
MARION COUNTY CHILD AND YOUTH SERVICES: A LOOK AT REVENUES AND EXPENDITURES
APRIL 2008
AUTHORS
DANIEL CLENDENNING ELIZABETH WATKINS
ERIC WRIGHT
CENTER FOR URBAN POLICY AND THE ENVIRONMENT
334 NORTH SENATE AVENUE, SUITE 300 INDIANAPOLIS, IN 46204-1708
CENTER FOR URBAN POLICY AND THE ENVIRONMENT

Center for Health Policy School of Public and Environmental Affairs
2
CONTENTS
Introduction ............................................................................................................................................................................... 4
Early Intervention Planning Commission................................................................................................................. 4
Overview of Fiscal Report ............................................................................................................................................... 4
Overview of National and State Issues ....................................................................................................................... 5
Purpose of Report ............................................................................................................................................................... 6
Child Services Funding Sources ......................................................................................................................................... 7
Federal Funding Sources ................................................................................................................................................. 7
Social Security ................................................................................................................................................................. 7
Social Services Block Grant ...................................................................................................................................... 10
Temporary Assistance for Needy Families ........................................................................................................ 10
Child Abuse Prevention and Treatment Act ..................................................................................................... 11
Medicaid........................................................................................................................................................................... 11
State Funding Sources .................................................................................................................................................... 11
Probation User Fees .................................................................................................................................................... 11
County Family and Children Fund ........................................................................................................................ 11
Local Funding Sources .................................................................................................................................................... 15
Taxes ................................................................................................................................................................................. 15
Child Advocacy Fund .................................................................................................................................................. 15
Community Corrections Programs ....................................................................................................................... 15
Child Services: Expenditures ............................................................................................................................................ 16
Selection of Agencies and Funds ................................................................................................................................ 16
Description of Agencies .................................................................................................................................................. 16
Public School Systems ................................................................................................................................................ 16
County Family and Children Fund ........................................................................................................................ 21
Mental Health ..................................................................................................................................................................... 24
BehaviorCorp ................................................................................................................................................................. 24
Gallahue ........................................................................................................................................................................... 25

Center for Health Policy School of Public and Environmental Affairs
3
Midtown Community Mental Health Centers ................................................................................................... 26
Trends ............................................................................................................................................................................... 27
Children in Need .................................................................................................................................................................... 28
Children in Poverty .......................................................................................................................................................... 28
Risk Factor Prevalence in Marion County .............................................................................................................. 31
Methods ........................................................................................................................................................................... 32
Adverse Childhood Experiences Study ............................................................................................................... 33
Conclusion ....................................................................................................................................................................... 38
Findings ..................................................................................................................................................................................... 39
Recommendations................................................................................................................................................................. 40
Appendix 1: .............................................................................................................................................................................. 41
Child Welfare Funding ......................................................................................................................................................... 41
References ................................................................................................................................................................................ 50

Center for Health Policy School of Public and Environmental Affairs
4
INTRODUCTION
EARLY INTERVENTION PLANNING COMMISSION
The Early Intervention Planning Council (EIPC) was appointed by the City-County Council of the
City of Indianapolis and Marion County, Indiana, in May 2006 to develop a comprehensive plan for
early intervention that will provide services tailored to the needs of children and adolescents who
have been either:
1. adjudicated or alleged as delinquent,
2. identified by the Office of Family and Children as substantially at risk of becoming
delinquent children, or
3. referred to the Marion County Office of Family and Children Services.
OVERVIEW OF FISCAL REPORT
The fiscal report will provide an overview of current funding sources and spending levels for child
welfare in Marion County. Where possible to provide context, funding and spending will be
compared to funding and spending levels in Indiana and the nation. As required by City-County
Council Ordinance No. 70 (2005), the following funding sources will all be considered:
1. Titles IV-B, IV-E, and XX of the Social Security Act;
2. the Child Abuse and Prevention Treatment Act;
3. community corrections programs (I.C. 12-1);
4. special education programs under (I.C. 20-1-6-19);
5. all programs designed to prevent child abuse, neglect, or delinquency, or to enhance child
welfare and family preservation administered by, or through funding provided by the
division of family and children, county offices, prosecutors, or juvenile courts (includes
programs funded under I.C. 12-19-17 and I.C. 31-40);
6. probation user’s fees under I.C. 31-40-2-1; and
7. the Child Advocacy fund under I.C. 12-17-17.

Center for Health Policy School of Public and Environmental Affairs
5
Indiana’s spending on child welfare is funded by a smaller share of federal funds than the national
average. To the extent possible, we will determine whether there are additional federal funds
available to reduce Indiana’s reliance on state and local revenues for child welfare spending. The
report will also address the flexibility with which the various federal funding sources can be used.
OVERVIEW OF NATIONAL AND STATE ISSUES
Federal funding is available through several sources. The principal sources of federal funds are
Titles IV-B and IV-E of the Social Security Act. The portion of child welfare spending from federal
funds varies widely across states. In their 2004 report, State Welfare Spending at a Glance, the
Urban Institute states that over 60% of Indiana’s funding for child welfare services comes from
local sources, while the average state receives 11% of its funding from local sources (Scarcella,
Bess, Zielewski, Warner, & Geen, 2004). Furthermore, in Indiana federal funds account for only
29.6% of spending on child welfare services, while nationally the average is 50.1% of child welfare
spending (Scarcella, Bess, Zielewski, & Geen, 2006). Spending on child welfare varies across states
for a variety of reasons. Some funds, including TANF, Social Services Block Grants, and Medicaid,
can be used not only for child welfare, but also for other purposes. There is also variation in the
amount of federal funding for which states qualify. Investigating the potential federal funding
sources may turn up additional revenue sources that can be used to improve child welfare in
Indiana.
An Urban Institute issue brief points out that TANF funds are capped, while federal foster care
reimbursements are uncapped. This leads to an incentive for many states to shift kinship care costs
for IV-E eligible children from child-only grants, paid out of TANF, to IV-E foster care payment. The
report, from 1997, finds that at that time, Indiana could have gained an additional $21.38 million
from Title IV-E; however, this would have required an additional investment of $9.74 million by the
state (Geen & Waters, 1997).

Center for Health Policy School of Public and Environmental Affairs
6
PURPOSE OF REPORT
This report will provide the Early Intervention Planning Council (EIPC) with a snapshot of current
child welfare expenditures and the sources used to fund these expenditures. This data will provide
the EIPC with a benchmark as they move forward in planning and implementing new programs.
Synthesizing this data with information on federal funding sources will help Marion County
increase the portion of costs that can be funded by federal dollars.

Center for Health Policy School of Public and Environmental Affairs
7
CHILD SERVICES FUNDING SOURCES
FEDERAL FUNDING SOURCES
The primary federal funding sources for child welfare activities are Titles IV-B and IV-E of the Social
Security Act. Additional funding is available through other federal programs, including the Social
Services Block Grant, Temporary Assistance for Needy Families, the Child Abuse Prevention and
Treatment Act, and Medicaid. This section discusses the funding available through each of these
programs. A summary of federal funding sources is provided in Appendix A. Much of the
information in this section and the appendix are available in Child Welfare Financing 101, available
from the North American Council on Adoptable Children (Freundlich, 2007).
SOCIAL SECURITY
Title IV-B
Title IV-B of the Social Security Act is a capped entitlement program that provides matching grants
to states for preventive services and case management. Title IV-B: Subpart 1, Child Welfare
Services, allots $70,000 to each state and then allots additional funds to each state as a function of:
1. the total amount of dollars appropriated for Title IV-B,
2. the percentage of the population in the state under 21 years of age, and
3. the ratio of the state’s per capita income to the per capita income of the entire nation.
The allotment becomes available to the state as a 75% federal match; thus, states are required to
fund part of the costs. The total appropriations for Title IV-B: Subpart 1 cannot be more than $325
million per year for each fiscal year from 2007 through 2011.
Funds appropriated through Title IV-B: Subpart 1 are intended to:
1. protect and promote the welfare of all children;
2. prevent the neglect, abuse, or exploitation of children;
3. support at-risk families through services that allow children, where appropriate, to remain
safely with their families or return to their families in a timely manner;

Center for Health Policy School of Public and Environmental Affairs
8
4. promote the safety, permanence, and well-being of children in foster care and adoptive
families; and
5. provide training, professional development, and support to ensure a well-qualified child
welfare workforce (Compilation of the Social Security Laws, 2007).
Title IV-B: Subpart 2, Promoting Safe and Stable Families, allocates money to each state as a
function of the average number of children receiving food stamps per month. As with Subpart
1, funds for Subpart 2 are made available as a 75% federal match. Funds from Title IV-B:
Subpart 2 are intended to support the following objectives (Compilation of the Social Security
Laws, 2007):
1. to prevent child maltreatment among families at risk through the provision of supportive
family services;
2. to assure children's safety within the home and preserve intact families in which children
have been maltreated when the family's problems can be addressed effectively;
3. to address the problems of families whose children have been placed in foster care so that
reunification may occur in a safe and stable manner in accordance with the Adoption and
Safe Families Act of 1997; and
4. to support adoptive families by providing support services as necessary so that they can
make a lifetime commitment to their children.
Title IV-E
Title IV-E provides funding for:
1. foster care;
2. adoption assistance;
3. the John H. Chafee Foster Care Independence Program;
4. administration; and
5. training.
Funding for foster care is an open-ended entitlement which provides as much money as is required
to pay all eligible claims. The federal matching rate is equal to the Medicaid match rate which

Center for Health Policy School of Public and Environmental Affairs
9
ranges from 50% to 83%.1 Funds are used to cover basic maintenance including children’s food
and shelter, parental visits, and case planning.
Funding for adoption assistance is also open-ended, providing funds sufficient to pay all eligible
claims. The federal matching rate is equal to the Medicaid match rate. These funds may be used for
payments to adoptive parents of children with special needs.
The Chafee Foster Care Independence Program funds are capped at $140 million nationally. The
federal match rate is 80%. Up to 30% of these funds may be used toward housing for youth ages 18
to 20. These funds may be used for living skills training, education, housing, substance abuse
prevention, and preventive health activities.
Funding for administration is an open-ended entitlement with a 50% federal matching rate. These
funds are intended for expenses associated with Title IV-E eligible children in foster care and
proportional administrative expenses for the foster care program.
Funding for training is an open-ended entitlement with a 75% federal matching rate. These funds
may be used to pay for training proportional to the number of children eligible for Title IV-E foster
care and/or adoption assistance. The training is for both agency staff and adoptive parents. These
funds may not be used for training related to non Title IV-E eligible children.
Title XX
Funds are allocated to each state as a function of total federal funding for Title XX and the
population of the state relative to the nation’s population. Title XX funds may be used for:
1. achieving or maintaining economic self-support to prevent, reduce, or eliminate
dependency;
1 The Medicaid match rate is based on the state’s per capita income and the per capita income for the continental United States, including Alaska and Hawaii. In 2007, the federal matching rate was 62.61%. This means that for every $62.61 provided by the federal government, Indiana must match with $27.39 of state funds.

Center for Health Policy School of Public and Environmental Affairs
10
2. achieving or maintaining self-sufficiency, including reduction or prevention of dependency;
3. preventing or remedying neglect, abuse, or exploitation of children and adults unable to protect their own interests; or preserving, rehabilitating or reuniting families;
4. preventing or reducing inappropriate institutional care by providing for community-based care, home-based care, or other forms of less intensive care; and
5. securing referral or admission for institutional care when other forms of care are not appropriate or providing services to individuals in institutions.
SOCIAL SERVICES BLOCK GRANT
The Social Security Block Grant provides funds that may be used for child care, child welfare, and
services for the elderly. The SSBG is a capped entitlement program that does not require a state
match. States may use SSBG funds for various child welfare-related activities including preventive
services, protective services, adoption services, and services for children in foster care. However,
states can also use SSBG funds for other non-child-welfare services, including services for the
elderly and other special populations. The percentage of SSBG used for child welfare varies across
states from 0% to as much as 34%. The SSBG program has never been fully funded and historically
has been subject to cuts in funding (Freundlich, 2007).
TEMPORARY ASSISTANCE FOR NEEDY FAMILIES
TANF provides assistance to needy families so that children may be cared for in their own homes or
the homes of relatives. TANF is a capped block grant program. No state matching is required;
however, states must satisfy a Maintenance of Effort requirement. Not all TANF funds are used for
child welfare purposes. Child welfare activities eligible for TANF funds include supporting children
whom child welfare has removed from their parents’ home and placed in the care of relatives.
States can also transfer up to 10% of their TANF grant to SSBG, described above, which can be used
to support a wide range of child welfare services.

Center for Health Policy School of Public and Environmental Affairs
11
CHILD ABUSE PREVENTION AND TREATMENT ACT
CAPTA was originally passed in 1974, and was recently reauthorized in 2003 by the Keeping
Children and Families Safe Act of 2003. The act provides federal funding to states to support
prevention, assessment, investigation and treatment of child abuse. In Indiana, this money does not
make it down to the local level.
MEDICAID
Medicaid provides medical coverage to those who qualify due to a financial or other need. Children
19 and younger in families with incomes below the 150% FPL are eligible for Medicaid. Children 19
and younger in families with incomes between 150% and 200% of the FPL that meet cost-sharing
requirements are also eligible for Medicaid.
STATE FUNDING SOURCES
PROBATION USER FEES
IC 31-40-2-1 dictates the amount of probation user fees (PUF) and the use of those fees.
Specifically, in Marion County every youth placed on probation is assessed an initial PUF of $35, a
monthly PUF of $15, and an administrative fee of $100. These funds can be used only for:
1. supplementing probation services to juveniles, and
2. supplementing the salaries of probation officers in accordance with the state salary
schedule.
COUNTY FAMILY AND CHILDREN FUND
The County Family and Children Fund (CFCF) receives the bulk of its funds through taxes, including
property tax, vehicle excise tax, financial institutions tax, and commercial vehicle excise tax. Total
receipts from taxes in 2006 were $44.3 million (31% of total revenues) with $40.3 million (28% of
total revenues) of this from property taxes alone (see Table 1). Reimbursements from Title IV-E of
the Social Security Act, shown below as “Total Reimbursements,” provided $27.8 million (20% of

Center for Health Policy School of Public and Environmental Affairs
12
total revenues) in 2006. Total returned warrants do not represent a flow of new monies into the
Family and Children Fund, but rather are the accounting mechanism used to account for checks
written for the wrong amount. Repayments show money from TANF, Medicaid, and Food Stamps
coming into the CFCF; however, this is money that is transferred in and immediately transferred
out to the state. This money is not actually used by the CFCF. All together, approximately 15% of
the DCS revenues were from federal sources in 2007. This is an increase from 12.0% in 2003, but is
lower than the 20% of revenues from federal sources in 2006.
Funds from Title IV-B of the Social Security Act do not show up on the CFCF budget. In 2006,
money from IV-B was approximately $1.6 million. Additionally, about $232,000 dollars were
obtained from Chafee to fund independent living.

Center for Health Policy School of Public and Environmental Affairs
13
Table 1: County Family and Children Fund Receipts
Receipts 2003 2004 2005 2006 2007
Property Tax $46,957,544 $41,104,427 $30,740,030 $40,383,979 $55,295,155
Other Taxes $4,544,661 $4,207,029 $4,336,170 $3,944,991 $5,441,188
Total from Taxes $51,502,204 $45,311,455 $35,076,200 $44,328,970 $60,736,343
Total Reimbursements $13,095,326 $16,803,117 $16,847,480 $27,804,090 $21,384,793
Total Returned Warrants $1,312,855 $344,180 $1,243,414 $454,610 $2,689,751
TANF $35,971 $45,380 $33,421 $19,733 $10,636
Medicaid $1,003,027 $1,081,963 $730,749 $749,304 $58,646
Food Stamps $24,642 $36,405 $45,568 $43,161 $24,070
All Other Repayments $19,081,763 $1,014,738 $1,138,141 $1,274,675 $860,739
Total Repayments $20,145,403 $2,178,486 $1,947,878 $2,086,873 $954,092
County Share of IV-E $7,690 $93,985 $3,145 $248,695 $545
Other $31,346,707 $31,783,613 $60,772,543 $66,948,225 $54,606,403
Total Other Receipts $31,354,397 $31,877,598 $60,775,687 $67,196,920 $54,606,947
Total Receipts $117,410,185 $96,514,836 $115,890,659 $141,871,463 $140,371,925
Table 1 shows annual revenues from property taxes, other taxes, and total repayments (which
largely consist of Title IV-E monies) from 2003 to 2007. Figure 1 shows that revenues from
property taxes reached its lowest point over this period in 2005 and peaked at $55 million in 2007.
Total reimbursements had been steadily increasing from 2003; however, reimbursements
decreased from 2006 to 2007. Finally, other tax revenues (vehicle excise tax, commercial vehicle
excise tax, and financial institutions tax) have been decreasing slowly since 2003, with the
exception of a slight increase from 2004 to 2005. Given the current property tax reforms being
considered by the state legislature, an alternate source of funding may be needed in the near future.

Center for Health Policy School of Public and Environmental Affairs
14
Figure 1: CFCF Major Revenue Sources
$0.00
$5,000.00
$10,000.00
$15,000.00
$20,000.00
$25,000.00
$30,000.00
2004 2005 2006 2007
Property Tax Other Taxes Total Reimbursements
Center for Health Policy School of Public and Environmental Affairs
15
LOCAL FUNDING SOURCES
TAXES
Funding is available from several local tax sources, and property taxes are the most important local
source, Other local sources include vehicle excise tax, commercial vehicle excise tax, and financial
institution tax.
CHILD ADVOCACY FUND
Indiana law (IC 12-17-17) calls for the establishment of a fund in each county dedicated to the
purpose of developing interdisciplinary response to child abuse and situations of neglect. The fund
is administered by the county auditor. The law further states that a county fiscal body will
appropriate funds for use at the discretion of the county legislature for addressing child abuse and
neglect prevention and intervention. The money placed in this fund is distributed to the nonprofit
organization, Child Advocates. In 2006, this amount was approximately $3,600, while in 2007 it
was about $4,100.
COMMUNITY CORRECTIONS PROGRAMS
The Marion County Community Corrections Agency serves only the adult courts. Therefore, the
Community Corrections Program funds are not currently relevant to early intervention for youth
and children. However, if Marion County were to establish a Juvenile Community Corrections
Program in Marion County, then the Community Corrections Program would be a potential source
of funding.

Center for Health Policy School of Public and Environmental Affairs
16
CHILD SERVICES: EXPENDITURES
SELECTION OF AGENCIES AND FUNDS
The report discusses several agencies and funds used to improve child well being at the county
level. Agencies and funds were selected based on the relevance of their work to early intervention.
The agencies and funds included are:
1. public school systems.
2. County Family and Children Fund,
3. mental health facilities.
DESCRIPTION OF AGENCIES
PUBLIC SCHOOL SYSTEMS
Summary
The public education system is a critical source of early intervention services for students in
Indiana. Funding exists for programs at all levels of the education spectrum. This section will
provide an overview of the major funding sources and programs available to students in Marion
County.
Even Start Family Literacy Grant Program
The Even Start grant, Title I, Part B, Subpart 3 of the Elementary and Secondary Education Act of
1965 (ESEA), is a federally funded education program for low-income families that is designed to
improve the academic achievement of young children and their parents. Even Start programming
addresses intergenerational poverty and low literacy rates by combining four major components:
early childhood education; adult literacy and parenting education; and interactive literacy activities
between parents and their children, often by provide linkage with other community entities
providing these services, such as government agencies, colleges and universities, public schools,

Center for Health Policy School of Public and Environmental Affairs
17
Head Start programs, and other public and private community-based groups. In 2006, the federal
government appropriated $99 million for Even Start programming, with Indiana receiving a total
award of $1.3 million.2 Even Start programming currently operates 11 programs statewide, with 2
programs located in Marion County.3 These programs are facilitated by the Indianapolis Public
School system. See Table 2 for a breakdown of allocations in Marion County.
Early Literacy Intervention Grant
The Early Intervention Program focuses on interventions in grades pre-k through second grade to
improve the reading readiness and reading skills of students who are at risk of not learning to read.
The grant supports three key functions: to assist schools in acquiring materials, resources, and
expertise needed to enhance literacy intervention; to provide funding for training specific to
intervention programs; and to provide support to further parent/family education and training in
the intervention instruction of children. For the 2004-2005 school year, the IDOE awarded 89 early
intervention grants, 101 reading recovering teaching training awards, 583 reading recovery
continuing contract awards, and 1 reading recovery training center grant. In 2006, the state of
Indiana allocated $3.7 million for early intervention program statewide. 4 See Table 2 for a
breakdown of awards in Marion County.
21st Century Community Learning Centers
The 21st Century Community Learning Centers program is an after-school initiative authorized by
the No Child Left Behind, Title IV Part B. CCLC is targeted to students in high-poverty areas or low-
performing schools, and helps communities establish or expand community learning centers that
provide students with academic enrichment opportunities aligned to state standards in core
2 Fiscal Year 2001-2008 State Tables for the U.S. Department of Education, Even Start Family Literacy Program, http://www.ed.gov/about/overview/budget/statetables/index.html#update 3 INDIANA EVEN START PROGRAMS Program Year 2007-2008, http://www.doe.state.in.us/adulted/docs/even_start_programs.doc
4 Digest of Public School Finance in Indiana 2005-2007 Biennium, Early Intervention Grant.
Center for Health Policy School of Public and Environmental Affairs
18
subjects, such as reading and mathematics. The program's primary purpose is to award grants, via
competition, to public schools, community-based organizations, public/private organizations, faith-
based organizations, or a consortium of these organizations. The federal government allocated $7.1
million for the CCLC programs in the state of Indiana for 2007 FY.5 See Table 2 for a breakdown of
allocations in Marion County.
Title III, Language Instruction for Limited English Proficient and Immigrant
Students
Title III, Language Instruction for Limited English Proficient and Immigrant Students, of the No
Child Left Behind Act, provides school districts with funds to provide a number of supplemental
services for Language English Proficient students. Authorized activities include family literacy
services; support for LEP personnel; provision of tutorials; mentoring and academic or career
counseling for immigrants; acquisition of curriculum materials; basic instructional services; and
comprehensive community services in coordination with community-based organizations. Title III
is available to all states and local school corporations. See Table 2 for a breakdown of allocations in
Marion County.
Alternative Education Grant
Alternative education is designed to meet the needs of at-risk students who are not succeeding in
the traditional setting. Students are provided with a variety of options that can lead to graduation.
Additionally, alternative education grants provide special services for the students and their
immediate families. Alternative education services include alternative classrooms, school-within-a-
school programming, separate alternative schools, and second or last-chance schools for disruptive
students. These schools provide students with flexible schedules, individualized teaching, and
linkage to essential community supports. Reimbursements are based on the number of full-time
equivalent students enrolled in an approved alternative education program. During the 2003-2004
5 Fiscal Year 2001-2008, State Tables for the U.S. Department of Education.

Center for Health Policy School of Public and Environmental Affairs
19
school year, 116 school corporations participated, supporting 290 programs statewide. See Table 2
for a breakdown of allocations in Marion County.
Title I
Title I funding is one the most significant sources of funding for school districts. Title I funding
covers a broad spectrum of services, all targeted toward improving academic achievement among
disadvantaged students. Part B, the Reading First and Even Start Family Literacy Programs, focuses
on improving reading achievement. Reading First awards grants to states to establish reading
programs for students in kindergarten through 3rd grade. Even Start provides funding for states,
local districts, and nonprofit organizations to provide early childhood education to young children
and basics skills and literacy instruction to their educationally disadvantaged parents. Part C, the
Migrant Education Program, supports state and local programs that address the special educational
needs of the children of migratory farm workers. Part D, the Neglected and Delinquent Children
Programs, provides grants to states responsible for educating children in state institutions for
neglected or delinquent children, adult correctional institutions, and community day care programs
for neglected or delinquent children. It also provides funds to support partnerships between
schools and correctional facilities to educate students residing in or returning from correctional
facilities.6 In addition, Title I requires that all school districts reserve a certain percentage of Title I
funds to provide educationally-related services to homeless students. This mandate includes
homeless students who do not attend Title I schools. See Table 2 for a breakdown of allocations in
Marion County.
6 Education Week, Research Center http://www.edweek.org/rc/issues/title-i/.
Center for Health Policy School of Public and Environmental Affairs
20
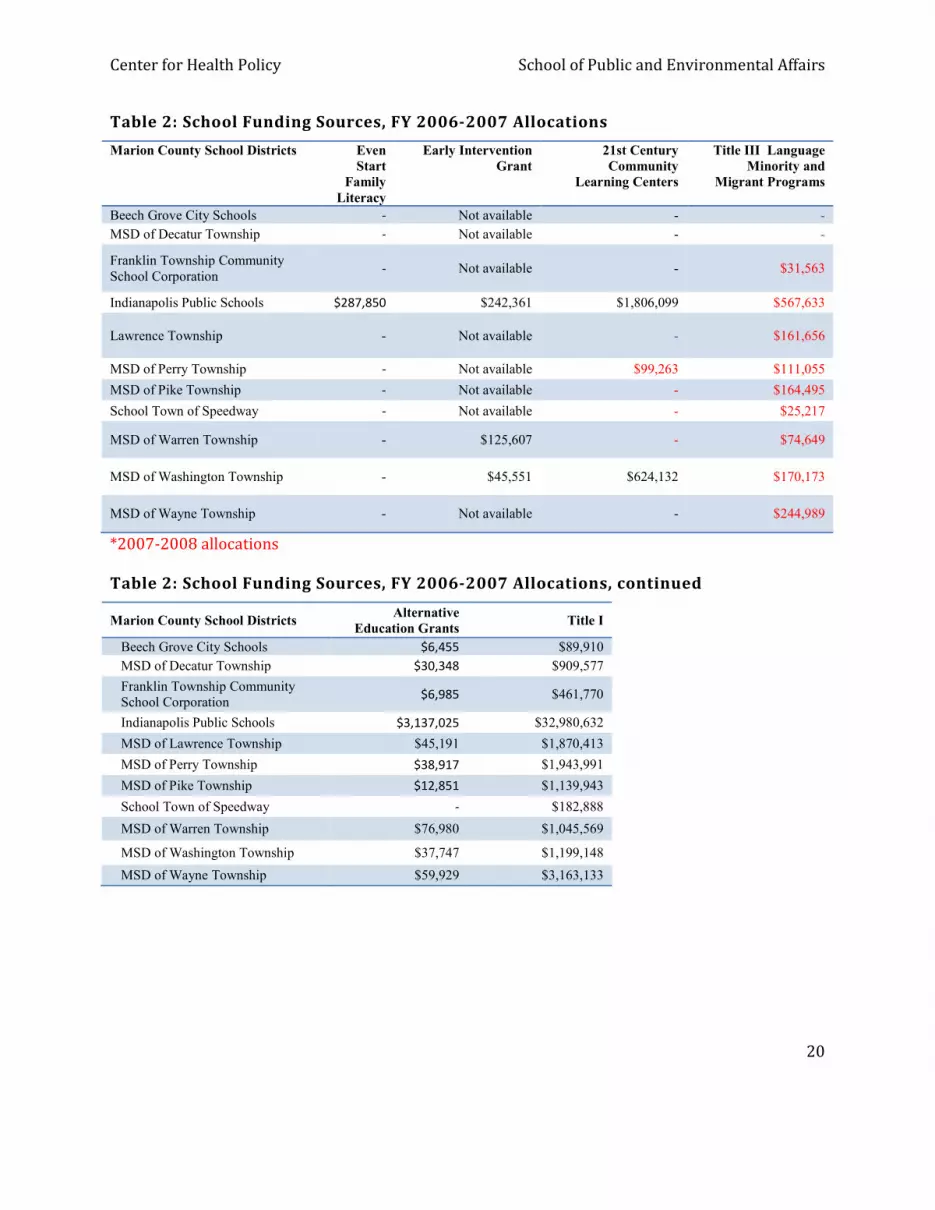
Table 2: School Funding Sources, FY 2006-2007 Allocations
Marion County School Districts Even
Start
Family
Literacy
Early Intervention
Grant
21st Century
Community
Learning Centers
Title III Language
Minority and
Migrant Programs
Beech Grove City Schools - Not available - -
MSD of Decatur Township - Not available - -
Franklin Township Community School Corporation
- Not available - $31,563
Indianapolis Public Schools $287,850 $242,361 $1,806,099 $567,633
Lawrence Township - Not available - $161,656
MSD of Perry Township - Not available $99,263 $111,055
MSD of Pike Township - Not available - $164,495
School Town of Speedway - Not available - $25,217
MSD of Warren Township - $125,607 - $74,649
MSD of Washington Township - $45,551 $624,132 $170,173
MSD of Wayne Township - Not available - $244,989
*2007-2008 allocations
Table 2: School Funding Sources, FY 2006-2007 Allocations, continued
Marion County School Districts Alternative
Education Grants Title I
Beech Grove City Schools $6,455 $89,910
MSD of Decatur Township $30,348 $909,577
Franklin Township Community School Corporation
$6,985 $461,770
Indianapolis Public Schools $3,137,025 $32,980,632
MSD of Lawrence Township $45,191 $1,870,413
MSD of Perry Township $38,917 $1,943,991
MSD of Pike Township $12,851 $1,139,943
School Town of Speedway - $182,888
MSD of Warren Township $76,980 $1,045,569
MSD of Washington Township $37,747 $1,199,148
MSD of Wayne Township $59,929 $3,163,133

Center for Health Policy School of Public and Environmental Affairs
21
COUNTY FAMILY AND CHILDREN FUND
The County Family and Children Fund provides funding for child welfare services, adoption
services, foster care services, care for wards of the state, and Medicaid rehabilitation services in
Marion County. The expenditures are summarized in Table 3. Note that starting in 2007, care of
wards in therapeutic foster homes is included under the category of care of wards in foster homes.
This change accounts for the bulk of the increase in spending on care of wards in foster homes from
2006 to 2007.
Table 3: County Family and Children Fund Expenditures
Disbursements 2003 2004 2005 2006 2007
Child Welfare Services $410,932 $344,117 $539,465 $1,858,900 $728,688
Care of Wards in Foster Homes $6,835,573 $7,055,016 $8,630,947 $8,943,623 $29,774,564
Care of Wards in Therapeutic Foster Homes $10,218,087 $11,447,902 $13,892,864 $19,225,647 NA
Care of Wards in Institutions $17,251,052 $17,959,799 $24,257,316 $29,702,384 $24,779,163
Independent Living for Wards $26,166 $13,056 $5,922 $20,975 $3,999
Preservation Services $12,746,571 $14,216,500 $14,608,681 $18,572,911 $21,344,685
Miscellaneous Costs of Wards $425,966 $423,334 $573,923 $722,911 $1,091,174
Medicaid Rehabilitation Option $101,984 $60,941 $13,954 $4,085 $0
Adoption Services $15,757,510 $17,310,329 $18,427,070 $22,068,714 $24,274,511
Foster Parent Insurance $32,844 $36,957 $46,976 $55,151 $60,260
Interest on Temporary Loan $114,710 $51,856 $91,325 $410,780 $120,627
Total of Budgeted Disbursements $63,921,396 $68,919,805 $81,088,445 $101,586,081 $102,177,671
TANF $35,616 $45,533 $31,649 $22,955 $11,178
Medicaid $1,092,113 $945,775 $866,936 $672,797 $135,153
Food Stamps $28,342 $36,074 $39,456 $51,028 $25,786
Care of Wards in Institutions $0 $16,510 $0 $0 $0
Temporary Loan (Principal) $30,800,000 $31,192,000 $33,699,666 $33,513,465 $41,958,666
Other $37
$127 $25 $10,524
Total of Non-Budgeted Disbursements $31,956,109 $32,235,892 $34,637,834 $34,260,269 $42,141,307
Total Disbursements $95,877,504 $101,155,697 $115,726,279 $135,846,351 $144,318,979
Center for Health Policy School of Public and Environmental Affairs
22
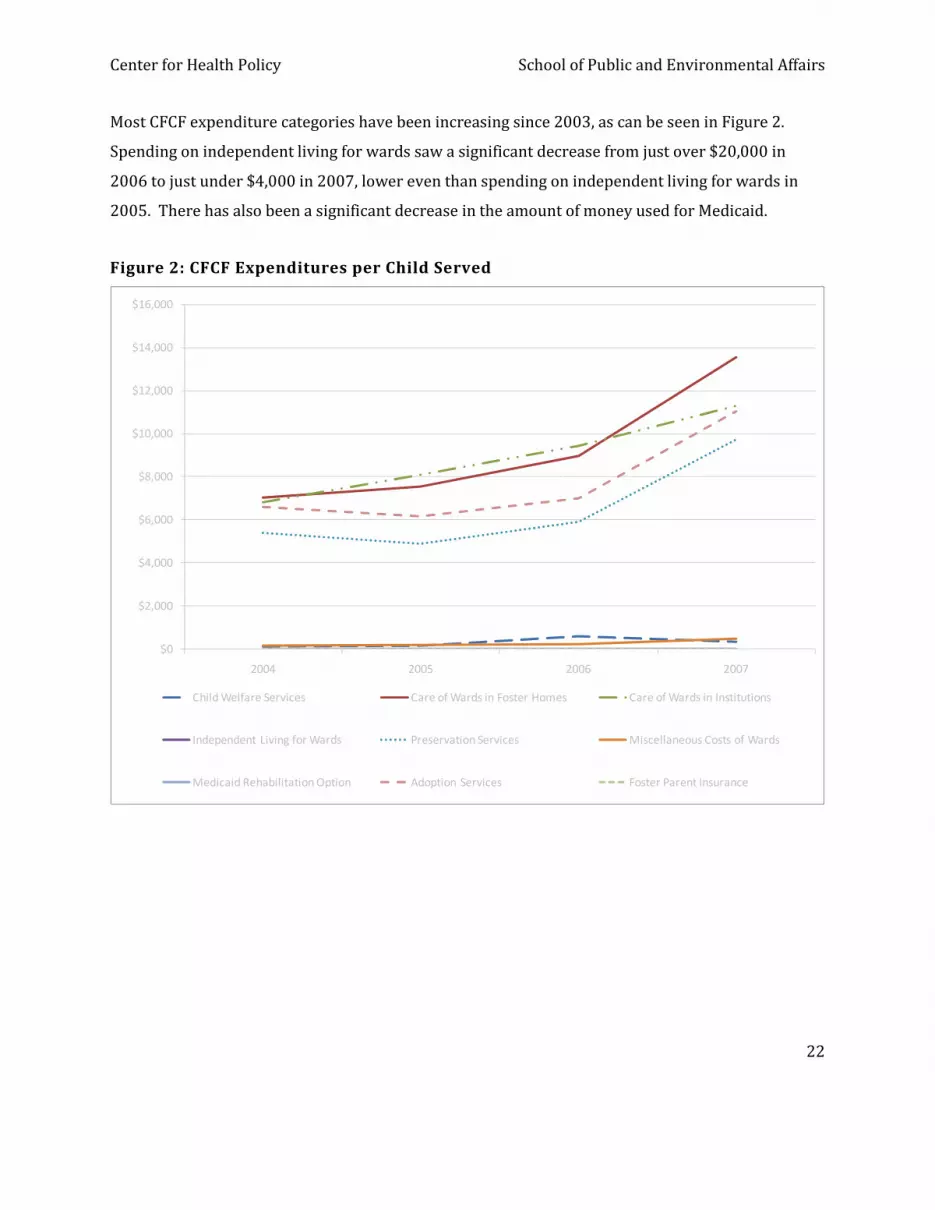
Most CFCF expenditure categories have been increasing since 2003, as can be seen in Figure 2.
Spending on independent living for wards saw a significant decrease from just over $20,000 in
2006 to just under $4,000 in 2007, lower even than spending on independent living for wards in
2005. There has also been a significant decrease in the amount of money used for Medicaid.
Figure 2: CFCF Expenditures per Child Served
$0
$2,000
$4,000
$6,000
$8,000
$10,000
$12,000
$14,000
$16,000
2004 2005 2006 2007
Child Welfare Services Care of Wards in Foster Homes Care of Wards in Institutions
Independent Living for Wards Preservation Services Miscellaneous Costs of Wards
Medicaid Rehabilitation Option Adoption Services Foster Parent Insurance

Center for Health Policy School of Public and Environmental Affairs
23
To arrive at a rough estimate of the cost per child served for one year, we took the total amount of
budgeted disbursements and divided this by the average number of children served during each
year. The costs of services provided from the CFCF fund has increased steadily from $26,194 per
child year in 2004 to $46,502 per child year in 2007 (see Figure 3).
Figure 3: Average Annual CFCF Expenditure per Child Served
$0.00
$5,000.00
$10,000.00
$15,000.00
$20,000.00
$25,000.00
$30,000.00
$35,000.00
$40,000.00
$45,000.00
$50,000.00
2004 2005 2006 2007
Annual Budgeted Costs Per Child
Annual Budgeted Costs Per Child

Center for Health Policy School of Public and Environmental Affairs
24
MENTAL HEALTH
There are four mental health organizations that play key roles in mental health care for children
and youth in Marion County. These four organizations are: Adult and Child Mental Health Center,
Behavior Corp, Gallahue Mental Health Center, and Midtown Community Mental Health Center.
Information regarding revenues, expenditures, and the number of children served was requested
from each of the agencies. All of them were gracious enough to reply; however, Adult and Child
Mental Health Center was unable to provide the requested data. This is because Adult Child and
Behavior does not keep the records for the children they serve in Marion County separate from
their records for children in other counties.
BEHAVIORCORP
In 2006, BehaviorCorp spent $1.98 million on serving children in Marion County (see Table 5). The
largest portion of their funding (47.19%) was obtained from Medicaid and other revenue; 44.22%
of their revenue was state revenue, and the remaining 8.58% was from Marion County. Over time,
BehaviorCorp has been receiving a smaller share of their revenue from Medicaid while the shares
from Marion County and the state have both been increasing.
Table 5: BehaviorCorp Budget
FY 2004 FY 2005 FY 2006
Children Served 757 789 815 Total Estimated Expenses $ 1,935,000 $ 1,980,000 $ 1,977,000 Estimated Revenue Medicaid & Other Revenue $ 1,111,900 $ 1,086,000 $ 933,000 Marion County Revenue $ 119,460 $ 130,910 $ 169,680 State Revenue $ 703,640 $ 763,090 $ 874,320
Total Revenues $ 1,935,000 $ 1,980,000 $ 1,977,000
Cost Per Child $ 2,556 $ 2,510 $ 2,426

Center for Health Policy School of Public and Environmental Affairs
25
During 2006, BehaviorCorp served 815 children, an increase of 13% since 2004 when 757 children
were served. The average cost per child in 2006 was $2,426, lower than the $2,556 per child in
2004. It would take further investigation to determine whether the decrease in spending per child
can be attributed to efficiency gains, to providing fewer services for each child, or some
combination of the two.
GALLAHUE
In 2006, Gallahue spent $13.6 million toward services for children in Marion County (see Table 6).
The largest portion of their funding (70.43%) was obtained from Medicaid and other revenue; 7.0%
of their revenue was from the Division of Mental Health; 6.5% of their revenue was from Marion
County; and the remaining 15.8% was from other sources. The mix of Gallahue’s funding has
remained stable.
Table 6: Gallahue Community Mental Health Center Budget
FY2004 FY2005 FY2006
Children Served 3,653 4,150 4,471 Salaries and Benefits $4,342,036 $4,828,728 $4,674,511 Other Direct $8,564,478 $8,687,033 $8,922,776 Total Expenditures $12,906,514 $13,515,761 $13,597,287 Medicaid $9,214,513 $9,386,476 $9,576,341 Division of Mental Health Grant $803,424 $942,485 $942,810 Marion County Contracts $858,096 $841,746 $888,629 Other $2,131,941 $2,211,393 $2,152,987 Total Funding Sources $13,007,974 $13,382,100 $13,560,767 Cost Per Child Served $3,533 $3,257 $3,041
During 2006, Gallahue served 4,471 children, an increase of 22% since 2004 when 3,653 children
were served. The average cost per child in 2006 was $3.041, lower than the $3,533 per child in
2004. It would take further investigation to determine whether the decrease in spending per child
Center for Health Policy School of Public and Environmental Affairs
26
can be attributed to efficiency gains, to providing fewer services for each child, or some
combination of the two.
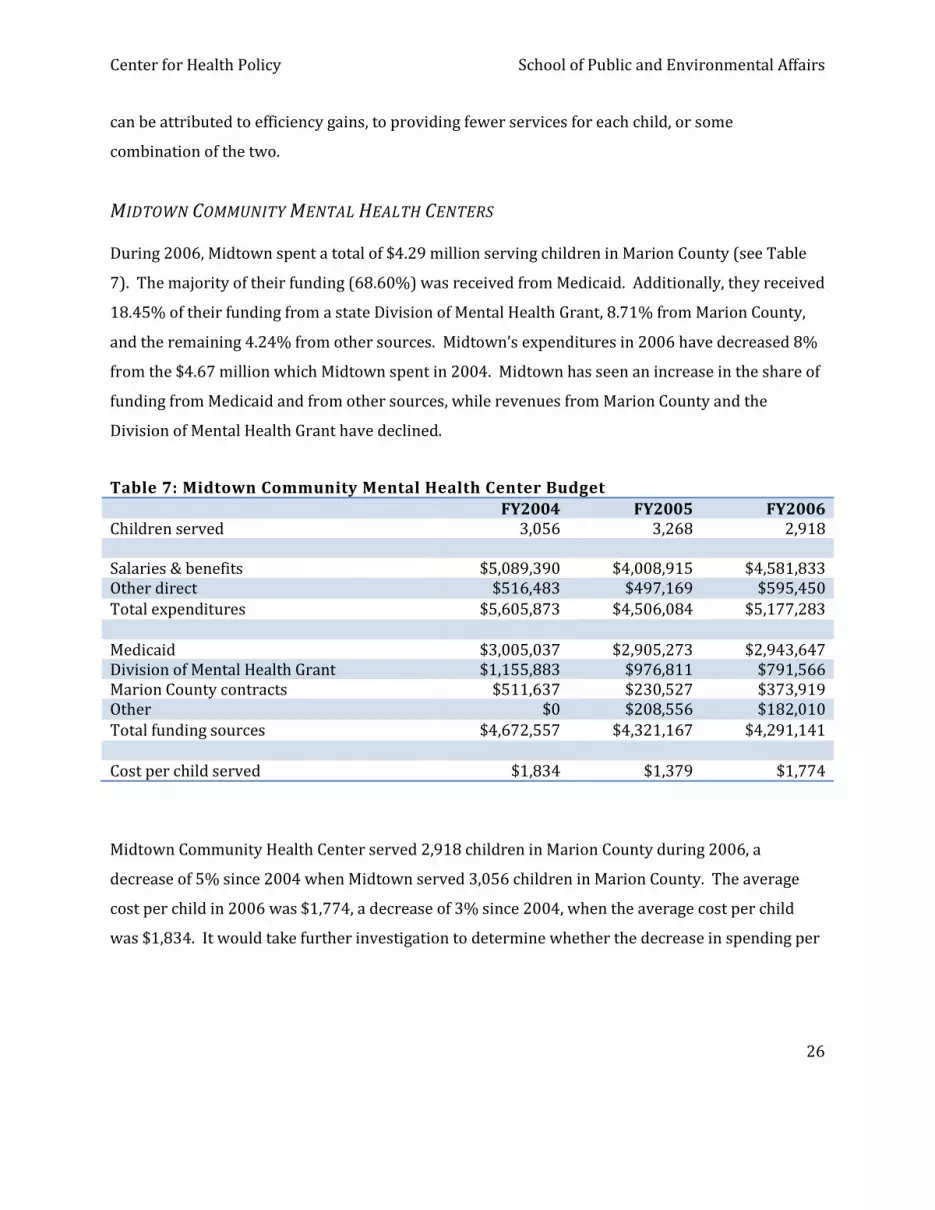
MIDTOWN COMMUNITY MENTAL HEALTH CENTERS
During 2006, Midtown spent a total of $4.29 million serving children in Marion County (see Table
7). The majority of their funding (68.60%) was received from Medicaid. Additionally, they received
18.45% of their funding from a state Division of Mental Health Grant, 8.71% from Marion County,
and the remaining 4.24% from other sources. Midtown’s expenditures in 2006 have decreased 8%
from the $4.67 million which Midtown spent in 2004. Midtown has seen an increase in the share of
funding from Medicaid and from other sources, while revenues from Marion County and the
Division of Mental Health Grant have declined.
Table 7: Midtown Community Mental Health Center Budget
FY2004 FY2005 FY2006
Children served 3,056 3,268 2,918 Salaries & benefits $5,089,390 $4,008,915 $4,581,833 Other direct $516,483 $497,169 $595,450
Total expenditures $5,605,873 $4,506,084 $5,177,283
Medicaid $3,005,037 $2,905,273 $2,943,647 Division of Mental Health Grant $1,155,883 $976,811 $791,566 Marion County contracts $511,637 $230,527 $373,919 Other $0 $208,556 $182,010
Total funding sources $4,672,557 $4,321,167 $4,291,141
Cost per child served $1,834 $1,379 $1,774
Midtown Community Health Center served 2,918 children in Marion County during 2006, a
decrease of 5% since 2004 when Midtown served 3,056 children in Marion County. The average
cost per child in 2006 was $1,774, a decrease of 3% since 2004, when the average cost per child
was $1,834. It would take further investigation to determine whether the decrease in spending per

Center for Health Policy School of Public and Environmental Affairs
27
child can be attributed to efficiency gains, to providing fewer services for each child, or some
combination of the two.
TRENDS
Looking at the data for the three mental health centers, two trends stand out. First, we see a
decrease in the cost of services per child at each of the three mental health centers. Whether this is
due to efficiency gains, because of fewer services for each child, or some combination of both is
unknown. Second, there is an increase in the number of children served by both BehaviorCorp and
Gallahue, but the number of children served by Midtown decreased 5% from 2004 to 2006. The
number of children served by all three institutions together has increased since 2004. A
hypothesis consistent with these two trends is that the number of children served is increasing
more quickly than the capacity at these institutions, thus leading to lower spending per child. The
fact that Midtown is serving fewer children but still has lower spending per child, does, however,
present an inconsistency with this hypothesis.

Center for Health Policy School of Public and Environmental Affairs
28
CHILDREN IN NEED
An important component for understanding the past and future budget required for child welfare
spending in Marion County is the number of children requiring such spending. One approach to
this problem is to use the number of children living in poverty to serve as a proxy measure of the
number of children requiring services. If services per child remain at the same level and we ignore
inflation, then an increase in the number of children requiring services should lead to an increase in
expenditures, and a decrease in the number of children requiring services should lead to a decrease
in expenditures. A second approach taken uses estimates of the prevalence of risks for young
children and applies these rates to the population of Marion County in order to estimate the
number of at-risk children in Marion County.
CHILDREN IN POVERTY
Figure 3 shows the number of children under 18 in poverty for three geographic regions: the
United States, Indiana, and Marion County. The measure of the number of children in poverty has
been normalized to 100, so that the growth rate can be easily compared across the three geographic
areas. Because of this normalization, the graph shows the percentage by which the number of
children in poverty has grown since 2000.

Center for Health Policy School of Public and Environmental Affairs
29
Figure 4: Number of Children in Poverty (Normalized with 2000 Levels Equal to 100)
90
100
110
120
130
140
150
2000 2001 2002 2003 2004
Nu
mb
er
of
Ch
ild
ren
in P
ove
rty
(No
rma
lize
d t
o 1
00
in 2
00
0)
US Indiana Marion County
Source: US Census Bureau, Small Area Income and Poverty Estimates
http://www.census.gov/cgi-bin/saipe/saipe.cgi
Figure 4 reveals that the number of children in poverty has been increasing more rapidly in Indiana
than in the United States. Furthermore, the number of children in poverty is increasing even more
quickly in Marion County than in Indiana as a whole. In 2000, there were 34,346 children under 18
living in poverty in Marion County. This number has increased to 49,208 children in 2004, an
increase of 43% in 4 years, compared to an increase of only 13% for the United States and 32% for
Indiana over the same time period.

Center for Health Policy School of Public and Environmental Affairs
30
Figure 5: Percentage of Under18 Population in Poverty
0%
5%
10%
15%
20%
25%
2000 2001 2002 2003 2004
Pe
rce
n t
in
Po
ve
rty
US Indiana Marion County
Source: US Census Bureau, Small Area Income and Poverty Estimates
http://www.census.gov/cgi-bin/saipe/saipe.cgi
These statistics show that the number of children under 18 living in poverty in Marion County has
increased, but does not tell us whether the percentage of children living in poverty has increased or
decreased. However, as Figure 5 shows, the percentage of children in Marion County who live in
poverty increased from 15.3% in 2000 to 21.1% in 2004. The percentage of children in poverty
was lower in Marion County than in the nation, but is now higher than the U.S. rate of 17.8% in
2004. This tells us that the number of children in poverty in Marion County is not only a function of
increased population, but is also a result of a higher percentage of children living in poverty.

Center for Health Policy School of Public and Environmental Affairs
31
RISK FACTOR PREVALENCE IN MARION COUNTY
In order to make educated decisions about programming and focus of intervention efforts,
estimates regarding the prevention needs of Marion county youth must be assimilated and
analyzed. Such estimates would indicate not only the children currently receiving services, but also
the children whose early childhood experiences put them at greater risk for needing services later
in life. Because many of these risk factors and experiences do not manifest themselves until later in
life, and because these risk factors are not always visible to service providers until they are acute,
systemic prevention programs and early interventions for children with high risk indicators can be
challenging to implement. These effects that do not manifest unit later in life are referred to as
downstream effects. The effects of such efforts, however, have been proven effective, and we
believe they are the best hope for solving some of the downstream effects that continue to
challenge our county.
Because estimates of risk at very early stages of childhood development are rare and differ
significantly from community to community, we are providing preliminary draft estimates
regarding the number of children and youth in each age category that may be at elevated risk for
juvenile delinquency and other unfavorable behaviors, based on local community data.
We emphasize that all children are a vulnerable population and require positive actions to help
them succeed in life. The level of intervention that deals with all children is systemic prevention,
which involves implementation of programs for all children and families. The focus of interest in
the population estimates provided here, however, focus on the second level of intervention, early
intervention. The policy focus for early intervention is children and youth who have had
experiences that make them particularly vulnerable to downstream problems. The estimates
provided here are derived from information we have received regarding the third level of
intervention, progressive intervention/treatment, which focuses on children and families that
continue to need assistance, and about whom more information is available.

Center for Health Policy School of Public and Environmental Affairs
32
The estimates we provide are based on a detailed review of empirical research that shows links
between a variety of risk factors and juvenile delinquency. This review resulted in a detailed
database which includes risk factors, age of vulnerability to risk factor, and supporting research,
and is available for your use. The age categories presented are based on a careful review of the
literature and the recommendations of a panel of experts assembled for the purpose of advising the
EIPC.
The figures are preliminary draft estimates only, and are intended for use as a conceptual tool only
in considering populations of at-risk children and youth in Marion County. Data measures for
children with downstream issues were identified, and simple rate calculations were used to
determine what percentage of children in each preceding or subsequent age group are likely to
develop this particular downstream issue. This method is relatively intuitive. In essence, it takes
prevalence rates among the whole population and extrapolates them backward to determine how
many children in any given age group are likely to develop the problem, if all rates stay the same
and other population risk factors stay constant. The purpose of these numbers is to provide a tool
for calculating the level of unaddressed need among each specific age group.
METHODS
Data measures for risk factors were identified, when possible, at the county level. When rate data
was not available for Marion County, state-level data and, in a few cases, national-level data were
used as proxies. Population risk rates were derived using occurrence in populations where risk
factors are observed. Where diagnosis/treatment was the only available data for risk factors, peak
diagnosis rates were used. Simple rate calculations were performed for each age population (see
Table 8). Unless age-based data were available, age clustering and prevalence were assumed
constant.
The simplicity of the rate calculations used in these estimates results in some inaccuracies. These
inaccuracies do not diminish the utility of the tool in conceptualizing the prevention and early
intervention needs of the children in Marion County, but these estimates should not be considered

Center for Health Policy School of Public and Environmental Affairs
33
durable and reliable. One assumption of these estimates is that rates of occurrence do not change
over time. We know this to be false.
If rates of a particular risk factor have been falling over time, then these estimates are conservative
for populations that are older than the target age group. If rates of a particular risk factor have been
rising over time, then these estimates are inflated for populations that are older than the target age
group. Risk rates for populations too young to be faced with a particular experience (such as teen
pregnancy) are included, showing the number of children expected, through whatever combination
of life events, to be at risk for that particular factor, assuming constant rates over time. These
estimates assume that exposure to a particular experience or risk factor (such as abuse or low birth
weight) remains a risk factor throughout childhood and early adulthood.
It is important to recognize that many, if not most, of the factors listed here are factors that have
high comorbidity rates. That is, some children are likely to have several of these risk factors at once.
Many of these risk factors increase the susceptibility of children to other of these risk factors,
including delinquency. These data do not represent comorbidity rates or clustering that occurs
among factors. That is, there is expected to be great overlap among the groups of children at-risk
for developing each individual downstream problem.
ADVERSE CHILDHOOD EXPERIENCES STUDY
During the 1980s and early 1990s, information about risk factors for disease had been identified.
However, it was also clear that risk factors were not randomly distributed in the population—
persons who had one risk factor tended to have one or more others, as is the case with the risk
factors of interest to the EIPC. The Adverse Childhood Experiences (ACE) study, like the EIPC, was
interested in how early childhood experiences or risk factors combine to cause downstream effects.
The primary ACE study question is, “If risk factors for disease, disability, and early mortality are not
randomly distributed, what influences precede the adoption or development of them?”

Center for Health Policy School of Public and Environmental Affairs
34
By providing information to answer this question, researchers hoped to provide scientific
information that would be useful for the development of new and more effective prevention
programs. Our question is fundamentally similar: What influences and/or risk factors precede the
development of juvenile delinquency and other adverse behaviors?
Risk factors of interest in the ACE study are also factors that increase risk of juvenile delinquency,
such as abuse, neglect, exposure to violence, and other factors of interest to the EIPC. We therefore
present some information from the ACE Study to provide additional context for the risk rate
estimates, and to give some idea of the overlap among risk factors. The indicators used in the ACE
study include self-reported measures of emotional abuse, physical abuse, sexual abuse, emotional
neglect, physical neglect, exposure to violence in the home, exposure to substance abuse, mental
illness in the home, parental separation or divorce, incarceration of a household member, and some
other medical indicators. These are fundamentally similar to the kinds of early risk factors that we
expect to be mitigated by prevention and early intervention efforts, and to require additional
protective factors and treatment in order to help prevent downstream effects of these upstream
experiences. There are some drawbacks to using the ACE information—first, the ACE study does
not include all indicators in which we have interest. Second, the measurement and definition of ACE
indicators differ from available data for Marion County. ACE study measures are also self-reported,
and therefore are likely to differ significantly from the agency reporting rates to which we have
immediate access. Nonetheless, the ACE overlap information is useful for interpreting the risk
factor information we have collected. The number of observations in the ACE study is also very
high, which increases confidence in the external validity of their overlap measures.
ACE Overlap Figures
N=17,337
36.1% reported no adverse childhood experiences.
26.0% reported 1 adverse childhood experience.
15.9% reported 2 adverse childhood experiences.
9.5% reported 3 adverse childhood experiences.
12.5% reported 4 or more adverse childhood experiences.

Center for Health Policy School of Public and Environmental Affairs
35
Cumulative ACE Figures
36.1% reported no adverse childhood experiences.
63.9% reported 1 or more adverse childhood experiences.
37.9% reported 2 or more adverse childhood experiences.
22.0% reported 3 or more adverse childhood experiences.
12.5% reported 4 or more adverse childhood experiences.

Ta
ble
8:
Ra
te-B
as
ed
Po
pu
lati
on
Ris
k E
sti
ma
tes
Ris
k F
act
or
%
To
tal
Pe
rin
ata
l P
resc
ho
ol
Pri
ma
ry S
cho
ol
Mid
dle
S
cho
ol
Hig
h
Sch
oo
l Y
ou
ng
A
du
lt
No
tes
0
1
-4
5-9
1
0-1
4
15
-19
2
0-2
4
To
tal
Ma
rio
n C
ou
nty
po
pu
lati
on
by
ag
e
10
0.0
3
02
,63
9
14
,86
8
57
,59
6
63
,01
8
60
,33
9
57
,13
2
49
,68
6
1*
BIR
TH
RE
LA
TE
D
No
fir
st t
rim
est
er
pre
na
tal
care
2
3.6
7
1,4
23
3
,50
9
13
,59
3
14
,87
2
14
,24
0
13
,48
3
11
,72
6
2**
No
nm
ari
tal
bir
ths
49
.1
14
8,5
96
7
,30
0
28
,28
0
30
,94
2
29
,62
6
28
,05
2
24
,39
6
2
Lo
w b
irth
we
igh
t 8
.8
26
,63
2
1,3
08
5
,06
8
5,5
46
5
,31
0
5,0
28
4
,37
2
3
Sin
gle
mo
the
r/N
o h
igh
sch
oo
l d
iplo
ma
8
.0
24
,21
1
1,1
89
4
,60
8
5,0
41
4
,82
7
4,5
71
3
,97
5
2
Mo
the
r u
sed
dru
gs
in m
on
th b
efo
re b
irth
8
.5
25
,72
4
1,2
64
4
,89
6
5,3
57
5
,12
9
4,8
56
4
,22
3
4
Ch
ild
ren
bo
rn t
o t
ee
n m
oth
ers
6
.6
19
,97
4
98
1
3,8
01
4
,15
9
3,9
82
3
,77
1
3,2
79
3
**†
PO
VE
RT
Y
Ch
ild
ren
liv
ing
in
po
ve
rty
1
8.3
5
5,3
83
2
,72
1
10
,54
0
11
,53
2
11
,04
2
10
,45
5
9,0
93
3
Fre
e l
un
ch/
text
bo
ok
eli
gib
le
37
.7
11
4,0
95
5
,60
5
21
,71
4
23
,75
8
22
,74
8
21
,53
9
18
,73
2
5
AC
AD
EM
IC
De
lay
ed g
rad
ua
tio
n
48
.0
14
5,2
67
7
,13
7
27
,64
6
30
,24
9
28
,96
3
27
,42
3
23
,84
9
3
Fa
ilu
re t
o g
rad
ua
te h
igh
sch
oo
l 1
0.9
3
2,9
88
1
,62
1
6,2
78
6
,86
9
6,5
77
6
,22
7
5,4
16
5
Su
spe
nsi
on
s a
nd
exp
uls
ion
s 3
2.9
9
9,5
68
4
,89
2
18
,94
9
20
,73
3
19
,85
2
18
,79
6
16
,34
7
5†
†
ME
NT
AL
HE
AL
TH
Dia
gn
ose
d l
earn
ing
dis
ab
ilit
y
7.3
2
2,0
93
1
,08
5
4,2
05
4
,60
0
4,4
05
4
,17
1
3,6
27
6
‡
Dia
gn
ose
d e
mo
tio
na
l d
istu
rba
nce
2
.5
7,5
66
3
72
1
,44
0
1,5
75
1
,50
8
1,4
28
1
,24
2
6‡
Su
icid
al
13
.0
39
,34
3
1,9
33
7
,48
7
8,1
92
7
,84
4
7,4
27
6
,45
9
7
Att
em
pte
d s
uic
ide
in p
ast
12
mo
nth
s 8
.4
25
,42
2
1,2
49
4
,83
8
5,2
94
5
,06
8
4,7
99
4
,17
4
7
AL
CO
HO
L A
ND
DR
UG
US
E
Pa
st m
on
th i
llic
it d
rug
use
2
1.0
6
3,5
54
3
,12
2
12
,09
5
13
,23
4
12
,67
1
11
,99
8
10
,43
4
8
Bin
ge
dri
nk
ing
28
.9
87
,46
3
4,2
97
1
6,6
45
1
8,2
12
1
7,4
38
1
6,5
11
1
4,3
59
8
Lif
eti
me
use
of
coca
ine
7.7
2
3,3
03
1
,14
5
4,4
35
4
,85
2
4,6
46
4
,39
9
3,8
26
8
AB
US
E/
NE
GL
EC
T
Su
bst
an
tia
ted
ab
use
or
ne
gle
ct
1.5
4
,60
0
22
6
87
5
95
8
91
7
86
8
75
5
9†
Exp
eri
en
ced
ab
use
or
ne
gle
ct
4.8
1
4,5
27
2
26
1
,10
1
2,0
59
2
,97
6
3,8
45
4
,60
0
9
VIO
LE
NC
E
Ca
rrie
s w
eap
on
1
9.2
5
8,1
07
2
,85
5
11
,05
8
12
,09
9
11
,58
5
10
,96
9
9,5
40
7
Ca
rrie
s g
un
5
.8
17
,55
3
86
2
3,3
41
3
,65
5
3,5
00
3
,31
4
2,8
82
7
Ph
ysi
cal
fig
hti
ng
3
5.9
1
08
,64
7
5,3
38
2
0,6
77
2
2,6
23
2
1,6
62
2
0,5
10
1
7,8
37
7
Da
tin
g v
iole
nce
9
.2
27
,84
3
1,3
68
5
,29
9
5,7
98
5
,55
1
5,2
56
4
,57
1
7
DE
LIN
QU
EN
CY
Arr
est
ra
te
2.1
3
6,4
46
3
17
1
,22
7
1,3
42
1
,28
5
1,2
17
1
,05
8
10
†
No
tes:
see
be
low
fo
r e
xpla
na
tio
ns
an
d s
ou
rces
.

Data Sources and Notes for Table 8
Red text = original data, rate, or estimate Orange text = expected population to be at risk for developing this factor Blue text = expected population to have experienced this risk factor
Reference
Number
Year Data
Level
Source
1 2006/2004 County U.S. Census Bureau (population estimates) /IYI Kids Count (birth rate)
2 2003 County IYI Kids Count
3 2004 County AECF CLIKS Data
4 2006 National NDIC
5 2004 County IYI Kids Count
6 2003 County Marion County Public Schools
7 2005 National CDC High School Youth Risk Behavior Surveillance Report
8 2004 State Indiana Prevention Resource Center
9 2004 County Indiana Department of Child Services Demographic Trends Report
10 2006 CDC Adverse Childhood Experiences Study
11 2004 State Indiana Criminal Justice Institute
Symbol Note
* Perinatal population estimate is based on total live births. Preschool is total for 0-4 minus total live births.
** Assumes single births
† Converted from per thousand measurement
†† Used school population total (all schools) from IYI Kids Count data in determining rate
‡ Treated at school only
Population forecasts are from Stats Indiana/Indiana Business Research Center.

Center for Health Policy School of Public and Environmental Affairs
38
CONCLUSION
We believe the estimates and information provided here is a useful starting point for recognizing
the upstream need for prevention and early intervention programs at various stages of childhood
development. We hope in the future to provide even more accurate, detailed, and useful
information, including the use of deidentified agency-level data to develop more accurate estimates
of the current need at the intervention and treatment level of service. We hope also to develop
more sophisticated estimates regarding comorbidity in risk and overlap in treatment, and more
detailed information about which risk factors cluster with which other risk factors, Marion county-
specific demographic detail including age, race, and gender clustering, and some systematic
comparison of risk rates to rates of observation and treatment.
Center for Health Policy School of Public and Environmental Affairs
39
FINDINGS
Indiana has a very low share of funding from federal sources, 28% in 2002—the lowest of all states
in the most recent Urban Institute report (Scarcella et al., 2004). In Marion County, the Family and
Children Fund receives approximately 18% of its funding through federal funds, compared to a
national average of 49% as calculated by the Urban Institute (Scarcella et al., 2006).
Both the number and percentage of children who live in poverty in Marion County increased from
2000 to 2004. All other things equal, this trend will lead to either increased spending on child
welfare or to lower spending per child in need. If we are to keep spending at current levels while
continuing to serve the increasing population of needy children, we will need to find more efficient
ways to provide services.
Forecasting future costs requires making assumptions. Some assumptions are made because they
are appealing; others are made out of necessity or due to lack of data. Based on 2007 per child
costs and the current prevalence of risk factors, along with population forecasts for Marion County
youth in 2010, estimated spending from the budgeted portion of the CFCF Fund is estimated to be
$105 million in 2010, compared to $101 million in 2006. The reason for a small increase in costs is
because population is forecasted to grow slowly in Marion County.
The cost of services per child has been increasing steadily since 2003, and there was a pronounced
increase in cost from 2006 to 2007. The average growth rate over this period can be used to
forecast future costs per child. Using the average growth rate over the entire period results in a
forecast of $186 million in 2010. However, it is possible that the sharp increase from 2006 to 2007
is not representative of the trend. A forecast based on the average growth rate from 2003 to 2006
produces a forecast of $144 million being spent on the budgeted portion of the CDCF Fund.
We do not currently have a good forecast of how risk factor prevalence will change; however, given
that the percentage of children living in poverty in Marion County has been increasing, it is likely
that the prevalence of risk factors will increase, leading to a greater increase in the cost of child

Center for Health Policy School of Public and Environmental Affairs
40
services. Early intervention, properly implemented, can help decrease the lifelong cost of caring for
children and help reduce the increased costs for child care that Marion County faces.
RECOMMENDATIONS
This study is concluded with three key recommendations:
1. More investigation needs to be done to determine how Marion County can obtain more
federal funds for child welfare and early intervention spending.
2. More research needs to be conducted to determine the benefits of early intervention. This
can be done by either implementing a program to study the benefits of early intervention in
Marion County or by generalizing the results of studies of other early intervention programs
to Marion County.
3. Marion County officials need to be cautious if they decide to move the responsibility for
child welfare to the county level. There are significant overhead expenses which are
currently paid by the state and would require additional funds if the county took full
responsibility for child welfare. These overhead expenses include salaries and benefits of
400 staff, a building lease, training and transportation, and equipment and supplies. These
overhead expenses total $22 million.
4. Alternative funding sources should be considered as an alternative to property taxes.

Center for Health Policy School of Public and Environmental Affairs
41
APPENDIX 1:
CHILD WELFARE FUNDING
Funding Source: Title IV-B
Eligible Population: No Eligibility Criteria.
Eligible Services
Title IV-B Subpart 1
� Prevention and Support Services (Family Support) � Crisis Intervention (Family Preservation) � Time-Limited Family Re-unification Services � Adoption Promotion and Support Services � Foster Care Maintenance � Adoption Assistance Program (AAP) � Foster / Kinship / Adoptive Parent Training (FAKT) � Chafee Foster Care Independence Program � Staff Development � Non Standardized Programs
Title IV-B Subpart 2
� Prevention and Support Services (Family Support) � Crisis Intervention (Family Preservation) � Time-Limited Family Re-unification Services � Adoption Promotion and Support Services � Chafee Foster Care Independence Program � Prevention Services-Community Partners for Child Safety
How Funded
Title IV-B Subpart 1

Center for Health Policy School of Public and Environmental Affairs
42
� The most recent law authorizes $ 325 million for each of the federal fiscal years (FY) 2007 through (FY) 2011.
� Each State’s share is determined by the state’s relative share of population under age 21 and the state’s per capita average income.
� There is a minimum allotment of $ 70,000 per state. � Federal Match : 75%
Title IV-B Subpart 2
� The law authorizes $ 345 million and discretionary funds at $ 200 million for FY2007-FY2011. � Each state share is determined by the state’s relative share of children receiving food stamps. � Federal Match : 75%
Limitations
� Program is not funded at the full level of authorized funding. � Program funding for services is a small percentage of total child welfare funding.

Center for Health Policy School of Public and Environmental Affairs
43
Funding Source: Foster Care, Title IV-E
Eligible Population
� Children eligible for AFDC program, for whom the required court orders are obtained, and who are placed in eligible homes or facilities.
Eligible Services
� Basic Maintenance, including children’s food and shelter and parental visits, and case planning.
How Funded
� Open Ended Entitlement: As much money required to pay for all entitlements. � Federal Match: Equal to Medicaid match rates, rates range from 50%-83%.
Limitations
� Support not provided for children whose birth parents do not meet eligibility requirements based on 1996 eligibility for AFDC.
� No direct support to children in the care of tribes, unless the tribe has a contract with its state. � Support is not provided for children who leave foster care to return to parents or who are in
permanent guardianship with relatives.

Center for Health Policy School of Public and Environmental Affairs
44
Funding Source: Adoption Assistance, Title IV-E
Eligible Population:
� Children with “special needs” eligible for Title IV-E Foster Care or SSI-Supplemental Security Income.
Eligible Services
� Payments to adoptive parents on behalf of children with special needs whom they adopt; not to exceed comparable foster care payment rates.
How Funded
� Open Ended Entitlement-As much money as is required to pay all eligible claims. � Federal Match: Equal to Medicaid match rates, ranging from 50%-83%.
Limitations
� Support not provided for children whose birth parents do not meet eligibility requirements based on 1996 eligibility for AFDC.
� No direct support to children in the care of tribes, unless the tribe has a contract with its state. � Support is not provided for children who leave foster care to return to parents or who are in
permanent guardianship with relatives. � In some states, children adopted from foster care who are not eligible for IV-E do not receive
the same benefits as IV-E eligible children. � Does not fund post-adoption services.

Center for Health Policy School of Public and Environmental Affairs
45
Funding Source: Chafee Foster Care Independence, Title IV-E
Eligible Population
� Youth (no minimum age) who are likely to remain in foster care until age 18; youth age 18-21.
Eligible Services
� Funds basic living skills training, education, employment initiatives, housing, substance abuse, prevention, and preventive health activities.
� Eligible youth and youth adopted from foster care after age 16 may receive Education and Training Vouchers.
How Funded
� Mandatory-Capped; authorized at $140 million. � Not more than 30% of the funds may be used for housing youth ages 18-20. � Federal Match: 80%
Limitations
� In some states, youth who achieve permanence through return home, guardianship, or adoption are not eligible for program services.
� Education and Training Vouchers are available only to youth in independence programs and to youth adopted at age 16 or older.

Center for Health Policy School of Public and Environmental Affairs
46
Funding Source: Administration, Title IV-E
Eligible Population
� Not Applicable.
Eligible Services
� Expenses associated with IV-E eligible children in foster care. � Administrative expenses for foster care program. � Children eligible for title IV-E adoption assistance. � Foster Care: Certain pre placement services, case management, eligibility determination,
licensing, foster care recruitment, and other administrative activities, including training of non public agency staff.
� Adoption Assistance.
How Funded
� Open Ended Entitlement. � Federal Match: 50%
Limitations
� Reimbursement is limited to the proportion of expenditures incurred for children who are IV-E eligible.
� States may not claim federal reimbursement for administrative costs for the care of children who are placed with relatives who are not licensed foster parents.

Center for Health Policy School of Public and Environmental Affairs
47
Funding Source: Training, Title IV-E
Eligible Population
� Not Applicable.
Eligible Services
� Costs of training proportional to children eligible for Title IV-E. � Training of public agency staff and foster and adoptive parents.
How Funded
� Open Ended Entitlement. � Federal Match: 75%
Limitations
� Funds may not be permitted for training, private child welfare agency staff, CASA’s, or children’s legal representatives.
� Funds cannot be used for training purposes for non IV-E Eligible children.

Center for Health Policy School of Public and Environmental Affairs
48
Funding Source: SSBG, Social Services Block Grant.
Eligible Services
� Prevention and Support Services (Family Support) � Crisis Intervention (Family Preservation) � Time-Limited Family Re-unification Services � Foster / Kinship / Adoptive Parent Training (FAKT)
How Funded
� Mandatory Capped Entitlement subject to the congressional appropriations process � Used for Child Welfare Purposes; Varies by state, ranges from 0% to 34%.
Limitations
� Program has never been fully funded and appropriations fall well below the authorized amount. � SSBG is very vulnerable to funding cuts. � Child Welfare must compete with other issues for funding, pitting programs and systems
against one another for a limited pool of money.

Center for Health Policy School of Public and Environmental Affairs
49
Funding Source: TANF
Eligible Services
� Provides assistance to needy families so that children may be cared for in their own homes or in the homes of their relatives.
� If states formerly used Emergency Assistance funds for foster care, states can use TANF funds for this purpose.
How Funded
� Mandated Funding Block Grant. � Used for Child Welfare Purposes; Varies by state, range from 0% to 50%.
Limitations
� Access to funds for child welfare purposes is subject to change with each reauthorization of the program.
� Child Welfare must compete with other issues for funding, pitting programs and systems against one another for a limited pool of money.

Center for Health Policy School of Public and Environmental Affairs
50
REFERENCES
Compilation of the Social Security Laws. (2007). Retrieved October 8, 2007, from http://www.ssa.gov/OP_Home/ssact/
Freundlich, M. (2007). Child Welfare Financing 101. St. Paul, MN: North American Council on Adoptable Children.
Geen, R., & Waters, S. (1997). The Impact of Welfare Reform on Child Welfare Financing, New
Federalism: Issues and Options for States. Washington, D.C.: The Urban Institute. Scarcella, C. A., Bess, R., Zielewski, E. H., & Geen, R. (2006). The Cost of Protecting Vulnerable
Children V. Washington, D.C.: The Urban Institute. Scarcella, C. A., Bess, R., Zielewski, E. H., Warner, L., & Geen, R. (2004). The Cost of Protecting
Vulnerable Children IV. Washington, D.C.: The Urban Institute.
Recommended


