
ww.sciencedirect.com
wat e r r e s e a r c h x x x ( 2 0 1 3 ) 1e1 2
Available online at w
ScienceDirect
journal homepage: www.elsevier .com/locate/watres
Monitoring microbiological changes in drinkingwater systems using a fast and reproducible flowcytometric method
E.I. Prest a, F. Hammes b,*, S. Kotzsch b, M.C.M. van Loosdrecht a,J.S. Vrouwenvelder a,c,d
aDepartment of Biotechnology, Faculty of Applied Sciences, Delft University of Technology, Julianalaan 67,
2628 BC Delft, The NetherlandsbEawag, Swiss Federal Institute of Aquatic Science and Technology, Ueberlandstrasse 133, CH-8600 Duebendorf,
SwitzerlandcWetsus, Centre of Excellence for Sustainable Water Technology, Agora 1, P.O. Box 1113, 8900 CC Leeuwarden,
The NetherlandsdKing Abdullah University of Science and Technology, Water Desalination and Reuse Center, Thuwal, Saudi Arabia
a r t i c l e i n f o
Article history:
Received 31 March 2013
Received in revised form
1 July 2013
Accepted 22 July 2013
Available online xxx
Keywords:
Biological stability
Distribution network
Drinking water
Flow cytometry (FCM)
Household
Low and high nucleic acid (LNA and
HNA) content bacteria
Abbreviations: AOC, assimilable organic cLNA, low nucleic acid; RSD, relative standar* Corresponding author. Tel.: þ41 58 765 537E-mail address: frederik.hammes@eawag
Please cite this article in press as: Prest, Eand reproducible flow cytometric metho
0043-1354/$ e see front matter ª 2013 Elsevhttp://dx.doi.org/10.1016/j.watres.2013.07.051
a b s t r a c t
Flow cytometry (FCM) is a rapid, cultivation-independent tool to assess and evaluate bacte-
riological quality and biological stability of water. Here we demonstrate that a stringent,
reproducible staining protocol combined with fixed FCM operational and gating settings is
essential for reliable quantification of bacteria and detection of changes in aquatic bacterial
communities. Triplicatemeasurements of diverse water samples with this protocol typically
showed relative standard deviation values and 95% confidence interval values below 2.5% on
all the main FCM parameters. We propose a straightforward and instrument-independent
method for the characterization of water samples based on the combination of bacterial
cell concentration and fluorescence distribution. Analysis of the fluorescence distribution (or
so-called fluorescence fingerprint) was accomplished firstly through a direct comparison of
the raw FCM data and subsequently simplified by quantifying the percentage of large and
brightly fluorescent high nucleic acid (HNA) content bacteria in each sample. Our approach
enables fast differentiation of dissimilar bacterial communities (less than 15 min from sam-
pling to final result), and allows accurate detection of even small changes in aquatic envi-
ronments (detection above 3% change). Demonstrative studies on (a) indigenous bacterial
growth inwater, (b) contamination of drinkingwaterwithwastewater, (c) householddrinking
water stagnation and (d)mixing of twodrinkingwater types, univocally showed that this FCM
approach enables detection and quantification of relevant bacterial water quality changes
with high sensitivity. This approach has the potential to be used as a new tool for application
in the drinkingwater field, e.g. for rapid screening of themicrobial water quality and stability
during water treatment and distribution in networks and premise plumbing.
ª 2013 Elsevier Ltd. All rights reserved.
arbon; a.u, arbitrary units; FCM, flow cytometer / flow cytometry; HNA, high nucleic acid;d deviation; TCC, total cell count; %HNA, percentage of high nucleic acid content cells.2, þ41 58 765 5260; fax: þ41 58 765 5547..ch (F. Hammes).
.I., et al., Monitoring microbiological changes in drinking water systems using a fastd, Water Research (2013), http://dx.doi.org/10.1016/j.watres.2013.07.051
ier Ltd. All rights reserved.
wat e r r e s e a r c h x x x ( 2 0 1 3 ) 1e1 22
1. Introduction
Here we argue that the quantitative use of both cell con-Flow cytometry (FCM) was introduced in the field of aquatic
microbiology as a cultivation-independent tool to enumerate
and assess suspended bacterial communities (Robertson and
Button, 1989; Vives-Rego et al., 2000; Gasol and Del Giorgio,
2000). FCM used in combination with fluorescent stains re-
veals important information such as total cell concentration,
bacterial viability, bacterial characteristics or bacterial iden-
tity in water samples (Veal et al., 2000; Wang et al., 2010;
Hammes et al., 2011). A wide range of fluorescent stains and
fluorescently labeled compounds is available, targeting a
specific characteristic or component of the cell, such as
membranes, nucleic acids or proteins (Vives-Rego et al., 2000;
Gasol and Del Giorgio, 2000).
During the past decade, FCM has emerged as a tool for
rapid assessment of drinking water quality (Hoefel et al., 2003,
2005; Phe et al., 2005; Berney et al., 2008). One of the most
straightforward applications, namely the determination of
total cell counts (TCC) using FCM in combination with nucleic
acid targeting stains, was shown repeatedly to be useful for
monitoring of treatment processes or detection of changes in
drinking water quality (Hammes et al., 2008; Lautenschlager
et al., 2010; Vital et al., 2012; Ho et al., 2012; Kotzsch and Egli,
2013). The TCC method was recently standardized via an
inter-laboratory ring trial and officially accepted as a guideline
method for drinking water analysis in Switzerland (SLMB,
2012). However, the capability of the TCC method extends
beyond cell counting. Each measurement provides multi-
variable information at single cell level by recording the
fluorescence intensity and light scatter signals, thereby
creating a so-called “fingerprint” of the bacterial community
that can be analyzed in different ways (Hammes et al., 2012;
De Roy et al., 2012). The fingerprint information can be valu-
able in practice for detection of changes that are not reflected
in the cell concentration.
Some fluorescent stains such as DAPI or SYBR� Green I
bind preferentially to nucleic acids (Robertson and Button,
1989; Zipper et al., 2004). The fluorescence intensity of such
stains is directly related to the amount of nucleic acids present
in the treated sample (Zipper et al., 2004) when the nucleic
acids are easily accessible by the stain (e.g. free DNA solu-
tions). In theory, the fluorescence intensity recorded for one
labeled bacterial cell should be directly related to its nucleic
acid content, which is dependent on both the type of bacteria
as well as its physiological state (Muller et al., 2000; Gunther
et al., 2008). As an example, increased fluorescence intensity
was recorded during regrowth of pure lab-cultured bacterial
communities due to duplication of DNA (Muller et al., 2000).
When considering natural samples, indigenous bacterial cells
have widely different amounts of nucleic acids (different
genome sizes) and can differ in their physiological states,
which will have an impact on the fluorescence intensities
when bacteria are stained. Because of this heterogeneity,
analysis of indigenous communities generates a unique fluo-
rescence distribution or fluorescence fingerprint, made of
multiple clusters of bacteria, distinguished from each other by
differences in fluorescence intensity (Wang et al., 2008;
Gunther et al., 2008).
Please cite this article in press as: Prest, E.I., et al., Monitoring mand reproducible flow cytometric method, Water Research (2013
centration data and fluorescence distribution information is
onlymeaningful if a highly reproducible labeling of the cells is
achieved during staining. While this notion seems self-
evident, an overview of current literature suggests that
staining procedures are not necessarily applied (or at least
described) in a reproducible manner in practice. Multiple
studies do not take in account critical aspects of staining such
as temperature, incubation time and FCM settings, and
particularly the concept of a stringent reproduction of staining
and measurement protocols for allowing correct comparison
of samples (e.g. Gasol et al., 1999; Lebaron et al., 2001; Hoefel
et al., 2005; De Roy et al., 2012) (discussed in detail below).
The aim of the present study was to determine (i) whether
flow cytometric methodology can be improved by using a
reproducible staining procedure and (ii) whether a simple data
collection and analysis strategy, using the combination of cell
concentrations and fluorescence fingerprints, is suitable for
sensitive detection of changes in the microbial communities
of natural aquatic environments in general, and specifically
for drinking water (distribution networks). Studies were done
to assess whether flow cytometry can sensitively detect and
quantify (a) regrowth, (b) contamination of drinking water
with wastewater, (c) household stagnation and (d) mixing of
two drinking water types. Potential practical applications of
flow cytometry for the water field are discussed.
2. Materials and methods
2.1. Staining protocol
Water samples were stained according to the standardized
protocol proposed in the Swiss guideline for drinking water
analysis (SLMB, 2012). In short, samples (500 mL) were pre-
heated to 35 �C (5 min) and then stained with 10 mL mL�1
SYBR� Green I (1:100 dilution in DMSO; Molecular Probes), and
incubated in the dark for 10 min at 35 �C beforemeasurement.
Where necessary, samples were diluted just before measure-
ment in filtered (0.22 mm; Millex-GP, Millipore) bottled mineral
water (EVIAN, France), so that the bacterial concentration
measuredwith the flow cytometer (FCM) was always less than
2 � 105 cells mL�1. Unless stated otherwise, this staining
protocol was strictly applied in order to achieve comparable
data.
2.2. Flow cytometric measurements
Measurements were performed using a BD Accuri C6� flow
cytometer (BD Accuri cytometers, Belgium) equipped with a
50 mW laser emitting at a fixed wavelength of 488 nm. Fluo-
rescence intensity was collected at Fl1 ¼ 533 � 30 nm,
Fl3 > 670 nm, while sideward and forward scattered light in-
tensities were collected as well. The FCM is equipped with
volumetric counting hardware, calibrated to measure the
number of particles in 50 mL of a 500 mL sample. Measurements
were performed at pre-set flow rate of 35 mL min�1. All data
were processed with the BD Accuri CFlow� software, and
electronic gating was used to separate positive signals from
icrobiological changes in drinking water systems using a fast), http://dx.doi.org/10.1016/j.watres.2013.07.051

wat e r r e s e a r c h x x x ( 2 0 1 3 ) 1e1 2 3
instrument and water sample background. A threshold value
of 500 was applied on the green fluorescence channel (FL1).
Unless stated otherwise, the instrument settings and elec-
tronic gates were kept the same for all samples in order to
achieve comparable data.
2.3. Gating strategy
Density plots of green fluorescence (FL1; 533 nm), and red
fluorescence (FL3; >670 nm) allowed for optimal distinction
between the stained microbial cells and instrument noise or
sample background (Fig. 1A, Hammes and Egli, 2005, 2010). An
electronic gate on the green/red fluorescence density plot was
used to select the signals of bacteria (Fig. 1A) and the selected
data from the bacterial gatewere subsequently visualized on a
green fluorescence histogram for further analysis (Fig. 1B).
The green fluorescence channel was chosen, since it collects
fluorescence at 533 nm, which is closest to the emission
maximum of SYBR� Green I (520 nm). The typical two-cluster
pattern of low (LNA) and high (HNA) nucleic acid content
bacteria, usually observed in natural samples (Lebaron et al.,
2001; Wang et al., 2009; Vila-Costa et al., 2012), was used in
the gating strategy by applying additional gates on the green
fluorescence histogram to distinguish LNA and HNA com-
munities (Fig. 1B). The exact same gates and gating strategy
was applied for all samples in the form of a fixed template to
allow direct comparison between measured samples (SLMB,
2012).
2.4. Comparison and quantification of fluorescencedistribution
The green fluorescence intensity histogramdata, generated as
a result of SYBR Green I staining of the bacterial cells (Fig. 1B),
was used as the main FCM “fingerprint” for the bacterial
community. For a first comparison, the available FCM soft-
ware (BD Accuri CFlow�) was used to directly overlay raw data
Fig. 1 e Data collection and gating strategy. (A) Selection of bacte
dotted line) on the green/red fluorescence density plot (for excl
acid (LNA and HNA) content bacterial clusters on the resulting g
“Bacteria” gate in Fig. 1A). The LNA and HNA percentages indic
these two clusters. Exactly the same gates were used for all me
this figure legend, the reader is referred to the web version of t
Please cite this article in press as: Prest, E.I., et al., Monitoring mand reproducible flow cytometric method, Water Research (2013
from different samples. Secondly, gates applied on the green
fluorescence histogram (Fig. 1B) were used to calculate the
number of HNA cells and express it as percentage of the total
cell number (LNA and HNA cells). The gates for LNA and HNA
content cells were set based on experimental data from the
present study (discussed below) and previous experience
(Wang et al., 2009). The distribution between LNA and HNA,
expressed as the percentage of HNA was chosen as a simpli-
fied, single value to describe the fluorescence fingerprint of
the community. Straightforward comparison of data from
different water samples was subsequently made based on the
measured total cell concentration and the percentage of HNA
cells.
2.5. Repeatable staining and analysis of aquatic bacteria
The repeatability of the FCM method was assessed by sepa-
rately staining and measuring 10 discrete sub-samples of the
same natural drinking water community (non-chlorinated tap
water, Dubendorf, CH). The staining protocol, FCM settings
and gating strategy described in Sections 2.1e2.3 were strictly
applied for all sub-samples. Subsequently, the influence of
two critical staining parameters, namely sample staining
temperature and staining time, was studied by deliberate
variations from the staining protocol. Aliquots of a same tap
water sample (non-chlorinated tap water, Dubendorf, CH)
were stained with 10 mL mL�1 SYBR� Green I at respectively 4,
22 and 35 �C. Each sub-samplewas pre-heated or pre-cooled to
the experimental temperature before addition of the stain. For
each temperature, the staining of triplicate aliquots was
tested after 5, 10 and 15 min of staining time respectively.
2.6. Discrimination of waters of different origins
Water samples were collected from seven separate drinking
water distribution networks located in the Canton of Zurich
(CH), three different commercial brands of bottled mineral
ria in a typical drinking water sample using a fixed gate (red
usion of background). (B) Selection of low and high nucleic
reen fluorescence histogram of selected data (from
ate the distribution of the overall bacterial community into
asurements. (For interpretation of the references to color in
his article.)
icrobiological changes in drinking water systems using a fast), http://dx.doi.org/10.1016/j.watres.2013.07.051

wat e r r e s e a r c h x x x ( 2 0 1 3 ) 1e1 24
water (Evian, Vittel, OK), three separate river/creek samples
(Chriesbach river and Glatt river, Dubendorf, CH, Schachen-
bach, Bonstetten, CH), three separated rainwater collection/
treatment ponds (Dubendorf, CH) and one wastewater treat-
ment plant effluent (Dubendorf, CH). The staining protocol,
FCM settings and gating strategy described in Sections 2.1e2.4
were strictly applied for all sub-samples, with the exception
that for a direct comparison of the fluorescence fingerprints,
the measurement was stopped when 6000 cells were counted
within the defined bacterial gate (Fig. 1A).
2.7. Detection of changes in aquatic bacterialcommunities
2.7.1. Contamination of drinking water by wastewaterWastewater treatment effluent was used to simulate a
contamination event in drinking water. Wastewater effluent
was collected from a treatment plant in Horstermeer (NL),
while drinking water (without residual disinfectant) was
collected from a household tap in Haarlem (NL). Both the
wastewater and tap water samples were first analyzed to
determine their total cell concentration and fluorescence fin-
gerprints (as described in Sections 2.1e2.4). The wastewater
sample was then spiked into sub-samples of the tap water in
such a way that respectively 1, 2, 4, 8, 16 and 32% of the total
cell concentration of the spiked sample were originating from
the wastewater sample. Triplicate aliquots were then stained
and analyzed as described in Sections 2.1e2.4.
2.7.2. Mixing of two drinking water typesTwo different drinking water samples were used to simulate
changes in a mixing zone in a drinking water distribution
network. Both drinking waters were prepared from surface
water at two different locations (Leiduin andHaarlem, NL) and
contained no residual disinfectant. Both samples were first
analyzed to determine their total cell concentration and
fluorescence fingerprint (as described above). The samples
were thenmixed with each other into 6 sub-samples in such a
way that respectively 0, 20, 40, 60, 80, and 100% of the total cell
Table 1 e Experimental conditions of the flow cytometry studicommunities in water.
Study Stainingtime (min) tem
Repeatable staining and analysis of aquatic bacteria
- Effect standardized staining protocol 10
- Effect staining protocol variation 5, 10, 15
Discrimination waters of different origin 10
Detection of changes in aquatic bacterial communities
- Contamination of drinking water by wastewater 10
- Mixing of two drinking water types 10
- Overnight stagnation of drinking water
in premise plumbing (household)
10
- Regrowth of indigenous bacterial community 10
# LNA ¼ low-nucleic-acid containing bacterial community; HNA ¼ high-n
Please cite this article in press as: Prest, E.I., et al., Monitoring mand reproducible flow cytometric method, Water Research (2013
concentration of the mixed sample were originating from one
of the original samples. Triplicate samples were then stained
and analyzed as described in Sections 2.1e2.4.
2.7.3. Overnight stagnation of drinking water in premiseplumbingA household tap (Dubendorf, CH), receiving non-chlorinated
drinking water, was opened after overnight stagnation (14 h)
and the flowing water was sampled immediately after open-
ing the tap, after 30 s, 1 min, and at regular intervals during
6 h. The flow rate of the constantly running tap was about
180 L h�1. Each sample was stained and analyzed as described
in Sections 2.1e2.4.
2.7.4. (Re)growth of indigenous bacterial communitiesRiver water (Chriesbach, Dubendorf, CH) was diluted 10-fold
in filtered (0.22 mm) river water (same source) to a final cell
concentration of 3 � 105 cells mL�1. Approximately 0.5 mg L�1
assimilable organic carbon (AOC) was added as nutrient
(LuriaeBertani (LB) medium; 10000� final dilution) (Hammes
et al., 2010; Vital et al., 2010). A 250 mL aliquot of this sample
was incubated at 30 �C for 8 h with continuous stirring.
Samples (3 � 500 mL) were collected at 1 h intervals and then
stained and analyzed as described in Sections 2.1e2.4.
2.8. Overview of experiments
An overview of the experimental conditions is shown in
Table 1.
3. Results
3.1. Repeatable staining and analysis of aquatic bacteria
3.1.1. Repeatable results with a strict staining protocolStaining and analyzing indigenous bacterial communities
according to a strict protocol provides highly repeatable data
on cell concentrations and on fluorescence distribution
es on change detection and characterization of bacterial
Stainingperature (�C)
Water types studied Figure Resultssection
35 Drinking water 2 3.1.1
4, 22, 35 Drinking water 3 3.1.2
35 Drinking water,
bottled water, river water,
pond water, wastewater
4 3.2
35 Drinking water, wastewater
treatment effluent
5 3.3.1
35 Drinking water from two
different sources
6 3.3.2
35 Drinking water sampled
from tap in time
7 3.3.3
35 River water with dosed
substrate
8 3.3.4
ucleic-acid containing bacterial community.
icrobiological changes in drinking water systems using a fast), http://dx.doi.org/10.1016/j.watres.2013.07.051

wat e r r e s e a r c h x x x ( 2 0 1 3 ) 1e1 2 5
(Fig. 2). The fluorescence distribution histograms (533 nm)
obtained after analysis of ten sub-samples from the same
water were visually identical (Fig. 2A). Moreover, quantitative
analysis of the rawdata resulted in relative standard deviation
(RSD) values of respectively 1.15% (total cell counts) and 1.53%
(percentage of HNA cells; %HNA), and in 95% confidence in-
tervals of 0.71% (total cell counts) and 0.95% (%HNA) (n ¼ 10)
(Fig. 2B). In fact, for all measurements described in the present
study (50 samples), the RSD on triplicate samples was on
average below 2.5% in cell counts and%HNA cells, and the 95%
confidence interval values were 2.5% on average for both pa-
rameters. Fig. 2C demonstrates how identical samples would
cluster together on a combined plot of cell concentration and
fluorescence distribution, which can subsequently be used for
comparing different water samples.
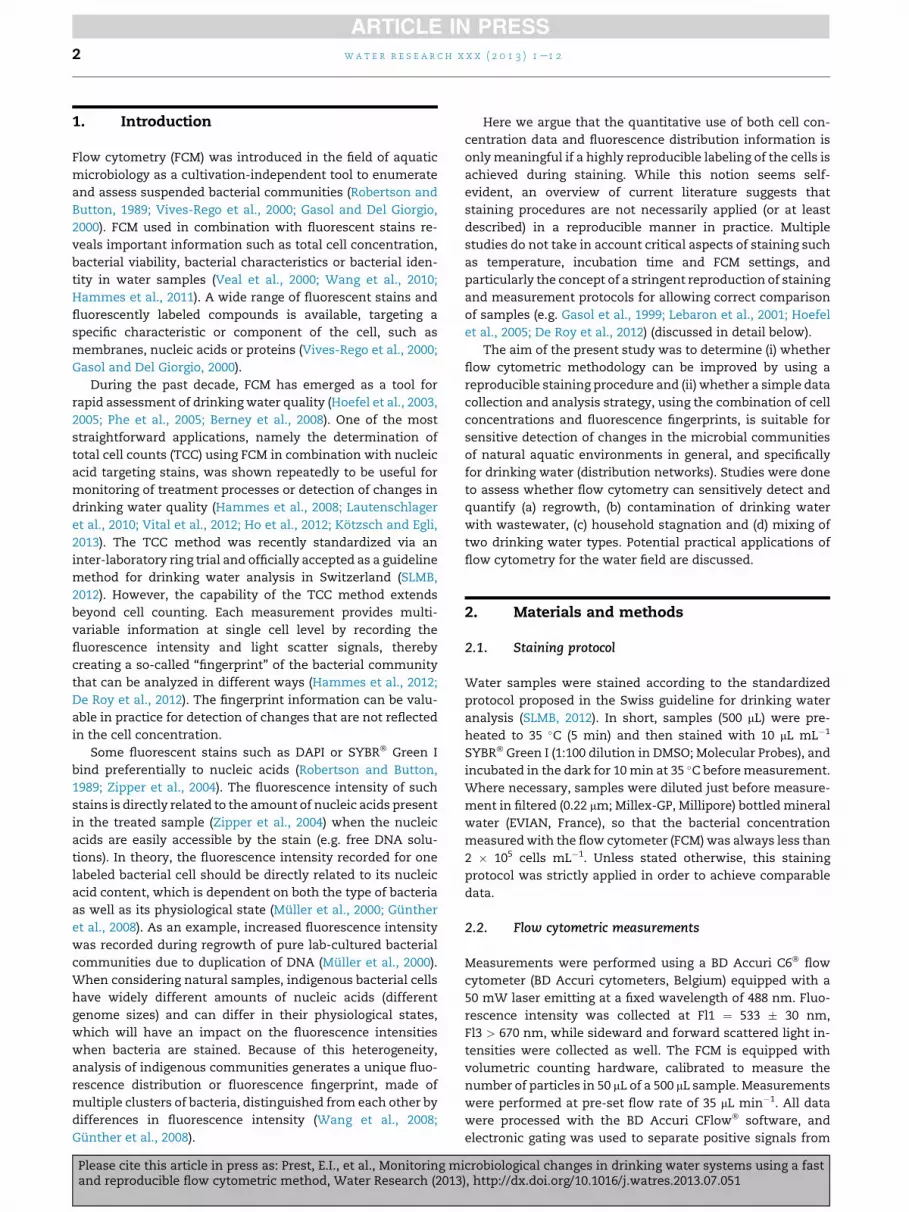
3.1.2. Adverse results from staining protocol variationDeviation from a fixed staining protocol negatively impacts
the accuracy of the obtained data (Fig. 3). The influence of the
staining temperature and staining time was investigated by
deliberately varying the staining conditions of the samewater
sample. Visual comparison of the fluorescence distribution
histograms obtained after measurement of the same sample
stained for 10 min at 4, 22 and 35 �C (Fig. 3A) and quantifi-
cation of the data (Fig. 3B and C) show that the fluorescence
distribution and cell concentrations are strongly affected by
variations in both staining temperature and staining time.
Significantly lower cell concentrations were measured when
staining was performed at a temperature (4 �C), opposed to
high temperature (35 �C). For each temperature, increasing
cell concentrations were found with increasing staining time,
although the impact of staining time was less pronounced
than that of staining temperature (Fig. 3B and C). The varia-
tions in staining protocols clearly show that reliable and
comparative results can only be obtained when using an ac-
curate and reproducible staining protocol as shown in Fig. 2.
Therefore, a fixed staining protocol (Section 2.1) and fixed
analysis and gating settings (Sections 2.2 and 2.3) were
Fig. 2 e High repeatability in (A) fluorescence distribution and (
measurement of 10 sub-samples of a same drinking water usin
distribution and cell concentration information can be combine
Different colored lines in Figure A represent raw data from indi
the fluorescence intensity used for separation of LNA and HNA
nucleic acid content bacteria.
Please cite this article in press as: Prest, E.I., et al., Monitoring mand reproducible flow cytometric method, Water Research (2013
applied for all samples to maintain consistency in the anal-
ysis and to allow direct comparison between different
samples.
3.2. Discrimination of waters from different origin
When using a reproducible staining protocol, water samples
from different origins (tap, bottled, river, pond and waste-
waters) differed considerably in terms of fluorescence distri-
bution and cell concentrations (Fig. 4). For example, bottled
water had a higher percentage of HNA cells compared to tap
water, while drinking water samples taken from different
distribution networks had clear differences in both cell con-
centrations (ranging from 1 � 103 to 4 � 105 cells mL�1) and
fluorescence fingerprints in most cases (Fig. 4 and Figure S1 in
Supplementary Information). However, in some cases sam-
ples had very similar cell concentrations and fluorescence
fingerprints, and were therefore difficult to distinguish from
one another (Figure S1 in Supplementary Information). Cell
concentrations of drinking waters (both tap and bottled wa-
ters) were in the range of 103 to 105 cells mL�1, while higher
cell concentrations were recorded in river, pond and waste-
waters (one to two log unit higher values). The fluorescence
fingerprints of representative examples of each water type,
and the results of additional drinking water samples are given
in Figures S1 and S2 in supplementary information. Most
water samples displayed the typical LNA and HNA bacterial
clusters commonly observed with FCM in aquatic samples,
although a small percentage of samples (e.g. Figure S2E in
supplementary material) showed no such discrimination, and
some samples were dominated by one of the clusters (e.g.
Figure S2B and S2C). The separation between the LNA and
HNA clusters was approximately at the same green fluores-
cence intensity (for our flow cytometer around 2 � 104 a.u.) for
all samples, which was the experimental basis for selecting
the LNA and HNA gating positions (Section 2.3). While the
differentiation of samples based on only cell concentrations
and the %HNA is a rather simplistic approach, it should be
B) cell concentrations resulting from the flow cytometric
g a fixed staining and analysis protocol. The fluorescence
d (C) for direct comparison of different water samples.
vidual measurements and the vertical dotted line indicate
cells. HNA [ high nucleic acid content bacteria; LNA [ low
icrobiological changes in drinking water systems using a fast), http://dx.doi.org/10.1016/j.watres.2013.07.051
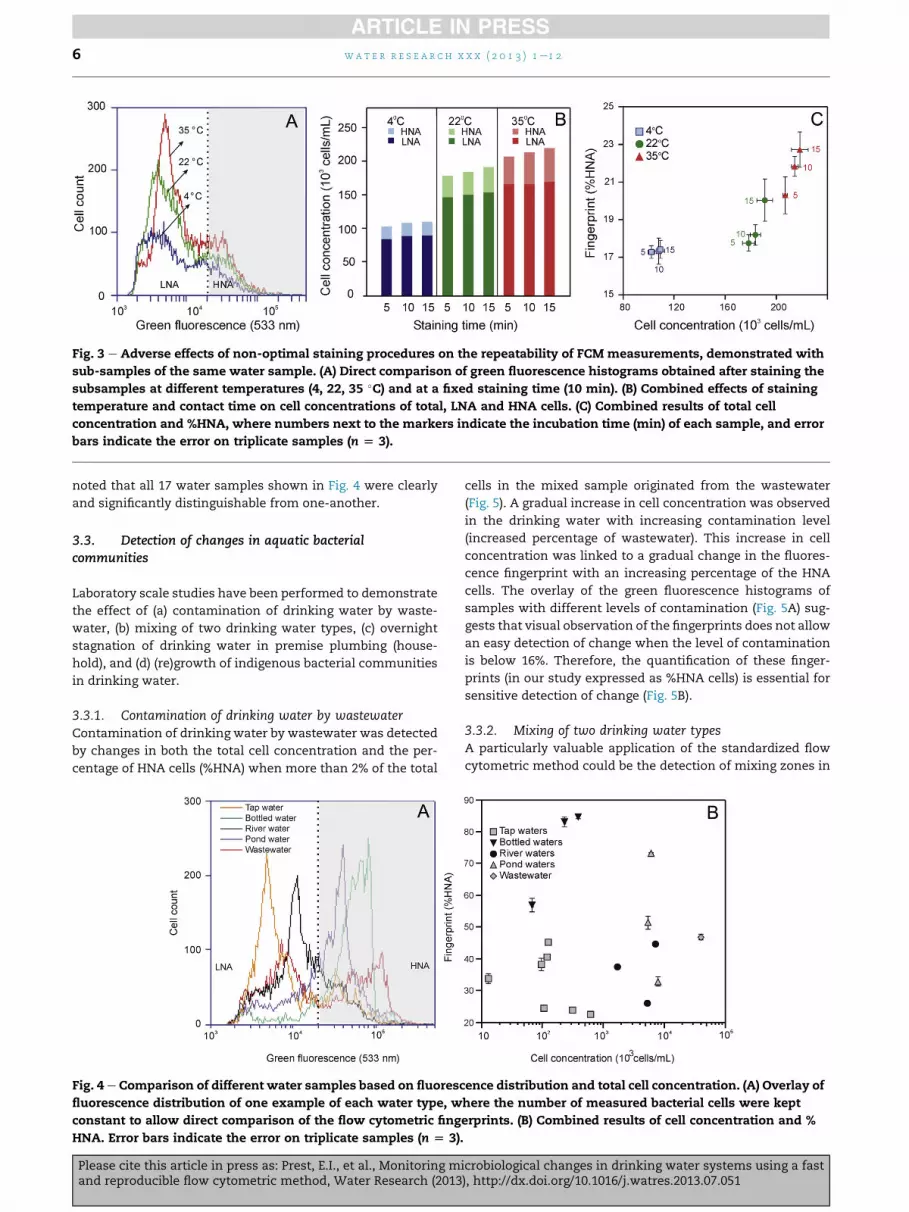
Fig. 3 e Adverse effects of non-optimal staining procedures on the repeatability of FCM measurements, demonstrated with
sub-samples of the same water sample. (A) Direct comparison of green fluorescence histograms obtained after staining the
subsamples at different temperatures (4, 22, 35 �C) and at a fixed staining time (10 min). (B) Combined effects of staining
temperature and contact time on cell concentrations of total, LNA and HNA cells. (C) Combined results of total cell
concentration and %HNA, where numbers next to the markers indicate the incubation time (min) of each sample, and error
bars indicate the error on triplicate samples (n [ 3).
wat e r r e s e a r c h x x x ( 2 0 1 3 ) 1e1 26
noted that all 17 water samples shown in Fig. 4 were clearly
and significantly distinguishable from one-another.
3.3. Detection of changes in aquatic bacterialcommunities
Laboratory scale studies have been performed to demonstrate
the effect of (a) contamination of drinking water by waste-
water, (b) mixing of two drinking water types, (c) overnight
stagnation of drinking water in premise plumbing (house-
hold), and (d) (re)growth of indigenous bacterial communities
in drinking water.
3.3.1. Contamination of drinking water by wastewaterContamination of drinking water by wastewater was detected
by changes in both the total cell concentration and the per-
centage of HNA cells (%HNA) when more than 2% of the total
Fig. 4 e Comparison of different water samples based on fluoresc
fluorescence distribution of one example of each water type, w
constant to allow direct comparison of the flow cytometric fing
HNA. Error bars indicate the error on triplicate samples (n [ 3)
Please cite this article in press as: Prest, E.I., et al., Monitoring mand reproducible flow cytometric method, Water Research (2013
cells in the mixed sample originated from the wastewater
(Fig. 5). A gradual increase in cell concentration was observed
in the drinking water with increasing contamination level
(increased percentage of wastewater). This increase in cell
concentration was linked to a gradual change in the fluores-
cence fingerprint with an increasing percentage of the HNA
cells. The overlay of the green fluorescence histograms of
samples with different levels of contamination (Fig. 5A) sug-
gests that visual observation of the fingerprints does not allow
an easy detection of change when the level of contamination
is below 16%. Therefore, the quantification of these finger-
prints (in our study expressed as %HNA cells) is essential for
sensitive detection of change (Fig. 5B).
3.3.2. Mixing of two drinking water typesA particularly valuable application of the standardized flow
cytometric method could be the detection of mixing zones in
ence distribution and total cell concentration. (A) Overlay of
here the number of measured bacterial cells were kept
erprints. (B) Combined results of cell concentration and %
.
icrobiological changes in drinking water systems using a fast), http://dx.doi.org/10.1016/j.watres.2013.07.051

Fig. 5 e Detection of tap water contamination with wastewater by fluorescence distribution and total bacterial cell
concentration. (A) Direct comparison of the green fluorescence histograms of the tap water and the tap water contaminated
with 16% and 32% wastewater bacteria. (B) Combined results of cell concentration and %HNA, where the numbers next to
the markers indicate the percentage of total cells originating from the contaminating wastewater, and error bars indicate
the error on triplicate samples (n [ 3). Arrow on figure B indicates increasing contamination.
wat e r r e s e a r c h x x x ( 2 0 1 3 ) 1e1 2 7
water distribution networks. Mixing of two drinking waters
fromdifferent locations (referred to aswater type 1 and type 2)
was tested in different proportions and could be detected in all
themixed samples (Fig. 6). The two drinking waters were both
prepared from surface water and had similar characteristics.
However, water type 1 had a slightly lower cell concentration
(1.5 � 105 cells mL�1) than water type 2 (1.8 � 105 cells ml�1)
and had a lower percentage of HNA cells (14%, compared to
24% in water type 2). Increased proportions of the water type 2
in water type 1 therefore resulted in a gradual change in
fluorescence distribution visually observed (Fig. 6A) through a
clear increase in cell count in the LNA fraction and quantita-
tively translated as a decrease in the percentage of HNA cells.
A gradual decrease in cell concentration was simultaneously
observed (Fig. 6B).
3.3.3. Overnight stagnation of drinking water in premiseplumbingChanges in fluorescence distribution and cell concentration
were clearly observed in drinking water that stagnated over-
night in household pipes. Water was sampled after overnight
stagnation from the same household tap, immediately after
opening the tap, after 30 s, 1 min, and at regular intervals
during 6 h. The first water sample displayed a significantly
higher cell concentration than all following samples (Fig. 7A
and C). The cell concentration dropped dramatically from
5� 105 to 1� 105 cells mL�1 within the first 30 s of flushing (i.e.
the first 1.5 L) and decreased gradually over 1 h (200 L) until it
reached about 8 � 104 cells mL�1. This cell concentration was
maintained over the next 5 h (about 1000 L) with less than 2%
variation. The large difference in cell concentration between
the first sample after tap opening and all other samples was
clearly related to a different fingerprint, with a significantly
higher HNA cell percentage (80% instead of 34e39% in all other
samples; Fig. 7B and C). When the cell concentration stabi-
lized, some variation was still observed in %HNA (4% varia-
tion, Fig. 7B and D), showing the additional value of using the
Please cite this article in press as: Prest, E.I., et al., Monitoring mand reproducible flow cytometric method, Water Research (2013
combination of the two parameters. Both cell concentrations
and fingerprints indicate that water stagnation in the house-
hold induced changes in drinking water microbial character-
istics. The strong increase in cell concentration during
overnight stagnation suggests that the change is linked to
either bacterial regrowth or detachment of the biofilm
attached to the pipe walls at household level or both regrowth
and detachment.
3.3.4. (Re)growth of indigenous bacterial communitiesA (re)growth test was performedwith river water to determine
the effect of (re)growth on the FCM fingerprints. Fig. 8B shows
that the increase in total cell concentration over time corre-
lated with an increase in the HNA cell concentration. Com-
parison of the green fluorescence histograms obtained in time
(Fig. 8A) show a clear change in the HNA cell fraction through
the course of the experiment (Fig. 8B), while the LNA fraction
remained fairly stable.
4. Discussion
Flow cytometry (FCM) was proposed previously as an alter-
native tool to cultivation-dependent heterotrophic plate
counts (HPC) for monitoring of microbial drinking water
quality (Hoefel et al., 2003; Hammes et al., 2008; Vital et al.,
2012). In the present study, a FCM approach was developed
and evaluated with respect to the characterization of indige-
nous aquatic bacterial communities in real water samples and
the ability to detect changes in such communities that are
relevant for drinking water monitoring. The method, partially
based on the recently standardized Swiss guideline method
(SLMB, 2012), uses reproducible staining and analysis of bac-
teria with a common nucleic acid stain to obtain (i) the total
cell concentration and (ii) fluorescence intensity distribution
(or fluorescence fingerprint) of the water sample. A fast and
instrument-independent approach was proposed for
icrobiological changes in drinking water systems using a fast), http://dx.doi.org/10.1016/j.watres.2013.07.051

Fig. 6 e Detection of the mixing of two different drinking water samples by fluorescence distribution and total cell
concentration. (A) Direct comparison of the green fluorescence histograms of the mixed water samples in different
proportions (0, 40, 80 and 100% of drinking water type 1) show that the number of LNA cells increases when the proportion
of water type 1 increases. (B) Combined results of cell concentration and %HNA. Numbers next to the markers indicate the
percentage of water type 1. Error bars indicate errors on triplicate samples (n [ 3).
Fig. 7 e Drinking water tap flushing after overnight stagnation. Comparison of green fluorescence histograms of samples
taken at different time intervals: (A) directly after tap opening and after flushing of at least 1.5 L; (B) after flushing of 1.5, 90,
360 and 1080 L. Development with flushed water volume of (C) total cell concentration and (D) %HNA cells. Both cell
concentrations and fingerprints showed a distinct change in microbial water quality in the first 1.5 L after tap opening. Cell
concentration stabilization in time is shown in an oval in figure (C). The corresponding points are indicated in an oval in
figure D.
wat e r r e s e a r c h x x x ( 2 0 1 3 ) 1e1 28
Please cite this article in press as: Prest, E.I., et al., Monitoring microbiological changes in drinking water systems using a fastand reproducible flow cytometric method, Water Research (2013), http://dx.doi.org/10.1016/j.watres.2013.07.051

Fig. 8 e (Re)growth detection of indigenous bacteria in river water by fluorescence distribution and total cell concentration.
(A) Direct comparison of the green fluorescence histograms of samples taken at 0, 3, 6, 7 and 8 h from start of the experiment
showing an increase in HNA cells. (B) Combined results of cell concentration and %HNA. The dashed arrow direction
indicates increasing incubation time. Error bars indicate errors on triplicate samples.
wat e r r e s e a r c h x x x ( 2 0 1 3 ) 1e1 2 9
straightforward and quantitative comparison of the fluores-
cence fingerprints from different samples, based on the dif-
ferentiation between the low- and high nucleic acid (LNA and
HNA) content bacterial clusters (Fig. 1B; Fig. 4 and Figure S2 in
Supplementary Information). We demonstrated that when a
reproducible staining and analysis procedure is strictly fol-
lowed for all samples, the FCM method was highly repeatable
(Fig. 2), allowed discrimination between water samples from
different origins (Fig. 4, Figure S1 and S2 in Supplementary
Information) and enabled detection of small variations in
bacterial communities due to e.g. contamination (Fig. 5),
mixing of two drinking water types (Fig. 6) or (re)growth (Figs.
7 and 8).
4.1. Need for a reproducible staining and analysisprotocol
FCM total cell count (TCC) analysis is a relatively novel
method, used for diverse applications including analysis of
seawater (Gasol and Del Giorgio, 2000), wastewater (Gunther
et al., 2008; Muela et al., 2011) and drinking water (Hammes
et al., 2008). As a consequence, a range of different staining
protocols can be found in literature, using different stains,
stain concentrations, incubation times and incubation tem-
peratures (Gasol et al., 1999; Lebaron et al., 2001; Berney et al.,
2008; Hammes et al., 2012). Additionally, nearly no standard-
ized or controlled approach is usedwith respect to instrument
settings and data analysis (i.e. FCM gating strategies)
(Hammes and Egli, 2010). Nonetheless, it is logic that correct
comparison of samples requires reproduciblemethodology. In
this regard, an inter-laboratory ring trial showed that different
instrument brands and users deliver comparable results when
the same staining and measurement procedures were strictly
applied (SLMB, 2012). However, the importance of the repro-
ducibility of the staining protocol on a same instrument had
not been studied or demonstrated in detail until now. Our
study clearly showed that the staining procedure (staining
Please cite this article in press as: Prest, E.I., et al., Monitoring mand reproducible flow cytometric method, Water Research (2013
incubation time and temperature) is critical for both total cell
concentration measurements and fluorescence fingerprints
and that a clearly defined protocol, followed precisely, is
needed for a meaningful comparison of different water sam-
ples and for sensitive detection of changes in bacterial com-
munities (Figs. 2 and 3). A striking example is the incubation
temperature. We showed that particularly colder staining
temperatures adversely affect the staining reaction (Fig. 3),
supporting previous data in this regard (Hammes et al., 2012).
While fixing the staining temperature may appear extremely
logic, nearly all previously published studies described stain-
ing at either unstated temperatures (e.g. Gasol et al., 1999) or
at “room temperature” (e.g. Lebaron et al., 2001), which can be
a source of considerable variations between different seasons,
locations or times of the day. This effect is aggravated by the
fact that water samples are typically transported and stored at
<5 �C before measurement (Lebaron et al., 1998; Hoefel et al.,
2005; Berney et al., 2008). Staining the sample at room tem-
perature (c.a. 22 �C) directly following cold storage and
without pre-heatingwould result in a considerably colder, and
thus inaccurate, staining process (Fig. 3). The final staining
protocol in the present study comprises 5 min pre-incubation
(35 �C), followed by staining and a further 10 min incubation
(35 �C). The rationale behind these conditions was as follow:
The pre-incubation step warms the sample to the selected
staining temperature before the stain is added to ensure a
homogenous staining reaction. The pre-incubation time
(5 min) was selected based on the time it takes for 500 mL of
cold samples (5 �C) to reach 35 �C (data not shown), and should
be tested and adapted for larger sample volumes. The incu-
bation temperature was selected from specific experiments
(e.g. Fig. 3, present manuscript), previous data (Hammes et al.,
2012) and the Swiss guideline method (SLMB, 2012). The
rationale is that higher temperatures lead to improved stain-
ing, but too high temperatures should be avoided due to po-
tential cell damage. The stain incubation time (10 min) was
selected based on own experiments (e.g. Fig. 3) and previous
icrobiological changes in drinking water systems using a fast), http://dx.doi.org/10.1016/j.watres.2013.07.051

wat e r r e s e a r c h x x x ( 2 0 1 3 ) 1e1 210
studies (SLMB, 2012; Hammes et al., 2012), to ensure a stable
fluorescence pattern. However, it is important to note that the
purpose of the present study was not to optimize the TCC
staining protocol further with respect to incubation time and
temperature, as this was already done in a number of studies
and “optimal” staining conditions may arguably differ for
different microbial communities. Here we simply demon-
strate the critical importance of using the exact same staining
and analysis protocol for all samples in order to obtain a
sensible and correct comparison. This does not only affect
TCC quantification; a sensitive FCM fingerprinting approach
can only be reliable when it is coupled to a precise and
reproducible staining protocol.
4.2. The added value of fluorescence fingerprints
Bacterial cell concentration measurements with FCM were
previously shown to be sensitive, with a quantification limit as
low as 100e1000 cells mL�1 (Hammes et al., 2008, 2012).
However, the sensitivity of FCM to detect changes in cell
concentrations is not based on absolute values, but rather
relative to the initial cell concentration of the analyzed water.
The present study showed that a change in cell concentration
larger than 3%, thus slightly above than the average 95%
confidence interval, could be detected (Fig. 2; Fig. 5). However,
in field situations, changes in the microbial community might
occur without necessarily being reflected in the cell concen-
tration (e.g. community turnover resulting from continuous
attachment and detachment of cells from the pipe biofilm
during distribution of drinking water). It has been suggested
previously that such changes can be detected in the FCM
patterns (De Roy et al., 2012). Therefore, we introduced a
fingerprinting approach in order to gain complementary in-
formation to the cell concentration data. For the fingerprinting
approach, fluorescence distributionwas preferred to scattered
light parameters, based on a better differentiation between
signal and background in the case of small water bacteria
(Hammes and Egli, 2010; De Roy et al., 2012; Figure S3 in sup-
plementary information), and green fluorescence was
selected specifically, since it is detected closest to the SYBR
Green I emission maximum. The obtained fluorescence raw
data (e.g. Fig. 4A) show that even if differentwater samples are
normalized with respect to the cell concentrations, they often
demonstrate different fluorescence distributions, allowing
characterization and differentiation of samples using these
fingerprints. Figs. 5 to 8 demonstrate clearly that changes in
samples are also clearly reflected in the FCM fingerprints. It is
logic that the FCM fingerprints reflect microbial changes in
water samples: in the present study, the fingerprints were
based on the fluorescence intensity of individual cells, which
in turn relates to the concentration of SYBR Green I molecules
bound to nucleic acids in each cell. Hence, in case the staining
protocol allowed complete dye penetration into cells, the
fluorescence intensity should relate to the concentration of
DNA and RNA in cells. The latter is dependent on both the type
of bacteria as well as the physiological state of cells (Muller
et al., 2000; Gunther et al., 2008; Vila-Costa et al., 2012), and
the principle has been used in FCM analysis previously to
distinguish between cells with high and low nucleic acid
content (Lebaron et al., 1998; Wang et al., 2009; Vila-Costa
Please cite this article in press as: Prest, E.I., et al., Monitoring mand reproducible flow cytometric method, Water Research (2013
et al., 2012). Moreover, it has been shown that changes in
flow cytometric data often correspond to changes in the mi-
crobial community composition assessed with molecular
fingerprinting tools (De Roy et al., 2012; Lautenschlager et al.,
2013; Koch et al., 2013a,b).
4.3. A straightforward approach to quantify FCMfingerprints
As seen from Fig. 4, the fluorescence fingerprints of samples
contain information that is not necessarily easy to describe or
quantify, particularly when changes in samples are small
(Figs. 5 and 6). Previous approaches have used principle
component analysis or other statistical means to assess FCM
patterns (Pomati et al., 2011; Boddy et al., 2001; De Roy et al.,
2012), and recently Koch et al. (2013a,b) described an
advanced fingerprinting method for indigenous microbial
communities based on the combination of scatter and fluo-
rescence signals. While this type of approach can indeed
provide detailed information, it often requires complex addi-
tional data analysis steps that render the fingerprint infor-
mation difficult to use for practical applications (e.g. rapid
drinking water monitoring), or incompatible for comparison
when different instruments were used for data collection. We
attempted to quantify (but also simplify) the information from
the fluorescence distribution plots for easy, instrument-
independent comparisons of the data. For the latter we used
the differentiation between LNA and HNA bacterial commu-
nities in FCM plots, which was shown elsewhere, to render
reproducible data when different instruments and different
users were processing the same samples (SLMB, 2012). Dif-
ferentiation between LNA and HNA bacteria can also provide
additional information on samples. The almost systematic
presence of distinct LNA and HNA clusters was previously
observed during flow cytometric measurements in a wide
range of aquatic environments (Robertson and Button, 1989; Li
et al., 1995; Gasol et al., 1999; Lebaron et al., 2001; Wang et al.,
2009). LNA bacteria were first considered as being not active or
even dead (Lebaron et al., 2001, 2002; Phe et al., 2005), but were
shown thereafter to be viable and active in low nutrient
environment (Servais et al., 2003; Longnecker et al., 2005;
Bouvier et al., 2007; Wang et al., 2009). Several studies
showed that the HNA cluster ismore dynamic and sensitive to
changes than the LNA cluster. As an example, indigenous
HNA bacteria were damaged faster by chlorination (Ramseier
et al., 2011). It was also previously suggested that growth
(particularly in stagnating drinking water) might occur pref-
erentially in the HNA-fraction of the microbial community,
leading to changes in the LNA:HNA ratios (Lebaron et al., 2001;
Gasol et al., 1999; Lautenschlager et al, 2010; Vila-Costa et al.,
2012; Kotzsch and Egli, 2013). A comparison of several water
types showed that the position and the distribution of cells in
the LNA and HNA groups vary from sample to sample
(Figure S2 in Supplementary Information), but the separation
of the two clusters was always at a stable fluorescence in-
tensity (c.a. 2� 104 a.u. for our flow cytometer, Fig. 2). Based on
these observations, we chose the percentage of HNA cells as a
straightforward quantification of the FCM fingerprints, and
combined it with the total cell concentration, for rapid char-
acterization of water samples (e.g. Fig. 4B). Figs. 5 to 8 show
icrobiological changes in drinking water systems using a fast), http://dx.doi.org/10.1016/j.watres.2013.07.051

wat e r r e s e a r c h x x x ( 2 0 1 3 ) 1e1 2 11
that the description of the fingerprint information with only
the percentage of HNA cells enabled quantification of changes
in the fingerprints during batch growth of aquatic indigenous
communities and in stagnating drinking water, and related to
a change in community composition, due to either contami-
nation or mixing of two samples. The important aspect of the
fingerprinting strategy described herein is the use of repro-
ducible sample processing coupled with straightforward data
analysis with fixed gating positions, enabling fast and easy
data handling for in-practice applications such as drinking
water monitoring. The method presented herein should be
seen as a rapid screening tool for a fast identification of
changes in samples, and which can then be complimented by
advanced flow cytometric fingerprinting methods (Koch et al.,
2013a,b), or by more time consuming methods such as mo-
lecular community analysis (Pinto et al., 2012) or specific
pathogen/indicator screening.
4.4. Application value for drinking water utilities andlaboratories
The developed method is sensitive, rapid and easy and
therefore has potential to be used as a routine tool for moni-
toring the drinking water quality at the treatment outlet and
during distribution.
The implementation of a flow cytometric based total cell
count (TCC) method in the Swiss guidelines (SLMB, 2012) re-
flects the interest of the drinking water utilities and quality
controlling laboratories for accurate and reproducible alter-
native monitoring tools to conventional cultivation-based
methods. The combination of the cell concentration and the
FCM fingerprint information would allow a further step in the
sensitive detection of changes, for example during water
distribution. This approach has the potential to be used as
indicator for biological stability/activity in networks (Vital
et al., 2012). Moreover, the fast detection of change using
flow cytometry would enable a quick and targeted reaction in
case of dramatic events, e.g. contamination. A completely
automatized and standardized procedure is under develop-
ment by combining the staining and processing method with
on-line flow cytometers (Hammes et al., 2012). From a
research perspective, the method can be used for under-
standing biological processes in natural environment, e.g.
understanding the role that the two LNA and HNA commu-
nities play in natural environments. Based on fast detection of
change using flow cytometry, more elaborate and time
consuming methods (e.g. molecular techniques like 454-
pyrosequencing) could be used to further evaluate the
changes in bacterial populations.
5. Conclusions
� A reproducible bacterial staining method is required for
obtaining reliable and accurate flow cytometric results with
respect to total cell counts and fluorescence fingerprints.
� Such an approach allows sensitive and accurate (i) detection
of changes and (ii) characterization of bacterial commu-
nities in water systems.
Please cite this article in press as: Prest, E.I., et al., Monitoring mand reproducible flow cytometric method, Water Research (2013
� The proposed data handling strategy (quantification of
fluorescence fingerprints) is fast, simple and easy to stan-
dardize using fixed gating positions for low (LNA) and high
(HNA) nucleic acid containing bacterial communities and
the use of one parameter only (%HNA bacteria).
� Small changes in aquatic environments such as (re)growth,
contamination, stagnation andmixing of water types can be
detected with both cell concentrations and flow cytometric
fingerprints.
� Evidently, the flow cytometric method has considerable
application potential for bacterial water quality monitoring
and control and for early and on-line detection of changes
during e.g. water treatment and in drinking water distribu-
tion networks.
Acknowledgments
The authors like to thank Evides Waterbedrijf for the fruitful
discussions and their financial support, and Hansueli Wei-
lenmann for his technical support.
Appendix A. Supplementary data
Supplementary data related to this article can be found at
http://dx.doi.org/10.1016/j.watres.2013.07.051.
r e f e r e n c e s
Berney, M., Vital, M., Hulshoff, I., Weilenmann, H.U., Egli, T.,Hammes, F., 2008. Rapid, cultivation-independent assessmentof microbial viability in drinking water. Water Res. 42 (14),4010e4018.
Boddy, L., Wilkins, M.F., Morris, C.W., 2001. Pattern recognition inflow cytometry. Cytometry 44, 195e209.
Bouvier, T., Del Giorgio, P.A., Gasol, J.M., 2007. A comparativestudy of the cytometric characteristics of high and lownucleic-acid bacterioplankton cells from different aquaticecosystems. Environ. Microbiol. 9 (8), 2050e2066.
De Roy, K., Clement, L., Thas, O., Wang, Y., Boon, N., 2012. Flowcytometry for fast microbial community fingerprinting. WaterRes. 46 (3), 907e919.
Gasol, J.M., Del Giorgio, P.A., 2000. Using flow cytometry forcounting natural planktonic bacteria and understanding thestructure of planktonic bacterial communities. Sci. Mar. 64 (2),197e224.
Gasol, J.M., Zweifel, U.L., Peters, F., Fuhrman, J.A., Hagstrom, A.,1999. Significance of size andnucleic acid contentheterogeneityas measured by flow cytometry in natural planktonic bacteria.Appl. Environ. Microbiol. 65 (10), 4475e4483.
Gunther, S., Hubschmann, T., Rudolf, M., Eschenhagen, M.,Roske, I., Harms, H., Muller, S., 2008. Fixation procedures forflow cytometric analysis of environmental bacteria. J.Microbiol. Meth. 75 (1), 127e134.
Hammes, F., Broger, T., Weilenmann, H.U., Vital, M., Helbing, J.,Bosshart, U., Huber, P., Peter Odermatt, R., Sonnleitner, B.,2012. Development and laboratory-scale testing of a fullyautomated online flow cytometer for drinking water analysis.Cytometry A 81 (6), 508e516.
icrobiological changes in drinking water systems using a fast), http://dx.doi.org/10.1016/j.watres.2013.07.051

wat e r r e s e a r c h x x x ( 2 0 1 3 ) 1e1 212
Hammes, F., Berney, M., Egli, T., 2011. Cultivation-independentassessment of bacterial viability. Adv. Biochem. Eng.Biotechnol. 124, 123e150.
Hammes, F., Egli, T., 2010. Cytometric methods for measuringbacteria in water: advantages, pitfalls and applications. Anal.Bioanal. Chem. 397 (3), 1083e1095.
Hammes, F., Vital, M., Egli, T., 2010. Critical evaluation of thevolumetric "bottle effect" on microbial batch growth. Appl.Environ. Microbiol. 76 (4), 1278e1281.
Hammes, F., Berney, M., Wang, Y., Vital, M., Koster, O., Egli, T.,2008. Flow-cytometric total bacterial cell counts as adescriptive microbiological parameter for drinking watertreatment processes. Water Res. 42 (1e2), 269e277.
Hammes, F., Egli, T., 2005. New method for assimilable organiccarbon determination using flow-cytometric enumeration anda natural microbial consortium as inoculum. Environ. Sci.Technol. 39, 3289e3294.
Ho, L., Braun, K., Fabris, R., Hoefel, D., Morran, J., Monis, P.,Drikas, M., 2012. Comparison of drinking water treatmentprocess streams for optimal bacteriological water quality.Water Res. 46 (12), 3934e3942.
Hoefel, D., Monis, P.T., Grooby, W.L., Andrews, S., Saint, C.P., 2005.Profiling bacterial survival through a water treatment processand subsequent distribution system. J. Appl. Microbiol. 99 (1),175e186.
Hoefel, D., Grooby, W.L., Monis, P.T., Andrews, S., Saint, C.P., 2003.Enumeration of water-borne bacteria using viability assaysand flow cytometry: a comparison to culture-basedtechniques. J. Microbiol. Meth. 55 (3), 585e597.
Koch, C., Fetzer, I., Harms, H., Muller, S., 2013a. CHIC22Anautomated approach for the detection of dynamic variations incomplex microbial communities. Cytometry A 83 (6), 561e567.
Koch, C., Fetzer, I., Schmidt, T., Harms, H., Muller, S., 2013b.Monitoring functions in managed microbial systems bycytometric bar coding. Environ. Sci. Technol. 47 (3), 1753e1760.
Kotzsch, S., Egli, T., 2013. Kunststoffe in Kontakt mit Trinkwasser.Aqua Gas 44 (3), 44e52.
Lautenschlager, K., Hwang, C., Liu, W.-T., Boon, N., Koster, O.,Vrouwenvelder, H., Egli, T., Hammes, F., 2013. A microbiology-based multi-parametric approach towards assessingbiological stability in drinking water distribution networks.Water Res. 47 (9), 3015e3025.
Lautenschlager, K., Boon, N., Wang, Y., Egli, T., Hammes, F., 2010.Overnight stagnation of drinking water in household tapsinduces microbial growth and changes in communitycomposition. Water Res. 44 (17), 4868e4877.
Lebaron, P., Servais, P., Baudoux, A.C., Bourrain, M., Courties, C.,Parthuisot, N., 2002. Variations of bacterial-specific activitywith cell size and nucleic acid content assessed by flowcytometry. Aquat. Microb. Ecol. 28, 131e140.
Lebaron, P., Servais, P., Agogue, H., Courties, C., Joux, F., 2001. Doesthe high nucleic acid content of individual bacterial cells allowus to discriminate between active cells and inactive cells inaquatic systems? Appl. Environ. Microbiol. 67 (4), 1775e1782.
Lebaron, P., Parthuisot, N., Catala, P., 1998. Comparison of bluenucleic acid dyes for flow cytometric enumeration ofbacteria in aquatic systems. Appl. Environ. Microbiol. 65 (5),1725e1730.
Li, W.K.W., Jellett, J.F., Dickie, P.M., 1995. DNA distributions inplanktonic bacteria stained with TOTO or TO-PRO. Limnol.Oceanogr 40 (8), 1485e1495.
Longnecker, K., Sherr, B.F., Sherr, E.B., 2005. Activity andphylogenetic diversity of bacterial cells with high and lownucleic acid content and electron transport system activity inan upwelling ecosystem. Appl. Environ. Microbiol. 71 (12),7737e7749.
Muela, A., Orruno, M., Alonso, M.L., Pazos, M., Arana, I.,Alonso, R.M., Jimenez, R.M., Garaizabal, I., Maguregui, M.I.,
Please cite this article in press as: Prest, E.I., et al., Monitoring mand reproducible flow cytometric method, Water Research (2013
Barcina, I., 2011. Microbiological parameters as an additionaltool to improve wastewater treatment plant monitoring. Ecol.Indic. 11 (2), 431e437.
Muller, S., Ullrich, S., Losche, A., Loffhagen, N., Babel, W., 2000.Flowcytometric techniques to characterise physiological statesof Acinetobacter calcoaceticus. J. Microbiol. Meth. 40, 67e77.
Phe, M.H., Dossot, M., Guilloteau, H., Block, J.C., 2005. Nucleic acidfluorochromes and flow cytometry prove useful in assessingthe effect of chlorination on drinking water bacteria. WaterRes. 39 (15), 3618e3628.
Pinto, A.J., Xi, C., Raskin, L., 2012. Bacterial community structurein the drinking water microbiome is governed by filtrationprocesses. Environ. Sci. Technol. 46 (16), 8851e8859.
Pomati, F., Jokela, J., Simona, M., Veronesi, M., Ibelings, B.W.,2011. An automated platform for phytoplankton ecology andaquatic ecosystem monitoring. Environ. Sci. Technol. 45 (22),9658e9665.
Ramseier, M.K., von Gunten, U., Freihofer, P., Hammes, F., 2011.Kinetics of membrane damage to high (HNA) and low (LNA)nucleic acid bacterial clusters in drinking water by ozone,chlorine, chlorine dioxide, monochloramine, ferrate(VI), andpermanganate. Water Res. 45 (3), 1490e1500.
Robertson, B.R., Button, D.K., 1989. Characterizing aquaticbacteria according to population cell size, andapparent DNA content by flow cytometry. Cytometry 10,70e76.
Servais, P., Casamayor, E.O., Courties, C., Catala, P., Parthuisot, N.,Lebaron, P., 2003. Activity and diversity of bacterial cells withhigh and low nucleic acid content. Aquat. Microb. Ecol. 33,41e51.
SLMB, 2012. Determining the Total Cell Count and Ratios of Highand Low Nucleic Acid Content Cells in Freshwater Using FlowCytometry. Analysis Method 333.1, the Swiss Food Book.(Schweizerische Lebensmittelbuch). Federal Office of PublicHealth, Switzerland.
Veal, D.A., Deere, D., Ferrari, B., Piper, J., Attfield, P.V., 2000.Fluorescence staining and flow cytometry for monitoringmicrobial cells. J. Immunolog. Meth. 243, 191e210.
Vila-Costa, M., Gasol, J.M., Sharma, S., Moran, M.A., 2012.Community analysis of high- and low-nucleic acid-containing bacteria in NW Mediterranean coastal watersusing 16S rDNA pyrosequencing. Environ. Microbiol. 14 (6),1390e1402.
Vital, M., Dignum, M., Magic-Knezev, A., Ross, P., Rietveld, L.,Hammes, F., 2012. Flow cytometry and adenosine tri-phosphate analysis: alternative possibilities to evaluate majorbacteriological changes in drinking water treatment anddistribution systems. Water Res. 46 (15), 4665e4676.
Vital, M., Stucki, D., Egli, T., Hammes, F., 2010. Evaluating thegrowth potential of pathogenic bacteria in water. Appl.Environ. Microbiol. 76 (19), 6477e6484.
Vives-Rego, J., Lebaron, P., Nebe-von Caron, G., 2000. Current andfuture applications of flow cytometry in aquatic microbiology.FEMS Microbiol. Rev. 24, 429e448.
Wang, Y., Hammes, F., Boon, N., Chami, M., Egli, T., 2009. Isolationand characterization of low nucleic acid (LNA)-contentbacteria. ISME J. 3 (8), 889e902.
Wang, Y., Hammes, F., De Roy, K., Verstraete, W., Boon, N.,2010. Past, present and future applications of flowcytometry in aquatic microbiology. Trends Biotechnol. 28(8), 416e424.
Wang, Y., Hammes, F., Egli, T., 2008. The impact of industrial-scale cartridge filtration on the native microbial communitiesfrom groundwater. Water Res. 42 (16), 4319e4326.
Zipper, H., Brunner, H., Bernhagen, J., Vitzthum, F., 2004.Investigations on DNA intercalation and surface binding bySYBR Green I, its structure determination and methodologicalimplications. Nucleic Acids Res. 32 (12), e103.
icrobiological changes in drinking water systems using a fast), http://dx.doi.org/10.1016/j.watres.2013.07.051
Recommended


