
Faculdade de Engenharia da Universidade do Porto
Spotify-ed: Music Recommendationand Discovery in Spotify
José Lage Bateira
Mestrado Integrado em Engenharia Informática e Computação
Supervisor: Fabien Gouyon
Co-Supervisor: Matthew Davies
July 8, 2014


Spotify-ed: Music Recommendation and Discoveryin Spotify
José Lage Bateira
Mestrado Integrado em Engenharia Informática e Computação
Approved by Jury:
President: José Manuel Magalhães CruzReferee: Luis Gustavo Pereira Marques MartinsSupervisor: Fabien GouyonJuly 8, 2014


Abstract
Not so long ago, before the Internet boom, listening to or discovering new music wasa challenge on its own. Now, with a few clicks users, can have in their hands such a vastmusic catalogue that a human mind cannot compute it.
There are dozens of online services that offer exactly that. Some focus on creationand/or generation of playlists, others try to expand their music catalogue even further,or focus on a more personalized music recommendation. And these systems present theirresults to the user with a list or a grid of music artists, for example.
However, lists or grids do not give the user enough information about the relationbetween the results. A possible solution to this problem is to represent the artist’s similar-ities as a network of interconnected artists in a graph, where a node is a music artist, andeach edge between them represents a strong connection. This is the concept that RAMA(Relational Artist MAps), a project developed at INESC TEC, uses. From a single search,RAMA draws a graph that helps the user to explore new music that can catch his/herinterest in a much more natural way. When a user wants to listen to an artist’s music,Youtube’s stream is used. Although one can find a large catalogue of music in Youtube,this service is not music oriented and the sound quality is not adequate for a music stream-ing service. The use of Youtube stream for audio thus needs to be replaced, and Spotifycan provide a quality stream and an accurate music catalogue.
To address this question, this thesis proposes a Spotify App for RAMA. Will a Spotifyuser experience a more pleasant and natural way of music discovery from this graphicalrepresentation of artist relations within Spotify, than its standard discovery mode (withgrids)? This is the main question that this dissertation seeks to answer.
i

ii

Resumo
Bem longe vão os tempos, antes da Internet, em que ouvir e descobrir música nova eraum desafio por si só. Agora, com alguns cliques, temos acesso a um catálogo de músicatão grande, que o nosso cérebro não consegue processar.
Existem dezenas de serviços online que oferecem isso mesmo. Alguns especializam-sena criação e/ou geração de playlists (que funcionam como rádios), outros em expandir ocatálogo de música e outros focam-se mais na sugestão e recomendação de artistas/álbun-s/músicas personalizada para os utilizadores. Estes últimos, apresentam as sugestões deconteúdo ao utilizador de uma forma rudimentar como listas ou em grelha. No entanto,listas ou grelhas não fornecem ao utilizador qualquer tipo de informação adicional sobre arelação entre os artistas nem justificam a sua semelhança.
Essas relações existem e podem ser representadas como uma rede de artistas interligadosnum grafo, onde cada nó é um artista de música, e cada ligação entre nós representa umaligação forte de parecença entre os artistas. Este é o conceito que o RAMA (RelationalArtist MAps), projeto desenvolvido no INESC TEC, usa. A partir de uma pesquisa deum artista de música, o RAMA cria e desenha um grafo que ajuda o utilizador a explorarmúsica que lhe possa interessar de uma forma muito mais natural e informativa. Noentanto, quando um utilizador pretende ouvir uma música de um artista, é usado stream doYoutube. Apesar de este oferecer um catálogo alargado de música, o mesmo não é indicadopara esta funcionalidade pois não fornece uma API nativamente orientada a música, nema qualidade de som do stream é adequada.
A experiência musical do utilizador do RAMA poderá melhorar consideravelmente aocolmatar esta falha. Existe por isso uma necessidade de substituir o Youtube por outroserviço mais orientado a streaming de música de qualidade. O Spotify é um deles. ForneceAPI orientada a música, e o streaming é de qualidade adequada para este tipo de fun-cionalidade.
A escolha final foi desenvolver uma aplicação (como plugin) para o Spotify. Será que umutilizador Spotify ao descobrir música nova de uma forma mais gráfica terá uma experiênciade utilizador mais rica e natural do que o modo de descoberta standard do Spotify (emgrelha)?
Esse é o objetivo primordial desta dissertação: Tentar descobrir se utilizadores Spotifyterão uma experiência melhorada ao usar a Aplicação Spotify proposta.
iii

iv

Acknowledgements
First, I would like to thank my supervisors, Fabien Gouyon and Matthew Davies. Theirguidance, focus and leadership allowed me to follow the right path to complete this thesis.
Second, I want to thank all of the members of the SMC group at INESC TEC andFaculdade de Engenharia da Universidade do Porto, that helped me in any way. The warmwelcome to the group and their experience as researchers played an important role in thisproject. Special thanks to Marcelo and Mohamed for their patience with my writing skills.
Third, I would like to thank all of the people that helped me with the experiments.Their feedback was very insightful. They were a motivation for me to develop this project.
Forth, a huge thank you to all of my friends who stood by my side when I neededthem the most, with a special thanks to João, João, Artur and Sandra. They showed morepatience and love that a friend could ever ask for in these last few months.
I would also like to thank my beloved dog, Pipo. He showed compassion, patience andabove all, unconditional love towards a tired and ranty friend.
And finally, a heart-warming thank you to my family. Their patience, understanding,caring, compassion and most importantly, their love, allowed me to accomplish what Ithought was impossible a few months ago. I thank them from the bottom of my heart.
José Lage Bateira
v

vi

Contents
1 Introduction 11.1 Context . . . . . . . . . . . . . . . . . . . . . . . . . . . . . . . . . . . . . . 11.2 Motivation . . . . . . . . . . . . . . . . . . . . . . . . . . . . . . . . . . . . . 11.3 Goals . . . . . . . . . . . . . . . . . . . . . . . . . . . . . . . . . . . . . . . 21.4 Methodology . . . . . . . . . . . . . . . . . . . . . . . . . . . . . . . . . . . 21.5 Report Structure . . . . . . . . . . . . . . . . . . . . . . . . . . . . . . . . . 3
2 State of The Art 52.1 Introduction . . . . . . . . . . . . . . . . . . . . . . . . . . . . . . . . . . . . 52.2 Related and Similar Services . . . . . . . . . . . . . . . . . . . . . . . . . . . 5
2.2.1 Liveplasma - liveplasma.com . . . . . . . . . . . . . . . . . . . . . . 52.2.2 Tuneglue - audiomap.tuneglue.net . . . . . . . . . . . . . . . . . . . 72.2.3 MusicRoamer - musicroamer.com . . . . . . . . . . . . . . . . . . . . 8
2.3 Summary . . . . . . . . . . . . . . . . . . . . . . . . . . . . . . . . . . . . . 11
3 Spotify 133.1 Exploration of the Spotify Environment . . . . . . . . . . . . . . . . . . . . 14
3.1.1 Introducing Spotify . . . . . . . . . . . . . . . . . . . . . . . . . . . . 143.1.2 Development Tools . . . . . . . . . . . . . . . . . . . . . . . . . . . . 14
3.2 Experiments . . . . . . . . . . . . . . . . . . . . . . . . . . . . . . . . . . . . 203.3 Summary . . . . . . . . . . . . . . . . . . . . . . . . . . . . . . . . . . . . . 23
4 Implementation and Validation 254.1 Implementation . . . . . . . . . . . . . . . . . . . . . . . . . . . . . . . . . . 25
4.1.1 Technologies used . . . . . . . . . . . . . . . . . . . . . . . . . . . . . 254.1.2 Implemented Features . . . . . . . . . . . . . . . . . . . . . . . . . . 294.1.3 Development Processes . . . . . . . . . . . . . . . . . . . . . . . . . . 42
4.2 Validation . . . . . . . . . . . . . . . . . . . . . . . . . . . . . . . . . . . . . 434.2.1 User Tests . . . . . . . . . . . . . . . . . . . . . . . . . . . . . . . . . 434.2.2 Data Analysis . . . . . . . . . . . . . . . . . . . . . . . . . . . . . . . 434.2.3 Summary . . . . . . . . . . . . . . . . . . . . . . . . . . . . . . . . . 45
5 Conclusions 475.1 Summary . . . . . . . . . . . . . . . . . . . . . . . . . . . . . . . . . . . . . 475.2 Discussion . . . . . . . . . . . . . . . . . . . . . . . . . . . . . . . . . . . . . 475.3 Future Work . . . . . . . . . . . . . . . . . . . . . . . . . . . . . . . . . . . 48
vii
CONTENTS
A Appendix 53A.1 Demonstrations . . . . . . . . . . . . . . . . . . . . . . . . . . . . . . . . . . 53A.2 Questionnaire . . . . . . . . . . . . . . . . . . . . . . . . . . . . . . . . . . . 53
viii

List of Figures
2.1 liveplasma: search result for “Mariza”; upper left corner: artist albums; lowerleft corner: youtube’s mini-player . . . . . . . . . . . . . . . . . . . . . . . . 6
2.2 liveplasma: interface to start playing tracks. Similar button plays tracksfrom similar artists, whereas, the only button only plays tracks from thespecified artist. . . . . . . . . . . . . . . . . . . . . . . . . . . . . . . . . . . 6
2.3 Tuneglue: menu for the node. Appears when the user clicks on the node. . . 72.4 Tuneglue: graph after expanding the root node. . . . . . . . . . . . . . . . . 72.5 MusicRoamer: Search options. by artist; by keyword and by Last.fm username 82.6 MusicRoamer: Visual representation of the artist graph . . . . . . . . . . . 92.7 MusicRoamer: Personalizable parameters for the graph . . . . . . . . . . . 92.8 MusicRoamer: The graph after expanding one node . . . . . . . . . . . . . . 10
3.1 Spotify: desktop client’s discovery mode interface. . . . . . . . . . . . . . . . 153.2 Spotify: Last.fm’s Spotify Application opened. . . . . . . . . . . . . . . . . 163.3 Spotify: Play Button. . . . . . . . . . . . . . . . . . . . . . . . . . . . . . . . 173.4 Spotify: Follow Button Allows the user to follow the music artist. . . . . . . 173.5 Experiment with the Metadata API and the Play Button Widget (source
code: github.com/carsy/spotify-playground) . . . . . . . . . . . . . . . 213.6 RAMA’s website embedded into a Spotify Application. . . . . . . . . . . . . 223.7 Test result for the canvas element. . . . . . . . . . . . . . . . . . . . . . . . 22
4.1 Develop Tab . . . . . . . . . . . . . . . . . . . . . . . . . . . . . . . . . . . . 264.2 Webkit: Inspector tab view. Other tools available: Resources, Network,
Sources, Timeline, Profiles, Audits and Console. . . . . . . . . . . . . . . . 274.3 Webkit Network . . . . . . . . . . . . . . . . . . . . . . . . . . . . . . . . . 274.4 Webkit Profile: Canvas render functions are the ones taking up most of
the processing cycles. However there is a function call in JQuery that used12.72% of processing time, which might indicate a performance issue to beimproved. . . . . . . . . . . . . . . . . . . . . . . . . . . . . . . . . . . . . . 27
4.5 Webkit Audit: 96% of the CSS code is not being used, which indicates anissue to be solved. . . . . . . . . . . . . . . . . . . . . . . . . . . . . . . . . 28
4.6 Webkit Console: Javascript errors are reported there (and highlighted in redas well). . . . . . . . . . . . . . . . . . . . . . . . . . . . . . . . . . . . . . . 28
4.7 The first drawn graph uses the current playing artist (lower left corner) asthe root node. . . . . . . . . . . . . . . . . . . . . . . . . . . . . . . . . . . . 30
4.8 Graph created like a tree with “Red Hot Chilli Peppers” as the root node. . 324.9 Graph created with all the connections with “Red Hot Chilli Peppers” as
the root node. . . . . . . . . . . . . . . . . . . . . . . . . . . . . . . . . . . . 33
ix

LIST OF FIGURES
4.10 Graph created with all the connections with “Mariza” as the root node. . . . 344.11 The settings menu that allows the user to change the visualization parameters. 354.12 “Dispatch” artist node expanded. . . . . . . . . . . . . . . . . . . . . . . . . 374.13 Artist Menu with information about “Chris Cornell” . . . . . . . . . . . . . 384.14 Tags overlay for the displayed graph. When the tag “grunge” is selected the
corresponding artist nodes are selected . . . . . . . . . . . . . . . . . . . . . 394.15 Graph for “Anamanaguchi”. The tags shown above are only but a small
sample of all the tags of all the artists in the graph . . . . . . . . . . . . . . 404.16 Graph with depth value of 3 . . . . . . . . . . . . . . . . . . . . . . . . . . . 414.17 Graph showing the number of commits to the project from January to June,
2014. All of the development code was hosted at Github.com. Adapted fromhttps://github.com/carsy/rama-spotify/graphs/contributors . . . . . 42
A.1 Questionnaire that the beta-testers were required to fill after the experiment. 54
x

List of Tables
4.1 Results for question 1. . . . . . . . . . . . . . . . . . . . . . . . . . . . . . . 434.2 Results for question 3. . . . . . . . . . . . . . . . . . . . . . . . . . . . . . . 444.3 Results for question 4. . . . . . . . . . . . . . . . . . . . . . . . . . . . . . . 45
xi

Chapter 1
Introduction
1.1 Context
Not so long ago, before the Internet boom, listening to or discovering new music wasa challenge on its own. Now, with a few clicks, users can have in their hands such a vastmusic catalogue that a human mind is not able to compute.
There is an uncountable number of music streaming services that offer exactly that1.These services are, mostly, web based, although some offer desktop applications. Theyallow the users to play music, save their collection, create playlists and much more. Mostof these services also have social components that allow the users to share what they’relistening to with their friends, as well as playlists.
There is always something that makes a music streaming service different from theothers. Some services focus on creation and/or generation of playlists (8tracks [1]), otherstry to expand their music catalogue even further (Spotify [2], Rdio [3]), while others focusmore on personalized music recommendations (Pandora [4]). The latter ones, present theirmusic recommendations to the user with a list or a grid of music artists, for example.However, lists do not provide the user enough information about the relation between theresults [5].
A possible solution to this problem is to represent the artist’s similarities as a networkof interconnected artists in a graph, where a node is a music artist, and each edge betweenthem represents a connection. This is the concept that RAMA (Relational Artist MAps)2,a project developed at INESC TEC, uses [6] [7] [8] [9].
1.2 Motivation
From a single search, the original RAMA system draws a graph that helps the user toexplore new music that might catch his/her interest in a much more natural way. Whena user wants to listen to an artist’s music, Youtube’s stream is used. Although one canfind a large catalogue of music in Youtube, this service is not music oriented and thesound quality is not adequate for a music streaming service. Youtube’s stream needs tobe replaced. From the available services that provide a vast music catalogue, Spotify3
1Although some of them require the users to subscribe to a monthly fee, for example, in order to fullyuse the service, or remove the advertisements.
2RAMA: http://rama.inescporto.pt3http://spotify.com
1

Introduction
provides a good quality stream and a good developer support for creating Spotify-poweredApplications. But how can RAMA and Spotify be integrated?
1.3 Goals
There are several possibilities that Spotify has made available for developers4 that canhelp to improve RAMA’s concept. From websites, mobile applications, native applicationsand even plugins for the Spotify Desktop Client, Spotify’s API is very complete. Giventhe existence of some restrictions when using some APIs5, there are several aspects to takeinto account when choosing which API to use.
The initial proposal was to develop a software module that implements, at least, oneof the following features:
1. Integrate Spotify’s music stream into RAMA’s website
2. Integrate information from the Spotify user into RAMA
3. Improve RAMA’s features and design
4. Integrate the RAMA concept into a Spotify Application
5. Integrate RAMA’s playlist generation into a Spotify Application
6. Integrate some of the above mentioned modules into a Mobile Application
All possibilities will be explored with further detail in Chapter 3. In the end, thisdissertation proposes a Spotify Application [11] (module 4) that works like a plugin to theSpotify’s Desktop Client, i.e., it should add something to Spotify. This is a very appealingsolution: Spotify Users will have the chance to continue using Spotify as they wouldnormally do, but with an extra help to discover new music by using RAMA’s applicationinside Spotify. This method works on the assumption that Spotify’s music discovery modecan be improved using a visual tool like RAMA.
After specifying the requirements, a prototype will be developed. This approach re-quires a solution to the following question: Will a Spotify User experience a more pleasantand natural way of music discovery from this graphical representation of artist relationswithin Spotify, than its standard discovery mode? To answer that question and to eval-uate and validate the final prototype, end-user testing will be done to compare the userexperience of discovering new music with or without the developed application.
1.4 Methodology
The following work methods consist of four phases: initial research on the state of theart of the current applications that are similar to RAMA’s approach; contextualizationof the Spotify’s environment given the tools available for users and developers; definitionand implementation of the prototype’s user requirements and validation of the developedprototyped by users.
4https://developer.spotify.com5for example, LibspotifySDK [10] requires the developer and the user of the application to have a
premium account.
2

Introduction
The initial state of the art research was done to assess the main features of the musicservices that offer any sort of music discovery interface. There are an uncountable numberof them, and so, focus was given to the ones that use visual tools. Their main featureswere analysed, as well as their pros and cons.
Next, Spotify’s environment was introduced from the user’s perspective and the devel-oper’s perspective. At first, it was important to establish how a Spotify user goes aboutdiscovering new music, i.e., what tools are available. After that, the available tools fordevelopers of Spotify-powered applications were analysed in detail. The goal for the endof this phase was to determine the type of application to be developed as the prototype.
By this point the user requirements of the application were defined and implemented.The tools used in the prototype’s development were important to help automate most ofthe repetitive tasks: source code version management, testing, package managing, buildingand deploying. All of the development processes were important to keep a maintainabledevelopment environment. After each feature implementation, a small constant group ofalpha-testers gave feedback and suggestions to be introduced in the following version ofthe prototype - this was the main development cycle that continuously made the proto-type evolve into the defined user requirements. There were approximately eighteen cyclesthroughout the whole prototype development.
After the prototype implemented the defined user requirements, it was submitted foruser evaluation. The beta-testers were asked to discover new music with the developedapplication and then fill a short questionnaire that was meant to capture their first hands-on experience with the prototype. The results of the experiment were analysed to interpretthe success to the application in meeting its goals.
1.5 Report Structure
This thesis report presents 4 additional chapters:
Chapter 2: State of the ArtInitial research on the current state of the art. Detailed analysis on the services thatprovide a platform for users to listen to and discover new music. Although, thisthesis focus on the ones that use visual tools.
Chapter 3: SpotifyDetailed analysis of the Spotify environment from the users perspective (applicationsavailable, e.g.) and from the developers perspective (available APIs, e.g.) in order togive a much more insightful view when determining the feasibility of the prototype’srequirements.
Chapter 4: Implementation and ValidationDefinition and implementation of: the prototype’s main features/requirements; thedevelopment processes and the user validation processes.
Chapter 5: Discussion and Future WorkDiscussion of the results and definition of future work to be done in the prototype(improvements, features, etc).
3

Introduction
4

Chapter 2
State of The Art
2.1 Introduction
In this chapter, the most relevant web services for this thesis will be analysed. Theproposed methodology will focus on how the content is presented and less on what thecontent is (without discarding its importance). Even so, some projects that focus onthe content will be analysed. The presented projects often use external databases (likeLast.fm1) to fetch metadata from. This is the preferred way, since those are the mostcomplete sets of information.
2.2 Related and Similar Services
2.2.1 Liveplasma - liveplasma.com
liveplasma.com is a flash2 application that not only allows users to see a graph of musicartists, but also of books and movies. The interaction with the graph is very limited: nochanges to the graph are allowed, and the user can easily make a mistake and performunwanted actions like redrawing the graph with another artist as the root node.
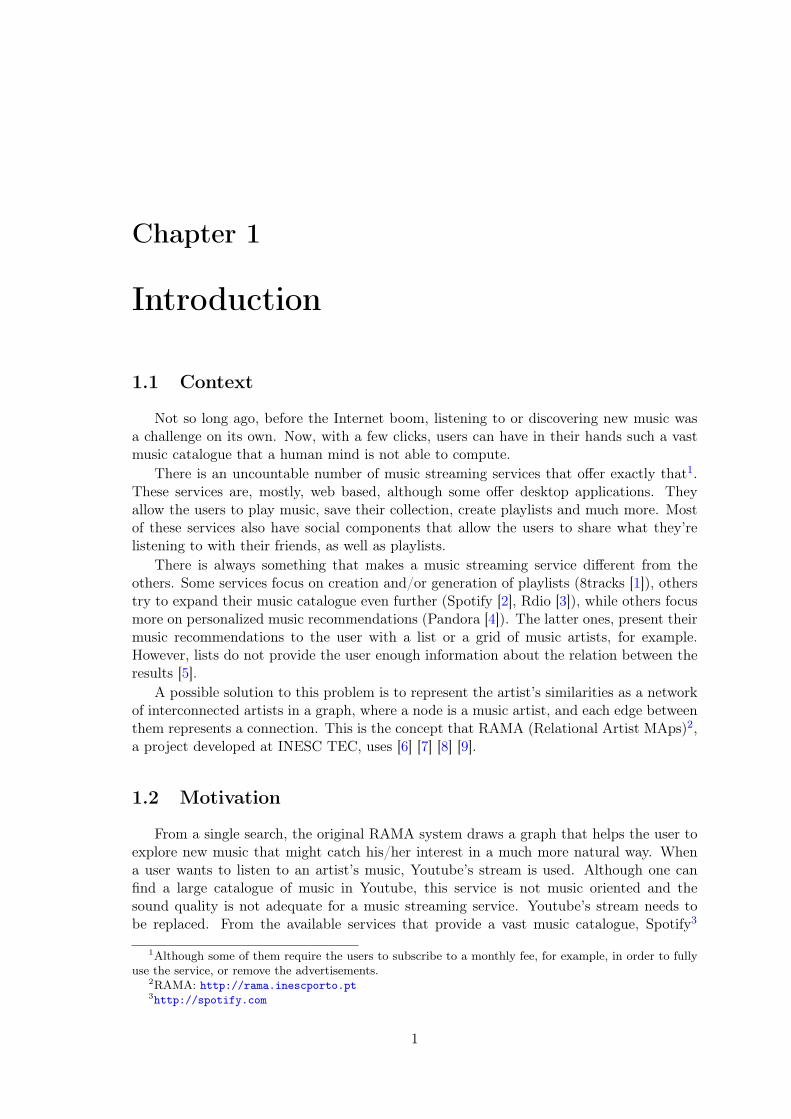
In Figure 2.1 one can see the search result for “Mariza”. On the left side of the ap-plication there are some interesting elements: a grid of the artist’s albums, a mini-player(stream from Youtube). In Figure 2.2 the user can have the choice to play tracks onlyfrom that artist, or play similar artists.
2.2.1.1 Pros
This tool has two interesting aspects to it:
• Links to buy albums of the artist
• Play tracks from similar artists to the search artist.
1Last.fm: http://last.fm/api2http://get.adobe.com/flashplayer
5
State of The Art
Figure 2.1: liveplasma: search result for “Mariza”; upper left corner: artist albums; lowerleft corner: youtube’s mini-player
2.2.1.2 Cons
The graph drawn from this simple search, is very cluttered with edges. Two nodes canhave several connections between them, which seems to overload the graph and making itvery confusing.
Different colours are used for the nodes and edges, but their meaning remains unknown.One can assume that they represent the similarity between artists, but that is just spec-ulation. It can also be assumed that the size of the nodes (radius value) can be directlyproportional to the artist’s popularity, but that is, again, just speculation.
One critical detail is that the user cannot visually point out the search node in thegraph, given the lack of visual distinction from the other nodes of the graph (Figure 2.1).
Figure 2.2: liveplasma: interface to start playing tracks. Similar button plays tracks fromsimilar artists, whereas, the only button only plays tracks from the specified artist.
6

State of The Art
2.2.1.3 Summary
In short, liveplasma is not very user friendly. It uses too many colours and edges, whichmakes the user experience of searching for new music even harder than it would be, if usinga more standard mode of discovery.
2.2.2 Tuneglue - audiomap.tuneglue.net
Tuneglue is another flash application that tries to explore the graphic visualization ofa network of related artists. Last.fm’s metadata API is used to retrieve artist information.When a user starts Tuneglue and searchs for an artist, say “Mariza”, they are presentedwith a single-node graph. By clicking the node, the user has four options (Figure 2.3):expand, releases, lock position and delete.
Figure 2.3: Tuneglue: menu for the node. Appears when the user clicks on the node.
When expanding a node, the user sees the root node with six child nodes in Figure 2.4.
Figure 2.4: Tuneglue: graph after expanding the root node.
So the first feature that brings the user experience to another level (in comparison withliveplasma) is that of graph editing. The user can expand, lock and delete every singlenode in the graph.
7

State of The Art
2.2.2.1 Pros
Tuneglue gives control to the user, who is able to craft a graph and tailor it to its needs.The user feels that the graph is its own creation.
2.2.2.2 Cons
However, the user has the responsibility to create the whole graph, which might be toomuch trouble and deteriorate the user experience. Again the root node is not highlighted,which might leave the user lost when the graph gets more and more complex.
2.2.2.3 Summary
Tuneglue takes the approach to give the user the power to create what he/she wants.But with no limit, the user can easily create a very complex graph that deteriorates theuser experience.
2.2.3 MusicRoamer - musicroamer.com
MusicRoamer is yet another flash application. Although it is similar to Tuneglue whenit allows the user to expand the graph further and further, it also imposes some limits tothe user to avoid making the graph too confusing.
2.2.3.1 Pros
There are three types of search (Figure 2.5):
Artist SearchThe most used one.
Keyword SearchSearch using keywords like genres and tags
Last.fm user searchThe search result generates several graphs with the top artists of the user as the rootnodes.
Figure 2.5: MusicRoamer: Search options. by artist; by keyword and by Last.fm username
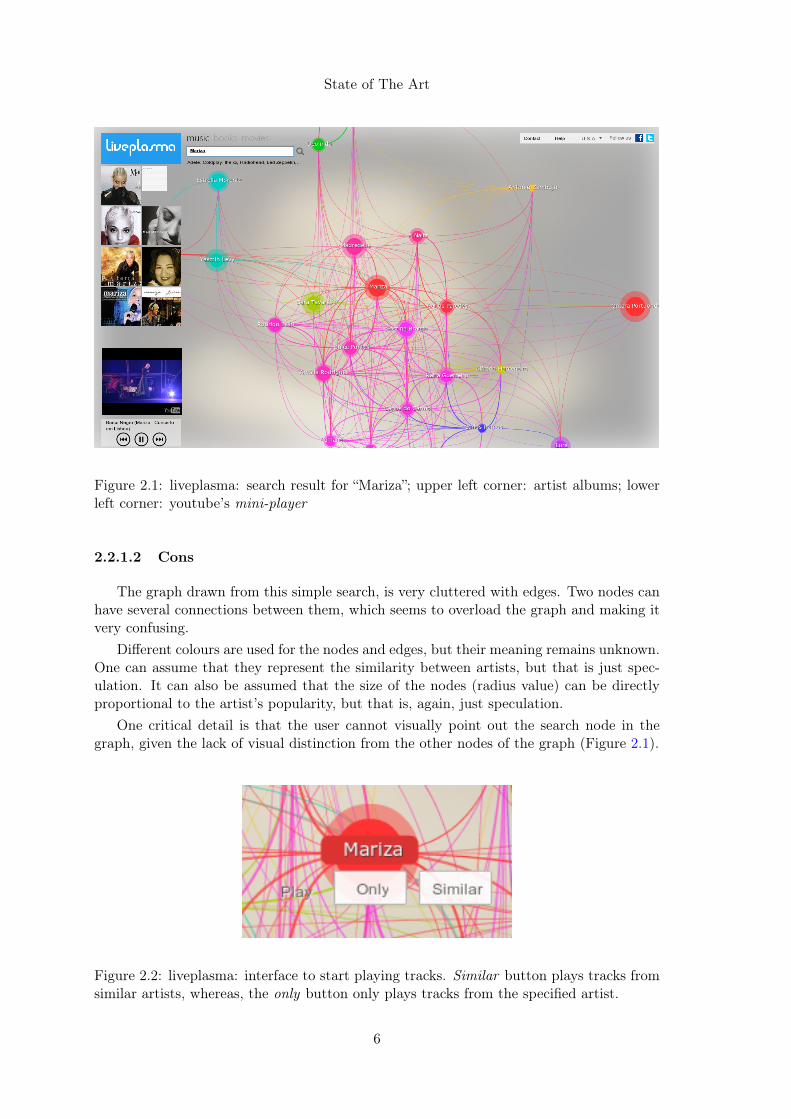
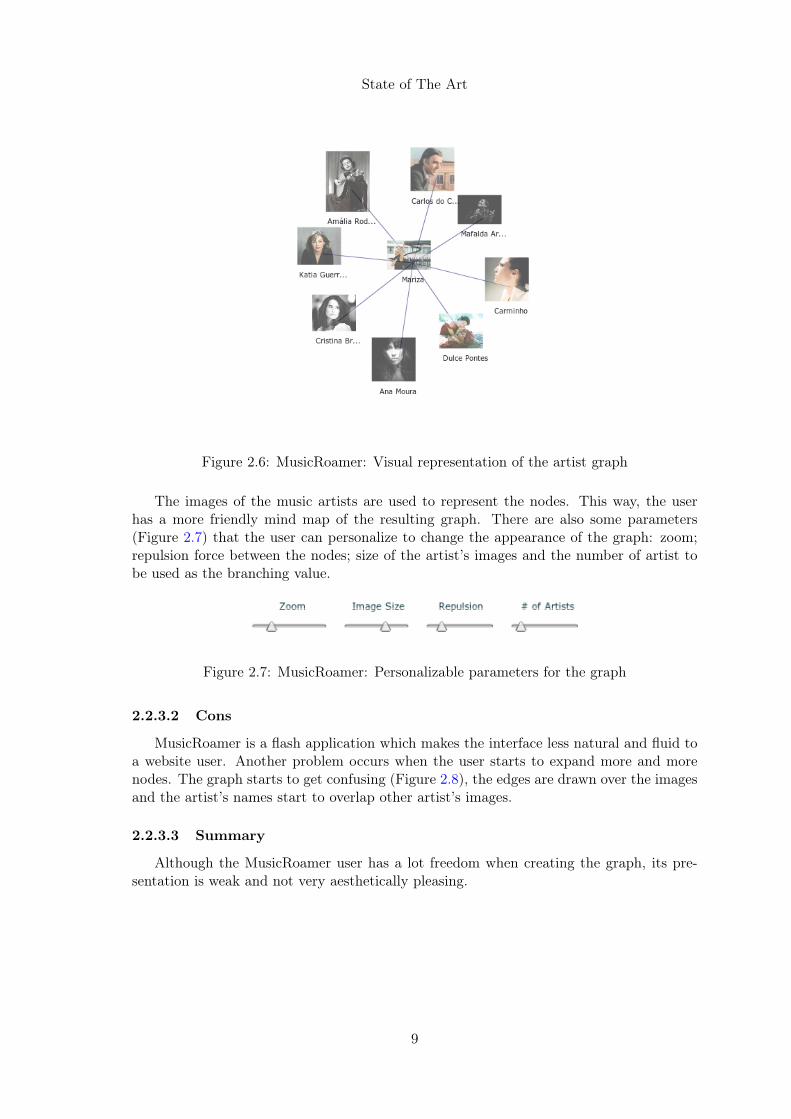
Independently of the search form used, the result will always be one (or more) graphswhere the nodes are music artists. MusicRoamer is worth mentioning because of the wayit shows the graph. In Figure 2.6 one can see the search result for “Mariza”.
8
State of The Art
Figure 2.6: MusicRoamer: Visual representation of the artist graph
The images of the music artists are used to represent the nodes. This way, the userhas a more friendly mind map of the resulting graph. There are also some parameters(Figure 2.7) that the user can personalize to change the appearance of the graph: zoom;repulsion force between the nodes; size of the artist’s images and the number of artist tobe used as the branching value.
Figure 2.7: MusicRoamer: Personalizable parameters for the graph
2.2.3.2 Cons
MusicRoamer is a flash application which makes the interface less natural and fluid toa website user. Another problem occurs when the user starts to expand more and morenodes. The graph starts to get confusing (Figure 2.8), the edges are drawn over the imagesand the artist’s names start to overlap other artist’s images.
2.2.3.3 Summary
Although the MusicRoamer user has a lot freedom when creating the graph, its pre-sentation is weak and not very aesthetically pleasing.
9

State of The Art
Figure 2.8: MusicRoamer: The graph after expanding one node
10

State of The Art
2.3 Summary
There are an uncountable number of services to discover new music. The ones presentedin the previous examples have a visual representation in graph. The following services havea somewhat interesting method to present the users with new music (not necessarily usingvisual tools):
• liveplasma.com
• audiomapa.tuneglue.net
• musicroamer.com
• discovr.info
• ifyoudig.net
• pitchfork.com
• hypem.com
• awdio.com
• 8tracks.com
• tastekid.com
• songza.com
• thesixtyone.com
• mog.com
• stereogum.com
• gigfi.com
• jango.com
• soundcloud.com
• grooveshark.com
• rdio.com
• pandora.com
• music.google.com
The most important aspect to retain from the previous examples is that the greaterthe visualization parameters (branching and depth) of the graph, the more confusing andcluttered the graph becomes. One could say that the visual tool loses its initial purpose tohelp the user to discover new music. A way to avoid that problem would be to force limitsin the graph creation process.
11

State of The Art
12

Chapter 3
Spotify
The primal objective of this dissertation, as mentioned in chapter 1, is to develop oneor more software modules that will improve Spotify users’ music discovery and recommen-dation experience, using visual tools to represent the relations among music artists andSpotify’s streaming service to provide high quality music stream.
The initial proposal was to develop a module that implements, at least, one of thefollowing features:
1. Integrate Spotify’s music stream into RAMA’s website
2. Integrate information from the Spotify user into RAMA
3. Improve RAMA’s features and design
4. Integrate the RAMA concept into a Spotify Application
5. Integrate RAMA’s playlist generation into a Spotify Application
6. Integrate some of the above mentioned modules into a Mobile Application
The first three functionalities (1, 2 and 3) focus on improving RAMA using Spotify’sAPI, i.e. to integrate Spotify into RAMA. Whereas 4 and 5 aim to integrate RAMA’sconcept into Spotify, through a Spotify Application (it would work as a plugin to Spotify’sDesktop Client). The last one (6) would focus on implementing the previous functionalitiesinto an Android, iOS or Windows Phone Application. The aim of this chapter is tocompare and contrast these proposed features, towards determining which among themwill be pursued in this thesis, either: Spotify Application, Mobile Application, or RAMAimprovements.
At first, Spotify’s user environment will be introduced (3.1.1), followed by Spotify’sDevelopment Tools (3.1.2) in order to assess which tools are available for developers. Next,the available tools will be evaluated, through experiments (3.2), in order to determine whichones fit the proposed modules better.
By the end of this chapter the modules developed should be clearly stated, as wellas which development tools will be used in the prototype. The prototype should pursuethe objective of contributing to an improved user experience of discovering new music bytaking advantage of visual tools that implement RAMA’s concept.
13

Spotify
3.1 Exploration of the Spotify Environment
3.1.1 Introducing Spotify
Spotify is a Music Streaming Service that allows the user, through an Internet connec-tion, to listen to any track (if available in the user’s country) in Spotify’s catalogue. Theservice was launched in 2008 with a native desktop client application. Now, the servicehas several types of clients available to the users: desktop client, webplayer and mobileapplications.
Desktop Client Desktop version of Spotify, with Windows and Mac versions (and alsoa Linux preview version).
Webplayer Web version of Spotify. This was released in 2013, although Spotify stilladvises the use of the native application for a better user experience.
Mobile Applications The mobile applications are available for Android and iOS devices.
3.1.2 Development Tools
Spotify provides a set of tools1 to develop Third-party Applications (websites, nativeapplications and mobile applications) and Spotify Applications (that run inside Spotify’sDesktop Client). There are five tools, each with different purposes.
3.1.2.1 Spotify Applications
Spotify Applications [11] are a special case in the whole set of tools provided by Spotify.These applications are designed to run inside the Desktop Client. Spotify users can runand install applications from the store called “App Finder”. All the applications are free.In Figure 3.1 one can see the interface of the desktop client. In this case, the discoverymode’s interface. On the left side, in the menu, bellow the “App Finder” item, appearsall the applications the user as installed from the store. In Figure 3.2 the official Last.fmapplication is opened. Note how the space filled by the applications is always the same.
The Applications’ runtime environment is one of a browser-based. More specifically,powered by the Chromium Embedded Framework [12]. This means that the code to developa Spotify Application follows the same principles as a web application: HTML, CSS andJavascript.
Spotify developed two Frameworks2 to help developers create these applications: theAPI 1.x Framework3 and the Views Framework4. The first one provides an interface touse object models, access metadata, control the player, among others. The second offerssupport for web components like buttons, lists, tabs, among others.
3.1.2.2 Spotify Widgets
Spotify Widgets [13] are small web components that can be embedded in externalwebsites. Spotify provides two components: Play Button (Figure 3.3) and a Follow Button(Figure 3.4)
1http://developer.spotify.com/technologies2https://developer.spotify.com/technologies/apps/reference3https://developer.spotify.com/docs/apps/api/1.0/4https://developer.spotify.com/docs/apps/views/1.0/
14

Spotify
Figure 3.1: Spotify: desktop client’s discovery mode interface.
15

Spotify
Figure 3.2: Spotify: Last.fm’s Spotify Application opened.
16

Spotify
Figure 3.3: Spotify: Play Button.
Figure 3.4: Spotify: Follow Button Allows the user to follow the music artist.
However, there are some limitations. In Spotify, only logged in users can use the service(listen to tracks, etc). This also applies to these widgets - even if they are in an externalapplication, only Spotify users can interact with them. This limitation does make sensein the case of the Follow Button, but the Play Button becomes useless to non-Spotifyusers. In truth, these widgets are nothing but a hyperlink to a Spotify Client (Web Playeror Desktop). With the Play Button, the stream of tracks always plays inside Spotify’senvironment, and not on external applications.
To embed a widget, it is only required to copy-paste Html code into the website, whereappropriate:
1 <iframe2 src="https: // embed.spotify.com /?
uri=spotify:track:1EsdqTsiQPaUJ82iy7KfS1"3 frameborder="0"4 width="300"5 height="380" >6 </iframe>
Listing 3.1: Html code to embed the Play Button
These widgets are useful to develop the proposed modules 1 and 3.
3.1.2.3 Libspotify SDK
Libspotify SDK [10] is an API that allows for third-party applications to include Spo-tify’s services into them. However, not without some limitations to the users of theseapplications. The users are limited depending on the type of Spotify Subscription thatthey have signed up to.
There are three different types of subscriptions [14], but the important part to retain,is the difference between being a Free Subscription Spotify User, and a Paid SubscriptionSpotify User (premium and unlimited subscriptions). As mentioned before, only Spotifyusers can interact with Spotify Widgets (Section 3.1.2.2). That also applies to third-partyapplications that are using Libspotify SDK, which allow, for example, the user to loginwith their Spotify account. But in this case, not only do they need to be Spotify users, theyalso need to have signed up to a paid Spotify subscription. And not only do the users need
17

Spotify
to pay to use the Spotify-powered application, but the developers as well. This is a veryrestrictive environment, although Libspotify SDK comes in many different flavours [15].
This tool would be used to develop modules 1, 2 and 6.
3.1.2.4 Metadata API
The Metadata API 5 [16] allows for applications to retrieve information from Spotify’smusic catalogue: tracks, albums, artists, playlists, and so on.
Requests to the database are done through HTTP and are of two types: search6 elookup7. To request detailed information of, e.g., an artist, the URI (used as the uniqueidentifier) of that artist is required. Such ID is of the form:
spotify:artist:<artist_id>, where artist_id is the unique identifier of the artist.Example:spotify:artist:65nZq8l5VZRG4X445F5kmN, is the ID for the artist “Mariza”.
There are also ID’s for albums:spotify:album:5d1LpIPmTTrvPltx26TlEU (album “Fado Tradicional” from “Mariza”)
and for tracks:spotify:track:2vqYasauhDLVjTt7CGWK6y (track “Fado Vianinha” of the previous al-
bum)
These URI schemes are compliant with Rosetta Stone’s ID spaces [17].First, to get this URI, one needs to search the database.
Search
The base URL:
http://ws.spotify.com/search/1/album, to search for albums.
For artists, artist, for tracks, track.
Examples:
http://ws.spotify.com/search/1/album?q=foohttp://ws.spotify.com/search/1/artist.json?q=red+hot
The request response, by default, is formatted in XML, although, as the secondexample demonstrates, JSON is also supported.
Given the following query:http://ws.spotify.com/search/1/artist.json?q=camane
The server responds with:1 {2 "info": {3 "num_results": 2,4 "limit": 100,
5This API was very recently deprecated (June, 2014) and was replaced by the Web API. It follows thesame principles of the previous one, and so, for the purposes of this report, the differences are not relevant.
6https://developer.spotify.com/technologies/web-api/search7https://developer.spotify.com/technologies/web-api/lookup
18

Spotify
5 "offset": 0,6 "query": "camane",7 "type": "artist",8 "page": 19 },
10 "artists": [11 {12 "href": "spotify:artist:3MLPFTe4BrpEV2eOVG0gLK",13 "name": "Camane",14 "popularity": "0.27"15 },16 {17 "href": "spotify:artist:5Gwulm1LfURW7dbZD1V3zX",18 "name": "Sergio Godinho/Camane/Carlos Do Carmo",19 "popularity": "0"20 }21 ]22 }
Listing 3.2: Results ordered by “popularity”
Lookup
When the URI is known, one can finally lookup detailed information about a databaseitem. With the following query:
http://ws.spotify.com/lookup/1/.json?uri=spotify:artist:3MLPFTe4BrpEV2eOVG0gLK&extras=album
The server responds with:
1 {2 "info": {3 "type": "artist"4 },5 "artist": {6 "href": "spotify:artist:3MLPFTe4BrpEV2eOVG0gLK",7 "name": "Camane",8 "albums": [{9 "album": {
10 "artist-id": "spotify:artist:3MLPFTe4BrpEV2eOVG0gLK",11 "name": "O Melhor 1995 -2013",12 "artist": "Camane",13 "href": "spotify:album:1YksI1vvItkdH95NBfjTvX",14 "availability": {15 "territories": "AD AR AT AU BE BG BO BR CA CH CL CO CR
CY CZ DE DK DO EC EE ES FI FR GB GR GT HK HN HR HUIE IS IT LI LT LU LV MC MT MX MY NI NL NO NZ PA PEPH PL PT PY RO SE SG SI SK SV TR TW UY"
16 }17 },18 "info": {19 "type": "album"20 }21 }, {22 "album": {23 "artist-id": "spotify:artist:3MLPFTe4BrpEV2eOVG0gLK",24 "name": "Do Amor E Dos Dias",25 "artist": "Camane",
19

Spotify
26 "href": "spotify:album:0N4aahnnaGZfLRFSQaqqUe",27 "availability": {28 "territories": "AD AR AT AU BE BG BO BR CA CH CL CO CR
CY CZ DE DK DO EC EE ES FI FR GB GR GT HK HN HR HUIE IS IT LI LT LU LV MC MT MX MY NI NL NO NZ PA PEPH PL PT PY RO SE SG SI SK SV TR TW UY"
29 }30 },31 "info": {32 "type": "album"33 }34 },3536 {37 ...38 }3940 ]41 }42 }
Listing 3.3: lookup of the artist “Camané”
This API is very useful for all the six proposed modules.
3.1.2.5 iOS SDK (beta)
The iOS SDK supports iOS Application developers. Although still in beta [18], thistool would be used to develop the proposed module 6. Much like the Libspotify SDK, thisSDK provides the following APIs:
• User authentication
• Audio playback and stream management
• Metadata (artist, album, track) lookup including artwork
• Playlist management
3.2 Experiments
As a first hands-on experience with these tools, a single-page website was developedwhich allows the users to search and listen to music using Spotify’s Metadata API andWidgets:
http://carsy.github.io/spotify-playground
In Figure 3.5 one can see a search result and the Widget Play Button with the selecteditem.
Both tools turned out to be well documented and easy to use.
20

Spotify
(a) Search result for “Mariza”
(b) After selecting the album “FadoTradicional” the Play button displaysall of the album’s tracks to be playedin sequence.
Figure 3.5: Experiment with the Metadata API and the Play Button Widget (source code:github.com/carsy/spotify-playground)
21

Spotify
Another experiment was made in order to assert the potential of Spotify Applications.There was a need to know if the canvas element was well supported by Spotify’s environ-ment, because that is the preferred way to graphically draw a graph. To test that, a simpleapplication was created with the following code:
1 <iframe src="http:// rama.inescporto.pt/app" frameborder="0">2 </iframe>
Listing 3.4: iframe element that allows to embed RAMA’s website into the application.
The final result can be seen in Figure 3.6.
Figure 3.6: RAMA’s website embedded into a Spotify Application.
Although the iframe and canvas elements are supported, there are some that are not.This specific application is not usable since, for example, playing tracks from externalsources is not allowed. Nonetheless, there is a way to test which HTML elements aresupported, using an internal Spotify application. In Figure 3.7 one can see the 100%supported canvas element.
Figure 3.7: Test result for the canvas element.
22

Spotify
3.3 Summary
Based on the analysis conducted, the most appropriate solution was to develop a SpotifyApplication. Although the other proposals were also feasible, the possibility to integrate aRAMA-like interface into Spotify’s Desktop Client leaves a Spotify user more at ease withthe environment. The prototype should then implement the proposed modules 4 and 5:
4. Integrate the RAMA concept into a Spotify Application
5. Integrate RAMA’s playlist generation into a Spotify Application
23

Spotify
24

Chapter 4
Implementation and Validation
In this chapter, further details about the prototype’s main features and the method-ologies used when developing the prototype, as well as in the validation process, will beexplored.
The Implementation section will go into details about the processes used to have amaintainable development environment by taking advantage of several tools that auto-mated most of the common tasks. The main implemented features will also be analysed.By this point, the validation of the prototype will be analysed, by explaining the performeduser tests, as well the analysis of the results.
4.1 Implementation
4.1.1 Technologies used
The following technologies were used during the development of the application.
4.1.1.1 Spotify Desktop Client
Spotify Applications are developed in its runtime environment: the Spotify DesktopClient. To open a Spotify Application, in the Desktop Client, one writes the following inthe search bar: spotify:app:rama, where rama is the application identifier declared in themanifest.json file1. Example:
1 {2 "AppName": {3 "en": "RAMA"4 },5 "BundleIdentifier": "rama",6 "AppDescription": {7 "en": "RAMA: Relational Artist MAps"8 },9 "BundleType": "Application",10 "BundleVersion": "1.0",11 "Dependencies": {12 "api": "1.0",13 "views": "1.0"
1file located at the root of the project folder
25
Implementation and Validation
14 },15 "SupportedDeviceClasses": ["Desktop"],16 "SupportedLanguages": [17 "en"18 ],19 "VendorIdentifier": "pt.inescporto"20 }
Listing 4.1: manifest.json: BundleIdentifier is the application’s identifier;Dependencies declares the Application’s API dependencies.
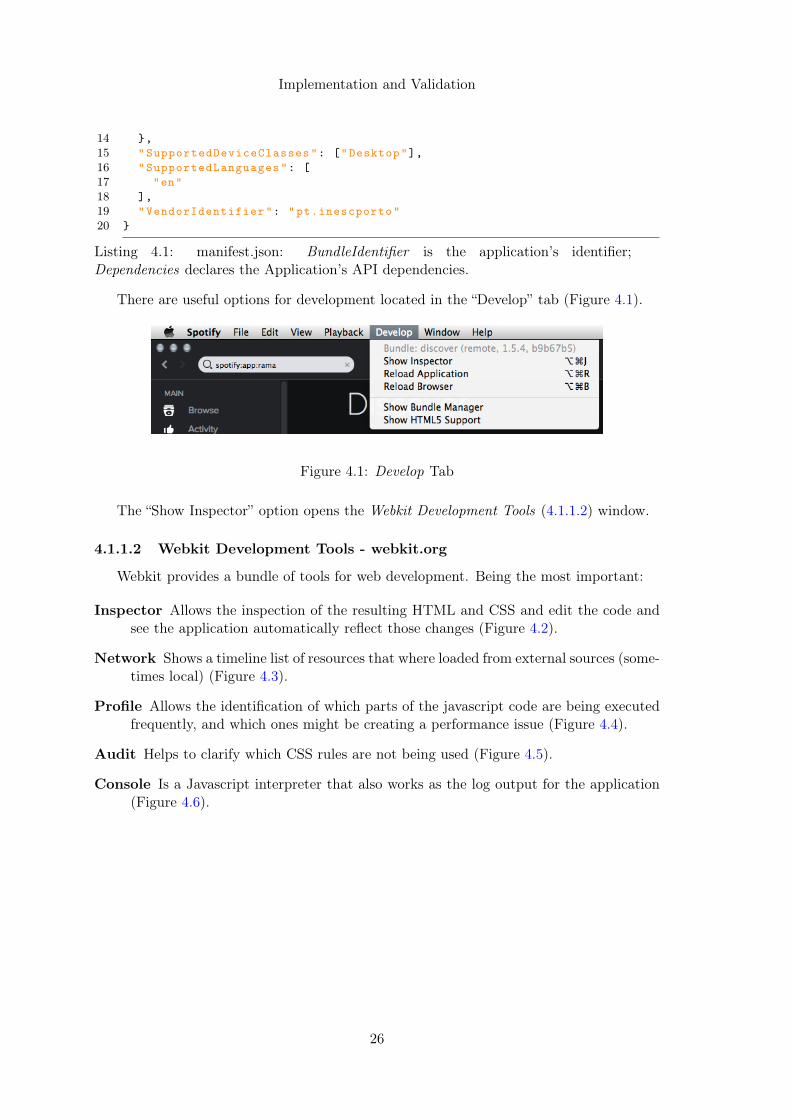
There are useful options for development located in the “Develop” tab (Figure 4.1).
Figure 4.1: Develop Tab
The “Show Inspector” option opens the Webkit Development Tools (4.1.1.2) window.
4.1.1.2 Webkit Development Tools - webkit.org
Webkit provides a bundle of tools for web development. Being the most important:
Inspector Allows the inspection of the resulting HTML and CSS and edit the code andsee the application automatically reflect those changes (Figure 4.2).
Network Shows a timeline list of resources that where loaded from external sources (some-times local) (Figure 4.3).
Profile Allows the identification of which parts of the javascript code are being executedfrequently, and which ones might be creating a performance issue (Figure 4.4).
Audit Helps to clarify which CSS rules are not being used (Figure 4.5).
Console Is a Javascript interpreter that also works as the log output for the application(Figure 4.6).
26

Implementation and Validation
Figure 4.2: Webkit: Inspector tab view. Other tools available: Resources, Network,Sources, Timeline, Profiles, Audits and Console.
Figure 4.3: Webkit Network
Figure 4.4: Webkit Profile: Canvas render functions are the ones taking up most of theprocessing cycles. However there is a function call in JQuery that used 12.72% of processingtime, which might indicate a performance issue to be improved.
27

Implementation and Validation
Figure 4.5: Webkit Audit: 96% of the CSS code is not being used, which indicates an issueto be solved.
Figure 4.6: Webkit Console: Javascript errors are reported there (and highlighted in redas well).
28
Implementation and Validation
4.1.1.3 vis.js - visjs.org
Vis.js is a javascript framework for visualization. It provides a few visual components,including graphs.
4.1.1.4 Git
The chosen version control system to manage the source code was Git2.Although not strictly followed, the model described in [19] was an inspiration. The use ofbranches [20] and tags [21] allowed for a manageable code development environment, e.g.,marking release commits or working on experimental features.
4.1.1.5 Gruntjs - gruntjs.com
Gruntjs is a Javascript task runner. It allows the automation of most of the repetitivetasks when developing a website. This is very useful for testing, compiling and optimizingcode.
4.1.1.6 Npmjs - npmjs.org
Npmjs is the package dependency manager for nodejs3 - Node Packaged Modules. Nodepackages will be used, since Gruntjs plugins are all nodejs packages (as well as Grunt itself).An npm configuration file (package.json) allows the identification of the packages that theapplication depends upon, as well as its versions. Example:1 {2 "name": "RAMA",3 "devDependencies": {4 "grunt": "~0.4.2",5 "grunt-contrib-jshint": "*",6 "grunt-contrib-jasmine": "*",7 "grunt-contrib-watch": "*"8 },9 "version": "0.1.0"10 }
Listing 4.2: package.json: "*" means that npm should always install the latest versionof that package.
Note that these software packages are for development only. They are not needed atall when running production code.
4.1.1.7 Bower - bower.io
Bower is also a package manager, but oriented for web front-end packages. It mainlysupports runtime software packages, which are needed for production code.
4.1.2 Implemented Features
The requirements for the prototype are as following:
• Representation of relations between artists by means of a visual tool;2Git: http://git-scm.com3nodejs: http://nodejs.org
29

Implementation and Validation
• Editing of the visualization using several parameters;
• Editing of the graph by allowing to remove and add new nodes;
• Visualizing the tags/genres (that describe an artist) in the graph representation.
All of these features were implemented.
4.1.2.1 Visualization of the Artists’ Map
The application automatically draws the map with the current playing artist as themain node, as seen in Figure 4.7.
Figure 4.7: The first drawn graph uses the current playing artist (lower left corner) as theroot node.
The graph-like structure is created by recursively fetching a list of related artists fromeach artist. Once a certain pre-established limit of recursive levels is reached4, the algo-rithm stops. The graph creation algorithm is as follows:1 // starting point for building the graph2 function buildGraph () {3 // create a node with the root artist and insert it into the graph
4depth value of a graph
30

Implementation and Validation
4 this.insertNode(this.rootArtist);56 // start constructing the graph recursively7 this.expandNode(8 this.depth - 1,9 this.rootArtist10 );11 }121314 // Expands the node of the parent artist by this.branching.15 function expandNode(depth , parentArtist) {16 var node = this.getNode(parentArtist);1718 // after expanding , the node will stop being a leaf19 node.isLeaf = false;2021 // retrieve this.branching number of childs of the parent artist22 var relatedArtists = parentArtist.getRelatedArtists(this.branching);2324 // and do the recursive call for the child , but with decreased depth.25 for (var childArtist in relatedArtists) {26 // create the child node and insert it into the graph27 this.insertNode(childArtist);2829 // recursive call for the child with decreased depth30 if (depth > 0)31 expandNode(depth - 1, childArtist);32 // note that the stop condition of the recursion is depth <= 033 }34 }
Listing 4.3: Simplified graph creation algorithm in Javascript (duplicate nodeschecking is encapsulated in the insertNode function)
The maximum number of nodes that the graph might have, can be calculated as follows:
d∑i=0
bi (4.1)
Where d is the depth value and b is the branching value of the graph.
This algorithm, albeit simplified, represents the basic flow when constructing a graph,or more specifically, a tree. Since, in this case of study, the direction of the edges of thegraph is not relevant in any way to the artists’ map, all of the edges are considered to beundirected.
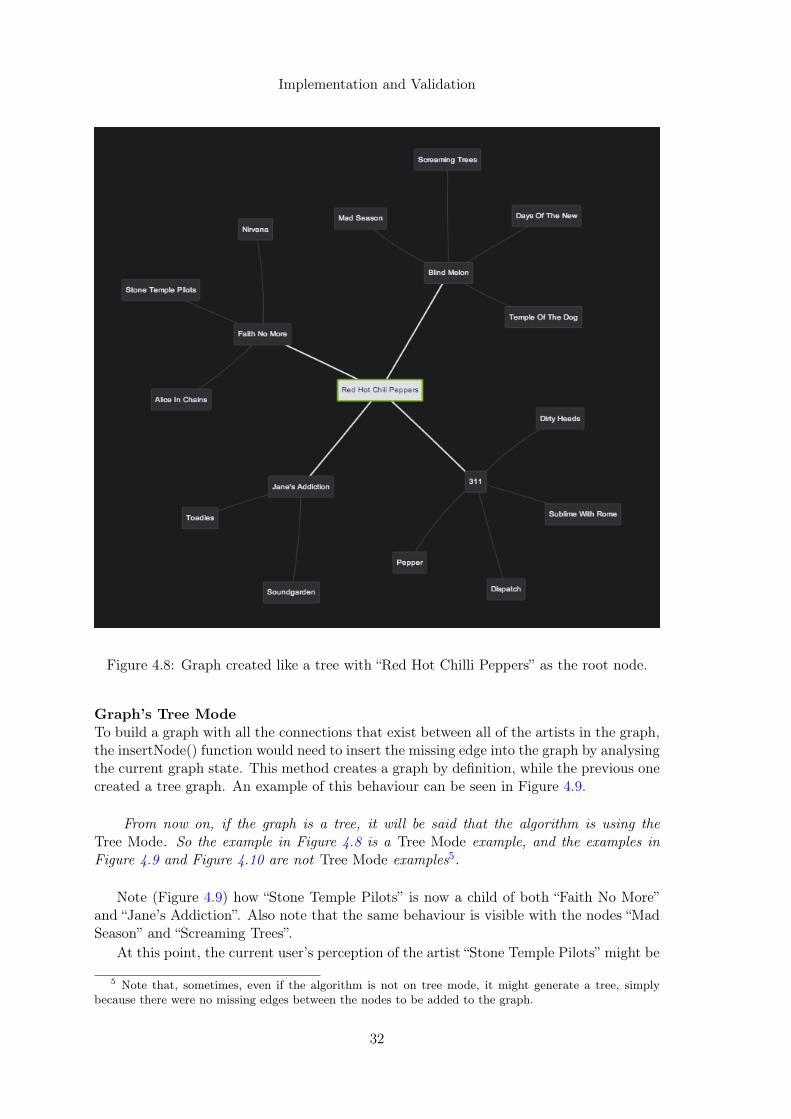
Assuming that the insertNode() function checks for duplicate nodes, i.e., it only insertsunique nodes into the graph, then the resulting graph is one of a tree, since there are nosimple cycles in the graph. An example of this behaviour can be seen in Figure 4.8.
This approach, however, is not showing all of the available information. Given thissame example (Figure 4.8), the artist node “Stone Temple Pilots” is a child of the nodeartist “Faith No More” The algorithm inserted the latter into the graph first. After that,when retrieving the childs of “Jane’s Addiction”, the artist node “Stone Temple Pilots”is contained in that list, and so the insertNode() function discards the node since it is aduplicate.
31
Implementation and Validation
Figure 4.8: Graph created like a tree with “Red Hot Chilli Peppers” as the root node.
Graph’s Tree ModeTo build a graph with all the connections that exist between all of the artists in the graph,the insertNode() function would need to insert the missing edge into the graph by analysingthe current graph state. This method creates a graph by definition, while the previous onecreated a tree graph. An example of this behaviour can be seen in Figure 4.9.
From now on, if the graph is a tree, it will be said that the algorithm is using theTree Mode. So the example in Figure 4.8 is a Tree Mode example, and the examples inFigure 4.9 and Figure 4.10 are not Tree Mode examples5.
Note (Figure 4.9) how “Stone Temple Pilots” is now a child of both “Faith No More”and “Jane’s Addiction”. Also note that the same behaviour is visible with the nodes “MadSeason” and “Screaming Trees”.
At this point, the current user’s perception of the artist “Stone Temple Pilots” might be
5 Note that, sometimes, even if the algorithm is not on tree mode, it might generate a tree, simplybecause there were no missing edges between the nodes to be added to the graph.
32

Implementation and Validation
Figure 4.9: Graph created with all the connections with “Red Hot Chilli Peppers” as theroot node.
different from the previous example (Figure 4.8). These added connections are, in a way,clustering together the most connected nodes. In this particular example, one could see animprovement with this approach: it contributes to the user’s understanding of the artist’snetwork by making sure the user knows that those specific artists are more connectedbetween them, than any others. Since only three extra edges where added, this meansthere is not much visual clutter in the visualization. However, that might not always bethe case.
One could argue that the “Mad Season” artist node is already disturbing the visual rep-resentation by being drawn over an edge. In fact, with the exact same values of branching,depth and tree mode off, when creating a graph for the artist “Mariza”, the visual clutteris so strong that the graph becomes confusing and not very helpful: Figure 4.10.
The cluster of nodes in the center makes it clear that those specific nodes are reallyconnected between them. But then, the edges, that are forcing those nodes together, arecreating a visual clutter that might not be desirable. Instead of creating a visual map of theartists’ network for the user to explore and change in his/her own way, the representation
33

Implementation and Validation
Figure 4.10: Graph created with all the connections with “Mariza” as the root node.
is more contained, static and not so visually appealing.
So, on the one hand, the clustering of the nodes seems like an interesting feature.It allows for a more complete understand of the underlying information of the relatedartists. But on the other hand, the focus of the visualization (to show a map of the artists’network) is shifting to this cluster-like representation. Both perspectives are advantageousdepending on the data they are operating on (as seen in the previous examples). So insteadof choosing only one method, both were chosen: by default, the graph creation algorithmis on tree mode, and the user can turn it off from a settings menu. This allows for the userto choose the visual representation method that suits his/her needs.
Depth and Branching valuesThe depth and branching values have been mentioned before in this chapter, but not yetfully explained.
The depth value of a graph determines how deep the recursive algorithm is. The pre-viously presented example (Figure 4.8) has a depth value of 2. The example in Figure 4.16has a depth value of 3. In short, depth is the maximum distance between the root nodeand any other node in the graph.
The branching value of a tree graph determines the maximum number of child nodesa node can have. The example in Figure 4.8 has a branching value equal to 4.
4.1.2.2 Visualization Parameters
The visualization parameters are the branching and depth values, as well as the optionto enable/disable the tree mode. To allow the user to change these values, a settings menu
34

Implementation and Validation
was added to the application, and can be seen in Figure 4.11. When the user changes theparameters, the graph refreshes accordingly.
Figure 4.11: The settings menu that allows the user to change the visualization parameters.
4.1.2.3 Graph Edition
The available features to edit the graph are as follow: expand node, delete node andcreate a new map. These interactions are available in the Artist Menu (4.1.2.4).
Expand nodeThis option allows the user to expand a node further (ignoring the graph’s branchingvalue). Given the previous example in Figure 4.8, if the “Dispatch” node gets expanded, itresults in Figure 4.12. To put it simply, to expand a node, one performs one iteration ofthe graph creation algorithm.
Delete nodeThis option allows the user to delete a node from the graph. This is useful for when theuser wants to construct the graph to his/her needs.
New mapThe user may choose to create a whole new graph from a another node. This way the rootnode will be the selected node.
4.1.2.4 Artist Menu
The user is able to see additional information about artists in the Artist Menu (Fig-ure 4.13) such as its popularity value, albums and tags, as well as perform the expand andnew map functions described in 4.1.2.3. When the user selects a node by clicking on it,the artist menu updates the displayed information.
The popularity, the albums and the tags are metadata information retrieved from Spo-tify’s API framework (3.1.2.1), although Echonest’s API6 is also used as a fallback sourcefor the tags (sometimes Spotify’s API responds with a small number of results).
Echonest’s TermsEchonest’s tags are very similar to the most commonly known music genres (like jazz,country, rock), but they also might include more alternative descriptive terms (progressivemetal, symphonic, soundtrack).
6Echonest’s API: http://developer.echonest.com/docs/v4
35

Implementation and Validation
The connection between the two APIs is possible thanks to the Project Rosetta Stone [17].For example, to retrieve the terms7 of an artist from Echonest’s metadata API using theSpotify’s Artist ID, the following query is used:
http://developer.echonest.com/api/v4/artist/terms?api_key=API_KEY&format=json&sort=weight&id=spotify-WW:artist:65nZq8l5VZRG4X445F5kmN
The id parameter is similar to the Spotify’s URI scheme (3.1.2.4), and this allows forretrieving extra information about the artist that Spotify’s API does not provide.
Sort is another interesting parameter. In general, artists have more than 10 or 15terms. Each term has a value of frequency and a value of weight, and both are float valuesthat range between zero and one. No official documentation was found to explain whatthese values represent, but Paul Lamere8 explains [22] that:
“term frequency is directly proportional to how often that term is used to de-scribe that artist”
“term weight is a measure of how important that term is in describing theartist”
So given this, one can conclude that by sorting the terms of an artist by its frequencyvalue, the top terms will be more general (rock, pop, jazz) and not very descriptive orspecific of an artist. And by sorting the tags by weight, one will get the most descriptivetags of that specific artist. Clearly, in this case, for the Artist Menu the weight parameter isvery helpful, and so, the sort parameter used for the query is weight. As seen in Figure 4.13,the tags shown are very descriptive of the artist (grunge, 80s, hard rock).
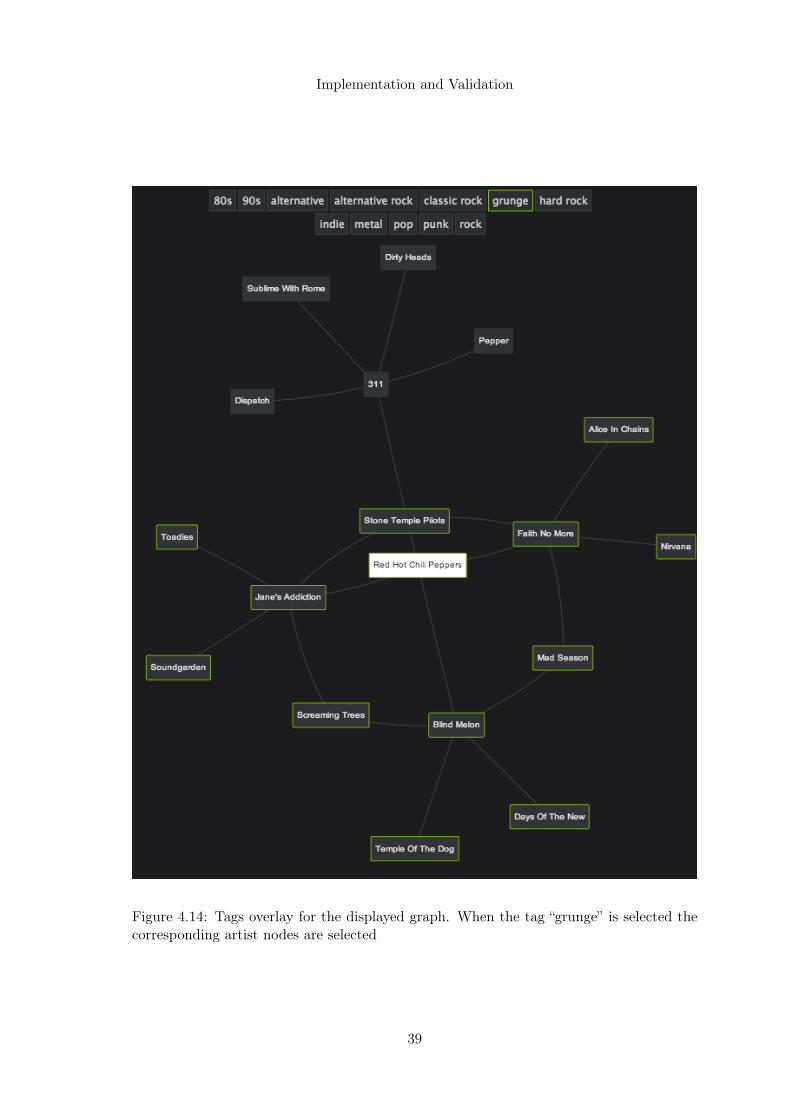
4.1.2.5 Tags Overlay
The tags overlay menu (Figure 4.14) is meant to enhance the user’s understanding onthe displayed artists’ nodes regarding their tags. These tags are the same ones used in theArtist Menu (Figure 4.13). They are selectable, and so, when clicked, the respective artistnodes that are described by those tags, are highlighted (as seen in Figure 4.14).
The tags shown in this menu, are just a small sample of the artists’ tags of the wholegraph. For example, for the graph in the Figure 4.15, the total count of unique tags inthe whole graph is 93. To select which tags to show, those same 93 tags were sorted byfrequency in the graph, and then the top 12 ones are shown.
This way, the tags in the overlay are significant for the graph, by helping the user tovisually group together some related artists.
7Echonest calls it terms. From now on, terms and tags will be used interchangeably8Paul Lamere is Director of Developer Platform at the.echonest.com (http://the.echonest.com/
company). He also blogs here: http://musicmachinery.com
36

Implementation and Validation
Figure 4.12: “Dispatch” artist node expanded.
37

Implementation and Validation
Figure 4.13: Artist Menu with information about “Chris Cornell”
38
Implementation and Validation
Figure 4.14: Tags overlay for the displayed graph. When the tag “grunge” is selected thecorresponding artist nodes are selected
39

Implementation and Validation
Figure 4.15: Graph for “Anamanaguchi”. The tags shown above are only but a smallsample of all the tags of all the artists in the graph
40

Implementation and Validation
Figure 4.16: Graph with depth value of 3
41

Implementation and Validation
4.1.3 Development Processes
The main objectives for the RAMA Spotify Application were to implement the basicfunctionalities that RAMA’s website [23] offers. Incrementally, they were implemented,tested and added to the application. A timeline (chronological order from bottom to top)with the added features (each update release) can be seen in
https://github.com/carsy/rama-spotify/releases
An overview of pushed commits can be viewed in Figure 4.17.
February March April May June
10
20
30
Figure 4.17: Graph showing the number of commits to the project from January to June,2014. All of the development code was hosted at Github.com. Adapted from https://github.com/carsy/rama-spotify/graphs/contributors
Unit tests were added for each feature. The tests were run locally to ensure that previ-ous features were still working during development. Also to ensure that every release hadthe tests passing, the project was integrated in Travis’s Continuous Integration9 system:
http://travis-ci.org/carsy/rama-spotify.This way, after every push of a new release, the project gets built and the unit tests
run automatically.
The solution was also submitted to validation several times during its development.After each release, a constant small group of alpha-testers (3 people) reviewed the stateof the application. Their feedback would be carried over to the next release: bug fixes,improvements, etc. This was the testing cycle that allowed to validate the implementedfeatures. To help with this iterative process the issue tracking system of Github10 wasused: https://github.com/carsy/rama-spotify/issues. Given this iterative process ofimplementation and feedback, the solution would be better prepared for future beta-testing.
9Travis: http://travis-ci.org10Github: http://github.com
42

Implementation and Validation
4.2 Validation
In order to validate the proposed method, user tests were done with regular Spotifyusers and non-Spotify users. They represent the second group of testers and will be referredas the beta-testers.
4.2.1 User Tests
The proposed application is targeted at Spotify users. However, non-Spotify users alsotested RAMA’s Spotify Application after a few moments of using Spotify’s Desktop Client.During the test, the user was asked to first use Spotify only. The task was to find a coupleof new artists that the user liked. This first task should take no more than a few minutes,depending on the user. The next task was to open the RAMA application and do the same(again this should be completed in a short period of time). Given this, the user is forcedto compare the two approaches: discovering new music with Spotify only, and discoveringnew music with RAMA’s Spotify Application.
The objectives of the experiment were to assess some aspects of the application:
User Experience Was the user able to discover new music easily?
Interface’s intuitiveness/design Were all of the application’s components (buttons,controls, etc) easy to use and well placed?
After the test, the user filled a short questionnaire (Figure A.1) about the experiment,which contained the following questions:
1. Are you a Spotify user?
2. Did the RAMA application help you discover new interesting artists?
3. Do you think you would use the application to discover new music?
4. Was the application well integrated with Spotify?
In the end, the user was encouraged to leave suggestions, feedback or comments aboutthe application.
4.2.2 Data Analysis
A total of 24 beta-testers participated in the experiment.
4.2.2.1 Question 1: Are you a Spotify user?
This question was meant to establish the user’s experience with Spotify. The resultscan be seen in Table 4.1.
Answer Nº of responsesYes, I use it as my main way to listen to music 7Yes, I use it from time to time 5No, but I have used/tried it at least once 5No, this is my first time using it 7
Table 4.1: Results for question 1.
43

Implementation and Validation
This test group is relatively well distributed with 12 Spotify users, and 12 non-Spotifyusers.
This information is very important to better understand the user’s suggestions thatmay or may not be related to basic Spotify interactions. For example, when a user wantsto start a new map with an artist that is not at the moment visible, there two possibilitiesto do this. By searching for the new artist, the user can then drag and drop the artist intothe application in the left side menu, or start playing a song from that artist, and then goback to RAMA and click the new map button in the artist menu.
Both ways require the user to search a new artist using Spotify’s search bar. To regularSpotify users this is a recurrent procedure, but for new Spotify users, it might confusethem to go out of RAMA’s application to fetch information.
4.2.2.2 Question 2: Did the RAMA application help you discover new inter-esting artists?
This was a yes or no question: 23 responded “yes”, whereas, 1 responded “no”. It is clearthat RAMA’s Spotify Application fulfilled the initial purpose of letting the user discovernew music.
Most of the users did not discover new artists before using the expand button or thenew map button. The users launched RAMA when listening to a known artist and thismeant that, for the most cases, the user already knew most of the similar artists thatappeared in the graph. Only when the user started to use these action buttons and foundout how to progress in discovering new music, he/she started to get excited to see whatnew artists were coming.
4.2.2.3 Question 3: Do you think you would use the application to discovernew music?
This is the principal question used to determine if users felt that RAMA was a usableway of discovering new music within Spotify.
Answer Nº of responsesYes, this is what Spotify is missing! 7Yes, sometimes it’s nice to see this visual representation 17No, it does not add much to Spotify 0No, I wouldn’t use it. I like Spotify the way it is 0
Table 4.2: Results for question 3.
The results indicate that the visual representation is indeed a very useful feature.Although the majority of the users do not find it to be an essential feature that Spotify ismissing, they still think it serves as a good helper to discover new music.
Given how different the listening habits of users can be, RAMA might be or mightnot be an appropriate tool for them: some users like to just have an automatic generatedplaylist playing in the background, while others might like to listen to an artist’s albumsin sequence.
44

Implementation and Validation
4.2.2.4 Question 4: Was the application well integrated with Spotify?
In a scale of 1 to 5, given 1 to be “I felt the app was out of place” and 5 to be “I feltthe app was part of Spotify”, the users were asked to grade the application’s integrationinto Spotify.
Answer Nº of responses1 02 13 14 85 14
Table 4.3: Results for question 4.
The majority of the users felt that the application was part of Spotify. These resultsindicate that the developed prototype blends very well with Spotify’s Desktop Client. Thisis a very important indicator for evaluating the application’s integration into Spotify’senvironment since it plays a major role in defining how good is RAMA in terms of userexperience.
The user that classified with 2 points was not able to create a new map from an artistthat was not visible in the graph, although he/she was a regular Spotify user. This mightindicate that the current way of performing this action is not very intuitive.
4.2.3 Summary
Overall, the results of the experiments were positive and the users were impressed withthis new way of discovering new music within Spotify. Some functionalities still need to bepolished in order to create an even more improved user experience, but RAMA’s conceptimplemented within Spotify worked well for the majority of the users.
45

Implementation and Validation
46

Chapter 5
Conclusions
5.1 Summary
The proposed thesis focused on delivering an enhanced user experience when discoveringnew music in Spotify’s Environment. By using RAMA’s concept applied in the developedprototype, the user experience when discovering new music as been greatly increased. Theusers felt that RAMA’s Spotify Application was natural and intuitive.
The amount of services that use visual tools for recommending music to users are notthat many, although, the ones shown in Chapter 2 are not representative of the wholespectrum.
Given the overview of the possibilities presented in Chapter 3, creating a Spotify Ap-plication to apply RAMA’s concept proved to be the best option to take.
The proposed modules 4 and 5 were implemented. The developed prototype provedto work after the beta-testing results. Although, there are a lot of improvements to do,the final result was very appealing to the users. All of the beta-testers liked the visualexperience and the majority responded positively about using the application in a regularbasis to discover new music.
All of the developed material (code, documentation, wiki, screenshots, demos) can befound in the project’s code repository (http://github.com/carsy/rama-spotify) as wellas in the appendix (A) to this document.
Two submissions will be sent to the following conferences:
• ISMIR 20141 - Demo submission2
• INFORUM 20143 - Comunication and poster4
5.2 Discussion
By introducing a visualization tool into a complete service like Spotify, the users feltthat their experience with RAMA’s application improved their abilities to find new music.The tests’ results show that RAMA’s Spotify Application is a successful approach to music
1http://www.terasoft.com.tw/conf/ismir20142http://www.terasoft.com.tw/conf/ismir2014/theLBD.html3http://inforum.org.pt/INForum20144http://inforum.org.pt/INForum2014/submissoes
47

Conclusions
discovery and recommendation. Although, the final results point in that direction, after theexperiments, 3 beta-testers stated that their music listening habits are not focused on themusic artists they are listening to. Instead, they simply pay attention to the songs (mostly,the popular ones), and so, their playlists are track-driven, not artist-driven. That mighthave had presented a problem to those users, since the focus of RAMA is the relationsbetween the artists. However, Spotify’s API’s recommendation system proved to pleasethose users, who started to pay more attention to the name of the artists they listen to.
Services like Spotify or Rdio, offer a complete set of features that range between playingevery track on their catalogue, to saving albums for offline mobile listening. With such avast music catalogue, the user might feel lost and not very motivated to find new music.Although these services continue to add features like Spotify’s “Radio” [24], the user findsit hard to cope with such a large world of available music.
By introducing this visual aid to music artist’s relations, RAMA succeeds in letting theuser understand and explore better the whole spectrum of available music.
5.3 Future Work
From the developed work so far, a more segmented testing might have been called for,in order to improve the results obtained, as well to better understand the user’s needs.
During the prototype’s development and the beta-testing experiments, there were sev-eral additional features suggested for RAMA’s Spotify Application. Most of them werenot included in the prototype because of the limited time frame for development, whileothers seemed to stray from RAMA’s focus. Nonetheless, every idea is important andmight someday contribute to the development of future features for RAMA.
Place the action buttons (expand, new map and delete) near the artist nodeSome users complained that it was hard to notice the action buttons (one user did not
even notice them). Maybe placing the buttons near the artist node and only show themwhile hovering it would make more sense.
Make it clear that the tags are clickable to the userFor some users it was not apparent at first that the upper tags were clickable, they
thought it was just an extra information, not something they could interact with.
Allow to click-and-hold to preview listening to an artistThis Spotify feature could be applied to the nodes so that the user could browse the
graph much faster.
Select multiple artists or tagsAllow the user to select multiple artists (or tags), in order to, for example, generate
playlists from that selection.
Let the graph update automatically with the current playing artistIn order to keep RAMA more alive, the graph would refresh automatically when a new
artist starts playing, with the new updated artist as root. Maybe an option to keep thegraph “locked” would allow the user to choose if he/she wants that behaviour or not.
48

Conclusions
Improve artists recommendationsThe assumption that Spotify’s recommendations are valid might not be so desirable.
Although the results are satisfactory, without knowing the reasons behind those choices ofconnections, the artists recommendations become inflexible. To improve this, one couldfully use Echonest’s API to fetch the similar artists [25]. The amount of query personal-ization is much more attractive than Spotify’s.
Improve the connection between the artists and the tagsAs an improvement of the previous idea, the connections between the artists and the
overlaying tags could become more related, and so, the intersection of tags between artistscould be used to improve the recommendations (creation of connections).
Include an alternate view with tags as nodes, instead of artistsSome users suggested that the tags overlay was an interesting point of view, and so,
if the graph could be drawn using the tags instead, the resulting map would then be analternative view of the application.
Improve artists recommendations with Social Networks’ dataA user suggested that the connections between the artist nodes could be improved
using information from social networks. Spotify already has the possibility for the user tointegrate his/her Facebook5 account, and so, this information could be used to personalizethe recommendations [26].
Cluster groups of artistsCluster groups of artists to create a geographical representation of what the entire
network of available artists could be like.
Tag mind mapIn a way to try and complement the two previous ideas, a clustering of the tags would
create an interesting mind map of the current genres. And since there are indeed musicgenres that are similar (for example, metal and celtic metal) the map would be browsable.
InformationAdd an information UI component to help the users understand better the visualization
parameters (a tutorial-like component) - although those parameters are advanced settings(not strictly necessary for the user to interact with) it might be a good idea to give morepower to the user and make these settings easy to understand.
3D VisualizationRegarding the discussion in 4.1.2.1, if the graph is not a tree, the visual clutter can
degradate the user’s experience. Some users suggested a 3D Visualization for these cases.This approach can be in fact be a good solution to the problem [27].
5http://facebook.com
49

Conclusions
Show more tagsThe list of tags shown in the Tags overlay is trimmed as mentioned in 4.1.2.5, but
sometimes the user might want to see more tags. A possibility to solve this problem couldbe to make the list scrollable or to add a "show more" button.
Improve the visualization of the connectionsThe length of the edges of the graph could have a repulsion value inversely proportional
to how strong the connection between the artists are. This might help the user to discovernew music quicker than before.
50

References
[1] 8tracks’ Product Vision. http://8tracks.com/about. [Online; accessed 23-June-2014].
[2] Spotify’s About page. https://www.spotify.com/uk/about-us/contact/. [Online;accessed 23-June-2014].
[3] Rdio’s Product Vision. http://www.rdio.com/about/. [Online; accessed 23-June-2014].
[4] Pandora’s music recommendation system. http://www.pandora.com/about. [Online;accessed 23-June-2014].
[5] Paul Lamere. Creating transparent, steerable recommendations. 2008.URL: http://www.mirlab.org/conference_papers/International_Conference/ISMIR%202008/latebreak/lamere.pdf.
[6] BG Costa, Fabien Gouyon, and Luís Sarmento. A Prototype for Visualizing Mu-sic Artist Networks. 2008. URL: http://www.inescporto.pt/~fgouyon/docs/CostaGouyonSarmento_ARTECH2008.pdf.
[7] Luís Sarmento and Eugénio Oliveira. Visualizing networks of music artists with rama.International Conference on Web . . . , 2009. URL: http://repositorio-aberto.up.pt/bitstream/10216/15194/2/18675.pdf.
[8] Diogo Costa, Luís Sarmento, and Fabien Gouyon. RAMA : An Interactive ArtistNetwork Visualization Tool. (i):2, 2009. URL: http://ismir2009.ismir.net/proceedings/LBD-2.pdf.
[9] Fabien Gouyon, Nuno Cruz, and Luís Sarmento. A Last.fm and YouTube Mash-upfor Music Browsing and Playlist Edition. Late-breaking/Demo session at the 12thInternational Society for Music Information Retrieval Conference, 2011. URL: http://ismir2011.ismir.net/latebreaking/LB-3.pdf.
[10] Libspotify SDK. https://developer.spotify.com/technologies/libspotify.[Online; accessed 23-June-2014].
[11] Spotify Apps. https://developer.spotify.com/technologies/apps. [Online; ac-cessed 1-July-2014].
[12] The Chromium Embedded Framework (CEF). https://code.google.com/p/chromiumembedded. [Online; accessed 23-June-2014].
51

REFERENCES
[13] Spotify Widgets. https://developer.spotify.com/technologies/widgets. [On-line; accessed 23-June-2014].
[14] Spotify Subscriptions Comparison Chart. http://community.spotify.com/t5/Newcomers-and-Contribution/Subscription-Comparison-Chart/td-p/666916.[Online; accessed 23-June-2014].
[15] Libspotify SDK’s builds available. https://developer.spotify.com/technologies/libspotify/#libspotify-downloads. [Online; accessed 23-June-2014].
[16] Metadata API (deprecated, now Web API). https://developer.spotify.com/technologies/web-api. [Online; accessed 23-June-2014].
[17] Project Rosetta Stone. http://developer.echonest.com/docs/v4#project-rosetta-stone. [Online; accessed 23-June-2014].
[18] iOS SDK (beta). https://developer.spotify.com/technologies/spotify-ios-sdk. [Online; accessed 23-June-2014].
[19] Vincent Driessen. A successfull Git branching model. http://nvie.com/posts/a-successful-git-branching-model/. [Online; accessed 23-June-2014].
[20] Git Brancing: What a Branch Is. http://git-scm.com/book/en/Git-Branching-What-a-Branch-Is. [Online; accessed 23-June-2014].
[21] Git Basics: Tagging. http://git-scm.com/book/en/Git-Basics-Tagging. [Online;accessed 23-June-2014].
[22] Echonest’s terms: What is the difference between weight and frequency. http://developer.echonest.com/forums/thread/353. [Online; accessed 23-June-2014].
[23] RAMA’s original Website application. http://rama.inescporto.pt/app. [Online;accessed 23-June-2014].
[24] Spotify’s Radio mode. http://news.spotify.com/us/2011/12/09/discover-the-new-spotify-radio. [Online; accessed 23-June-2014].
[25] Similar artists query using Echonest’s API. http://developer.echonest.com/docs/v4/artist.html#similar. [Online; accessed 23-June-2014].
[26] B. Fields, K. Jacobson, C. Rhodes, M. d’Inverno, M. Sandler, and M. Casey.Analysis and exploitation of musician social networks for recommendation anddiscovery. Multimedia, IEEE Transactions on, 13(4):674–686, Aug 2011.doi:10.1109/TMM.2011.2111365.
[27] Paul Lamere and Douglas Eck. Using 3d visualizations to explore and discover music.In ISMIR, pages 173–174, 2007. URL: http://musicalevent.googlecode.com/svn/trunk/bibliography/2007-lamere.pdf.
52
Appendix A
Appendix
A.1 Demonstrations
Two demonstrations of the developed prototype can be seen in:https://raw.githubusercontent.com/carsy/rama-spotify/master/demo.gif
andhttps://raw.githubusercontent.com/carsy/rama-spotify/master/demo2.gif
An effort was made to show the main implemented features.
A.2 Questionnaire
The questionnaire in Figure A.1 was composed of four mandatory questions and afree-text field for suggestions and other feedback.
53

Appendix
Figure A.1: Questionnaire that the beta-testers were required to fill after the experiment.
54
Recommended


