
Jointly published by Elsevier Science B. V., Amsterdam
and Akaddmiai IOad6, Budapest
Scientometrics,
Vol. 33, No. 3 (1995) 381-422
N E W B I B L I O M E T R I C T O O L S F O R T H E A S S E S S M E N T O F N A T I O N A L R E S E A R C H P E R F O R M A N C E : D A T A B A S E
D E S C R I P T I O N , O V E R V I E W O F I N D I C A T O R S A N D F I R S T A P P L I C A T I O N S
H. F. MOED, 1~ E. DE BRUIN, TH. N. VAN LEEUWEN
Centre for Science and Technology Studies, (CWTS), Leiden University, Wassenaarseweg 52, P.O. Box 9555, 2300 RB Leiden (The Netherlands)
(Received March 16, 1995)
This paper gives an outline of a new bibliometric database based upon all articles published by authors from the Netherlands, and processed during the time period 1980-1993 by the Institute for Scientific Information (ISI) for the Science Citation Index (SCI), Social Science Citation lndex (SSCI) and Arts & Humanities Citation Index (A&HCI). The paper describes various types of information added to the database: data on articles citing the Dutch publications; detailed citation data on ISI journals and subfields; and a classification system of publishing main organizations, appearing in the addresses. Moreover, an overview is given of the types of bibliometric indicators that were constructed. Their relationship to indicators developed by other researchers in the field is discussed. Finally, two applications are given in order to illustrate the potentials of the database and of the bibliometric indicators derived from it. The first represents a synthesis of 'classical' macro indicator studies at the one hand, and bibliometric analyses of research groups or institutes at the other. The second application gives for the first time a detailed analysis of a country's publication output per institutional sector.
1. Introduction
In this paper we summarize the main outcomes of a project, financed by the Netherlands Organization for Scientific Research (NWO), and aimed at the development and application of bibliometric indicators in science and research policy. We give a description of a bibliometric database, the core of which consists of all scientific publications by Dutch authors published during the time period 1980-1993 in journals processed for the Science Citation Index, Social Science
Citation Index and Arts and Humanities Citation Index, compiled by the Institute for Scientific Information.
0138- 9130/95/US $ 9.50
Copyrigtu �9 1995 Akad~miai Kiad6, Budapest
All rights reserved

H. F. MOED et al.: ASSESSMENT OF NATIONAL RESEARCH PERFORMANCE
In an attempt to cope with several points of critique on previous studies we
explore new bibliometric indicators of the past research performance of research
groups, focusing on the impact of a group as compared to some international
standard, and on its scientific cooperation with other groups. We develop indicators
revealing both the cognitive orientation of a research group, as well as its impact as
compared to a world average citation rate. Moreover, we distinguish between several
types of cooperation (e.g., cooperation between groups within the same main
organization, or international scientific cooperation), and construct indicators
reflecting both the number of cooperations of each type, as well as the average
impact of the papers resulting from those cooperations. Next, the position of a group
in the SCI journal spectrum in analysed. Finally, statistics are calculated related to
different types of articles published, comparing for instance normal articles and
review articles both in terms of their frequency of occurrence in a group's oeuvre, as
well as their average impact, compared to a world average calculated for all papers of
a certain type.
We introduce a method to analyse the research performance at the level of
aggregates of research groups, for instance, all groups within a specific university, or
within a specific scientific discipline. This method presents an overall picture of a
sample of groups in such a way that the positions of the individual groups are still
visible, in order to obtain insight into the distribution of the groups' scores underlying
an overall statistic for the sample as a whole. As such, it represents a synthesis
between classical macro indicator studies at the one hand, and bibliometric analyses
of groups or institutes at the micro or meso level at the other.
The method enables one to perform statistical analyses in which the research
performance of groups is related to specific characteristics of these groups, for
instance, the size of a group, the amount of financial support received from Scientific
Research Councils or the main organization, institutional sector or field in which they are active.
Our methodology was applied in a number of studies conducted for specific
branches or sub-organizations of NWO, dedicated to several subfields in the natural
and life sciences, social sciences and arts and humanities. The outcomes of these
studies were published in research reports, and some of these also in the serial
literature. 1 This paper focuses on the technical and methodological aspects of our
work. It shows some applications in the natural and life sciences only, in order to
illustrate our methodology. An assessment of its usefulness is given in.the research
reports and papers listed in Ref. 1, and will be presented in future publications.
382 Scientometrics 33(1995)

H. F. MOED et al.: ASSESSMENT OF NATIONAL RESEARCH PERFORMANCE
Our paper consists of three parts, The first part is outlined in Section 2 and gives
a description of the bibliometric database that was constructed. The core of the database consists of all articles with a 'Netherlands' address, published in journals processed by the Institute for Scientific Information (ISI) for the Science Citation
Index (SCI), the Social Science Citation Index (SSCI) and the Arts & Humanities
Citation Index (A&HCI). Currently, the time period covered is 1980-1993. In Chapter 2 we also give an overview of the types of information added to the database.
In Section 2.1 we describe both the core of the database, as well as the data on publications citing the Dutch articles. Detailed information on the citation rates of all journals processed by ISI is outlined in Section 2.2. We also added a classification of
journals into scholarly subfields ('categories') developed by ISI. The potentials of
combining this classification system with the data on citation rates per journal is illustrated in Section 2.3. We unified the names of all Dutch main organizations
appearing in the addresses of the publications and developed a classification system of main organisations enabling analyses per institutional sector (e.g., university, industry). This part of the work is presented in Section 2.4. In Section 2.5 we describe
in general terms the methods we developed to match the information in the database
to research units to be analysed. The second part of our paper deals with bibliometric indicators, and is covered by
Section 3. In an attempt to cope with several points of critique on previous studies,
we explore new bibliometric indicators of the past performance of research groups,
focusing on the impact of a group compared to an international standard, its cognitive orientation and its collaboration with other groups. Section 3.1 deals with
indicators of output (or publication activity), and Section 3.2 with impact indicators. We developed indicators of short term impact (typically, during the first three years after publication date), but also statistics reflecting the impact at a longer term. In
order to assess the level of the impact, we apply international 'standards' based upon
average journal citation rates or average subfield citation rates. Simple indicators
reflecting the position of a research group in the journal spectrum are presented in Section 3.3. Section 3.4 introduces a visual display of a set of indicators, reflecting both the output (publication activity), cognitive orientation and impact of a research group. Indicators of scholarly collaboration are illustrated in Section 3.5, while in
Section 3.6 analyses are made per type of publication (e.g., normal article, review, note).
Our database contains only articles published in journals processed for the SCI, SSCI and A&HCI. Research groups may publish articles in journals that are not
Scientometrics 33 (1995) 383

H. F. MOED et al.: ASSESSMENT OF NATIONAL RESEARCH PERFORMANCE
covered by any of the ISI Indexes, or they may publish in other sources (e.g., in
conference proceedings or books). It is very important to analyse the extent to which
they publish in scientific journals and the extent to which a group's journal oeuvre is
covered by the ISI indexes. In Section 3.7 we describe indicators of journal coverage
and ISI coverage. In impact analyses, it is most relevant to assess whether the impact
of a group is significantly higher or lower than the international standard based upon
journal or subfield citation rates. In Section 3.8 a statistical test is described in order
to establish significant deviations from the international standard. Finally, in Section
3.9 we compare our indicators to those developed by other colleagues in the field of Evaluative Bibliometrics.
The third part of this paper presents applications of the database and the
methodology outlined above. All applications relate to research activities in the
natural and life sciences, and are based on SCI data. Results for the Social Sciences
and the Arts and Humanities are published in separate publications. 1 In Section 4.1
we introduce a method to analyse the research performance at the level of aggregates
of research groups, for instance, all groups within a specific subfield or a university.
This method presents an overall picture of a collection of groups in such a way, that
the positions of the individual groups are still visible, in order to obtain insight into
the distribution of the groups' scores underlying an overall statistic for the collection
as a whole. This approach represents a synthesis between 'classical' macro indicator
studies and analyses of research groups or institutes. As an illustration of this
method, we present a bibliometric analysis of all Departments of Medical
Pharmacology established at universities in the Netherlands. In Section 4.2 we
present results of a bibliometric analysis per institutional sector within the
Netherlands, applying the classification of publishing organizations described in
Section 2.4, To our knowledge, this is the first bibliometric study presenting detailed
results per institutional sector.
2. Database description
2.1. Publication and citation data
We collected data on all publications which, according to the addresses of the
contributing authors, originated from the Netherlands, and were included during the
period 1980-1993 in the Science Citation Index (SCI), the Social Science Otation
Index (SSCI), and the Arts & Humanities Index (A&HCI), published by the Institute
384 Scientometrics 33 (1995)

H. F. MOED et al.: ASSESSMENT OF NATIONAL RESEARCH PERFORMANCE
for Scientific Information (ISI) at Philadelphia (USA). For each publication we
obtained the following information processed by ISI:
- Data on all contributing authors;
- All their addresses;
- Source data (journal title, publication year, volume number, initial and final
page number, type of document); - The title of the publication;
- The cited references contained in each publication.
Moreover, we collected data on all publications processed by ISI citing these
Dutch publications during the period 1980-1993. For each citing publication we
obtained the same information as for the above mentioned Dutch publications. We
created a large bibliometric database splitting up all relevant information into
separate subfields, and developed software to search the database, and to perform
bibliometric analyses on data samples extracted from it. A substantial part of the
publication and citation data were ordered directly from ISI, and were delivered on magnetic tapes. The database was created in 1990, and updated in 1992 and 1994.
Currently, our database contains some 240,000 publications from the Netherlands.
In selecting citations to the Dutch papers, several important sources of error were
eliminated. To be more specific, ISI matched the Dutch publications to its citation
files using a matchkey consisting of the first four characters of an author's last name,
his/her first initial, the first character of the journal title, the publication year,
volume number and initial page number. In this way, ISI took into account possible
variations in author names, particularly in an author's initials (except the first one).
This method is different from the one applied by ISI in the collection of citation data
for the Dutch Survey Committee on Biochemistry (Verkenningscommissie
Biochemie) in 1982, and gives much more accurate results. 2
2.Z Database of journal citation data
We obtained bibliometric data in computer readable form on all journals
processed by ISI during the period 1981-1993. These data were extracted from ISI's
Integrated Citation File. The data relate to journals processed both for the SCI, the
SSCI and the A&HCI. For each journal and each publication (or source) year we
obtained information on the number of papers published, as well as on the number
of times these publications were cited in subsequent years up until 1993.
Scientornetrics 33 (1995) 385

H. F. MOED et al.: ASSESSMENT OF NATIONAL RESEARCH PERFORMANCE
To be more specific, publications in each journal were disaggregated into types
according to the ISI classification of publications into normal articles, letters, notes, reviews, proceedings papers, meeting abstracts, editorials, and so on. With respect to
the citation data, we have information on the total number of citations received in a
specific citing year, the percentage of papers not cited in that year, and the variance
among the citation scores.
In order to illustrate the type of data we have collected, we give a typical example.
From our database results that the journal Biochimica et Biophysica Acta published 2133 normal articles in 1981. These articles are cited 3775 times in the year 1987. The
mean number of citations per article thus amounts to 1.77. The variance of the
citation scores to these 2133 articles amounts to 7.25. Furthermore, 811 normal
articles published in 1981 are not cited in 1987 (38%). The mean number of citations
per cited article is 2.85, and the variance of the citation scores of all cited papers
amounts to 8.62. We obtained similar data for each publication type in each journal
processed by ISI, for each publication year during the period 1981-1993, while the
citation data relate to each (citing) year separately up until 1993.
2.3. Database of journal categories/subfields
Data in computer readable form were collected on a classification of scholarly
journals into subfields or categories. These data were obtained from the database
descriptions of the SCI, SSCI and S&HCI, published by ISI during the period
1981-1992. Combining this database with the one on citation scores of Scholarly
journals (see Section 2.2), one is able to obtain publication and citation data at the
level Of subfields as defined by the ISI journal categories. Two typical examples are
presented in Tables 1.1 and 1.2. These tables show for normal articles published in
journals assigned to the categories biochemistry and molecular biology (Table 1.1),
and gastro-enterology (Table 1.2), the annual number of papers published, the
percentage of these papers uncited in a particular year, as well as the sum and mean
number of citations received during the time period between the publication year and
1990. In these tables we display only data related to the period 1981-1990. Currently
our journal citation and category data relate to the period 1981-1993.
386 Scientornetrics 33 (1995)

H. F. M O E D et al.: ASSESSMENT OF N A T I O N A L R E S E A R C H P E R F O R M A N C E
[..,
O
t . ;
.
,~,,,
N ~
e ~ .
~'~.
t, 0
|
~,, m,., i mm 6~
~ g
,3.~.~ ~ . : ~.~. :~ : ~ ~.~. ~.~.~ ~ . ~ . . . . . .
!;2 !ii !;: !;i !21 !;i !;i
i ' ~ "~. "~~ "~~ "~. "~. "~. "~~ "~.
Scientometrics 33 (1995) 3 8 7

H. F. M O E D et al.: A S S E S S M E N T O F N A T I O N A L R E S E A R C H P E R F O R M A N C E
0
t ~
~ a
o N I ' ,-
~ .~ . . . . . . . . . . . . . . . . . . . . . . . . . . .
N
~..;,4 ,4,.; ~; . . . . . . . . . . . . . . . . . . . . . . . .
e q
. ; . . . . . . . ".,.; . . . . . . . . . . . . . . . . . . .
- ~ - ~ - $ - [ -
�9 �9 �9 �9 �9
N
- ~ - ~ - ~ . . ~ ~ ~ ~ o
~ 0~ - ~--o. o.
388 Scientometrics 33 (1995)

H. F. MOED et al.: ASSESSMENT OF NATIONAL RESEARCH PERFORMANCE
Legend to Tables 1.1 and 1.2: Table 1.1 shows that the number of articles published in the category biochemistry and molecular
biology in 1981 amounts to 15,716.5. It should be noted that if a journal is assigned by ISI to two categories, half of the journal's papers were assigned to the firstcategory, and the other half to the second. In technical terms: we applied a fractional counting scheme. For this reason, non-integer values may appear both for the number of sources as well as for the sum of citations. Approximately 10% of all journals were assigned to more than one category. Table 1.1 shows further than the 1981 sources are cited 8358.67 times in 1981 (0 years after publication year), 41,776.83 times in 1982 (1 year after publication date), and so on. We found that 34.83% of the 1981 sources are not cited in 1982. Focusing on the average number of citations per publication for normal articles published in 1981, Table 1.1 reveals a peak of 3.39 citations per publication reached at the secondyear after publication date. In later years, the citation per publication ratio declines rapidly, obtaining the value 1.83 in the nineth years after publication date. In fact, the citation pe r publication ratio in the second year after publication date is 1.85 times higher than this ratio in the nineth year after publication date (3.39 versus 1.83). For articles from all publication years, the maximum number of citations per publication is reached at the second year after publication date, expect for sources published in 1982. Table 1.1 also reveals that the number of normal articles published in the category increases steadily from 15,716.5 in 1981 to 20,422.0 in 1990, corresponding to an average annual growth rate of 3% during the period 1981-1990. Inspecting the citations and selecting a fixed year after publication (i.e., reading the table column-wise), one observes also an increase in the citation per publication ratio for most years.
Table 1.2 relates to the category gastro-enterology and shows a pattern, which is rather different from the one presented for biochemistry and molecular biology. Citation levels are much lower here. Focusing on articles published in 1981 and citations received in the second year after publication date, Table 1.2 shows a citation per publication ratio of 2.03 while the percentage of papers not cited amounts to 37.57. For biochemistry and molecular biology we found 3.39 and 30.67%, respectively. Citations peak in most cases in the third year after publication date rather than the second year as in the case of biochemistry and molecular biology. Moreover, the decline in the citation per publication ratio seems to be less rapid. In fact, for articles published in 1981, the citation per publication ratio in the second year after publication date is 1.53 times higher than in the nineth year, while for biochemistry and molecular biology we found for this parameter the value of 1.85. Next, there is no general increase of the citation per publication ratio. Finally, the average annual increase in the number of articles published during the period 1981-1990 is 7.6, which is more than two times higher than the annual growth rate found in biochemistry and molecular biology.
T h e p u b l i c a t i o n a n d c i t a t i on d a t a p e r j o u r n a l a n d p e r j o u r n a l c a t e g o r y w e h a v e
co l l ec t ed in o u r p r o j e c t a r e s i m i l a r to d a t a c o m p i l e d by Schubert , Glanze l a n d
Braun.3, 4 I n a n e x t e n s i v e s tudy p u b l i s h e d in 1989, t h e s e a u t h o r s p r e s e n t e d
b i b l i o m e t r i c s ta t i s t i cs for all j o u r n a l s p r o c e s s e d for t h e SCI d u r i n g t h e p e r i o d
1 9 8 1 - 1 9 8 5 , a n d for all SC I j o u r n a l c a t e g o r i e s d u r i n g t h e s a m e p e r i o d o f t ime . T h e s e
s ta t i s t ics w e r e u s e d in a b i b l i o m e t r i c a s s e s s m e n t o f t h e r e s e a r c h p e r f o r m a n c e o f
i nd iv idua l c o u n t r i e s . T h e y a s s e s s e d s t r e n g t h s a n d w e a k n e s s e s o f a c o u n t r y ' s r e s e a r c h
p e r f o r m a n c e in t h e v a r i o u s sc ien t i f ic s u b f i e l d s as d e f i n e d b y m e a n s o f j o u r n a l
ca t ego r i e s . T h e s t u d y b y B r a u n a n d c o - w o r k e r s is b a s e d o n p r e v i o u s w o r k b y Narin.5
T h e fo l lowing m a i n d i f f e r e n c e s exis t b e t w e e n o u r d a t a a n d t h e d a t a p r e s e n t e d by
Schuber t et al.:
Scientometrics 33 (1995) 389

H. F. MOED et al.: ASSESSMENT OF NATIONAL RESEARCH PERFORMANCE
- We have collected data on all journals processed for the SCI, SCCI and
A&HCI during the period 1981-1993, while the data compiled by Schubert et
al. relate to the SCI only, and to the period 1981-1985 or to the period 1986 - 1990;
- We have collected citation data on a year-by-year basis, up to 1993, enabling
us to analyse age distributions of citations and to perform longitudinal
analyses. Schubert et al. present only publication and citation data with respect
to two periods; - We have systematically disaggregated papers in journals or journal categories
into types (e.g., normal articles, letters, notes, reviews);
- On the other hand, Schubert et al. have disaggregated papers within a journal
or journal category on the basis of the country of origin of the publishing authors. They calculated bibliometric statistics for each country separately.
2.4. Unification and classification of research institutions
A corporate address gives the institutional and geographic affiliation of publishing
authors, as indicated in the heading of a publication. Most scientific literature databases include one address only, usually the address of the first or reprint author. In databases processing the addresses of all contributing authors, such as the SCI, the
output of a specific country (i.e. the Netherlands) can be established without much difficulty.
The problem of name variations (Netherlands, Nederland, Holland) has largely been solved by ISI at the country level and, to a limited extent also for institutes. Since this unification is still far from perfect, we developed a method to unify all the ISI addresses for our bibliometric analyses. 6 To prevent 'scattering' of publications the name variations have been stored under one (common) denominator in a unification database or masterfile. For instance, the variations FREE UNIV AMSTERDAM, FREE UNIV, VRIJE UNIV AMSTERDAM, FREIE UNIV AMSTERDAM, UNIV LIBRE AMSTERDAM have been unified to FREE UNIV AMSTERDAM. Through comparing addresses and using reference books such as annual reports, handbooks on universities and research organizations, or telephone directories, we have been able to identify most addresses appearing in SCI papers. In addition, we consulted specialists in the various research fields.
We have established the type of organization using the classification system presented in Table 2. We have aggregated the various types of organizations into three sectors: the public sector, the private sector and the intermediate sector.
390 Scientornetrics 33 (1995)

H. F. MOED et al.: ASSESSMENT OF NATIONAL RESEARCH PERFORMANCE
The public sector consists of two sub-sectors. The first is Higher Education. For this sub-sector, identification of addresses is not extremely difficult. In most university addresses the name of the university can be found in the first part of the corporate address field. We have unified the name variations and identified the records with one of these variations as a university. Addresses with department names only have been identified as parts of a specific university with the aid of reference books. This group of addresses involves mainly university hospitals. The category Other Educational Organization consists almost exclusively of institutes of higher vocational education: 'HBO-instellingen' and 'Hogescholen'. The term 'Hogeschool' is ambiguous: before 1986 it related to education on a university level (e.g., the Technische Hogeschool Delft) and after 1986 to non-university higher education. However, classification and unification of this category did not lead to major problems. Moreover, the number of publications involved is very low; the higher education sector consists almost completely of university output.
Table 2 Classification system of organization types
A. PUBLIC SECTOR
1 (HIGHER) EDUCATION - Universities - Other Educational Organizations (mainly Higher Vocational Education
(HBO)-institutions)
2 OTHER PUBLICLY FINANCED RESEARCH ORGANIZATIONS - Research Institutes - Hospitals (non-academic) - Museums, Libraries & Archives - Government Departments (e.g., Ministry of Education & Science; Department
of Public Works) - International Organizations (e.g., ESA, EURATOM)
B. PRIVATE SECTOR
-Companies
C. INTERMEDIATE SECTOR
- Pharmacies, Doctors, Veterinarians - Societies, Foundations, Trade Unions - Veterinary Health Institutes - Zoological Gardens - (Scientific) Journal Publishers
Scientoraetrics 33 (1995) 391

H. F. MOED et al.: ASSESSMENT OF NATIONAL RESEARCH PERFORMANCE
In the second sub-sector of the public sector, Other Publicly Financed Research Organizations, identification and classification is much more difficult. Borderlines are
sometimes vague, institutes have changed their name and character during the 1980s, and for smaller institutes the reference books we used, often do not give sufficient
information. Moreover, doing justice to the character of every institute would result in too many categories. Therefore, we have made combinations. For instance, all non-university hospitals, clinics, municipal health services (GGD), psychiatric
institutes etc. have been classified as Hospitals. The next subcategory in the public
sector consists of Research Organizations and institutions that perform research as their main task. Examples are institutes of the Netherlands Organisation for Applied
Research (TNO) and the Royal Netherlands Academy of Arts and Sciences (KNAW). The subcategory Museums, Libraries and Archives is very small in the natural and life sciences, but differs too much in character to combine it with other
subcategories. The subcategory Government Departments consists of publications with Ministries or local governments in the corporate address or with services such as the Food Inspection Service. The category International Organizations relates to
publications by authors with affiliations such as the European Space Agency (ESA), the European Communities or EURATOM. These organizations have several
research establishments in the Netherlands, for instance in Noordwijk and Petten. The private sector consist of companies. In the corporate addresses this category
can be identified by abbreviations such as 'BV' and 'NV' or well-known company names such as Philips or Unilever. Telephone directories are also useful guides for identification. A problem is constituted by the privatization of public services and
state owned companies during the 1980s, such as the PTT and DSM. After consulting the Minsitry of Education and. Science we decided to consider these, as well as all
public service corporations (that are still state owned) as companies and
consequently as belonging to the private sector. Since the numbers of publications involved are low, this decision will not affect the trends considerably. The only
exception is DSM, but the industrial character of this chemical company was already evident before the selling of the shares by the government in the late 1980s.
As intermediate sector are considered publications from researchers, who are not affiliated clearly to either the public or the private sector. Veterinary Health Services, in which both government and private enterprise (in particular farmers
organizations) participate, constitute the most important group in this category. We
classify publications from Societies, Sports Associations, Trade Unions, Zoological Gardens, as well as from self-employed veterinarians, doctors and pharmacies, also in
392 Scientometrics 33 (1995)

H. F. MOED et al.: ASSESSMENT OF NATIONAL RESEARCH PERFORMANCE
this intermediate category. Since the numbers of papers in this sector are very low,
we aggregated all parts of the intermediate sector also in the analysis of the
subcategories. It should be noted that we are dealing here with a classification of papers based
on their addresses. On the inpu t side the distribution may be somewhat different. For
instance, the major part of the research activities at Dutch universities is publicly
f'manced, but part of the research activities consists of contract research, financed by
private firms. On the other hand, several private companies in the Netherlands
received budgets from national or supra-national government agencies (particularly
the Ministry of Economic Affairs, the Ministry of Education and Science and the
Commission of the European Communities) as stimuli to their R&D activities.
The unification and classification of Dutch corporate source addresses in our
database is almost complete now. Over 99% of the addresses has been unified and
classified according to the system mentioned above. However, several of the
addresses that have been unified and classified, are Still 'problematic'. These
institutes belong to overlapping categories, in which their status could not clearly be
established or their identification (e.g., as a university department) was not 100%
certain. Since these 'problematic' addresses in our database generally have a small
output, we believe that we have unambiguously unified and classified the institutes
responsible for well over 95% of the publications. This is sufficient to produce
reliable results per institutional sector. Publications that could not be classified yet
were not taken into account in the analyses.
2.5. General principles of data collection
In order to select papers from our database published by a specific research
group we developed an approach in which we combined author names and
information on addresses in our publication database with names of scientists and
department names. We start the selection process by specifying the names of the
(senior) scholars working in a specific group. We look up in the author index of our
database his/her name as author of publications, taking into account possible
variations of the name. In the next step, papers are extracted in which the name of
the person appears as an author (either first author or co-author). Next, the
addresses attached t o these papers are analysed, comparing the names of the
departments and other subdivisions appearing in the addresses with the institutional
affiliations of the researcher. If a scholar moved from one institution to another
Scientornetrics 33 (1995) 393

H. F. MOED et al.: ASSESSMENT OF NATIONAL RESEARCH PERFORMANCE
during the time period considered, we select his/her articles originating from both institutions. This approach is repeated for all researchers within a group. It is
performed partly manually and partly by means of computer programs. Thus, for each researcher in our set we generate lists of publications extracted from our
Netherlands publication database. These lists are sent to the researchers involved in
order to check their completeness and correctness (verification round). All additions and corrections indicated by these are entered in our database. As a result, we obtain
reliable publication data for all scientists involved,
3. Indicators constructed
3.1. Indicators of publication output
The publication output of a research group is expressed in the number of articles in our ISI database. Calculating this indicator (symbol P) enables us to determine,
for each group, the number of ISI-publications with a Netherlands address per year,
or during the whole period 1980-1993. Here only the ISI-types normal articles,
letters, notes, reviews and proceedings papers were considered, which are regarded as fully-fledged articles.
3.2. Impact indicators
3.2.1. Trend analysis of short term impact.
We developed software to perform a trend analysis on numbers of articles by a
specific group and on the number of times these articles have been cited during the
first few years after publication date. As an example, Figs 1 and 2 show the results for
a department in the field of Neurology. In this example, data relate to the time period 1980-1993. This analysis provides insight into the trend in publication output
and impact (measured through bibliometric indicators) during the period 1980-1993. It may serve to identify groups whose performance is increasing or declining during the time period considered. 7
394 Scientornetrics 33 (1995)

H. F. M O E D et al.: ASSESSMENT OF NATIONAL R E S E A R C H P E R F O R M A N C E
190
180
170
160
150
140
130
120
110
100'
90'
80'
70'
60
50'
40'
30"
20"
101
O"
80-82
,p Cex
/ /
/ /
/
/ o
I / /
t
/ /
/ , / "
/ /
/ /
/
I | I I I I I I I I I
81-83 82-84 83-85 84-86 85-87 86-88 87-$9 88-90 89-91 90-92 91-93
YEARS
Fig. 1. Trends in the numbers of publications and citations for a department in the field of Neurology
Legend to Figs 1 and 2: Figure 1 gives the annual number of papers published (P), as well as the sum of citations to these
papers during the period defined by the citation window (Cex). Self citations are not included. A self citation is defined as a citation given in a publication of which at least one author (either first- or co- author) is also an author of the cited paper. In Figure 2, the average number of citations per publication is presented. Moreover, the average citation rate of all papers in the journals in which the group has published (JCSm, the mean Journal Citation Score) is presented as well. JCSm constitutes a reference level for the citation rate of the group's publications (CPP). Comparing the two measures one is able to assess whether a group's articles are cited frequently, relative to the citation rate of all papers published in the journals in which the group has published (its journal packet). Figures 1 and 2 represent a research department in the field Neurology and show that the impact of its papers increases enormously during the second half of the time period considered.
Scientometrics 33 (1995) 395

H. F. MOED et al.: ASSESSMENT OF NATIONAL RESEARCH PERFORMANCE
13
12
11
10
9
8
7
6
5
4
3
2
1
0 i
80-82 81-83
"S/,/"1"1 CPP
JCSm
i i i i I i i i i
82-84 83-85 84-86 85-87 86-88 87-89 88-90 89-91 90-92 91-93
YEARS
Fig. 2. Trends in the average short term impact and journal impact for a department in the field of Neurology
A foced citation window is applied. This means that citations to papers pubfished in a particular year are counted during the first few years after publication date. In Figures 1 and 2 the citation window has a length of three years, starting with the year of publication. This means that for papers published in 1980, we count those citations received during the period 1980-1982. Similarly, for papers published in 1991, citations are counted during the period 1991-1993.
396 Scientometrics 33 (1995)

H. F. MOED et al.: ASSESSMENT OF NATIONAL RESEARCH PERFORMANCE
It should be noted that this comparison of the group's citation rate with the
average citation rate of its journal packet does not take into consideration the level of
the journals in which a group has published. If group A publishes in prestigious (high impact) journals and group B publishes in mediocre journals the citation rate of
publications published by both groups may be equal relative to the average citation
rate of their respective journal sets, but the first group can be considered to have
gained a higher impact than the second. A second limitation of this trend analysis described above holds that the citation
windows applied are rather short. While some groups may have published papers
cited predominantly at the short term - i.e., the first 2 or 3 years after publication
date - , other groups may gain impact in later years.
Finally, the indicators do not take into account the phenomenon of co-publication
between different groups. In this analysis a co-publication between two groups is
assigned to each of the participating groups. No insight can be obtained into the
extent to which groups co-publish with other groups, nor into the effect of co-
publication on the impact.
In order to overcome these limitations, we developed several other bibliometric
indicators that will be outlined below. These new indicators are supplementary to the
ones we developed in previous studies. They do not replace the old indicators. We
introduced the following new elements.
- We abandoned the idea of a fixed, short citation window, so that we can assess
also impact at a longer term.
- We developed a new reference level for the citation rate of papers published
by a group, by comparing this rate with a 'world' average citation rate of all
papers published in the subfields in which the group is active. In other words,
instead of journal citation rates we apply subfield citation rates.
- We developed indicators to assess the impact of the journals in which a group
has published.
- We took into account collaboration between research groups, as measured
through co-publication between scientists from different groups:
3.2.2. 'To(al period' citation indicators; the construction of a 'world' average citation rate per scientific subfield.
The purpose of these indicators is to assess a group's output and impact during a
fixed time period, utilising all publication and citation data related to this period. We
Scientornetrics 33 (1995) 397

H. F. MOED et al.: ASSESSMENT OF NATIONAL RESEARCH PERFORMANCE
count the total number of papers published by a group during a fixed period - for
instance, 1980-1991 - , and the total number of citations received by all these papers
during the same period. Consequently, for papers published in 1980, citations are
counted during the period 1980-1991. For papers published in 1990, only citations
received in 1990 and 1991 are available. Below we will calculate bibliometric
indicators with respect tot the total period 1980-1991 and for the more recent period
1986-1991.
Table 3 Bibliometric indicators for the field Nucleic Acid Research in the Netherlands
Time period Indicator Symbol 1980 - 1991 1986 - 1991
Nr. publications in SCI P Total nr. citations received C Citations per publication CPP Citations per publication, self- CPPex citations not included Percentage of papers not cited %Pnc Mean citation rate of journal packet JCSrn Mean citation rate subfield(s) FCSm Citations per publication, compared CPP/JCSrn to citation rate of journal packet Citations per publication, compared to citation rates of subfield(s) Citation rate journal packet, compared to citation rate of subfield(s) Percentage self-citations
2,162 1,262 45,170 16,587
20.9 13.1 16.3 10.4
13.0 20.3 19.3 11.7 12.6 7.6 1.08 1.12
CPP/FCSm 1.65 1.73
JCSm/FCSm 1.53 1.54
% SELFC1T 22.0 21.2
As an example, we present in Table 3 the results with respect to the collection of
research groups in the Netherlands, active in the field 'Nucleic Acids Research' . The
first statistic gives the total number of papers published by the group during the
entire period (P). We considered only normal articles, letters, notes and reviews.
Meeting abstracts, corrections and editorials are not included. In a few cases a paper
is published in a journal for which no citation data are available, or that is not
assigned to an ISI journal category. These papers are not considered in the
calculation of the indicators presented in this table. The next two rows give the total
number of citations received (C), and the average number of citations per publication
(CPP). In these figures self-citations are included.
398 Scientometrics 33 (1995)

H. F. MOED et al.: ASSESSMENT OF NATIONAL RESEARCH PERFORMANCE
A self-citation to a paper is a citation given in a publication of which at least one
author (either first author or co-author) is also an author of the cited paper (either
first author or co-author). The fourth indicator is the average number of citations per
publication calculated while self-citations are not included (CPPex). The percentage
of self-citations (relative to the total number citations received) is presented in the
last row of Table 3.
The next indicator is the percentage of articles not cited during the time period
considered (%Pnc). Self citations are included. The sixth indicator gives the mean
citation rate of the journals in which the group has published (JCSm, the mean
Journal Citation Score), taking into account both the type of paper (e.g., normal
article, review, and so on), as well as the specific years in which the group's papers
were published. To give an example, the number of citations received during the
period 1985-1991 by a letter published by a group in 1985 in journal X is compared
to the average number of citations received during the same period (1985-1991) by
all letters published in the same journal (X) in the same year (1985). Generally, a
group publishes its papers in several journals rather than one. Therefore, we
calculated a weighted average JCS indicated as JCSm, with the weights determined
by the number of papers published in each journal. A more detailed example is
presented in the Appendix. The seventh indicator presents the mean citation rate of the subfields (journal
categories) in which the group is active (FCSm, the mean Field Citation Score). Our
definition of subfields is based on a classification of journals into categories developed
by ISI. Although this classification is far from perfect, it is at present the only
classification available to us. In calculating FCSm, we used the same procedure as the
one we applied in the calculation of JCSm, with journals replaced by subfields (see
Appendix). In most cases, a group is active in more than one subfield (i.e., journal
category). In those cases, we calculate a weighed average value, the weights being determined by the total number of papers the group has published in each subfield.
The next indicators cempare the average number of citations to a group's oeuvre
(CPP) to the corresponding journal and field mean citation scores (JCSm and FCSm, respectively), by calculating the ratio for both. If the ratio CPP/FCSm is above 1.0,
this means that the group's oeuvre is cited more frequently than an 'average'
publication in the subfield(s) in which the group is active. FCSm constitutes a world average in a specific (combination of) subfield(s). In this way, one may obtain an
indication of the international position of a research group, in terms of its impact
compared to a 'world' average. This 'world' average is calculated for the total
Scientometrics 33 (1995) 399

H. F. MOED et al.: ASSESSMENT OF NATIONAL RESEARCH PERFORMANCE
population of articles published in ISI journals assigned to a particular subfield or
journal category. As a general rule, about 80% percent of these papers are autliored
by scientists from the United States; Canada, Western Europe, and Japan. Therefore, this 'world' average is dominated by the Western World. If the ratio CPP/JCSm is
above 1.0, the mean impact of a group's papers exceeds the mean impact of all
articles published in the journals in which the particular group has published its
papers (the group's journal packet). Finally, if JCSm/FCSm is above 1.0, the mean
citation score of the journal packet in which the group has published exceeds the
mean citation score of all papers published in the subfield(s) to which the journals belong. In this case, one can conclude that the group publishes in journals with a high
impact. It should be noted that the three last mentioned indicators are dependent
one upon the other. The value of each one of these follows directly from the values of
the other two indicators.
It should be noted that the indicators presented here are highly aggregated
statistics in which much information is lost. If one wishes to assess individual groups,
other bibliometric indicators should be calculated as well, showing more detail and
revealing more information than the overall statistics applied here. In the next
sections we present indicators measuring the position of a group within the scientific journal spectrum (Section 3.3), the cognitive orientation of a group (Section 3.4), the
collaboration with other groups (Section 3.5), and certain publication characteristics
(types of articles published, Section 3.6).
3.3. Position in the journal spectrum
We made frequency tables of the journals in which a group has published, and of the journals from which the group was cited during the total period considered. Table 4 presents the results for a research group in the field of Analytical Chemistry. Inspecting these lists, one may assess for instance whether groups publish in - or are cited from - prestigious journals such as the Lancet, Science or Nature. One may also compare the publishing and citing journal lists one with another. For instance, Table 4 shows that the department hardly publishes in the journal Analytical Chemistry, but it is cited rather frequently in this journal (13% of all citations). In the near future we plan to develop displays in which one may also assess the impact of the journals listed, as well as the journal category to which they belong.
400 Scientometrics 33 (1995)

H. F. M O E D et al.: ASSESSMENT OF NATIONAL R E S E A R C H P E R F O R M A N C E
Table 4
Publishing and citing journals of a department in the field of Analytical Chemistry
Rank Publishing % Publ CITING % CITS journal journal
1 J C H R O M A T 34 J C H R O M A T 15 2 J C H R O M A T - B I O 9 A N A L Y T C H E M 13 3 O R G MASS SP 5 J CHROM-BIO 9 4 B I O M E D ENV 4 J LICE C H R O M 3 5 A N A L Y T CHIM 3 MASS SPECTR 3 6 C H R O M A T O G R 3 C H R O M A T O G R 2 7 J AN AP PYR 3 A N A L Y T CHIM 2 8 INT J MASS 3 J P H A R M B 2 9 J P H A R M B 3 O R G MASS SP 2
10 RAP C MASS 3 BIOMED ENV 2 All other 30 All other 48 (46 journals) (185 journals) Total publications 178 Total Citations 686
3. 4. Indicators of impact and cognitive orientation
All papers by a group are disaggregated into subfields, based on the ISI classification of journals into categories. Typical examples are presented in Figs 3.1 and 3.2.
Figure 3.1 shows that the department of Pharmacology publishes the overwhelming part of its articles in one journal category only: Pharmacology and Pharmacy. The impact of the papers in this category is substantially above world average.
Figure 3.2 relates to a research department in the field Biochemical Pharmacology. In fact, the major part of its papers are published in the categories Pharmacology & Pharmacy and in Biochemistry and Molecular Biology. Interestingly, the impact in the first category is above average, and in the second category near the world average.
Scientometrics 33 (1995) 401

H. F. M O E D et al.: ASSESSMENT OF NATIONAL R E S E A R C H P E R F O R M A N C E
CATEGORY
ANESTHESIOLOGY
8tOCH & MOL BIOL
CARDIOVASC SYST
CHEM, ANALYTICAL
CHEMISTRY
GENETICS & HERED
HEMATOLOGY
MEDICINE, RES
MEDICINE,GENERAL
NEUROSCIENCES
PHARMACOL & PHAR
i P I
i-
0 "100 200 300
NR. PUBL
IMPACT : L----J LOW ~ AVERAGE i HIGH
Fig. 3.1. Output, impact and cognitive orientation of a research depar tment in the field of Pharmacology
Legend to Figs 3.1 and 3.2: The horizontal axis indicates the number of articles published. The vertical axis displays the subfields
(journal categories) in which the group is active. Black coloured bars indicate that the impact of the corresponding articles is substantially above the
world citation average in the corresponding category (to be specific, CPP/FCS > = 1.2). Uncoloured bars indicate an impact below the world average (CPP/FCS < = 0.8), while shaded bars reflect an impact around the world average (0.8 < CPP/FCS < 1.2).
402 Scientometrics 33 (1995)

H. F. MOED et al.: ASSESSMENT OF NATIONAL RESEARCH PERFORMANCE
CATEGORY
BIOCH & MOL BIOL
BIOLOGY
BIOPHYSICS
CANCER
CHEM, ANALYTICAL
CHEM, ORGANIC
CHEMISTRY
CYTOL & HISTOL
GASTROENTEROLOGY
PHARMACOL & PHAR
TOXICOLOGY
|
0 10 20 30 40 50
NR. PUBL
IMPACT : ~ LOW ~;:~.~2x~ AVERAGE ~ HIGH
Fig. 3.2. Output, impact and cognitive orientation of a research department in the field of Biochemical Pharmacology
At first sight the outcomes seem difficult to interpret. We launch the following hypothesis. Research groups may perform multidisciplinary activities. They may be active in one subfield, but apply approaches or methods from other subfields. For instance, a pharmacological group may apply methods from other subfields such as biochemistry and molecular biology. This group may publish partly its own subfield, and partly in the other field. Its papers in its own subfield may be cited frequently (relative to the world average in that subfield), but its papers in the other subfield may to some extent be deviant from the main stream and consequently be cited less frequently than the world average in that other subfield.
Scientometrics 33 (1995) 403

H. F. MOED et aI.: ASSESSMENT OF NATIONAL RESEARCH PERFORMANCE
This hypothesis should be developed further, by studying cases in greater detail,
including background knowledge on the groups' activities. Our preliminary results
suggest that Figs 3.1 and 3.2 may be most useful for the assessment of
multidisciplinary oriented research groups. At present, however, it is not clear to us
how one should construct in operational-numerical terms an indicator based on these
figures. The overall ratio CPP/FCSm introduced in Section 3.2 - in which all
subfields in which a group is active are aggregated using the number of papers in each subfield as weight factor - may not be the most appropriate indicator for the
international position of multidisciplinary oriented groups. Background knowledge
on the group's activities are necessary in order to assess its performance, and it is in
our view questionable whether its performance may be expressed adequately in one
single index.
3.5. Indicators of collaboration
The indicators of collaboration are based on an analysis of all addresses in papers published by a group, We identified first all papers authored by scientists from one group only. To these papers we assigned the collaboration type 'no collaboration'. With respect to the remaining papers we established (on the basis of the addresses) whether authors participated from other groups within the Netherlands (collaboration type within the Netherlands), and finally whether scientists are involved from other groups outside the Netherlands (collaboration type International). If a paper by a group is the result of a collaboration with both another Dutch group and a group outside the Netherlands, it is marked with collaboration type international.
Table 5 shows the results related to the collection of senior scientists active in the
field of chemistry at Dutch universities. The purpose of this indicator is to show how
frequently a group has co-published papers with other groups, and how the impact of
papers resulting from national or international collaboration compares to the impact
of publications authored by scientists from one research group only.
It is interesting to analyse the impact of the articles as a function of the type of
collaboration. All three 'relative' impact indicators - both the average impact of the
papers compared to the impact of the journal packet (CPP/JCSm) or to the world
citation average in the subfields to which the articles are assigned (CPP/FCSm) as
well as the impact of the journal packet compared to the world citation averag~
(JCSm/FCSm) - show the same pattern. They obtain the highest values for papers
resulting from international collaboration, and the lowegt for articles from which no
404 Scientornetrics 33 (1995)

H. F. M O E D et al.: ASSESSMENT OF NATIONAL R E S E A R C H P E R F O R M A N C E
collaboration is apparent in the addresses given in their headings. This pattern has been observed in several other bibliometric studies. 8
Table 5
Indicators of scientific collaboration in Academic Chemistry in the Netherlands (1986-1991)
"l~pe of P(%) C CPP CPPex %Pnc CPP/ cPP/ JCSm/ %SELF collaboration JCSm F C S m FCSm CIT
No 5275 32499 6.2 4.2 25.8 1.08 1.27 1.17 31.5 collaboration (53%) Collaboration 2588 16680 6.5 4.3 26.0 1.12 1.37 1.22 34.1 within the (26%) Netherlands International 2180 19672 9.0' 6.0 23.0 1.28 1.71 1.33 33.1 collaboration (22%)
Legend to Table 5: P: The number of articles published. C: The number of citations received. CPP: The average number of citations per article. CPPex: The average number of citations per article, self-citations not included. %Pnc: The percentage of articles not cited during the time period considered. CPP/JCSm: The average number of citations per article, divided by the mean citation rate of all papers in the journals in which the articles are published. CPP/FCSm: The average number of citations received, divided by the world citation average in the subfields (journal categories) in which the scientists are active. JCSm/FCSm: The mean citation rate of all papers in the journals in which the scientists have published, divided by the world citation average in the subfields (journal categories) in which the scientists are active. %SELFCIT: The percentage of self-citations.
Scientometrics 33 (1995) 405

H. F. MOED et al.: ASSESSMENT OF NATIONAL RESEARCH PERFORMANCE
to .o
to
to
X
[ -
r
:r..g
~.~ e ~
e ~
�9 ~
~'~
~ e
e~
N
0 $ "~ .=
"6
.~.~
-~.~
~.~ ~
6'-6 ~
o o .~ .~ ~ . ~ ~ ~ ' ~
0
.o
.3
cO
0
, .~ r
406 Scientometrics 33 (1995)
H. F. MOED et al.: ASSESSMENT OF NATIONAL RESEARCH PERFORMANCE
3. 6. Indicators of impact and publication type
ISI has classified papers into several types. We consider normal articles, letters, notes, reviews and proceedings papers as regular research publications presenting
original research findings. Table 6 shows a b reakdown of a group's papers into these
five types. F rom these figures one may for instance assess whether a group has
published review articles, or the extent to which the group communicates research
findings in short communicat ions (letters or notes).
3.Z Coverage of the Science Citation Index
The indicators ment ioned above are entirely based on articles f rom our
'Netherlands ' database. In this paragraph we will discuss the coverage of the ISI-
Indexes. As ment ioned in Section 2.5 we conduct a 'verification round ' in which the
scientists involved are requested to check lists of publications extracted from our
publication database and to indicate publications not included in our lists, applying
the following classification scheme: publications in international journals, na t ional journals, proceedings of international conferences, books (thematic collections of
papers or monographies) , research reports, and patents.
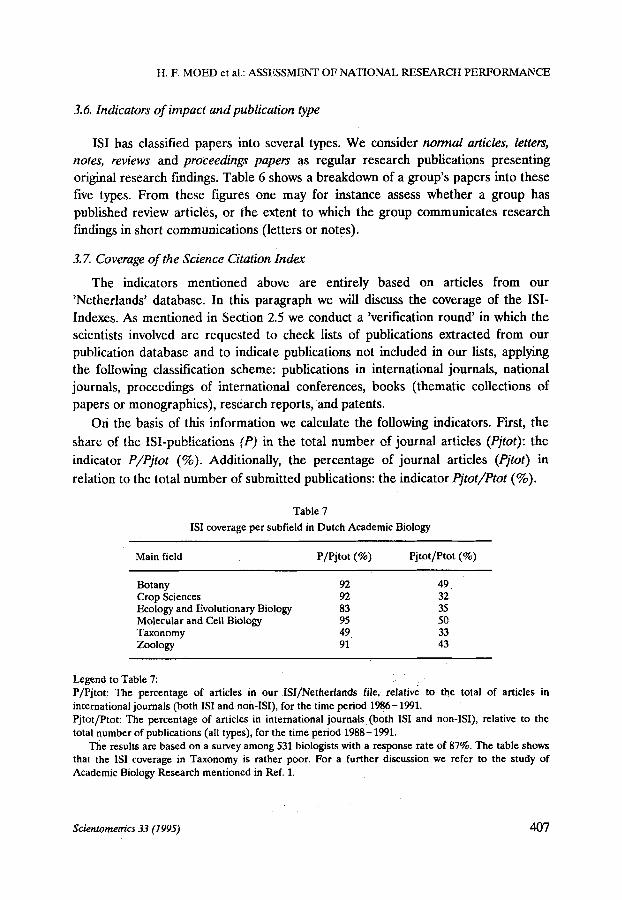
Off the basis of this information we calculate the following indicators. First, the
share of the ISI-pubtications (P) in the total number of journal articles (Pilot): the
indicator P/Pilot (%). Additionally, the percentage of journal articles (Pilot) in
relation to the total number of submitted publications: the indicator Pjtot/Ptot (%).
Table 7 ISI coverage per subfield in Dutch Academic Biology
Main field P/Pjtot (%) Pjtot/Ptot (%)
Botany 92 49 Crop Sciences 92 32 Ecology and Evolutionary Biology 83 35 Molecular and Cell Biology 95 50 Taxonomy 49 33 Zoology 91 ~ 43
Legend to Table 7: P/Pjtot; The percentage of articles in our ISI/Netherlands file, relative to the total of articles in international journals (both ISI and non-ISI), for the time period 1986-1991. Pjtot/Ptot: The percentage of articles in international journals (both ISI and non-ISl), relative to the total number of publications (all types), for the time period 1988-1991.
The results are based on a survey among 531 biologists with a response rate of 87%. The table shows that the ISI coverage in Taxonomy is rather poor. For a further discussion we refer to the study of Academic Biology Research mentioned in Ref. L
Scientometrics 33 (1995) 407

H. F. MOED et al.: ASSESSMENT OF NATIONAL RESEARCH PERFORMANCE
The interpretation of these indicators is not always easy. A high score indicates
that the department concerned mainly publishes in ISI-journals and that this index is
a good source for measuring production and impact. If we presuppose that the ISI has a good coverage of the field, a low ratio P/Pjtot allows us to conclude that the department concerned apparently does not publish in good international journals.
Yet, one could also assume that the coverage of the ISI-Indexes is not adequate and that important (international) journals have been left out. The problem of
inadequate ISI-coverage will particularly arise in scientific fields in which researchers do not publish primarily in a limited number of international (mainly English- language) top journals, but rather in a wide range of periodicals with an often
national scope (including non English-language journals), which are nonetheless of high quality. On closer inspection it turned out that such journals from non English- speaking countries are included in the ISI to a lesser degree, which points to the
problem of a possible Anglo-Saxon (mainly US) bias. 7, 9
Analogous remarks can be made about the ratio Pflot/Ptot. When a department has a low ratio, this may mean that it has barely made its research results known to
its professional colleagues. However, it is also possible than in the scientific field
concerned journals play a less predominant role in the distribution of scientific
knowledge. In some scientific fields the significance of conference proceedings (particularly in engineering), monographs and contributions to compilations is considerable. 9
In practice, the question which interpretation is (most) correct, wi! 1 depend on the field in question. To come to valid judgements it is necessary to have recourse to
experts in the field of ~tudy concerned. Detailed research into global publication habits per scientific field should determine the important journals and should verify
the coverage of the ISI-Indexes.
3.8. A statistical test
In this study we applied a statistical test developed by Glanzel in order to establish whether the average impact of a group's publication oeuvre (CPP) differs significantly from the average impact of all papers in the group's journal packet
(JCSm) or from the world citation average (FCSm) in de subfield(s) in which the group is active. The next paragraphs are based on a note written by GRinzel.
Citation rate data have usually showed discrete frequency distributions. Their averages are, however, approximately normally distributed. As any statistical function
408 Scientometrics 33 (1995)

H. F. MOED et al.: ASSESSMENT OF NATIONAL RESEARCH PERFORMANCE
or empirical data they are subject to random influences. Their random error, which
can be determined from the size of the analysed publication set and the citation
frequency distribution, must be taken into consideration if citation averages are
compared with each other, or with given fixed values. The standard error d(x) of the
mean citation rate x of a research group depends on the size of the group and the
'inequality' of the distribution, in particular.
d(x) = o/x/
where n is the number of papers published by the research group and D the standard
deviation of the citation rates distribution. We say x is significantly greater (less) than
a given f'uced value a at a confidence level of 95% if (x -a ) /d (x ) > 1.96 (or < - 1.96,
respectively). Otherwise the deviation can be considered 'random'. This method can
be applied to the comparison of observed mean citation rates (citation averages) with
their expectations based on journal and/or subfield averages JCSm or F c s m . Since
expected mean citation rates are based on much greater data sets, their random error
is much less then that of citation averages of research groups and can therefore be
neglected. Thus for comparisons expected mean citation rates can be treated as fixed values. For further details concerning the comparison of a citation averages and the
construction of expected mean citation rates we refer to Schubert and Gli~nzel 1~ and to Gliinzel. 11
3. 9. Comparison to indicators proposed by other authors
In the previous sections we have applied several indicators based on the citation
per publication ratio (CPP), the average citation rate of the journals in which a group
has published (JCSm) and of the subfields (journal categories) in which a group is
active (FCSm). Several authors have proposed and applied in the past indicators
which are similar to those applied in this paper.
The indicator JCSm is similar to the Expected Citation Rate (ECR) applied by
Schubert et al. 3 However, there are significant differences between JCSm and ECR.
As illustrated in the Appendix, JCSm is~a-i weighed average citation rate of the
journals in which a group publishes. The weighting factor of a journal is determined
by the number of articles published in that journal. Moreover, we take into account
both the year in which an article has been published, as well as the type of article.
Basically, we calculate for a specific journal citation rates per publication year and
Scientometrics 33 (1995) 409

H. F. MOED et al.: ASSESSMENT OF NATIONAL RESEARCH PERFORMANCE
per type of article. Our ratio CPP/JCSm is similar to the Relative Citation Rate
(RCR) developed by Schubert et al. However, our method of calculating this ratio
differes from the one underlying the RCR. For instance, if the period of analysis is
1987-1991, the citation score of a note published in 1989 in a specific journal is
compared to the average number of citations received by notes published in 1989 in
that journal. We conclude that our indicator CPP/JCSm takes into account
differences in publication strategy (as reflected in article types), and differences in
the age distribution of publications, while the RCR does not. Consequently,
CPP/JCSm seems to be more accurate than the RCR, particularly at the level of
research groups or departments.
Our statistic FCSm gives the average number of citations per publication for all
publications in a subfield, based on journal categories. If a group publishes in several
subfields rather than one, a weighting procedure is applied, similar to the one that
generates JCSm. The idea of constructing and applying average citation rates per
scientific subfield has been explored in the past by several authors. 12 In fact, Vinkler has proposed the Relative Subfield Citedness (Rw), 13 which is similar to our
indicator CPP/FCSm, and the Publication Strategy (PS) similar to JCSm/FCSm. 14 Gl~inzel suggests also a measure similar to PS. 1~ From a technical point of view,.
differences exist between our indicators and Rw and PS, due to the fact that we
calculate with respect to a subfield citation rates per type of article and per
publication year. The main point we wish to make is that impact analyses comparing
CPP with journal citation rates only (CPP/JCSm or ECR) may provide an
incomplete picture of a group's or even a country's impact, and should be
supplemented with indicators assessing (or at least taking into account) the impact of the journals in which the articles are published (CPP/FCSm or JCSm/FCSrn). Narin has also explored the use of journal categories in constructing institute profiles. 5
However, in our methodology we apply journal categories as a secondary entity, in
the sense that our primary tool to define a unit of analysis is a combined analysis of
author names and institutional addresses at the level of research groups.
An interesting question is of course whether JCSm or FCSm is the most
appropriate reference level for CPP. We suggest to use FCSm as the principal
standard. However, if there are strong indications, that the definition of the subfield
in terms of journal categories is inadequate, JCSm is a more appropriate standard.
It should be noted that the relative citation indicators mentioned above relate to
the average impact of all papers published by a group. In the first step, all citations to
a group's oeuvre are aggregated. Next, this total number of citations is divided by the
410 Scientometrics 33 (1995)

H. F. MOED et al.: ASSESSMENT OF NATIONAL RESEARCH PERFORMANCE
size of the oeuvre, i.e., the total number of papers published. The use of an average
score, particularly the citation per publication ratio, has been criticized by several
scientists in the field of evaluative bibliometrics, and also by researchers who were subjected to citation analyses. A formal objection against the use of the citation per
publication ratio is that the distribution of citations amongst papers in a publication
oeuvre is highly skewed, and that the sample mean is not an adequate statistic to characterize such skewed distributions. A more material objection holds that groups may publish papers of high quality, but may also be 'forced' to publish less significant
papers gaining a low impact. Applying the citation per publication ratio, the impact of the highly quality papers may be 'averaged out'. In other words, a citation analysis should assess the impact a group's most significant papers, and not the average
impact of the total oeuvre. Our comments to this criticism are the following. We have performed several
analyses of the distribution of citations amongst papers published by a group. Preliminary results suggest that the mean of the distribution correlates rather well to other statistics of the distribution, such as the median, the percentage of papers not
cited, and the 90th percentile. Provided that the number of papers published by a group is sufficiently high - typically, more than 50 papers in an oeuvre - , we found that groups with a high mean value of citations tend to have a high score on the other
statistics as well. Our conjecture, therefore, holds that the mean citation rate may be
as appropriate as any other parameter of the distribution.
In other words, groups that publish 'extraordinary papers' with a very high citation impact tend to publish 'normal papers' of which the impact is also relatively high, compared to the impact of the 'normal papers' of other groups not publishing
these extraordinary papers. In addition, if a group publishes a disproportional number of papers gaining a relatively low impact, this can be considered as a
significant fact, which is actually reflected in a relatively low citation per publication ratio. We plan to conduct a more detailed analysis on this issue. An important step
would in fact be to develop indicators of the impact of a group's very best articles, and compare the results to those obtained by applying the citation per publication ratio. I t should be noted that the application of other parameters of the citation
distribution than the mean is an important and most valuable element in the work by
Narin and co-workers. 5 �9 In 1992, several publications appeared in the journal Science Watch - published
by the Institute for Scientific Information - in which impact indicators have been calculated for universities or even research departments in the field of chemistry. For
Scientometrics 33 (1995) 411

H. F. MOED et al.: ASSESSMENT OF NATIONAL RESEARCH PERFORMANCE
instance, in Vol. 3, no. 3 of Science Watch (April, 1992), rankings were published on
the top 25 universities in the subfield (i.e., journal category) organic chemistry and
analytical, inorganic and nuclear chemistry. 15 Publications were assigned to
universities on the basis of an analysis of the addresses of the contributing authors.
We have very strong indications that ISI has made several severe errors in their
assignment of papers to universities. ISI has not taken into account all variations
under which the name of a university appears in the addresses. For instance, ISI
seems to have missed an important variation in the name of the University of Leiden.
As a consequence, the number of papers assigned to this university in the field
analytical, inorganic and nuclear chemistry is much too low,
A second point of criticism on the rankings published by ISI relates to the type of
impact indicators constructed. They calculate only the citation per publication ratio.
As discussed in Section 3.2, in our view it is more appropriate to apply impact
indicators in which this citation per publication ratio is 'normalized', by comparing
this ratio to an average citation rate of all papers in the journals or in the subfields in
which a research department is active. Our points of critique apply also to the
rankings of European countries and universities in the field of chemistry presented by Bradley. 16
4. Applications
In our view, the indicators discussed in the previous sections may be applied properly at the level of individual research groups only if one combines the bibliometric outcomes with background knowledge on the group and on the subfield(s) in which it is active. In order to obtain a more complete picture of a group's performance, bibliometric indicators should be complemented with input indicators, particularly those reflecting the number of senior scientists involved, the number of research students, and grants from external organizations such as research councils or industries. Thus far, every attempt to construct one single bibliometric index indicating a group's international position or quality seems to have failed. Moreover, in the bibliometric literature no justification can be found for an attempt to draw definite conclusions on a research group's performance merely on the basis of bibliometric indicators. This is due to the fact that publication and citation are to be conceived as highly complex processes. The quality or international position of a group is an important factor in determining the publication output and citation rate of a group, but it is d~finitely not the only factor. 17, 7
412 Scientometncs 33 (1995)

H. F. MOED et al.: ASSESSMENT OF NATIONAL RESEARCH PERFORMANCE
Bibliometric indicators gain both validity and usefulness if one considers sufficiently large samples of research groups and analyses patterns in the scores of these groups, by relating the bibliometric statistics per group to other characteristics such as the size of the group, the amount of financial support received from Research Councils, the main organization in which it is located (e.g., university, faculty) or the group's cognitive orientation (e,g., discipline Or subfields in which it is active).
In this chapter we give two applications of the database and methodology outlined above. Other interesting applications were achieved in bibliometric studies of the Faculties of Sciences and Medicine at three Flemish Universities. 18
4.1. A bibliometric analysis of the field Medical Pharmacolog~ at Dutch Universities
On the basis of an analysis of the addresses in articles included in our publication
database we selected alI papers authored by scientists in the departments of medical pharmacology at eight Universities in the Netherlands. We performed a bibliometric analysis of the type outlined in Section 3.4, focusing on the production, cognitive
orientation and impact of each department. The data relate to the time period 1980-1989. The results are presented in Fig. 4.
This figure gives a three-dimensional plot, in which the horizontal axis indicates
the universities involved. Since the purpose of the analysis is to give a first overview of the field medical pharmacology, the names of the universities are replaced by abstract symbols to assure anonimity.
Figure 4 shows a rather positive picture of the impact of academic medical
pharmacology during the 1980's in the Netherlands. In the most important category, Pharmacology & Pharmacy, six departments have a high impact, and two an average
impact. There are considerable differences in cognitive orientation among the eight
department involved. Some departments are - apart form their core activities, also oriented towards the neurosciences, other groups towards the cardiovascular system or endocrinology and metabolism, and in these categories the impact is in most cases
substantially above world average. In our view, graphical displays of the type presented in Fig. 4 contain much more information than the indicators presenting
overall statistics per country and per journal category, and constitute a good alternative to these 'classical' macro indicators. First of all, the analyses underlying Fig. 4 relate to research activities that can be located properly. In other words, there
is a clear relationship between output and the institutional spheres producing that
output. In the classical macro indicators this relationship is often less clear. Secondly,
Scientometrics 33 (1995) 413

H. F. MOED et al.: ASSESSMENT OF NATIONAL RESEARCH PERFORMANCE
A B C D E F G H
UNNERSlTY
IMPACT ~ AVERAGE ~ HIGH t : : : ~ I . o w
Fig. 4. Output, impact and cognitive orientation of the Departments of Medical Pharmacology at 8 Dutch Universities
Legend to Fig. 4: The horizontal axis displays the Universities involved. The vertical axis indicates the number of
articles published. The third axis presents the journal categories in which the various departments are active. The numbers printed in a cell indicate the number of articles published by a specific department in a specific category.
Black coloured bars indicate that the impact of the corresponding articles is substantially above the world citation average in the corresponding category (to be specific, CPP/FCS >__ 1,2). Uncoloured bars indicate an impact below the world average (CPP/FCS < 0.8), while crossed bars reflect an impact around the world average (0.8 < CPP/FCS < 1.2).
Fig. 4 gives an overall picture of the state of a subfield, but in such a way that the
distribution of the output and impact among the various units active in the subfield,
can be assessed as well. In this way, one is able to assess the activities and their
impact in a subfield, and distinguish for instance between fields in which one or two
groups generate a high impact and other groups a low impact, and fields in which the
impact is more evenly distributed among the participating groups. This type of
information is in our view very useful, particularly in a 'macro ' analysis. Finally, Fig. 4
414 Scientometrics 33 (1995)

H. F. MOED et al.: ASSESSMENT OF NATIONAL RESEARCH PERFORMANCE
shows also the relations, built by the participating groups, between scientific
subfields, while in the macro indicators currently applied such relations are absent.
Our approach represents a synthesis of 'classical' macro indicator studies at the one
hand and bibliometric analyses of research groups or institutes at the other.
4.2. The position of the Public and the Private Sector in the Netherlands
To our knowledge, this is the first study presenting detailed results of the
publication output per institutional sector at a national level. It was conducted in
1991. The data relate to the time period 1980-1989, and to papers included in de
SCI. Tables 8 and 9 show that the shares of the four main sectors in the total output
remain at a constant level during the i980s: 76% for Higher Education, 17% for the
Rest of the Public Sector, 6% for the Private Sector and 0.3% for the Intermediate
Sector. Universities appear to be almost exclusively responsible for the output in
Higher Education. The role of university research is strongest in the biological sciences and in mathematics & computer science (over 80%). It is about average in
chemistry, physics, astronomy & space science and in general medicine, and relatively
weak in engineering~ environmental sciences and agricultural & veterinary sciences. However, even in the latter fields the share of university research is still between 50
and 60%.
Research institutes appear to be the most important in the non-educational part
of the public sector. These institutes are responsible for 69.8% of the output in this
sector and 12.1% of the total output over the entire period. Between 1980 and 1983
these percentages decreased from 74.3% to 69.4% and from 12.8% to 11.8%
respectively, remaining more or less stable for afterwards. The publicly financed
research institutes are strongly concentrated in the environmental and life sciences. In
environmental sciences and in agricultural & veterinary sciences these institutes play an important part in the total output with 34.7% and 32.2% respectively. As we have
seen, university research is relatively weak in these two main fields. Institutes of the Netherlands Organisation for Applied Research (TNO), the National Institute for Public Health and Environmental and Agricultural Research Institutes are important
contributors to the publication output of the research institutes in environmental and
agricultural sciences. These two fields are the only ones where government
departments have a share of more than 1% (mainly from The Department of Public Works and Food Inspection Services). In general, we have found very few government
departments in the corporate addresses: 0.5% and no trend.
Scientometrics 33 (1995) 415

H. F. MOED et al.: ASSESSMENT OF NATIONAL RESEARCH PERFORMANCE
"E
0
Z Z ~
~ 0 0
I N I ~ ~ I ~ N - - - - ~ . . . . + . . . . § . . . . §
. ~ 1 I I I
~ : ; : - - - + . . . . I = - - - $ = - - - + I I I
I ~ I N I N
< = ' ~ ~ : - - - - § - - - - ~ - - + . . . . + - - ~ - - - - + - - - - - - - - +
z m , + + = m + < + + m + � 9 m ~
- - + . . . . . ~ - - - . . . . . ? . . . . .
~ . . . . . . , . . ,
m - - - - + . . . . + - - - - ~ - - @ . . . . + - - ~ - - - - @
I t I I
~ I I I I
- - - - + . . . . + . . . . + - - - - - - - - + . . . . +
~ - - - - - - ~ @ . . . . + . . . . @ - - - - - - - - @ +
I 1 . -
(J
I t l
i r . ~ i I Icl I I / I I
I
" t U I ~ , - U.I l , ~ C I
I k, l
UJ L W = ~ , , . I .~
416 Scientometrics 33 (1995)

HI F. M O E D et al.: ASSESSMENT OF NATIONAL RESEARCH P E R F O R M A N C E
e~ ,m
Z Z ~
~ U
N ~
I § . . . . § . . . . § . . . . O I I ~ § I I I I I
. . . . . . . I N * * * 1 I *
, N I , ~ , , I § . . . . § . . . . + . . . . § . . . . §
I I I
~ I ' . . . . I
_ § . . . . + . . . . . . . . . + . . . .
i
. . . . I . . . . . .
I l I
- § 2 4 7 . . . . + . . . . + . . . . § I I
' ~ ~ ' ~ ~ I �9 . . . . ~ ~ 1 7 4 ~ , ~ I . . . . . , ~ �9
| 1 7 4 ~ I ~ " ~ ~ ~ ~ 1 7 6 1 7 6 ~
+
~ § . . . . ~ . . . . § 2 4 7
I . . . . l �9 �9
I § 2 4 7 . . . . § 2 4 7 . . . . § I I
. . . . . . . . . . 2 . . . . i
l | I
- ~ _ _ _ _ § " ~ - ~ . . . . . . . . + . . . . +
i I , - I U
I - I I/1
U I U
* . J
t ,J
l . )
7=
Scientometric s 33 (1995) 417

H. F. MOED et al.: ASSESSMENT OF N A T I O N A L R E S EARCH P E R F O R M A N C E
The role of international organizations is limited as well (a stable 0.7%). Only in astronomy & space sciences (10.7%) and in engineering (4.3%) these organizations have a share of some importance. The ESTEC establishment of the European Space Agency (ESA) in Noo~rdwijk and the CEC Joint Research Centre in Petten are important contributors. In fact these are research institutes, differing from the category mentioned above only by their international affiliation. Of the remaining types of institutes in the public sector the category museums & libraries is negligible (0.1%). The category Non-academic Hospitals (3.9%) is, as to be expected, concentrated in the main fields general medicine and biological sciences, where it constitutes 9.6% and 2.1% of the total output in the respective fields. In all other fields the role of non-academic hospitals and comparable health institutes is negligible (less than 1%). The share of non-academic hospitals in the scientific output of the Netherlands seems to have increased during the 1980s: from 3.0% in 1980 to 4.2% in 1989. This increase ties in with the rapid growth rate of Dutch research output in the medical field. Within this field the share of the hospitals fluctuated during the 1980s.
The share of the private sector is 6.1% over the whole period and fluctuates without a visible trend. Publications are mainly in the field of engineering (32.7%) and to a lesser extent to chemistry (22.8%), physics (17.7%) and general medicine (13.1%). Only in engineering companies play an important role (25% of the total output). In chemistry (12.2%) and physics (11.1%) their share is smaller, but still good for a second rank position (before the research organizations). In environmental sciences, companies are on a third position with 6.3%. In all other fields their share is less than 5%. The role of the intermediate sector is extremely limited (0.3%), Publications from this sector are concentrated in the field agricultural & veterinary sciences, where they constitute 4.7% of the output. The Veterinary Health Services, in which both government and private sector participate, are mainly responsible for this figure.
We are grateful to Prof. Dr. A. F. J. van Raan for his efforts to establish the contract with the Netherlands Organization for Scientific Research (NWO) that enabled us to conduct this study. We acknowledge NWO for financing the database and a substantial part of the work involved in the development and application of the new bibliometric indicators. Moreover, we acknowledge the Dutch Ministry of Education and Science for financing the activities involved in the analyses per institutional sector. We are grateful to Dr. G. van Ark (NWO) for his st imulating contribution to the development and exploration of the new bibliometric indicators. In addition, we acknowledge 1. Vriend, J. /t. Schoneveld, L. Pill, Z Beerens, S. Linnemann, A. Rarnaekers, and P. Negenborn at CWTS for their important contributions to the creation of the database and the software.
418 Scientometrics 33 (1995)

H. F. MOED et al.: ASSESSMENT OF NATIONAL RESEARCH PERFORMANCE
References
1. This paper is based on the following two publications: H. F. MOED, R. E. DE BRUIN, J. BEERENS, J. A. SCHONEVELD, I. VRIEND (1992), A Bibliometric System for the Assessment of National Research Performance: Database Description and First Application. Research Report to the Netherlands Organization for Scientific Research, Report CWTS 92-03, Centre for Science and Technology Studies (CWTS), Leiden, 1992, 32 pp. R. E. DE BRUIN, H. F. MOED, J. A. SCHONEVELD (1992), Scientific Cooperation between the Public and Private Sector in the Netherlands (1980-1989). Report prepared for the Netherlands Ministry of Education and Science, Report CWTS 92 - 04, Centre for Science and Technology Studies (CWTS), Leiden, 32 pp. In addition, we present outcomes from the following other publications: H. F. MOED, J. G. M. VAN OER VELDE (1993), Bibliometric Profiles of Academic Chemistry Research in the Netherlands, Research Report to the Netherlands Foundation for Chemical Research (SON), and to the Netherlands Organization for Scientific Research (NWO), CWTS, Report CWTS 93-08, Centre for Science and Technology Studies, Leiden, 107 pp. H. F. MOED, A. M. P. H. RAMAEKERS (1994), Bibliometric Profiles of Academic Biology Research in the Netherlands. In: Netherlands Biology in the Nineties, Association of Universities in the Netherlands (VSNU), Utrecht, (ISBN 90- 801015- 7-5), 76 pp. H. F. MOED (1993), Bibliometric Indicators of Medical Research (in Dutch), Research Report to the Netherlands Organization for Scientific Research, Report CWTS 93-01, Centre for Science and Technology Studies (CWTS), 30 pp. Other publications within the framework of the NWO project are the following: A. J. NEDERHOF, A. STRAATHOE (1993), Productivity and impact of economic sciences in The Netherlands, Research Report to The Netherlands Organization for Scientific Research (NWO), The Hague. Report CWTS 93-02, Centre for Science and Technology Studies (CWTS), Leiden, enlarged version 1994, 53 pp. m. J. NEDERHOE, A. M. P. H. RAMAEKERS (1993), A bibliometric study of linguistics projects funded by the NWO Stichting Taalwetenschap, 1980-1989. Research Report to The Netherlands Organization for Scientific Research (NWO), The Hague. Report CWTS 93-04, Centre for Science and Technology Studies (CWTS), Leiden, 19 pp. R. J. W. TIJSSEN. A. STRAATHOF (1993), Bibliometric Mapping of Dutch Research in the Geosciences (in Dutch), Research Report to The Netherlands Organization for Scientific Research (NWO), The Hague. Report CWTS 93-06, Centre for Science and Technology Studies (CWTS), Leiden, 30 pp.
2. Verkenningscommissie Biochemie (National Survey-Committee on Biochemistry) Over Leven, Staatsuitgeverij, The Hague, 1982.
3. A. SCHUBERT, W. GLA.NZEL, T. BRAUN, Scientometric data files. A comprehensive set of indicators on 2649 journals and 96 countries in all major science fields and subfields 1981 - 1985, Scientometrics, 16 (1989) 3-478.
4. T. BRAUN, W. GLANZEL, H . MACZELKA, m. SCHUBERT, World science in the eighties. National performance in publication output and citation impact, 1985-1989 versus 1980-1984, Part I. All science fields combined, physics and chemistry, Scientometries, 29 (1994) 299 - 334.
5. F. NARIN, Evaluative Bibliometrics: The Use of Publication and Citation Analysis in the Evaluation of Scientific Activity, Washington DC., National Science Foundation, 1976.
6. R.E. OE BRUIN, H. F. MOED. The unification of addresses in scientific publications. In: L. EGGHE, R. ROUSSEAU (Eds), Informetrics 89/90. Selection of papers submitted for the 2nd International Conference on Bibliometrics, Scientometrics and lnformetrics, London, Ontario, Canada, 5 - 7 July 1989. Elsevier Science Publishers, Amsterdam, 1990, 65 - 78.
7. H.F. MOED, W. J. M. BURGER, J. G. FRANKFORT, A. F. J. VAN RAAN, The use of bibliometric data for the measurement of university research performance, Research Policy, 14 (1985) 131 - 149.
8. F. NAR1N, E. S. WHITLOW, Measurement of Scientific Cooperation and Co-authorship in CEC related Areas of Science, Office for Official Publications of the European Communities, Luxemburg, EUR 12900, 1990.
9. H.-J. CZERWON, F. HAVEMANN, Influence of publication languages on the citation rate of scientific articles: A case study on the basis East German journals, Scientometrics, 26 (1993) 51 -64.
Scientometrics 33 (1995) 419

H. F. MOED et al.: ASSESSMENT OF NATIONAL RESEARCH PERFORMANCE
10. A. SCHUBERT, W. G ~ Z E L , Statistical reliability of comparisons based on the citation impact of scientific publications, Scientometrics, 5 (1983) 5 9 - 74.
11. W. GLANZEL, Publication dynamics and citation impact: A multi-dimensional approach to scientometric research evaluation. In: P. WEINGART, R. SEHRINGER, M. WINTERHAGER (Eds), Representations of Science and Technology, DSWO Press, Leiden 1992, 209-224. Proceedings of the International Conference on Science and Technology Indicators, Bielefeld (Germany), 10-12 June, 1990.
12. P. VINKLER, Bibliometric features of some scientific subfields and their scientometric consequences there from, Scientometrics, 14 (1988) 453-474.
13. P. VXNKLER, Evaluations of some methods for the relative assessment o f scientific publications, Scientometrics, 10 (1986) 157-178.
14. P. VINKLER, Bibliometric analysis of publication activity of a scientific research institute, In: Informetrics 89/90, L. EGGHE, R. ROUSSEAU (Eds), Elsevier, Amsterdam, 1990.
15. D . A . PENDLEBURY, Chemist~y that counts: The frontrunners in four fields, Science Watch, 3, (3) (1992) 1 - 2. \
16. D. BRADLEY, European elites envy American cohesion, Science, 260 (1993) 1738-1739. 17. B. R. MAR~N, J. IRVlNE, Assessing basic research. Some partial indicators of scientific progress in
radio astronomy, Research Policy, 12 (1983) 61 -90, 18. R .E . DE BRUIN, A. tINT, M. LUWEL, H. F. MOED, A study of research evaluation and planning -
The University of Ghent, Research Evaluation, 3 (1993) 1 - 14.
420 Scientometrics 33 (1995)

H. F. M O E D e t al.: ASSESSMENT OF NATIONAL RESEARCH PERFORMANCE
Appendix Counting scheme applied in the calculation of journal and subfield citation rates
We explain the counting scheme by means of an example. Suppose we have a research group that has published 4 papers: I, II, III and IV, specified in Table A1 below.
Table A1
Characteristics of four papers
paper type publ. year journal journal nr citations category until 1991
I review 1981 CANCER RES Cancer 17 II note 1986 J CLIN END Endocrinology' 4 III normal 1987 J CLIN END Endocrinology 6
article IV normal 1987 J CLIN END Endocrinology 8
article
For the calculation of JCSm (the average citation rate of the journal packet) we look up for paper I the average number of citations received during the period 1981:1991 by reviews published in CANCER RES in 1981. This ratio appears to be 16.9. For paper II, we look up the average number of citations received during the period 1986-1991 by notes published in J CLIN END in 1986 (value: 3.1). For papers III and IV, we determine the average number of citations received during 1987-1991 by normal articles, published in J CLIN END in 1987 (value: 4.8). We indicate the average number of citations per publication for a particular type of article published in a particular journal in a specific year as JCS (Journal Citation Score).
Next, we look up for the category cancer (assigned to the journal CANCER RES) the average number of citations received during the period 1981-1991 by all reviews
published in the category in 1981 (value: 23.7). similarly, we determine the average number of citations received during the period 1986-1991 by all notes published in the subfield endocrinology in 1986 (value: 3.0) and the average number of citations received during the period 1987-1991 by all normal articles published in 1987 (value: 4.1). The average number of citations received on average by a particular type of paper in a subfield and published in a specific year will be symbolized by FCS (Field Citation Score).
Scientometrics 33 (1995) 421

H. F. MOED et al,: ASSESSMENT OF NATIONAL RESEARCH PERFORMANCE
The results thus far may be summarized in the Table A2.
Table A2 Citation, journal citation and field citation scores
Paper Nr. JCS FCS citations
I 17 16.9 23.7 II 4 3.1 3.0 III 6 4,8 4,1 IV 8 4,8 4.1
The average number of citations to the group's oeuvre (CPP) is calculated in the
following manner:
CPP = ( 1 7 + 4 + 6 + 8 ) / ( 1 + 1 + 1 + 1 ) = 8.6
The average citation rate of the journals in which the group has published (JCSm)
is calculated in the following way:
JCSm = [(1 • 16.9) + (1 • 3.1) + (2 • 4.8)]/(1~- 1 + 2) = 7.4
Similarly, the average citation rate of the subfields in which the group has
published (FCSm) is given by:
FCSm = I(1 • 23.7) + (1 • 3,0) + (2 • 4 .1)] / (1+ 1+ 2) = 8.7.
422 Scientometrics 33 (1995)
Recommended


