
On selecting Gabor features for biometric authentication
Loris Nanni, Alessandra Lumini
DEIS, IEIIT – CNR, Università di Bologna
Viale Risorgimento 2, 40136 Bologna, Italy
Abstract
In this paper we describe a Gabor feature selection technique that allows to develop a fast and
robust Gabor feature based biometric system.
Existing Gabor based methods use a huge number of Gabor features to represent the patterns,
our experiments on different biometric characteristics show that using only few (~ten) Gabor
features it is possible to achieve a very low Equal Error Rate.
In this work, we propose a multi-matcher system where each matcher is trained using a single
Gabor Filter (with a given scale and orientation) convolved with a sub-image of the whole image,
and the matchers are finally combined using the “Sum Rule”. Only a low number of Gabor Filters
and sub-images, selected by running the Sequential Forward Floating Selection (SFFS), are
exploited in the fusion step. The system has been tested on two biometric traits: Ear Authentication
and Finger Authentication. The experimental results show the effectiveness of the feature selection
in terms of Equal Error Rate and Area Under The ROC curve.
KeyWords: Gabor features; Feature Selection; Ear Authentication; Finger Authentication.
1. Introduction
Despite robustness, Gabor filter based feature selection methods are normally computationally
expensive due to the high number of filters used and the resulting high dimensional Gabor features.
Some relevant publication in biometry about Gabor filters are: [22] (Fingerprint); [23] (Face). To
reduce feature dimension, a sampling method is proposed in [9] which selects ‘optimal’ positions
on a face where convolving the filters and extracting Gabor features. The same set of Gabor filters,
1

which might be not appropriate, is applied at different locations on the face. A genetic algorithm
has also been used to select Gabor features for pixel classification [11] and vehicle detection [10].
In [12] the authors propose an AdaBoost-based Gabor feature selection algorithm for Face
Recognition, namely, the Mutual-Boost algorithm, where the mutual information between a
candidate weak classifier and the selected weak classifiers is examined to avoid redundant
classifiers.
In this paper, we study the benefits of selecting only a small subset of Gabor Filters. We show
that an ensemble of classifiers, where each classifier is trained using a single Gabor Filter, selected
running the Pudil’s feature selection method [6]. permits to improve the performance of a biometric
authentication system, both in term of Equal Error Rate (the standard biometric performance
indicator) and computational time. Experimental results on biometric authentication, obtained
within two different type of biometric characteristics: finger and ear, show that few (~ten) Gabor
filters are enough to achieve high performance. In this way a significant reduction in computation
and memory cost has been achieved.
With respect to the work proposed in [12], where the AdaBoost is used to select the 200 most
important Gabor features from a pool of 163840 and then these features are used to build a
Generalized Discriminant Analysis subspace (GDA), we have an extremely lower search space of
about 1000 elements (see Section 3.1) and a very reduced feature space of about 10 features. In this
way the selection is computationally feasible by running [6]. Please note that the AdaBoost is used
to select directly the features, while the proposed method select the filters (for this reason we have a
search space of about 1000 elements).
Moreover the results explained in [12] do not show a drastic increase of the accuracy with
respect to that obtained by a GDA performed extremely on the whole set of Gabor Features; on the
contrary our experiments show that our method permits a reduction of the Equal Error Rate with
respect to that obtained by other state-of-the-art-works in Ear and Finger authentication.
2

In [25] we propose a local approach of 2D ear authentication. A multi-matcher system is
proposed where each matcher is trained using features extracted from a single Sub-Window of the
whole 2D image. Only the best matchers, selected by running the Sequential Forward Floating
Selection (SFFS), are exploited in the fusion step and combined using the “Sum Rule”. We show
that using few (~ten) Sub-Windows it is possible to achieve a very low Equal Error Rate. In [25]
SFFS selects the most important region of the EAR, in this paper we select directly the better filters,
in this way it is possible to choose more precisely the discriminant area of the image.
The paper is organized as follows: in section 2 the Related works are reported, in section 3 the
new technique is reported, in section 4 experimental results are presented. Finally, in section 5 some
concluding remarks are given.
2. Related work
In this section we briefly review some recent works concerning finger and ear authentication
in order to make possible an experimental comparison.
A number of biometric characteristics can be extracted from an image of a hand: Palmprint
[2]; Hand vein; hand geometry [14]; images of the fingers. To our knowledge few papers (e.g. [1]
[2]) study the images of the fingers as a biometric characteristic. In [2] it is reported that the image
of the middle-finger projected onto a lower dimensional subspace by Karhunen-Loeve transform
permits to obtain performance higher than that obtained by a palm matcher. In [1] it is shown that
the lines in the inner skin of knuckle of the finger (named Knuckleprint) may be used for
identification.
Few works (e.g. [4][5][7]) study the ear as a biometric characteristic. [4] and [5] have
surveyed the small literature on ear biometrics. Both conclude that the state-of-the-art of image
based ear biometric is the Principal Component Analysis (PCA) when the first eigenvectors are
3

dropped. Recently, [7] shows that Independent Component Analysis outperforms PCA, but the
authors do not discard the first eigenvectors. In [25] we have proposed a local approach of 2D
image-based ear authentication. However, the performance of Image-Based Ear biometrics are
dramatically lower than that obtained matching the 3D data [4].
3. System description
The performance of an authentication system strongly depends on the goodness of the
extracted features. Several system are designed to retain a huge number of features with the aim to
decrease the classification error. We argue that in several applications a feature selection method
may be very useful both to reduce the number of retained features and thus the computational
complexity of the system and to improve the performance [24]. In this work we propose a feature
selection among a wide set of features obtained as the response to a set of Gabor Filters given from
fixed sub-windows of the whole image [16]. Due to the different characteristics of the Gabor Filters
used and to the different information carried out by the Sub-images involved in the convolution
process, we expect to obtain a good representation of the biometrics used.
The proposed biometric authentication system, whose block-diagram is shown in Figure 1, is
composed by 4 steps: localization and image pre-processing, feature extraction, feature selection,
classification and fusion. Please note that the feature selection is performed only during the training
step, in the testing phase from each image only the filters selected in the training step are used for
the identification.
In the image-acquisition phase, an image is taken using a low-cost scanner. Then the area of
interest (finger or ear) is extracted and processed to reduce the lighting effects. For the finger image
a localization step (figure 2) is performed to extract the middle finger from the hand image using a
method similar to that used in [1]. The acquired image is filtered using a Gaussian low-pass filter
and binarized by the global image threshold Otsu's method [20]. The ear image is normalized by the
4

method used in [8] and enhanced by a Contrast-Limited Adaptive Histogram Equalization1, whereas
the finger image is enhanced using Contrast-Limited Adaptive Histogram Equalization and Adjust
image intensity values2.
The feature extraction consists in the response to a set of Gabor Filters given from fixed sub-
windows of the whole image. Feature selection is performed (only during the training step) by
running Sequential Forward Floating Selection (SFFS)3 for selecting the best Gabor filters and sub-
windows. Finally the matching step is performed by means of a simple 1-nearest neighbour
classifierError: Reference source not found [3] and the matchers’ response are combined by the
Sum Rule [25].
Figure 1. Block-diagram of the proposed biometric authentication system.
1 implemented as in adapthisteq.m of the Matlab 7.0 Image Processing Toolbox2 Implemented as in the functions imadjust.m and adapthisteq.m of Matlab 7.0 Image Processing Toolbox3 implemented as in PrTools 3.1.7 ftp :// ftp .ph.tn.tudelft.nl/pub/bob/prtools/prtools3.1.7
5
Image processing
Image
Image Pre-Processing
FeatureExtraction
Feature Selection
Classification and Fusion
Gabor Filters
Sequential Forward Floating Selection Nearest Neighbour
classifier
Sum Rule
k-th matcher
First matcherNearest Neighbour classifier
Datum Points
(a) (b) (c)

Figure 2. a) Hand Image; b) Datum Points and localization of the ROI; c) Finger Image.
3.1 Feature Extraction
Feature extraction is performed by using a bank of Gabor filters of different scales and
orientations [16] (as in [25]). In the spatial domain, the 2D Gabor filter is a Gaussian kernel
function modulated by a sinusoidal plane wave [13]. The filters are applied at fixed positions, in
correspondence of the nodes of a square-meshed grid superimposed to the image (see Figure 3).
Image features are extracted by convolving the image with Gabor filters (see Figure 4). The
parameters chosen for feature extraction are reported in Table 1. To reduce the computational issue
each convolved image is resized to 1212 and then the classifiers are trained using this image.
Since the dimensions of the segmented images can vary, they have been resized to the
dimension 150100 (EAR) or 300100 (FINGER) by nearest neighbour interpolation4.
Table 1. The values of the main parameters.
From the Table 1 it is clear that the search space in the EAR dataset is 800 (800=51016),
while the search space in the FINGER dataset is 2000 (2000=52516).
4 This method is implemented as in the function imresize.m of Matlab 7.0
Feat
ure
extr
actio
n
grid nodes 510 (Ear) 525 (Finger)
GaborFilterSize 50
Gabor filters standard deviation 5, 10, 15, 20
Gabor filters orientations 0, , ,
6

Figure 3. Square-meshed grid superimposed to the Ear image and to the Finger image.
Figure 4. Image, Gabor filter and convolution result.
3.2 Feature Selection
Sequential Forward Floating Selection (SFFS) [15] is a top down search that successively
delete features from a set of original candidate features in order to find a smaller optimal set of
features [25]. With SFFS the best feature subset Sk of size k, is constructed by adding a single
feature to the subset Sk-1 , with k-1 initially equal to 0, that gives the best performance for the new
subset. At this point, each feature in Sk is excluded, and the new set S’k-1 is compared with Sk-1. If
S’k-1 outperforms Sk-1, then it replaces Sk-1.
4. Experiments
The EAR database [17] here used contains 459 images from 113 users, with 3 to 9 samples for
each user. The FINGER database here used contains 720 right-hand images, 10 samples from each
user, for 72 users; our tests have been conducted using the middle-finger. In Figure 5 we show some
samples from both the datasets.
7

Figure 5. Examples from both the datasets.
Our results on both databases have been averaged over ten experiments. For each experiment
on the EAR database, we randomly extract one sample from each user and we use these samples as
training set, all the others samples belong to the test set; on the FINGER database we randomly
resample the learning and the test sets (each containing five images from each user).
For the performance evaluation we adopt the Equal Error Rate (EER) [19], and the area under
the Receiver Operating Characteristic curve (AUC) [18]. EER is the error rate where the frequency
of fraudulent accesses (FAR) and the frequency of rejections of people who should be correctly
verified (FRR) assume the same value. The point of intersection of the two curves FAR and FRR
denotes the EER. It represents the intrinsic error of the system, and it is usually considered a good
indicator of the performance of a biometric identification system [21]. Our approach was tested
using a protocol similar to FVC2004 [19], by performing the following matching attempts:
• genuine recognition attempts: each image in the test set is matched against the remaining
impressions of the same user (in the training set);
• impostor recognition attempts: each ear in the test set is matched against all the template of
the other users in the training set.
8

AUC is a two-dimensional measure of classification performance that plots the probability of
classifying correctly the genuine examples against the rate of incorrectly classifying impostors
examples.
The fitness of the SFFS is computed as the average EER achieved throughout 10 experiments
(different from the 10 experiments used in the testing).
4.1 Experiments on Ear
The tests reported in Figure 6 are aimed to compare the ear verification performance gained
by our complete systems as a function of the number k matchers selected by SFFS. Due to
computational issue we run SFFS until k=30, in Figure 6 we plot the EER obtained for k<=10 since
the EER obtained with k>10 & k<30 is quite similar.
Figure 6. EERs obtained by the ensemble as a function of the number k of retained Gabor Filters.
The results reported in Table 2 are aimed to compare several ear verification methods. In
particular we test the following methods:
OUR(k) denote the fusion of k classifiers selected by SFFS;
OUR(ALL) denote the fusion of all the classifiers trained using the Gabor Features;
PCA-x denotes the state-of-the-art PCA approach [5] trained by grey-level pixels
(GR), where the first x PCA dimension are discarded;
9
k= 0
2
4
6
8
10
12
1 2 3 4 5 6 7 8 9 10
EAR Verification
EER=

ICA denotes the approach proposed in [7] and it is based on the Independent
Component analysis;
ADA denotes the approach proposed in [12], AdaBoost is used to select the 200 most
important Gabor features.
Table 2. Performance obtained by the methods tested in this paper.
In Figure 7, we show the best 10 Gabor filters (and the respective sub-images) SWs selected
by SFFS. Please note that these 10 Gabor filters are the same for all the users of the database.
Figure 7. The best 10 Gabor filters (second row), and the respective sub-images (first row), selected
by SFFS.
In Figure 8 we plot the ROC curves (FAR vs FRR) of OUR(10) and OUR(ALL).
Methods PC-0 PC-5 ICA [25] ADA OUR(10) OUR(ALL)
EER 13 7 15 4.04 9 3.4 9
AUC 5 3.7 5.3 3 4.8 2 5
10
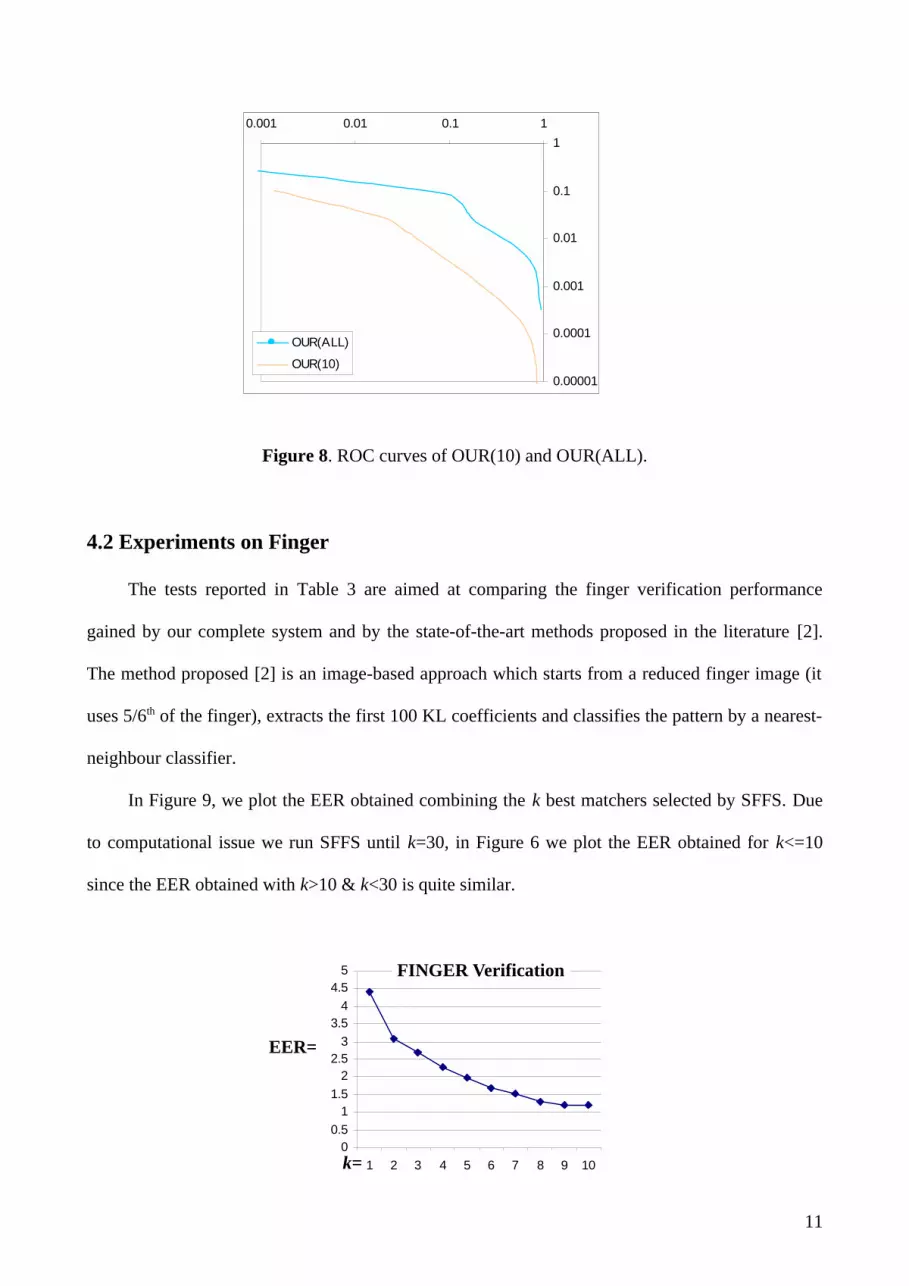
Figure 8. ROC curves of OUR(10) and OUR(ALL).
4.2 Experiments on Finger
The tests reported in Table 3 are aimed at comparing the finger verification performance
gained by our complete system and by the state-of-the-art methods proposed in the literature [2].
The method proposed [2] is an image-based approach which starts from a reduced finger image (it
uses 5/6th of the finger), extracts the first 100 KL coefficients and classifies the pattern by a nearest-
neighbour classifier.
In Figure 9, we plot the EER obtained combining the k best matchers selected by SFFS. Due
to computational issue we run SFFS until k=30, in Figure 6 we plot the EER obtained for k<=10
since the EER obtained with k>10 & k<30 is quite similar.
11
k=0
0.51
1.52
2.53
3.54
4.55
1 2 3 4 5 6 7 8 9 10
FINGER Verification
EER=
0.00001
0.0001
0.001
0.01
0.1
10.001 0.01 0.1 1
OUR(ALL)
OUR(10)

Figure 9. EERs obtained by the ensemble as a function of the number k of retained Gabor Filters.
Table 3. Performance obtained by the methods tested in this paper.
In Figure 10, we show the best 10 Gabor filters (and the respective sub-images) SWs selected
by SFFS. Please note that these 10 Gabor filters are the same for all the users of the database.
Figure 10. The best 10 Gabor filters (second row), and the respective sub-images (first row),
selected by SFFS.
In Figure 11 we plot the ROC curves (FAR vs FRR) of OUR(10) and OUR(ALL).
Figure 11. ROC curves of OUR(10) and OUR(ALL).
Methods [2] ADA OUR(10) OUR(ALL)
EER 7 3.5 1.2 3.6
AUC 2.8 1.3 0.4 1.2
12
0.00001
0.0001
0.001
0.01
0.1
10.001 0.01 0.1 1
OUR(10)
OUR(ALL)

4.3 Discussions
The experimental results show that our approach dramatically improves the performance of
the state-of-the-art methods (PC-5 and [2]). It is interesting to note that few Gabor Filters are
enough for obtaining a very low Equal Error Rate. Our method needs to compute only 10 Gabor
filters, in this way we obtain not only a very good performance but also very efficient approach.
E.g. if we selected the most discriminant sub-image (and then we trained a classifiers using the
features extracted by all the 16 Gabor Filters convolved with the given sub-image) we obtained not
only an higher EER but an approach more computational expensive (if we select a sub-image we
need 16 convolution calculations).
Finally, we compare the computation time of OUR(10) and OUR(ALL). Using OUR(10) a
single match is performed in 0.00031 seconds (both for EAR and FINGER). Using OUR(ALL) a
single match is performed in 0.00036 seconds (EAR) or 0.0004 seconds (FINGER).
The feature extraction of a single filter is performed in 0.0125 seconds (i.e. the feature
extraction in OUR(10) is performed in only 0.012510 seconds).
These results are obtained with a P4 2GhZ 1GbRAM and MATLAB 7.0.
5. Conclusions
An interesting study on Gabor Filter selection is proposed in this paper. Experimental results
obtained from two databases show that the fusion of the selected matchers leads to a substantial
improvement in the overall performance with respect to the state-of-the-art approaches. The main
experimental finding that can be extracted from the results is that by using few Gabor Filters, it is
possible to obtain an EER lower than that obtained using other global and local approaches.
13

References
[1] Q.Li, Z.Qiu, D.Sun, J.Wu, Personal Identification Using Knuckleprint, Sinobiometrics (2004)
680-689.
[2] S.Ribaric, I.Fratric, A Biometric Identification System Based on Eigenpalm and Eigenfinger
Features, IEEE Transactions on Pattern Analysis and Machine Intelligence, 27 (11) (2005)
1698-1709.
[3] R.O. Duda, P.E. Hart, D.G. Stork, Pattern Classification, Wiley, New York, 2nd edition, 2000.
[4] P.Yan, K.W. Bowyer, Empirical evaluation of advanced ear biometrics, Empirical Evaluation
Methods in Computer Vision, (EEMCV 2005) June 2005, San Diego .
[5] K.Pun, Y.Moon, Recent advances in ear biometrics, Proceedings of the sixth international
conference on automatic face and gesture recognition, May-2004, pp. 164-169.
[6] P. Pudil, J. Novovicova, J. Kittler, Floating search methods in feature selection, Pattern
Recognition Letters 15 (11) (November-1994) 1119-1125.
[7] H.J. Zhang, Z.C. Mu, W.Qu, L.M. Liu, C.Y. Zhang, A novel approach for ear recognition based
on ICA and RBF network, Fourth international conference on Machine Learning and
Cybernetics, August-2005, pp. 4511-4515.
[8] T. Connie, A.T.B. Jin, M.G.K. Ong, D.N.C. Ling, An automated palmprint recognition system
Image and Vision Computing 23 (2005) 501–515.
[9] D.H. Liu, K.M. Lam, L.S. Shen, Optimal sampling of Gabor features for face recognition.
Pattern Recognition Lett. 25 (2004) 267–276.
[10] Z. Sun, G. Bebis, R. Miller, Evolutionary Gabor filter optimization with application to
vehicle detection. In: Proc. 3rd IEEE Internat. Conf. on Data Mining, Florida, USA, (2003)
307–314.
14

[11] N.W. Campbell, B.T. Thomas, Automatic selection of Gabor filters for pixel classification.
In: Sixth Internat. Conf. on Image Processing and its Applications, (1997) 761–765.
[12] L. Shen, L. Bai, MutualBoost learning for selecting Gabor features for face recognition, to
appear on Pattern Recognition Letters (2006).
[13] J.G. Daugman, Complete discrete 2D Gabor transforms by neural networks for image-
analysis and compression. IEEE Trans. Acoust. Speech Signal Process. 36 (1988) 1169–
1179.
[14] M. Faúndez-Zanuy, M.A. Ferrer-Ballester, C. Travieso-González, V. Espinosa-Duro, Hand
Geometry Based Recognition with a MLP Classifier, International Conference Advances in
Biometrics, Hong Kong, China, January 5-7, (2006) 721-727.
[15] S. Brahnam, L. Nanni, S. Randall, Introduction to neonatal facial pain detection using
common and advanced face classification techniques, In Computational Intelligence In
Healthcare, To Appear 2006.
[16] L. Nanni, D.Maio, Weighted Sub-Gabor For Face Recognition, to appear on Pattern
Recognition Letters 2006.
[17] http://www.nd.edu/~cvrl/
[18] L. Huang, Y. Dai, A support vector machine approach for prediction of T cell epitopes,
Proc. of the Third Asia-Pacific Bioinformatics Conference (APBC2005), Singapore, Jan.
17-21, (2005) 312-328.
[19] D. Maio and L. Nanni. Combination of different fingerprint systems: a case study FVC2004,
Sensor Review, 26 (1) (2006) 51-57.
[20] N. Otsu, A Threshold Selection Method from Gray-Level Histograms, IEEE Transactions on
Systems, Man, and Cybernetics, 9 (1) (1979) 62-66.
[21] D. Maltoni, D. Maio, A.K. Jain, S. Prabhakar, Handbook of Fingerprint Recognition.
Springer (2003).
15

[22] A. Ross, A. Jain, J. Reismanb, A hybrid fingerprint matcher. Pattern Recognition 36 (2003)
1661 – 1673.
[23] L. Wiskott, J.M. Fellous, N. Kruger, C. von der Malsburg, Face Recognition By Elastic
Bunch Graph Matching, IEEE Trans. on PAMI, 19 (7) (1997) 775-779.
[24] A. Cohen, Y. Zigel, On feature selection for speaker verification, COST 275 workshop on
the Advent of Biometrics on the Internet, 89-92 2002.
[25] L. Nanni, A. Lumini, A multi-matcher for Ear Authentication, accepted at Pattern
Recognition Letters, to appear 2007.
16
Recommended


