ORIGINAL PAPER
Origin of Spanish invasion by the zebra mussel, Dreissenapolymorpha (Pallas, 1771) revealed by amplified fragmentlength polymorphism (AFLP) fingerprinting
Sanjeevi Rajagopal Æ Bart J. A. Pollux Æ Janny L. Peters Æ Geert Cremers ÆSeung Yeo Moon-van der Staay Æ Theo van Alen Æ Jelle Eygensteyn ÆAngela van Hoek Æ Antoni Palau Æ Abraham bij de Vaate Æ Gerard van der Velde
Received: 15 January 2008 / Accepted: 12 August 2008 / Published online: 5 July 2009
� The Author(s) 2009. This article is published with open access at Springerlink.com
Abstract The zebra mussel, Dreissena polymorpha
is an aquatic nuisance invasive species originally
native to the Ponto-Caspian region where it is found
in lakes and delta areas of large rivers draining into
the Black and Caspian seas. The dispersal of
D. polymorpha began at the end of the 18th century,
at a time when shipping trade become increasingly
important and many canals were built for linking
different navigable river systems in Europe. Over the
past 200 years, zebra mussels spread to most of the
lakes, rivers and waterways in Europe by a combi-
nation of natural and anthropogenic dispersal mech-
anisms. D. polymorpha invaded Spain around 2001,
being found for the first time in the Riba-roja
reservoir at the lower part of the Ebro River, North-
East Spain. The relatively late invasion of Spain was
most likely caused by the presence of the Pyrenees,
which isolated the Iberian Peninsula from the rest of
the European continent, and acted as a barrier to the
dispersal of D. polymorpha. In recent studies,
S. Rajagopal (&) � G. Cremers � G. van der Velde
Department of Animal Ecology and Ecophysiology,
Institute for Wetland and Water Research, Radboud
University Nijmegen, Heyendaalseweg 135, 6525 AJ
Nijmegen, The Netherlands
e-mail: [email protected]
B. J. A. Pollux
Department of Aquatic Ecology and Environmental
Biology, Institute for Wetland and Water Research,
Radboud University Nijmegen, Heyendaalseweg 135,
6525 AJ Nijmegen, The Netherlands
J. L. Peters
Section Plant Genetics, Institute for Wetland and Water
Research, Radboud University Nijmegen, Radboud
University Nijmegen, Heyendaalseweg 135, 6525 AJ
Nijmegen, The Netherlands
S. Y. Moon-van der Staay � T. van Alen
Department of Microbiology, Institute for Wetland and
Water Research, Radboud University Nijmegen, Radboud
University Nijmegen, Heyendaalseweg 135, 6525 AJ
Nijmegen, The Netherlands
J. Eygensteyn
Department of General Instrumentation, Science Faculty,
Radboud University Nijmegen, Heyendaalseweg 135,
6525 AJ Nijmegen, The Netherlands
A. van Hoek
RIKILT—Institute of Food Safety, Wageningen UR,
Bornsesteeg 45, 6708 PD Wageningen, The Netherlands
A. Palau
Department of Environment and Sustainable
Development, Endesa, C/Ribera del Loira 60, 28042
Madrid, Spain
A. bij de Vaate
Waterfauna Hydrobiologisch Adviesbureau, Oostrandpark
30, 8212 AP Lelystad, The Netherlands
123
Biol Invasions (2009) 11:2147–2159
DOI 10.1007/s10530-009-9495-3
molecular genetic methods have successfully been
used to determine phylo-geographic relationships,
which may reflect invasion corridors and can help
retrace source populations. Zebra mussels from
populations in Great Britain, The Netherlands, Bel-
gium, France, Germany, Spain, Italy, Romania and
North America were analyzed using PCR based
amplified fragment length polymorphism (AFLP)-
fingerprinting to determine the source population of
D. polymorpha in Spain. The phylogenetic analyses
and pair-wise genetic distances revealed that the
recent invasion of zebra mussels in Spain is most
likely from France.
Keywords Dreissena polymorpha � Invasive
species � Population genetics � Ebro River �AFLP fingerprinting � Phylogenetic analysis
Introduction
The zebra mussel (Dreissena polymorpha) is a
successful invasive bivalve that originates from the
Ponto-Caspian region. Its rapid spread throughout
Europe and North America (Kinzelbach 1992; Bij de
Vaate et al. 2002) has been facilitated by a favourable
combination of life-history characteristics (free-
swimming larval stages, formation of byssus threads,
etc.) and human-mediated dispersal mechanisms
(Carlton 1993; Johnson and Carlton 1996). Once
they are introduced into a new area, zebra mussels
often form dense aggregations (reaching densities of
up to 700,000 individuals m-2), a common feature of
the zebra mussel that has led to many adverse socio-
economic and ecological consequences (Pimentel
et al. 2000). In North America, industrial facilities
using surface water for production processes and
drinking water companies had to take costly and
time-consuming measures to prevent clogging of
their intake pipes, with cost estimates ranging up to
several billions of dollars by the turn of the century
(Roberts 1990; Ludyanskiy et al. 1993; Van der
Velde et al. 1994; Hushak 1996; Pimentel et al.
2000). The epizoic colonisation of snails, crayfish and
unionid bivalves by this exotic species has led to a
decline, and in many cases to a total eradication, of
native species (Mackie 1991; Haag et al. 1993;
Schloesser et al. 1996). Seston removal by filter-
feeding of this organism has resulted in the transfor-
mation of turbid to clear waters (Reeders et al.
1989; Reeders and Bij de Vaate 1990, 1992; Reeders
et al. 1993), not only resulting in severe ecological
impacts due to complete changeovers of local
communities, but also in negative socio-economic
impacts on commercial- and sport fisheries due to the
decline of commercially important fish species such
as the Walleye (Sander vitreus) (Mackie 1991;
Griffiths 1993; Van der Velde et al. 1994; Strayer
et al. 1999).
D. polymorpha colonised Spain around 2001, where
it was found for the first time in the Riba-roja reservoir
in the lower part of the Ebro River, North-East Spain
(Ruiz-Altaba et al. 2001). The relatively late invasion
of Spain was most likely caused by the presence of the
Pyrenees, which isolate the Iberian Peninsula from the
rest of the European continent, and act as a dispersal
barrier for D. polymorpha. Peribanez (2005) has tried
to infer the origin of invasion by using the presence of
D. polymorpha’s parasites in the Ebro River as origin
tracers (Palau, unpubl.). They recorded the presence of
the helminth Phyllodistomum folium in the branchi-
odes of D. polymorpha. This helminth species is widely
known in Europe but, to date, not known in North
America, suggesting a European rather than North
American origin of the D. polymorpha population in
the Ebro. However, the exact source region in Europe
remained uncertain (refer to Burlakova et al. 2006 for
more information on the use of parasites to infer origin
of invasion by adult zebra mussels).
Recent studies have revealed the usefulness of
genetic markers (e.g., RAPD, AFLP and microsatel-
lites) as a tool to study the genetic structure of
populations and infer source regions of invasion of
Dreissena species (Wilson et al. 1999; Stepien et al.
2002; Pollux et al. 2003; Elderkin et al. 2004; Astanei
et al. 2005; Therriault et al. 2005; May et al. 2006).
Phylogeographic analysis, expressing the hierarchical
descent of populations, allows the identification of
source regions by comparing the genetic similarity
between the newly established population and
potential surrounding source populations (Pollux
et al. 2003). In this study, the PCR-based AFLP-
fingerprinting method (Vos et al. 1995) was applied
to determine the most likely origin of the
D. polymorpha population in the Ebro River in Spain.
2148 S. Rajagopal et al.
123
Materials and methods
Sampling and preservation
A total of 237 zebra mussels were sampled from eight
locations throughout Europe and one location in
North America (Table 1), covering a large part of
their current range of geographic distribution (Fig. 1).
Live zebra mussels were collected from submerged
substrata and were immediately placed in 50 ml
conical polypropylene tubes (Greiner Bio-One, Al-
phen aan den Rijn, Netherlands), filled to the rim with
a saturated aqueous solution of Cetyltrimethylammo-
nium-bromide (CTAB; Merck, Amsterdam, Nether-
lands) containing 20% Dimethylsulfoxide (DMSO;
Merck) to fixate the DNA and stored at -20�C for
further analysis.
DNA isolation
DNA was isolated, using the DNeasy Tissue Kit
(Qiagen) following the DNeasy protocol for animal
tissues, with some modifications. About 20 mg of fish
muscle tissue is completely lysed by adding 30 ll of
Proteinase K. Complete lysis was achieved after
overnight incubation at 55�C. DNA was isolated
following the procedures outlined by Qiagen DNeasy
protocol. Final DNA dilutions were performed with
two times 75 ll buffer instead of two times of 100 ll
as mentioned in the protocol. The quality of the
genomic DNA was checked by electrophoresis in
1.2% agarose gels.
The quality of the DNA is most important for the
AFLP analysis because the process is dependent upon
the complete enzymatic digestion of the DNA via
endonucleases. AFLP techniques require 100–500 ng
of relatively pure DNA (Saunders et al. 2002). These
fragments are subsequently used in PCR amplifica-
tion, and therefore, it is necessary to have complete
digestion of the DNA to get reproducible patterns
between replicate samples.
AFLP procedures
AFLP analyses were applied as described by Vos
et al. (1995) with modifications as described in De
Roos (2003). Restriction—Ligation reactions were
performed in a single reaction at 37�C for 2 h, in a
total volume of 10 ll containing 100 ng DNA,
1 9 T4 Ligase Buffer (Life Technology, Invitrogen),
0.05 M NaCl, 5 U EcoRI—Enzyme (New England
BioLabs), 5U MseI—Enzyme (New England Bio-
Labs), 0.045 M bovine serum albumine (BSA, New
England BioLabs), 0.2 lM EcoRI—adapter (50-CTC
GTAGACTGCGTACC, CATCTGACGCATGGTTAA-05), 2.0 lM MseI—adapter (50-GACGATGAGTCCT-
GAG, TACTCAGGACTCAT-05) and 1 U T4—Ligase
(Life Technology, Invitrogen). PCR amplifications
were performed on a T-gradient thermocycler (Biom-
etra) in two separate amplification steps. Pre-ampli-
fication PCR reactions were conducted in a 20 ll
volume (containing 4 ll 209 diluted Restriction–Liga-
tion mix, 0.5 lM EcoRI/? A primer (Applied Biosys-
tems), 0.5 lM MseI/? C primer (Applied Biosystems)
Table 1 Characteristics of Dreissena polymorpha populations
sampled in various European countries and the United States of
America (n is the number of sampled individuals, Npl is the
number of polymorphic loci, Ppl (%) is the percentage of
polymorphic loci and I is mean (±SD) Shannon’s diversity
index)
Country River system Assigned code n Npl Ppl (%) I(±SE)
1. Great Britain Thames River TR 25 40 32.79 0.0847 (0.1893)
2. The Netherlands Waal River WR 27 49 40.16 0.0887 (0.1738)
3. Belgium Meuse River MN 25 56 45.90 0.0949 (0.1652)
4. Germany Untersee US 26 54 44.26 0.1045 (0.1844)
5. Spain Ebro River ER 27 71 58.20 0.1803 (0.2429)
6. France Petit Rhone River RR 25 66 54.10 0.1475 (0.2228)
7. Italy Po river PR 29 64 52.46 0.1565 (0.2440)
8. Romania Danube River DR 26 47 38.52 0.1136 (0.2165)
9. USA Mississippi River MR 27 76 62.30 0.1800 (0.2409)
Origin of Spanish invasion by the zebra mussel 2149
123
and 15 ll AFLP Amplification Core Mix (Applied
Biosystems), with the following temperature profile: an
initial denaturation step of 2 min 94�C; 20 cycles with
20 s 94�C, 30 s 56�C, 2 min 72�C; followed by 2 min
72�C and 30 min 60�C. Selective amplifications were
performed in a 10 ll volume (containing 1.5 ll 109
diluted Pre-amplification product, 0.05 lM Dye labeled
EcoRI/? ACC primer (Applied Biosystems), 0.25 lM
MseI/? CAT primer (Applied Biosystems) and 7.5 ll
AFLP Amplification Core Mix (Applied Biosystems),
with the following temperature profile: an initial
denaturation step of 2 min 94�C; 10 cycles with 20 s
94�C, 30 s 66�C decreasing with 1�C per cycle, 2 min
72�C; 25 cycles with 20 94�C, 30 s 56�C, 2 min 72�C;
followed by 30 min 60�C. Amplified fragments were
analyzed on a CEQTM 8000 Genetic Analysis System
(Beckman Coulter Inc. 2002). Fragments between 100
and 350 bp were scored as present (1) or absent (0)
using the Fragment Analysis Software Module of the
CEQTM 8000 (AFLP settings: bin width = 1.0 nt;
Ythreshold = 400 RFU). Prior to the analyses the AFLP
data were transformed to a binary 1/0 character matrix,
indicating the presence and absence of bands, respec-
tively. Loci with a band frequency below 5% were
considered as potential artifacts and omitted from
further analysis. Altogether, 12 different primer combi-
nations are tested for the AFLP studies of D. polymor-
pha on the reduced set of samples with a goal to pick
good pattern. The primer combination of AAC/CAT is
selected based on the average number of reliable
fragment length peaks in basepairs.
Data analysis
Genetic variation within populations was assessed by
calculating Shannon’s index of diversity (I; Shannon
and Weaver 1949), the number of polymorphic loci
(NPL) and the proportion of polymorphic loci (PPL),
using the software program POPGENE version 1.32
(Yeh et al. 1997).
Genetic diversity among populations and regio-
nal population structure was assessed by means of
Fig. 1 Map showing the sampling locations for the present study. The numbers correlate with the locations mentioned in Table 1
2150 S. Rajagopal et al.
123
several methods: Firstly, Principal Component Anal-
ysis (PCA), a non-hierarchical grouping technique
without prior knowledge of the source location of the
sampled individuals, was performed using the Gene-
Maths XT software package, version 1.6.1 (Applied
Maths BVBA, Sint-Martens-Latem, Belgium), to
visualise the grouping of individuals into clusters.
Secondly, phylogenetic analyses were performed
using two different approaches: a neighbour-joining
(NJ) distance analysis (Saitou and Nei 1987) and a
Bayesian analysis (Huelsenbeck and Ronquist 2001).
Preliminary analyses showed that the MR group
clearly showed the earliest divergence when a closely
related species Dreissena rostriformis bugensis was
included as an outgroup. The North American (MR)
population was therefore used as an out-group to
compare the European populations. For the NJ anal-
ysis, the genetic distances were estimated using the
algorithm of Nei and Li (1979), with the PHYLIP
package (Felsenstein 2002). The Bayesian inference
that evaluates posterior probabilities of clades was
performed using the program MRBAYES version
3.1.2 (Ronquist and Huelsenbeck 2003). The character
state transition model used is the one implemented in
the program, the F81-like model, where the rate of the
state transitions is calculated by the stationary state
frequencies. Markov chain Monte Carlo from a random
starting tree was initiated and run for 20 million
generations. Trees were sampled every 1000th gener-
ation. The first 25% of the samples were discarded as
‘burn-in’, and the rest of the samples were used for
inferring a Bayesian tree. The convergence diagnostic
PSRF (potential scale reduction factor) value over the
runs sampled approached 1. Examination of the log-
likelihood and the observed consistency with the
similar likelihood values between the two independent
runs suggest that the run reached stationarity and that
these burn-in periods were sufficiently long. Thirdly,
an Analysis of Molecular Variance (AMOVA) was
performed to assess the degree of molecular variation
within and among populations, using the program
ARLEQUIN v2.000 (Schneider et al. 2000), which
performs a nested ANOVA using the matrix of
Euclidean genetic distances as input (Excoffier et al.
1992). The level of population subdivision was
estimated by calculating pairwise genetic distances
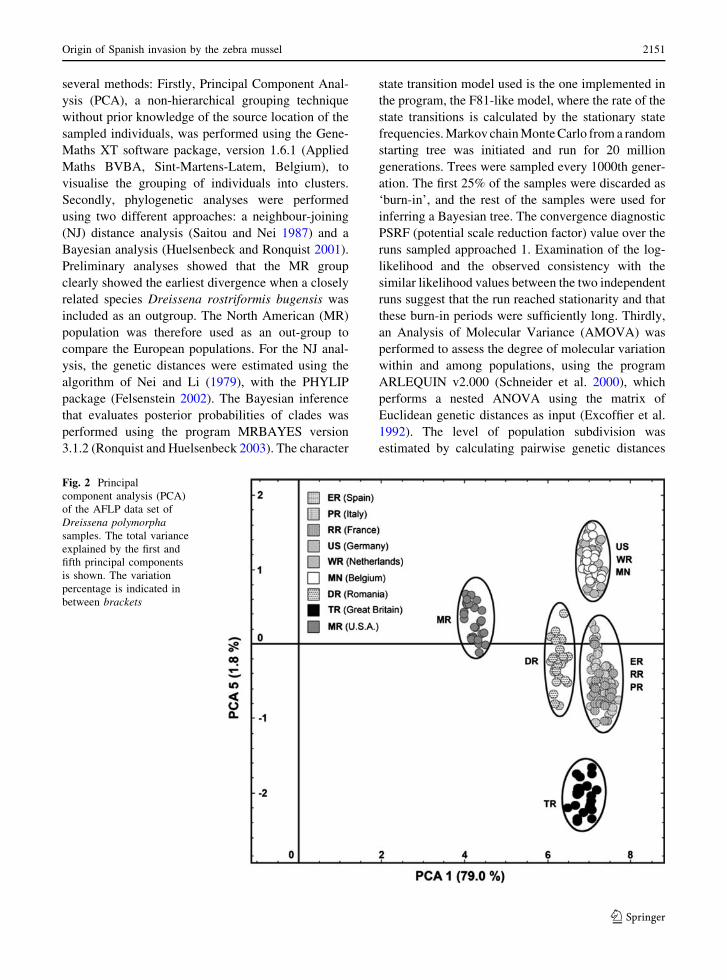
Fig. 2 Principal
component analysis (PCA)
of the AFLP data set of
Dreissena polymorphasamples. The total variance
explained by the first and
fifth principal components
is shown. The variation
percentage is indicated in
between brackets
Origin of Spanish invasion by the zebra mussel 2151
123
between populations using U statistics (that are directly
analogous to Wright’s F statistics; Weir and Cocker-
ham 1984; Excoffier et al. 1992). The pair-wise genetic
distances were calculated according to Lynch and
Milligan (1994), using AFLP-SURV v1.0 under the
assumption of a Hardy–Weinberg equilibrium (Veke-
mans et al. 2002). Exact tests of population differen-
tiation (Raymond and Rousset 1995) were calculated
with TFPGA (Tools for Populations Genetic Analysis
version 1.3; Miller 1999). Analyses were performed
with pairwise combinations of populations (using 20
batches and 2000 permutations), based on observed
marker frequencies and assuming linkage equilibrium
among loci (Miller 1999).
Results
Descriptive analyses
A total of 122 putative gene loci (i.e. clear and
reproducible AFLP fragments) were resolved from
the 237 D. polymorpha samples. The genetic diver-
sity within populations was lowest in the Thames
river, Great Britain (Npl = 32.79%; I = 0.0847 ±
0.1893) and highest in the Mississippi river, USA
(Npl = 62.30%; I = 0.1800 ± 0.2409; Table 1).
Phylogeography and PCA analysis
In the Principal Component Analysis (PCA), more
than 89% of the variation was explained by the first
three components. The first component of PCA
already accounted for 79% of the total variation.
The first and fifth components clearly separate the
nine Dreissena polymorpha populations into five
geographically defined groups: G1 (Mississippi river,
USA), G2 (Thames river, Great Britain), G3 (Danube
river, Romania), G4 (the Waal river, the Meuse river
and the Untersee in the neighbouring countries of the
Netherlands, Belgium and Germany, respectively)
and G5 (the Ebro river, the Petit Rhone river and the
Po river in the neighbouring countries of Spain,
France and Italy, respectively; Fig. 2).
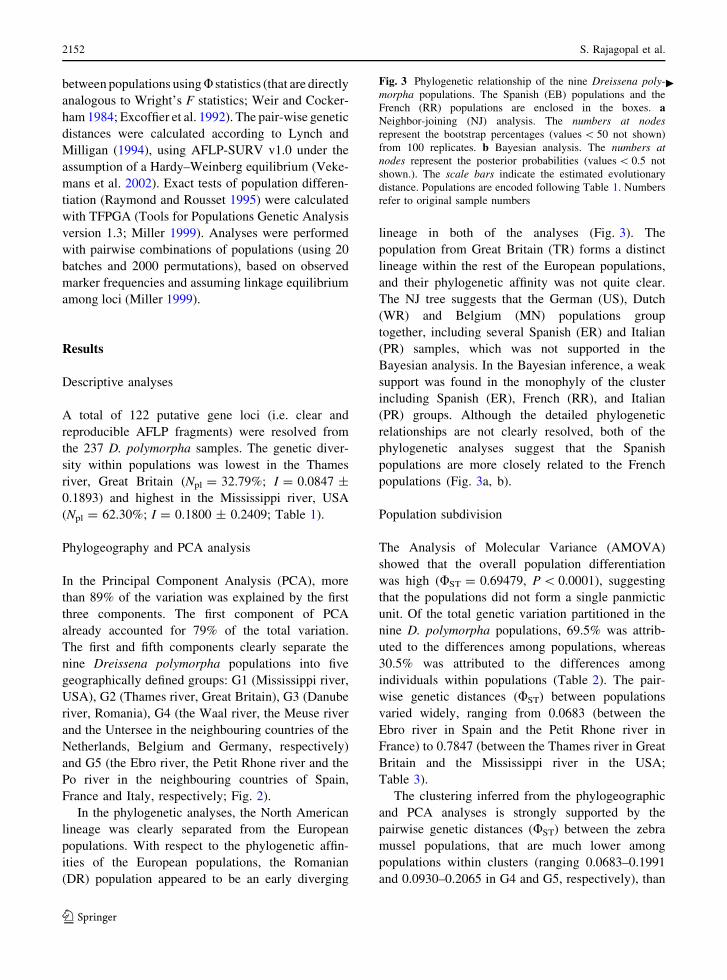
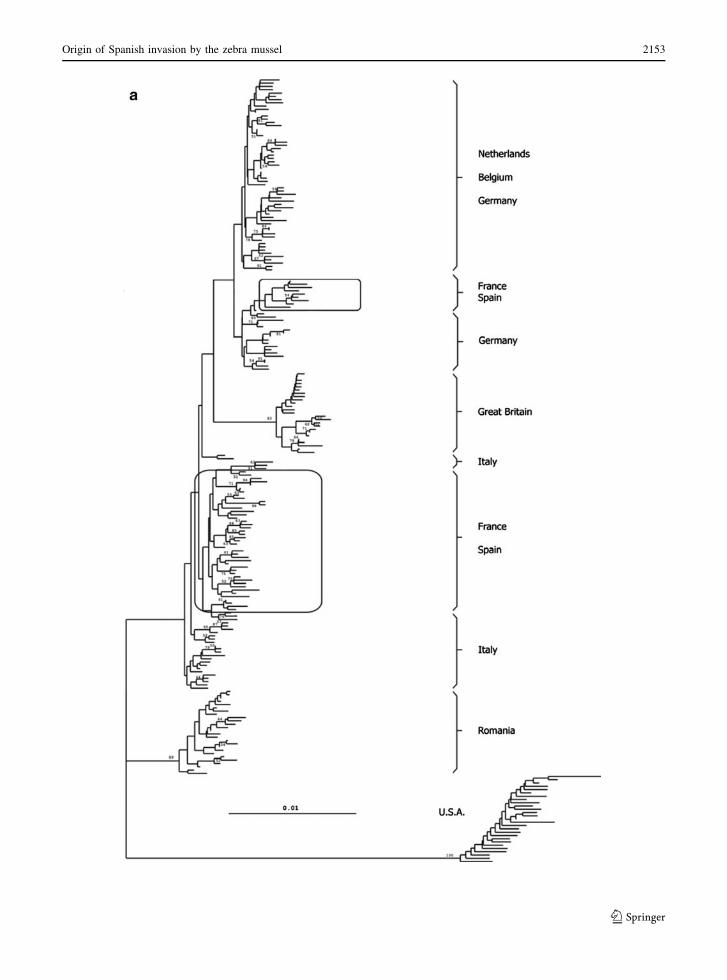
In the phylogenetic analyses, the North American
lineage was clearly separated from the European
populations. With respect to the phylogenetic affin-
ities of the European populations, the Romanian
(DR) population appeared to be an early diverging
lineage in both of the analyses (Fig. 3). The
population from Great Britain (TR) forms a distinct
lineage within the rest of the European populations,
and their phylogenetic affinity was not quite clear.
The NJ tree suggests that the German (US), Dutch
(WR) and Belgium (MN) populations group
together, including several Spanish (ER) and Italian
(PR) samples, which was not supported in the
Bayesian analysis. In the Bayesian inference, a weak
support was found in the monophyly of the cluster
including Spanish (ER), French (RR), and Italian
(PR) groups. Although the detailed phylogenetic
relationships are not clearly resolved, both of the
phylogenetic analyses suggest that the Spanish
populations are more closely related to the French
populations (Fig. 3a, b).
Population subdivision
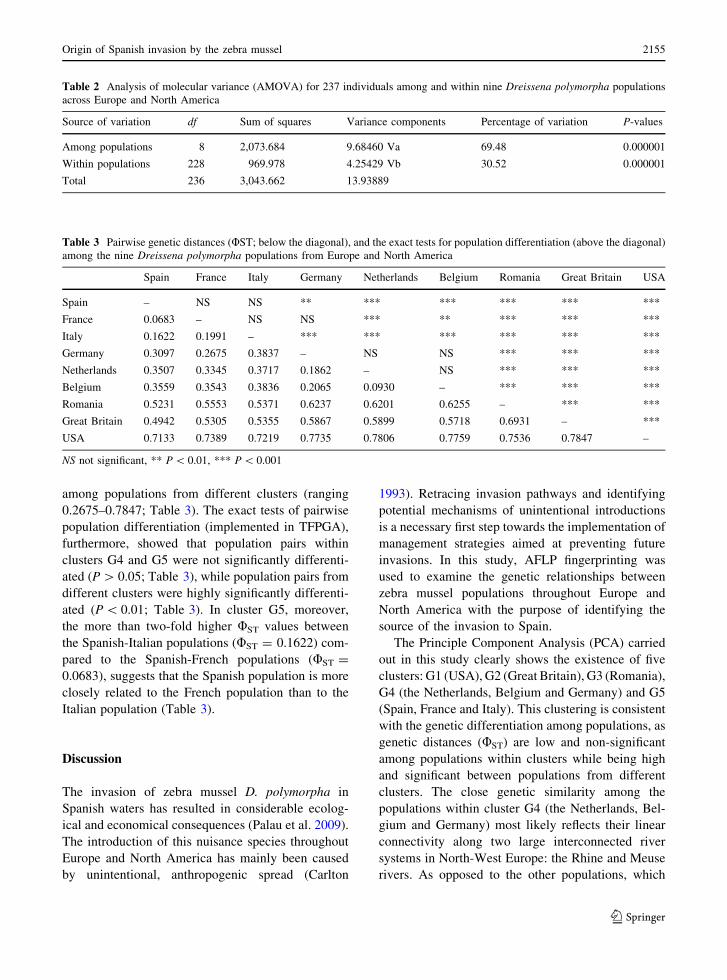
The Analysis of Molecular Variance (AMOVA)
showed that the overall population differentiation
was high (UST = 0.69479, P \ 0.0001), suggesting
that the populations did not form a single panmictic
unit. Of the total genetic variation partitioned in the
nine D. polymorpha populations, 69.5% was attrib-
uted to the differences among populations, whereas
30.5% was attributed to the differences among
individuals within populations (Table 2). The pair-
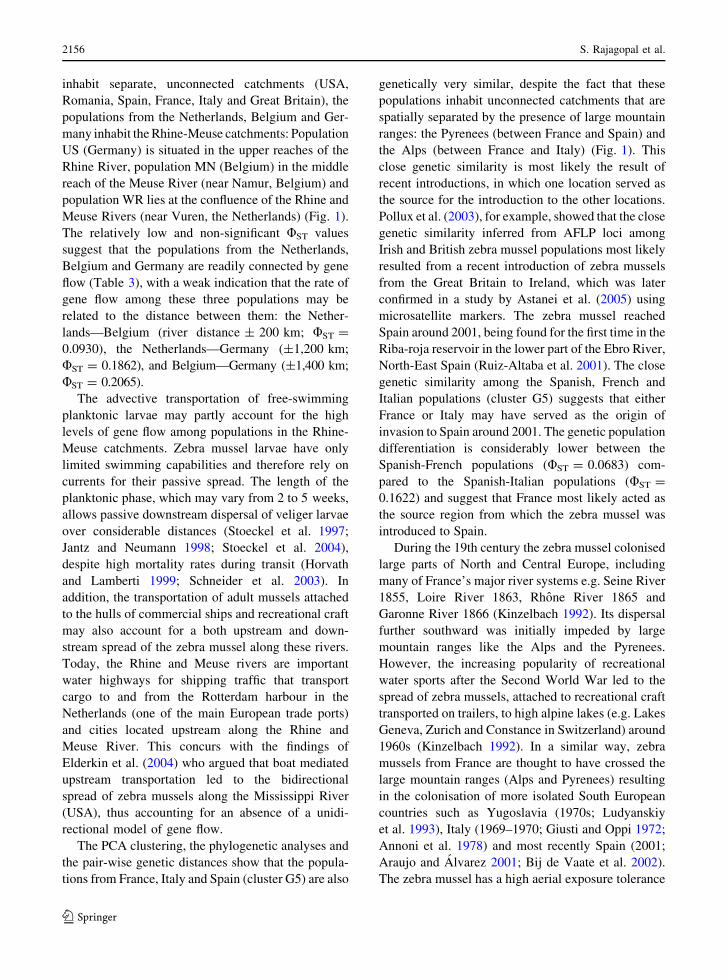
wise genetic distances (UST) between populations
varied widely, ranging from 0.0683 (between the
Ebro river in Spain and the Petit Rhone river in
France) to 0.7847 (between the Thames river in Great
Britain and the Mississippi river in the USA;
Table 3).
The clustering inferred from the phylogeographic
and PCA analyses is strongly supported by the
pairwise genetic distances (UST) between the zebra
mussel populations, that are much lower among
populations within clusters (ranging 0.0683–0.1991
and 0.0930–0.2065 in G4 and G5, respectively), than
Fig. 3 Phylogenetic relationship of the nine Dreissena poly-morpha populations. The Spanish (EB) populations and the
French (RR) populations are enclosed in the boxes. aNeighbor-joining (NJ) analysis. The numbers at nodesrepresent the bootstrap percentages (values \ 50 not shown)
from 100 replicates. b Bayesian analysis. The numbers atnodes represent the posterior probabilities (values \ 0.5 not
shown.). The scale bars indicate the estimated evolutionary
distance. Populations are encoded following Table 1. Numbers
refer to original sample numbers
c
2152 S. Rajagopal et al.
123
Origin of Spanish invasion by the zebra mussel 2153
123
Fig. 3 continued
2154 S. Rajagopal et al.
123
among populations from different clusters (ranging
0.2675–0.7847; Table 3). The exact tests of pairwise
population differentiation (implemented in TFPGA),
furthermore, showed that population pairs within
clusters G4 and G5 were not significantly differenti-
ated (P [ 0.05; Table 3), while population pairs from
different clusters were highly significantly differenti-
ated (P \ 0.01; Table 3). In cluster G5, moreover,
the more than two-fold higher UST values between
the Spanish-Italian populations (UST = 0.1622) com-
pared to the Spanish-French populations (UST =
0.0683), suggests that the Spanish population is more
closely related to the French population than to the
Italian population (Table 3).
Discussion
The invasion of zebra mussel D. polymorpha in
Spanish waters has resulted in considerable ecolog-
ical and economical consequences (Palau et al. 2009).
The introduction of this nuisance species throughout
Europe and North America has mainly been caused
by unintentional, anthropogenic spread (Carlton
1993). Retracing invasion pathways and identifying
potential mechanisms of unintentional introductions
is a necessary first step towards the implementation of
management strategies aimed at preventing future
invasions. In this study, AFLP fingerprinting was
used to examine the genetic relationships between
zebra mussel populations throughout Europe and
North America with the purpose of identifying the
source of the invasion to Spain.
The Principle Component Analysis (PCA) carried
out in this study clearly shows the existence of five
clusters: G1 (USA), G2 (Great Britain), G3 (Romania),
G4 (the Netherlands, Belgium and Germany) and G5
(Spain, France and Italy). This clustering is consistent
with the genetic differentiation among populations, as
genetic distances (UST) are low and non-significant
among populations within clusters while being high
and significant between populations from different
clusters. The close genetic similarity among the
populations within cluster G4 (the Netherlands, Bel-
gium and Germany) most likely reflects their linear
connectivity along two large interconnected river
systems in North-West Europe: the Rhine and Meuse
rivers. As opposed to the other populations, which
Table 2 Analysis of molecular variance (AMOVA) for 237 individuals among and within nine Dreissena polymorpha populations
across Europe and North America
Source of variation df Sum of squares Variance components Percentage of variation P-values
Among populations 8 2,073.684 9.68460 Va 69.48 0.000001
Within populations 228 969.978 4.25429 Vb 30.52 0.000001
Total 236 3,043.662 13.93889
Table 3 Pairwise genetic distances (UST; below the diagonal), and the exact tests for population differentiation (above the diagonal)
among the nine Dreissena polymorpha populations from Europe and North America
Spain France Italy Germany Netherlands Belgium Romania Great Britain USA
Spain – NS NS ** *** *** *** *** ***
France 0.0683 – NS NS *** ** *** *** ***
Italy 0.1622 0.1991 – *** *** *** *** *** ***
Germany 0.3097 0.2675 0.3837 – NS NS *** *** ***
Netherlands 0.3507 0.3345 0.3717 0.1862 – NS *** *** ***
Belgium 0.3559 0.3543 0.3836 0.2065 0.0930 – *** *** ***
Romania 0.5231 0.5553 0.5371 0.6237 0.6201 0.6255 – *** ***
Great Britain 0.4942 0.5305 0.5355 0.5867 0.5899 0.5718 0.6931 – ***
USA 0.7133 0.7389 0.7219 0.7735 0.7806 0.7759 0.7536 0.7847 –
NS not significant, ** P \ 0.01, *** P \ 0.001
Origin of Spanish invasion by the zebra mussel 2155
123
inhabit separate, unconnected catchments (USA,
Romania, Spain, France, Italy and Great Britain), the
populations from the Netherlands, Belgium and Ger-
many inhabit the Rhine-Meuse catchments: Population
US (Germany) is situated in the upper reaches of the
Rhine River, population MN (Belgium) in the middle
reach of the Meuse River (near Namur, Belgium) and
population WR lies at the confluence of the Rhine and
Meuse Rivers (near Vuren, the Netherlands) (Fig. 1).
The relatively low and non-significant UST values
suggest that the populations from the Netherlands,
Belgium and Germany are readily connected by gene
flow (Table 3), with a weak indication that the rate of
gene flow among these three populations may be
related to the distance between them: the Nether-
lands—Belgium (river distance ± 200 km; UST =
0.0930), the Netherlands—Germany (±1,200 km;
UST = 0.1862), and Belgium—Germany (±1,400 km;
UST = 0.2065).
The advective transportation of free-swimming
planktonic larvae may partly account for the high
levels of gene flow among populations in the Rhine-
Meuse catchments. Zebra mussel larvae have only
limited swimming capabilities and therefore rely on
currents for their passive spread. The length of the
planktonic phase, which may vary from 2 to 5 weeks,
allows passive downstream dispersal of veliger larvae
over considerable distances (Stoeckel et al. 1997;
Jantz and Neumann 1998; Stoeckel et al. 2004),
despite high mortality rates during transit (Horvath
and Lamberti 1999; Schneider et al. 2003). In
addition, the transportation of adult mussels attached
to the hulls of commercial ships and recreational craft
may also account for a both upstream and down-
stream spread of the zebra mussel along these rivers.
Today, the Rhine and Meuse rivers are important
water highways for shipping traffic that transport
cargo to and from the Rotterdam harbour in the
Netherlands (one of the main European trade ports)
and cities located upstream along the Rhine and
Meuse River. This concurs with the findings of
Elderkin et al. (2004) who argued that boat mediated
upstream transportation led to the bidirectional
spread of zebra mussels along the Mississippi River
(USA), thus accounting for an absence of a unidi-
rectional model of gene flow.
The PCA clustering, the phylogenetic analyses and
the pair-wise genetic distances show that the popula-
tions from France, Italy and Spain (cluster G5) are also
genetically very similar, despite the fact that these
populations inhabit unconnected catchments that are
spatially separated by the presence of large mountain
ranges: the Pyrenees (between France and Spain) and
the Alps (between France and Italy) (Fig. 1). This
close genetic similarity is most likely the result of
recent introductions, in which one location served as
the source for the introduction to the other locations.
Pollux et al. (2003), for example, showed that the close
genetic similarity inferred from AFLP loci among
Irish and British zebra mussel populations most likely
resulted from a recent introduction of zebra mussels
from the Great Britain to Ireland, which was later
confirmed in a study by Astanei et al. (2005) using
microsatellite markers. The zebra mussel reached
Spain around 2001, being found for the first time in the
Riba-roja reservoir in the lower part of the Ebro River,
North-East Spain (Ruiz-Altaba et al. 2001). The close
genetic similarity among the Spanish, French and
Italian populations (cluster G5) suggests that either
France or Italy may have served as the origin of
invasion to Spain around 2001. The genetic population
differentiation is considerably lower between the
Spanish-French populations (UST = 0.0683) com-
pared to the Spanish-Italian populations (UST =
0.1622) and suggest that France most likely acted as
the source region from which the zebra mussel was
introduced to Spain.
During the 19th century the zebra mussel colonised
large parts of North and Central Europe, including
many of France’s major river systems e.g. Seine River
1855, Loire River 1863, Rhone River 1865 and
Garonne River 1866 (Kinzelbach 1992). Its dispersal
further southward was initially impeded by large
mountain ranges like the Alps and the Pyrenees.
However, the increasing popularity of recreational
water sports after the Second World War led to the
spread of zebra mussels, attached to recreational craft
transported on trailers, to high alpine lakes (e.g. Lakes
Geneva, Zurich and Constance in Switzerland) around
1960s (Kinzelbach 1992). In a similar way, zebra
mussels from France are thought to have crossed the
large mountain ranges (Alps and Pyrenees) resulting
in the colonisation of more isolated South European
countries such as Yugoslavia (1970s; Ludyanskiy
et al. 1993), Italy (1969–1970; Giusti and Oppi 1972;
Annoni et al. 1978) and most recently Spain (2001;
Araujo and Alvarez 2001; Bij de Vaate et al. 2002).
The zebra mussel has a high aerial exposure tolerance
2156 S. Rajagopal et al.
123
and is likely to survive a 3–6 day journey attached to
the hulls of boats transported on trailers (Pollux et al.
2009). Not surprisingly, the transportation of recrea-
tional craft is deemed one of the most important
vectors for the spread of zebra mussels among isolated
catchments and water bodies (Padilla et al. 1996;
Johnson et al. 2001; Minchin et al. 2002).
Transport via ballast tanks of big commercial
vessels was probably a further mechanism by which
the D. polymorpha were successfully introduced in
many areas (Minchin et al. 2002). Carlton (1993) has
suggested that transport through ballast water from a
European port is considered to be the route by which
zebra mussels (most likely as veliger larvae) were
introduced into the Great Lakes of North America
(Hebert et al. 1989). Similarly, Bij de Vaate et al.
(2002) have discussed the role of ballast-water
transport in the spread of a number of Ponto-Caspian
species through the mainland of Europe, including
the zebra mussel. However, this is relatively unlikely
because of the absence of big vessels coming from
the ocean into the Ebro river system.
The third possibility of introduction is through
transport of exotic fish species to the Ebro river.
Historically, there have been introductions of fishes
from Central Europe to Spain (Palau et al. 2009)
examples being the bleak (Alburnus alburnus) and
the zander (Sander lucioperca). According to Palau
et al. (2006), the introduction of the zebra mussel in
Spain coincides with introduction of such exotic fish
species first reported in the lower reaches of the river
Ebro. Fish tanks could have been filled with water
from D. polymorpha infested rivers and mussel larvae
could have easily survived the short journey without
any problems (Minchin et al. 2003; Bidwell 2009).
Conclusions
Phylogenetic analyses and pair-wise genetic distances
determined from the PCR based AFLP fingerprinting
have revealed that the recent invasion of zebra
mussels of Spain has most likely been from France.
The introduction of D. polymorpha to Spain has been
possibly attributed to the transport of recreational
boats with mussel-fouled hulls or by fish transport
across the Pyrenees (Bij de Vaate et al. 2002;
Minchin et al. 2003; Pollux et al. 2003).
Acknowledgments This study was funded by the European
Commission in the Community’s Sixth Framework Programme
(INCO project, Contract number: PL510658, Assessing
impacts of TBT on multiple coastal uses). It is contribution
number 470 of the Centre for Wetland Ecology (CWE).
Open Access This article is distributed under the terms of the
Creative Commons Attribution Noncommercial License which
permits any noncommercial use, distribution, and reproduction
in any medium, provided the original author(s) and source are
credited.
References
Annoni D, Bianchi I, Girod A et al (1978) Introduction of
Dreissena polymorpha (Pallas) (Mollusca, Bivalvia) in the
coastal mollusc beds of Lake Garda (North Italy). Oua-
derni Civica Stazione Idrobiologica Milano 6:77–84
Araujo R, Alvarez RM (2001) El mejillon cebra en el Ebro: un
grave caso de riesgo ambiental en Aragon. Naturaleza
Aragonesa 8:39–46
Astanei I, Gosling E, Wilson J et al (2005) Genetic variability
and phylogeography of the invasive zebra mussel, Dre-issena polymorpha (Pallas). Mol Ecol 14:1655–1666
Beckman Coulter Inc (2002) CEQTM 8000 Genetic analysis
system
Bidwell JR (2009) Range expansion of the zebra mussel,
Dreissena polymorpha: a review of major dispersal vec-
tors in Europe and North America. In: Van der Velde G,
Rajagopal S, Bij de Vaate A (eds) The Zebra Mussel in
Europe. Backhuys Publishers, Leiden, pp 73–83
Bij de Vaate A, Jazdzewski K, Ketelaars HAM et al (2002)
Geographical patterns in range extension of Ponto-Cas-
pian macro-invertebrate species in Europe. Can J Fish
Aquat Sci 59:1159–1174
Burlakova LE, Padilla DK, Karatayev AY et al (2006)
Endosymbionts of Dreissena polymorpha in Ireland: evi-
dence for the introduction of adult mussels. J Mollusc
Stud 72:207–210
Carlton JT (1993) Dispersal mechanisms of the zebra mussel
(Dreissena polymorpha). In: Nalepa TF, Schloesser DW
(eds) Zebra mussels: biology, impacts, and control. Lewis
Publishers, CRC Press, Boca Raton, USA, pp 677–698
De Roos K (2003) CEQTM 8000 AFLP Protocol. Beckman
Coulter Netherlands BV, Mijdrecht, The Netherlands
Elderkin CL, Perkins EJ, Leberg PL et al (2004) Amplified
fragment length polymorphism (AFLP) analysis of the
genetic structure of the zebra mussel, Dreissena poly-morpha, in the Mississippi River. Freshw Biol 49:1487–
1494
Excoffier L, Smouse PE, Quattro JM (1992) Analysis of
molecular variance inferred from metric distances among
DNA haplotypes: application to human mitochondrial
DNA restriction data. Genetics 131:479–491
Felsenstein J (2002) PHYLIP (Phylogeny Inference Package)
version 3.6a3. Distributed by the author. Department of
Genome Sciences, University of Washington, Seattle
Origin of Spanish invasion by the zebra mussel 2157
123
Giusti F, Oppi E (1972) Dreissena polymorpha (Pallas) nu-
ovamente in Italia. Memorie del Museo Civico di Storia
Naturale di Verona 10:45–49
Griffiths RW (1993) Effects of zebra mussel (Dreissena poly-morpha) on the benthic fauna of Lake St. Clair. In: Nalepa
TF, Schloesser DW (eds) Zebra mussels: biology, impacts
and control. Lewis Publishers, Boca Raton, Fla, pp 415–437
Haag WR, Berg DJ, Garton DW et al (1993) Reduced survival
and fitness in native bivalves in response to fouling by the
introduced zebra mussel (Dreissena polymorpha) in
Western Lake Erie. Can J Fish Aquat Sci 50:13–19
Hebert PDN, Muncaster BW, Mackie GL (1989) Ecological
and genetic studies on Dreissena polymorpha (Pallas): a
new mollusc in the Great Lakes. Can J Fish Aquat Sci 46:
1587–1591
Horvath T, Lamberti GA (1999) Mortality of zebra mussel,
Dreissena polymorpha, veligers during downstream
transport. Freshw Biol 42:69–76
Huelsenbeck JP, Ronquist F (2001) MRBAYES. Bayesian
inference phylogeny. Bioinformatics 17:754–755
Hushak L (1996) Zebra mussels costing $120 million in five
years. Sea Grant Network, Zebra Mussel Update 27:4
Jantz B, Neumann D (1998) Growth and reproductive cycle of
the zebra mussel in the River Rhine as studied in a river
bypass. Oecologia 114:213–225
Johnson LE, Carlton JT (1996) Post-establishment spread in
large-scale invasions: dispersal mechanisms of the zebra
mussel Dreissena polymorpha. Ecology 77:1686–1690
Johnson LE, Ricciardi A, Carlton JT (2001) Overland dispersal
of aquatic invasive species: a risk assessment of transient
recreational boating. Ecol Appl 11:1789–1799
Kinzelbach R (1992) The main features of the phylogeny and
dispersal of the Zebra mussel Dreissena polymorpha. In:
Neumann D, Jenner HA (eds) The Zebra mussel Dreissenapolymorpha. Gustav Fisher Verlag, Stuttgart, pp 5–17
Ludyanskiy ML, McDonald D, MacNeill D (1993) Impact of the
zebra mussel, a bivalve invader. Bioscience 43:533–544
Lynch B, Milligan BG (1994) Analysis of population genetic
structure with RAPD markers. Mol Ecol 3:91–99
Mackie GL (1991) Biology of the exotic zebra mussel, Dre-issena polymorpha, in relation to native bivalves and its
potential impact in Lake St. Clair. Hydrobiologia 219:
251–268
May GE, Gelembiuk GW, Panov VE et al (2006) Molecular
ecology of zebra mussel invasions. Mol Ecol 15:1021–
1031
Miller MP (1999) Tools for population genetic analyses
(TFPGA): a windowaTM program for the analysis of al-
lozyme and molecular population genetic data. Available
at http://www.marksgeneticsoftware. net/_vti_bin/shtml.
exe/tfpga.htm
Minchin D, Lucy F, Sullivan M (2002) Zebra mussel: impacts
and spread. In: Leppakoski E, Gollasch S, Olenin S (eds)
Invasive aquatic species of Europe: distribution. impacts
and management. Kluwer Academic Publishers, Dordr-
echt, The Netherlands, pp 135–146
Minchin D, Maguire C, Rosell R (2003) The zebra mussel
(Dreissena polymorpha PALLAS) invades Ireland: human
mediated vectors and the potential for rapid intranational
spread. Biol Environ Proc R Ir Acad 103B:23–30
Nei M, Li WH (1979) Mathematical model for studying
genetic variation in terms of restriction endonucleases.
Proc Nat Acad Sci USA 76:5269–5273
Padilla DK, Chotkowski MA, Buchan LAJ (1996) Predicting
the spread of zebra mussels (Dreissena polymorpha) to
inland waters using boater movement patterns. Global
Ecol Biogeogr Lett 5:353–359
Palau A, Casas R, Cia I et al (2006) The ENDESA control
strategy of Zebra Mussels (Dreissena polymorpha) in the
Riba-Roja reservoir. Transactions of the International
Congress on Large Dams
Palau A, Cia I, Casas R et al (2009) Zebra mussel distribution
and habitat preference in the lower Ebro river (North East
Spain). In: Van der Velde G, Rajagopal S, Bij de Vaate A
(eds) The Zebra Mussel in Europe. Backhuys Publishers,
Leiden, pp 121–129
Peribanez MA (2005) Estudio del mejillon cebra, Dreissenapolymorpha, en el rıo Ebro: Encuesta parasitologica y
pruebas de control microbiologico en el laboratorio.
Unpublished document. Universidad de Zaragoza—EN-
DESA. 3 pp
Pimentel D, Lach L, Zuniga R et al (2000) Environmental and
economic costs of nonindigenous species in the United
States. Bioscience 50:53–65
Pollux BJA, Minchin D, Van der Velde G et al (2003) Zebra
mussels (Dreissena polymorpha) in Ireland, AFLP-fin-
gerprinting and boat traffic both indicate an origin from
Britain. Freshw Biol 48:1127–1139
Pollux BJA, Van der Velde G, Bij de Vaate A (2009) A per-
spective on global spread of the zebra mussel Dreissenapolymorpha: a review on possibilities and limitations. In:
Van der Velde G, Rajagopal S, Bij de Vaate A (eds) The
Zebra Mussel in Europe. Backhuys Publishers, Leiden,
pp 47–61
Raymond M, Rousset F (1995) GENEPOP (V. 1.2): a popu-
lation genetics software for exact tests and ecumenicism. J
Hered 86:248–249
Reeders HH, Bij de Vaate A (1990) Zebra mussels (Dreissenapolymorpha): a new perspective for water quality man-
agement. Hydrobiologia 200/201:437–450
Reeders HH, Bij de Vaate A, Slim FJ (1989) The filtration rate
of Dreissena polymorpha (Bivalvia) in three Dutch lakes
with reference to biological water quality management.
Freshw Biol 22:133–141
Reeders HH, Bij de Vaate A, Noordhuis R (1993) Potential of
the Zebra nussel (Dreissena polymorpha) for water qual-
ity management. In: Nalepa TF, Schloesser DW (eds)
Zebra mussel: biology, impacts, and control. Lewis Pub-
lishers, CRC Press, Boca Raton, USA, pp 439–451
Roberts L (1990) Zebra mussel invasion threatens US waters.
Science 249:1370–1372
Ronquist F, Huelsenbeck JP (2003) MrBayes 3: Bayesian
phylogenetic inference under mixed models. Bioinfor-
matics 19:1572–1574
Ruiz-Altaba C, Jimenez PJ, Lopez MA (2001) El temido me-
jillon cebra empieza a invadir los rıos espanoles desde el
curso bajo del rıo Ebro. Quercus 188:50–51
Saitou N, Nei M (1987) The neighbour-joining method: a new
method for reconstructing phylogenetic tree. Mol Biol
Evol 4:406–425
2158 S. Rajagopal et al.
123
Saunders JA, Mischke S, Hemeida AA (2002) The use of AFLP
techniques for DNA fingerprinting in plants. Application
information, Beckman Couter, California, pp 1–9
Schloesser DW, Nalepa TF, Mackie GL (1996) Zebra mussel
infestation of unionid bivalves (Unionidae) in North
America. Am Zool 36:300–310
Schneider S, Roessli D, Excoffier L (2000) Arlequin: a soft-
ware for population genetics data analysis. Ver 2.000.
Genetics and Biometry Lab, Department of Anthropology,
University of Geneva
Schneider DW, Stoeckel JA, Rehmann CR et al (2003) A
developmental bottleneck in dispersing larvae: implica-
tions for spatial population dynamics. Ecol Lett 6:352–360
Shannon CE, Weaver W (1949) The mathematical theory of
communication. University of Illinois Press, Urbana
Stepien CA, Taylor CD, Dabrowska KA (2002) Genetic vari-
ability and phylogeographical patterns of a nonindigenous
species invasion: a comparison of exotic vs. native zebra
and quagga mussel populations. J Evol Biol 15:314–328
Stoeckel JA, Schneider DW, Soeken LA et al (1997) Larval
dynamics of a riverine metapopulation: implications for
zebra mussel recruitment, dispersal, and control in a large
river system. J North Am Benthol Soc 16:586–601
Stoeckel JA, Rehmann CR, Schneider DW et al (2004)
Retention and supply of zebra mussel larvae in a large
river system: importance of an upstream lake. Freshw Biol
49:919–930
Strayer DL, Caraco NF, Cole JJ et al (1999) Transformation of
freshwater ecosystems by bivalves. Bioscience 49:19–27
Therriault TW, Orlova MI, Docker MF et al (2005) Invasion
genetics of a freshwater mussel (Dreissena rostriformisbugensis) in eastern Europe: high gene flow and multiple
introductions. Heredity 95:16–23
Van der Velde G, Paffen BGP, Van den Brink FWB et al
(1994) Decline of zebra mussel populations in the Rhine–
Competition between two mass invaders (Dreissenapolymorpha and Corophium curvispinum). Naturwissens-
chaften 81:2–34
Vekemans X, Beauwens T, Lemaire M et al (2002) Data from
amplified fragment length polymorphism (AFLP) markers
show indication of size homoplasy and of a relationship
between degree of homoplasy and fragment size. Mol
Ecol 11:139–151
Vos P, Hogers R, Bleeker M et al (1995) AFLP: a new tech-
nique for DNA fingerprinting. Nucleic Acids Res 23:
4407–4414
Weir BS, Cockerham CC (1984) Estimating F-statistics for the
analysis of population structure. Evolution Int J org Evo-
lution 38:1358–1370
Wilson AB, Naish KA, Boulding EG (1999) Multiple dispersal
strategies of the invasive quagga mussel (Dreissena bug-ensis) as revealed by microsatellite analysis. Can J Fish
Aquat Sci 56:2248–2261
Yeh FC, Yang R, Boyle TBJ et al (1997) POPGENE, the user-
friendly shareware for population genetic analysis.
Molecular Biology and Biotechnology Centre, University
of Alberta, Canada
Origin of Spanish invasion by the zebra mussel 2159
123
Recommended


