
Population Studies of
Eurasian Watermilfoil (Myriophyllum spicatum) and Zebra Mussels (Dreissena polymorpha)
in Conesus Lake, N.Y. (Summer 2000)
Prepared for the Livingston County Planning Department
With Funds Provided by New York State Under the Finger Lakes-Lake Ontario Watershed
Protection Alliance Program
by Isidro Bosch, Joseph C. Makarewicz∗,
Jennifer P. Emblidge, Douglas A. Johnson and Michael D. Valentino
Department of Biology, SUNY College at Geneseo
and *Center for Applied Aquatic Science and Aquaculture
Department of Biological Sciences SUNY College at Brockport
January 2001

2
TABLE OF CONTENTS
Page
Executive Summary ……………………………………………………… 3
Table Legends …………….………………………………………………. 5
Figure Legends …………….…………………………………………….. 6
Introduction ………………………………………………………..…….. 7
Procedures and Materials ………………………………………………… 9
Results and Discussion …..………………………………………….…… 12
Summary and Conclusions ……………………………………………….. 16
Acknowledgements ……………………………………………………….. 19
Literature Cited ………………………………………………………….… 21
Tables ………………………………………………………………………. 23
Figures ………………………………………………………………….… 29

3
EXECUTIVE SUMMARY 1. We studied the distribution and density of macrophyte beds dominated by
Eurasian watermilfoil and of populations of zebra mussels in Conesus Lake to
better understand the impact of these species on the lake ecosystem and to
provide a scientific foundation for possible management strategies. Two sites,
sampled by Herman Forest since 1967 and by our group in 1999, were
revisited and sampled in 2000 to provide a comparable data base for evaluating
long-term trends in macrophyte biomass.
2. Twelve dense macrophyte beds consisting of more than 95% Eurasian
watermilfoil were found in shallow coves and off points in the north basin and
in the upper south basin. Owing to more narrow slopes and greater depths, the
far southern areas of the lake were relatively free of milfoil beds.
3. The largest watermilfoil bed, located off Sand Point in the north end, covered
an area of 0.34 km2 (the equivalent of 84 acres) and contained an estimated
biomass of 87 thousand kg dry weight. Average bed size was 0.05 km2 or
approximately 12.4 acres.
4. Without exception, watermilfoil beds were located in the proximity of streams
and drainage pipes, including several which have been shown to deliver high
loads of nutrients from the watershed into the lake. We suggest that these
sources have caused significant local enrichment of macrophyte growth and
therefore warrant special attention in any management considerations.
5. At the long term study sites near Wilkins Creek and Sand Point, macrophyte
biomass was relatively low compared to 1999 and 9 other years. In contrast,
blooms of filamentous green algae in Conesus Lake reached nuisance levels,
particularly near streams and runoff pipes. The balance between macrophyte
growth and filamentous algal growth near streams and runoff pipes could be a
fruitful area for future investigations.

4
6. Surveys in seven widely distributed locations revealed that adult zebra
mussels were abundant in nearly every available substrate from the shoreline to
a depth of about 10 m.
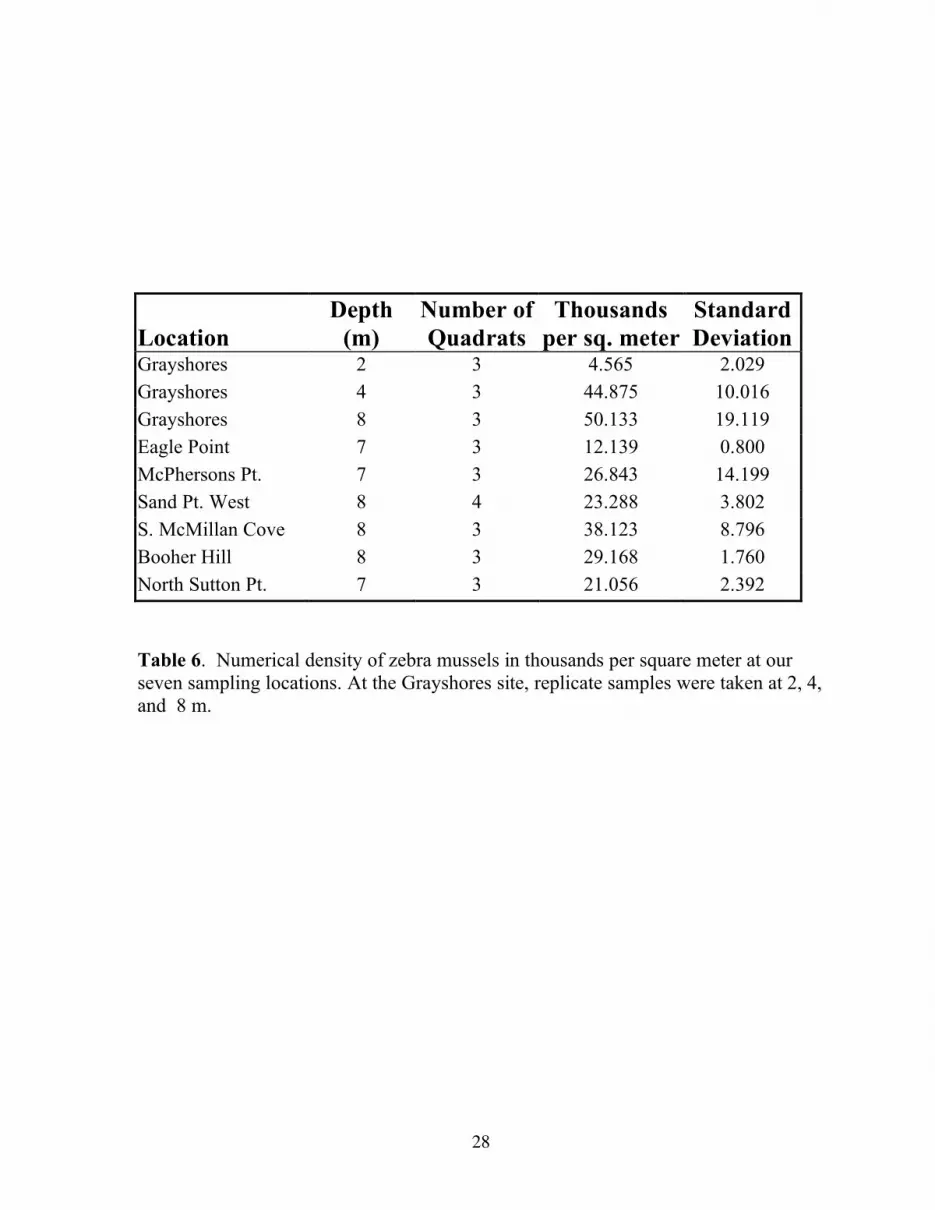
7. Population densities at a depth of 8 m ranged from an average low of 12,139
individuals per m2 off Eagle Point to an average high of 50,133 individuals
per m2 off Grayshores. These densities are slightly higher than those reported
for established populations in 32 European lakes, but moderate in comparison
to reports of maximum numbers reaching 250 thousand individuals per m2 in
newly invaded North American lakes.
8. Continued monitoring is necessary to better understand the population
dynamics of zebra mussels in Conesus Lake.

5
TABLE LEGENDS
Table 1. English unit equivalents of some of the metric units used in this report ………..…………………………………………………23 Table 2. Macrophyte biomass at selected beds in Conesus Lake. Collections were made from Aug. 3-10, 2000. All but the Wilkins Creek samples and the 1.5 m Sand Point sample represent areas dominated by Eurasian watermilfoil ………….……..…………………………...24 Table 3. Estimated surface area and total standing crop of the watermilfoil beds mapped using GPS. The standing crops were calculated by multiplying the surface area of the bed times the average dry
weight. m-2 determined by quadrat sampling ………………………. 25 Table 4 Historical record of standing crops at various depths in the Wilkins Creek site. Data from 1999 and 2000 are from Bosch et. al. 1999, and this study. Previous data are from work by Herman Forest
and his colleagues and were extracted from various published and unpublished sources .……………..………………………………...26
Table 5 Historical record of standing crops at various depths off Sand Point. All sources are as described in Tabled 4 for Wilkins Creek ……….27 Table 6. Numerical density of zebra mussels (individuals . m-2) at our seven sampling sites. At the Grayshores site, replicate samples were taken at 2, 4, and 8 m. Samples at all other sites were at depths of about 8 m. Sample size was 3-4 replicate quadrats per site …………….28

6
FIGURE LEGENDS Figure 1. Map of Conesus Lake showing sites where quantitative studies of macrophytes and zebra mussels were carried out ………………..29 Figure 2. Location of the watermilfoil beds in Conesus Lake. The coordinates for the outer margin of each bed were mapped as a continous track using a Trimble model TSC1 GPS. Shown are maps of the northern (A) central (B-C) and southern (C) portions of the lake ……………30 Figure 3. Historical record of macrophyte biomass at Wilkins Creek. The 2000 values were moderate to low compared to 9 other years, and much lower than the values obtained during our 1999 study ……..34 Figure 4. Historical record of macrophyte standing crops at Sand Point. Although less comprehensive than the Wilkins Creek record, the 2000 values appear to be low to moderate compared to 1999 and other years ..….………………………………………………….…35 Figure 5. Numerical abundance (individuals . m-2 )and biomass (kg. m-2 ) of adult zebra mussels at selected locations. Three depths were sampled off Grayshores. At all other sites, samples were taken
from a depth of about 8 m …..………………….………………….36 Figure 6. Length frequency distributions of zebra mussels at the 7 sampling sites. Subsamples of at least 100 mussels were taken and the individuals were measured to the nearest mm. Two replicate cores were analyzed for each site ……..………………………………...37

7
INTRODUCTION
The transport of species across natural barriers by human activities (i.e.
shipping, agriculture, fishery stocking) poses a great threat to the uniqueness of
native biological communities and to the integrity of ecosystem processes. In the
United States alone, according to Mills and his colleagues (1993), at least 4500
nonindigenous species have established free living populations, and approximately
15% of these have caused severe harm to agriculture, human health and the
environment. Recognizing the potential threat to native ecosystems, Carlton and
Geller (1993) referred to the problem of species introductions as "ecological
roulette".
The Great Lakes have been subject to nonindigenous species invasions since
the arrival of Europeans, and their history offers one of the most profound examples
of the ecological impact of species introductions (Mills et al. 1993). Since the
1800's, 139 aquatic organisms have become established in the Great Lakes
watershed, and of these nearly one third have arrived in the last 30 years. Some of
the more notorious invaders that have significantly altered the ecosystem include
animals such as the sea lamprey, the alewife, the Asiatic clam, and more recently the
zebra and quagga mussels, the spiny waterflea and the fishhook waterflea; and plants
such as the purple loosestrife, the waterchestnut and the Eurasian watermilfoil (Mills
et al. 1993).
As with the Great Lakes, the character of our own Conesus Lake has been
altered significantly by the establishment of nonindigenous species. The alewife
(Alosa pseudoharengus), Eurasian watermilfoil (Myriophyllum spicatum) and zebra
mussels (Dreissena polymorpha) are three nonindigenous species which have
become dominant in Conesus Lake. The impact of the alewife on the lake ecosystem
and on lake water quality has been documented by Makarewicz and his students
(Makarewicz, 1986; Puckett, 1989; Makarewicz, 2000). The extent to which

8
watermilfoil and zebra mussel populations have expanded in the lake and their
potential impact on the ecosystem have not been studied.
The primary goal of our research during the summer 2000 was to examine the
distribution and density Eurasian watermilfoil beds and of populations of zebra
mussels in Conesus Lake. The results of this study improve our knowledge of these
populations and contribute to the scientific foundation required for consideration of
possible management strategies. A secondary goal of this project was to extend our
long term database on macrophyte growth at two sites first studied by Herman
Forest and his colleagues in 1967.
Background on Zebra Mussels and Watermilfoil
Zebra mussel (Dreissena polymorpha) larvae were first identified in Conesus
lake during the summer of 1992, approximately 6 years after they had been
accidentally brought from Eurasia to the Great Lakes watershed in the ballast water
of a transatlantic cargo ship. By the fall of 1994 large populations of zebra mussels
occupied the whole south basin of Conesus Lake. From there they spread with the
prevailing currents northward into the north basin and by the fall of 1998 occupied
every suitable benthic habitat.
To date there are no quantitative studies of adult zebra mussel populations in
Conesus lake. Students from SUNY Geneseo documented the summer production of
veliger larvae from 1995-97 and again in 1999 (Bosch, unpublished) and found that
summer larval densities had declined from an average of 10,000 .m-3 in 1995 to less
than 3,000 .m-3 in 1997 and 1999. Whether this decline in larval supply is indicative
of changes in the adult population remains uncertain.
Evidence from studies in the Great Lakes and elsewhere indicate that zebra
mussels have a profound impact on native ecosystems. Large populations clear the
water of suspended material, alter the nutrient balance (e.g. carbon, phosphorus)
between the water column and the benthic compartments of the ecosystem, and

9
outcompete native species for food and space. The specific consequences of these
changes are currently under investigation in other lakes. A well known indirect
outcome of zebra mussel feeding is an increase in the amount of light penetrating the
water and reaching the bottom of the lake. This trend has been correlated with the
increased growth of attached algae and macrophytes in the nearshore environment
(Skubinna et al. 1995).
The first verified record of Eurasian watermilfoil (Myriophyllum spicatum) in
North America was from the Potomac River, Virginia in 1881. When and how this
species spread from Virginia to its nearly ubiquitous present range was not well
known until the work of C.F. Reed in 1977. Some of this uncertainty was the result
of the strong morphological and ecological similarities between M. spicatum and the
native North American watermilfoil, M. exalbescens. A debate over the taxonomy
of the two forms persisted well into the 1970's. In time, Nichols (1975), Aiken and
his colleagues (1979, 1980) and others were able to reliably distinguish the two
forms as species on the basis of morphological and ecological criteria that were
consistent in the field as well as in the laboratory under different growth conditions.
The first comprehensive study of the macrophyte community in Conesus Lake
was by Muenschner (1927). According to Forest (1978), Muenschner judged several
species to be "predominant" and included among these was Myriophyllum, which
Muenschner identified as M. exalbescens. Forest (1971, 1978) recognized the
uncertainty of the taxonomic distinction between the two types of watermilfoil and
cautiously resisted making definitive species designations in any of his collections.
Consequently the approximate time of arrival of the Eurasian species in Conesus
Lake can not be ascertained.
Eurasian watermilfoil is a vigorous plant that favors eutrophic waters and by
shading effectively excludes other species from its habitat. Its branches regularly
reach the surface, covering as much as 80% of the surface in some lakes. Forest
(1978) remarked that Myriophyllum in Conesus Lake" is important and at times

10
greatest in bulk". This trend is reflected in Forest's unpublished quantitative data
from the late 60's and 70's. Whether his records encompass one or both types of
watermilfoil is of interest but of no great consequence to present concerns about the
lake. Many of Forest's original research sites were surveyed by our group in 1999
(Bosch et al, 1999) and were found to be dominated by dense stands that were almost
monocultures of Eurasian watermilfoil. The proliferation of this species is one of the
greatest environmental problems in Conesus Lake today.
PROCEDURES AND MATERIALS
Our study was carried out between July and November 2000 in Conesus Lake,
NY (Lat 42˚ 47' N; Long 77˚ 43' W). The main objectives of our work were to (1)
map the distribution and surface area coverage of the principal watermilfoil beds in
the lake; (2) determine the density and standing crops of plants within each bed; and
(3) characterize the population size of adult zebra mussels in the lake. Collections of
zebra mussels were made in late July. Mapping and quantitative collections in
macrophyte beds were carried out from early to mid August. Qualitative
observations of some of the beds were made in September and October.
Macrophyte Collections
A variety of sources including the herbarium collection at SUNY Geneseo
were used to identify species (Hotchkiss, 1967, Prescott 1980). The field guide by
Borman and colleagues (1998) proved to be the most useful for field identifications.
The principal beds that extended to the water's surface were identified initially
by visually surveying the perimeter of the lake. Subsequently a Trimble Model
TSC1 global positioning system (Trimble Navigation Ltd.) was used to map the
beds. The surface area of each bed was delineated by having a swimmer in
snorkeling gear track its perimeter visually while an operator on board a trailing boat
recorded georeferenced positions with the GPS (latitude-

11
longitude or UTM points) every few seconds on a continuos track. Since our
interest was primarily on the distribution of watermilfoil, the swimmer essentially
followed the margin of the watermilfoil growth. The outer margin of watermilfoil
beds were abrupt and well defined, typically at a depth 3-3.5 m. The inner margins
were less defined and often difficult to track. Accordingly, we defined our inner
boundary as the position where watermilfoil represented about 50% of the total plant
number. While this procedure introduced a margin of error in our estimates of bed
surface area and standing crop, we believe the error to be relatively small due to the
small size of watermilfoil plants and the low biomass in the shallows.
ArcView software (Esri Inc.) was used to superimpose the graphical data on a
high-resolution topographic map of Conesus Lake and the surrounding watershed
and to estimate the surface area of each bed.
Th procedures followed for quadrat sampling are described in a previous
report (Bosch et al., 1999). Briefly, 3 or 4 replicate quadrats were taken by
S.C.U.B.A. divers at depths ranging from 2 - 3.5 m within each bed (Fig. 1). The
quadrat was a PVC square with sides of 0.5 m which were held together by PVC
elbows. Within a few hours of collection the samples were processed in our
laboratory. Hundreds of zebra mussels had to be removed manually from each plant
before they could be weighed. Bulk plant samples were blotted dry, sorted by
species and weighed to the nearest 0.1 g. To be consistent with the procedures used
by Forest and colleagues in previous studies we converted blotted wet weights to dry
weights using an average wet weight to dry weight conversion of 0.10 (Forest et al.
1971; 1978). Our own estimates of blotted wet weight to dry weight conversions for
watermilfoil are approximately 12%.
Zebra Mussel Collections

12
Adult zebra mussels were collected at seven representative locations
distributed throughout the lake (Figure 1). Replicate quadrat samples (3-4) were
taken by divers using a PVC square with a total sample surface area of 0.125 m2
(0.25 m per side). Mussels were collected by hand and loaded into a 1 L wide-
mouth jar that was covered on one side with 1mm plastic mesh. Individuals were
separated from empty shells in the laboratory and counted. For each quadrat, a
representative subsample of more than 100 individuals was weighed to obtain an
average weight per animal. The remainder of the bulk sample was weighed and the
total number of individuals in a quadrat was estimated by dividing the bulk sample
weight by the average weight per individual. The height and length of 100-200
animals from each sampling site were measured under a stereomicroscope to the
nearest mm.
Our first collections were made off Grayshores, which proved to be an
excellent location from a standpoint of safety and accessibility. At the Grayshores
site multiple samples were taken from 2, 4 and 8 m depth, in part to determine the
optimal depth for the remaining collections. The 2 m collection depth fell within the
marginal band of milfoil. Milfoil plants seem to be a preferred substrate for
thousands of very small zebra mussels which were not considered in our bottom
sampling scheme. Plants were sparse or absent at the 4 m sites but a steep slope at
these depths tended to make sampling more difficult. At depths of about 8 m, zebra
mussels of all sizes formed a dense carpet over the gradually sloping bottom. Below
10 m the populations were always sparse or absent. Taking these patterns into
consideration we decided to base our survey on populations in the 8 m depth range.
RESULTS AND DISCUSSION
Distribution and Standing Crops of Eurasian Watermilfoil
The survey of macrophyte bed distribution using global positioning systems
(GPS) provided some valuable insights into the environmental factors that foster

13
plant growth. We emphasize that the beds mapped in this study were ones
dominated by Eurasian watermifoil. Milfoil beds are visible from the surface,
sometimes at a distance of more than one hundred meters. They form a very dense
growth with thick tangles of branches near the surface and consequently pose
considerable hindrance to recreational use of the lake. Several other macrophyte
species form expansive beds in Conesus Lake (ex. eelgrass), but these plants rarely
grow to the surface and their impact on public aesthetic perception and recreational
use of the lake is limited.
The distribution of the Eurasian milfoil beds in the lake is shown in Figure
2A-D. Starting from the north end the beds were distributed as follows: as shown in
Figure 2A, a bed south of Sand Point over a broad shallow shelf southeast nearly to
Wilkins Creek and southwest past Pebble Beach cove; one from Graywood to Gray
Center continuing south past "Gray Gully"; as shown in Figure 2B, a large bed
extending from Eagle Point well into Sacketts Harbor to the south; one off Sand
Point north of Sand Point Gully; off Long Point and into Long Point Cove; on the
east shore, off Orchard Point extending into north and central McPhersons Cove; and
off McPhersons Point extending south to the state boat launch; as shown in Figure
2C a small bed south of Harston Point near an unnamed rivulet; across to the west
two small beds located near large runoff pipes; a small narrow bed off Booher Hill;
and a larger, discrete bed north of Cottonwood Gully; as shown in Figure 2D, a
small bed off North Sutton Point. There was very little milfoil in the large bed that
covers most of the south end of the lake, near the inlet.
Without exception the watermilfoil beds described in this study were
associated with a stream or large drainage pipes . A good example is the bed near
Sand Point (west shore, Figure 2B). This dense, well defined bed grows in a
shallow shelf immediately to the north of Sand Point Gully , where it would be
bathed directly by runoff from the stream under the prevailing southwesterly winds.
As is true of many of the major streams and rivulets in the lake, Sand Point Gully, is

14
known to contribute significant loading of sediment and nutrients to the lake
(Makarerwicz et al. 1991; Makarewicz in preparation). In addition to the direct
fertilizing effect of stream runoff, a wide shallow shelf and a southern exposure are
factors that possibly contribute to the distribution pattern of milfoil beds in Conesus
Lake.
The biomass of macrophytes in the large beds dominated by Eurasian
watermilfoil ranged from a high of 389 g . m-2 off Booher Hill to a low of 92 g . m-2
in McPhersons Cove (Table 2) . Typically, these samples consisted of more than
>95% watermilfoil by weight. Overall, the biomass densities for the summer 2000
in the milfoil beds were 29-66 % lower than values recorded in 1999 for some of the
same sites.
We used the average August biomass obtained from our quadrat samples and
multiplied them by the calculated surface areas of the respective beds to generate
estimates of watermilfoil standing crops (Table 3). The largest standing crop,
representing more than 87 thousand kg dry weight was in the north end bed.
Standing crops in the other beds ranged from a low of 345 kg dry wt. for a small bed
near Harston Point (So. Gully) to a high of 10,298 kg in Eagle Point/Sacketts Harbor
bed.
Interannual Patterns of Macrophyte Density
In addition to quadrat collections taken within the beds dominated by Eurasian
watermilfoil, quadrat samples were collected at various depths along two transects,
one just north of Wilkins Creek and one south of Sand Point. These transects
correspond to the approximate locations sampled by Herman Forest and his
colleagues over the years (Forest et al. 1971; Forest et al. 1978; Makarewicz et al
1991; Forest unpublished data) and by our group in 1999 (Bosch et al. 2000). As in
our previous studies the collections were made during a time which we estimated to
be the height of the growing season for Conesus Lake. Because there are no

15
previous estimates of the size of the macrophyte beds it is not possible to determine
how surface area and total biomass have changed over the years. Our analysis of
long term trends is based on the average macrophyte biomass observed in a square
meter of water surface at selected sites within a macrophytes bed.
In the Wilkins Creek site collections were made at depths of 1.5, 3 and 4 m.
The highest average biomass along the transect was 419 g..m-2 at depths of 1-1.5 m.
Eelgrass was the dominant species at these depths. At a depth of 4 m coontail
(Ceratophyllum demersum) was the dominant species and the biomass was relatively
low (95 g.m-2). Eurasian watermilfoil was present in the 3-4 m depth range, but the
Wilkins Creek sampling site was one of the few in which the native species are
dominant at these depths. Collections made at a depth of 1.5 m directly south of
Sand Point also yielded a high biomass (513 g.m-2 ) and eelgrass was once again the
dominant. At depths of 3 m and below, the Sand Point transect was dominated by
Eurasian watermilfoil, but the average biomass was relatively low (94 g.m-2 ).
The average macrophyte biomass per square meter in the summer 2000 was
generally low to moderate compared to 1999 and previous years (Table 4-5, Figs 3-
4). Differences between the last two years are particularly interesting and warrant
further consideration. As we discussed in the previous section, typical biomass in the
Eurasian milfoil beds in August 2000 was 24-66% lower than in August 1999. At our
Wilkins Creek study site, which is more representative of the native flora, the
biomass in the eelgrass dominated shallows (1-2 m) was similar in the two years
(Table 4). However at a depth of 3 m the average biomass was nearly 3 times higher
in 1999; and at 4 m the biomass was nearly 5 times higher. A similar contrast
between the two years is evident in the Sand Point data (Table 5).
The growth of aquatic plants can be influenced by a number of physical and
chemical forces which include light, water transparency, site exposure, hydrostatic
pressure and nutrient availability (Aiken and Piccard 1980; Middleboe and Markager
1997; Hudon et al. 2000). There is no direct evidence that indicates which of these

16
factors, if any, can account for the lower macrophyte biomass in Conesus Lake
during the summer 2000. One plausible explanation is that growth might have been
light-limited during the cloudy and rainy summer. This hypothesis is consistent with
the observations that growth of eelgrass and of filamentous algae was extensive in
the shallows of the lake (unpublished data) while at greater depths macrophyte
biomass was relatively low.
Abundance and Population Structure of Zebra Mussels
Zebra mussels were abundant from nearshore to a depth of approximately 10
m at all 7 sites sampled quantitatively. According to our qualitative observations
over the last two years, they are present throughout the lake above a depth of 10 m,
which is approximately the upper layer of the hypolimnion during the period of
stratification in the Conesus Lake. The numerical density of mussels and their
corresponding mass per unit area for our 7 sampling sites are shown in Table 6 and
Figure 5. At our Grayshores station, the number of adults at 2 m was relatively
low. These samples were collected from the bottom within a stand of watermilfoil.
Large numbers of smaller zebra mussels also lived along the stem of milfoil plants,
but these populations were not accounted for in our quadrat sampling protocol. The
4 m and 8 m samples yielded much higher densities of adult mussels, averaging 45
thousand and 50 thousand individuals. m-2, respectively. These were among the
highest values found at any of our collection sites. A similar pattern of distribution
has been noted by researchers in European lakes (Stanczykowka, 1977).
The biomass (kg. m-2) recorded for the 4 m depth in the Grayshores site was
considerably lower than the biomass at 8 m . We can attribute this difference to the
uniformly smaller mussels inhabiting the shallower site (data not shown). Why such
differences exist between proximate sites remains a mystery. Similar contrasts
could be made among several of our other sampling sites on the basis of the length
distributions of the subpopulations (Figure 6). In our Sutton Point and McPherson

17
Point sites, for example, the average zebra mussel length was approximately 0.9 cm.
In Eagle Point and Grayshores the average length was between 1.3 and 1.5 cm, or
30-40% higher.
Adult zebra mussel densities as high as 250 thousand individuals. m-2 have
been found in Lake Ontario and other North American lakes, but numbers more
established populations seem to be consistently lower. Stanczykowka (1977)
compiled information for 32 European lakes where the species has more established
populations and reported average densities of 100 -14,000 individuals. m-2 .
With only one year's study of adult densities, the dynamics of the Conesus
Lake populations cannot be determined. Our unpublished studies of zebra mussel
veliger densities show that larval numbers averaged for the summer were
approximately 10,000 per cubic meter (. m-3), a relatively low density. Larval
numbers were lower in '96 and continued to decline to less than 3,000 . m-3 in '97,
and '99. These trends in larval numbers suggest that recruitment may be on the
decline, but only continued monitoring of adult populations can provide unequivocal
evidence of the fate of the zebra mussel in Conesus Lake.
SUMMARY AND CONCLUSIONS Macrophyte Studies 1. Submersed macrophytes form a dense band along the perimeter of Conesus Lake,
extending from a nearshore depth of about 0.5 m to a relatively shallow maximum
depth of 4 m. As in our 1999 survey, the dominant species during the summer 2000
were eelgrass and water stargrass at depths of 0.5-2 m and the Eurasian milfoil at
depths of 2-3.5 m; coontail and curly-leaf pondweed were sometimes well
represented at depths of 3.5 m and below. The species diversity of macrophytes
remains high along the shallow marginal zones of the lake, particularly between Sand

18
Point and Wilkins Creek near the north end, and between the inlet and South
McMillan Creek near the south end..
2. The perimeter band of macrophytes is punctuated by a series of expansive and
very dense beds that are dominated in coverage and biomass by Eurasian
watermilfoil. These beds are particularly common along shallow coves and off points
in the north basin and in the upper south basin of the lake. Owing to its narrower
slopes and greater depths, the far southern areas of the lake are relatively free of
milfoil beds.
3. The distribution of the macrophyte beds and surface area of each bed were
determined with a global positioning system which uses satellites and land based
transmitters to determine geographic position to a precision of less than one meter.
The largest watermilfoil bed, located off Sand Point in the north end of the lake,
covered an area of 0.34 km2 (about 84 acres). Expansive watermilfoil beds were
also found on a number of other coves and points throughout the lake.
4. These watermilfoil beds were invariably located very near streams or large runoff
pipes. A broad, shallow shelf and some degree of southern exposure seemed to be
also necessary for the sustenance of these beds.
5. The average milfoil biomass was low compared to 1999. At our long term study
sites near Wilkins Creek and off Sand Point, biomass levels were also low to
moderate compared to 9 other years from 1968-1999. However, the standing crops
calculated from biomass and area measurements reveal that the lake continues to
harbor vast amounts of macrophytes, particularly in the form of Eurasian milfoil
beds.

19
6. The relatively low macrophyte densities in 2000 may be attributable to low light
levels during the rainy summer. In contrast, filamentous green algae growing in or
on the canopy of milfoil beds and along the shallow shoreline reached nuisance
levels, particularly near streams and other sources of runoff. The balance between
macrophyte growth and filamentous algal growth near streams could be a fruitful
area for future investigations.
7. Streams and other sources of runoff seem to have a fertilizing effect on
macrophyte communities, creating conditions that favor the proliferation of Eurasian
Watermilfoil and filamentous algae. Significant reduction of nutrient runoff from
these sources could mitigate excessive growth on a local scale. Mitigation of the
lake-wide problem of excessive macrophyte growth will require more
comprehensive and protracted measures.
Zebra Mussel Studies
1. Surveys by S.C.U.B.A. divers in seven widely distributed locations revealed that
adult zebra mussels were abundant in nearly every available substrate from the
shoreline to a depth of about 10 m.
2. Population densities at a depth of 8 m ranged from an average low of 12,139
individuals per m2 off Eagle Point to an average high of 50,133 individuals m-2 at a
site off Grayshores road .
3. Eurasian watermilfoil plants provide a suitable substrate for large numbers of
smaller zebra mussels, but a quantitative analysis of this habitat was beyond the
scope of our study.

20
4. The numerical abundance of adult mussels in Conesus Lake was slightly higher
than values reported for 32 European Lakes, but lower than in many newly colonized
lakes in North America. Whether Conesus Lake populations are stable, increasing or
on the decline cannot be ascertained from a single year's data. Research on adult and
larval population dynamics should be continued under the auspices of the monitoring
program.
ACKNOWLEDGEMENTS
We thank Joe Kane, Jack Baldwin and the members of the Conesus Lake
Association for their continued encouragement and for the generous gift of a pontoon
boat to SUNY Geneseo. We are indebted to Dr. Edwin Spicka and Mr. Bill Mathews
of SUNY Geneseo for unfailing support of our activities; and to Bill and JoAn Stein
for their generosity and kindness in providing a base of operations for our research
group. This study is dedicated to Jean Meekin, in appreciation of her spirited
concern for the environment and her dedication to the welfare of Conesus Lake.

21
LITERATURE CITED
Aiken, S.G., P.R. Newroth and I. Wile (1979). The Biology of Canadian Weeds.34. Myriophyllum spicatum. Canadian Journal of Plant Science 59:201-215. Aiken, S.G. and R. R. Picard. 1980. The influence of substrate on the growth and morphology of Myriophyllum exalbescens and Myriophyllum spicatum. Canadian Journal of Botany Vol. 58 pp 1111-1118. Borman, S., R. Korth and C. Watkins. 1998. Through the Looking Class: A Field Guide to Aquatic Plants. Univ. of Wisconsin Press. 256 pp. Carlton, J.T. and J. B. Geller. 1993. Ecological Roulette: The Global Transport of Nonindigenous Marine Organisms. Science 261: 78-82. Forest, H.S. and E.L. Mills. 1971. Aquatic flora of Conesus Lake. Proc Rochester Acad. Sci. # 12, pp 110-138. Forest, H.S., J.Q. Wade and T.F. Maxwell. 1978. The limnology of Conesus lake. In Lakes of New York State. Vol. I. Ecology of the Finger Lakes. J.A. Bloomfield, Ed. Academic Press, N.Y. pp. 122-221 Hotchkiss, N. 1967. Underwater and floating-leaved plants of the United States and Canada. Resource Publication #44, Bureau of Sport Fisheries and Wildlife. 124 pp. Hudon, C., S. Lalonde and P. Gagnon. 2000. Ranking the effects of site exposure, plant growth form, water depth, and transparency on aquatic plant biomass. Canadian Journal of Fisheries and Aquatic Science vol 57: 31-42. Makarewicz, J.C. 1986. Water Quality of Conesus Lake. Report to the Villages of Avon and Geneseo and the Town of Livonia. 85 pp.
Makarewicz, J.C., T.W. Lewis, R. Dilcher, M. Letson and N. Puckett. 1991. Chemical analysis and nutrient loading of streams entering Conesus Lake, NY. Report to the Livingston County Planning Department. 45 pp. Makarewicz, J.C., D. Beckstrand and I. Bosch. 1999. Management Approaches for the Control of Aquatic Plants. Report to the Livingston Co. Planning Department. 46 pp. Middleboe, A.L. and S. Markager. 1997. Depth limits and minimum light requirements of freshwater macrophytes. Freshwater Biology #37: 553-568. Mills, E.L, J.H. Leach, J.T. Carlton, & C.L. Secor. 1993. Exotic species in the Great Lakes: A History of Biotic Crises and Anthropogenic Introductions. J. Great Lakes Res. #19: 1-54.

22
Muenschner, W.C. 1927. Vegetation of Silver Lake and Conesus Lake. In "A Biological Survey of the Geneseo River Watershed" Suppl. To Annu. Rep. No. 16, pp 66-71, and Appendix VII, p. 86. N.Y. State Department of Conservation, Albany. Prescott, G.W. 1980. How to know aquatic Plants. In the Pictured Key Nature Series, Wm. C. Brown Publishers, Iowa. 158 pp.
Puckett, N. 1989. Trophic level changes and alewife predation in Conesus Lake. M.S. Thesis, SUNY Brockport, Brockport NY.
Reed, C.F. 1977. History and distribution of Eurasian watermilfoil in the United States and Canada. Phycologia 36: 417-436. Skubina, J.P., T.G. Coon & T.R. Batterson. 1995. Increased abundance and depth of submersed macrophytes in response to decreased turbidity in Saginaw Bay, Lake Huron. J. Great Lakes Res. 21: 476-478. Stanczykowska, A. 1977. Ecology of Dreissena polymorpha (Pall.) (Bivalvia) in Lakes. Pol. Arch. Hydrobiol. 24:461-530.

23
Table 1. English equivalent of metric units used in this report.
Metric Units English Unit Equivalent
meter (m) 3.28 feet
centimeter(cm) 0.4 inches
millimeter(mm) 0.04 inches
Square meter (m2) 0.093 square ft
gram(g) 0.35 ounces;0 .0022 lbs
Kg per square meter
(kg.m-2
)
0.205 lb per square ft
milliliter (ml) 0.034 fluid ounces
Liter (L) 34 fluid ounces

24
Depth # of Mean Dry Wt. Standard Location (m) Quadrats (g/square meter) Deviation
McPherson Cove 3 3 92 13 Orchard Point 3 3 147 53
Eagle Point 3 4 170 61 Sand Point West 3 3 212 29
McPherson Point 3 3 262 134 Long Point 3 3 252 35 Booher Hill 3 3 389 61 Cottonwood 3 3 193 85 McMillan 3 3 132 33
North Sutton Point 3 3 184 43 Sand Point North 1.5 3 513 12 Sand Point North 3 3 94 44
Wilkins Creek 1.5 3 419 133 Wilkins Creek 3 4 133 30 Wilkins Creek 4 3 95 6
Table 2. Macrophyte biomass at selected beds in Conesus Lake. Collections were made from Aug. 3-10, 2000. All but the Wilkins Creek samples and the 1.5m Sand Point sample represent areas dominated by Eurasian watermilfoil.

25
Macrophyte Bed Area Biomass /Area Total Biomass Location ( m2 ) (kg. m-2) (kg dry wt)
North End 337,547 0.259 87,425 Eagle Pt./Sacketts Harbor 60,574 0.17 10,298 Old Orchard Point 54,294 0.147 7,981 Long Point Cove 1 37,080 0.252 9,344 "Gray Gully" 23,351 0.238 5,557 McPhersons Point 23,192 0.267 6,192 Cottonwood Gully 15,070 0.193 2,909 Sand Point Gully 9,535 0.212 2,021 Long Point Cove 2 4,852 0.252 1,223 Booher Hill 4,673 0.389 1,818 Harston Point 3,746 0.092 345 North Sutton Point 2,756 0.184 507 Table 3. Macrophyte biomass at selected beds in Conesus Lake. Collections were made from Aug. 3-10, 2000. All but the Wilkins Creek samples and the 1.5 m Sand Point samples represent areas dominated by Eurasian watermilfoil.

26
Depth # of Mean Dry Wt. Standard
Year of Collection (m) Quadrats (g/sq.meter) Deviation Summer 1968 0.5 1 562
2 1 499 2.5 1 332 5 1 1410
September 14, 1969 1 9 513 191 2.5-3.5 6 1816 3 3 973 362 5.5 1 463
August 26, 1970 1 5 431 2 5 499 3 5 1407
September 20, 1970 1 5 551 225 1.75 2 2054 205
July 25,1975 2 1 885 3.5 1 568
July 7, 1978 1 3 91 2 3 372
August 15, 1978 0.5 3 256 2 4 391 62
September 28, 1978 2 3 482 October 27, 1978 2 3 244 303 August 31, 1979 3 3 170
July 22, 1984 3 1 417 August 28, 1984 Average 1 318 August 20, 1985 1 1 120
2 1 350 3 1 525 4 1 1400
August 8, 1999 1 3 490 0 2 3 687 267 3 3 390 275 4 3 493 39
August 10, 2000 1.5 3 419.23 132 3 4 133.47 30 4 3 95.05 6
Table 4. Historical record of standing crops at various depths in the Wilkins Creek site. Data from 1999 and 2000 are from Bosch et. al. 1999, and this study. Previous data are from work by Herman Forest and his colleagues and were extracted from various published and unpublished sources.

27
Depth # of Mean Dry Wt. Standard
Date (m) Quadrats (g/sq.meter) Deviation Summer 1968 0.5 1 82
1 1 235 2 1 256 3.5 1 1470 5.5 1 214 7 1 562
August 14, 1969 3 6 908 5.5 3 454
August 25, 1975 2.0-3.0 4 521 47 July 7, 1978 2 5 183 July 13, 1978 2.5 3 184
3-3.5 3 88 August 15, 1978 3 3 101
4 6 71 50 September 28, 1978 2 3 1033
3 6 289 117 4 6 160 0
October 27, 1978 2.5 3 782 July 31, 1979 2.5 4 296
2 4 301 July 7, 1984 2.5 1 687
3 1 473 3.5 1 478
August 20, 1985 1 1 120 2 1 350 3 1 350-700 4 1 1400
August 7, 1999 2 3 690 174 3 3 827 296 4 3 395 191
August 10, 2000 1.5 3 513 30 3 3 153 23
Table 5. Historical record of macrophyte standing crops at Sand Point. Although less comprehensive than the Wilkins Creek record, the 2000 values appear to be low to moderate compared to 1999 and other years. Sources of the data as in Table 4.
28
Depth Number of Thousands Standard Location (m) Quadrats per sq. meter Deviation Grayshores 2 3 4.565 2.029 Grayshores 4 3 44.875 10.016 Grayshores 8 3 50.133 19.119 Eagle Point 7 3 12.139 0.800 McPhersons Pt. 7 3 26.843 14.199 Sand Pt. West 8 4 23.288 3.802 S. McMillan Cove 8 3 38.123 8.796 Booher Hill 8 3 29.168 1.760 North Sutton Pt. 7 3 21.056 2.392 Table 6. Numerical density of zebra mussels in thousands per square meter at our seven sampling locations. At the Grayshores site, replicate samples were taken at 2, 4, and 8 m.

29
Sand Pt.
Old Orchard Pt.
McPherson Pt.
Cottonwood Pt.
Long Pt.
Eagle Pt.
x
x
x
x x
x 500m
x
Figure 2. Locations in Conesus Lake where quantitative surveys were carried out. X zebra mussels populations macrophyte surveys

30
Figure 2A. Location of the watermilfoil beds in Conesus Lake. The coordinates for the outer margin of each bed were mapped as a continous track using a Trimble model TSC1 GPS. Shown in 2A are the beds in the Northern portion of the lake.

31
Figure 2B. Watermilfoil beds in the central portion of Conesus Lake, including parts of the North basin and parts of the South basin.

32
Figure 2C. Larger scale view of the south basin showing the watermilfoil beds down to Cottonwood Gully along the southwest shore.

33
Figure 2D. The South end of the lake showing a small bed off North Sutton Point. Greater depths and narrower slopes limit the growth of watermilfoil in this region. The large macrophyte bed between the Inlet Stream and North McMillan Creek was dominated by eelgrass and other native species.

34
Figure 3. Historical record of macrophyte biomass at Wilkins Creek. The 2000 values were moderate to low compared to 9 other years, and much lower than values obtained during our 1999 study. See Table 4 for numerical data.

35
Figure 4. Historical record of macrophyte standing crops at Sand Point. Although less comprehensive than the Wilkins Creek record, the 2000 values appear to be low to moderate compared to 1999 and other years. See Table 5 for numerical data.

36
Figure 5. Numerical abundance (individuals . m-2 )and biomass (kg. m-2 ) of adult zebra mussels at selected locations. Three depths were sampled off Grayshores road. At all other sites, samples were taken only from a depth of about 8 m.

37
Figure 6. The length frequency distribution of zebra mussels at 7 sampling stations. Sub-samples of at least 100 mussels were taken and the individuals were measured to the nearest mm. Two replicate quadrats were analyzed for each site.
Recommended


