
Available online at www.sciencedirect.com
www.elsevier.com/locate/solener
Solar Energy 84 (2010) 986–996
Ray tracing study for non-imaging daylight collectors
Stephen Wittkopf a,b,*, Lars Oliver Grobe a, David Geisler-Moroder a, Raphael Compagnon c,Jerome Kampf b, Friedrich Linhart b, Jean-Louis Scartezzini b
a Solar Energy Research Institute of Singapore (SERIS), National University of Singapore (NUS), 7 Engineering Drive 1, Block E3A, #06-01,
Singapore 117574, Singaporeb Solar Energy and Building Physics Laboratory (LESO), Swiss Federal Institute of Technology Lausanne (EPFL), Switzerland
c College of Engineering and Architecture of Fribourg (EIA-FR), University of Applied Sciences of Western Switzerland (HES-SO), Switzerland
Received 12 August 2009; received in revised form 4 March 2010; accepted 7 March 2010Available online 2 April 2010
Communicated by: Associate editor Yogi Goswami
Abstract
This paper presents a novel method to study how well non-imaging daylight collectors pipe diffuse daylight into long horizontal fun-nels for illuminating deep buildings. Forward ray tracing is used to derive luminous intensity distributions curves (LIDC) of such col-lectors centered in an arc-shaped light source representing daylight. New photometric characteristics such as 2D flux, angular spread andhorizontal offset are introduced as a function of such LIDC. They are applied for quantifying and thus comparing different collectorcontours.� 2010 Elsevier Ltd. All rights reserved.
Keywords: Non-imaging daylight collectors; Performance criteria; Anidolic; Photometry; Forward ray tracing
1. Introduction
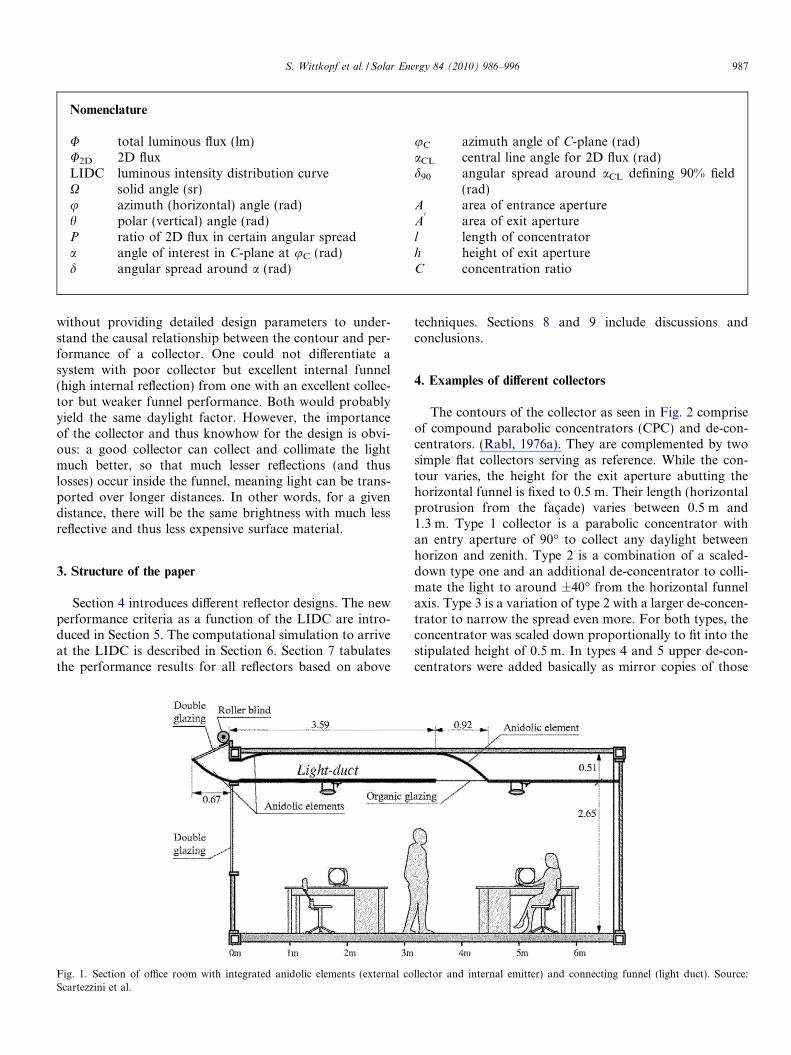
Non-imaging collectors are typically used to concentratelight through parabolic or elliptical mirrors. Compoundparabolic collectors are widely used to concentrate sunlightfor solar thermal applications (Hsieh, 1979; Winston, 1974;Rabl, 1976a,b; Eames, 1993; Welford and Winston, 1989).In buildings, anidolic (from Greek an: non and eidolon:image) daylight collectors can be used to collect and colli-mate daylight for efficient transportation into deep build-ings zones. They can be part of integrated systems asshown in Fig. 1. Here, the collector is located at the build-ing’s fac�ade or roof and is connected to a horizontal or ver-tical pipe for efficient transport of light over long distances
0038-092X/$ - see front matter � 2010 Elsevier Ltd. All rights reserved.
doi:10.1016/j.solener.2010.03.008
* Corresponding author at: Solar Energy Research Institute of Singa-pore (SERIS), National University of Singapore (NUS), 7 EngineeringDrive 1, Block E3A, #06-01, Singapore 117574, Singapore. Tel.: +65 65161454; fax: +65 6775 1943.
E-mail address: [email protected] (S. Wittkopf).
with diffusers to divert light into spaces that require light.These systems provide natural light well beyond the reachof conventional windows (Courret et al., 1998; Scartezziniand Courret, 2002; Compagnon et al., 1993). Their applica-tion in the tropics with bright zenithal skylight is promising(Wittkopf et al., 2006; Wittkopf, 2007; Lau et al., 2007).
2. Problem statement
Despite such promising experiments, integration of suchsystems into buildings is not widespread. Besides verticallight pipes (usually without anidolic collectors) no commer-cial systems are around to choose from. And because oflack of planning tools and guidelines, architects and engi-neers refrain from considering these systems. The authorsargue that using the traditional daylight factor approachalso does not help in the proliferation of anidolic daylightcollectors. It is rather a simple measure averaging thedaylight performance of the whole system into one value,
Nomenclature
U total luminous flux (lm)U2D 2D fluxLIDC luminous intensity distribution curveX solid angle (sr)u azimuth (horizontal) angle (rad)h polar (vertical) angle (rad)P ratio of 2D flux in certain angular spreada angle of interest in C-plane at uC (rad)d angular spread around a (rad)
uC azimuth angle of C-plane (rad)aCL central line angle for 2D flux (rad)d90 angular spread around aCL defining 90% field
(rad)A area of entrance apertureA0
area of exit aperturel length of concentratorh height of exit apertureC concentration ratio
S. Wittkopf et al. / Solar Energy 84 (2010) 986–996 987
without providing detailed design parameters to under-stand the causal relationship between the contour and per-formance of a collector. One could not differentiate asystem with poor collector but excellent internal funnel(high internal reflection) from one with an excellent collec-tor but weaker funnel performance. Both would probablyyield the same daylight factor. However, the importanceof the collector and thus knowhow for the design is obvi-ous: a good collector can collect and collimate the lightmuch better, so that much lesser reflections (and thuslosses) occur inside the funnel, meaning light can be trans-ported over longer distances. In other words, for a givendistance, there will be the same brightness with much lessreflective and thus less expensive surface material.
3. Structure of the paper
Section 4 introduces different reflector designs. The newperformance criteria as a function of the LIDC are intro-duced in Section 5. The computational simulation to arriveat the LIDC is described in Section 6. Section 7 tabulatesthe performance results for all reflectors based on above
Fig. 1. Section of office room with integrated anidolic elements (external coScartezzini et al.
techniques. Sections 8 and 9 include discussions andconclusions.
4. Examples of different collectors
The contours of the collector as seen in Fig. 2 compriseof compound parabolic concentrators (CPC) and de-con-centrators. (Rabl, 1976a). They are complemented by twosimple flat collectors serving as reference. While the con-tour varies, the height for the exit aperture abutting thehorizontal funnel is fixed to 0.5 m. Their length (horizontalprotrusion from the fac�ade) varies between 0.5 m and1.3 m. Type 1 collector is a parabolic concentrator withan entry aperture of 90� to collect any daylight betweenhorizon and zenith. Type 2 is a combination of a scaled-down type one and an additional de-concentrator to colli-mate the light to around ±40� from the horizontal funnelaxis. Type 3 is a variation of type 2 with a larger de-concen-trator to narrow the spread even more. For both types, theconcentrator was scaled down proportionally to fit into thestipulated height of 0.5 m. In types 4 and 5 upper de-con-centrators were added basically as mirror copies of those
llector and internal emitter) and connecting funnel (light duct). Source:

Fig. 2. Sections of 5 anidolic collector systems (types 1–5) and two test collectors (types 6 and 7) for evaluation of photometric quantities (all sizes inmeter); abutting funnels are outlined in dashed lines.
Fig. 3. LIDC of collector type 1 with the area considered for theperformance criteria 2D flux highlighted in grey.
988 S. Wittkopf et al. / Solar Energy 84 (2010) 986–996
in types 2 and 3. Two simple flat baffle collectors with 45�(type 6) and 26.6� (type 7) complete the set of collectors.The shapes for all concentrators and de-concentrators aregenerated through a special software for a given acceptanceangle, edge rays and overall height (kampf, 2000).
5. Proposed performance criteria
LIDC are already established formats for illustrating theluminous intensity distribution of light sources. Intensitiesare charted over defined horizontal angles u (called C-planes) and vertical angles h either absolutely or relativelyper 1000 lumen luminous flux. The authors suggest adopt-ing the LIDC standard for quantifying the luminous inten-sity distribution of anidolic collectors. The set newperformances criteria can all be derived from a LDIC;either generated through forward ray tracing simulationtechniques as in our case, or through actual measurements.
5.1. 2D flux
This is a general descriptor how much light is collected.Focusing on the collector’s two-dimensional geometry inthe XZ-plane, the 2D flux U2D in a single vertical plane,which combines two opposite C-planes from the LIDC athorizontal angles uC and uC + 180� can be examined.Fig. 3 shows this light as shaded in grey in the LDIC for col-lector type 1 for example. The 2D flux can be calculated as:
U2DðuCÞ ¼Z p
�pLIDCðuC; hÞdh ð1Þ
where
LIDCðuC; hÞ ¼LIDCðuC; hÞ if h 2 ½0; p�; and
LIDCðuC þ p;�hÞ if h 2 ½�p; 0�
�
ð2Þ
Fig. 4. LIDC of collector type 1 now highlighting the cropped area for 2Dflux limited to angular spread of ±27.5�.
5.2. Percentage of 2D flux for a given angular spread
This is a descriptor how much of the collected lightleaves the collector within a given angular spread as illus-
trated in Fig. 4 for ±27.5�. The ratio P within a certainangular spread ±d around a defined angle a in this C-plane(usually the C0–C180 or the C90–C270 plane) can be calcu-lated as:
P ¼R aþd
a�d LIDCðuC; hÞdh
U2DðuCÞð3Þ

Fig. 6. LIDC of collector type 7 now showing the offset angle based ononly 90% of the total 2D flux.
S. Wittkopf et al. / Solar Energy 84 (2010) 986–996 989
and use percentages 100�P for displaying results. a is 0�when the direction of light is along the horizontal funnelaxis. The percentage can be derived for any spread d, e.g.±27.5�, an angle within which optical lighting films wouldreflected almost 100% of the light based on total internalreflection.
5.3. Horizontal off set and 90% field angle
Light leaving the collector can be perfectly symmetricalto the horizontal duct axis or point up- or down-wards. Ahorizontal offset is only desirable if a connected duct is alsooff the horizontal axis or when, in absence of a duct, lightneeds to be directed upwards to the ceiling for further dif-fusion into the room. A quantifier for the horizontal offsetangle is needed and the angle of a centerline that divides the2D flux into two equal parts is proposed as illustrated inFig. 5. Based on the percentage of 2D flux the central lineCL of the 2D flux in the C-plane can be calculated by itsangle aCL2[�p, p].R aCL
�p LIDCðuC; hÞdh
U2DðuCÞ¼R p
aCLLIDCðuC; hÞdh
U2DðuCÞ¼ 0:5 ð4Þ
aCL is zero whenever a collector system redirects light per-fectly along the axis of the duct. A positive or negative va-lue indicates light is leaving the collector upwards ordownwards, respectively. Additionally, the angular spreadcan be limited to d90 where 90% of the 2D flux happensas illustrated in Fig. 6.R aCLþd90
aCL�d90LIDCðuC; hÞdh
U2DðuCÞ¼ 0:9 ð5Þ
5.4. Concentration ratio
A traditional measure to describe the performance of aconcentrator is the concentration ratio C which is definedas:
C ¼ A=A0 ð6Þ
Fig. 5. LIDC of collector type 7 showing the offset angle based on totalarea.
where A is the area of the concentrator’s entrance apertureand A0 is the area of its exit aperture. In the two-dimen-sional approach this ratio can be expressed in terms oflengths instead of areas. Thus, C is calculated as:
C ¼ l=h ð7Þ
where l denotes the length of the concentrator and h is theheight of the exit aperture.
6. Computational simulation techniques
Ray tracing based simulation has been shown to be avaluable aid to predict the performance of daylighting sys-tems. Back-ward ray tracers such as RADIANCE areknown to be inefficient with many specular reflected indi-rect light rays as in the case of a daylight collector withattached funnels.
For the purpose of this paper the commercially availableforward ray tracing software package PHOTOPIA (LTI,2008) in its current version 3.0, has been selected. It is a3D CAD based simulation software frequently used bydesigner of optical system including reflectors and lensesand includes a large library of commercially availablelamps and materials. It calculates and exports LIDCs andwas validated for the performance assessment of tubularlight pipes (Dutton and Li, 2007). The set-up as describedbelow is generic and can be modeled in other suitable soft-ware such as OPTICAD and Photomap (PMAP) as well.For use in such 3D simulation software the 2D contoursof the collectors were extruded by 1.50 m along the Y-axisas shown in Fig. 9 for collector type 4. Alternatively, a 2Dstudy could have been conducted, but this 3D simulationallows the future analysis of 3D geometries that cannotbe adequately represented by 2D contours.
6.1. Arc-shaped light source
To allow the efficient 2D assessment of a 3D model, a lightsource was set-up that shines ideally in the plane containing

Fig. 7. Arc-shaped light source and measurement set-up for luminous intensity distributions.
990 S. Wittkopf et al. / Solar Energy 84 (2010) 986–996
the collector axis and the vertical as illustrated in Fig. 7. Thelight source is thus a narrow vertical slice of the sky vault,forming an arc located in front of the collector entry. Thearc light is divided into eight planar segments followinginternational standards for the subdivision of the sky hemi-sphere (Tregenza, 1987). Each segment is defined as a lightsource with constant intensity within ±6� beam and linearlyfading out until ±12�. Their overlapping light beams creatediffuse illumination around the center of the arc, where thecollector entries will eventually be positioned. Followingrequirements for far-field photometry, the radius of the lightarc was set to 10 m compared to the size of the luminaries,where one arc segment is 2.1 m high and 3.6 m wide. This
Fig. 8. Horizontal illuminance plane covering all collectors’ entrances and thereference illuminance plane with an average illuminance of 10000 lx.
also ensures that every point on the 1.50 m wide collectorreceives light from all angles. The authors use a luminousflux of 22,817 lumen for each segment to reach an averageilluminance of 10,000 lux at the horizontal reference planelocated at the collectors’ entrances. Fig. 8 shows a horizontalilluminance plane covering all collectors’ entry apertures.The bottom horizontal lines denote the photometric centerfrom where the collectors opening extend upwards. The hor-izontal lines denote the position of the edges of the entryapertures for all seven collectors. Systems with de-concen-trators are longer (horizontally) than those without, whilethose with baffles are the shortest. As the position of photo-metric center of the LIDC has to be same for all collectors
ir outlined areas; the central third defined by the dashed lines contains the

Fig. 9. Photometric planes for collector type 4.
S. Wittkopf et al. / Solar Energy 84 (2010) 986–996 991
(fixed distances rom the light sources) these varying lengthsresult in slightly different locations of the aperture entries.Long systems, such as type 2 have an entry opening slightlycloser to the lower elevation light source. However, the aver-age illuminance across all collectors varies only around 3%and this variation can thus be neglected.
While the initial set-up uses a uniform distribution, theflux of the light sources could be controlled individually,so that various standard sky luminance distributions(ISO, 1546) could be represented. One modified set-up,consisting only of the segments at 66�, 78� and 90� is usedwith two collectors, types 1 and 5, to assess the perfor-mance for zenith light only.
6.2. Measurement planes
The photometric measurement of the collector takesplace at the center of the exit apertures. As the distance
Fig. 10. Ray paths as sim
between the light source and collector entry is kept constantacross all collectors’ simulations, the varying internal dis-tances between collector entry and exit, leads to slight varia-tions of distances of photometric measurement center andlight source. However, these horizontal differences matteronly from the lower light segments and become insignificantfor the upper light segments. Fig. 9 shows collector type 4with the 0.5 m wide horizontal reference illuminance planeabove the collector entrance and the 0.5 m � 0.5 m verticaltest illuminance plane at the exit of the collector. Furthervertical measurement planes (0.5 m wide and 0.5 m high)are located at 5 h (or 5 � 0.5 m = 2.5 m) intervals from theexit aperture inside the funnel to quantify the light attenua-tion. No openings for extractors are included in the funnel torelate the light fall off only to the collector contour withoutany interference with light fall off due to sequential extrac-tion. Basic equations for light fall offs caused by these emit-ters or extractors are given for hollow light guides (Edmondset al., 1997).
7. Results
Fig. 10 illustrated the paths of light rays through thewhole system as simulated by Photopia. Rays originate fromthe arc light source (right) and converge in the center of thelight arc creating the desired diffuse daylight at the collectorentry aperture. Rays received by the collector are directedinto the horizontal funnel passing through the various verti-cal measurement planes to eventually leave the system at thefunnel exit on the left. The funnel end was kept open toexclude interfering reflections from the back end.
A detailed close up of rays intersecting with selected col-lectors is shown in Fig. 11. The images in the left columnshow how rays incident at 60� intersect with the anidolicand baffle collector. Note that the baffle collector partiallyrejects rays, while the anidolic concentrators accept all. Thecollimating effect of the additional de-concentratorsbecomes evident as well. The images in the right column
ulated in Photopia.

Fig. 11. Ray paths as simulated in Photopia for different collector types.
992 S. Wittkopf et al. / Solar Energy 84 (2010) 986–996
superimpose rays from various incident angles, showing thetypical converging point at the collector edge for raysadmitted at 90� and the shifting of the convergence zoneto the left with lower incidence angles.
Eventually, Fig. 12 shows the C0–C180 planes of theLIDCs for the seven collector systems where the collectors’outlines were added on the right hand side of the scale forillustrative purposes. With a parabolic shape of type 1 lightleaves the collector almost perfectly diffuse spreading overnearly the full left hemisphere (C0–180-plane), basicallykeeping the diffuse spread of light in front of the collector.Adding a de-concentrator (type 2) however shows at bettercollimation at the expense of overall intensity, a trend thatbecomes stronger with a larger de-concentrator in type 3due to the smaller parabolic collector (to keep to the 0.5 mheight limit). Adding further de-concentrators improve thesymmetry of the spread. Collectors 6 and 7 (flat baffles at45� and 26.6�) show the most asymmetrical spread over thefunnel axis, with most light redirected in a downwards man-ner and a clear cut off of the upward spread. This is becausemost of the downwards shining light rays will reach the col-lector exit without intersecting with the collectors. All LID-Cs show similar range for the maximum ranging between8000–9000 candela.
With the presence of the LDIC the above performancecriteria can be calculated to allow for more informedcomparison. They are tabulated for all seven collectors intable 1.
8. Discussions
8.1. 2D flux
The plain parabolic collector type 1 performs best interms of 2D flux (16,730 lm), followed by the straight baffletype 7. This is not surprising as both types have the largestcollector opening. The flux at the exit of the type 1 collectoris about 3000 lumen higher than the flux of the straight baf-fle collector, simply because the parabolic shape collectslight more efficiently with the same opening surface becauseof its wider acceptance angle. Adding de-concentrators tothe parabolic shape reduces the flux by more than5000 lm due to the reduced sized of the collector openingsup to the extreme case where due to the two relatively largede-concentrators in type 5 the size becomes only half oftype 1. So, if maximum flux at the collector exit was thedesign objective, a parabolic collector of type 1 would bethe ideal choice. Actually, in practice straight baffle type7 would be preferred for ease of construction. If that wouldstill be the best choice if transportation over long funnelswere to be considered remains a problem to be looked atwith the following criteria.
8.2. Percentage of flux within ±27.5�
The ranking is inverted when looking at the flux within aspecified narrow angle as charted in Fig. 13. Setting the

Fig. 12. C0–C180 planes of LIDCs for the seven collector systems with collector’s outlines attached.
S. Wittkopf et al. / Solar Energy 84 (2010) 986–996 993
angle to 55� (or ±27.5� producing total internal reflectionswithout significant losses using optical light film) wouldmake the former best performer parabolic type 1 now theworst performer as less than 50% of all emitted light falls
within this range. In contrast, type 5 shows the highestyield with close to 90%. Straight baffles such as types 6and 7 show around 50% yield. Hence, adding the collima-tion as design criteria would results in an opposite choice.

Table 1Photometric quantities of all collectors.
Photometric characteristics Collector type
1 2 3 4 5 6 7
2D flux 16,730 11,750 10,210 10,190 7840 9120 13,6002D flux within 55 deg (%) 44.7 58.5 71.1 70.9 87.4 44.8 55.1Horizontal offset angle (�) �1.9 0.2 �4.6 0.6 0.2 �30.9 �12.8Angular spread 90% (�) ±64.2 ±45.1 ±37.2 ±35.8 ±29.4 ±34.0 ±48.5C (l/h) 2.0 1.58 1.3 1.3 0.98 1.0 2.0
0
20
40
60
80
100
1 2 3 4 5 6 7
5000
7000
9000
11000
13000
15000
17000
% o
f 2D
-flux
in 5
5 de
gree
fiel
d
2D-fl
ux
Collector Type
% of 2D-flux in 55 degree field2D-flux
Fig. 13. 2D flux and percentage of 2D flux in ±27.5� angular spreadaround a = 0� for the seven collector systems.
2500
5000
7500
10000
12500
15000
17500
0h 5h 10h 15h 20h 25h 30h 35h 40h
Illum
inan
ce (l
x)
Distance from collector
Type 1Type 2Type 3Type 4Type 5Type 6Type 7
Fig. 14. Light fall off (illuminance on vertical planes) as a function of thedistance from the exit aperture with h = 0.5 m.
994 S. Wittkopf et al. / Solar Energy 84 (2010) 986–996
However, with percentages of 71% for types 3 and 4 and87% for type 5 in the 55� field, these collectors partiallycompensate the lower flux by redirecting more light intothe directions close to the funnel axis. From the 2D fluxand the 55� field percentages, absolute values for the partial2D flux within the angular spread of ±27.5� can easily becalculated by multiplying them. Values of 7479, 6867,7256, 7223, 6858, 4085 and 7498 can be obtained for collec-tor systems types 1–7. Considering this measure, type 7 per-forms best followed by type 1, but the values are quitesimilar for all collector systems except the 45� flat baffleof type 6, which performs worst.
8.3. Central line and 90% field angle
The angles aCL for the central lines of the 2D fluxes ofthe seven collector systems show varying horizontal offsetangles. The angular spread ±d90 around aCL which is nec-essary to cover 90% of the 2D flux also varies significantly.As already indicated by the LIDCs in Fig. 12, the systemswith the de-concentrators e.g. types 4 and 5 collimate thelight the best, with type four having the desired narrowerspread.
The impact of this is illustrated in Fig. 14, as light fall offin an abutting funnel in terms of illuminance ratios relatingto the illuminance at the particular collector exit, i.e., thebeginning of the funnel. Regarding this ratio, type 5 per-
forms best as it shows the lowest attenuation, followedby types 4 and 3. From this figure one can also derivethe normalized distance from the collector exit where50% of the light flux is absorbed. These ‘cut-offs’ happenat 11 h for types 1 and 6, 14 h for type 7, 16 h for type 2,21 h for type 3 and 4, and 28 h for type 5. For an actualfunnel of h = 0.5 m, the cut off with type 5 would be at14 m.
8.4. Concentration ratio
The direct correlation between the concentration ratioand previous criteria is evident. The lowest ratio of 1 fora collector system where height equals collector entrylength, as almost given for type 5, yields the lowest angularspread, or best collimation. However, there is no such cor-relation for the straight baffle collectors.
8.5. Non uniform daylight
The current results present a case with daylight of uni-form distribution pattern falling onto the collector open-ing. The generic set-up in the computational simulationallows the modeling of a non uniform light distributionfrom horizon to zenith as well. In Singapore, for instance,located on the equator where the sun travels overhead, the

Fig. 16. Light fall off as vertical and horizontal illuminance for collectors1 and 5 under illuminance from 66–90�.
S. Wittkopf et al. / Solar Energy 84 (2010) 986–996 995
zenithal portion of the sky is much brighter than the hori-zon. For this case, the lower lights (segments of the arclight source) can be dimmed down or switched off to alsoconsider over shading from surrounding buildings.
Two collectors, types 1 and 5, were chosen to comparetheir performance considering only light coming from highelevation angles under 66–90�. The choice was based on theprevious results, which had identified type 1 as guiding thehighest luminous flux into the funnel, while type 5 hadshown the highest performance in shaping the exiting beaminto a desired exit angle of 55�. As the whole arc light is stillcompletely within by the acceptance angle, the luminousflux collected remains unchanged and still only dependson the illuminance, which has been set to the same10,000 lux as in the case of uniform daylight. Fig. 15 showsthe LIDC’s for types 1 and 5 for both uniform and zenithaldaylight. The exit distribution of type 1 depends on thedirections under which incoming illuminance is receivedby the collector, the spread leaving type 5 is only definedby the geometry of its de-concentrators, leading to exactlythe same exitance distribution for any incoming directionas long as the illuminance at the entry and thus the lumi-nous flux received remains constant and the sources arewithin the acceptance angle.
The different exit distributions are illustrated for hori-zontal and vertical illuminance ratios for types 1 and 5 col-lectors illuminated with zenith light (66–90�) in Fig. 16.Type 1, guiding more light into the funnel due to its diam-eter, exhibits high illuminances on the horizontal measure-ment plane, while type 5 directs the flux almost parallel tothe duct axis, resulting in lower horizontal illuminances.However, type 5, due to very little losses at the reflectorsurfaces, shows an almost constant illuminance on the dif-ferent vertical measurement planes. Thus while type 1 cer-tainly would perform well on the first meters, type 5 allowsguiding light further through the light duct. The effect ofthe fewer reflective bounces and thus little reflective lossesof type 5 would become even more significant when reflec-tive duct surfaces with a lower reflectance grade or lower
Fig. 15. C0–C180 planes of LIDCs for collectors 1 and 5 underilluminance from 6–90� (uniform) as well as 66–90� (zenithal only).
specularity would be used, and thus suffer less from agingeffects, contaminations or surface imperfections.
9. Conclusion
A novel method for quantifying the performance ofanidolic daylight collectors is presented that goes beyondthe currently used daylight factor approach, focusing onthe collector and providing descriptors for its detailedassessment and thus optimization. New criteria such as2D flux, percentage of 2D flux within a selected angle, hor-izontal offset angle and angular spread were proposed toquantify the optical performance of anidolic daylight col-lectors, based on luminous intensity distribution curves(LIDC). A method to derive LIDC with forward ray trac-ing simulation techniques was introduced together withequations indicating how the quantities of the performancecriteria were calculated as a function of the LIDC. Thismethod was applied to compare various collector designswhich brought about the pros and cons of various collectortypes.
Transportation of daylight over longer distances requiresan optimized collector using de-concentrators, however atthe expense of a larger funnel to collector entry size ratio.If this larger space for the funnel is available, high collima-tion and thus low light attenuation can be achieved. In addi-tion, the extractor and emitters such as laser cut panels,eventually redirecting this light into spaces below, can bemuch more effective if they receive collimated rather thandiffuse light (Edmonds et al., 1997; Kwok, 2008). Systemswith simple baffle and parabolic reflectors can capture morelight, just because their entry opening is larger, however theykeep the diffuse character of the incident light so that lightleaving it has a wide spread. This can be desired in theabsence of a funnel or when funnels can be kept rather short.
An optimized collector ensures best light capturing andis most cost effective when reducing losses by limiting thenumber of reflection bounces instead of expensive

996 S. Wittkopf et al. / Solar Energy 84 (2010) 986–996
countermeasures such as extremely high reflectance grades.On the other hand, some reflective materials such as opticallight films would require a certain range of oblique lightrays in order to provide total internal reflection. A similarprecise direction would be required when using laser cutpanels as extractors, so that well defined portions of thehorizontal light flow can be directed vertically through exitapertures for room illumination. The presented methodol-ogy and derived performance criteria helps to optimizethese applications.
10. Future work
The proposed methodology provides a base for furtherwork, which could focus on the development of new collec-tor contours supported by these performance criteria. Var-iation of acceptance angles, including their interplay withvarious reflecting materials can be analyzed as well as theimpact of truncation of large collectors which has beenfound an effective way of reducing the collector size with-out much performance losses. The current sky conditionsof uniform luminance distribution between horizon andzenith can be adjusted to represent the various CIE/ISOskies or actual measured sky luminance. For non uniformlight distributions the collector designs can be further opti-mized by narrowing the acceptance angle and aligningthem to the brightest parts of the sky. In view of the light-ing conditions in cities in the tropics such as Singapore withmainly high-rise buildings, collectors would thus be opti-mized to capture light mainly from the zenithal parts ofthe sky. Finally, after the collectors, funnels and diffusershave been constructed as part of the zero-energy buildingin Singapore; actual measurements can be taken and com-pared with the computational simulations.
Acknowledgements
This research project is funded by Singapore Ministry ofNational Development (MND) under the project ‘Ad-vanced day lighting and PV in high performance envelopesof building in the tropics’ and supported by the Solar En-ergy Research Institute of Singapore (SERIS), the Schoolof Design and Environment (SDE) of the National Univer-sity of Singapore (NUS) and the School of Architecture,Civil and Environmental Engineering (ENAC) of the SwissFederal Institute of Technology Lausanne (EPFL). Theauthors would like to acknowledge Mark Jongewaard from
LTI for his valuable support with PHOTOPIA and GillesCourret and Bernard Paule for information about industrymaterials used with anidolic daylight collectors.
References
Compagnon, R., Scartezzini, J.L., Paule, B., 1993. Application ofnonimaging optics to the development of new daylighting systems.In: ISES Solar World Congress, Budapest.
Courret, G. et al., 1998. Design and assessment of an aniodolic light-duct.Energy and Buildings 28, 79–99.
Dutton, S., Li, S., 2007. Raytracing simulation for predicting light pipetransmittance. International Journal of Low-Carbon Technologies 2(4), 339–358.
Eames, P.C., 1993. Norton, detailed parametric analyses of heat transferin CPC solar energy collectors. Solar Energy 50 (4), 321–338.
Edmonds, I., Reppel, J., Jardine, P., 1997. Extractors and emitters forlight distribution from hollow light guides. Lighting Research andTechnology 29 (1), 23–33 (Corrigenda, 29(2) p. 88).
Hsieh, C.K., 1979. Design of a system using CPC collectors to collect solarenergy and to produce industrial process steam. Argonne NationalLibary, Gainsville, Florida. p. 95.
ISO, 2004. Spatial Distribution of Daylight – CIE General Sky. In: ISOStandard 15469.
Kampf, J., 2000. Parametric anidolic shape generator. In: Concent.pl,Deconcent_inf.pl, Deconcent_sup.pl, (Eds.), Solar Energy and Build-ing Physics Laboratory, Swiss Federal Institute of Technology,Lausanne.
Kwok, C.M., 2008. Computer simulation study of a horizontal light pipeintegrated with laser cut panels in a dense urban environment. LightingResearch and Technology 40 (4), 287–305.
Lau, S.S.Y., Baharuddin, S.K., Wittkopf, 2007. The use of anidoliclighting systems in improving daylight illuminance of high-risebuidlings in Hong Kong. In: Wittkopf, S.K., Tan, B.K. (Eds.), PLEA2007 – Sun, Wind and Architecture, National University of Singapore,Singapore, pp. 567–573.
LTI, 2008. Photopia – The Complete Solution of Luminaire Design &Analysis. LTI Optics.
Rabl, A., 1976a. Comparison of solar concentrators. Solar Energy 18 (2),93–111.
Rabl, A., 1976b. Optical and thermal properties of compound parabolicconcentrators. Solar Energy 8, 497–511.
Scartezzini, J.-L., Courret, G., 2002. Anidolic daylighting systems. SolarEnergy 73 (2), 123–135.
Tregenza, P.R., 1987. Subdivision of the sky hemisphere for luminancemeasurements. Lighting Research and Technology 19 (1), 13–14.
Welford, W.T., Winston, R., 1989. Non-Imaging Optics. Academic Press,New York.
Winston, R., 1974. Principles of solar concentrators of a novel design.Solar Energy 16, 89–95.
Wittkopf, S.K., 2007. Daylight performance of anidolic ceiling underdifferent sky conditions. Solar Energy 81 (2), 151–161.
Wittkopf, S.K., Yuniarti, E., Soon, L.K., 2006. Prediction of energysavings with anidolic integrated ceiling across different daylightclimates. Energy and Buildings 38 (9), 1120–1129.
Recommended


