
THIS REPORT CONTAINS ASSESSMENTS OF COMMODITY AND TRADE ISSUES MADE BY USDA STAFF AND NOT NECESSARILY STATEMENTS OF OFFICIAL U.S. GOVERNMENT POLICY
Required Report: Required - Public Distribution Date: March 30, 2022
Report Number: ID2022-0008
Report Name: Grain and Feed Annual
Country: Indonesia
Post: Jakarta
Report Category: Grain and Feed
Prepared By: Sugiarti Meylinah
Approved By: Jasmine Osinski
Report Highlights:
High global commodity prices are expected to slow the growth of 2021/22 Indonesian wheat
imports and lower the use of wheat in feed formulation. Although Ukraine is one of Indonesia’s
top wheat suppliers, industry sources indicate the Russia/Ukraine conflict will not have an
immediate impact on wheat supplies to Indonesia, as they reportedly received all of their
contracted wheat shipments from Ukraine before the start of the conflict. Indonesian flour mills
and feed mills have not yet started new purchases from Ukraine as the next wheat harvest in
Ukraine is not expected to occur until August 2022. Wheat imports from Australia are likely to
offset potential future losses of Ukrainian imports. The steady decline of COVID-19 cases is
expected to continue to improve consumer purchasing power and drive increases in the
consumption of wheat and corn for Food, Seed and Industrial use in 2021/22 and 2022/23.

Glossary:
APTINDO : Indonesian Flour Millers Association
BAPANAS : National Food Agency
BMKG : Indonesian Meteorology, Climatology, and Geophysics Agency
BI : Bank of Indonesia
BPS : Indonesian Statistics Agency
BULOG : Indonesian National Logistics Agency
DDGS : Distillers Dried Grains
GOI : Government of Indonesia
GPMT : Indonesian Feed Millers Association
HPP : Government Purchasing Price
MOA : Ministry of Agriculture
MOT : Ministry of Trade
MPW : Ministry of Public Works
NTP : Farmers’ Terms of Trade
PKH : Hope Family Program
P3JI : Indonesian Corn Wet Millers Association
IDR : Indonesian Rupiah
SME : Small and Medium Enterprises
USSEC : United States Soybean Export Council
WHO : World Health Organization

SECTION I. SITUATION AND OUTLOOK
In February 2022, The Indonesian Meteorology, Climatology, and Geophysics Agency (BMKG,
Badan Meteorologi, Klimatologi, dan Geofisika) forecasted that the 2021/22 rainy season would
not end until April or May 2022. During the peak period of the rainy season (February to March
2022), long periods of rain are expected to occur. BMKG also predicts that the impact of La
Nina will not be over until April 2022. The timely arrival of the rainy season in October and
November 2021 enabled farmers to start the first crop cycle of 2021/22 on time. Water
availability from normal reservoir levels and adequate rainfall is expected to encourage most
farmers on low-land, semi-irrigated areas to continue growing paddy rather than secondary crops
such as corn or soybean, as well as expand corn area on up-land, rain-fed areas during the second
crop cycle (usually March to June).
Chart 1. Forecast of Rainfall Intensity for April 2021
Source: BMKG

Chart 2. Forecast of Rainfall Intensity for April 2022
Source: BMKG
Chart 3. Forecast of Rainfall Intensity for May 2021
Source: BMKG

Chart 4. Forecast of Rainfall Intensity for May 2021
Source: BMKG
According to the Indonesian Ministry of Public Works (MPW), approximately 60 percent of
Indonesian harvested rice area is irrigated, while the remaining 40 percent is rainfed. With the
arrival of the rainy season, major reservoirs in Java reported normal levels of water elevation.
The water volume is expected to be able to supply water for paddy fields close to the reservoirs.
Table 1. Water Elevation at West Java Water Reservoirs, March 2, 2022
No. Reservoir
Reservoir
Volume
Elevation and Volume
Condition
Target Observed
Elevation Volume Elevation Volume
(Million
m3) (m)
(Million
m3) (m)
(Million
m3)
1 Jatiluhur 1325.40 95.10 447.62 93.72 n/a Normal
2 Cirata 668.12 210.61 201.23 213.33 n/a Normal
3 Saguling 530.75 633.08 159.48 636.86 n/a Normal
Source: Indonesian Min. of Public Works, (March 11, 2022), processed by FAS/Jakarta

On March 21, 2022, the World Health Organization (WHO) reported a total of 1,156,854
COVID-19 confirmed cases globally, a significant decline compared to the peak of 4,040,347
confirmed cases on January 26, 2022. Indonesian cases reflect this global trend, with the WHO
reporting a total of 29,204 confirmed cases in Indonesia on March 21, 2022, down 93 percent
from the peak of 389,727 positive cases recorded on February 14, 2022. In line with declining
cases of COVID-19, the global economy is projected to continue to recover while facing various
challenges, such as the possible resurgence of the pandemic through new variants, geo-political
tensions, and rising global inflation which has prompted a number of developed countries to
normalize their monetary policies.
Despite the arrival of the Omicron variant in Indonesia in early 2022, the Government of
Indonesia (GOI) did not implement measures as strict as those in place during the Delta variant
outbreak in mid-2021, and so had a less severe impact on the economy. The Indonesian Statistics
Agency (BPS) reported that Indonesia's economy grew by 3.69 percent from 2020 to 2021.
Indonesia's economy in the fourth quarter of 2021 was 1.06 percent higher than in the previous
quarter and 5.02 percent higher than in the fourth quarter of 2020. The agricultural sector
maintained positive growth throughout 2021 on strong consumer demand for staple commodities
and a growing food processing sector. Therefore, the Bank of Indonesia (BI) projects economic
growth in 2022 at 5.5 percent, up from 4.7 percent.

SUMMARY
Wheat
Wheat imports for 2021/22 are estimated to increase to 11.0 million metric tons (MMT) from
10.45 MMT in 2019/20, reflecting rebounding demand in food consumption following the easing
of COVID-19-related restrictions. Considering this economic recovery and steady population
growth, 2022/23 wheat imports are forecast to increase to 11.2 MMT. In line with increased feed
production, wheat consumption by feed mills in 2021/22 and 2022/23 is estimated to increase to
1.7 MMT and 1.8 MMT respectively.
Corn
Post revises 2020/21 corn harvested area and production to 3.85 million hectares and 12.6 MMT,
an increase of 6.9 percent and 6.8 percent respectively. Harvested area in 2021/22 and 2022/23
are forecast to continue increasing to 3.9 million hectares and 3.95 million hectares respectively
as farmers generally prefer to grow more corn compared to other secondary food crops. In line
with increasing area, corn production is expected to increase to 12.7 MMT and 12.9 MMT in
2021/22 and 2022/23. Increasing demand for corn starch from the growing food processing and
food service sectors is expected to push up 2021/22 and 2022/23 corn imports to 1.1 MMT and
1.2 MMT destined solely for corn wet mills.
Rice
Post revises down 2020/21 harvested area 3 percent to 11.4 million hectares from 11.8 million
hectares as some farmers switched to planting corn because of better price margins.
Consequently, 2020/21 rice production is also revised down to 34.5 MMT of milled rice
equivalent from 35.3 MMT. For 2021/22, despite area expansion during the first crop cycle, rice
production is expected to decline further from the previous year to 34.4 MMT due to lower yield.
In line with expected marginal increases in harvested area and assuming better yields than the
previous year, 2022/23 rice production is forecast to increase to 34.6 MMT.

WHEAT
Production
Indonesia does not produce wheat domestically and is fully reliant on wheat imports to fulfill
demand for wheat flour-based food products as well as animal feed for poultry, aquaculture, and
livestock.
Trade
During the pre-deregulation era from 1970 to 1998, when wheat imports were carried out by a
single state-owned procurement company, BULOG, only five flour mills operated in Indonesia.
Currently, 30 flour mills are operational across the archipelago, including 22 mills on Java
Island, six mills on Sumatera Island, and two mills in South Sulawesi. Despite the challenging
pandemic years of 2020 and 2021, the expansion of existing mills continues. Two new mills
located in South Sulawesi and West Java are expected to start operations in 2022. Installed
capacity in 2021/22 is estimated to reach 13.1 MMT, an increase from 12.8 million in 2020/21.
However, running capacity is currently only averaging 60-70 percent, a decline from 80 percent
in 2018/19. As more mills open and expand capacity, competition in the market is expected to
further increase price sensitivities, already a major factor in determining the source of imports.
Wheat is also imported as a feed ingredient substitute for corn depending on international prices.
Imports of corn for feed use remain restricted to BULOG, which must receive an authorization
from the newly established National Food Agency (BAPANAS) before importing and can only
distribute directly to small-holder farmers, not to feed mills. Imports of corn are normally only
allowed when prices spike due to domestic supply shortages. Regardless of annual production
2,000
2,500
3,000
3,500
4,000
4,500
5,000
5,500
6,000
6,500
7,000
Jan
Feb
Mar
Ap
r
May Jun
Jul
Au
g
Sep
Oct
No
v
Dec Jan
Feb
Mar
Ap
r
May Jun
Jul
Au
g
Sep
Oct
No
v
Dec Jan
Feb
Mar
2020 2021 2022
US Wheat Ukraine Wheat Argentinian Corn Brazilian Corn Local Corn
Chart 5. Imported Wheat Prices v. Local Corn Prices (IDR/kg)
Source: Hammersmith and USSEC, processed by FAS

volumes, the seasonality of domestic corn supplies along with limited drying and storage
facilities as well as increasing demand from feed mills continue to push corn prices higher even
during the main corn harvesting period. Despite the high prices of domestic corn, soaring global
prices of wheat and other protein sources for feed are forcing Indonesian feed mills to purchase
more domestic corn and lower their consumption of imported wheat.
In 2020/21, Indonesia imported a total of 10.45 MMT of wheat equivalent, with Australia as its
largest supplier with 36 percent market share and Ukraine as the second largest supplier with 25
percent. Canada served as the third largest supplier with 23 percent market share. The United
States is losing market share due to its higher prices. Although Indonesian flour mills source
from several different countries, feed mills prefer to procure only Ukrainian wheat due to lower
prices and acceptable quality.
According to industry sources, the conflict in Ukraine will not have an immediate impact on
supplies to Indonesia, as they reportedly received all of their contracted wheat shipments from
Ukraine before the start of the Russia/Ukraine conflict. Indonesian flour mills and feed mills
have not yet started new purchases from Ukraine as the next wheat harvest in Ukraine is not
expected to occur until August 2022. These flour mills and feed mills have also reduced
procurement from Russia due to the wheat export tax imposed by the Russian government
starting last year. With Australia’s record wheat production in 2021/22, closer proximity, and
lower freight costs, Australia is likely to offset potential future losses of Ukrainian imports.
Wheat imports from Australia during the period of July 2021 to January 2022 increased by 112
percent compared to the same period of 2020/21. However, Ukraine dominated the market with
38 percent market share of total Indonesia wheat imports. Australia, Canada, and Argentina
followed with 31 percent, 9 percent, and 9 percent market share respectively. Supply from
Australia started to pick up in November 2021.
Chart 6. Indonesia Wheat Imports (MT), 2018 - 2022
Note: *for the period of July 2021 to January 2022 only
Source: Trade Data Monitor, March 2022
-
500,000
1,000,000
1,500,000
2,000,000
2,500,000
3,000,000
3,500,000
4,000,000
2017/18 2018/19 2019/20 2020/21 2021/22*
Argentina Australia Canada Ukraine United States

Despite high international wheat prices Indonesia’s recovering economy is expected to drive up
its wheat imports to 11.0 MMT of wheat equivalent in 2021/22. In line with population growth
and a rebounding economy, wheat imports are forecast to grow modestly to 11.2 MMT in
2022/23.
Domestic wheat flour continues to dominate the local market with a 99.9 percent market share.
In line with higher consumption, wheat flour imports in 2021/22 are forecast to marginally
increased by 11.2 percent to 73,300 MT of wheat equivalent from to 65,929 MT in 2020/21.
During the first semester of 2021/22, Indonesia’s imports of wheat flour reached a total of
31,300 MT of wheat equivalent. India replaced Turkey as Indonesia’s largest supplier of wheat
flour with 84.8 percent market share, followed by South Korea with 9.6 percent.
Consumption
In 2020/21, annual per capita wheat flour consumption slightly increased to 32 kg from 31 kg in
2019/20. Indonesia’s trend towards urbanization and a growing middle class continue to align
with an increasingly diverse diet and increased consumption of wheat-based foods such as
breads, pizza, and pasta. The decline in COVID-19 cases, faster vaccination rollouts, and the
relaxation of social distancing measures have led to increased economic activity and domestic
demand for wheat-based foods. Visits to malls, restaurants, and tourist destinations are
increasing. BPS reported that starred hotel occupancy rates in January 2022 increased to 42.43
percent compared to 30.35 percent in January 2021. However, high prices of wheat on the
international market combined with volatile exchange rates resulted in increased wheat flour
production costs, which are passed on to consumers through higher retail prices. The price of one
popular brand of wheat flour, Segi Tiga Biru, increased by 8 percent to 10,900 IDR/kg
($761/MT) in March 2022 from 10,100 IDR/kg ($706/MT) in March 2021.
Chart 7. End User Profile of Indonesian Wheat Flour, February 2022
Source: Indonesian Flour Millers Association (APTINDO)
Bakery
22%
Biscuits
4%
Cake
2%Traditional
cake
6%Wet noodle
9%Pancake
2%Pastry
1%
Retailer
20%
Big and
Modern
Industry
34%
END USER PROFILE OF WHEAT FLOUR
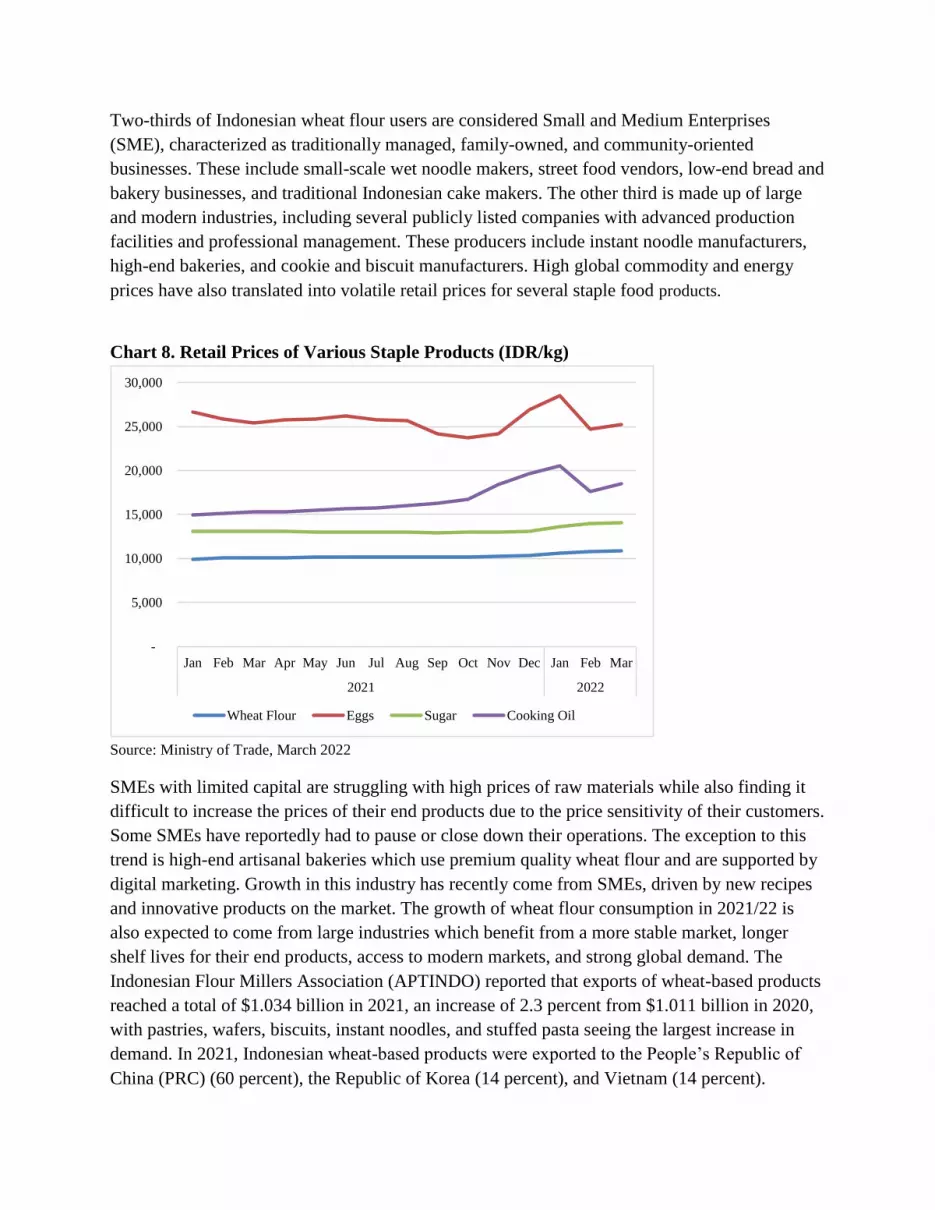
Two-thirds of Indonesian wheat flour users are considered Small and Medium Enterprises
(SME), characterized as traditionally managed, family-owned, and community-oriented
businesses. These include small-scale wet noodle makers, street food vendors, low-end bread and
bakery businesses, and traditional Indonesian cake makers. The other third is made up of large
and modern industries, including several publicly listed companies with advanced production
facilities and professional management. These producers include instant noodle manufacturers,
high-end bakeries, and cookie and biscuit manufacturers. High global commodity and energy
prices have also translated into volatile retail prices for several staple food products.
Chart 8. Retail Prices of Various Staple Products (IDR/kg)
Source: Ministry of Trade, March 2022
SMEs with limited capital are struggling with high prices of raw materials while also finding it
difficult to increase the prices of their end products due to the price sensitivity of their customers.
Some SMEs have reportedly had to pause or close down their operations. The exception to this
trend is high-end artisanal bakeries which use premium quality wheat flour and are supported by
digital marketing. Growth in this industry has recently come from SMEs, driven by new recipes
and innovative products on the market. The growth of wheat flour consumption in 2021/22 is
also expected to come from large industries which benefit from a more stable market, longer
shelf lives for their end products, access to modern markets, and strong global demand. The
Indonesian Flour Millers Association (APTINDO) reported that exports of wheat-based products
reached a total of $1.034 billion in 2021, an increase of 2.3 percent from $1.011 billion in 2020,
with pastries, wafers, biscuits, instant noodles, and stuffed pasta seeing the largest increase in
demand. In 2021, Indonesian wheat-based products were exported to the People’s Republic of
China (PRC) (60 percent), the Republic of Korea (14 percent), and Vietnam (14 percent).
-
5,000
10,000
15,000
20,000
25,000
30,000
Jan Feb Mar Apr May Jun Jul Aug Sep Oct Nov Dec Jan Feb Mar
2021 2022
Wheat Flour Eggs Sugar Cooking Oil

Based on the abovementioned factors, Post expects declining wheat flour demand from most
SMEs will be offset by growing demand from artisanal bakeries and large manufacturers which
will lead to overall annual increases of total wheat-based food consumption by 3.4 percent to 8.9
MMT in 2021/22 and 9.3 MMT in 2022/23.
Despite higher international wheat prices, Post predicts that increased feed production in 2021/22
and 2022/23 will drive up wheat consumption. The price spread whereby feed mills begin
incorporating more wheat over local corn is approximately 400-500 IDR/kg ($27.9 – 35/MT).
Currently, the landed price of Ukrainian wheat, the origin most frequently used in feed
formulation, is 6,200 IDR/kg ($433/MT) compared to 4,800 IDR/kg ($405/MT) for local corn at
the mills’ gate. The wheat inclusion rate is about 17 percent in layer feed formulation and 11
percent in aquaculture feed formulation. In 2021, aquaculture feed production reached a total of
1.7 MMT and the Indonesian Feed Millers Association (GPMT) has forecast a growth of 6
percent in aquaculture feed production for 2022. Despite the relative price advantage of local
corn over wheat imports, due to nutrition requirements, feed mills will continue to include wheat
as a key ingredient in feed rations, especially during the off-harvest corn season when prices for
local corn tend to surge and the price advantage of corn disappears. Post forecasts 2021/22 wheat
consumption for feed to increase to 1.7 MMT from 1.5 MMT consumed in 2020/21. Wheat for
feed consumption is forecast to further increase to 1.8 MMT in 2022/23 in line with forecast
increases of overall feed production.
Stocks
Due to higher import and higher food and feed consumption, 2021/22 ending stocks are expected
to marginally increase to 1.78 MMT of wheat equivalent compared to 1.73 MMT of wheat
equivalent in 2020/21. Reflecting higher food and feed consumption, 2022/23 ending stocks are
forecast to decline to 1.43 MMT of wheat equivalent.

Source: FAS Jakarta, March 3, 2022
Photo 1: Cornfield in Central Java
CORN
Production
Indonesia’s main corn producing areas are in Java, which accounts for 40 percent of national
corn production, followed by Sulawesi (24 percent), Sumatera (24 percent), and Nusa Tenggara
(10 percent). Indonesia normally experiences a dry season from April to October and a rainy
season from October to April. Depending on the relative distance to water reservoirs, rivers, and
other sources of water, most regions can normally accommodate three crop cycles per year.
Across much of Indonesia, the
first corn season normally takes
place from October to February
(49 percent); the second from
March to June (37 percent); and
the third from July to September
(14 percent). At the onset of the
2021/22 rainy season, most
farmers started the first planting
season on time (in October or
November) just like the previous
planting season of 2020/21.
Sufficient water availability
from adequate rainfall during the
second crop cycle will likely
result in farmers on upland, rain-
fed areas growing more corn.
In addition to adequate water, high corn prices have also incentivized farmers to grow more corn
over other secondary crops such as soybean, mung bean, or peanut during the second and third
crop cycles of 2020/21. Some farmers on lowland, semi-irrigated areas also switched from
growing paddy to corn.

Chart 9. Average Corn Prices at Feed Mill’s Gate (IDR/kg)
Source: MOA, March 2022
To increase national corn production, the Ministry of Agriculture (MOA) has provided farmers
with subsidized corn seed. However, the GOI has continuously reduced the MOA’s budget,
thereby reducing its budget allocation for food crops production. In 2021, MOA’s total budget
for food crops production was 3.6 trillion IDR ($251 million). In 2022, this budget was reduced
to 2.1 trillion IDR ($182 million). With its 2022 budget, MOA will provide subsidized seed for a
total area of 352,000 hectares of corn and 842,000 hectares of paddy, a decline from 988,000
hectares of corn and 1.7 million hectares of paddy in 2021. However, a reduced allocation of
subsidized seeds is likely to increase corn production because farmers will have the ability to
choose higher yielding seeds from the commercial market. With subsidized seeds, farmers are
not provided a choice in seed variety.
The budget cuts coincide with an increase in farmers’ purchasing power as a result of the
COVID-19 related economic slowdown. BPS reported Farmers’ Terms of Trade (NTP) in
general tend to increase throughout 2021 to February 2022. In February 2022, NTP reached
108.83 (a 0.15 percent increase from the previous month). NTP as an indicator of farmers’
purchasing power is illustrated in Chart 10 below.
-
1,000
2,000
3,000
4,000
5,000
6,000
7,000
Jan Feb Mar Apr May Jun Jul Aug Sep Oct Nov Dec
2020 2021 2022

Photo 2: Harvested Corn Collection in Central Java
Source: FAS Jakarta, March 3, 2022
Chart 10. Food Crop Farmers’ Terms of Trade
Source: BPS, March 2022.
The NTP is the comparison of the price index received by farmers to the price index paid by
farmers. The GOI uses the NTP to assess the purchasing power of farmers in rural areas. The
NTP also shows the terms of trade of agricultural products with goods and services consumed as
well as for production costs. With farmers’ higher purchasing power, hybrid corn seed producers
reported more sales of higher quality seeds. Combined with farmers’ interest to grow more corn,
the seed industry reported hybrid seed sales in 2021 reached a total of 60,000 to 65,000 MT
compared to sales of 55,000 MT in 2020. Industry estimates that corn prices will remain high in
2022 and will continue to motivate farmers to grow more corn in 2021/22. Hybrid corn area
accounts for 75 percent of total corn area.
Despite the uptick in the use of
higher quality seeds,
production is being hindered
by a lack of subsidized
fertilizer for food crops. The
MOA reported that in 2021,
fertilizer subsidies reached
27.147 trillion IDR,
approximately 93.45 percent of
the budget ceiling for fertilizer
subsidies of 29.05 trillion IDR.
Issued through MOA
Regulation no. 41/2022, the
total GOI budget for subsidies
for food crops was reduced to
25.28 trillion IDR for 9.11
MMT of fertilizer in 2022. A
long process for submitting
requests for subsidized
90.00
92.00
94.00
96.00
98.00
100.00
102.00
104.00
106.00
Jan Feb Mar Apr May Jun Jul Aug Sep Oct Nov Dec
2019 2020 2021 2022

fertilizers has led to delayed arrivals of fertilizers on farms. Having less subsidized fertilizer
means farmers will have to supplement their needs with more expensive, non-subsidized
fertilizers. Farmers have reported decreased application of fertilizers due to the lack of
availability and untimely arrivals of subsidized fertilizers which will likely lead to a decline in
yields.
Table 2. Allocation and Maximum Retail Prices of Subsidized Fertilizers
Type of Fertilizer 2020 2021 2022
Volume
(MT)
Price
(IDR/kg)
Volume
(MT or
Liter)
Price
(IDR/kg or
IDR/liter)
Volume
(MT or
liter)
Price
(IDR/kg or
IDR/liter)
Urea 3,274,303 1,800 4,166,669 2,250 4,232,704 2,250
SP 36 500,000 2,000 640,812 2,400 541,201 2,400
ZA 750,000 1,400 784,144 1,700 823,475 1,700
NPK 2,688,000 2,300 2,662,000 2,300 2,470,445 2,300
Specific NPK 17,000 17,000 3,300 11,469 3,300
Granulated organic 720,000 500 770,850 800 1,038,763 800
Liquid organic 1,500,000 20,000 1,870,380 20,000
Source: Ministry of Agriculture Regulation No. 41/2022
Based on the abovementioned factors, 2021/22 corn harvested area is estimated to increase to 3.9
million hectares, while corn yield is estimated to decline to 3.26 MT per hectare. However, high
corn prices are expected to incentivize farmers to continue growing corn over other secondary
crops. Thus, 2022/23 harvested area is forecast to further increase to 3.95 million hectares. In
line with increased harvested area, 2022/23 corn production is forecast to increase to 12.9 MMT.
No significant pest or disease problems were reported during the 2019/20 crop year.
Consumption
Currently, Indonesia’s feed mill sector consists of 110 feed mills under 44 companies located in
10 provinces, with 81 of those mills located on Java Island. In 2022, total installed capacity
reached approximately 29.7 MMT, remaining on par with the total installed capacity in 2020.
Feed mills are running at 70-75 percent of total installed capacity. Following 2016 GOI
restrictions on imports of corn for feed use, to secure a consistent supply for operations amid
seasonal supplies from farmers, mills began to build their own dryers and silos in 2018. In 2022,
total silo capacity is at 1.739 MMT, an increase of 17.6 percent from a total capacity of 1.478
MMT in 2018.

Table 3. Feed Mills (Including Aquaculture): Number of Plants and Installed Capacity
Area
Number of Plants Production (thousands MT/year)
2020 2022 2020 2022
North and West Sumatera 13 13 3,068 3,068
Southern Sumatera and Lampung 6 6 1,500 1,500
West Java and Jakarta 40 40 10,652 10,652
Central Java 13 13 3,950 3,950
East Java 28 28 8,102 8,102
Kalimantan 3 3 800 800
Sulawesi 7 7 1,580 1,580
Total 110 110 29,652 29,652
Source: Indonesian Feed Producers Association (Asosiasi Produsen Pakan Indonesia, APPI), 2022
The poultry industry consumes approximately 90 percent of domestic animal feed supplies, with
aquaculture accounting for 6 percent and cattle and swine the remaining 4 percent. The MOA
forecasts that the population of broilers in 2020–2024 will grow around 8.5 percent per year.
BPS reported that in 2021 the broiler and layer populations were recorded at 3.1 billion heads
and 368 million heads respectively. In 2022, the poultry industry association forecasts that the
broiler population will increase by 6.4 percent to 3.3 million heads while the layer population
will increase by 10.32 percent to 408 million heads. To meet this demand in 2021, feed mills
produced a total of 19.24 MMT of poultry complete feed, while poultry farmers produced a total
of 1.26 MMT of home mixed feed. In 2022, feed mills are expected to produce a total of 20.1
MMT of poultry complete feed, while poultry farmers are estimated to produce a total of 1.4
MMT of home mixed feed.
For aquaculture, a total of 1.6 MMT of feed was produced in 2021. In 2022, it is estimated that
aqua feed production will increase to 1.72 MMT. The improving economy is expected to
increase the consumption of poultry meat to 11.63 kg per capita per year in 2022 compared to
10.1 kg per capita in 2020. Egg consumption is also estimated to increase to 19.32 kg per capita
in 2022 from 18.52 per capita in 2021.
The soaring prices of corn and wheat on the international market has encouraged feed mills to
use local corn as the primary energy source in feed. Corn usage in feed formulation in 2021 is
expected to remain around 40-45 percent compared to 50-60 percent in 2014, which was prior to
the import restrictions on corn for feed use. Feed mills fill the gap with wheat purchased from
local flour mills and other local feed ingredients.

Table 4. Average Composition of Feed Formulation (percent) in 2022
Animal Species Corn
Soybean
Meal Rice Bran
Wheat
Pollard
Animal
By-
Products CGM
Palm
Kernel
Meal Palm Oil DDGS
Broiler 35-45 23-25 15 0 5 10 2 5 0
Layer 50 20 10 0 5 3 3 2 4
Poultry Breeder 50-55 20-22 13 5 0 1-2 0 2-3 1
Swine 40-42 15 18 15 5-6 0 8 1-2 0
Aquaculture 0 30-40 13-14 20 5-6 3 2 2 7
Dairy Cattle 0 0 23-25 15 0 0 10 0 5
Source: APPI, processed by US Grains Council
Corn milling capacity is continuing to grow. Installed capacity is estimated to increase to 4,000
MT per day in 2021/22, compared to 3,000 MT per day in 2020/21. The industry consists of four
major players and remains the main importer of corn due to food safety requirements for corn in
the wet milling process. The wet milling industry requires corn with an aflatoxin content of less
than 20 parts per billion (ppb) to produce food ingredients fit for human consumption, a standard
which local corn suppliers cannot meet. Local corn, which is mostly harvested manually at
moisture content levels reaching 35 percent, dried under the sun, and often improperly stored at
the farmer level, frequently reaches aflatoxin levels far above 20 ppb. As a result, corn wet mills
cannot use local corn for their raw materials. Wet millers also prefer imported dent corn over
locally produced flint corn due to its higher starch content.
In 2021, the corn milling industry produced a total of 320,000 MT of corn starch, an increase of
5.3 percent from 304,000 MT of corn starch produced in 2020. The industry also produced a
total of 250,000 MT of glucose syrup, an increase of 252 percent from 71,000 MT of glucose
syrup produced in 2020. Approximately 80-90 percent of the corn starch produced is used as the
main raw material for corn vermicelli production, while most of the balance is used as a whitener
by the paper industry. Prospects for wet mill expansion remain likely as Indonesia still imports
55 percent of its total demand for corn starch, providing ample opportunity for the local corn
milling industry to grow and increase its market share.
Corn for food use is not only consumed as vermicelli but also as a staple food, especially in the
Eastern part of Indonesia. However, with rice generally becoming more accessible, corn
consumption as staple food continues to decline. The MOA reports that for the period of 2020 to
2024, the consumption of corn as a staple food is projected to decrease by 4.56 percent per year.
Based on the abovementioned factors, 2021/22 and 2022/23 corn consumption for feed is
expected to increase to 9.5 MMT and 9.8 MMT respectively due to a recovering economy and a
rebound of poultry meat and egg consumption. Despite the declining consumption of corn as a
staple food, overall corn consumption for food in 2021/22 and 2022/23 is forecast to increase to

4.2 MMT and 4.3 MMT respectively due to wet mill expansion and increasing demand for corn
starch.
Trade
Despite international corn prices soaring from an average cost and freight (CNF) price of
$422/MT in March 2022 from $290/MT in 2021, Indonesia’s wet milling industry continues to
import corn to meet food safety requirements. Based on recent industry expansions, Post
estimates 2021/22 corn imports will reach 1.1 MMT, further increasing to 1.2 MMT in 2022/23
as new facilities begin operations.
After much engagement with industry, the MOA and Ministry of Trade (MOT) gained an
understanding of the technical specifications of corn required by wet mills that local corn cannot
meet. Therefore, no significant impediment to trade was experienced in 2020/21 due to the
exception made for food grade corn to GOI policies requiring raw materials to be sourced
locally. The MOT issues import licenses for the industry on a semiannual basis, requiring
allocation applications to be submitted at least one month in advance. To further ensure the
smooth importation of the raw material, industry has proposed to GOI to assign different HS
Codes for corn for wet milling and corn for feed. Currently, only BULOG is authorized to import
corn for feed under the HS Code 10059090 when local corn is insufficient to meet feed demand.
The GOI has not yet made any decision regarding industry’s recommendation for food grade
corn.
For the period of October 2021 through January 2022, a total of 346,246 MT of food grade corn
was imported into Indonesia, an increase of 17.2 percent compared to 2020/21. During this
period, Indonesia imported corn mainly from Argentina (48.3 percent) and Brazil (38.3 percent).
For marketing year 2020/21, corn imports originated from Argentina (60.4 percent), Brazil (22.9
percent), and the United States (15.6 percent). According to contacts, wet mills prefer to source
corn from South America over corn from the United States because South American corn is less
brittle, has fewer broken kernels, and contains less foreign material. Industry also claims there
are often inconsistencies between the stated specifications on U.S. inspection results and the
actual condition of the U.S. corn upon arrival to Indonesia.
Indonesia exports minimal volumes of corn. Exports for 2021/22 are estimated at 2,000 MT.
Reflecting production increases, 2022/23 corn exports are forecast to slightly increase to 3,000
MT. In 2020/21 Indonesia exported corn to Singapore (23.6 percent), Thailand (19.1 percent),
Japan (16.8 percent), and Pakistan (13.7 percent).
Stocks
Consistent with estimated higher production and higher imports, 2021/22 ending stocks are
estimated to increase to 1.443 MMT compared to 1.45 MMT in 2020/21. Stocks are forecast to
decline slightly to 1.440 MMT due to higher consumption and exports in 2022/23.

Prices
As per MOT Regulation No. 7/2020, issued on February 10, 2020, the selling price of corn with
15 percent moisture content at the mill level is fixed at 4,500 IDR/kg ($277/MT). Currently, the
first main harvest is ongoing. Prices at the farmer’s level normally decline as the main harvest
season progresses. However, driven by higher demand from feed mills and estimated lower
supply from the field, average corn prices at the farmers’ level remains high.
Corn prices in March 2022 are currently fixed at 5,800 IDR/kg ($405/MT), 29 percent higher
than in March 2021 at 4,500 IDR/kg ($315/MT). The price of feed ingredients constitutes 80-85
percent of compound feed production costs. Exacerbated by the scarcity of shipping containers
for importing containerized feed ingredients such as DDGS, prices of poultry complete feed have
also increased.
Table 5. Prices of Poultry Complete Feed Broiler Complete Feed
2020 Jan Feb Mar Apr May Jun Jul Aug Sep Oct Nov Dec
2021 6650
- 7100
6650 -
7100
6650 -
7100
6650 -
7100
6650 -
7100
6650 -
7100
6650 -
7100
6650 -
7100
6650 -
7100
6650 -
7100
6650 -
7100
6650 -
7100
2022 6800
- 7200
6800 -
7200
6800 -
7200
Layer Complete Feed
2020 5650
- 6100
5650 -
6100
5650 -
6100
5650 -
6100
5650 -
6100
5650 -
6100
5650 -
6100
5650 -
6100
5650 -
6100
5650 -
6100
5800 -
6250
5800 -
6250
2021 5900 -
6350
5900 -
6350
5900 -
6350
Source: U.S. Soybean Export Council (USSEC)

Photo 3-4: Rice Paddy in Central Java
Source: FAS Jakarta, March 4, 2022
RICE, MILLED
Production
Approximately 50 to 55 percent of rice production is in Java, while Sumatera and Sulawesi
account for 20 and 12 percent, respectively. Approximately 85 percent of rice production comes
from irrigated paddy fields. Typically, irrigated farms are planted with paddy during the first and
second crop cycles (October – February and March – June), followed by a third crop of paddy or
secondary crops such as corn, mung bean, soybean, peanut, or sweet potato (July – October). A
prolonged rainy season in 2020/21 combined with attractive prices for corn, has driven some
farmers on lowland, semi-irrigated areas to switch from growing paddy to corn. Most of the
switches occurred in the major corn producing areas of southern Sumatera, Lampung, and East
Java. Farmers on upland, rain-fed areas also opted to grow corn during the second and third crop
cycles for the same reasons. The timely arrival of the 2021/22 rainy season has enabled farmers
to start the first crop cycle on time, with most farmers planting paddy in October or November
2021. The first main harvest in 2021/22 is currently taking place, a month earlier than the first
main harvest in 2020/21 which took place in April 2021.
In early March 2022, BPS forecasted based on standing crops that 2021/22 first crop cycle paddy
harvested area will increase 8.6 percent to 4.81 million hectares compared to 4.1 million hectares
in the first crop cycle of 2020/21. BPS estimates that 2021/22 paddy production for the first main
harvest will increase to 25.06 MMT from 23.58 MMT produced during the first main harvest of
2020/21 (January to April 2021). Recent Post observations from the field indicate that the main
harvest is currently ongoing in some areas. Frequent rainfall had limited the sunlight required
during the flowering and grain filling stages, resulting in high amounts of empty husks and high
moisture content for harvested paddy. Paddy farmers also faced the same fertilizer constraints as
corn farmers, with some not receiving allocated subsidized fertilizers on time, resulting in fewer
applications to crops. Accordingly, some farmers in major paddy growing areas in Central Java
and East Java reported slightly declined yields of almost 3 percent compared to the same period
of 2021/22. No significant incidents of pests or diseases were reported.

Photo 5: Rice Mill in Central Java
Source: FAS Jakarta, March 4, 2022
Considering the aforementioned factors, Post revises 2020/21 harvested area to 11.4 million
hectares, a decline of 3.3 percent from 11.8 million hectares previously estimated. Despite the
likelihood some farmers will again switch from growing paddy to corn during the second and
third crops cycles which will limit paddy area expansion, due to reports of increased harvested
area during the first crop cycle of 2021/22, harvested rice area in 2021/22 is estimated to increase
to 11.6 million hectares from the previous year, and then marginally increase to 11.650 million
hectares in 2022/23. However, due to reduced yields during the first main harvest, 2021/22
paddy production is estimated to decline to 54.173 MMT from 54.330 MMT in 2020/21. Higher
yields resulting from the end of La Nina in April 2022 is expected to increase 2022/23
production to 54.49 MMT.

Chart 11. Paddy Harvest Area Pattern (millions of hectares)
Source: BPS, March 2022
Consumption
The COVID-19 pandemic was detrimental to the livelihoods of many Indonesian households and
their ability to purchase even staple foods like rice. As part of its COVID-19 pandemic relief
package, the GOI distributed food aid in the form of staple food cards to 18.8 million
households. Using this card, recipients could obtain necessary food staples through an appointed
distributor. The GOI no longer provides in-kind food aid through BULOG directly to
households. BULOG’s sole role now is to stabilize rice prices through market interventions by
procuring and distributing rice to wholesale markets. In 2021, BULOG distributed 787,000 MT
of rice through this kind of market intervention. Combined with other government social aid
programs such as its natural disaster relief program, BULOG distributed a total of 1.154 MMT of
rice in 2020/21.
Per capita rice consumption continues to decline by approximately 0.62 percent per year as
middle and upper-middle income consumers continue diversifying their diets to include more
western-style foods like bread and pasta and lower-middle income consumers continue to replace
rice-based dishes with instant noodles due to the ease of preparation and affordability. However,
with rice prices being more stable than wheat flour prices, Post expects 2021/22 rice
consumption to remain stable at 35.2 MMT as in 2019/20. However, with the economy
improving and consumer purchasing power increasing, Indonesian consumers will likely
continue diversifying their diets away from rice. Accordingly, Post forecasts rice consumption
will dip to 35.1 MMT tons in 2022/23.
-
0.20
0.40
0.60
0.80
1.00
1.20
1.40
1.60
1.80
2.00
Jan Feb Mar Apr May Jun Jul Aug Sep Oct Nov Dec
2019 2020 2021 2022

Policy
For 2022, GOI has not made any adjustment to the Government Purchasing Price (HPP) for
paddy. Please see ID2021-0014.
BPS reports prices of wet paddy at the farmer’s level in February 2022 increased by 1.9 percent
to 4,849 IDR/kg ($339/MT) compared to 4,758 IDR/kg ($333/ton) in February 2021. Wet paddy
prices at the mill’s level in February 2022 increased by 2.03 percent to 4,962 IDR/kg ($347/MT)
from 4,863 IDR/kg ($340/MT) in February 2021. The price increases are in line with lower
yields and quality from the ongoing main harvest.
GOI assistance to pandemic-affected households has staved off rising demand for rice at
commercial markets and maintained stable prices for medium quality rice at around 12,000
IDR/kg ($839/MT) since February 2021 at the wholesale market. However, these prices remain
far above the government-set maximum retail price of 9,450 IDR/kg ($653/MT) for medium
quality rice on Java because even production costs are above the government’s price ceiling.
Trade
BULOG set its 2022 procurement target at 1.5 MMT, an increase of 25 percent from its 2021
realized procurement of 1.2 MMT. As of March 21, 2022, BULOG has procured a total of
19,728 MT of milled rice, a decline of 83.8 percent compared to 121,832 MT procured at the
same period of 2021. BULOG is required to maintain a minimum year-end stock level of 1.5-2
MMT. However, considering the current stable price of rice, the GOI has not considered
importing any rice in 2021/22 through BULOG; only private sector importers are expected to
import rice. Rice imports for 2021/22 are estimated at 650,000 MT, an increase of 8.3 percent
from 600,000 MT imported in 2020/21 mainly due to expected higher demand from the food
service sector, especially middle-eastern restaurants which are currently trending in the country.
These restaurants use basmati rice, a specialty rice that Indonesia does not produce. In 2022/23,
imports of rice are forecast to remain stable at 650,000 MT. In 2020/21, Indonesia imported rice
from India (38 percent), Singapore (16 percent), Malaysia (15 percent), and Thailand (12
percent).
Stocks
In line with revised lower production, 2020/21 ending stocks are revised down from the previous
estimate to 3.21 MMT. Other than stocks at BULOG, rice mills and households held a total of
1.96 MMT at the end of 2020/21. Ending stocks are estimated to further declined to 3.057 MMT
of milled rice equivalent in 2021/22. Based on expected increased production, higher imports,
and higher consumption, 2022/23 ending stocks are forecast to rebound to 3.2 MMT of milled
rice equivalent.

SECTION II. PSD TABLES
Table 6. PSD: WHEAT
Wheat 2020/2021 2021/2022 2022/2023
Market Begin Year Jul 2020 Jul 2021 Jul 2022
Indonesia USDA
Official New Post
USDA
Official New Post
USDA
Official New Post
Area Harvested 0 0 0 0 0 0
Beginning Stocks 1716 1716 1730 1730 0 1780
Production 0 0 0 0 0 0
MY Imports 10450 10450 11000 11000 0 11200
TY Imports 10450 10450 11000 11000 0 11200
TY Imp. from U.S. 794 794 0 74 0 100
Total Supply 12166 12166 12730 12730 0 12980
MY Exports 336 336 350 350 0 450
TY Exports 336 336 350 350 0 450
Feed and Residual 1500 1500 1700 1700 0 1800
FSI Consumption 8600 8600 8800 8900 0 9300
Total Consumption 10100 10100 10500 10600 0 11100
Ending Stocks 1730 1730 1880 1780 0 1430
Total Distribution 12166 12166 12730 12730 0 12980
Yield 0 0 0 0 0 0
(1000 HA) ,(1000 MT) ,(MT/HA)
Note: Figures in the “New Post” columns are not USDA Official figures

Table 7. PSD: CORN
Corn 2020/2021 2021/2022 2022/2023
Market Begin Year Oct 2020 Oct 2021 Oct 2022
Indonesia USDA
Official New Post
USDA
Official New Post
USDA
Official New Post
Area Harvested 3600 3850 3600 3900 0 3950
Beginning Stocks 1102 1102 1045 1345 0 1443
Production 11800 12600 12000 12700 0 12900
MY Imports 945 945 1200 1100 0 1200
TY Imports 945 945 1200 1100 0 1200
TY Imp. from U.S. 151 151 0 0 0 0
Total Supply 13847 14647 14245 15145 0 15543
MY Exports 2 2 2 2 0 3
TY Exports 2 2 2 2 0 3
Feed and Residual 8700 9200 9100 9500 0 9800
FSI Consumption 4100 4100 4200 4200 0 4300
Total Consumption 12800 13300 13300 13700 0 14100
Ending Stocks 1045 1345 943 1443 0 1440
Total Distribution 13847 14647 14245 15145 0 15543
Yield 3.2778 3.2727 3.3333 3.2564 0 3.2658
(1000 HA) ,(1000 MT) ,(MT/HA)
Note: Figures in the “New Post” columns are not USDA Official figures

Table 8. PSD: RICE, MILLED
Rice, Milled 2020/2021 2021/2022 2022/2023
Market Begin Year Jan 2021 Jan 2022 Jan 2023
Indonesia USDA
Official New Post
USDA
Official New Post
USDA
Official New Post
Area Harvested 11800 11400 11830 11600 0 11650
Beginning Stocks 3313 3313 3410 3210 0 3057
Milled Production 35300 34500 35400 34400 0 34600
Rough Production 55591 54330 55748 54173 0 54488
Milling Rate (.9999) 6350 6350 6350 6350 0 6350
MY Imports 600 600 600 650 0 650
TY Imports 600 600 600 650 0 650
TY Imp. from U.S. 0 0 0 0 0 0
Total Supply 39213 38413 39410 38260 0 38307
MY Exports 3 3 0 3 0 3
TY Exports 3 3 0 3 0 3
Consumption and Residual 35800 35200 35600 35200 0 35100
Ending Stocks 3410 3210 3810 3057 0 3204
Total Distribution 39213 38413 39410 38260 0 38307
Yield (Rough) 4.7111 4.7658 4.7124 4.6701 0 4.6771
(1000 HA) ,(1000 MT) ,(MT/HA)
Note: Figures in the “New Post” columns are not USDA Official figures
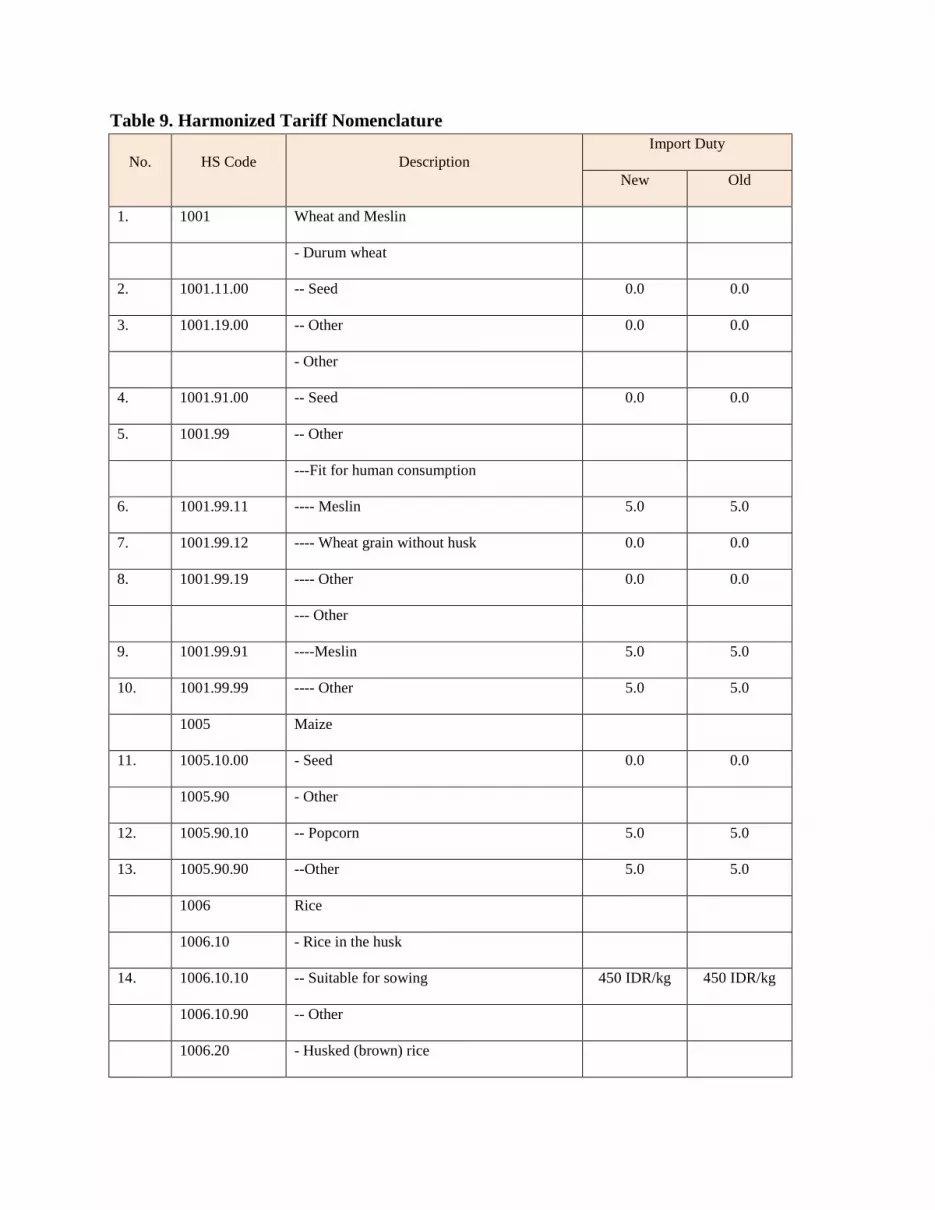
Table 9. Harmonized Tariff Nomenclature
No. HS Code Description
Import Duty
New Old
1. 1001 Wheat and Meslin
- Durum wheat
2. 1001.11.00 -- Seed 0.0 0.0
3. 1001.19.00 -- Other 0.0 0.0
- Other
4. 1001.91.00 -- Seed 0.0 0.0
5. 1001.99 -- Other
---Fit for human consumption
6. 1001.99.11 ---- Meslin 5.0 5.0
7. 1001.99.12 ---- Wheat grain without husk 0.0 0.0
8. 1001.99.19 ---- Other 0.0 0.0
--- Other
9. 1001.99.91 ----Meslin 5.0 5.0
10. 1001.99.99 ---- Other 5.0 5.0
1005 Maize
11. 1005.10.00 - Seed 0.0 0.0
1005.90 - Other
12. 1005.90.10 -- Popcorn 5.0 5.0
13. 1005.90.90 --Other 5.0 5.0
1006 Rice
1006.10 - Rice in the husk
14. 1006.10.10 -- Suitable for sowing 450 IDR/kg 450 IDR/kg
1006.10.90 -- Other
1006.20 - Husked (brown) rice

15. 1006.20.10 -- Thai Hom Mali 450 IDR/kg 450 IDR/kg
16. 1006.20.90 -- Other 450 IDR/kg 450 IDR/kg
1006.30
- Semi-milled or wholly milled rice, whether
or not polished or glazed:
17. 1006.30.30 --Glutinous rice 450 IDR/kg 450 IDR/kg
18. 1006.30.40 -- Thai Hom Mali 450 IDR/kg 450 IDR/kg
-- Other
19. 1006.30.91 --- Parboiled rice 450 IDR/kg 450 IDR/kg
20. 1006.30.99 --- Other 450 IDR/kg 450 IDR/kg
1006.40 - Broken rice
21. 1006.40.10 -- Of a kind used for animal feed 450 IDR/kg 450 IDR/kg
22. 1006.40.90 -- Other 450 IDR/kg 450 IDR/kg
1101 Wheat or meslin flour
- Wheat flour
23. 1101.00.11 -- Fortified 10.0 5.0
24. 1101.00.19 -- Other 5.0 5.0
25. 1101.00.20 - Meslin Flour 5.0 5.0
1103 Cereal, groats, meal, and pellets
- Groats and meals
26. 1103.11.00 -- Of wheat 5.0 5.0
27. 1103.13.00 -- Of maize 5.0 5.0
2303
Residues of starch manufacture and similar
residues, beet pulp, bagasse, and other waste
of sugar manufacture, brewing or distilling
dregs and waste, whether or not in the form
of pellets.
28. 2303.30.00 - Brewing or distilling dregs and waste 5.0 5.0
Source: Ministry of Finance

Table 10. Exchange Rate
Year Jan Feb Mar Apr May Jun Jul Aug Sep Oct Nov Dec
2017 13,343 13,347 13,321 13,327 13,321 13,319 13,323 13,351 13,492 13,572 13,514 13,548
2018 13,413 13,707 13,756 13,877 13,951 14,404 14,413 14,711 14,929 15,227 14,339 14,481
2019 14,072 14,062 14,244 14,268 14,362 14,141 13,913 14,237 14,174 14,008 14,102 13,901
2020 13,662 14,234 16,367 15,157 14,733 14,302 14,653 14,554 14,918 14,690 14,187 14,105
2021 14,084 14,229 14,459 14,453 14,292 14,452 14,548 14,306 14,321 14,171 14,320 14,278
2022 14,392 14,369 14,306
Source: Bank of Indonesia
Note: Exchange rate is 14,306 IDR/USD, as of March 11, 2022.
Attachments:
No Attachments
Recommended


