Request for Incidental Harassment Authorization
of Marine Mammals Resulting from the Proposed Ketchikan Port Facility Recapitalization Project
National Oceanic and Atmospheric Administration
Office of Marine and Aviation Operations Marine Operations Center-Pacific
Proposed Ketchikan Port Facility Recapitalization Project
Ketchikan, Alaska
Prepared for:
Ahtna Engineering Services, LLC
110 West 38th Avenue, Suite 200A
Anchorage, AK 99503
Prepared by:
AECOM Technical Services, Inc.
October 2021
Executive Summary Request for Incidental Harassment Authorization
October 2021 ii
EXECUTIVE SUMMARY The National Oceanic and Atmospheric Administration (NOAA) proposes to recapitalize its property and facilities currently operated by the Office of Marine and Aviation Operations (OMAO) at the existing Marine Operations Center-Pacific (MOC-P) Ketchikan Port Facility.
NOAA OMAO has prepared this request for incidental harassment authorization (IHA) application in accordance with the Marine Mammal Protection Act (MMPA) of 1972, as amended (16 United States Code [U.S.C.] Section 1371(a)(5)(D)), to analyze the potential effects to marine mammals associated with the project. Section 1 through Section 14 of this application cover the 14 specific items required for this application, as set out by 50 Code of Federal Regulations (CFR) 216.104, Submission of Requests.
The facility is at 1010 Stedman Street in the city of Ketchikan, Alaska, and is the dedicated homeport for the NOAA Ship Fairweather. Due to failing and inadequate facilities, the existing NOAA homeport is unable to fully support the berthing of vessels or staging for cruises or missions carried out by the NOAA Ship Fairweather or other vessels. The Proposed Action would provide upgrades and replacement facilities necessary to reestablish homeport operations and maintenance functions for the NOAA Ship Fairweather and other vessels. The proposed recapitalization project would more effectively support NOAA missions conducted primarily in the North Pacific Ocean and the Arctic Continental Shelf.
The Proposed Action at the Ketchikan Port Facility would require demolition, disposal, and replacement of key structures and infrastructure in a 77,000-square-foot upland area and a 102,000 square foot in-water area owned by NOAA. Nearly all the existing OMAO facilities and assets at its Ketchikan Port Facility would be affected.
Nearly all of the existing in-water infrastructure at the Ketchikan Port Facility would be removed, including the following in-water and over-water structures and assets:
• Remnant wooden access trestle and parallel utility trestle and supporting piles • Main pile-supported pier structure (9,000 square feet) and supporting piles • Steam plant (boiler) shed on the pier • Three concrete-filled steel mooring dolphins • Two single piles extending above the water surface • Floating cylindrical fendering (250 linear feet); this may be saved or salvaged by the contractor
The following in-water infrastructure would be retained and/or salvaged:
• Concrete/steel mooring platform (750 square feet) and breasting dolphin with fender—to be retained; connecting metal catwalks to be salvaged.
The following new in-water structures would be constructed:
• An approximately 240-foot long and 50-foot wide (48-foot wide pier with 2-foot fendering) floating replacement pier would replace the existing pier and its supporting piles. The floating pier would be secured and stabilized by 10 steel piles, each 24 inches in diameter, and accessed via a single, 144-foot long and 17-foot wide steel, truss-framed transfer bridge. The transfer bridge would be supported by a bridge support float adjacent to the pier and hinged to the shoreline cast in place concrete abutment. The 24-foot by 22-foot bridge support float would be secured by four additional 24-inch diameter steel piles. Replacement mooring dolphins and fenders for mooring would be installed. Ship utilities would be extended dockside attached to the transfer bridge (60 percent design drawings for the project are provided in Appendix A).
• A small boat dock, approximately 90 feet long by 14 feet wide, would be installed and connected to the floating dock by an aluminum gangway approximately 40 feet long and 5 feet wide. The small boat dock would be secured and stabilized by four steel piles, each 24 inches in diameter.
• The small boat launch ramp proposed at the northern portion of the NOAA-owned shoreline would be supported on a raised, rip-rap protected mound with side slopes of 2:1 (Horizontal:Vertical) and a footprint of approximately 200 feet by 70 feet wide.

Executive Summary Request for Incidental Harassment Authorization
October 2021 iii
Pile removal and placement associated with the proposed activities have the potential to affect marine mammals within the waterways adjacent to the proposed project, which could result in harassment under the MMPA of 1972, as amended.
NOAA used the National Marine Fisheries Service (NMFS) sound thresholds for assessing pile placement and removal on marine mammals, and used the practical spreading loss equation and empirically measured source levels from other similar steel pile-driving projects to estimate potential marine mammal exposures to pile-driving noise.
Predicted exposures are described in detail in Section 6 (Table 6-10); a summary is provided in Table ES-1. Level A harassments associated with pile-driving activities will be avoided for all species but harbor porpoise, Dall’s porpoise, and harbor seals by implementing mitigation measures described in Section 11. Conservative assumptions (including marine mammal densities) used to estimate the exposures are likely to overestimate the potential number of exposures and incidental take.
Table ES-1: Total Exposure Estimates
Species Level B Take Level A Take Humpback whale Central North Pacific Stock Hawaii DPS
39 0
Humpback whale CA/OR/WA Stock Mexico DPS
1 0
Minke whale 1 0 Gray whale 4 0 Killer whale 20 0 Pacific white-sided dolphin 200 0 Harbor porpoise 20 10 Dall's porpoise 40 20 Steller sea lion Eastern Stock 470 0
Harbor seal 423 141
Pursuant to MMPA Section 101(a)(5)(A), NOAA OMAO submits this application to NMFS for the authorization of incidental, but not intentional, taking of individuals of nine marine mammal species during pile activities for project. The taking will be in the form of noninjurious, temporary harassment, and for harbor porpoise, Dall’s porpoise, and harbor seals will also include Level A harassment. All taking is expected to have a negligible impact on populations of these species. In addition, the taking will not have an adverse impact on the availability of these species for subsistence use.
Regulations governing the issuance of incidental take under certain circumstances are codified at 50 CFR Part 216, Subpart I (Sections 216.101–216.108). Section 216.104 sets forth 14 specific items that must be addressed in requests for take pursuant to Section 101 (a)(5)(A) of the MMPA. These 14 items are addressed in Section 1 through Section 14 of this IHA application.

Table of Contents Request for Incidental Harassment Authorization
October 2021 iv
TABLE OF CONTENTS Executive Summary ............................................................................................................................... ii List of Acronyms and Abbreviations ....................................................................................................... vii 1.0 Introduction and Description of Activities ............................................................................ 1-1
1.1 Introduction........................................................................................................................... 1-1 1.2 Proposed Action ................................................................................................................... 1-2
2.0 Dates, Duration, and Region of Activity .............................................................................. 2-1 2.1 Dates and Duration .............................................................................................................. 2-1 2.2 Geographic Region of Activities ........................................................................................... 2-1 2.3 Action Area ........................................................................................................................... 2-2
3.0 Marine Mammal Species and Numbers ............................................................................. 3-1 4.0 Affected Species and Status and Distribution .................................................................... 4-1
4.1 Humpback Whale ................................................................................................................. 4-1 4.2 Minke Whale ........................................................................................................................ 4-3 4.3 Gray Whale .......................................................................................................................... 4-3 4.4 Killer Whale .......................................................................................................................... 4-4 4.5 Pacific White-Sided Dolphin ................................................................................................. 4-5 4.6 Harbor Porpoise ................................................................................................................... 4-5 4.7 Dall’s Porpoise ..................................................................................................................... 4-6 4.8 Steller Sea Lion .................................................................................................................... 4-7 4.9 Harbor Seal .......................................................................................................................... 4-9
5.0 Take Authorization Requested ............................................................................................ 5-1 5.1 Take Authorization Request ................................................................................................. 5-1 5.2 Method of Incidental Taking ................................................................................................. 5-1
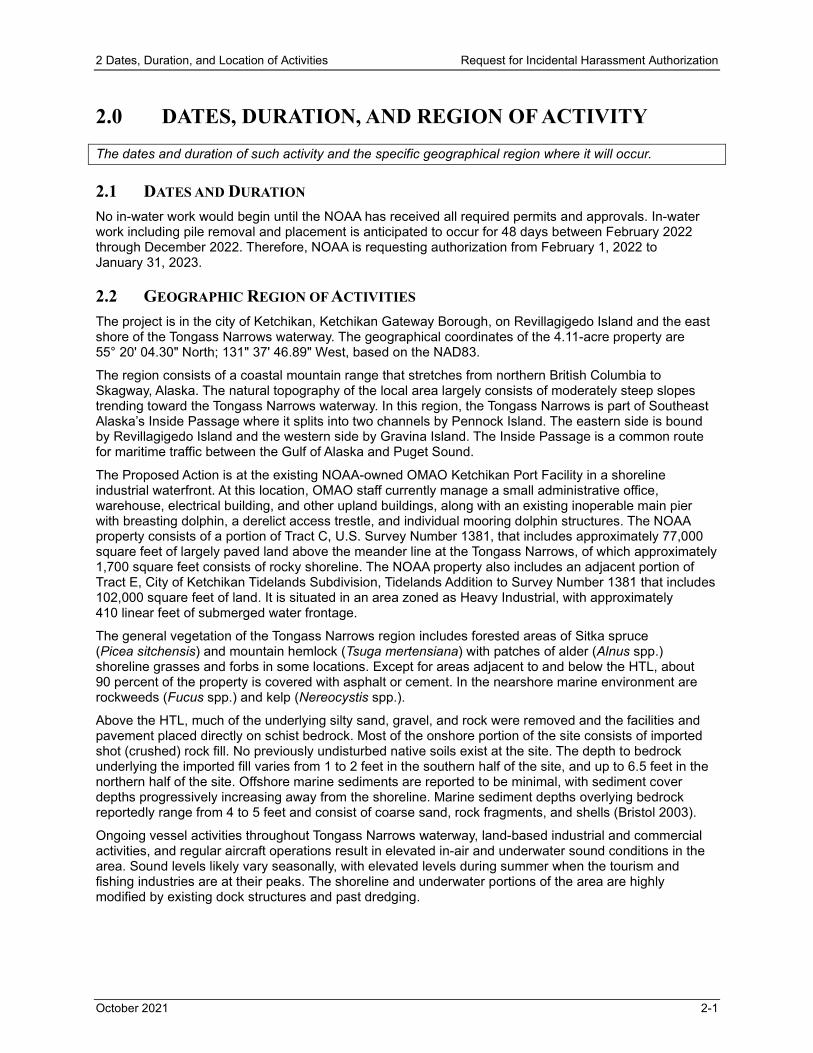
6.0 Numbers and Species Exposed ......................................................................................... 6-1 6.1 Introduction........................................................................................................................... 6-1 6.2 Description of Noise Sources ............................................................................................... 6-1 6.3 Vocalization and Hearing of Marine Mammals..................................................................... 6-2 6.4 Sound Exposure Criteria and Thresholds ............................................................................ 6-3 6.5 Limitations of Existing Noise Criteria ................................................................................... 6-4 6.6 Auditory Masking .................................................................................................................. 6-4 6.7 Modeling Noise from Pile Removal/Placement Activities ..................................................... 6-5 6.8 Exposure Estimates ............................................................................................................. 6-12
7.0 Impacts to Marine Mammals and Stocks ........................................................................... 7-1 7.1 Potential Effects of Pile Removal and Installation on Marine Mammals .............................. 7-1 7.2 Vessel Interactions ............................................................................................................... 7-3 7.3 Water Quality ........................................................................................................................ 7-3 7.4 Prey Availability .................................................................................................................... 7-3 7.5 Conclusions Regarding Impacts to Species or Stocks ........................................................ 7-4
8.0 Impacts to Subsistence ...................................................................................................... 8-1 9.0 Impacts to Marine Mammal Habitat and the Likelihood of Restoration .............................. 9-1
9.1 Effects of Project Activities on Marine Mammal Habitat....................................................... 9-1 9.2 Effects of Project Activities on Marine Mammal Prey Habitat .............................................. 9-2
10.0 Impacts to Marine Mammals from Loss or Modification of Habitat .................................... 10-1

Table of Contents Request for Incidental Harassment Authorization
October 2021 v
11.0 Mitigation Measures ........................................................................................................... 11-1 11.1 General Construction Activities ............................................................................................ 11-1 11.2 Pile Removal and Installation Activities ................................................................................ 11-1
12.0 Effects on Arctic Subsistence Hunting and Plan of Cooperation ........................................ 12-1 13.0 Monitoring and Reporting Efforts ........................................................................................ 13-1
13.1 Monitoring and Reporting Efforts ......................................................................................... 13-1 13.2 Reporting .............................................................................................................................. 13-1
14.0 Research Efforts ................................................................................................................. 14-1 15.0 References ......................................................................................................................... 15-1
APPENDICES Appendix A: Engineering Drawings Appendix B: Underwater Noise Technical Memorandum Appendix C: Biological Assessment Appendix D: Essential Fish Habitat Assessment Appendix E: List of Invited Parties
LIST OF FIGURES Figure 1-1: Regional Site Map ............................................................................................................... 1-3 Figure 1-2: Site Location ........................................................................................................................ 1-4 Figure 2-1: Action Area .......................................................................................................................... 2-3 Figure 6-1: Representative Zones of Impact for Pile Removal and Installation Underwater Noise ....... 6-10 Figure 6-2: Representative Zones of Impact for Pile Removal and Installation Airborne Noise ............ 6-11 Figure 11-1: Proposed Monitoring and Shutdown Zones ...................................................................... 11-4
LIST OF TABLES Table ES-1: Total Exposure Estimates .................................................................................................. iii Table 3-1: Marine Mammals Potential Occurring in Waters near the Activity Area ............................... 3-1 Table 6-1: Representative Levels of Underwater Anthropogenic Noise Sources .................................. 6-1 Table 6-2: Hearing and Vocalization Ranges for Marine Mammal Functional Hearing Groups and
Species Potentially within the Project Areas ................................................................ 6-3 Table 6-3: Injury and Disturbance Threshold Criteria for Underwater and Airborne Noise ................... 6-3 Table 6-4: Proxy Underwater Sound Source Levels for Pile Placement and Removal ......................... 6-6 Table 6-5: Calculated Radial Distances to Underwater Marine Mammal Impact and Down the
Hole Rock Socket Driving Noise to Cumulative Sound Exposure Level PTS and Behavioral Disturbance Thresholds ............................................................................. 6-7
Table 6-6: Calculated Radial Distances to Underwater Marine Mammal Impact– Peak PTS Thresholds ................................................................................................................... 6-7
Table 6-7: Calculated Radial Distances to Underwater Marine Mammal Vibratory Removal Noise Thresholds Within Threshold Distances ...................................................................... 6-8
Table 6-8: Calculated and Measured Distances to Pinniped Behavioral Airborne Noise Thresholds Impact Pile Driving .................................................................................... 6-9

Table of Contents Request for Incidental Harassment Authorization
October 2021 vi
Table 6-9: Estimated Group Size and Predictable Occurrence of Marine Mammals in the Zones of Impact .......................................................................................................................... 6-12
Table 6-10: Potential Exposures of Marine Mammals During Project Activities .................................... 6-13 Table 6-11: Take Request Summary ..................................................................................................... 6-13 Table 9-1: Estimate of Direct Impacts to Aquatic Habitats from Proposed Structures .......................... 9-1

Acronyms and Abbreviations Request for Incidental Harassment Authorization
October 2021 vii
LIST OF ACRONYMS AND ABBREVIATIONS °F degrees Fahrenheit ADF&G Alaska Department of Fish and Game ADOT&PF Alaska Department of Transportation and Public Facilities CFR Code of Federal Regulations CV coefficient of variation dB decibels dB re 1 µPa decibels referenced to 1 micro Pascal DPS distinct population segment DTH down-the-hole eDPS Eastern Distinct Population Segment EFH essential fish habitat ENP Eastern North Pacific ESA Endangered Species Act FR Federal Register HTL high tide line Hz Hertz IHA incidental harassment authorization m meter MMPA Marine Mammal Protection Act MOC-A Marine Operations Center-Atlantic MOC-P Marine Operations Center-Pacific NAD83 North American Datum of 1983 NEPA National Environmental Policy Act NMFS National Marine Fisheries Service, also referred to as NOAA Fisheries NOAA National Oceanic and Atmospheric Administration NPFMC North Pacific Fishery Management Council OMAO Office of Marine and Aviation Operations PTS permanent threshold shift RMS root mean square SEL sound exposure level SELCUM cumulative sound exposure level SPL sound pressure level TL transmission loss TTS temporary threshold shift U.S. United States U.S.C. United States Code wDPS Western Distinct Population Segment ZOI zone of impact

1 Introduction and Description of Activities Request for Incidental Harassment Authorization
October 2021 1-1
1.0 INTRODUCTION AND DESCRIPTION OF ACTIVITIES A detailed description of the specific activity or class of activities that can be expected to result in incidental taking of marine mammals.
1.1 INTRODUCTION The National Oceanic and Atmospheric Administration (NOAA) has prepared this incidental harassment authorization (IHA) application of marine mammals for its project to recapitalize its property and facilities currently operated by the Office of Marine and Aviation Operations (OMAO) at the existing Marine Operations Center-Pacific (MOC-P) Ketchikan Port Facility.
Under the Marine Mammal Protection Act (MMPA) of 1972, as amended (16 United States Code [U.S.C.] Section 1371[a][5][D]), NOAA OMAO is requesting an IHA for project activities that are expected to result in the unintentional take of marine mammals. Section 1 through Section 14 of this application cover the 14 specific items required for this application, as set out by 50 Code of Federal Regulations (CFR) 216.104 Submission of Requests.
Construction of the project is expected to occur from February 2022 through December 2022. The NOAA OMAO will notify the National Marine Fisheries Service (NMFS) of any changes to project dates. Dates and durations are described in Section 2.
1.1.1 Overview The mission of the NOAA OMAO is to safely deliver effective Earth-observation capabilities; integrate emerging technologies; and provide a specialized, flexible, and reliable team responsive to NOAA and the nation. In order to meet its mission, OMAO manages and operates NOAA's fleet of 16 research and survey ships and nine aircraft.
OMAO’s research and survey ships comprise the largest fleet of federal research ships in the nation. Ranging from large oceanographic research vessels capable of exploring the world’s deepest ocean to smaller ships responsible for charting the shallow bays and inlets of the United States (U.S.), the fleet supports a wide range of marine activities including fisheries research, nautical charting, and ocean and climate studies.
Administrative, engineering, maintenance, and logistical support for the NOAA fleet are based out of either the MOC-P or the Marine Operations Center-Atlantic (MOC-A). The MOC-P is in Newport, Oregon and the MOC-A is in Norfolk, Virginia. Although a few NOAA ships are berthed at the MOC-P or MOC-A facilities, for efficiency and continuance of operation, a majority of NOAA ships are strategically berthed at locations closer in proximity to their dedicated or primary mission support areas.
NOAA proposes to recapitalize property and facilities operated by its OMAO at their MOC-P Ketchikan Port Facility in the city of Ketchikan in the southeast region of Alaska (Figure 1-1). The Ketchikan Port Facility is a dedicated homeport for the NOAA Ship Fairweather and may temporarily support other OMAO MOC-P vessels, or by arrangement, vessels managed by other agencies or entities. The existing NOAA facilities are currently unable to fully support the berthing of vessels or staging for cruises or missions carried out by OMAO. Proposed actions to recapitalize the facility are described in Section 1. NOAA has tentatively identified physical and operational design requirements for the Ketchikan Port Facility for upland and in-water environments. Prior to implementing proposed or alternative actions, NOAA will select a design/build contractor through its source selection process and award a contract in Fiscal Year 2021.
1.1.2 Background OMAO operates and maintains its MOC-P Ketchikan Port Facility at 1010 Stedman Street in the city of Ketchikan, Alaska (Figure 1-2). The facility was acquired to serve as the dedicated homeport for the NOAA Ship Fairweather in support of its primary mission to conduct surveys to provide updates to nautical charts and other hydrographic products. This data enables accurate mapping of the continental shelf in the Arctic and bathymetry for safe navigation throughout the North Pacific. In addition to

1 Introduction and Description of Activities Request for Incidental Harassment Authorization
October 2021 1-2
supporting marine navigation, Fairweather’s data is also used for marine ecosystem studies, fisheries habitat mapping, and ocean research.
Although Ketchikan Port Facility was acquired as the NOAA Ship Fairweather’s dedicated homeport and berthing facility, the Fairweather and other vessels have been unable to berth at the facility for several years due to deteriorating or obsolete upland and in-water conditions. In 2008, NOAA condemned its wooden approach trestle and wooden pier leading out to the concrete waterfront pier as unsafe due to disrepair of existing wooden pier piles and structural support members. Due to this deficiency and OMAO being unable to use the Ketchikan Port Facility as a ship berthing location, the Fairweather has been temporarily using the nearby Coast Guard Station Ketchikan pier when in Ketchikan. NOAA/OMAO is proposing to recapitalize the Ketchikan Port Facility by demolishing obsolete facilities; regrading upland areas; and upgrading or replacing necessary in-water, over-water, and upland structures and infrastructure.
1.2 PROPOSED ACTION NOAA/OMAO is proposing to recapitalize its MOC-P Ketchikan Port Facility to reestablish homeport operations and maintenance functions for the NOAA Ship Fairweather and other vessels. The Proposed Action would include the removal and appropriate disposal of unused or obsolete structures and infrastructure, in both a 77,000-square-foot upland area and within 102,000 square feet of the in-water area, all owned by NOAA. Unnecessary upland structures and remnant infrastructure associated with prior uses of the property will be removed. Upland structures critical to OMAO include the existing office and warehouse buildings. Other areas will be razed, graded, and paved for parking and vehicle circulation. Most existing in-water structures, including pier, access trestle, and mooring dolphins present above and below the water surface, are inadequate and would be removed. The in-water structures would be replaced by adequately sized and structurally sound elements necessary for berthing, preparing, and maintaining vessel operations. Details regarding NOAA’s actions for implementing the proposed recapitalization project are provided in Section 1.
1.2.1 Purpose and Need The existing facilities at the Ketchikan Port Facility are inefficient to berth the Ship Fairweather; the in-water pier, access trestle, and mooring dolphin infrastructure are in disrepair and have been closed to berthing or staging of vessels since 2008. The existing pier is undersized with severe deterioration of timber piles; the bracing for the trestle and pier have made them unsafe for use. Consequently, the NOAA Ship Fairweather has been without a dedicated Alaskan homeport facility and is wintering at the MOC-P facility in Newport, Oregon.
The purpose of the Proposed Action to recapitalize the property and facilities operated by its OMAO at its existing Ketchikan Port Facility to enable OMAO to provide critical management and operational and logistical support to the NOAA Ship Fairweather and intermittently to other NOAA and non-NOAA vessels.

_̂(
!
!
!
!
!
!
!
!
!
!
!
!
!
!
!
!
!
!!
!
!
!
! !
!
!
!!
!
!
!
!
011541000100U S COAST GUARDCOM 17TH CG
Haines
Metlakatla
Coffman Cove
Thorne Bay
Hollis
Port Protection
SkagwayKlukwan
Juneau
Pelican
Tenakee Springs
HoonahElfin Cove
Angoon
Kake
WrangellPoint Baker
PetersburgKupreanof
Port Alexander
Edna Bay
CraigKlawock Kasaan
Hydaburg
Meyers Chuck
KetchikanSaxman
Hyder
Sitka
Gustavus
Whale Pass
NOAAKetchikan Homeport Revitalization ProjectINCIDENTAL HARASSMENT AUTHORIZATION
REGIONAL SITE MAPFigure 1-1
0 50Miles
Map Extent
AECOM Anchorage AK 9/3/2021 USER thomas.schultz PATH C:\Ketchikan\IHA Figures\Figure 1-1 Regional Site Map.mxd
Legend_̂( Ketchikan Port Facility
KetchikanPort Facility
AlaskaCanada
AlaskaCanada

011531001000U S UNITED
STATES OF AMERICA
011531000500HARBOR ENTERPRISES
INC DBA PETROMARINE SERVICES
011531000900NORTHLAND
SERVICES INC
011531000800ALASKA GENERAL
SEAFOODS
011542000500HARBOR ENTERPRISES
INC DBA PETROMARINE SERVICES
011541000100U S COAST GUARD
COM 17TH CG
011531000700ALASKA GENERAL
SEAFOODS
011441007200ATS3STATE OF ALASKADEPARTMENT OF
NATURAL RESOURCES
NOAAKetchikan Homeport Revitalization ProjectINCIDENTAL HARASSMENT AUTHORIZATION
SITE LOCATIONFigure 1-2
Imagery: 2015; GeoNorth OIM BDL WMSParcels: Ketchikan Gateway Borough0 250
Feet
!
!
!
Map Extent
Saxman
Ketchikan
AECOM Anchorage AK 9/3/2021 USER thomas.schultz PATH C:\Ketchikan\IHA Figures\Figure 1-2 Site Location.mxd
LegendNOAA ParcelSurrounding ParcelsProject AreaConsolidated Lot
Tract CTract E
Stedman Street
Steamplant Shed
Wharf Access Trestle
Utility Trestle
Utility Trestle
Lab Building
WarehouseOffices
Power Vault Shed
Storage Building
Main Wharf
Covered Shelter

1 Introduction and Description of Activities Request for Incidental Harassment Authorization
October 2021 1-5
The need for the Proposed Action is to meet the congressional mandate of the Frank LoBiondo Coast Guard Authorization Act of 2018 (Public Law 115-282), including Section 1003, Homeport of Certain Research Vessels, subpart (a) Acceptance of Funds Authorized. This subpart states, as mandated:
The Secretary of Commerce may accept non-Federal funds for the purpose of the construction of a new port facility, including obtaining such cost estimates, designs, and permits as may be necessary to facilitate the homeporting of the R/V FAIRWEATHER in accordance with Title II of the Departments of Commerce, Justice, and State; the Judiciary; and Related Agencies Appropriations Act, 2002 (Public Law 107-77; 115 Stat. 775) at a location that during such homeporting shall be under the administrative jurisdiction of the under Secretary of Commerce for Oceans and Atmosphere. Statute 775 specifically provides that the R/V FAIRWEATHER shall be homeported in Ketchikan, Alaska.
1.2.1 Project Location/Setting The Proposed Action would occur on property and facilities obtained by NOAA in 2004 and operated by OMAO as its existing Ketchikan Port Facility at 1010 Stedman Street in the city of Ketchikan, Ketchikan Gateway Borough, Alaska (Figure 1-1). The geographical coordinates of the 4.11-acre property are 55° 20' 04.30" North; 131" 37' 46.89" West, based on the North American Datum of 1983 (NAD83).
The property, formerly a fuel transfer dock and warehouse area owned and operated by the Tesoro Refining and Marketing Company (Tesoro), is composed of a portion of Tract C, U.S. Survey Number (No) 1381, consisting of land above the meander line at the Tongass Narrows, and a portion of Tract E, City of Ketchikan Tidelands Subdivision, Tidelands Addition to Survey Number 1381. It is in an area zoned as Heavy Industrial with approximately 410 linear feet of submerged water frontage.
Except for areas adjacent to and below the high tide line (HTL), the majority of the upland property is covered with asphalt or cement and various structures.
1.2.2 Proposed Upland Actions Nearly all the existing OMAO facilities and assets developed at its Ketchikan Port Facility would be affected. Proposed actions upland of the HTL elevation include:
• Corrugated metal warehouse building (3,600 square feet)—to remain in use with upgrades to replace the existing roof and to install new windows
• Prefabricated office building (1,200 square feet)—to be removed and replaced (details of the new office building are provided below)
• Aluminum-sided storage building (900 square feet)—to be removed • Aluminum-sided electrical power vault building (383 square feet)—to be removed • Fuel/oil spill catchment shelter (832 square feet)—to be removed, graded, and paved • Shoreside laboratory building (1,200 square feet)—to be removed • Asphalt paved and unpaved areas for circulation, parking and outdoor storage—to be removed,
graded and paved with asphalt • Buried remnant infrastructure (e.g., fuel pipelines and pumps and abandoned utility conduit)—to be
removed • Existing utility infrastructure—to be rerouted on site, as needed • Fencing and gates—to be removed and replaced • New single story, pre-engineered metal office building (approximately 2,600 square feet) on a
concrete pad to include six offices, two bathrooms, conference room, and light storage—to replace the existing prefabricated office building
• New cast in place concrete transfer bridge abutment (approximately 40 feet long and tapering from approximately 55 feet wide at the onshore end to approximately 35 feet at the offshore end)
• New concrete boat launch ramp (approximately 160 feet by 18 feet) of which approximately half would be a cast in place concrete apron and half of pre-cast concrete panels, supported on mound of shot rock fill with armor rock protection.

1 Introduction and Description of Activities Request for Incidental Harassment Authorization
October 2021 1-6
The remaining fenced grounds of the NOAA property would be regraded and paved to accommodate up to 40 parking spaces, typically used during vessel missions by NOAA personnel. The total upland impervious area is approximately 38,180 square feet. A drainage feature receiving surface water flows from higher elevations and culverts adjacent to and under Stedman Street emerges above ground and flows to Tongass Narrows at the most southerly portion of the Ketchikan Port Facility property. This surface drainage feature within the NOAA property but outside of the existing NOAA security fence would not be altered as part of the Proposed Action.
Remnant fuel lines and upland utilities—both buried and overhead—would be removed and utility conduit rerouted to connect with public utility service lines immediately off site. These service lines include electrical power, potable water, firefighting utilities, sewer, and telecommunications. A buried sewer-holding tank would be relocated farther upland on the property, requiring excavation of up to 8 feet for removal and installation of a replacement tank. Two existing fuel tanks and appurtenances would be salvaged. Concrete and other nonhazardous materials would be stockpiled for disposal to a regional landfill.
Upland demolition and construction activities are anticipated to be undertaken using an excavator, forklift, and 50-ton crane.
1.2.3 Proposed In-Water Actions Nearly all of the existing in-water infrastructure would be removed, including the following in-water and over-water structures and assets:
• Remnant wooden access trestle and parallel utility trestle and supporting piles • Main pile-supported pier structure (9,000 square feet) and supporting piles • Steam plant (boiler) shed on the pier • Three concrete-filled steel mooring dolphins • Two single piles extending above the water surface • Steel pipe struts and cable braces • Floating cylindrical fendering (250 linear feet); this may be saved or salvaged by contractor
The following in-water infrastructure would be retained and/or salvaged:
• Concrete/steel mooring platform (750 square feet) and breasting dolphin with fender—to be retained; connecting metal catwalks to be salvaged.
In-water work would be performed using equipment based on a floating barge or from the shore, as needed. In-water concrete and other nonhazardous materials to be removed would be stockpiled for disposal to a regional landfill. An estimated 100 to 200 remnant piles would be removed. Wood piles would be choked and pulled by vibratory methods; if piles incur breakage or splintering during the removal process, the pile would be cut at or about 2 feet from the bottom. Steel piles would be cut at or near the mudline using a torch or plasma cutter for cuts above low water. For cuts made below low-water, or if the piles are concrete-filled, a wire saw would be used.
An approximately 240-foot long and 50-foot wide (48-foot wide pier with 2-foot fendering) floating replacement pier would replace the existing pier and its supporting piles. The floating pier would be secured and stabilized by 10 steel piles, each 24 inches in diameter, and accessed via a single, 144-foot long and 17-foot wide steel, truss-framed transfer bridge. The transfer bridge would be supported by a bridge support float adjacent to the pier and hinged to the shoreline cast in place concrete abutment. The 24-foot by 22-foot bridge support float would be secured by four additional 24-inch diameter steel piles. Replacement mooring dolphins and fenders for mooring would be installed. Ship utilities would be extended dockside attached to the transfer bridge (60 percent design drawings for the project are provided in Appendix A).
A small boat dock, approximately 90 feet long by 14 feet wide, would be installed and connected to the floating dock by an aluminum gangway approximately 40 feet long and 5 feet wide. Four piles are required to support this structure.

1 Introduction and Description of Activities Request for Incidental Harassment Authorization
October 2021 1-7
The small boat launch ramp proposed at the northern portion of the NOAA-owned shoreline would be supported on a raised, rip-rap protected mound with side slopes of 2:1 (Horizontal:Vertical) and a footprint of approximately 200 feet by 70 feet wide.
Installation of the new steel piles is anticipated to be undertaken using a barge mounted down-the-hole (DTH) system and vibratory hammer. Piles would be embedded into socket holes created by the DTH in bedrock to a minimum depth of 20 feet. The last foot of each pile would be “proofed” using an impact pile driver that is anticipated will require approximately 5 to 10 blows per pile based on the contractor’s experience at other pile-driving sites in the Ketchikan area.
1.2.4 Proposed Utilities and Other Services NOAA would install or upgrade the utility services and security fencing. Utility services would include water, sewer, telephone, communications/cable, electrical, waste disposal, and janitorial services. Utility services will be extended to on-site structures and to berthing stations at the large vessel pier and small craft dock.
Existing active and abandoned electric, telephone, fueling, sewer, water, and communications conduits, as well as any other obsolete improvements or fixtures (lighting and fencing), will be removed to accommodate the accepted revised layout and design. This may include demolition of existing structures or substructures.
Anticipated electrical requirements would include: two ship power receptacles for 480 volts, 400 amperes, three-phase services; at least one industrial power receptacle for three-phase, four wire 277/480 volt, 200 amperes, and three three-wire 120/240 volt 20 amperes services; and at least three 110 volt AC ports for the ship service at each of the berths.
In addition to the proposed actions mentioned above, NOAA would install a self-contained backup power generator within a sound-attenuation enclosure and a double-walled diesel fuel supply for continuation of electrical power for emergency lighting and electronics during infrequent power outages. This unit would also be used for short periods during monthly preventative maintenance.
Telecommunication terminals would include two telephones, four cable runs, and eight single mode fiber optic cables with dual pathways per local service provider, to provide redundancy that does not interrupt service or act as a single point of failure.
Potable water service and expanded sewer disposal infrastructure will be provided on site and extended to berthing stations and adjacent connections with local service providers along Stedman Street. Bilge water would be separated from oily waste, which would be stored on board in a tank until it could be pumped on shore to a truck for disposal.
Security services and infrastructure will consist of the replacement of existing perimeter security fencing, use of electronic Common Access Card reader at the entry gate, and prearranged access for visitors and vendors. Temporary access will be provided for local construction contractors as well as those arriving from outside Southeast Alaska.
2 Dates, Duration, and Location of Activities Request for Incidental Harassment Authorization
October 2021 2-1
2.0 DATES, DURATION, AND REGION OF ACTIVITY The dates and duration of such activity and the specific geographical region where it will occur.
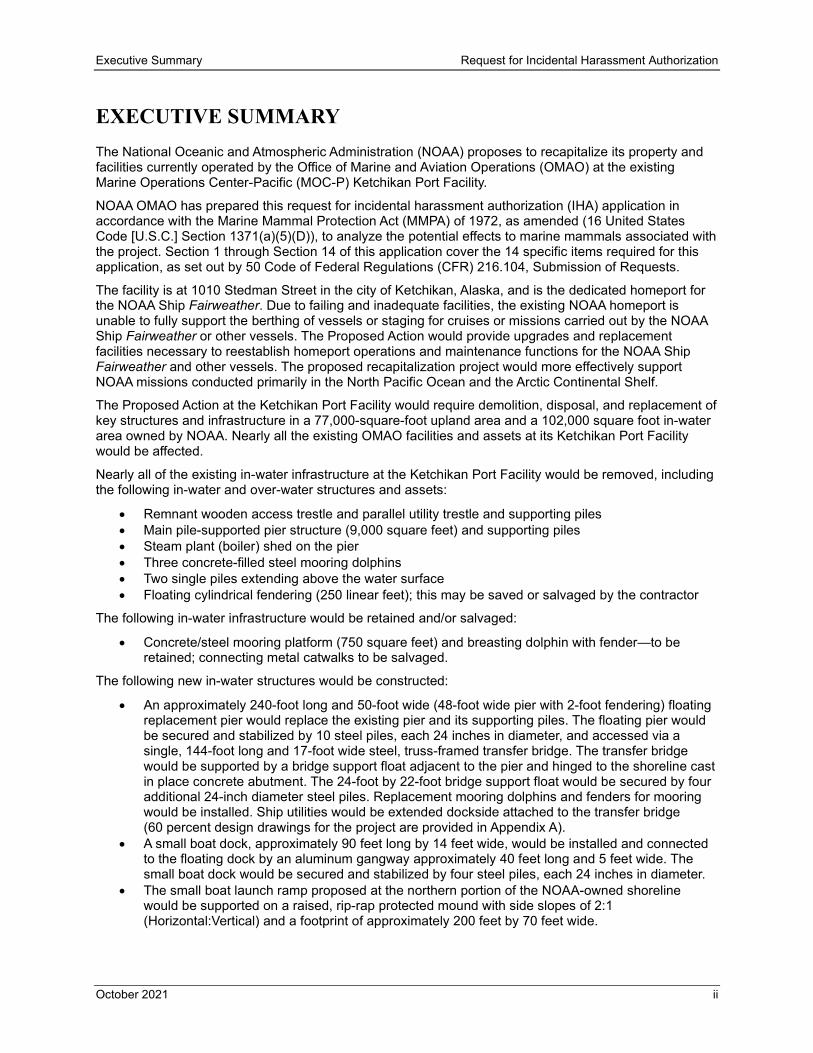
2.1 DATES AND DURATION No in-water work would begin until the NOAA has received all required permits and approvals. In-water work including pile removal and placement is anticipated to occur for 48 days between February 2022 through December 2022. Therefore, NOAA is requesting authorization from February 1, 2022 to January 31, 2023.
2.2 GEOGRAPHIC REGION OF ACTIVITIES The project is in the city of Ketchikan, Ketchikan Gateway Borough, on Revillagigedo Island and the east shore of the Tongass Narrows waterway. The geographical coordinates of the 4.11-acre property are 55° 20' 04.30" North; 131" 37' 46.89" West, based on the NAD83.
The region consists of a coastal mountain range that stretches from northern British Columbia to Skagway, Alaska. The natural topography of the local area largely consists of moderately steep slopes trending toward the Tongass Narrows waterway. In this region, the Tongass Narrows is part of Southeast Alaska’s Inside Passage where it splits into two channels by Pennock Island. The eastern side is bound by Revillagigedo Island and the western side by Gravina Island. The Inside Passage is a common route for maritime traffic between the Gulf of Alaska and Puget Sound.
The Proposed Action is at the existing NOAA-owned OMAO Ketchikan Port Facility in a shoreline industrial waterfront. At this location, OMAO staff currently manage a small administrative office, warehouse, electrical building, and other upland buildings, along with an existing inoperable main pier with breasting dolphin, a derelict access trestle, and individual mooring dolphin structures. The NOAA property consists of a portion of Tract C, U.S. Survey Number 1381, that includes approximately 77,000 square feet of largely paved land above the meander line at the Tongass Narrows, of which approximately 1,700 square feet consists of rocky shoreline. The NOAA property also includes an adjacent portion of Tract E, City of Ketchikan Tidelands Subdivision, Tidelands Addition to Survey Number 1381 that includes 102,000 square feet of land. It is situated in an area zoned as Heavy Industrial, with approximately 410 linear feet of submerged water frontage.
The general vegetation of the Tongass Narrows region includes forested areas of Sitka spruce (Picea sitchensis) and mountain hemlock (Tsuga mertensiana) with patches of alder (Alnus spp.) shoreline grasses and forbs in some locations. Except for areas adjacent to and below the HTL, about 90 percent of the property is covered with asphalt or cement. In the nearshore marine environment are rockweeds (Fucus spp.) and kelp (Nereocystis spp.).
Above the HTL, much of the underlying silty sand, gravel, and rock were removed and the facilities and pavement placed directly on schist bedrock. Most of the onshore portion of the site consists of imported shot (crushed) rock fill. No previously undisturbed native soils exist at the site. The depth to bedrock underlying the imported fill varies from 1 to 2 feet in the southern half of the site, and up to 6.5 feet in the northern half of the site. Offshore marine sediments are reported to be minimal, with sediment cover depths progressively increasing away from the shoreline. Marine sediment depths overlying bedrock reportedly range from 4 to 5 feet and consist of coarse sand, rock fragments, and shells (Bristol 2003).
Ongoing vessel activities throughout Tongass Narrows waterway, land-based industrial and commercial activities, and regular aircraft operations result in elevated in-air and underwater sound conditions in the area. Sound levels likely vary seasonally, with elevated levels during summer when the tourism and fishing industries are at their peaks. The shoreline and underwater portions of the area are highly modified by existing dock structures and past dredging.

2 Dates, Duration, and Location of Activities Request for Incidental Harassment Authorization
October 2021 2-2
2.3 ACTION AREA The action area includes all areas affected directly or indirectly by the federal action and not merely the immediate area involved in the action (50 CFR Part 402.02). This area is the geographic extent of the physical, chemical, and biological effects (zones of impact) resulting from the project, including direct and indirect effects, and effects of interrelated and interdependent activities. This section briefly provides the extent of impacts and a more detailed analysis, which includes a description of noise and marine mammal injury; disturbance thresholds are provided in Section 6.
The action area encompasses project area as well as the spatial extent for underwater noise (12 kilometers) and airborne noise (1 kilometer). The complete action area, terrestrial and aquatic portions, is shown in Figure 2-1. An Underwater Noise Technical Memorandum prepared for installation/removal of piles at Ketchikan Port Facility is provided in Appendix B. The action area is also described in the biological assessment provided in Appendix C, and the essential fish habitat (EFH) assessment provided in Appendix D.

!
!
!
!
!
!
!
!
!
!
!
!
!
!
!
!
!
!
!
!
!
!
!
!
!
!
!
!
RevillagigedoIsland
GravinaIsland
AnnetteIsland
Carla
nna C
reek
Hoadley C
reek
Ketch
ikan C
reek
Gove
rnmen
t Cree
kBeaver Falls
Dairy
Herring Cove
Ketchikan
Mountain Point
Peninsula Point
Refuge Cove
Saxman
Shoreline Drive
Ward Cove
AchillesMountain
AnvilMountain
BingoMountain
Brush Hill
Buck Mountain
Bush Mountain
CurveMountain
DeerMountains
DianaMountain
Doe Mountain
Dude Mountain
Fawn Mountain
Fish Mountain
Flat Mountain
John Mountain
Judy Hill
Juno Mountain
LevelMountain
MahoneyMountain
MinervaMountain
NippleMountain
Northbird
NubbinsMountain
PlainMountain
Red Mountain
Roy JonesMountain
SignalMountain
Spot Mountain
Twin Peaks
NOAAKetchikan Homeport Revitalization ProjectINCIDENTAL HARASSMENT AUTHORIZATION
ACTION AREAFigure 2-1
Imagery: 2015; GeoNorth OIM BDL WMSParcels: Ketchikan Gateway Borough0 5
Miles
AECOM Anchorage AK 10/5/2021 USER thomas.schultz PATH \\na.aecomnet.com\lfs\AMER\Oakland-USOAK01\DCS\Projects\_ENV\60640505_NOAA_OMAO_Ketch\900_CAD_GIS AECOM\02_Maps\02_Report_Maps\IHA\Figure 2-1 Action Area.mxd
LegendProject Area
Action AreaAirborne NoiseUnderwater Noise

3 Marine Mammal Species and Numbers Request for Incidental Harassment Authorization
October 2021 3-1
3.0 MARINE MAMMAL SPECIES AND NUMBERS The species and numbers of marine mammals likely to be found within the activity area.
Known distribution ranges of a number of marine mammal species, subspecies, stocks, or distinct population segments (DPSs) encompass the portion of Tongass Narrows in which the proposed project would occur. The NMFS Alaska Protected Resources Division Species Distribution mapper lists the fin whale, humpback whale, minke whale, gray whale, killer whale, Pacific white sided dolphin, harbor porpoise, Dall’s porpoise, harbor seal, and Steller sea lion as species with a range that may extend into the activity area (NMFS 2021). While the fin whale is mapped as having a range extending into the activity area, there are no known sightings in Tongass Narrows, and recent IHAs issued by NMFS in the Ketchikan area have not included the fin whale (Dalheim et al. 2009; HDR 2019). Based on this information, the fin whale is not included in this application and is not discussed further. A summary of MMPA / Endangered Species Act (ESA) status, stock abundance, and potential occurrence of marine mammal species is provided in Table 3-1. Life history information for each species is provided in Section 4.
Table 3-1: Marine Mammals Potential Occurring in Waters near the Activity Area
Species Stock (and DPS) MMPA Status ESA Status Stock
Abundance Potential
Occurrence
Order Cetacea
Suborder Mysticeti (baleen whales)
Family Balaenopteridae (rorquals)
Humpback whale (Megaptera novaeangliae)
Central North Pacific Hawaii DPS
Depleted, Strategic
Delisted in 2016 10,103 Common
CA/OR/WA Mexico DPS
Depleted, Strategic Threatened 2,900 Common
Minke whale (Balaenoptera acutorostrata)
Alaska Nonstrategic, Non-Depleted Not Listed unknown Rare
Family Eschrichtiidae (gray whale) Gray Whale (Eschrichtius robustus)
Eastern North Pacific
Nonstrategic, Non-Depleted Not Listed 26,960 Rare
Suborder Odontoceti (toothed whales)
Family Delphinidae (dolphins)
Killer Whale (Orcinus orca)
Northern Resident Nonstrategic, Non-Depleted Not Listed
302
Intermittent Alaska Resident 2,347 West Coast Transients 349
Pacific white-sided dolphin (Lagenorhynchus obliquidens)
North Pacific Nonstrategic, Non-Depleted Not Listed 26,880 Rare
Family Phocoenidae (porpoises) Harbor porpoise (Phocoena phocoena)
Southeast Alaska Stock
Strategic, Non-Depleted Not Listed 1,354 Infrequent

3 Marine Mammal Species and Numbers Request for Incidental Harassment Authorization
October 2021 3-2
Table 3-1: Marine Mammals Potential Occurring in Waters near the Activity Area
Species Stock (and DPS) MMPA Status ESA Status Stock
Abundance Potential
Occurrence Dall’s porpoise (Phocoenoides dalli) Entire Alaska Stock Protected,
Nonstrategic Not Listed 83,400 Infrequent
Order Carnivora
Suborder Pinnipedia
Family Otariidae (fur seals and sea lions)
Steller sea lion (Eumetopias jubatus)
Eastern Stock Nonstrategic, Non-Depleted
Delisted in 2013 43,201 Common
Western Stock Depleted, Strategic Endangered 52,932 Unlikely
Family Phocidae (true seals) Harbor seal (Phoca vitulina) Clarence Strait Nonstrategic,
Non-Depleted Not Listed 27,659 Common
Notes: Source: National Marine Fisheries Service marine mammal stock assessment reports at: https://www.fisheries.noaa.gov/national/marine-mammal-protection/marine-mammal-stock-assessment-reports-species-stock DPS = Distinct Population Segment ESA = Endangered Species Act MMPA = Marine Mammal Protection Act Occurrence:
Rare: Few or no confirmed sighting or the distribution of the species is near enough to the area that the species could occur there. Infrequent: Confirmed, but irregular sightings. Intermittent: Species known to use the action area periodically but are not residents. Common: Confirmed and regular sightings of the species.

4 Affected Species and Status and Distribution Request for Incidental Harassment Authorization
October 2021 4-1
4.0 AFFECTED SPECIES AND STATUS AND DISTRIBUTION
A description of the status and distribution, including seasonal distribution (when applicable), of the affected species or stocks of marine mammals likely to be affected by such activities.
This section describes the status, distribution, behavior, and critical habitat for the affected species/stocks of marine mammals likely to be affected by the proposed project. Discussion of species prevalence in the project area is provided in Section 6.
4.1 HUMPBACK WHALE 4.1.1 Status and Management In 1970, the humpback whale was listed as endangered under the Endangered Species Conservation Act (ESCA) (35 Federal Register [FR] 18319). NMFS conducted a global status review and reassessed the status of humpback whales under the ESA (replaced the ESCA in 1973) (Bettridge et al. 2015). Based on that review, 14 DPSs of humpback whales were identified, and listing status revised (81 FR 62260).
In the North Pacific, five DPSs that breed in subtropical and tropical waters from Asia to Central America and migrate north to feed in highly productive North Pacific feeding grounds were identified (Bettridge et al. 2015). Whales from three of these DPSs migrate to Alaskan waters: the Mexico DPS (ESA-listed as threatened), the Western North Pacific DPS (ESA-listed as endangered), and the Hawaii DPS (delisted) (81 FR 62260). These DPSs generally represent the California/Oregon/Washington, Western North Pacific, and Central North Pacific stocks, respectively.
4.1.2 Distribution The humpback whale is distributed worldwide in all ocean basins. Relatively high densities of humpback whales are found in feeding grounds in Southeast Alaska and northern British Columbia, particularly during summer months. Based on extensive photo identification data, NMFS has determined that individual humpback whales encountered in Southeast Alaska and northern British Columbia have a 98 percent probability of being from the recovered (delisted) Hawaii DPS and a 2 percent probability of being from the currently threatened (ESA-listed) Mexico DPS (coefficient of variation [CV]=0.03) (Wade 2021). There is a 0 percent probability that humpback whales in Southeast Alaska are from the endangered Western North Pacific DPS (Wade 2021). Intermixed DPSs are not visually distinguishable; their identity can only be determined by DNA or photo identification. Therefore, this report uses the Wade (2021) DPS ratio that assumes 98 percent of humpbacks in Southeast Alaska are from the Hawaii DPS and 2 percent are from the Mexico DPS for ESA purposes.
Humpback whales migrate to Alaska to feed after months of fasting in the low latitude breeding grounds. The timing of migration varies among individuals: most begin returning to Alaska in spring and most depart Alaska for southern breeding grounds in fall or winter. Peak numbers of humpbacks in Southeast Alaska occur during late summer to early fall, but because there is significant overlap between departing and returning whales, humpbacks can be found in Alaska feeding grounds in every month of the year (Baker et al. 1985; Straley 1990; Witteveen and Wynne 2009). There is also an apparent increase in the number of humpback whales overwintering in feeding grounds in Alaska, including reports in Ketchikan during some years in the winter (Straley et al. 2017; Liddle 2015; 84 FR 36891).
Hawaii Distinct Population Segment Humpback Whale (Hawaii DPS) Humpback whales that breed around the main Hawaiian Islands were observed in summer feeding grounds throughout the North Pacific. Most of the Hawaii DPS migrates to feeding grounds in Southeast Alaska and northern British Columbia (Bettridge et al. 2015). Mark-recapture analysis of identification photographs suggests the Hawaii DPS is composed of approximately 10,103 individuals and is increasing (Calambokidis et al. 2008). A multi-strata analysis estimated the abundance of the Hawaii DPS at 11,398 individuals (CV=0.04) (81 FR 62260). As mentioned above, Wade (2021) estimated that

4 Affected Species and Status and Distribution Request for Incidental Harassment Authorization
October 2021 4-2
98 percent of the humpbacks encountered in Southeast Alaska and Northern British Columbia are from the Hawaii DPS.
Mexico Distinct Population Segment Humpback Whale (Mexico DPS) Whales in the Mexico DPS typically breed off of Mexico and migrate to northern feeding grounds ranging from British Columbia to the western Gulf of Alaska. Given their widespread range and their opportunistic foraging strategies, Mexico DPS humpback whales may be in the vicinity during the proposed project activities. In the final rule changing the status of humpback whales under the ESA (81 FR 62260), the abundance of the Mexico DPS was estimated to be 2,900 individuals (CV=0.06) with an unknown trend. Note that only a portion of the Mexico DPS migrates to Alaska for feeding; the probability that a whale encountered in Southeast Alaska and northern British Columbia is from the Mexico DPS is 2 percent, as mentioned above (Wade 2021).
4.1.3 Site-Specific Occurrence Humpback whales occur frequently in Tongass Narrows and the adjacent Clarence Strait during summer and fall months to feed. Data on the distribution suggests that both the Mexico DPS and Hawaii DPS of humpback whales may be present in the Tongass Narrows area. Because humpback whale individuals of different DPS (natal) origin are generally visually indistinguishable, the frequency of occurrence is estimated using the DPS ratio (noted above) (Wade 2021).
The Alaska Department of Fish and Game reports that humpback whales occur in Clarence Strait year-round, with numbers peaking in May and June and falling off from July to September (ADF&G 2020). Local anecdotal reports indicate that humpback whales are becoming more common and abundant in Tongass Narrows during August and September, which is consistent with research in Southeast Alaska.
Dahlheim et al. (2009) found significant difference in the mean group size of humpback whales in Southeast Alaska from year to year and also found that the average group size was largest in the fall (September through October). Numbers of humpback whales peak in the summer and fall and are more uniformly distributed throughout the region. Humpback whales were observed in Clarence Strait every year, although less frequently than other areas of Southeast Alaska (Dahlheim et al. 2009).
The average group size during the fall surveys was two whales. During the spring months, humpback whales tend to congregate in areas outside of the Ketchikan area, such as Lynn Canal and Fredrick Sound (Dahlheim et al. 2009). Local reports of humpback whale group size in Tongass Narrows is similar, with the typical size being between one and three whales. Local residents report humpback whales in Tongass Narrows anywhere from once a month to several times weekly. There have also been several instances where whales have been observed more frequently, including a single whale that was observed by a ferry terminal employee every few days for several months (85 FR 673).
The City of Ketchikan Rock Pinnacle project reported one humpback whale sighting of one individual during the project (December 2019 through January 2020) in the Level B behavioral harassment zone1. The sighting was 55 minutes post-blast and not recorded as a take (Sitkiewicz 2020).
Marine mammal monitoring and sighting data in the Tongass Narrows for the Alaska Department of Transportation and Public Facilities (ADOT&PF) Gravina Access project from October 2020 to February 2021 and May 2021 to July 2021 resulted in mean group size of 1.3 with a range of 1 to 4 humpback whales. Sighting at the ADOT&PF Ward Cove project resulted in similar data with a mean group size of 1.7 and range of 1 to 6 humpback whales.
In the Biological Opinion issued for the ADOT&PF ferry terminal project IHA application, NMFS determined that up to two humpback whales may be present twice per week, based on a year-round project and the fluctuating seasonal abundance (NMFS 2019a). Given that the action area for this project encompasses a similar portion of Tongass Narrows and is consistent with local anecdotal and survey observations together with the NMFS determination, this estimate of up to two humpback whales twice
1 The Level B behavioral harassment zone is the area which underwater noise generated from pile installation is greater than the sound thresholds established for marine mammal behavioral disturbance. The different zones of impact for this project are described in Section 6.

4 Affected Species and Status and Distribution Request for Incidental Harassment Authorization
October 2021 4-3
per week is a conservative estimate of humpback whale presence in the action area. Therefore, these estimates of distribution in the action area are used in this application.
4.1.4 Humpback Whale Critical Habitat The final rule to designate critical habitat for the endangered Western North Pacific distinct population segment (DPS), the endangered Central America DPS, and the threatened Mexico DPS of humpback whales was published on April 21, 2021 (86 FR 21082) and was effective on May 21, 2021. The final rule excluded Southeast Alaska Unit 10 which includes the proposed action area.
Therefore, for the purpose of the application, critical habitat for humpback whales is not considered further.
4.2 MINKE WHALE 4.2.1 Status and Management The minke whale is protected under the MMPA but is not listed as a strategic or depleted species. Minke whales are also not listed as threatened or endangered under the ESA. No abundance estimates are available for minke whales (Muto et al. 2019). The minke whale’s population status is considered stable and they are the most abundant rorqual, or “great whale,” in the world (NMFS 2020e).
4.2.2 Distribution Minke whales are widely distributed throughout the northern hemisphere and are found in both the Pacific and Atlantic oceans. Minke whales in Alaska are considered migratory. During summer months these whales are typically found in the sub-Arctic and during winter months found near the equator (NMFS 2020e).
4.2.3 Site-Specific Occurrence There are no known occurrences of minke whales within the action area. Since their ranges extend into the project area and have been observed in southeast Alaska, including in Clarence Strait (Dahlheim et al. 2009), it is possible the species could occur near the project area. During surveys, all but one encounter was with a single whale and, although infrequent, minke whales were observed during each of the seasons surveyed (spring, summer and fall). For the Ketchikan Berth IV project, NMFS estimated that one group of three whales may be present in the Tongass Narrows area once every four months (83 FR 22009). No minke whales where reported during the City of Ketchikan Rock Pinnacle Blasting Project (Sitkiewicz 2020).
4.3 GRAY WHALE 4.3.1 Status and Management The gray whale is protected under the MMPA but is not listed as a strategic or depleted species under the MMPA (Carretta et al. 2019). The gray whale is not listed as threatened or endangered under the ESA. There are two stock of gray whales, Eastern North Pacific (ENP) and the Western North Pacific. The ENP stock gray whale was listed as endangered under the ESA in 1970 (35 FR 18319) and delisted in 1994 due to a successful recovery (59 FR 31094). The ENP stock grey whale is protected under the MMPA but is not listed as a strategic or depleted species (NMFS 2020f). The minimum population estimate for this stock is 25,849, an increase of 21% since 1988 (Carretta et al 2019; NPFMC 2009).
4.3.2 Distribution Gray whales are distributed throughout the North Pacific Ocean and are found primarily in shallow coastal waters (NMFS 2020f; Carretta et al 2019). Gray whales in the ENP stock range from the southern Gulf of California, Mexico to the arctic waters of the Bering and Chukchi seas. Gray whales are generally solitary creatures and travel together alone or in small groups (NMFS 2020f). The gray whale was once abundant throughout the northern hemisphere but was extinct in the Atlantic Ocean by the early 1700s. Today gray whales are only commonly found in the North Pacific with single sightings reported in the Mediterranean Sea and off Namibia.

4 Affected Species and Status and Distribution Request for Incidental Harassment Authorization
October 2021 4-4
Most whales in the eastern population spend the summer and fall months feeding in the Chukchi, Beaufort, and northwestern Bering seas (Carretta et al 2019). A small number of whales spend summer and fall feeding along the Pacific coastline from Kodiak Island, Alaska to northern California.
4.3.3 Site-Specific Occurrence Gray whales are rare in the action area and unlikely to occur in Tongass Narrows. Due to the large Level B Harassment zone and the overlap with the species’ range, presence in the action area cannot be discounted. Therefore, it is possible for gray whales to be present in the Level B Harassment zone during construction. Gray whales were not observed during the Dahlheim et al. (2009) surveys of Alaska’s inland waters with surveys conducted in the spring, summer and fall months. The presence of gray whales in the area is highly seasonal and occasional late fall/early winter sightings are recorded. Gray whales are generally observed in groups of two (84 FR 36891). No gray whales were reported during the City of Ketchikan Rock Pinnacle Blasting Project (Sitkiewicz 2020).
4.4 KILLER WHALE 4.4.1 Status and Management NMFS considers three stocks of killer whales to occur in southeast Alaskan waters, which may occur separately or concurrently within the project area. These stocks are the Eastern North Pacific/Alaska Resident stock (2,347 individuals), Eastern North Pacific/Northern Resident stock (302 individuals), the West Coast Transient stock (349 individuals) (Muto et al. 2021). These stocks represent two of the three ecotypes of killer whales occurring within the North Pacific Ocean, resident (forages on fish) and transient (forages primarily on marine mammals). However, NMFS is evaluating new genetic information that may result in a revision of the stock structure (Muto et al. 2019). The killer whale is protected under the MMPA, but none of these stocks are listed as a strategic or depleted species under the MMPA nor listed as threatened or endangered under the ESA.
The population trend for the Northern Resident stock has shown an average annual increase of 2.2 percent over a 40-year time period ending in 2014; however, growth rates have slowed from 5.1 percent in 2014 to -0.3 percent in 2018 (Muto et al. 2019).
4.4.2 Distribution Killer whales are found in every ocean of the world (NMFS 2020d) and are the most widely distributed marine mammal (Allen and Angliss 2014). Killer whales occur commonly within the waters of the project area and are observed within the project area several times annually. Occurrences could include members of one or more of the following designated stocks occurring in the project area: Eastern North Pacific/Alaska Resident, Eastern North Pacific/Northern Resident, and West Coast Transient.
The Dahlheim et al. surveys observed resident and transient killer whales in all major waterways during all seasons surveyed (spring, summer, and fall) and resident pods were frequently encountered in Clarence Strait. The mean group size observed in these surveys ranged from 16 to 70 whales, with the typical group size between 20 and 40 whales. Group size was not found to differ significantly by year or season.
4.4.3 Site-Specific Occurrence Killer whales have been observed in Tongass Narrows year-round and are most common during the summer Chinook salmon (Oncorhynchus tshawytscha) run (May-July). During the Chinook salmon run, Ketchikan residents have reported pods of 20-30 whales and during the 2016/2017 winter a pod of five whales was observed in Tongass Narrows (84 FR 36891). NMFS estimated killer whale presence within Tongass Narrows at one pod per month (HDR 2019). While killer whales can be common, they are not known to linger in Tongass Narrows or other similar environments. During the City of Ketchikan’s marine mammal monitoring for the Rock Pinnacle Removal project in December 2019 and January 2020, no killer whales were observed. Comparatively, the daily work durations were shorter than anticipated for this project.

4 Affected Species and Status and Distribution Request for Incidental Harassment Authorization
October 2021 4-5
Marine mammal monitoring and sighting data in the Tongass Narrows for the ADOT&PF Gravina Access project from October 2020 to February 2021 and May 2021 to July 2021 resulted in mean group size of 4.7 with a range of 2 to 8 killer whales. Sighting at the ADOT&PF Ward Cove project resulted in similar data with a mean group size of 3.5 and range of 2 to 5 whales.
4.5 PACIFIC WHITE-SIDED DOLPHIN 4.5.1 Status and Management The Pacific white-sided dolphin is protected under the MMPA but is not listed as a strategic or depleted species (Carretta et al. 2019). The most recent minimum population estimate is 26,880 dolphins. This abundance estimate is greater than 8 years old and the minimum population size is considered unknown. No reliable information is available on the population trend of the Pacific white-sided dolphin (Muto et al. 2019).
4.5.2 Distribution There are three stocks of the Pacific white-sided dolphin in U.S. waters. Only the North Pacific stock is found within the action area. The Pacific white-sided dolphin is distributed throughout the temperate north Pacific Ocean, north of Baja California to Alaska’s southern coastline and Aleutian Islands. The North Pacific Stock ranges from Canada into Alaska (Muto et al. 2019).
Pacific white-sided dolphins are generally distributed in deep offshore waters and occur seasonally in some inland waters of Alaska. They also have been observed in Clarence Strait (Jefferson et al. 2015; Dahlheim et al. 2009; 84 FR 36891). Dahlheim et al. (2009) encountered Pacific white-sided dolphin on numerous occasions within Clarence Strait. The average group size varied widely and encounters were infrequent enough to determine the average group size. The majority of the Pacific white-sided dolphins encountered during Dahlheim et al. (2009) surveys were in the southern portion of Southeast Alaska, including in the Clarence Strait area. Numbers were highest in the spring and lowest in the fall. However, no observations (surveys) were conducted during winter months (Dahlheim et al. 2009).
4.5.3 Site-Specific Occurrence There were no sightings of Pacific white-sided dolphins during the City of Ketchikan Rock Pinnacle Blasting Project during monitoring surveys conducted in December 2019 and January 2020 (Sitkiewicz 2020). In the project area, it is estimated that an average group size is approximately 20 dolphins (84 FR 36891).
4.6 HARBOR PORPOISE 4.6.1 Status and Management The Southeast Alaska stock of harbor porpoise is not designated as depleted under the MMPA nor listed as threatened or endangered under the ESA. It is considered Strategic due to human-induced mortality (Muto et al. 2019).
4.6.2 Distribution In the eastern North Pacific Ocean, the harbor porpoise ranges from Point Barrow, along the Alaska coast to Point Conception, California. NMFS currently acknowledges three stocks of harbor porpoise within this range (Muto et al. 2019), with the one encompassing the action area, the Southeast Alaska stock, ranging from Dixon Entrance to Cape Suckling. This stock is estimated to include 1,354 individuals based on 2010-2012 surveys; however, it is important to note that this minimum population estimate is negatively biased (Muto et al. 2019). When corrected for user bias, estimated corrected abundance increased to 11,146 harbor porpoises in the coastal and inside waters of Southeast Alaska (Hobbs and Waite 2010 as cited in Muto et al 2019). The current population trend is unknown. Data analyzed from Dahlheim et al. surveys between 1991 and 2010 suggested a decline of 2 to 4 percent; however, when data from 2011 and 2012 were included in the analysis, the decline was not significant (Muto et al. 2019). As data are now nearly a decade out of date, the current population trajectory is uncertain.

4 Affected Species and Status and Distribution Request for Incidental Harassment Authorization
October 2021 4-6
The harbor porpoise frequents nearshore waters and coastal embayments throughout their range, including bays, harbors, estuaries, and fjords less than 650 feet (198 m) deep (NMFS 2020c).
Dahlheim et al. (2015) reported that the highest densities of harbor porpoise were consistently found in two areas: 1) near Glacier Bay and Icy Strait and 2) around Zamobo Island/Wrangell. It was estimated that the abundance of harbor porpoises was 75 to 88 percent throughout the study area2 in the inland waters of Southeast Alaska.
4.6.3 Site-Specific Occurrence In the Clarence Strait to Ketchikan area the average expected group size of harbor porpoise during the summer ranged from 0 to 1.61 animals and the density ranged from 0 to 0.02 porpoises per kilometer, depending on the survey period (Dahlheim et al. 2009). The Dahlheim et al. (2009) surveys that occurred in the spring, summer and fall months found no evidence of seasonal changes in harbor porpoise abundance.
There are few reports of harbor porpoises within Tongass Narrows and harbor porpoises typically avoid areas with high levels of vessel activity and noise, such as most of the action area. Freitag (2017, as cited in 83 FR 22009) reports that harbor porpoises occur more commonly on the outside of Gravina Island and occasionally transit through Tongass Narrows year-round. During marine mammal monitoring for the Ketchikan Berth IV expansion project, harbor porpoises were observed zero to once per month (Freitag et al. 2017 as cited in 83 FR 22009).
The recent Ketchikan Rock Pinnacle Removal project’s Level B harassment zones encompassed is similar to the Level B harassment zone calculated for this project and estimated that one group of five harbor porpoises may be exposed once every week of the project. The marine mammal monitoring associated with this project did not observe any harbor porpoise during surveys conducted in December 2019 and January 2020 (Sitkiewicz 2020).
Marine mammal monitoring and sighting data in the Tongass Narrows for the ADOT&PF Gravina Access project from October 2020 to February 2021 and May 2021 to July 2021 resulted in no observation of harbor porpoises. Sighting at the ADOT&PF Ward Cove project resulted in observations with a mean group size of 5 and range of 1 to 10 porpoises.
4.7 DALL’S PORPOISE 4.7.1 Status and Management The Dall’s porpoise is not designated as a depleted or strategic species under the MMPA, nor are they listed as threatened or endangered under the ESA. Only one stock of Dall’s porpoise is currently recognized in Alaskan waters, the Alaska stock, with an estimated abundance of 83,400, although this estimate is outdated (Muto et al. 2019). While the Dall’s porpoise is generally considered abundant, there is insufficient data on population trends to determine whether the population is stable, increasing or decreasing (NMFS 2020b).
4.7.2 Distribution Dall’s porpoises are widely distributed in the North Pacific Ocean, usually in deep oceanic waters (>600 ft/183 m), over the continental shelf or along slopes (NMFS 2020c; Muto et al. 2019). They can be found along the west coast of the U.S. ranging from California to the Bering Sea in Alaska (NMFS 2020c).
Dall’s porpoise is typically in waters in excess of 600 feet (183 meters) deep, favoring pelagic and inland waters. Most of the waters in the action area are shallower with the exception of just south of Pennock Island where a small area has depths just over 600 feet (185 meters) and other small areas where depths reach up to 550 feet (170 meters). Dall’s porpoise may also be found in habitats not typically used by this
2 The study area included all major waterways from the Glacier Bay area to lower Clarence Strait. These included Icy Strait, Lynn Canal, Chatham Strait, Stephens Passage, Fredrick Sound and Sumner Straight, all of which were surveyed each year between 1991 and 2007. Many smaller bays, inlets and passages adjacent to the previously listed major waterways were surveyed when time permitted but not every year.

4 Affected Species and Status and Distribution Request for Incidental Harassment Authorization
October 2021 4-7
species including bays, shallow water, and nearshore areas Moran et al. (2018b). This species also has a tendency to bow-ride with vessels and both commercial and recreational vessels are prevalent in the action area.
4.7.3 Site-Specific Occurrence Dall’s porpoises have exhibited strong seasonal patterns with the highest abundance in the spring (April/May), decreasing in the summer (June/July/August) and reaching the lowest in fall (Muto et al. 2019). While Dall’s porpoises are more likely to be present in the action area during the spring, there are reports of sightings in Tongass Narrows during the fall and winter months (84 FR 36891).
During the Dahlheim et al. (2009) surveys, Dall’s porpoises were encountered consistently in Clarence Strait during the spring, summer and fall months, including concentrations of animals in Clarence Strait. Group sizes were generally small, under 5 individuals, with a mean group size of 2.6. However, group size in the Clarence Strait/Tongass Narrows area is reported between 10 and 15 animals (Freitag 2017 as cited in 83 FR 22009, Solstice 2018 as cited in 84 FR 36891).
During the City of Ketchikan’s marine mammal monitoring for the Rock Pinnacle Removal project in January of 2019, no Dall’s porpoises were observed in the maximum extent of the Level B harassment zone 5 kilometers for blasting activities. This zone was smaller than that of the proposed project (Sitkiewicz 2020).
Marine mammal monitoring and sighting data in the Tongass Narrows for the ADOT&PF Gravina Access project from October 2020 to February 2021 and May 2021 to July 2021 resulted in mean group size of 8.6 with a range of 6 to 10 of Dall’s porpoises. Sighting at the ADOT&PF Ward Cove project resulted in a mean group size of 4 and range of 3 to 5 porpoises.
The City of Ketchikan’s Berth IV Expansion Project (Solstice [2020] cited Freitag [2017]) estimates for the project area, as 10 to 15 porpoises (with a maximum of 20) observed 0 to 1 times per month. The action area was similar to that of the proposed project, so it is reasonable to use the same estimates for this project. As a conservative measure, we use the maximum of 20 Dall’s porpoises observed one time per month for this application
4.8 STELLER SEA LION 4.8.1 Status and Management The Steller sea lion was listed as a threatened species under the ESA in 1990 following declines of 63% on certain rookeries since 1985 and declines of 82 percent since 1960 (55 FR 12645). In 1997, two DPSs of Steller sea lion were identified based on differences in genetics, distribution, and population trends (Fritz et al. 2013, 62 FR 24345). These DPSs are the Eastern U.S. DPS (which includes animals east of Cape Suckling, Alaska [144°W]) and the Western U.S. DPS. The Eastern U.S. DPS was recently delisted under the ESA; the Western U.S. DPS remains listed as endangered (62 CFR 30772; Allen and Angliss 2010). The DPSs under ESA are also the MMPA stock delineations.
In 2014, the worldwide population estimate was 142,360-157,498 Steller sea lions (Allen and Angliss 2014). The Eastern DPS (eDPS) was removed from ESA listing in 2013 (78 FR 66140). The eDPS of Steller sea lions is protected under the MMPA but is not a strategic or depleted species.
The Western DPS (wDPS) is listed as endangered under the ESA and is a depleted, strategic stock under the MMPA. The population of the Western U.S. DPS declined about 75 percent between 1976 and 1990. The overall trend for the wDPS in Alaska is an annual increase of 2.05 percent for nonpups and 1.52 percent for pups between 2002 and 2018. It should be noted there were strong regional differences in the population trend. Factors that contributed to the decline of the stock include incidental take in fisheries, illegal and legal shooting, predation or certain diseases, climate change, and contaminants (Muto et al. 2019).

4 Affected Species and Status and Distribution Request for Incidental Harassment Authorization
October 2021 4-8
4.8.2 Distribution Steller sea lions range throughout the North Pacific Ocean from Japan, east to Alaska, and south to central California (Muto et al. 2019). In 2014, the worldwide population estimate was 142,360 to 157,498 Steller sea lions (Allen and Angliss 2014). Most sea lions occupying either rookeries or haulouts, depending on the season. Male sea lions are more likely to disperse beyond their typical habitat, but this primarily occurs after the breeding season (NMFS 2020). Rookeries are used by adult sea lions for pupping, nursing, and mating during the reproductive season (generally from late May to early July). Haulouts are used by all age classes of both genders but are generally not where sea lions reproduce. At sea, they are seen alone or in small groups, but may gather in large "rafts" at the surface near rookeries and haulouts or foraging sites.
Members of this species are not known to migrate, but individuals disperse widely outside of the breeding season (late May to early July). At sea, Steller sea lions commonly occur near the 656-foot (200-meter) depth contour but have been found from nearshore to well beyond the continental shelf (Kajimura and Loughlin, 1988). Sea lions move on- and offshore to pelagic waters for feeding excursions. They are also capable of traveling long distances in a season. Sea lions may make semi-permanent or permanent one-way movements from one site to another (Chumbley et al. 1997; Burkanov and Loughlin 2005).
Eastern DPS The eDPS stock generally occurs east of Cape Suckling (144° W longitude) and is commonly found in the project area waters. They were most recently surveyed in Southeast Alaska in June and July of 2015. The current population estimate is 41,638 individuals. In Southeast Alaska, the estimated total abundance is 28,594 individuals (20,756 nonpups and 7,838 pups). The eDPS has been increasing between 1990 to 2015 with an estimated annual increase of 4.76 percent for pups and 2.84 percent for nonpups (Muto et al. 2019).
Western DPS The wDPS generally occurs west of Cape Suckling with the centers of abundance and distribution located in the Gulf of Alaska and Aleutian Islands. While there is some mixing of the wDPS east of the 144° line, Hastings et al. 2020 considered the Ketchikan area to be outside of the mixing zone; there are no known occurrences of wDPS animals in Tongass Narrows. As such, the wDPS is not considered further in this application.
4.8.3 Site-Specific Occurrence The project location is not located near any designated critical habitat (major rookery or haulout as shown in Figure 5. However, there are other minor haulouts located at Grindall Island, Point Islet and West Rock. Grindall Island is the closest to the project site, located approximately 21 miles (34 km) northwest of the project site. Two winter surveys have been conducted at Grindall Island in 1993 and 1994. In March of 1993, there were 293 animals recorded at the haulout and in December of 1994 there were 211 animals recorded (85 FR 673). During these surveys, no Steller sea lion pups were observed.
While there are no haulouts in close proximity to the project site, Steller sea lions are known to occur intermittently in the action area and are known to transit through Tongass Narrows while foraging (especially during Chinook salmon runs). Steller sea lions in this area congregate near seafood processing facilities and hatcheries in the area, several of which are located in proximity to the project site. Trident Seafoods Corporation operates two processing plants approximately 0.65 miles (1 km) from the site, one to the north and one to the south of the project site. Additionally, the Deer Mountain Hatchery is located just east of the project site and the Whitman Lake Hatchery is located east of the project site just outside of the action area. Both hatcheries are operated by the Alaska Department of Fish and Game (HDR 2019).
The ADOT&PF Tongass Narrows Project (HDR 2019), citing Freitag 2017 in 83 FR 22009, reported average Steller sea lion occurrence in Tongass Narrows as traveling as individuals or in groups of 6-10 from one to two times per week. Steller sea lions are found in Tongass Narrows year-round, and more abundant during the winter months.

4 Affected Species and Status and Distribution Request for Incidental Harassment Authorization
October 2021 4-9
The City of Ketchikan conducted pinnacle rock blasting in December 2019 and January 2020 near vicinity of the proposed project and recorded 11 Steller sea lion sightings of an estimated 12 individuals during 76.2 hours of observation in the 150-meter observation zone (Sitkiewicz 2020).
Marine mammal monitoring and sighting data in the Tongass Narrows for the ADOT&PF Gravina Access project from October 2020 to February 2021 and May 2021 to July 2021 resulted in mean group size of Steller sea lions of 1.2 with a range of 1 to 5. Sighting at the ADOT&PF Ward Cove project resulted in similar data with a mean group size of 1.6 and range of 1 to 6 sea lions.
4.8.4 Steller Sea Lion Critical Habitat NMFS designated critical habitat for Steller sea lions on August 27, 1993 (58 FR 45269). The project is not within designated critical habitat and is over 175 kilometers by air from the closest major haulout or rookery (Forrester Island).
4.9 HARBOR SEAL 4.9.1 Status and Management The harbor seal is protected under the MMPA but is not listed as a strategic or depleted species (Muto et al. 2019). The harbor seal is not listed as threatened or endangered under the ESA.
The total statewide abundance estimate is 205,090 seals based on surveys taken between 1998 and 2011 (Muto et al. 2019). In the northeast Pacific, 12 stocks of harbor seals have been identified by NMFS, ranging from Baja California to the Aleutians and north to Cape Newman and the Pribilof Islands (Allen and Angliss 2014). In Alaska, there are a total of 12 stocks of harbor seals ranging along the coastal waters from the eastern coast of the Aleutian Islands to Cape Muzon in Southeast Alaska (Muto et al. 2019).
Only the Clarence Strait stock is found in the project area waters and the only stock considered in this application. The current population estimate for Clarence Strait stock is 27,659 individuals, and the 8-year trend estimate is +138. The probability of decrease of this stock is 0.413 (Muto et al. 2019).
4.9.2 Distribution Harbor seals are found in coastal and estuarine waters ranging from Baja California to the eastern Aleutian Islands of Alaska. Harbor seals often inhabit nearshore coastal waters and are considered nonmigratory, typically staying within 15 to 31 miles of their home. Harbor seals have been found up to 62 miles (100 kilometers) from the shore (Klinkhart et al. 2008).
Up to 44 percent of harbor seals time is spent hauled out, with hauling out occurring more often during the summer (Pitcher and Calkins 1979; Klinkhart et al. 2008). Harbor seals typically haul out in groups of 30 or less but have been known, rarely, to haul out in numbers of several hundred. Harbor seals use a variety of terrestrial sites to haul out for resting (year-round), pupping (May to July), and molting (August-September) including tidal and intertidal reefs, beaches, sand bars, and glacial/sea ice (Sease 1992; Klinkhart et al. 2008).
4.9.3 Site-Specific Occurrence There are no known harbor seal haulouts within Tongass Narrows, or within the anticipated project specific ensonified area (HDR 2019). Although NOAA 2018 abundance estimates for the unit in which the action area is located states 0 harbor seals, local anecdotal observations and numerous surveys report harbor seals in the area daily (HDR 2019) (Figure 6). The City of Ketchikan conducted pinnacle rock blasting in December 2019 and January 2020 near the vicinity of the proposed project and recorded a total of 21 harbor seal sightings of 24 individuals over 76.2 hours of pre- and post-blast monitoring (Sitkiewicz 2020).
Marine mammal monitoring and sighting data in the Tongass Narrows for the ADOT&PF Gravina Access project from October 2020 to February 2021 and May 2021 to July 2021 resulted in mean group size of 1.3 with a range of 1 to 4 harbor seals. Sighting at the ADOT&PF Ward Cove project resulted in similar data with a mean group size of 1 and range of 1 to 3 seals.

4 Affected Species and Status and Distribution Request for Incidental Harassment Authorization
October 2021 4-10
Harbor seals were observed in groups ranging from one to three animals throughout the 1.12-kilometer observation zone. Groups of one to three harbor seals in the area also have been reported by local residents (85 FR 673). NMFS estimates a maximum group size of three individuals (83 FR 2009).

5 Take Authorization Request Request for Incidental Harassment Authorization
October 2021 5-1
5.0 TAKE AUTHORIZATION REQUESTED The type of incidental taking authorization that is being requested (i.e., takes by harassment only, takes by harassment, injury, and/or death), and the method of incidental taking.
5.1 TAKE AUTHORIZATION REQUEST Under Section 101 (a)(5)(D) of the MMPA, NOAA OMAO requests an incidental take authorization of marine mammals described in this application resulting from the proposed action at the Ketchikan Port Facility in Ketchikan, Alaska.
Under the 1994 amendments to the MMPA, harassment is statutorily defined as any act of pursuit, torment, or annoyance that:
• has the potential to injure a marine mammal or marine mammal stock in the wild (known as Level A harassment); or
• has the potential to disturb a marine mammal or marine mammal stock in the wild by causing disruption of behavioral patterns, including—but not limited to—migration, breathing, nursing, breeding, feeding, or sheltering but does not have the potential to injure a marine mammal or marine mammal stock in the wild (known as Level B harassment).
5.2 METHOD OF INCIDENTAL TAKING This authorization request considers noise from DTH, impact, and vibratory pile removal and placement, as outlined in Section 1, that has the potential to disturb or displace marine mammals or produce a temporary shift in their hearing ability (temporary threshold shift [TTS]) resulting in Level B harassment, as defined above.
The project has the potential to produce a permanent shift in the ability of marine mammals to hear from pile placement resulting in Level A harassment. Level A harassment is only requested where the zones are too large, difficult to safely access, or obscured by structured or land masses to fully monitor; in combination with the cryptic nature of some marine mammal species which are extremely difficult to track.
Vibratory pile drivers will be the primary method of steel pile installation. Vibratory pile drivers also have relatively lower sound levels (less than 180 decibels [dB] referenced to 1 microPascal [dB re 1 µPa] at 10 meters) that are lower than impact pile driving and are not expected to cause injury to marine mammals due to the nature of the sound.
All pile installation will either not start or be halted if marine mammals are observed approaching the Level A injury zone (“shutdown zone”). Level A takes are requested for harbor porpoise, Dall’s porpoise, and harbor seals because of the difficulty in detecting these species, size of the shutdown zone, and potential for visibility issue depending on sea state. Level A harassment will be minimized to the extent practicable, given the methods of installation and measures designed to minimize the possibility of injury to marine mammals.
The Proposed Action is not anticipated to affect the prey base or significantly affect other habitat features of marine mammals that would meet the definition of take. To minimize, to the extent practicable, Level B harassment of ESA-listed humpback whales and non-ESA-listed marine mammals, NOAA OMAO will implement a shutdown of pile driving if marine mammals are seen entering a monitoring zone. This measure is intended to avoid exposure to underwater sound that could result in harassment (more details on the proposed impact reduction and mitigation measures are provided in Section 11).
6 Numbers and Species Exposed Request for Incidental Harassment Authorization
October 2021 6-1
6.0 NUMBERS AND SPECIES EXPOSED By age, sex, and reproductive condition (if possible), the number of marine mammals (by species) that may be taken by each type of taking, and the number of times such takings by each type of taking are likely to occur.
6.1 INTRODUCTION Construction activities could temporarily increase the local underwater and airborne noise environment in the vicinity of the project. Research suggests that increased noise may impact marine mammals in several ways and that these impacts depend on many factors. Noise impacts are discussed in more detail in Section 7. Assessing whether a sound may disturb or injure a marine mammal involves understanding the characteristics of the acoustic source and the potential effects that sound may have on the physiology and behavior of that marine mammal. Although it is known that sound is important for marine mammal communication, navigation, and foraging (National Research Council 2003, 2005), there are many unknowns in assessing impacts, such as the potential interaction of different effects and the significance of responses by marine mammals to sound exposures (Nowacek et al. 2007; Southall et al. 2007). Furthermore, many other factors besides the received level of sound may affect an animal's reaction, such as the animal's physical condition, prior experience with the sound, and proximity to the source of the sound.
In-water construction activities associated with the proposed project include DTH, impact, and vibratory pile removal and placement as described in Section 1.3. Noise-related impacts discussed in this application could result in Level A and Level B exposure of marine mammals as defined under the MMPA. The methods for estimating the number and types of exposures are summarized below.
6.2 DESCRIPTION OF NOISE SOURCES Ambient sound is a composite of sounds from multiple sources, including environmental events, biological sources, and anthropogenic activities. Physical noise sources include waves at the surface, precipitation, earthquakes, ice, and atmospheric noise, among other events. Biological sources include marine mammals, fish, and invertebrates. Anthropogenic sounds are produced by vessels (small and large), dredging, aircraft overflights, construction activities, geophysical explorations, commercial and military sonars, and other marine or coastal human activities. A summary of known noise levels and frequency ranges associated with anthropogenic sources similar to those that would be used for this project is provided in Table 6-1.
Table 6-1: Representative Levels of Underwater Anthropogenic Noise Sources
Noise Source Frequency Range (Hz) Source Level Reference
Dredging 1−500 161–186 dB RMS re: 1 µPa at 1 meter
Richardson et al. 1995; Department for Environment, Food, and Rural Affairs 2003; Reine et al. 2014
Small vessels 860–8,000 141–175 dB RMS re: 1 µPa at 1 meter
Galli et al. 2003; Matzner and Jones 2011; Sebastianutto et al. 2011
Large ship 20−1,000 176–186 dB re: 1 µPa2sec SEL at 1 meter McKenna 2011
Tug docking gravel barge 200–1,000 149 dB at 100 meters Blackwell and Greene 2002
Notes: dB = decibel; Hz = Hertz; RMS = root mean square; sec = second; SEL = sound exposure level, dB re 1 μPa @ 1 m = decibels (dB) referenced to (re) 1 micro (μ) Pascal (Pa) at 1 meter

6 Numbers and Species Exposed Request for Incidental Harassment Authorization
October 2021 6-2
The sounds produced by these activities fall into two sound types: impulsive and nonimpulsive (defined below). Impact pile driving produces impulsive sounds, while vibratory pile driving produces nonimpulsive sounds. The distinction between these two general sound types is important because their potential to cause physical effects differs, particularly with regard to hearing (Ward 1997).
Impulsive sounds (e.g., explosions, seismic air gun pulses, and impact pile driving), which are referred to as pulsed sounds by Southall et al. (2007), are brief, broadband, atonal transients (Harris 1998) and occur either as isolated events or are repeated in some succession (Southall et al. 2007). Impulsive sounds are characterized by a relatively rapid rise from ambient pressure to a maximal pressure value, followed by a decay period that may include a period of diminishing, oscillating maximal and minimal pressures (Southall et al. 2007). Impulsive sounds generally have a greater capacity to induce physical injury compared with sounds that lack these features (Southall et al. 2007).
Nonimpulsive sounds (referred to as nonpulsed in Southall et al. 2007) can be tonal, broadband, or both. They lack the rapid rise time and can have longer durations than impulsive sounds. Nonimpulsive sounds can be either intermittent or continuous. Examples of nonimpulsive sounds include vessels, aircraft, and machinery operations such as drilling, dredging, and vibratory pile driving (Southall et al. 2007). In some environments, the duration of both impulsive and nonimpulsive sounds can be extended due to reverberations.
6.3 VOCALIZATION AND HEARING OF MARINE MAMMALS All marine mammals that have been studied can produce sounds and use sounds to forage, orient, detect, and respond to predators and to facilitate social interactions (Richardson et al. 1995). Measurements of marine mammal sound production and hearing capabilities provide some basis for assessing whether exposure to a particular sound source may affect a marine mammal behaviorally or physiologically. Marine mammal hearing abilities are quantified using live animals either via behavioral audiometry or electrophysiology (Schusterman 1981; Au 1993; Wartzok and Ketten 1999; Nachtigall et al. 2007). Behavioral audiograms, which are plots of an animal’s exhibited hearing threshold versus frequency, are obtained from captive, trained live animals using standard testing procedures with appropriate controls. These audiograms are considered to be a more accurate representation of a subject’s hearing abilities. However, behavioral audiograms of many marine mammal species are difficult to obtain or impossible because many species are too large, too rare, and too difficult to acquire and maintain for experiments in captivity. Consequently, our understanding of a species’ hearing ability may be based on the behavioral audiogram of a single individual or a small group of animals or another species that is considered to be similar in its hearing abilities. In addition, captive animals may be exposed to local ambient sounds and other environmental factors that may impact their hearing abilities and may not accurately reflect the hearing abilities of free-swimming animals.
For animals that are not available in captive or stranded settings (including large whales and rare species), estimates of hearing capabilities are made based on anatomical and physiological structures, the frequency range of the species’ vocalizations, and extrapolations from related species.
Electrophysiological audiometry measures small electrical voltages produced by neural activity when the auditory system is stimulated by sound. The technique is relatively fast, does not require a conscious response, and is routinely used to assess the hearing of newborn humans. It has recently been adapted for use on nonhumans, including marine mammals (Dolphin, 2000). For both methods of evaluating hearing ability, hearing response in relation to frequency is a generalized U-shaped curve or audiogram showing the frequency range of best sensitivity (lowest hearing threshold) and frequencies above and below with higher threshold values.
The NMFS reviewed studies of the hearing sensitivity of marine mammals and developed thresholds for use as guidance when assessing the effects of anthropogenic sound on marine mammals based on measured or estimated hearing ranges (NMFS 2018). The guidance places marine mammals into the following functional hearing groups based on their generalized hearing sensitivities: high-frequency cetaceans, mid-frequency cetaceans, low-frequency cetaceans (mysticetes), phocid pinnipeds (true seals), and otariid pinnipeds (sea lions and fur seals). A summary of the sound production and hearing capabilities of the marine mammal species assessed in this application is provided in Table 6-2.

6 Numbers and Species Exposed Request for Incidental Harassment Authorization
October 2021 6-3
Table 6-2: Hearing and Vocalization Ranges for Marine Mammal Functional Hearing Groups and Species Potentially within the Project Areas
Functional Hearing Group Species Functional Hearing Range1
Low-frequency cetaceans Humpback whale, gray whale, minke whale 7 Hz to 35 kHz
Mid-frequency cetaceans Killer whale, Pacific white-sided dolphin 150 Hz to 160 kHz
High-frequency cetaceans Harbor porpoise, Dall’s porpoise 275 Hz to 160 kHz
Phocidae Harbor seal In-water: 50 Hz to 86 kHz In-air: 75 Hz to 30 kHz
Otariidae Steller sea lion In-water: 60 Hz to 39 kHz In-air: 50 Hz to 75 kHz
Notes: Hz = Hertz; kHz = kilohertz 1In-water hearing data from NMFS, 2018; in-air data from Schusterman 1981; Hemila et al. 2006; Southall et al. 2007.
6.4 SOUND EXPOSURE CRITERIA AND THRESHOLDS Under the MMPA, NMFS has defined levels of harassment for marine mammals. Level A harassment is defined as “Any act of pursuit, torment, or annoyance which has the potential to injure a marine mammal or marine mammal stock in the wild.” Level B harassment is defined as “Any act of pursuit, torment, or annoyance which has the potential to disturb a marine mammal or marine mammal stock in the wild by causing disruption of behavioral patterns, including but not limited to migration, breathing, nursing, breeding, feeding, or sheltering.”
To date, no studies have been conducted that examine impacts to marine mammals from pile-driving sounds from which empirical noise thresholds have been established. Currently, NMFS uses underwater sound exposure thresholds to determine when an activity could result in impacts to a marine mammal defined as Level A (injury) or Level B (disturbance including behavioral and TTS) harassment (NMFS 2005). NMFS (2018) has recently developed acoustic threshold levels for determining the onset of permanent threshold shift (PTS) in marine mammals in response to underwater impulsive and nonimpulsive sound sources. The criteria use cumulative sound exposure level (SEL) metrics (dB SELCUM) and peak pressure (dB PEAK) rather than the previously used dB root mean square (RMS) metric. NMFS equates the onset of PTS, which is a form of auditory injury, with Level A harassment under the MMPA, and with “harm” under the ESA. Level B harassment occurs when marine mammals are exposed to impulsive underwater sounds above 160 dB RMS re 1 μPa, such as from impact pile driving, and to nonimpulsive underwater sounds above 120 dB RMS re 1 μPa, such as from vibratory pile driving (NMFS 2005) (Table 6-3). The onset of TTS is a form of Level B harassment under the MMPA and a form of “harassment” under the ESA. All forms of harassment, either auditory or behavioral, constitute “incidental take” under these statutes.
Table 6-3: Injury and Disturbance Threshold Criteria for Underwater and Airborne Noise
Marine Mammal Functional
Hearing Group
Airborne Noise (impact and vibratory
pile driving) (re 20 μPa)1
Underwater Vibratory Pile-Driving Noise
(nonimpulsive sounds) (re 1 μPa)
Underwater Impact Pile-Driving Noise
(impulsive sounds) (re 1 μPa)
Disturbance Guideline (haulout)2
PTS Onset (Level A)
Threshold
Level B Disturbance Threshold
PTS Onset (Level A)
Threshold3
Level B Disturbance Threshold
Low-Frequency Cetaceans Not applicable 199 dB
SELCUM4 120 dB RMS 219 dB Peak5
183 dB SELCUM4 160 dB RMS
Mid-Frequency Cetaceans Not applicable 198 dB
SELCUM4 120 dB RMS 230 dB Peak5
185 dB SELCUM4 160 dB RMS

6 Numbers and Species Exposed Request for Incidental Harassment Authorization
October 2021 6-4
Table 6-3: Injury and Disturbance Threshold Criteria for Underwater and Airborne Noise
Marine Mammal Functional
Hearing Group
Airborne Noise (impact and vibratory
pile driving) (re 20 μPa)1
Underwater Vibratory Pile-Driving Noise
(nonimpulsive sounds) (re 1 μPa)
Underwater Impact Pile-Driving Noise
(impulsive sounds) (re 1 μPa)
Disturbance Guideline (haulout)2
PTS Onset (Level A)
Threshold
Level B Disturbance Threshold
PTS Onset (Level A)
Threshold3
Level B Disturbance Threshold
High-Frequency Cetaceans Not applicable 173 dB
SELCUM4 120 dB RMS 202 dB Peak5
155 dB SELCUM4 160 dB RMS
Otariidae (fur seals and sea lions)
100 dB RMS (unweighted)
219 dB SELCUM4 120 dB RMS 232 dB Peak5
203 dB SELCUM4 160 dB RMS
Phocidae (true seals)
90 dB RMS (unweighted)
201 dB SELCUM4 120 dB RMS 218 dB Peak5
185 dB SELCUM4 160 dB RMS
Notes: μPa = microPascal; dB = decibel; PTS = permanent threshold shift; RMS = root mean square; SEL = sound exposure level; 1Airborne disturbance thresholds not specific to pile driver type. 2Sound level at which pinniped haulout disturbance has been documented. This is not considered an official threshold, but is used as a guideline. 3Dual metric acoustic thresholds for impulsive sounds. Whichever results in the largest isopleth for calculating PTS onset is used in the analysis. 4Cumulative sound exposure level over 24 hours. 5Flat weighted or unweighted peak sound pressure within the generalized hearing range.
NMFS uses generic sound exposure thresholds to determine when an activity in the ocean that produces an airborne sound might result in impacts to a marine mammal (70 FR 1871). Construction-period airborne noise would have little impact to cetaceans because noise from airborne sources would not transmit as well underwater (Richardson et al. 1995); thus, noise would primarily be a problem for hauled-out pinnipeds near the project locations. NMFS has identified behavioral harassment threshold criteria for airborne noise generated by pile driving for pinnipeds regulated under the MMPA. Level A injury threshold criteria for airborne noise have not been established. The Level B behavioral harassment threshold for harbor seals is 90 dB RMS re 20 μPa (unweighted), and for all other pinnipeds it is 100 dB RMS re 20 μPa (unweighted).
6.5 LIMITATIONS OF EXISTING NOISE CRITERIA The application of the 120 dB RMS re 1 μPa behavioral threshold can sometimes be problematic because this threshold level can be either at or below the ambient noise level of certain locations. The 120 dB RMS re 1 μPa threshold level for nonimpulsive noise originated from research conducted by Malme et al. (1984, 1988) for California gray whale response to continuous industrial sounds, such as drilling operations. The 120 dB re 1 μPa nonimpulsive sound threshold should not be confused with the species-specific 120 dB pulsed sound criterion established for migrating bowhead whales in the Arctic as a result of research in the Beaufort Sea [Richardson et al. 1995; Miller et al. 1999].)
To date, there is no research or data supporting a response by pinnipeds or odontocetes to nonimpulsive sounds from vibratory pile driving as low as the 120 dB RMS re 1 μPa threshold. Southall et al. (2007) reviewed studies conducted to document the behavioral responses of harbor seals and northern elephant seals to nonimpulsive sounds under various conditions. They concluded that those limited studies suggest that exposures between 90 dB and 140 dB RMS re 1 μPa generally do not appear to induce strong behavioral responses.
6.6 AUDITORY MASKING Natural and artificial sounds can disrupt behavior through auditory masking or interference with a marine mammal’s ability to detect and interpret other relevant sounds, such as communication and echolocation

6 Numbers and Species Exposed Request for Incidental Harassment Authorization
October 2021 6-5
signals (Wartzok et al. 2004). Masking occurs when both the signal and masking sound have similar frequencies and either overlap or occur very close to each other in time. A signal is very likely to be masked if the noise is within a certain “critical bandwidth” around the signal’s frequency and its energy level is similar or higher (Holt 2008). Noise within the critical band of a marine mammal signal will show increased interference with detection of the signal as the level of the noise increases (Wartzok et al. 2004). For example, in delphinid subjects, relevant signals needed to be 17 to 20 dB louder than masking noise at frequencies below 1 kHz to be detected and 40 dB greater at approximately 100 kHz (Richardson et al. 1995). Noise at frequencies outside of a signal’s critical bandwidth will have little to no effect on the detection of that signal (Wartzok et al. 2004).
Additional factors influencing masking are the temporal structure of the noise and the behavioral and environmental context in which the signal is produced. Continuous noise is more likely to mask signals than intermittent noise of the same amplitude; quiet “gaps” in the intermittent noise allow detection of signals that would not be heard during continuous noise (Brumm and Slabbekoorn 2005). The behavioral function of a vocalization (e.g., contact call, group cohesion vocalization, echolocation click) and the acoustic environment at the time of signaling may both influence the call source level (Holt et al. 2011), which directly affects the chances that a signal will be masked (Nemeth and Brumm 2010). Miksis-Olds and Tyack (2009) showed that manatees modified vocalizations differently during increased noise, depending on whether or not a calf was present.
Masking noise from anthropogenic sources could cause behavioral changes if the masking disrupts communication, echolocation, or other hearing-dependent behaviors. As noted above, noise frequency and amplitude both contribute to the potential for vocalization masking; noise from pile driving typically covers a frequency range of 10 Hz to 1.5 kHz, which is likely to overlap with the frequencies of vocalizations produced by species that may occur in the project area. Amplitude of noise from both impact and vibratory pile-driving methods is variable and may exceed that of marine mammal vocalizations within an unknown range of each incident pile. Depending on the animal's location and vocalization source level, this range may vary over time.
Based on the frequency overlap between noise produced by both vibratory and impact pile driving (10 Hz to 1.5 kHz), animals that remain in a project area during steel pile driving may be vulnerable to masking for the duration of pile driving (typically 2 hours or less, intermittently over the course of a day depending on site and project). Energy levels of vibratory pile driving are less than half that of impact pile driving; therefore, the potential for masking noise would be limited to a small radius around a pile. The likelihood that vibratory pile driving would mask relevant acoustic signals for marine mammals is negligible. In addition, most marine mammal species that may be subject to masking are transitory within the project areas. The animals most likely to be at risk for vocalization masking are resident pinnipeds (harbor seals and sea lions around local haulout areas). Possible behavioral reactions to vocalization masking include changes to vocal behavior (including cessation of calling), habitat abandonment (short or long term), and modifications to the acoustic structure of vocalizations (which may help signalers compensate for masking) (Brumm and Slabbekoorn 2005; Brumm and Zollinger 2011). Given the relatively high source levels for most marine mammal vocalizations, the Navy has estimated that masking events could occur concurrently within the zones of behavioral harassment estimated for vibratory and impact pile driving (Section 6.7.2) and are therefore taken into account in the exposure analysis.
6.7 MODELING NOISE FROM PILE REMOVAL/PLACEMENT ACTIVITIES An Underwater Noise Technical Memorandum prepared for installation/removal of piles at Ketchikan is provided in Appendix B. This memorandum describes underwater noise fundamentals, applicable noise criteria, protected species, an estimation of pile driving and removal noise, and a discussion on potential effects of proposed in-water construction noise would have on fish and marine mammals. Distances of criteria level exceedance for noise for different types of piles installed by different methods at different depths are provided in the tables in the memorandum.
6.7.1 Underwater Sound Propagation Pile removal and placement activities will generate underwater noise that potentially could result in disturbance to marine mammals in a project area. Transmission loss (TL) underwater is the decrease in
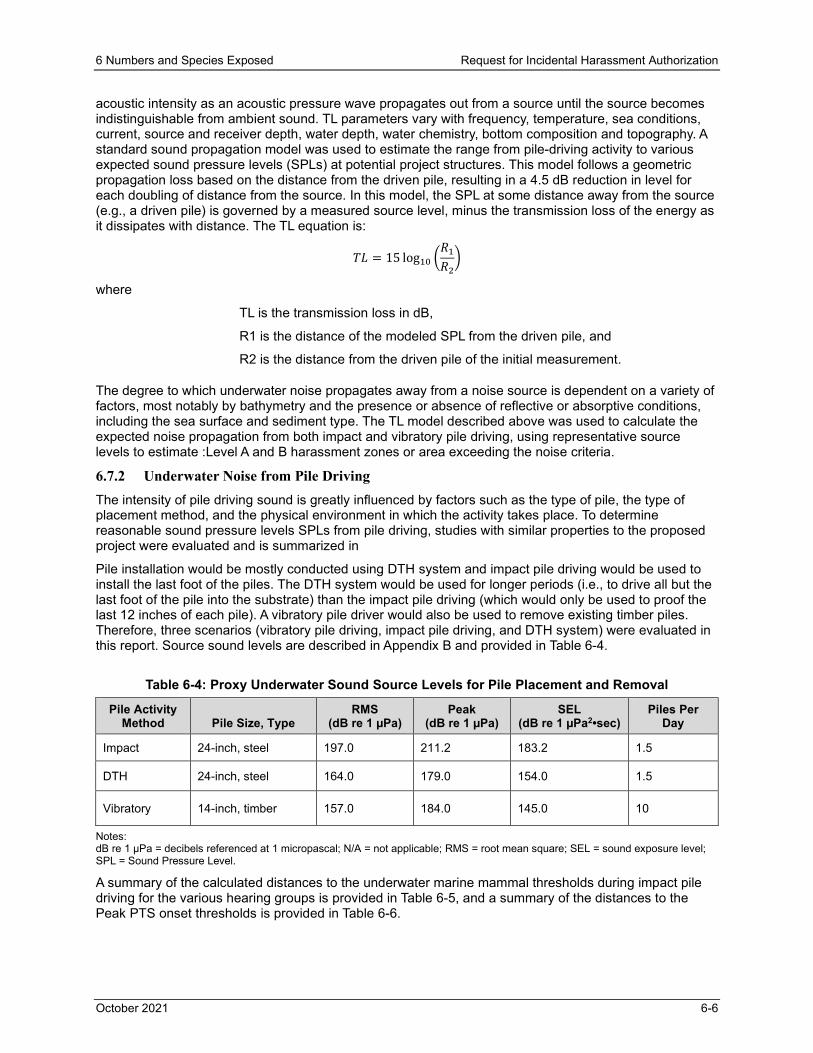
6 Numbers and Species Exposed Request for Incidental Harassment Authorization
October 2021 6-6
acoustic intensity as an acoustic pressure wave propagates out from a source until the source becomes indistinguishable from ambient sound. TL parameters vary with frequency, temperature, sea conditions, current, source and receiver depth, water depth, water chemistry, bottom composition and topography. A standard sound propagation model was used to estimate the range from pile-driving activity to various expected sound pressure levels (SPLs) at potential project structures. This model follows a geometric propagation loss based on the distance from the driven pile, resulting in a 4.5 dB reduction in level for each doubling of distance from the source. In this model, the SPL at some distance away from the source (e.g., a driven pile) is governed by a measured source level, minus the transmission loss of the energy as it dissipates with distance. The TL equation is:
𝑇𝑇𝑇𝑇 = 15 log10 �𝑅𝑅1𝑅𝑅2�
where
TL is the transmission loss in dB,
R1 is the distance of the modeled SPL from the driven pile, and
R2 is the distance from the driven pile of the initial measurement.
The degree to which underwater noise propagates away from a noise source is dependent on a variety of factors, most notably by bathymetry and the presence or absence of reflective or absorptive conditions, including the sea surface and sediment type. The TL model described above was used to calculate the expected noise propagation from both impact and vibratory pile driving, using representative source levels to estimate :Level A and B harassment zones or area exceeding the noise criteria.
6.7.2 Underwater Noise from Pile Driving The intensity of pile driving sound is greatly influenced by factors such as the type of pile, the type of placement method, and the physical environment in which the activity takes place. To determine reasonable sound pressure levels SPLs from pile driving, studies with similar properties to the proposed project were evaluated and is summarized in
Pile installation would be mostly conducted using DTH system and impact pile driving would be used to install the last foot of the piles. The DTH system would be used for longer periods (i.e., to drive all but the last foot of the pile into the substrate) than the impact pile driving (which would only be used to proof the last 12 inches of each pile). A vibratory pile driver would also be used to remove existing timber piles. Therefore, three scenarios (vibratory pile driving, impact pile driving, and DTH system) were evaluated in this report. Source sound levels are described in Appendix B and provided in Table 6-4.
Table 6-4: Proxy Underwater Sound Source Levels for Pile Placement and Removal
Pile Activity Method Pile Size, Type
RMS (dB re 1 µPa)
Peak (dB re 1 µPa)
SEL (dB re 1 µPa2•sec)
Piles Per Day
Impact 24-inch, steel 197.0 211.2 183.2 1.5
DTH 24-inch, steel 164.0 179.0 154.0 1.5
Vibratory 14-inch, timber 157.0 184.0 145.0 10
Notes: dB re 1 µPa = decibels referenced at 1 micropascal; N/A = not applicable; RMS = root mean square; SEL = sound exposure level; SPL = Sound Pressure Level.
A summary of the calculated distances to the underwater marine mammal thresholds during impact pile driving for the various hearing groups is provided in Table 6-5, and a summary of the distances to the Peak PTS onset thresholds is provided in Table 6-6.

6 Numbers and Species Exposed Request for Incidental Harassment Authorization
October 2021 6-7
Vibratory pile-driving sound levels can be 20 to 30 or more decibels lower than impact-driving sound levels and do not produce the high peak amplitudes with fast rise times typical of steel pile driving. Therefore, bubble curtains are not used for vibratory pile driving.
A summary of the calculated distances to the underwater marine mammal thresholds during vibratory driving is provided in Table 6-7. The extent and area of each Level A and Level B harassment zone for a pile representing the worst-case extent of noise propagation (furthest from the shore) is shown in Figure 6-1. Distances to certain thresholds are not depicted in Figure 6-1 if they are smaller than the worst-case scenario.
Table 6-5: Calculated Radial Distances to Underwater Marine Mammal Impact and Down the Hole Rock Socket Driving Noise to Cumulative Sound Exposure Level PTS and Behavioral
Disturbance Thresholds
Pile Size, Type
Pile Placement Method
Distance (m) to Injury (PTS Onset)
Level A Pinnipeds
Distance (m) to Injury (PTS Onset)
Level A Cetaceans
Behavioral Disturbance
Level B
Radial Distance (m) to Threshold PW OW LF MF HF
24-inch, Steel Impact 81 6 151 5 179 2,590A
24-inch, Steel Down-the-hole 70 5 130 5 155 11,659B Notes: PTS= permanent threshold shift; dB RMS= decibel root mean square; PW = phocid pinniped underwater (harbor seal); OW= otariid pinniped underwater (sea lion); LF = low frequency cetacean; MF = mid frequency cetacean; HF = high frequency cetacean; m = meter A = Based on 160 dB RMS; B = Based on 120 dB RMS Calculations for Level A based on SELCUM threshold criteria provided in Table 6-3.
Table 6-6: Calculated Radial Distances to Underwater Marine Mammal Impact– Peak PTS Thresholds
Pile Size, Type
Pile Placement Method
Distance (m) to Injury (PTS Onset)
Level A Pinnipeds
Distance (m) to Injury (PTS Onset)
Level A Cetaceans
Behavioral Disturbance
Level B (160 dB RMS)
Radial Distance (m) to Threshold PW OW LF MF HF
24-inch, Steel Impact 3 N/A 2 N/A 33 2,590
Notes: PTS= permanent threshold shift; dB RMS= decibel root mean square; PW = phocid pinniped underwater (harbor seal); OW= otariid pinniped underwater (sea lion); LF = low frequency cetacean; MF = mid frequency cetacean; HF = high frequency cetacean; m = meter Calculations for Level A based on peak threshold criteria are provided in Table 6-3. Distances to peak PTS thresholds calculated using practical spreading loss model.

6 Numbers and Species Exposed Request for Incidental Harassment Authorization
October 2021 6-8
Table 6-7: Calculated Radial Distances to Underwater Marine Mammal Vibratory Removal Noise Thresholds Within Threshold Distances
Pile Size, Type Pile Placement/
Removal Method
Distance (m) to Injury (PTS Onset)
Level A Pinnipeds
Distance (m) to Injury (PTS Onset)
Level A Cetaceans
Behavioral Disturbance
Level B (120 dB RMS)
Radial Distance (m) to Threshold PW OW LF MF HF
14-inch, Timber Vibratory Removal 1 0 2 0 3 2,929
Notes: PTS= permanent threshold shift; dB RMS= decibel root mean square; PW = phocid pinniped underwater (harbor seal); OW= otariid pinniped underwater (sea lion); LF = low frequency cetacean; MF = mid frequency cetacean; HF = high frequency cetacean; m = meter Calculations for Level A based on SELCUM threshold criteria provided in Table 6-3.
6.7.3 Airborne Sound Propagation Pile driving can generate airborne noise that could potentially result in disturbance to marine mammals (pinnipeds) that are hauled out or at the water’s surface. As a result, the potential for pinnipeds hauled out or swimming at the surface to be exposed to airborne SPLs could result in Level B behavioral harassment. The airborne noise threshold for behavioral harassment for all pinnipeds except harbor seals is 100 dB RMS re 20 µPa (unweighted), and this noise threshold for harbor seals is 90 dB RMS re 20 µPa (unweighted) (see Table 6-3). Construction noise behaves as point-source noise and thus propagates in a spherical manner with a 6 dB decrease in the SPL over water (“hard-site” condition) per doubling of distance (Washington State Department of Transportation, 2018). A spherical spreading loss model, assuming average atmospheric conditions, was used to estimate the distance to the 100 dB and 90 dB RMS re 20 µPa (unweighted) airborne thresholds. The transmission loss equation is:
𝑇𝑇𝑇𝑇 = 20 log10 �𝑅𝑅1𝑅𝑅2�
where
TL is the transmission loss in dB
R1 is the distance of the modeled SPL from the driven pile
R2 is the distance from the driven pile of the initial measurement
The intensity of pile-driving sounds is greatly influenced by factors such as the type of piles, the type of hammers, and the physical environment in which the activity takes place. To determine reasonable airborne source SPLs, source levels were chosen based on a review of available pile driving in situ recordings. The calculations are based on air noise source level of 95 dBA for pile driving, additional detail is provided in the Underwater Noise Technical Memorandum (Appendix B).
The distances to the airborne harassment thresholds were calculated for steel pile impact and vibratory driving with the airborne transmission loss formula. The distances to the pinniped airborne noise thresholds produced by the impact installation are provided in Table 6-8 and shown in Figure 6-2. Because these areas are smaller than the underwater behavioral threshold zones, a separate analysis of Level B take was not conducted for the airborne zones. Animals in the airborne zones would already have been exposed within a Level B underwater zone; therefore, no additional takes due to exposure to airborne noise are requested.

6 Numbers and Species Exposed Request for Incidental Harassment Authorization
October 2021 6-9
Table 6-8: Calculated and Measured Distances to Pinniped Behavioral Airborne Noise Thresholds Impact Pile Driving
Placement/Removal Method Pile Size, Type
Harbor Seal Distance (m) to
Threshold (90 dB RMS)
Steller Sea lion Distance (m) to Threshold
(100 dB RMS) Impact 24-inch, Steel 54 17 Down the Hole 24-inch, Steel 38 12 Vibratory 14-inch, Timber 27 9
Notes: dB RMS = decibel root mean square; m = meters

NOAAKetchikan Homeport Revitalization ProjectINCIDENTAL HARASSMENT AUTHORIZATION
REPRESENTATIVE ZONES OF IMPACT FOR PILE REMOVALAND INSTALLATION UNDERWATER NOISE
Figure 6-1
Imagery: 2015; GeoNorth OIM BDL WMSParcels: Ketchikan Gateway Borough
Pier: PND, Sept 20210 100
Meters
!
!
Project Area
Saxman
Ketchikan
AECOM Anchorage AK 10/22/2021 USER thomas.schultz PATH \\na.aecomnet.com\lfs\AMER\Oakland-USOAK01\DCS\Projects\_ENV\60640505_NOAA_OMAO_Ketch\900_CAD_GIS AECOM\02_Maps\02_Report_Maps\IHA\Figure 6-1 Underwater Noise Zones of Impact.mxd
LegendLevel A Harassment Zones
Phocid (81 meters)Otariid (6 meters)LF Cetaceans (151 meters)MF Cetaceans (5 meters)HF Cetaceans (179 meters)
Level B Harassment ZoneImpact Steel (160 dB RMS) (2,590 meters)Vibratory Timber (120 dB RMS) (2,929 meters)

NOAAKetchikan Homeport Revitalization ProjectINCIDENTAL HARASSMENT AUTHORIZATION
REPRESENTATIVE ZONES OF IMPACT FOR PILE REMOVALAND INSTALLATION AIRBORNE NOISE
Figure 6-2
Imagery: 2015; GeoNorth OIM BDL WMSParcels: Ketchikan Gateway Borough
Pier: PND, Sept 20210 250
Feet
AECOM Anchorage AK 9/7/2021 USER courtney.m.smith PATH C:\Users\courtney.m.smith\Documents\ArcGIS\900_CAD_GIS AECOM\02_Maps\02_Report_Maps\IHA\Figure 6-2 Airborne Noise Zones of Impact.mxd
LegendPinnipeds
Phocid (Impact Driving: 54 meters) Phocid (DTH: 28 meters)Phocid (Vibratory: 27 meters)Otariid (Impact Driving: 17 meters)Otariid DTH: 12 meters)Otariid (Vibratory: 9 meters)
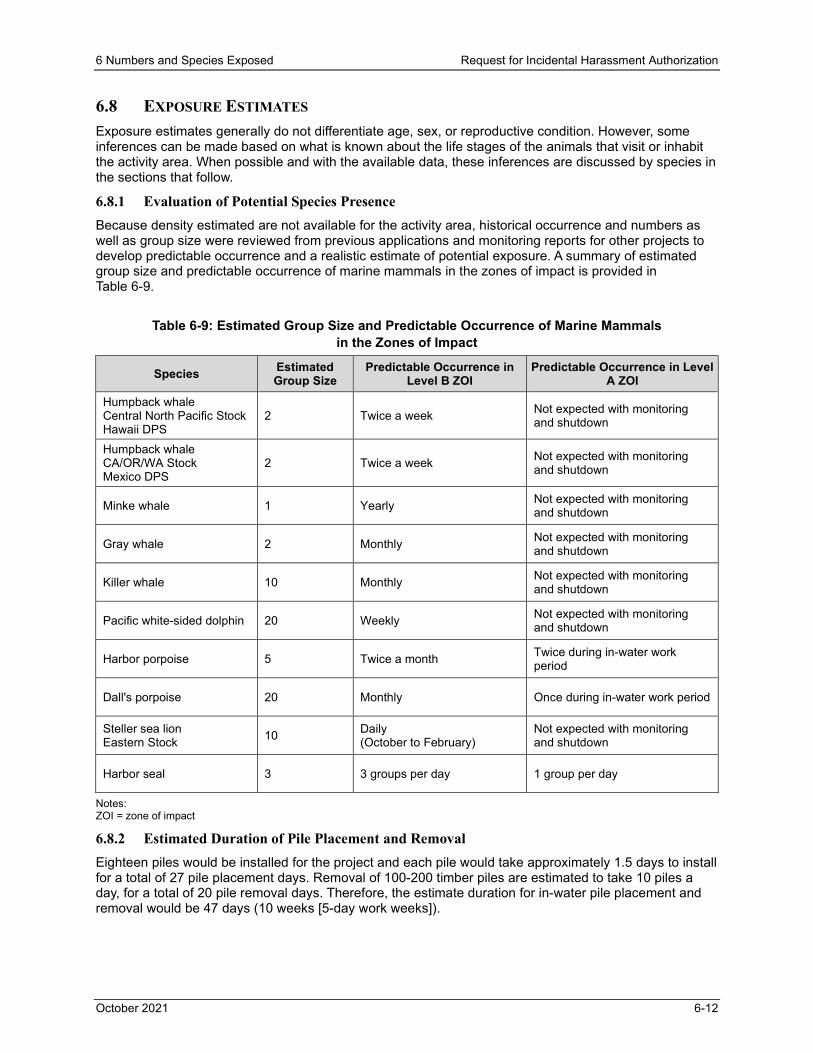
6 Numbers and Species Exposed Request for Incidental Harassment Authorization
October 2021 6-12
6.8 EXPOSURE ESTIMATES Exposure estimates generally do not differentiate age, sex, or reproductive condition. However, some inferences can be made based on what is known about the life stages of the animals that visit or inhabit the activity area. When possible and with the available data, these inferences are discussed by species in the sections that follow.
6.8.1 Evaluation of Potential Species Presence Because density estimated are not available for the activity area, historical occurrence and numbers as well as group size were reviewed from previous applications and monitoring reports for other projects to develop predictable occurrence and a realistic estimate of potential exposure. A summary of estimated group size and predictable occurrence of marine mammals in the zones of impact is provided in Table 6-9.
Table 6-9: Estimated Group Size and Predictable Occurrence of Marine Mammals in the Zones of Impact
Species Estimated Group Size
Predictable Occurrence in Level B ZOI
Predictable Occurrence in Level A ZOI
Humpback whale Central North Pacific Stock Hawaii DPS
2 Twice a week Not expected with monitoring and shutdown
Humpback whale CA/OR/WA Stock Mexico DPS
2 Twice a week Not expected with monitoring and shutdown
Minke whale 1 Yearly Not expected with monitoring and shutdown
Gray whale 2 Monthly Not expected with monitoring and shutdown
Killer whale 10 Monthly Not expected with monitoring and shutdown
Pacific white-sided dolphin 20 Weekly Not expected with monitoring and shutdown
Harbor porpoise 5 Twice a month Twice during in-water work period
Dall's porpoise 20 Monthly Once during in-water work period
Steller sea lion Eastern Stock 10 Daily
(October to February) Not expected with monitoring and shutdown
Harbor seal 3 3 groups per day 1 group per day
Notes: ZOI = zone of impact
6.8.2 Estimated Duration of Pile Placement and Removal Eighteen piles would be installed for the project and each pile would take approximately 1.5 days to install for a total of 27 pile placement days. Removal of 100-200 timber piles are estimated to take 10 piles a day, for a total of 20 pile removal days. Therefore, the estimate duration for in-water pile placement and removal would be 47 days (10 weeks [5-day work weeks]).

6 Numbers and Species Exposed Request for Incidental Harassment Authorization
October 2021 6-13
6.8.3 Number of Marine Mammals that May Be Affected The assumptions of marine mammal presence (potential exposures) in the action area used for the take estimates are provided in Table 6-10. A summary of anticipated underwater exposure estimates for marine mammal species expected to be in the project area is provided in Table 6-11.
Table 6-10: Potential Exposures of Marine Mammals During Project Activities
Species Level B Take Level A Take Humpback whale, Central North Pacific Stock Hawaii DPS
2 whale x (2/week x 10 weeks) = 40 Hawaii DPS (98%) = 39 Not expected with monitoring and shutdown
Humpback whale CA/OR/WA Stock Mexico DPS
2 whale x (2/week x 10 weeks) = 40 Hawaii DPS (2%) = 1 Not expected with monitoring and shutdown
Minke whale 1 whale x 1 year = 1 Not expected with monitoring and shutdown Gray whale 2 whale x 2 months = 4 Not expected with monitoring and shutdown Killer whale 10 whales x 2 months = 20 Not expected with monitoring and shutdown Pacific white-sided dolphin 20 dolphins x 10 weeks = 200 Not expected with monitoring and shutdown Harbor porpoise 5 porpoises x (2 x 2 months) = 20 5 porpoises x 2 = 10 Dall's porpoise 20 porpoises x 2 months = 40 20 porpoises x1 = 20 Steller sea lion Eastern Stock 10 sea lions x 47 days = 470 Not expected with monitoring and shutdown
Harbor seal 9 seals x 47 days = 423 3 seals x 47 days = 141
Table 6-11: Take Request Summary
Species Level B Take Level A Take Stock Abundance Percent of Stock Humpback whale Central North Pacific Stock Hawaii DPS
39 0 10,103 0.39%
Humpback whale CA/OR/WA Stock, Mexico DPS
1 0 2,900 0.03%
Minke whale 1 0 26,880 <0.01% Gray whale 4 0 26,960 0.01% Killer whale 20 0 2,892 0.69% Pacific white-sided dolphin 200 0 Unknown Unknown Harbor porpoise 20 10 1,354 2.22% Dall's porpoise 40 20 83,400 0.07% Steller sea lion Eastern Stock 470 0 43,201 1.08%
Harbor seal 423 141 27,659 2.03% Notes: Bold = ESA-listed species

7 Impacts to Marine Mammals and Stocks Request for Incidental Harassment Authorization
October 2021 7-1
7.0 IMPACTS TO MARINE MAMMALS AND STOCKS The anticipated impact of the activity upon the species or stock of marine mammals.
7.1 POTENTIAL EFFECTS OF PILE REMOVAL AND INSTALLATION ON MARINE MAMMALS
7.1.1 Potential Effects Resulting from Underwater Noise The effects of pile-driving noise on marine mammals depend on several factors, including the species, the size of the animal, and the animal’s proximity to the source; the depth, intensity, and duration of the pile-driving sound; the depth of the water column; the substrate of the habitat; the distance between the pile and the animal; and the sound propagation properties of the environment.
Impacts to marine mammals from pile-driving activities are expected to result primarily from acoustic pathways. As such, the degree of effect is intrinsically related to the received level and duration of the sound exposure, which are in turn influenced by the distance between the animal and the source. In general, sound exposure should be less intense farther away from the source. The substrate and depth of the habitat affect the sound propagation properties of the environment. Shallow environments are typically more structurally complex, which leads to more rapid sound attenuation. In addition, substrates that are soft (i.e., sand) will absorb the sound more readily than hard substrates (rock), which may reflect the acoustic wave. Soft porous substrates will also likely require less time to drive the pile, and possibly less forceful equipment, which would ultimately decrease the intensity of the acoustic source.
Potential impacts to marine species can be caused by physiological responses to both the type and strength of the acoustic signature (Viada et al. 2008). Behavioral impacts may also occur, although the type and severity of these effects are more difficult to define because studies addressing the behavioral effects of impulsive sounds on marine mammals are limited. Potential effects from impulsive sound sources can range from Level B effects, such as brief behavioral disturbance, tactile perception, and physical discomfort, to Level A impacts, which may include slight injury to the internal organs and the auditory system and possible death of the animal (Yelverton et al. 1973; O’Keefe and Young 1984; Ketten 1995; Navy 2001).
7.1.2 Physiological Responses Direct tissue responses to impact/impulsive sound stimulation may range from mechanical vibration or compression with no resulting injury to tissue trauma (injury). Because the ears are the most sensitive organ to pressure, they are the organs most sensitive to injury (Ketten 2000). Sound-related trauma can be lethal or sublethal. Lethal impacts are those that result in immediate death or serious debilitation in or near an intense source and are often related to lung injury (Ketten 1995). Sublethal damage to the ear from a pressure wave can rupture the tympanum, fracture the ossicles, and damage the cochlea and can cause hemorrhage as well as leakage of cerebrospinal fluid into the middle ear (Ketten 2004). Sublethal impacts also include hearing loss, which is caused by exposure to perceptible sounds. Sublethal effects can contribute to reduced fitness which can negatively affect the probability of survival of an individual.
Moderate injury implies partial hearing loss. Permanent hearing loss (also called PTS) can occur when the hair cells of the ear are damaged by a very loud event as well as by prolonged exposure to noise. Instances of TTSs and/or auditory fatigue are well documented in marine mammal literature as being one of the primary avenues of acoustic impact. Temporary loss of hearing sensitivity has been documented in controlled settings using captive marine mammals exposed to strong sound exposure levels at various frequencies (Mooney et al. 2009).
While injuries to other sensitive organs are possible, they are less likely because pile-driving impacts are almost entirely acoustically mediated, unlike explosive sounds, which also include a shock wave that can result in damage. Based on the mitigation measures outlined in Section 11 and the conservative modeling assumptions discussed in Section 6, Level A harassment is not expected to any individuals, except potentially to harbor seals during impact pile driving. Therefore, auditory effects could be experienced by

7 Impacts to Marine Mammals and Stocks Request for Incidental Harassment Authorization
October 2021 7-2
individual harbor seals, but will not cause population-level impacts or affect the continued survival of the species.
7.1.3 Behavioral Responses Behavioral responses to sound can be highly variable. For each potential behavioral change, the magnitude of the change ultimately determines the severity of the response. A number of factors may influence an animal’s response to noise, including its previous experience, its auditory sensitivity, its biological and social status (including age and sex), and its behavioral state and activity at the time of exposure. Habituation occurs when an animal’s response to a stimulus wanes with repeated exposure, usually in the absence of unpleasant associated events (Wartzok et al. 2004). Animals are most likely to habituate to sounds that are predictable and unvarying. The opposite process is sensitization—when an unpleasant experience leads to subsequent responses, often in the form of avoidance, at a lower level of exposure.
Behavioral state or differences in individual tolerance levels may affect the type of response as well. For example, animals that are resting may show greater behavioral change in response to disturbing noise levels than animals that are highly motivated to remain in an area for feeding (Richardson et al. 1995; National Research Council 2003; Wartzok et al. 2004; Southall et al. 2007). Indicators of disturbance may include sudden changes in the animal’s behavior or avoidance of the affected area. A marine mammal may show signs that it is startled by the noise and/or it may swim away from the sound source and avoid the area. Increased swimming speed, increased surfacing time, and cessation of foraging in the affected area would indicate disturbance or discomfort. Pinnipeds may increase their haulout time, possibly to avoid in-water disturbance.
Marine mammals encountering pile-driving operations over a project’s construction time frame would likely avoid affected areas in which they experience noise-related discomfort, limiting their ability to forage or rest there. As described in the section above, individual responses to pile-driving noise are expected to vary. Some individuals may occupy a project area during pile driving without apparent discomfort, but others may be displaced with undetermined effects. Avoidance of the affected area during pile-driving operations would reduce the likelihood of injury impacts. Noise-related disturbance may also inhibit some marine mammals from transiting the area. There is a potential for displacement of marine mammals from affected areas due to these behavioral disturbances during the in-water construction season. However, in some areas, habituation may occur, resulting in a decrease in the severity of the response. Since pile driving will only occur during daylight hours, marine mammals transiting a project area or foraging or resting in a project area at night will not be affected. Effects of pile-driving activities will be experienced by individual marine mammals but will not cause population-level impacts or affect the continued survival of the species.
7.1.4 Potential Effects Resulting from Airborne Noise Marine mammals that occur in the project area could be exposed to airborne sounds associated with pile driving that have the potential to cause behavioral harassment, depending on their distance from pile-driving activities. Airborne pile-driving noises are expected to have very little impact on cetaceans because noise from atmospheric sources does not transmit well through the air-water interface (Richardson et al. 1995). Consequently, cetaceans are not expected to be exposed to airborne sounds that will result in harassment as defined under the MMPA.
Airborne noise will primarily be an issue for pinnipeds that are swimming or hauled out within the range of impact as defined by the acoustic criteria discussed in Section 6. Airborne sound is most likely to cause behavioral responses similar to those discussed above in relation to underwater noise. For instance, anthropogenic sound could cause hauled-out pinnipeds to exhibit changes in their normal behavior, such as a reduction in vocalizations, or could cause them to temporarily abandon their usual or preferred locations and move farther from the noise source. Pinnipeds swimming in the vicinity of pile driving may avoid or withdraw from the area, or they may show increased alertness or alarm (e.g., heading out of the water and looking around). However, studies of ringed seals by Blackwell et al. (2004) and Moulton et al. (2005) indicate a tolerance or lack of response to unweighted airborne sounds as high as 112 peak dB and 96 dB RMS, which suggests that habituation occurred.

7 Impacts to Marine Mammals and Stocks Request for Incidental Harassment Authorization
October 2021 7-3
Marine mammals in the impact zones may exhibit temporary behavioral reactions to airborne pile-driving noise. However, these exposures may have a temporary effect on individual animals or groups of animals, but this level of exposure is very unlikely to result in population-level impacts.
7.2 VESSEL INTERACTIONS Close proximity to vessels has been observed to disrupt feeding aggregations of humpbacks and separation of mothers and calves, as well as dispersal of the fish schools targeting by the whales (Krieger and Wing 1986). In addition to acoustic impacts, vessel traffic also poses a direct threat to humpbacks through ship-strike injury and mortality (Muto et al. 2019). Vulnerability to ship-strike may be higher in areas where humpbacks rest, as they spend three times as much time at the surface when resting than when traveling fast. Vessel strikes are not a major source of mortality for other marine mammals listed in this application, with the exception of resident killer whales observed following fishing vessels to consume the processing waste that is discharged, often close to ship propellers where whales may feed on the processing waste (Muto et al. 2019).
Sea Grant research indicates that humpback whales may increase energy expenditures when vessels are nearby. Observations included changes in direction, higher swim speeds, a decrease of time in-between breaths at the surface as the number of vessels increased (Schuler and Pearson 2019; Teerlink 2017). These effects may result in changes in habitat use and distribution (Schuler and Pearson 2019). Teerlink (2017) measured concentrations of steroid hormones, including cortisol, from biopsy samples in whales in the Juneau area that area subjected to large amounts of vessel traffic and compared the results to whales in other areas with less vessel traffic. No physiological evidence of increased stress response was found in whales in the Juneau area indicating humpback whales in the Juneau area likely are habituated to vessel traffic (Teerlink 2017).
Steller sea lions and harbor seals may be disturbed by approaching vessels when on haulout sites which can lead to stampedes as individuals flee towards the water. There are no documented Steller sea lion or harbor seal haulouts or rookeries in the project area. The nearest sea lion haulout is approximately 20 miles northwest of the project area (Geoengineers 2018).
The project area is expected to experience an increase in the amount of vessel traffic within marine mammal habitat based on a projected increase in tourism of the area; however, due to the substantial amount of existing vessel traffic in the area coupled with the continued use of the habitat by marine mammals, the effects on marine mammals from project vessel noise are expected to be minor and negligible. In addition, 33 CFR 162.240, Tongass Narrows, Ketchikan, Alaska; navigation, establishes a maximum speed limit of 7 knots for vessels of over 23 feet in length in Tongass Narrows, bounded on the north by Buoy ‘9’ and to the south by the East and West Channel Regulatory markers, respectively.
7.3 WATER QUALITY Due to the localized and temporary nature of increased turbidity discussed in Section 10.2, effects to marine mammals in this application and their prey species would be short term and negligible. Implementation of the shutdown zones discussed in Section 11 will reduce the potential of effects of water quality changes on marine mammals. Displacement or disaggregation of prey species would be temporary and result in prey species avoiding the area temporarily. Consequently, there are no permanent effects on marine mammal populations anticipated due to water quality.
7.4 PREY AVAILABILITY The action area provides habitat for the marine mammal species that supports foraging, migration, refuge and reproductive activities. Because the proposed piles will be installed on or adjacent to existing structures, in waters with significant marine debris and in an industrial area, no long-term effects to EFH are anticipated. Effects due to underwater sound or turbidity would be limited to temporary displacement or disaggregation of prey species. These effects would be short in duration with prey species returning to the project area upon completion of the project.

7 Impacts to Marine Mammals and Stocks Request for Incidental Harassment Authorization
October 2021 7-4
7.5 CONCLUSIONS REGARDING IMPACTS TO SPECIES OR STOCKS Individual marine mammals may be exposed to SPLs during pile driving, which may result in Level B behavioral harassment and, for harbor porpoise, Dall’s porpoise, and harbor seals, some Level A harassment.
Any marine mammals that are exposed (harassed) may change their normal behavior patterns (e.g., swimming speed, foraging habits) or be temporarily displaced from the area of construction. Any exposures to Level B harassment will likely have only a minor effect on individuals and no effect on the population. Exposure to Level A harassment during steel impact driving could result in a permanent change in hearing thresholds. To avoid permanent impacts to marine mammal hearing, a shutdown zone will be implemented that will encompass as much of the Level A zone as practicable. The sound generated from vibratory pile driving will not result in injury to marine mammals because the areas where injury could potentially occur are small and will be fully monitored, and pile driving will be shut down if marine mammals are approaching these zones.
Mitigation is expected to avoid most potential adverse underwater impacts to marine mammals from impact pile driving. Nevertheless, some exposure is unavoidable. The expected level of unavoidable exposure (defined as acoustic harassment) is provided in Section 6. This level of effect is not anticipated to have any adverse impact to harbor porpoise, Dall’s porpoise, or harbor seal population recruitment, survival, or recovery.

8 Impacts to Subsistence Request for Incidental Harassment Authorization
October 2021 8-1
8.0 IMPACTS TO SUBSISTENCE The anticipated impact of the activity on the availability of the species or stock of marine mammals for subsistence uses.
Alaska Natives have traditionally harvested subsistence resources in Southeast Alaska for many hundreds of years, particularly large terrestrial mammals, marine mammals, salmon, and other fish (ADF&G 1997). Harbor seals are the marine mammal species most regularly harvested for subsistence by households in Ketchikan and Saxman. Eighty harbor seals were harvested by Ketchikan residents in 2007, which ranked fourth among all communities in Alaska that year for harvest of harbor seals. Thirteen harbor seals were harvested by Saxman residents in 2007. Hunting usually occurs in October and November (ADF&G 2009). In 2008, two Steller sea lions were harvested by Ketchikan-based subsistence hunters, but this is the only record of sea lion harvest by residents of either Ketchikan or Saxman. The Alaska Department of Fish and Game has not recorded harvest of cetaceans from either community (ADF&G 2018).
Approximately 17 percent of Ketchikan residents and 51 percent of Saxman residents identify as Alaska Native. There are approximately 10 households in Ketchikan that subsistence hunt, while there are approximately 110 such households in Saxman. Based on data from 1999, marine mammals account for approximately 5.1 percent (6,978 pounds) of all subsistence harvest in Saxman (ADF&G 2018).
All project activities will take place within the industrial area of Tongass Narrows immediately adjacent to Ketchikan where subsistence activities do not generally occur. The project will not have an adverse impact on the availability of marine mammals for subsistence use at locations farther away. Some minor, short-term disturbance of the harbor seals could occur, but this is not likely to have any measurable effect on subsistence harvest activities in the region. No changes to availability of subsistence resources will result from project activities.
In accordance with the Alaska Native Claims Settlement Act (43 U.S.C. 1602), NOAA reached out to all potentially interested Indian Tribes (which include native villages, regional corporations, or village corporations) regarding the proposed project. The outreach, consistent with the National Environmental Policy Act (NEPA) and Section 106 National Historic Preservation Act, included letters and invitations for Indian Tribes to participate in an online meeting for the purposes of information exchange. The online open house was held on April 16, 2021. No comments were received. A list of invited parties is provided in Appendix E.
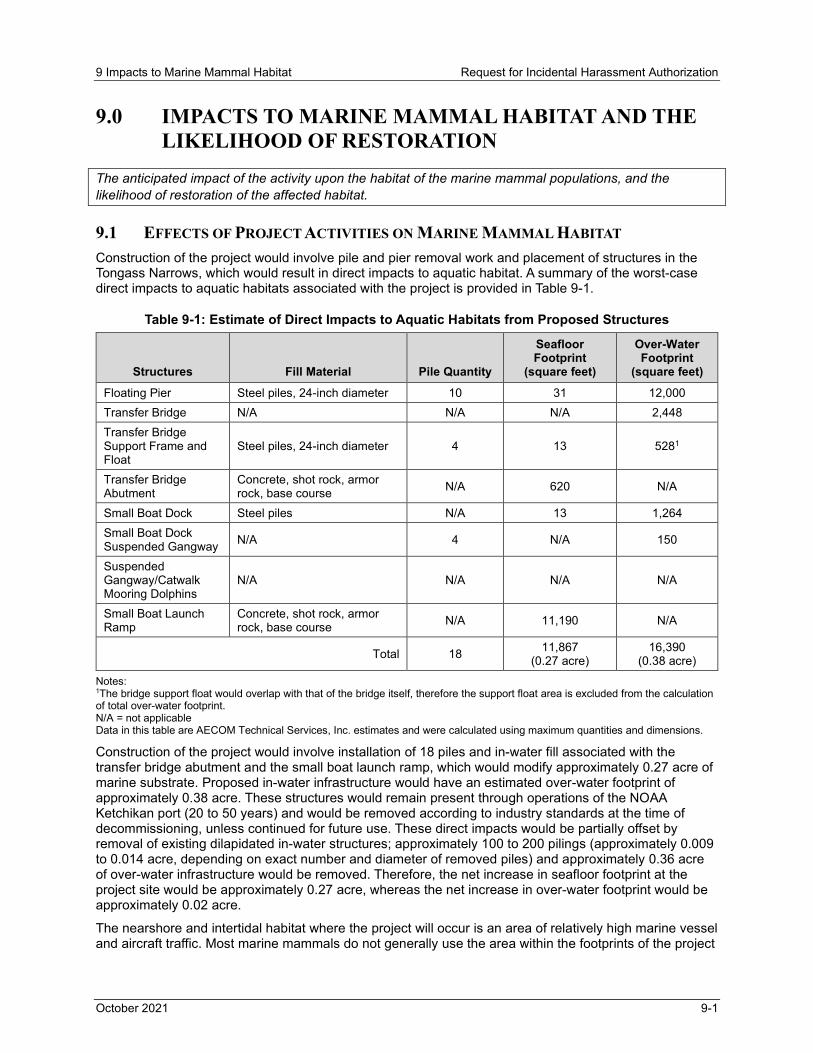
9 Impacts to Marine Mammal Habitat Request for Incidental Harassment Authorization
October 2021 9-1
9.0 IMPACTS TO MARINE MAMMAL HABITAT AND THE LIKELIHOOD OF RESTORATION
The anticipated impact of the activity upon the habitat of the marine mammal populations, and the likelihood of restoration of the affected habitat.
9.1 EFFECTS OF PROJECT ACTIVITIES ON MARINE MAMMAL HABITAT Construction of the project would involve pile and pier removal work and placement of structures in the Tongass Narrows, which would result in direct impacts to aquatic habitat. A summary of the worst-case direct impacts to aquatic habitats associated with the project is provided in Table 9-1.
Table 9-1: Estimate of Direct Impacts to Aquatic Habitats from Proposed Structures
Structures Fill Material Pile Quantity
Seafloor Footprint
(square feet)
Over-Water Footprint
(square feet) Floating Pier Steel piles, 24-inch diameter 10 31 12,000 Transfer Bridge N/A N/A N/A 2,448 Transfer Bridge Support Frame and Float
Steel piles, 24-inch diameter 4 13 5281
Transfer Bridge Abutment
Concrete, shot rock, armor rock, base course N/A 620 N/A
Small Boat Dock Steel piles N/A 13 1,264 Small Boat Dock Suspended Gangway N/A 4 N/A 150
Suspended Gangway/Catwalk Mooring Dolphins
N/A N/A N/A N/A
Small Boat Launch Ramp
Concrete, shot rock, armor rock, base course N/A 11,190 N/A
Total 18 11,867 (0.27 acre)
16,390 (0.38 acre)
Notes: 1The bridge support float would overlap with that of the bridge itself, therefore the support float area is excluded from the calculation of total over-water footprint. N/A = not applicable Data in this table are AECOM Technical Services, Inc. estimates and were calculated using maximum quantities and dimensions.
Construction of the project would involve installation of 18 piles and in-water fill associated with the transfer bridge abutment and the small boat launch ramp, which would modify approximately 0.27 acre of marine substrate. Proposed in-water infrastructure would have an estimated over-water footprint of approximately 0.38 acre. These structures would remain present through operations of the NOAA Ketchikan port (20 to 50 years) and would be removed according to industry standards at the time of decommissioning, unless continued for future use. These direct impacts would be partially offset by removal of existing dilapidated in-water structures; approximately 100 to 200 pilings (approximately 0.009 to 0.014 acre, depending on exact number and diameter of removed piles) and approximately 0.36 acre of over-water infrastructure would be removed. Therefore, the net increase in seafloor footprint at the project site would be approximately 0.27 acre, whereas the net increase in over-water footprint would be approximately 0.02 acre.
The nearshore and intertidal habitat where the project will occur is an area of relatively high marine vessel and aircraft traffic. Most marine mammals do not generally use the area within the footprints of the project

9 Impacts to Marine Mammal Habitat Request for Incidental Harassment Authorization
October 2021 9-2
components. Temporary, intermittent, and short-term habitat alteration may result from increased noise levels within the Level B harassment zones.
Although Southeast Alaska in its entirety is listed as a biologically important area for humpback whales, the project area does not contain particularly high value habitat and is not unusually important for the species. Furthermore, mitigation measures (Section 11), such as marine mammal monitoring, would limit the number of humpback whales exposed to underwater noise as a result of the project. Avoidance of the project area by humpback whales is possible, but would be temporary and intermittent in duration.
9.2 EFFECTS OF PROJECT ACTIVITIES ON MARINE MAMMAL PREY HABITAT EFH has been designated within the project area for all five species of salmon (i.e., chum salmon, pink salmon, coho salmon, sockeye salmon, and Chinook salmon; NMFS 2017), which are common prey of marine mammals. An EFH assessment is provided in Appendix D. Fish populations in the project area that serve as marine mammal prey could be temporarily affected by noise from in-water pile installation. The frequency range in which fish generally perceive underwater sounds is 50 to 2,000 Hz, with peak sensitivities below 800 Hz (Popper and Hastings 2009). Fish behavior or distribution may change, especially with strong and/or intermittent sounds that could potentially harm fish. High underwater SPLs have been documented to alter behavior; cause hearing loss; and injure or kill individual fish by causing serious internal injury (Hastings and Popper 2005).
Drilling of rock sockets and pile installation and removal may result in a small increase in sedimentation within a few feet of the piles. In general, turbidity associated with pile installation is expected to be localized to about a 25-foot radius around the pile (Everitt et al. 1980). A small amount of sediment and drill tailings may be deposited in proximity to each pile. Minor and temporary increases in turbidity may result from this process, but the effects on fish and marine mammal prey would be negligible. Indirect effects to prey would be insignificant and discountable due to the temporary nature of the activity and are expected to be undetectable to marine mammals.
In general, impacts on marine mammal prey species are expected to be minor and temporary. Additional overwater structures and shading have the potential to impact marine mammal prey. The area likely impacted by the project is relatively small compared to the available habitat in Tongass Narrows and throughout Southeast Alaska. The most likely impact to fish from the project would be temporary behavioral avoidance of the immediate area, although any behavioral avoidance of the disturbed area would still leave significantly large areas of fish and marine mammal foraging habitat. Therefore, the impact on marine mammal prey during the project is expected to be minor.

10 Impacts to Marine Mammals from Modification of Habitat Request for Incidental Harassment Authorization
October 2021 10-1
10.0 IMPACTS TO MARINE MAMMALS FROM LOSS OR MODIFICATION OF HABITAT
The anticipated impact of the loss or modification of the habitat on the marine mammal population involved.
The potential impacts of the project on marine mammal habitat are discussed in Section 9. Anticipated impact of the loss or modification of habitat on marine mammal populations presented in this application are negligible and discountable due to the temporary nature of the proposed construction activities. The permanent net loss of habitat would occur in an area where most marine mammals do not generally use because of high marine vessel traffic and limited foraging opportunities.
Potential displacement of marine mammals by noise would not be permanent and would not have long-term effects. The project is not expected to have any habitat-related effects that could cause significant or long-term consequences for individual marine mammals or their populations, because pile installation/removal and other noise sources will be temporary and intermittent.

11 Mitigation Measures Request for Incidental Harassment Authorization
October 2021 11-1
11.0 MITIGATION MEASURES The availability and feasibility (economic and technological) of equipment, methods, and manner of conducting such activity or other means of effecting the least practicable adverse impact upon the affected species or stocks, their habitat, and on their availability for subsistence uses, paying particular attention to rookeries, mating grounds, and areas of similar significance.
11.1 GENERAL CONSTRUCTION ACTIVITIES The proposed project avoids impacts as much as practicable. Tongass Narrows is an active marine environment, with high levels of vessel traffic (Section 2.5.1), particularly during summer months. There is an elevated level of ambient noise within the area compared to natural conditions. The mitigation measures and best management practices that will be implemented are designed to reduce the project’s impacts within the action area.
The following measures and best management practices will be incorporated by the applicant in order to minimize potential impacts:
• Improvement structures are designed to provide barrier-free migration and vertical movement for marine and estuarine fish. The improvements will be maintained in a manner that does not introduce any pollutants or debris into the water or cause a migration barrier for fish, such that prey continues to be available to marine mammals in the area.
• The improvement structures are designed to limit contaminant releases and will be maintained in a manner that manages pollutants and debris streams to avoid incidental introduction of deleterious materials into Tongass Narrows.
• Fuels, lubricants, chemicals and other hazardous substances will be stored above the high tide line to prevent spills.
• Oil booms will be readily available for containment should any releases occur. • To prevent spills or leakage of hazardous material during construction, standard spill-prevention
measures will be implemented during construction. The contractor will provide and maintain a spill clean-up kit on-site at all times.
• The contractor will monitor equipment and gear storage areas for drips or leaks regularly, including inspection of fuel hoses, oil drums, oil or fuel transfer valves and fittings, and fuel storage that occurs at the project site. Equipment will be maintained and stored properly to prevent spills.
• If contaminated or hazardous materials are encountered during construction, all work in the vicinity of the contaminated site will be stopped until a corrective action plan is devised and implemented to minimize impacts on surface waters and organisms in the project area.
11.2 PILE REMOVAL AND INSTALLATION ACTIVITIES A Marine Mammal Monitoring and Mitigation Plan will be implemented for all pile installation activities. To ensure consistency under NEPA, ESA, and MMPA, the Marine Mammal Monitoring and Mitigation Plan will be drafted once mitigation measures and environmental commitments under NEPA, ESA, and MMPA are decided. The Marine Mammal Monitoring and Mitigation Plan includes protected species observers (PSOs) that will be positioned at the practical and optimal vantage points to detect marine mammals entering monitoring and shutdown zones.
The plan will also provide the qualifications and training required for the PSOs; the required equipment, including guidance and reference materials; and required data collection protocols to ensure that clear and concise data records are kept and that data interpretation, post-season data QA/QC, analyses, and reporting are accurate.
Two zones are proposed for all marine mammals: a monitoring zone and shutdown zone. The monitoring zone would be set at 3 kilometers from the project area (Figure 11-1). This 3-kilometer zone is based on Level B harassment zones during impact driving (2.6 kilometers) and vibratory removal of piles

11 Mitigation Measures Request for Incidental Harassment Authorization
October 2021 11-2
(2.9 kilometers). The shutdown zone would be set at 180 meters from the project area. The 180-meter zone protects all marine mammal function hearing groups from Level A harassment and is protective of non-auditory injury and mortality. The Level B harassment zone for DTH placement extends to 12 kilometers which is an area that is difficult to monitor given the characteristics of the Tongass Narrows (see Figure 2-1).
The daily construction window for pile driving will begin no sooner than 30 minutes after sunrise to allow for 30 minute pre-activity monitoring and work may not begin without sufficient daylight or weather conditions to conduct pre-activity monitoring. When construction ceases at least 30 minutes prior to sunset, post-activity monitoring will be conducted for 30 minutes. In the case of work extending into the night hours (as described in Section 2.1), post-activity monitoring will not be conducted.
In case of fog or reduced visibility, observers must be able to observe the entire shutdown zones before permitted activities can be initiated; work may continue if shutdown zones are visible. Takes will be extrapolated, in these cases, based on the amount of the Level B harassment zone visible. Where weather conditions limit the visibility of the zone after work has commenced and where Level B zones are too large to be fully observed, takes will be extrapolated based on the percentage of the Level B harassment zone that is visible and the number/species observed. Percentages visible for each day will be determined and documented by the monitoring team using maps and land features visible during monitoring efforts.
All efforts will be made to avoid Level A takes of any marine mammals.
For marine mammals for which no Level B takes are requested or permitted, all in water pile driving activities will shut down immediately until the animals leave the Level B harassment zone of their own volition.
11.2.1 Pile Installation Methods
To minimize impacts to marine mammals and their prey vibratory installation and/or hammering will be used as the primary methods of pile installation. Impact driving or DTH will be minimized and used only as needed to seat the pile in its final position or to penetrate material that is too dense for a vibratory hammer. Use of bubble curtains are not proposed as mitigation because the large calculated exclusion zones are truncated by land masses.
11.2.2 Soft Start Procedures
To allow marine mammals to leave the area prior to exposure to maximum noise levels, soft start procedures will be used prior to impact pile driving/hammering each day and when work ceases for more than 30 minutes. No soft start is proposed for vibratory pile driving or DTH.
For impact hammers, the soft start procedure includes initiating approximately three strikes at a reduced energy level, followed by a 30-second waiting period. This procedure will be repeated two additional times before beginning in-water pile driving/hammering operations.
11.2.3 Vessel Interactions
In order to minimize impacts from vessel interactions with marine mammals, the crew aboard project vessels will follow NMFS’s marine mammal viewing guidelines and regulations as practicable (NOAA 2020b).In additional speed reduction to a minimum possible if within 10 meters of a marine mammal.
11.2.4 In-Water or Over-Water Construction Activities
During in-water or over-water construction activities, a shutdown zone of 10 meters will be implemented for all marine mammals to prevent physical injury interaction with construction equipment. If any marine mammal is observed in this zone, shutdown will be implemented immediately until the animal has left of its own volition and/or vessel speeds reduced to the minimum level required to maintain steerage and safe working conditions.

11 Mitigation Measures Request for Incidental Harassment Authorization
October 2021 11-3
11.2.5 Compensatory Habitat Mitigation NOAA has requested a permit for the proposed project under Section 404 of the Clean Water Act and Section 10 of the Rivers and Harbors Act from the U. S. Army Corps of Engineers. To receive that permit, NOAA will be required to avoid, minimize, and mitigate impacts to intertidal habitat. For impacts that cannot be avoided or minimized, NOAA will coordinate compensatory mitigation with U. S. Army Corps of Engineers.

#0
Monitoring ZoneMonitoring Zone
Monitoring Zone
011541000100
U S COAST GUARD
COM 17TH CG
NOAAKetchikan Homeport Revitalization ProjectINCIDENTAL HARASSMENT AUTHORIZATION
PROPOSED MONITORINGAND SHUTDOWN ZONES
Figure 11-1
Imagery: 2015; GeoNorth OIM BDL WMSParcels: Ketchikan Gateway Borough
Pier: PND, Sept 20210 100
Meters
!
!
#0
#0
#0
Project Area
Saxman
Ketchikan
AECOM Anchorage AK 10/22/2021 USER thomas.schultz PATH L:\AMER\Oakland-USOAK01\DCS\Projects\_ENV\60640505_NOAA_OMAO_Ketch\900_CAD_GIS AECOM\02_Maps\02_Report_Maps\IHA\Figure 11-1 Proposed Monitoring and Shutdown Zones.mxd
Legend#0 Protected Species Observer (PSO) Proposed Locations
Shutdown Zone (180 meters)Monitoring Zone (3,000 meters)

12 Effects on Arctic Subsistence Hunting and Plan of Cooperation Request for Incidental Harassment Authorization
October 2021 12-1
12.0 EFFECTS ON ARCTIC SUBSISTENCE HUNTING AND PLAN OF COOPERATION
Where the proposed activity would take place in or near a traditional Arctic subsistence hunting area and/or may affect the availability of a species or stock of marine mammal for Arctic subsistence uses, the applicant must submit either a plan of cooperation or information that identifies what measures have been taken and/or will be taken to minimize any adverse effects on the availability of marine mammals for subsistence uses. A plan must include the following:
(i) A statement that the applicant has notified and provided the affected subsistence community with a draft plan of cooperation
(ii) A schedule for meeting with the affected subsistence communities to discuss proposed activities and to resolve potential conflicts regarding any aspects of either the operation or the plan of cooperation
(iii) A description of what measures the applicant has taken and/or will take to ensure that proposed activities will not interfere with subsistence whaling or sealing
(iv) What plans the applicant has to continue to meet with the affected communities, both prior to and while conducting activity, to resolve conflicts and to notify the communities of any changes in the operation
The project will take place in Ketchikan, which is in waters south of the 60˚ North latitude demarcation. No activities will take place in or near a traditional Arctic subsistence hunting area. The project will not impact the availability of marine mammals for Arctic subsistence uses and no plan of cooperation is required for this project. Further, as addressed in Section 8, this project is not likely to impact the availability of any marine mammal for subsistence uses.

13 Monitoring and Reporting Efforts Request for Incidental Harassment Authorization
October 2021 13-1
13.0 MONITORING AND REPORTING EFFORTS The suggested means of accomplishing the necessary monitoring and reporting that will result in increased knowledge of the species, the level of taking, or impacts on populations of marine mammals that are expected to be present while conducting activities and the suggested means of minimizing burdens by coordinating such reporting requirements with other schemes already applicable to persons conducting such activity. Monitoring plans should include a description of the survey techniques that will be used to determine the movement and activity of marine mammals near the activity site(s) including migration and other habitat uses, such as feeding.
13.1 MONITORING AND REPORTING EFFORTS Monitoring measures for the potential impacts the project could have on marine mammals are discussed briefly in Section 11.
13.2 REPORTING A comprehensive annual marine mammal monitoring report documenting marine mammal observations will be submitted to NMFS at the end of the in-water work season. The draft comprehensive marine mammal monitoring report will be submitted to NMFS within 90 calendar days of the end of the in-water work period. The report will include marine mammal observations (pre-activity, during-activity, and post-activity) during pile driving/hammering days. A final comprehensive report will be prepared and submitted to NMFS within 30 calendar days following resolution of comments on the draft report from NMFS.
(a) The marine mammal report must contain the informational elements described in the Monitoring Plan and, at minimum, must include:
(i) Dates and times (begin and end) of all marine mammal monitoring;
(ii) Construction activities occurring during each daily observation period, including:
A. The number and type of piles that were driven and the method (e.g., impact, vibratory, down-the-hole);
B. Total duration of driving time for each pile (vibratory driving) and number of strikes for each pile (impact driving); and
C. For down-the-hole drilling, duration of operation for both impulsive and non-pulse components.
(iii) PSO locations during marine mammal monitoring;
(iv) Environmental conditions during monitoring periods (at beginning and end of PSO shift and whenever conditions change significantly), including Beaufort sea state and any other relevant weather conditions including cloud cover, fog, sun glare, and overall visibility to the horizon, and estimated observable distance;
(v) Upon observation of a marine mammal, the following information:
A. Name of PSO who sighted the animal(s) and PSO location and activity at time of sighting;
B. Time of sighting;
C. Identification of the animal(s) (e.g., genus/species, lowest possible taxonomic level, or unidentified), PSO confidence in identification, and the composition of the group if there is a mix of species;
D. Distance and bearing of each marine mammal observed relative to the pile being driven for each sighting (if pile driving was occurring at time of sighting);

13 Monitoring and Reporting Efforts Request for Incidental Harassment Authorization
October 2021 13-2
E. Estimated number of animals (min/max/best estimate);
F. Estimated number of animals by cohort (adults, juveniles, neonates, group composition, etc.);
G. Animal’s closest point of approach and estimated time spent within the harassment zone;
H. Description of any marine mammal behavioral observations (e.g., observed behaviors such as feeding or traveling), including an assessment of behavioral responses thought to have resulted from the activity (e.g., no response or changes in behavioral state such as ceasing feeding, changing direction, flushing, or breaching);
(vi) Number of marine mammals detected within the harassment zones, by species; and
(vii) Detailed information about implementation of any mitigation (e.g., shutdowns and delays), a description of specific actions that ensued, and resulting changes in behavior of the animal(s), if any.
(b) The Holder must submit all PSO datasheets and/or raw sighting data with the draft report, as specified in condition 6(b) of this IHA.

14 Research Efforts Request for Incidental Harassment Authorization
October 2021 14-1
14.0 RESEARCH EFFORTS Suggested means of learning of, encouraging, and coordinating research opportunities, plans, and activities relating to reducing such incidental taking and evaluating its effects.
The data recorded during marine mammal monitoring for the proposed project will be provided to NMFS in monitoring reports. These reports will provide information on the usage of the site by humpback whales, Steller sea lions, harbor seals, harbor porpoises, Dall’s porpoises, killer whales, and any other marine mammals observed during the project. The monitoring data will inform NMFS and future permit applicants about the behavior and adaptability of pinnipeds and cetaceans for future projects of a similar nature.

15 References Request for Incidental Harassment Authorization
October 2021 15-1
15.0 REFERENCES Alaska Department of Fish and Game (ADF&G). 2021a. Alaska Fish Resource Monitor. Accessed at
https://adfg.maps.arcgis.com/apps/MapSeries/index.html?appid=a05883caa7ef4f7ba17c99274f2c198f
ADF&G. 2021b. Anadromous Waters Catalog. Accessed online at https://www.adfg.alaska.gov/sf/SARR/AWC/
Alaska Department of Transportation and Public Facilities (ADOT&PF). 2020. Alaska Marine Highway System. Accessed online at https://dot.alaska.gov/amhs/route.shtml on April 22, 2020.
Allen, B. M., and R. P. Angliss. 2014. Alaska marine mammal stock assessments, 2013.
Au, W.W.L., A.A. Pack, M.O. Lammers, L.M. Herman, M.H. Deakos, and K. Andrews. 2006. Acoustic properties of humpback whale songs. Journal of Acoustical Society of America 120 (2):1103-1110.
Smith, Melanie. 2011. Place-based Summary of the Arctic Marine Synthesis. Atlas of the Chukchi and Beaufort Seas. Prepared for Audubon Alaska. Anchorage, Alaska. September 2011.
Austin, M., S. Denes, J. MacDonnell, and G. Warner. 2016. Hydroacoustic Monitoring Report: Anchorage Port Modernization Project Test Pile Program. Version 3.0. Technical report by JASCO Applied Sciences for Kiewit Infrastructure West Co.
Baker, C.S., L.M. Herman, A. Perry, W.S. Lawton, JM Straley, JH Straley. 1985. Population characteristics and migration of summer and late-season humpback whales (Megaptera novaeangliae) in southeastern Alaska. Mar. Mamm. Sci. 1:304-323.
Barrett-Lennard, L.G., C.O. Matkin, J.W. Durban, E.L. Saulitis, and D. Ellifrit. 2011. Marine Ecology Progress Series: 421: 229-241.
Bettridge, S., C.S. Baker, J. Barlow, P.J. Clapham, M. Ford, D. Gouveia, D.K. Mattila, R.M. Pace, III, P.E. Rosel, G.K. Silber, P.R. Wade. 2015. Status Review of The Humpback Whale (Megaptera novaeangliae) Under the Endangered Species Act. March 2015. Department of Commerce, NOAA Technical Memo. NOAA-TM-NMFS-SWFSC-540
Burkanov, V and TR Loughlin. 2005. Distribution and abundance of Steller sea lions on the Asian coast, 1720’s– 2005. Mar. Fish. Rev. 67(2): 1-62.
Calambokidis, J., E. A. Falcone, T. J. Quinn, A. M. Burdin, P. J. Clapham, J. K. B. Ford, C. M. Gabriele, R. LeDuc, D. Mattila, L. Rojas-Bracho, J. M. Straley, B. L. Taylor, J. Urbán R., D. Weller, B. H. Witteveen, M. Yamaguchi, A. Bendlin, D. Camacho, K. Flynn, A. Havron, J. Huggins, and N. Maloney. 2008. SPLASH: Structure of Populations, Levels of Abundance and Status of Humpback Whales in the North Pacific. Final Report for Contract AB133F-03-RP-00078, U.S. Dep. Commer., Western Administrative Center, Seattle, WA. Available online: http://www.cascadiaresearch.org/files/Projects/Archived_projects/SPLASH/SPLASH-contract-Report-May08.pdf
Caltrans, 2015. Buehler, D., R. Oestman, J. Reyff, K. Pommerenck, B. Mitchell. 2015. Technical Guidance for Assessment and Mitigation of the Hydroacoustic Effects of Pile Driving on Fish. Written for the California Dept. of Transportation, Div. of Environmental Analysis, Environmental Engineering, Hazardous Waste, Air, Noise, Paleontology Office. Sacramento, CA.
Carretta J, K. Forney, E. Oleson, D. Weller, A. Lang, J. Baker, M. Muto, B. Hanson, A. Orr, H. Huber, M. Lowry, J. Barlow, J. Moore, D. Lynch, L. Carswell, and R. Brownell Jr. 2019. U.S. Pacific Marine Mammal Stock Assessments: 2018. NOAA-TM-NMFS-SWFSC-617
Carretta,J. V. Forney, Karin. A. Oleson, Erin M. Weller, David W. Lang, Aimee R. Baker, Jason. Muto, Marcia M. Hanson, Brad. Orr, Anthony J. Huber, Harriet. Lowry, Mark S. Barlow, Jay. Moore, Jeffrey E. Lynch, Deanna. Carswell, Lilian. Robert L. Brownell Jr., Robert L. 2019. U.S. Pacific

15 References Request for Incidental Harassment Authorization
October 2021 15-2
Marine Mammal Stock Assessments: 2018. U.S. Department of Commerce, NOAA Technical Memorandum NMFS-SWFSC-617.
Chenoweth EM, JM Straley, MV McPhee, S Atkinson, S Reifenstuhl. 2017 Humpback whales feed on hatchery released juvenile salmon. R. Soc. open sci. 4: 170180.
Chumbley, K, J Sease, M Strick, and R Towell. 1997. Field studies of Steller sea lions at Marmot Island Alaska 1979 through 1994. NOAA Tech Memo NMFS-AFSC-77. 111 pages.
Dahlheim, M., A. York, R. Towell, J. Waite, and J. Breiwick. 2000. Harbor porpoise (Phocoena phocoena) abundance in Alaska: Bristol Bay to Southeast Alaska, 1991-1993. Marine Mammal Science 16:28-45.
Dahlheim, M.E., P.A. White, and J.M. Waite. 2009. Cetaceans of Southeast Alaska: distribution and seasonal occurrence. Journal of Biogeography 36:410–426.
Dahlheim, M.E., A.N. Zerbini, J.M. Waite, and A.S. Kennedy. 2015. Temporal changes in abundance of harbor porpoise (Phocoena phocoena)
Denes, S. L., G.J. Warner, M.E. Austin, and A.O. MacGillivray. 2016. Hydroacoustic Pile Driving Noise Study – Comprehensive Report. Document 001285, Version 2.0. Technical report by JASCO Applied Sciences for Alaska Department of Transportation & Public Facilities.
Denes, S., J. Vallarta, and D. Zeddies. 2019. Sound Source Characterization of Down-the-Hole Hammering: Thimble Shoal, Virginia. Document 001888, Version 1.0. Technical report by JASCO Applied Sciences for Chesapeake Tunnel Joint Venture.
Department for Environment, Food and Rural Affairs. 2003. Preliminary investigation of the sensitivity of fish to sound generated by aggregate dredging and marine construction. (Project AE0914 Final Report). London, UK. Undated project completed in March 2003.
Department of the Navy (DoN). 2008. Marine Resources Assessment Update for the Virginia Capes Operating Area. Department of the Navy, U.S. Fleet Forces Command, Norfolk, Virginia. Contract #N62470-02-D-9997, CTO 0056. Prepared by Geo-Marine, Inc., Hampton, Virginia.
Eguchi, T., & J. T. Harvey. 2005. Diving behavior of the Pacific harbor seal (Phoca vitulina richardii) in Monterey Bay, California. Marine Mammal Science, 21(2), 283-295.
Erbe, Christine. Dunlop, Rebecca. Dolman, Sarah. 2018. Effects of Noise on Marine Mammals. 10.1007/978-1-4939-8574-6-6_10.
Everitt, R., C. Fiscus, and R. DeLong. 1980. Northern Puget Sound marine mammals. Interagency Energy. Environment R & D Program Report, US EPA, EPA-600/7-80-139. US EPA, Washington, DC.
Fleming, A. and J. Jackson. 2011. Global Review of Humpback Whales (Megaptera novaeangliae). U.S. Dept. of Commerce, NOAA, NMFS, Southwest Fisheries Science Center. Technical Memorandum. NOAA-TM-NMFS-SWFSC-474. Foote AD, Morin PA, Durban JW, Willerslev E, Orlando L, Gilbert MTP. (2011). Out of the Pacific and back again: insights into the matrilineal history of Pacific killer whale ecotypes. PLoS ONE 6: e24980.
Freitag, G. 2017. Personal communication between Kate Arduser, Solstice Alaska Consulting, Inc. and Gary Freitag, University of Alaska Fairbanks College of Fisheries and Ocean Sciences Associate Professor Marine Advisory Program, member of NOAA Marine Mammal Stranding Network, and longtime Ketchikan resident, regarding marine mammal occurrence, behavior, and typical groups size in Ketchikan vicinity. As cited by Solstice 2019.
Fritz, L., K. Sweeney, D. Johnson, M. Lynn, T. Gelatt, and J. Gilpatrick. 2013. Aerial and ship-based surveys of Steller sea lions (Eumetopias jubatus) conducted in Alaska in June-July 2008 through 2012, and an update on the status and trend of the western distinct population segment in Alaska. U.S. Dep. Commer., NOAA Tech. Memo. NMFS-AFSC-251, 91 p.
Geoengineers. 2019. Removal of Berth II Rock Pinnacle Project, Ketchikan, Alaska: Application for MMPA Incidental Harassment Authorization. Prepared for the City of Ketchikan. Ketchikan, Alaska.

15 References Request for Incidental Harassment Authorization
October 2021 15-3
Gjertz, I., C. Lydersen, O. Wiig. 2001. Distribution and diving of harbour seals (Phoca vitulina) in Svalbard. Polar Biol (2001) 24: 209-214. Springer-Verlag.
Hastings, K., M. Rehberg, G. O’Corry-Crowe, G. Pendleton, L. Jemison and T. Gelatt. 2020. Demographic consequences and characteristics of recent population mixing and colonization in Steller sea lions, Eumetopias jubatus. Journal of Mammalogy. Submitted June 2019.
Hastings, Mardi C. Popper Arthur N. 2005. Effects of Sound on Fish. Revised August 23, 2005. Prepared for California Department of Transportation. Contract No. 43A0139, Task Order 1. Sacramento, CA.
HDR. 2019. Tongass Narrows Project: Application for MMPA Incidental Harassment Authorizations Revision Number 4. Report prepared for Alaska Department of Transportation & Public Facilities, Juneau, Alaska.
Hobbs, R. C., and J. M. Waite. 2010. Abundance of harbor porpoise (Phocoena phocoena) in three Alaskan regions, corrected for observer errors due to perception bias and species misidentification, and corrected for animals submerged from view. Fish. Bull., U.S. 108(3):251-267.
Jacobs, S.R. and J.M. Terhune. 2002. The effectiveness of acoustic harassment devices in the Bay of Fundy, Canada: seal reactions and a noise exposure model. Aquatic Mammals, 28.2: 147-158. Jefferson TA, Webber MA, Pitman RL. 2015. Marine mammals of the world: a comprehensive guide to their identification. 2nd ed. London: Academic Press.
Jefferson, T.A., M.E. Dahlheim, A.N. Zerbini, J.M. Waite and A.S. Kennedy. 2019. Abundance and Seasonality of Dall’s Porpoise (Phocoenoides dalli) in Southeast Alaska. NOAA Technical Memorandum NMFS-AFSC-385.
Jemison L.A., Pendleton G.W., Fritz L.W., Hastings K.K., Maniscalco J.M., et al. 2013. Inter-population movements of Steller sea lions in Alaska with implications for population separation. PLoS ONE 8(8): e70167. doi:10.1371/journal.pone.0070167
Kastak, D. and R.J. Schusterman. 1998. Low frequency amphibious hearing in pinnipeds: Methods, measurements, noise, and ecology. Journal of the Acoustical Society of America. 103(4): 2216-2228.
Kastelein, R.A., R. van Schie, W. Verboom, and D. Haan. 2005. Underwater hearing sensitivity of a male and a female Steller sea lion (Eumetopias jubatus). Journal of the Acoustical Society of America 118:1820-1829.
Kastelein, R.A., P.W. Wensveen, L. Hoek. 2009. Underwater hearing sensitivity of harbor seals (Phoca vitulina) for narrow noise bands between 0.2 and 80 kHz. The Journal of the Acoustical Society of America 126, 476. July 2009.
Kajimura, H. and T.R. Loughlin. 1988. Marine Mammals in the Oceanic Food Web of the Eastern Subarctic Pacific. Bulletin of the Ocean Research Institute, University of Tokyo 26:187-223.
Kawamura A. 1980 A review of food of balaenopterid whales. Sci. Reports Whales Res. Inst. 32, 155–197.
Klinkhart, E., K. Pitcher, G. Blundell. 2008. Harbor Seal. Alaska State Dept. of Fish and Game. Revised and reprinted 2008. Accessed from https://www.adfg.alaska.gov/static/education/wns/harbor_seal.pdf.
Krieger, KJ, BL Wing. 1986. Hydroacoustic monitoring of prey to determine humpback whale movements. NOAA Tech. Memo. 60 (NMFS-F/NWC-98).
Laughlin, J. 2010. Memorandum: Airborne Noise Measurements (A-weighted and un-weighted) during Vibratory Pile Installation – Technical Memorandum. Washington State Dept. of Transportation.
Laughlin, J. 2011. Underwater Sound Levels Associated with Driving 72-inch Steel Piles at the SR 529 Ebey Slough Bridge Replacement Project. Washington State Department of Transportation

15 References Request for Incidental Harassment Authorization
October 2021 15-4
Liddle, Joseph. 2015. Population Dynamics of Pacific Herring and Humpback Whales, Sitka Sound, Alaska 1981-2011 (doctoral dissertation). University of Alaska Fairbanks.
Limpinsel, D. E., Eagleton, M. P., and Hanson, J. L. 2017. Impacts to Essential Fish Habitat from Non-Fishing Activities in Alaska. EFH 5 Year Review: 2010 through 2015. U.S. Dep. Commer., NOAA Tech. Memo. NMFS-F/AKR-14, 229p.
Loughlin, TR, DJ Rugh, and CH Fiscus. 1984. Northern sea lion distribution and abundance: 1956-1980. J. Wildl. Manage. 48:729-740.
Marine Mammal Center. 2020. Gray Whale. Accessed online at https://www.marinemammalcenter.org/education/marine-mammal-information/cetaceans/gray-whale.html on April 22, 2020.
Merrick, R.L., M.K. Chumbley, and G.W. Byrd. 1997. Diet Diversity of Steller Sea Lions and Their Population Decline in Alaska: A Potential Relationship. Canadian Journal of Fisheries and Aquatic Science. 54(6):1342-1348.
Miner, Robert. 2018. Sound Source Verification. Down-hole Hammer Operation, August 12 & 15, 2018. Vibratory Hammer Operation, August 15, 2018. Biorka Island Dock Replacement Project, Southeast Alaska. 8 pp.
Moran, J.R., R.A. Heintz, J.M. Straley, J.J. Vollenweider. 2018. Regional variation in the intensity of humpback whale predation on Pacific herring in the Gulf of Alaska. Deep-Sea Research Part II: Topical Studies in Oceanography, Vol. 147, pp. 187–195. January 2018. http://dx.doi.org/10.1016/j.dsr2.2017.07.010
Moran, J.R., M.B. O’Dell, M.L. Arimitsu, J.M. Straley, and D.M.S. Dickson. 2018b. Seasonal distribution of Dall’s porpoise in Prince William Sound, Alaska. Deep-Sea Research Part II 147:164-172.
Muto, M. M., V. T. Helker, R. P. Angliss, P. L. Boveng, J. M. Breiwick, M. F. Cameron, P. J. Clapham, S. P. Dahle, M. E. Dahlheim, B. S. Fadely, M. C. Ferguson, L. W. Fritz, R. C. Hobbs, Y. V. Ivashchenko, A. S. Kennedy, J. M. London, S. A. Mizroch, R. R. Ream, E. L. Richmond, K. E. W. Shelden, K. L. Sweeney, R. G. Towell, P. R. Wade, J. M. Waite, and A. N. Zerbini. Alaska marine mammal stock assessments, 2018. U.S. Dep. Commerce, NOAA Tech. Memo. NMFS-AFSC-393. June 2019.
Muslow, J. and C. Reichmuth. 2010. Psychophysical and electrophysiological aerial audiograms of a Steller sea lion (Eumetopias jubatus). Journal of the Acoustical Society of America. 127:2692-2701.
Nemoto, T. 1957. Foods of the baleen whales of northern Pacific. Sci. Rep. Whal. Res. Inst. 12, 33–89.
NOAA. 2015. Nautical Chart 17428 – Revillagigedo Channel
NOAA. 2020. Alaska Harbor Seal Abundance 2018. Accessed online at https://noaa.maps.arcgis.com/home/item.html?id=2c6ca3e595024d3990127bfe061d7ed3 on April 22, 2020.
NOAA. 2020b. Viewing Marine Mammals. Accessed online at https://alaskafisheries.noaa.gov/protectedresources/mmv/guide.htm on April 22, 2020.
NMFS. 2015 (accessed). Interim Sound Threshold Guidance. West Coast Region, NMFS, NOAA, U.S. Dept. of Commerce. Retrieved from: www.westcoast.fisheries.noaa.gov/protected_16species/marine_mammals/threshold_guidance.html
NMFS. 2016 as revised 2018, as revised 2020. Technical Guidance for Assessing the Effects of Anthropogenic Sound on Marine Mammal Hearing. NMFS, NOAA, U.S. Dept. of Commerce. NOAA Technical Memorandum NMFS-OPR-55. July 2016. Accessed on April 22, 2020 at https://www.fisheries.noaa.gov/national/marine-mammal-protection/marine-mammal-acoustic-technical-guidance
NMFS. 2018a, as revised 2020. Manual for Optional User Spreadsheet Tool (Version 2.0) for: 2018 Technical Guidance for Assessing the Effects of Anthropogenic Sound on Marine Mammal
15 References Request for Incidental Harassment Authorization
October 2021 15-5
Hearing (Version 2.0): Underwater Thresholds for Onset of Permanent and Temporary Threshold Shifts. Silver Spring Maryland: Office of Protected Resources, National Marine Fisheries Service.
NMFS. 2018b. 2018 Revision to Technical Guidance for Assessing the Effects of Anthropogenic Sound on Marine Mammal Hearing. NMFS, NOAA, U.S. Dept. of Commerce. NOAA Technical Memorandum NMFS-OPR-59. Retrieved from: https://www.fisheries.noaa.gov/webdam/download/75962998
NMFS. 2019a. Biological Opinion for the Tongass Narrows Project (Gravina Access). NMFS Consultation Number: AKRO-2019-03432. Juneau, Alaska.
NMFS. 2020a. Nearshore Fish Atlas. Accessed for Ketchikan vicinity on March 26, 2020 at https://alaskafisheries.noaa.gov/mapping/szflex/index.html?T=FA%40L%3DB
NMFS. 2020. Fisheries Home » Protected Resources » Steller Sea Lion (Eumetopias jubatus). As viewed April 2020 at https://www.fisheries.noaa.gov/species/steller-sea-lion
NMFS. 2020b. Fisheries Home » Protected Resources » Dall’s Porpoise (Phocoena phocoena). As viewed September 2019 at https://www.fisheries.noaa.gov/species/harbor-porpoise
NMFS. 2020c. Fisheries Home » Protected Resources » Harbor Porpoise (Phocoenoides dalli). As viewed April 2020 at https://www.fisheries.noaa.gov/species/harbor-porpoise
NMFS. 2020d. Fisheries Home » Protected Resources » Killer Whale (Orcinus Orca). As viewed September 2019 at https://www.fisheries.noaa.gov/species/killer-whale
NMFS. 2020e. Fisheries Home » Protected Resources » Species Minke Whale (Balaenoptera acutorostrata). As viewed April 2020 at https://www.fisheries.noaa.gov/species/minke-whale#management
NMFS. 2020f. Fisheries Home » Protected Resources » Gray Whale (Eschrichtius robustus). Accessed August 2019 at https://www.fisheries.noaa.gov/species/gray-whale
NMFS. 2020g. NOAA Fisheries. Pacific White-sided Dolphin. Accessed online at https://www.fisheries.noaa.gov/species/pacific-white-sided-dolphin on April 22, 2020.
Nowacek, DP, LH Thorne, D.W. Johnston, And PL Tyack. 2007. Responses of cetaceans to anthropogenic noise. Mammal Rev. 37(2):81–115.
North Pacific Fishery Management Council (NPFMC). 2009b. Environmental Assessment/ Regulatory Impact Review/ Final Regulatory Flexibility Analysis for the Arctic Fishery Management Plan and Amendment 29 to the Fishery Management Plan for Bering Sea/Aleutian Islands King and Tanner Crabs. August 2009
NUKA Research and Planning Group, LLC. 2012. Southeast Alaska Vessel Traffic Study. July 23, 2012. Revision 1. Prepared for the Alaska Department of Environmental Conservation
Parsons, K. J.W. Durban, A. M. Burdin, V.N. Burkanov, R. L. Pitman, J. Barlow, L.G. Barrett-Lennard, R.G. LeDuc, K.M. Robertson, C.O. Matkin, and P.R. Wade. 2013. Geographic Patterns of Genetic Differentiation among Killer Whales in the Norther North Pacific. J. Hered: published online July 11, 2013 doi:10.1093/jhered/est037.
Pitcher, K.W. and D.G. Calkins. 1979. Biology of the Harbor Seal, Phoca vitulina richardii, in the Gulf of Alaska. Report for the Outer Continental Shelf Environmental Assessment Program. NOAA, U.S. Dept. of Commerce.
Pitcher, K.W. 1981. Prey of the Steller Sea Lion in the Gulf of Alaska. Fisheries Bulletin Seattle. 79:467-472. Pitman, R. L. and J. W. Durban. 2011. Cooperative hunting behavior, prey selectivity and prey handling by pack ice killer whales (Orcinus orca), type B, in Antarctic Peninsula waters. Marine Mammal Science. (doi: 10.1111/j.1748-7692.2010.00453.x).
PND (PND Engineers Inc.). 2006. Geotechnical Investigation. City of Ketchikan Port Berth Reconfiguration/Expansion. Prepared for the City of Ketchikan. Seattle, WA.

15 References Request for Incidental Harassment Authorization
October 2021 15-6
PND. 2008. Revised 2011. Statter Harbor Improvements Sound Study. Prepared for CBJ Docks and Harbors Department. Juneau, Alaska.
Popper, Arthur. Hastings, Mardi. 2009. The effects of human-generated sound on fish. Integrative Zoology. 2009; 4: 43-52. Rehberg, M.J. and S.T. Zimmerman. 2008. Steller sea lion. Alaska State Dept. of Fish and Game. Revised and reprinted 2008. Accessed on 12/11/19 from Rehberg, Michael J. 2008. Steller Sea Lion. Alaska Fish and Game. Original text by Stephen T. Zimmerman. 1994. Accessed online at https://www.adfg.alaska.gov/static/education/wns/steller_sea_lion.pdf on April 22, 2020.
Reyff, James. Heyvaert, Cameron. 2019. White Pass & Yukon Railroad Mooring Dolphin Installation. Pile Driving and Drilling Sound Source Verification. Report prepared for PND Engineers, Seattle, WA.
Reyff, James. Heyvaert, Cameron. 2019. Updated. White Pass & Yukon Railroad Mooring Dolphin Installation. Pile Driving and Drilling Sound Source Verification. Report prepared for PND Engineers, Seattle, WA.
Reyff, James. 2020. Unpublished Draft Review of Down-the-Hole Rock Socket Drilling Acoustic Data Measured for White Pass & Yukon Route (WP&YR) Mooring Dolphins.
Ruggerone, G.T., S. Goodman, and R. Miner, 2008. Behavioral Response and Survival of Juvenile Coho Salmon Exposed to Pile Driving Sounds. Prepared for the Port of Seattle, Seattle, Washington, by Natural Resources Consultants, Inc., Seattle, Washington.
Schuler A.R., and Pearson, H.C. 2019. Conservation benefits of whale-watching in Juneau, AK. Tourism in Marine Environments. 14: 231-248
Sease, J.L. 1992. Status Review: Harbor Seals (Phoca vitulina) in Alaska. Alaska Fisheries Science Center. NMFS, NOAA, U.S. Dept. of Commerce. December 1992. Seattle, Washington.
Sitkiewicz, Sioned. 2020. 2019-2020 City of Ketchikan Rock pinnacle Removal Project Marine Mammal Monitoring and Mitigation Report. Prepared for National Marine Fisheries Service, Alaska Region, Protected Resources Division, 222 W. 7th Avenue, #43 Anchorage, AK 99513; National Marine Fisheries Service, Permits and Conservation Division, Office of Protected Resources, 1315 East-West Highway, Silver Spring, MD, 20910. Prepared by Fairweather Science, LLC, 301 Calista Court, Anchorage, AK 99518. April 2020.
Solstice. 2020. Ward Cove Cruise Ship Dock Project, Ward Cove, Ketchikan, Alaska. Application for MMPA Incidental Harassment Authorization. Prepared for Power Systems & Supplies of Alaska, Ketchikan, Alaska.
Southall, B. L., A. E. Bowles, W. T. Ellison, J. J. Finneran, R. L. Gentry, C. R. Greene, D. Kastak, D. R. Ketten, J.H. Miller, P. E. Nachtigall, W. J. Richardson, J. A. Thomas, and P. L. Tyack. 2007. Marine Mammal Noise-Exposure Criteria: Initial Scientific Recommendations. Aquatic Mammals 33(4): 409-521. Retrieved from: http://thecre.com/pdf/Aquatic_Mammals_33_4_FINAL.pdf.
Straley, JM. 1990. Fall and winter occurrence of humpback whales (Megaptera novaeangliae) in southeastern Alaska. pp 319-323 in Hammond, PS, SA Mizroch, and GP Donovan (eds) Rept. Int. Whal. Commn. (Special Issue 12): Individual Recognition of Cetaceans: Use of Photo-Identification and Other Techniques to Estimate Population Parameters. International Whaling Commission.
Straley, J.M., J.R. Moran, K.M. Boswell, J.J. Vollenweider, R.A. Heintz, T.J. Quinn II, B.H. Witteveen, S D. Rice. 2017. Seasonal presence and potential influence of humpback whales on wintering Pacific herring populations in the Gulf of Alaska. Deep-Sea Research Part II: Topical Studies in Oceanography http://dx.doi.org/10.1016/j.dsr2.2017.08.008
Szymanksi, M.D., D.E. Bain, K. Kiehl, S. Pennington, S. Wong, and K.R. Henry. 1999. Killer whale (Orcinus orca) hearing: Auditory brainstem response and behavioral audiograms. Journal of the Acoustical Society of America, Volume 106, No. 2. August 1999.

15 References Request for Incidental Harassment Authorization
October 2021 15-7
Teerlink. S.F. 2017. Humpback whales and humans: a multi-disciplinary approach to exploring the whale watching industry in Juneau, Alaska. Thesis (Ph.D.) University of Alaska Fairbanks, 2017. Accessed on 12/12/2019 at https://scholarworks.alaska.edu/handle/11122/7644.
Terhune JM and Turnbull S. 1995. Variation in the psychometric functions and hearing thresholds of a harbor seal. In: U.S. Fish and Wildlife. 2012. Observer Protocols for Pile Driving, Dredging and Placement of Fill. Draft. Anchorage Field Office. USFWS. Dept. of Interior. August 7, 2012.https://www.adfg.alaska.gov/static/education/wns/steller_sea_lion.pdf
United States Navy. 2015. Proxy source sound levels and potential bubble curtain attenuation for acoustic modeling of nearshore marine pile driving at Navy installations in Puget Sound. Prepared by Michael Slater, Naval Surface Warfare Center, Carderock Division, and Sharon Rainsberry, Naval Facilities Engineering Command Northwest. Revised January 2015.
Vollenweider, J.J., Heintz, R.A., Schaufler, L., Bradshaw, R., 2011. Seasonal cycles in whole body proximate composition and energy content of forage fish vary with water depth. Mar Biol. 158, 413-42 Vu ET, Risch D, Clark C, Gaylord S, Hatch L, et al. (2012) Humpback whale song occurs extensively on feeding grounds in the western North Atlantic Ocean. Aquatic Biology 14: 175–183.
Wade, P. R. 2021. Estimates of abundance and migratory destination for North Pacific humpback whales in both summer feeding areas and winter mating and calving areas. International Whaling Commission. SC/68c/IA/03. 32 pp. https://archive.iwc.int/.
Wade, P.R., T.J. Quinn II, J. Barlow, C.S. Baker, A.M. Burdin, J. Calambokidis, P.J. Clapham, E. Falcone, J.K.B. Ford, C.M. Gabriele, R. Leduc, D.K. Mattila, L. Rojas-Bracho, J. Straley, B.L. Taylor, J. Urbán, D. Weller, B.H. Witteveen, and M. Yamaguchi. 2016. Estimates of abundance and migratory destination for North Pacific humpback whales in both summer feeding areas and winter mating and calving areas. Paper SC/66b/IA21 submitted to the Scientific Committee of the International Whaling Commission, June 2016, Bled, Slovenia. Available at www.iwcoffice.org.
Witteveen, B.H., R.J. Foy, K.M. Wynne, Y. Tremblay. 2008. Investigation of foraging habits and prey selection by humpback whales (Megaptera novaeangliae) using acoustic tags and concurrent fish surveys. Mar. Mamm. Sci. 24: 516–534.
Witteveen, B. Worth, G. Roth, J. 2009. Tracing Migratory movements of breeding North Pacific humpback whales using stable isotope analysis. Mar. Ecol. Prog. Ser. 393 (2009), pages 173 – 183.
Witteveen, B.H. and K.M. Wynne. 2017. Site fidelity and movement of humpback whales (Megaptera novaeangliae) in the western Gulf of Alaska as revealed by photo-identification. Can. J. Zool. 95: 169–175 dx.doi.org/10.1139/cjz-2016-0101
Wolfe, RJ, J Bryant, L Hutchinson-Scarborough, M Kookesh, and LA Sill. 2013. The Subsistence Harvest of Harbor Seals and Sea Lions in Southeast Alaska in 2012. Alaska Department of Fish and Game, Division of Subsistence, Technical Paper No. 383, Anchorage, Alaska
Wolski, L.F., R.C. Anderson, A.E. Bowles, P.K. Yochem. 2003. Measuring hearing in the harbor seal (Phoca vitulina): Comparison of behavioral and auditory brainstem response techniques. J. Acoust. Soc. Am. 113 (1), January 2003. [DOI: 10.1121/1.1527961]
Womble, J.N., M.F. Sigler and M.F. Willson. 2009. Linking seasonal distribution patterns with prey availability in a central-place forager, the Steller sea lion. Journal of Biogeography 36(3): 439-451.

Appendix A: Engineering Drawings

TITLE SHEET AND VICINITY MAP
PND PROJECT NO.:APPROVED:DRAWN:
DESIGN: CHECKED:
SCALE:
DATE:
SHEET TITLE:
9360 Glacier Highway Ste 100Juneau, Alaska 99801
www.pndengineers.comFax: 907-586-2099Phone: 907-586-2093 60% DESIGN
SUBMITTAL
C.A.N. NO.:
NOAA FAIRWEATHER HOMEPORT
RECAPITALIZATION PROJECT
E NN G I E E R S I NC, .
G1.01
ALASKAUSACANADA
JUNEAU
SOUTHEAST
ALASKA
VICINITY
NATIONAL OCEANIC AND ATMOSPHERIC ADMINISTRATION
UNITED STATES DEPARTMENT OF COMMERCE
NOAA FAIRWEATHER HOMEPORT
RECAPITALIZATION PROJECT
CONTRACT NO. 1305M421CNAAJ0005
SOUTHEAST ALASKA
HAINES
JUNEAU
PETERSBURG
GRAHAMISLAND
F
R
E
D
E
R
IC
K
S
O
U
N
D
C
L
A
R
E
N
C
E
ST
RA
IT
L
Y
N
NC
A
N
A
L
C
H
A
T
H
A
M
S
T
R
A
IT
CANADAUNITED STATES
S
U
M
N
E
R
S
T
R
A
IT
ICY
S
T
R
A
I
T
WRANGELL
SKAGWAY
HOONAHPELICAN
TENNAKEE
ANGOON
SITKA
KAKE
CRAIG
VICINITY MAP
THIS
PROJECT
TONGASSNARROWS
KETCHIKAN
INTERNATIONAL
AIRPORT
TIDAL DATA
SOURCE: NOAA NOS/CO-OPS STATION ID:9450460 KETCHIKAN, AK. 9/26/11
DESCRIPTIONELEV.(FT.)
KETCHIKAN
KETCHIKAN
AMHS
FERRY
TERMINAL
S
T
E
D
M
A
N
S
T
NOAA FAIRWEATHER
HOMEPORT RECAPITALIZATION
PROJECT
PENNOCK
ISLAND
T
O
N
G
A
S
S
A
V
E
.
BAR
HARBOR
THOMAS
BASIN
NORTH
F
R
O
N
T
S
T
USCG BASE
KETCHIKAN
KETCHIKAN
PORT & HARBOR
DEPT.
KETCHIKAN
CRUISE SHIP
DOCKS
W
A
T
E
R
S
T

DRAWING INDEX
PND PROJECT NO.:APPROVED:DRAWN:
DESIGN: CHECKED:
SCALE:
DATE:
SHEET TITLE:
9360 Glacier Highway Ste 100Juneau, Alaska 99801
www.pndengineers.comFax: 907-586-2099Phone: 907-586-2093 60% DESIGN
SUBMITTAL
C.A.N. NO.:
NOAA FAIRWEATHER HOMEPORT
RECAPITALIZATION PROJECT
E NN G I E E R S I NC, .
G1.02
DRAWING INDEXDRAWING INDEX

GENERAL NOTES,
LEGEND, AND ABBREVIATIONS
PND PROJECT NO.:APPROVED:DRAWN:
DESIGN: CHECKED:
SCALE:
DATE:
SHEET TITLE:
9360 Glacier Highway Ste 100Juneau, Alaska 99801
www.pndengineers.comFax: 907-586-2099Phone: 907-586-2093 60% DESIGN
SUBMITTAL
C.A.N. NO.:
NOAA FAIRWEATHER HOMEPORT
RECAPITALIZATION PROJECT
E NN G I E E R S I NC, .
G1.03
WX
FMX
ABBREVIATIONS
DIAL BEFORE YOU DIG!
907-228-4727
UNDERGROUND POWER, TELEPHONE, T.V.,COMMUNICATIONS, WATER AND SEWER LINES AREIN THE AREA. UTILITIES SHOWN ON THE PLANS DO
NOT SUBSTITUTE FOR FIELD LOCATES.
GENERAL NOTES
EXISTING THIS PROJECT
LEGEND
SD N
SS X
SD X
SS N
WN
P1
FMN
KTN B-1B-4
CO
E
5
OWSSDMH
S

SSX
SS XSS
XSS
XSS
XSS
XSS X
SSX
SSX
SSX
SSX
SSX
SSX
SSX
SS XSS X
SSX
WX
WX
W XW X
W XW X
W XW
XW
XW X W
XW
X WX
W X
W XW X
W X
WX
FMX
FMX
FMX
FMX
SSX
SSX
SSX
SS XSS
XSS
XSS
XSS
XSS X
SSX
SSX
SSX
SSX
SSX
SSX
SSX
SS XSS X
SSX
WX
WX
W XW X
W XW X
W XW
XW
XW X W
XW
X WX
W X
W XW X
W X
WX
FMX
FMX
FMX
FMX
SSX
SSX
B-3
B-4B-5
-80
-75
-70
-65
-60
-55
-50
-4
5
5
0
3
0
2
5
3
5
2
0
1
5
1
0
1
0
5
-6
5
1
5
1
0
5
3
0
3
5
40
25
20
-8
5
-80
-75
-7
0
3
0
3
5
3
0
25
20
-
5
35
30
2
5
2
0
1
5
10
5
0
-6
0
-5
5
-5
0
-40
-3
5
-30
-2
5
-20
-1
5
-5
-6
5
-60
-
5
5
-5
0
-4
5
-4
0
-35
-30
-25
-2
0
-1
5
-10
0
-1
0
-4
5
-4
0
PND PROJECT NO.:APPROVED:DRAWN:
DESIGN: CHECKED:
SCALE:
DATE:
SHEET TITLE:
9360 Glacier Highway Ste 100Juneau, Alaska 99801
www.pndengineers.comFax: 907-586-2099Phone: 907-586-2093 60% DESIGN
SUBMITTAL
C.A.N. NO.:
NOAA FAIRWEATHER HOMEPORT
RECAPITALIZATION PROJECT
E NN G I E E R S I NC, .
G1.04
SURVEY CONTROL
EXISTING CONDITIONS, SURVEY CONTROL
AND BOREHOLE LOCATIONS
BOREHOLE LEGEND
PND (2021)
SURVEY NOTES:
KTN B-1
B-4DAMES & MOORE (1974)
KTN B-4
KTN B-3
KTN B-1
KTN P-5
KTN B-2
KTN P-6
KTN P-7

SSX
SSX
SSX
SSX
SSX
SSX
SSX
SS XSS
XSS
XSS
XSS
XSS
XSS
XSS
XSS
XSS X
WX
W XW X
WX
W XW
XW X
W XW X
W X WX
WX W
XW X
W XW
X
W X
WX
FMX
FMX
FMX
FMX
SSX
SSX
SSX
SSX
SSX
SSX
SSX
SSX
SSX
SS XSS
XSS
XSS
XSS
XSS
XSS
XSS
XSS
XSS X
WX
W XW X
WX
W XW
XW X
W XW X
W X WX
WX W
XW X
W XW
X
W X
WX
FMX
FMX
FMX
FMX
SSX
SSX
-80
-75
-70
-65
-60
-55
-50
-4
5
5
0
3
0
2
5
3
5
2
0
1
5
1
0
1
0
5
-6
5
1
5
1
0
5
3
0
3
5
40
25
20
-8
5
-8
0
-75
-70
3
0
3
5
3
0
25
20
-
5
35
30
2
5
20
1
5
10
5
0
-
7
0
-6
0
-5
5
-5
0
-40
-3
5
-30
-2
5
-20
-1
5
-5
-6
5
-60
-
5
5
-5
0
-45
-4
0
-35
-30
-25
-2
0
-1
5
-10
0
-1
0
-4
5
-4
0
DEMOLITION PLAN
PND PROJECT NO.:APPROVED:DRAWN:
DESIGN: CHECKED:
SCALE:
DATE:
SHEET TITLE:
9360 Glacier Highway Ste 100Juneau, Alaska 99801
www.pndengineers.comFax: 907-586-2099Phone: 907-586-2093 60% DESIGN
SUBMITTAL
C.A.N. NO.:
NOAA FAIRWEATHER HOMEPORT
RECAPITALIZATION PROJECT
E NN G I E E R S I NC, .
G1.05
DEMOLITION SUMMARY
1
2
3
4
5
6
7
8
9
10
11
12
13
14
15
16
17
18
19
20
GENERAL NOTES
A
B
C
D
E
F
DEMOLISH
SALVAGE
(E)
11
13
8
1
10
16
126
7
9
9
9
9
9
1
181
2
15
54
55
515
1
1
1
3
3
3
6
7
14
17
19
20
20

SS XSS
XSS
XSS X
SSX
SS XSS X
SSX
SS XSS
XSS X
SS XSS
XSS X
SSX
SS XSS X
SSX
SS XSS
XSS
XSS
XSS
XSS
XSS
XSS
XSS X
SS XSS
XSS X
SSX
SS XSS X
SSX
WX
WX
WX
W X W XW X
W XW X
W XW X
W XW X
W XW X
W XW X
WX
W XW X
W XW X
W X WX
W XW X W
X WX
W XW X
W X
W XW X
W XW X
W X
W X
W X
W X
WX
WX
FMX
FMX
FMX
FMX
FMX
FMX
FMX
FMX
FMX
SSX
SSX
SSX
SSX
SSX
SSX
0
0
5
10
15
20
20
25
3
0
5
10
15
5
1
0
1
0
1
5
2
0
3
5
2
5
3
035
10
1
5
0
-10
-1
5
-
2
0
-2
5
-30
-3
5
-40
-4
5
-
5
0
-
5
5
-60
-6
5
-5
-10
-1
5
-2
0
-2
5
-30
-35
-4
0
-5
0
-5
5
-6
0
-
7
0
-
5
-
7
0
-
8
0
-70
-75
-8
0
-8
5
-9
0
-
7
5
-6
5
-4
5
-65
-70
-75
-80
40
25
WX
WX
WX
-20
GENERAL SITE PLAN
PND PROJECT NO.:APPROVED:DRAWN:
DESIGN: CHECKED:
SCALE:
DATE:
SHEET TITLE:
9360 Glacier Highway Ste 100Juneau, Alaska 99801
www.pndengineers.comFax: 907-586-2099Phone: 907-586-2093 60% DESIGN
SUBMITTAL
C.A.N. NO.:
NOAA FAIRWEATHER HOMEPORT
RECAPITALIZATION PROJECT
E NN G I E E R S I NC, .
G1.06
TRANSFER BRIDGE LAYOUT TABLE
POINT NORTHING EASTINGELEV.(FEET) DESCRIPTION
1 1284920.17 3110039.50 - C TRANSFER BRIDGE & CENTER FACE OF CONCRETE ABUTMENT
2 1284812.30 3109952.16 - C TRANSFER BRIDGE & CENTER BEARING PIN
TRANSFER BRIDGECONCRETE ABUTMENT
TRANSFER BRIDGE
BRIDGE SUPPORT FLOAT
MAIN FLOATING DOCK
MOORING FRAME,TYP.
(E) MOORING &BREASTING DOLPHIN
NOAA VESSELFAIRWEATHER
COVEREDGANGWAY
14-7" x 86' SMALL VESSELMOORAGE FLOAT
BOAT LAUNCHRAMP
FLOATING CAMEL
PAVEDUPLANDS STAGING &
PARKING AREA
L
1
2
L

E
F F
E WSSW E
E
S
W
FN
FN
FN
FN
FN
FN
FN
FN
FN
FN
FN
FN
FN
FN
F
NF
NF
NF
NF
NF
NF
NF
NF
NF
N F
N
FN
FN
FN
FN
F N FN
FN
FN
PND PROJECT NO.:APPROVED:DRAWN:
DESIGN: CHECKED:
SCALE:
DATE:
SHEET TITLE:
9360 Glacier Highway Ste 100Juneau, Alaska 99801
www.pndengineers.comFax: 907-586-2099Phone: 907-586-2093 60% DESIGN
SUBMITTAL
C.A.N. NO.:
NOAA FAIRWEATHER HOMEPORT
RECAPITALIZATION PROJECT
E NN G I E E R S I NC, .
G1.07
DOCK UTILITY ARRANGEMENT AND
VEHICLE TURNING DIAGRAM
AML 20' 20' CHASSIS
HS20 TRUCK WITH 20-FT CONEX CONTAINER
NOTE:
FLOATING DOCK UTILITY PLAN
ELECTRICAL SWITCHGEAR CABINET, TYP.(2) EA.
LIGHT POLE, TYP.(4) EA.
FIRE SERVICE RISER, TYP.(2) EA.
WATER SERVICE RISER IN HEATED ENCLOSURE, TYP.(2) EA.
STEEL PIPE BOLLARD, TYP.
SEWER SERVICE RISER HEAT TRACED/ INSULATED, TYP.(2) EA.
SHORE TIE ELECTRICAL PEDESTAL, TYP.(2) EA.
HS20 TRUCK w/ 20-FT CONEXCONTAINER TURNING LEFT
HS20 TRUCK w/ 20-FT CONEXCONTAINER TURNING RIGHT
8-FT MOORING & UTILITY CORRIDOR
SEWER LIFT STATION IN HEATED ENCLOSURE
COVERED GANGWAY
SMALL VESSEL MOORAGE FLOAT
TRANSFER BRIDGE
BRIDGE SUPPORT FLOAT
MOORING BOLLARD, TYP.(6) EA.

SS X SSX SS
X SSX SS
X SS X SS X SSX SS
X SSX SS
X SS X SS X SSX SS
X SSX SS
X SS X SS X SSX SS
X SSX SS X SS X SS
X SSX SS
X SSX SS X SS
X SSX SS
X SSX SS
X SSX SS X SS
X SS X SSX SS X SS
X SSX SS
X SSX
SSX
SSX
SS XSS X
SS XSS X
SSX
SSX
SS XSS X
WX
WX
WX
WX
WX
WX
WX
WX
WX W
X WX W X
WX
W XW
XW X W X
WX
W X W XW
XW
XW X W X W X
WX
WX
W X W X W XW
XW
X W X W X WX W
X WX W
X WX W
X W X W X W XW X
W XW X W
X WX
W XW X
W XW
X WX W
X WX W
X
WX
WX
WX
W X WX
W X
W X
W X
W X
W X
W X
WX
WX
W XW
X
FMX
FMX
FMX
FMX
FMX
FMX
FMX
FMX
FMX
FMX
FMX
FMX
FMX
FMX
FMX
FMX
FMX
FMX
FMX
SSX
SSX
SSX
SSX
SSX
SSX
SSX
SSX
SSX
SSX
SSX
SSX
SSX
1
5
10
5
0
20
15
10
30
25
20
35
3
0
2
5
3
5
2
0
1
5
1
0
WX
WX
WX
WX
WX
WX
WX
25
40
3
5
UPLANDS SITE PLAN
PND PROJECT NO.:APPROVED:DRAWN:
DESIGN: CHECKED:
SCALE:
DATE:
SHEET TITLE:
9360 Glacier Highway Ste 100Juneau, Alaska 99801
www.pndengineers.comFax: 907-586-2099Phone: 907-586-2093 60% DESIGN
SUBMITTAL
C.A.N. NO.:
NOAA FAIRWEATHER HOMEPORT
RECAPITALIZATION PROJECT
E NN G I E E R S I NC, .
C1.01
A
C1.03
TRANSFER BRIDGECONCRETE ABUTMENT
TRANSFER BRIDGE
RELOCATED FUEL TANK ON8'x12'x8"t RAISED CONC PAD
NOAA OFFICE BUILDING
BOAT LAUNCH RAMP
(E)WAREHOUSE
BLDG
PAVEDUPLANDS STAGING & PARKING AREA
STEDMAN STREET
(E)RETAININGWALL
(E)ARMORROCKSLOPE
NORTHLANDTERMINAL
E
F
3' CONCRETEBORDER, TYP.
6' CONCRETEWALKWAY, TYP.
EXISTING GROUNDCONTOUR, TYP.
EXISTING FENCETO REMAIN
PETROMARINE
TERMINAL
8'SECURITYFENCE,TYP.
(E) ROCKERYWALL TO REMAIN
8' SECURITY FENCE,TYP.
(E) CONC. RET. WALLTO REMAIN
(E) GRASS & LANDSCAPINGTO REMAIN, TYP.
ROCK MULCH
ELECTRICAL EQUIP.ON RAISEDCONCRETE PAD,SEE ELECTRICAL
F
(E) PIPEBOLLARDS
M / C
UTILITYISLAND
6' CONCRETE SIDEWALK,TYP.
E E EE
E
I
III
IIIII
9' x 18' PARKING STALL,TYP.
(E) DUMPSTER ON FLUSH8'x13'x6"t CONC. PAD
(E) BOLLARDS TOREMAIN, TYP.
LUMINAIRE, TYP.SEE ELECTRICAL
S
SEWER LIFT STATION
FDC
OIL/ WATERSEPARATOR
D
ENDSECURITYFENCE
PRE-CAST CONC. BUMPERCURB, TYP. (7) EA
CANTILEVEREDGATE
CANTILEVEREDGATE
1
2
3
45
6
END SECURITY FENCE

POINT LAYOUT TABLES
PND PROJECT NO.:APPROVED:DRAWN:
DESIGN: CHECKED:
SCALE:
DATE:
SHEET TITLE:
9360 Glacier Highway Ste 100Juneau, Alaska 99801
www.pndengineers.comFax: 907-586-2099Phone: 907-586-2093 60% DESIGN
SUBMITTAL
C.A.N. NO.:
NOAA FAIRWEATHER HOMEPORT
RECAPITALIZATION PROJECT
E NN G I E E R S I NC, .
C1.02
POINT LAYOUT TABLE
POINT NORTHING EASTINGELEV.(FEET) DESCRIPTION
1 .. .. .. ..
2 .. .. .. ..
3 .. .. .. ..
4 .. .. .. ..
5 .. .. .. ..
6 .. .. .. ..
7 .. .. .. ..
8 .. .. .. ..
9 .. .. .. ..
10 .. .. .. ..
11 .. .. .. ..
12 .. .. .. ..
13 .. .. .. ..
14 .. .. .. ..
15 .. .. .. ..
16 .. .. .. ..
17 .. .. .. ..
18 .. .. .. ..
19 .. .. .. ..
20 .. .. .. ..
21 .. .. .. ..
22 .. .. .. ..
23 .. .. .. ..
24 .. .. .. ..
25 .. .. .. ..
26 .. .. .. ..
27 .. .. .. ..
28 .. .. .. ..
29 .. .. .. ..
30 .. .. .. ..
·
··
··
··
·
··
··
·
POINT TABLE ABBREVIATIONS:
NOTE:
POINT LAYOUT TABLE (CONT.)
POINT NORTHING EASTINGELEV.(FEET) DESCRIPTION
31 .. .. .. ..
32 .. .. .. ..
33 .. .. .. ..
34 .. .. .. ..
35 .. .. .. ..
36 .. .. .. ..
37 .. .. .. ..
38 .. .. .. ..
39 .. .. .. ..
40 .. .. .. ..
41 .. .. .. ..
42 .. .. .. ..
43 .. .. .. ..
44 .. .. .. ..
45 .. .. .. ..
46 .. .. .. ..
47 .. .. .. ..
48 .. .. .. ..
49 .. .. .. ..
50 .. .. .. ..
51 .. .. .. ..
52 .. .. .. ..
53 .. .. .. ..
54 .. .. .. ..
55 .. .. .. ..
56 .. .. .. ..
57 .. .. .. ..
58 .. .. .. ..
59 .. .. .. ..
60 .. .. .. ..
NOTES :
LUMINAIRE POINT LAYOUT TABLE
POINT NORTHING EASTING FND TYPE
1 1285123.86 3109977.39 CONCRETE BASE
2 1285112.68 3110087.19 CONCRETE BASE
3 1284943.00 3110221.50 CONCRETE BASE
4 1284912.48 3110112.16 CONCRETE BASE
5 1284970.64 3110042.07 CONCRETE BASE
6 1285037.51 3109996.88 CONCRETE BASE

??
?
??
KTN
B-4
KTN
B-3
?
A
B
CD
E
F
B
A
TYPICAL SECTIONS
PND PROJECT NO.:APPROVED:DRAWN:
DESIGN: CHECKED:
SCALE:
DATE:
SHEET TITLE:
9360 Glacier Highway Ste 100Juneau, Alaska 99801
www.pndengineers.comFax: 907-586-2099Phone: 907-586-2093 60% DESIGN
SUBMITTAL
C.A.N. NO.:
NOAA FAIRWEATHER HOMEPORT
RECAPITALIZATION PROJECT
E NN G I E E R S I NC, .
C1.03
TYPICAL SECTION
A
C1.01
MATERIAL SCHEDULE
SYMBOL MATERIAL DESCRIPTION
A
B
C
D
E
F
TYPICAL SITE GRADING SECTION

TYPE I CURB AND GUTTER
TYPE III CURB - VERTICAL
TYPE II GUTTER - VALLEY
PRECAST CONCRETE BUMPER CURB
DETAIL
CIVIL DETAILS
PND PROJECT NO.:APPROVED:DRAWN:
DESIGN: CHECKED:
SCALE:
DATE:
SHEET TITLE:
9360 Glacier Highway Ste 100Juneau, Alaska 99801
www.pndengineers.comFax: 907-586-2099Phone: 907-586-2093 60% DESIGN
SUBMITTAL
C.A.N. NO.:
NOAA FAIRWEATHER HOMEPORT
RECAPITALIZATION PROJECT
E NN G I E E R S I NC, .
C1.04
CONCRETE SIDEWALK @ BUILDING
CONTROL JOINT
EXPANSION JOINT
PIPE BOLLARD DETAIL

FENCE DETAILS
PND PROJECT NO.:APPROVED:DRAWN:
DESIGN: CHECKED:
SCALE:
DATE:
SHEET TITLE:
9360 Glacier Highway Ste 100Juneau, Alaska 99801
www.pndengineers.comFax: 907-586-2099Phone: 907-586-2093 60% DESIGN
SUBMITTAL
C.A.N. NO.:
NOAA FAIRWEATHER HOMEPORT
RECAPITALIZATION PROJECT
E NN G I E E R S I NC, .
C1.05
LINE POST TOP
CONCRETE POST SETTING
PIPE STYLE POST TOP
TYPICAL FENCE SECTION TYPICAL PULL POST TYPICAL CORNER OR TERMINAL POST
NOTES:
X
X
X
FENCE SECTION

PEDESTRIAN VEHICLE
LIFT MASTERSL 3000
GATE DETAILS
PND PROJECT NO.:APPROVED:DRAWN:
DESIGN: CHECKED:
SCALE:
DATE:
SHEET TITLE:
9360 Glacier Highway Ste 100Juneau, Alaska 99801
www.pndengineers.comFax: 907-586-2099Phone: 907-586-2093 60% DESIGN
SUBMITTAL
C.A.N. NO.:
NOAA FAIRWEATHER HOMEPORT
RECAPITALIZATION PROJECT
E NN G I E E R S I NC, .
C1.06
MAIN ENTRANCE GATE PLAN
SERVICE GATE PLAN
KEY PAD AND PEDESTAL DETAILS
LOOP DETECTOR
DETAIL
B
A
CANTILEVER GATE
ELEVATION
-B-
A
-A
GATE OPERATOR & FOUNDATION
DETAIL
-B

FMX
FMX
FMX
FMX
FMX
FMX
FMX
FMX
FMX
FMX
FMX
FMX
FMX
SSX
SSX
SSX
SSX
SSX
SSX
SSX
SSX
SSX
SSX
SSX
25
20
25
30
20
1
5
1
0
1
5
1
0
5
P5
P1P3
P4
P2
PARTIAL SITE AND
STORM DRAIN PLAN
PND PROJECT NO.:APPROVED:DRAWN:
DESIGN: CHECKED:
SCALE:
DATE:
SHEET TITLE:
9360 Glacier Highway Ste 100Juneau, Alaska 99801
www.pndengineers.comFax: 907-586-2099Phone: 907-586-2093 60% DESIGN
SUBMITTAL
C.A.N. NO.:
NOAA FAIRWEATHER HOMEPORT
RECAPITALIZATION PROJECT
E NN G I E E R S I NC, .
C1.07
3"H x 6"L SCUPPER OPENINGTHRU CONCRETE WALL, TYP.(2) EA.
ELECTRICAL UTILITY VAULT
S2S4
TRENCH DRAIN
TRANSFER BRIDGECONCRETE ABUTMENT
CLASS II ARMOR ROCKSPLASH PAD, 10'x15'x2't
S3
LUMINAIRE, TYP.SEE ELECTRICAL
S1
S5
STORM DRAIN STRUCTURES
STRUCTUREDESIGNATION NORTHING EASTING R.E. (FT) DESCRIPTION
S1
S2
S3
S4
S5
CIFG = CURB INLET FRAME & GRATECB = CATCH BASINFG = FRAME & GRATEOWS = OIL WATER SEPARATOR
RE = RIM ELEVATIONTD = TRENCH DRAINVGIFG = VALLEY GUTTER INLET FRAME & GRATE
STORM DRAIN PIPING
PIPE DESIGNATION NOMINAL Ø LENGTH (LF) FROM I.E. (FT) TO IE
P1
P2
P3
P4
P5
CPP = CORRUGATED POLYETHYLENE PIPE, TYPE S
OIL/ WATERSEPARATORE
4" WHITE STRIPE, TYP.
LS
PARTIAL SITE PLAN

CATCH BASIN DETAILS
CATCH BASIN
ADJUSTING RING
TOP SLAB
CURB INLET
FRAME AND GRATE
OIL WATER SEPARATOR, TYPE I
PLAN VIEW
SECTION THRU CHAMBER
STORM DRAIN DETAILS
PND PROJECT NO.:APPROVED:DRAWN:
DESIGN: CHECKED:
SCALE:
DATE:
SHEET TITLE:
9360 Glacier Highway Ste 100Juneau, Alaska 99801
www.pndengineers.comFax: 907-586-2099Phone: 907-586-2093 60% DESIGN
SUBMITTAL
C.A.N. NO.:
NOAA FAIRWEATHER HOMEPORT
RECAPITALIZATION PROJECT
E NN G I E E R S I NC, .
C1.08
TRENCH DRAIN DETAILS
TRENCH DRAIN PROFILE

SSX
SSX
SSX
SSX
SSX
SSX
SSX
WX
WX
WX
WX
WX
WX
WX
WX
WX
3
5
2
0
15
10
5
0
-5
-
1
0
-
1
5
-30
-
1
0
5
0
-
2
0
-
2
5
BOAT LAUNCH RAMP
PLAN & PROFILE
PND PROJECT NO.:APPROVED:DRAWN:
DESIGN: CHECKED:
SCALE:
DATE:
SHEET TITLE:
9360 Glacier Highway Ste 100Juneau, Alaska 99801
www.pndengineers.comFax: 907-586-2099Phone: 907-586-2093 60% DESIGN
SUBMITTAL
C.A.N. NO.:
NOAA FAIRWEATHER HOMEPORT
RECAPITALIZATION PROJECT
E NN G I E E R S I NC, .
C2.01
BOAT LAUNCH RAMP PLAN
BOAT LAUNCH RAMP PROFILE
C2.02A
C2.02B
GUIDE MARKER PIPE DETAIL
(1) EA REQ'D

BOAT LAUNCH RAMP
TYPICAL SECTIONS
PND PROJECT NO.:APPROVED:DRAWN:
DESIGN: CHECKED:
SCALE:
DATE:
SHEET TITLE:
9360 Glacier Highway Ste 100Juneau, Alaska 99801
www.pndengineers.comFax: 907-586-2099Phone: 907-586-2093 60% DESIGN
SUBMITTAL
C.A.N. NO.:
NOAA FAIRWEATHER HOMEPORT
RECAPITALIZATION PROJECT
E NN G I E E R S I NC, .
C2.02
A
B
TYPICAL SECTION
ARMOR ROCK TOE APRON
TYPICAL SECTION
BOAT LAUNCH RAMP

PLAN
PROFILE
TYPICAL RAMP PLANK SECTION
CONNECTION PLATE DETAIL
SLEEPER END TAB DETAIL
SLEEPER SPLICE DETAIL
PLAN
PROFILE
BOAT LAUNCH RAMP
PLANK & SLEEPER DETAILS
PND PROJECT NO.:APPROVED:DRAWN:
DESIGN: CHECKED:
SCALE:
DATE:
SHEET TITLE:
9360 Glacier Highway Ste 100Juneau, Alaska 99801
www.pndengineers.comFax: 907-586-2099Phone: 907-586-2093 60% DESIGN
SUBMITTAL
C.A.N. NO.:
NOAA FAIRWEATHER HOMEPORT
RECAPITALIZATION PROJECT
E NN G I E E R S I NC, .
C2.03
CONCRETE RAMP PLANKS - PLAN

BOAT LAUNCH RAMP
APRON DETAILS
PND PROJECT NO.:APPROVED:DRAWN:
DESIGN: CHECKED:
SCALE:
DATE:
SHEET TITLE:
9360 Glacier Highway Ste 100Juneau, Alaska 99801
www.pndengineers.comFax: 907-586-2099Phone: 907-586-2093 60% DESIGN
SUBMITTAL
C.A.N. NO.:
NOAA FAIRWEATHER HOMEPORT
RECAPITALIZATION PROJECT
E NN G I E E R S I NC, .
C2.04
CONCRETE APRON ON -15% SLOPE PLAN
A
CONCRETE APRON -TYPICAL SECTION
B
NOTES:
NOTE:
-A
-B
APRON PROFILE VIEW

SSX
SSX
SSX
SSX
SS XSS
XSS
XSS
XSS
XSS
XSS X
SS XSS X
SSX
SSX
SSX
SS XSS
XSS
X
WX
WX
W XW X
W XW X
W XW X
W XW
XW X
W XW X W
XW X
WX
W XW
W XW X
W X
W X
W X
FMX
FMX
FMX
FMX
FMX
SSX
SSX
SSX
0
0
5
10
1
5
20
25
3
0
5
10
1
5
5
1
0
1
0
1
5
2
0
3
5
2
5
3
035
10
0
-10
-15
-
2
0
-2
5
-3
0
-3
5
-4
0
-4
5
-
5
0
-
5
5
-5
-10
-1
5
-2
0
-2
5
-3
0
-3
5
-40
-
5
-4
5
40
FMX
FMX
FMX
FMX
FMX
E
F F
E WSSW E
E
S
WX
WX
FN
FN
FN
FN
FN
W
FMN
FMN
FMN
FMN
FMN
FMN
FMN
FMN
FMN
FMN
FN
FN
FN
FN
FN
FN
FN
FN
FN
FN
FMN
FMN
FMN
FMN
FMN
SDN SD N SDN
SDNSD
N
CIVIL UTILITIES
SCHEMATIC PLAN
PND PROJECT NO.:APPROVED:DRAWN:
DESIGN: CHECKED:
SCALE:
DATE:
SHEET TITLE:
9360 Glacier Highway Ste 100Juneau, Alaska 99801
www.pndengineers.comFax: 907-586-2099Phone: 907-586-2093 60% DESIGN
SUBMITTAL
C.A.N. NO.:
NOAA FAIRWEATHER HOMEPORT
RECAPITALIZATION PROJECT
E NN G I E E R S I NC, .
C3.01
LEGEND:
FDC
LS #2
LS #1
FMN
FN
CTEFDC
LSCO
CO
KEY NOTES:
ALL EXPOSED PIPING AND HOSES ON TRANSFER BRIDGE AND MAINFLOATING DOCK SHALL BE HEAT TRACED & INSULATED.WATER 3"FIRE 4"SEWER 3"
LS#1 - PERISTALTIC PUMP ASSEMBLY IN HEATED & INSULATEDENCLOSURE.
LS#2 - DUPLEX SUBMERSIBLE GRINDER PUMPS IN WET WELL.
EXISTING 3" FORCEMAIN IS SLIP LINED THROUGH EXISTING 6" SERVICELINE. SLIP LINE NEW 1.5" HDPE FORCEMAIN THROUGH 6" SERVICE LINEADJACENT TO EXISTING 3" FORCEMAIN & TERMINATE AT APPROXIMATESAME LOCATION WITHIN MANHOLE.
SEE BUILDING MECHANICAL DRAWINGS FOR INTERNAL PIPING.
FLEXIBLE HOSE CONNECTIONS AT BOTTOM OF TRANSFER BRIDGE ARESUBMERGED.
6
1
2
3
4
5
2
4
F
W
S
E
5
3
4
6
F
C3.02
E
C3.02
A
C3.03A
A
C3.03
1

UPLAND UTILITIES DETAILS
PND PROJECT NO.:APPROVED:DRAWN:
DESIGN: CHECKED:
SCALE:
DATE:
SHEET TITLE:
9360 Glacier Highway Ste 100Juneau, Alaska 99801
www.pndengineers.comFax: 907-586-2099Phone: 907-586-2093 60% DESIGN
SUBMITTAL
C.A.N. NO.:
NOAA FAIRWEATHER HOMEPORT
RECAPITALIZATION PROJECT
E NN G I E E R S I NC, .
C3.02
A
-
UPLAND LIFT STATION SECTION
E
-
WATER SERVICE CONNECTION DETAIL
D
-
TEE THRUST BLOCK DETAIL
FIRE LINE INLET CONNECTION DETAIL
PIPE TRENCH DETAIL
WATER VALVE, BOX AND COVER DETAIL
B
-
C
-
F
-

PND PROJECT NO.:APPROVED:DRAWN:
DESIGN: CHECKED:
SCALE:
DATE:
SHEET TITLE:
9360 Glacier Highway Ste 100Juneau, Alaska 99801
www.pndengineers.comFax: 907-586-2099Phone: 907-586-2093 60% DESIGN
SUBMITTAL
C.A.N. NO.:
NOAA FAIRWEATHER HOMEPORT
RECAPITALIZATION PROJECT
E NN G I E E R S I NC, .
C3.03
A
C3.01
TRANSFER BRIDGE UTILITY ROUTING
DETAIL
UTILITIES TRANSFER BRIDGE DETAILS
B
-
INSULATED FLEXIBLE HOSE
DETAIL
B
-
NOTE:
SHEETS C3.03 AND C3.03A DISPLAY ALTERNATE TRANSFER
BRIDGE PIPE ROUTING FOR PLAN REVIEW SET ONLY.

PND PROJECT NO.:APPROVED:DRAWN:
DESIGN: CHECKED:
SCALE:
DATE:
SHEET TITLE:
9360 Glacier Highway Ste 100Juneau, Alaska 99801
www.pndengineers.comFax: 907-586-2099Phone: 907-586-2093 60% DESIGN
SUBMITTAL
C.A.N. NO.:
NOAA FAIRWEATHER HOMEPORT
RECAPITALIZATION PROJECT
E NN G I E E R S I NC, .
C3.03A
UTILITIES TRANSFER BRIDGE DETAILS
ALTERNATE
B
-
B
-
A
C3.01
TRANSFER BRIDGE UTILITY ROUTING
DETAIL
B
-
INSULATED FLEXIBLE HOSE
DETAIL
NOTE:
SHEETS C3.03 AND C3.03A DISPLAY ALTERNATE TRANSFER
BRIDGE PIPE ROUTING FOR PLAN REVIEW SET ONLY.
ALTERNATE

PND PROJECT NO.:APPROVED:DRAWN:
DESIGN: CHECKED:
SCALE:
DATE:
SHEET TITLE:
9360 Glacier Highway Ste 100Juneau, Alaska 99801
www.pndengineers.comFax: 907-586-2099Phone: 907-586-2093 60% DESIGN
SUBMITTAL
C.A.N. NO.:
NOAA FAIRWEATHER HOMEPORT
RECAPITALIZATION PROJECT
E NN G I E E R S I NC, .
C3.04
A
-
PIPE MOUNTING
DETAIL
B
-
PIPE MOUNTING
DETAIL
C
-
FLOAT WATER & FIRE HOSE
CONNECTION DETAIL
D
-
FLOAT SEWER HOSE
CONNECTION DETAIL
C
-
E
3.05
B
-
B
-
A
-
FLOAT PIPE ROUTING PLAN
FLOATING DOCK PIPE ROUTING DETAILS
D
-
NOTE:
SHEETS C3.04 AND C3.04A DISPLAY ALTERNATE TRANSFER
BRIDGE PIPE ROUTING FOR PLAN REVIEW SET ONLY.

PND PROJECT NO.:APPROVED:DRAWN:
DESIGN: CHECKED:
SCALE:
DATE:
SHEET TITLE:
9360 Glacier Highway Ste 100Juneau, Alaska 99801
www.pndengineers.comFax: 907-586-2099Phone: 907-586-2093 60% DESIGN
SUBMITTAL
C.A.N. NO.:
NOAA FAIRWEATHER HOMEPORT
RECAPITALIZATION PROJECT
E NN G I E E R S I NC, .
C3.04A
A
-
PIPE MOUNTING
DETAIL
B
-
PIPE MOUNTING
DETAIL
C
-
FLOAT WATER & FIRE HOSE
CONNECTION DETAIL
D
-
FLOAT SEWER HOSE
CONNECTION DETAIL
C
-
E
3.05
B
-
B
-
A
-
FLOAT PIPE ROUTING PLAN
FLOATING DOCK PIPE ROUTING DETAILS
ALTERNATE
D
-
NOTE:
SHEETS C3.03 AND C3.03A DISPLAY ALTERNATE TRANSFER
BRIDGE PIPE ROUTING FOR PLAN REVIEW SET ONLY.
ALTERNATE

PND PROJECT NO.:APPROVED:DRAWN:
DESIGN: CHECKED:
SCALE:
DATE:
SHEET TITLE:
9360 Glacier Highway Ste 100Juneau, Alaska 99801
www.pndengineers.comFax: 907-586-2099Phone: 907-586-2093 60% DESIGN
SUBMITTAL
C.A.N. NO.:
NOAA FAIRWEATHER HOMEPORT
RECAPITALIZATION PROJECT
E NN G I E E R S I NC, .
C3.05
FLOATING DOCK UTILITIES DETAILS
SMALL VESSEL FLOAT WATER PEDESTAL MOUNTING
DETAIL
SMALL VESSEL FLOAT WATER PEDESTAL
DETAIL
SUBMERGED ARCTIC PIPE DETAIL
DETAIL
E
C3.04
FIRE LINE HANGER DETAIL

PND PROJECT NO.:APPROVED:DRAWN:
DESIGN: CHECKED:
SCALE:
DATE:
SHEET TITLE:
9360 Glacier Highway Ste 100Juneau, Alaska 99801
www.pndengineers.comFax: 907-586-2099Phone: 907-586-2093 60% DESIGN
SUBMITTAL
C.A.N. NO.:
NOAA FAIRWEATHER HOMEPORT
RECAPITALIZATION PROJECT
E NN G I E E R S I NC, .
C3.06
FLOATING DOCK UTILITIES DETAILS
SHIP WATER SERVICE DETAIL
A
-
FIRE PEDESTAL CAP
DETAIL
FIRE PEDESTAL DETAIL
A
-
SHIP SEWER REMOTE PUMPING CENTER
ELEVATION

TRANSFER BRIDGE ABUTMENT PLAN
PND PROJECT NO.:APPROVED:DRAWN:
DESIGN: CHECKED:SCALE:
DATE:
SHEET TITLE:
9360 Glacier Highway Ste 100Juneau, Alaska 99801
www.pndengineers.comFax: 907-586-2099Phone: 907-586-2093
60% DESIGNSUBMITTAL
C.A.N. NO.:
NOAA FAIRWEATHER HOMEPORTRECAPITALIZATION PROJECT
E NN G I E E R S I NC, .
S1.01
ABUTMENT PLAN
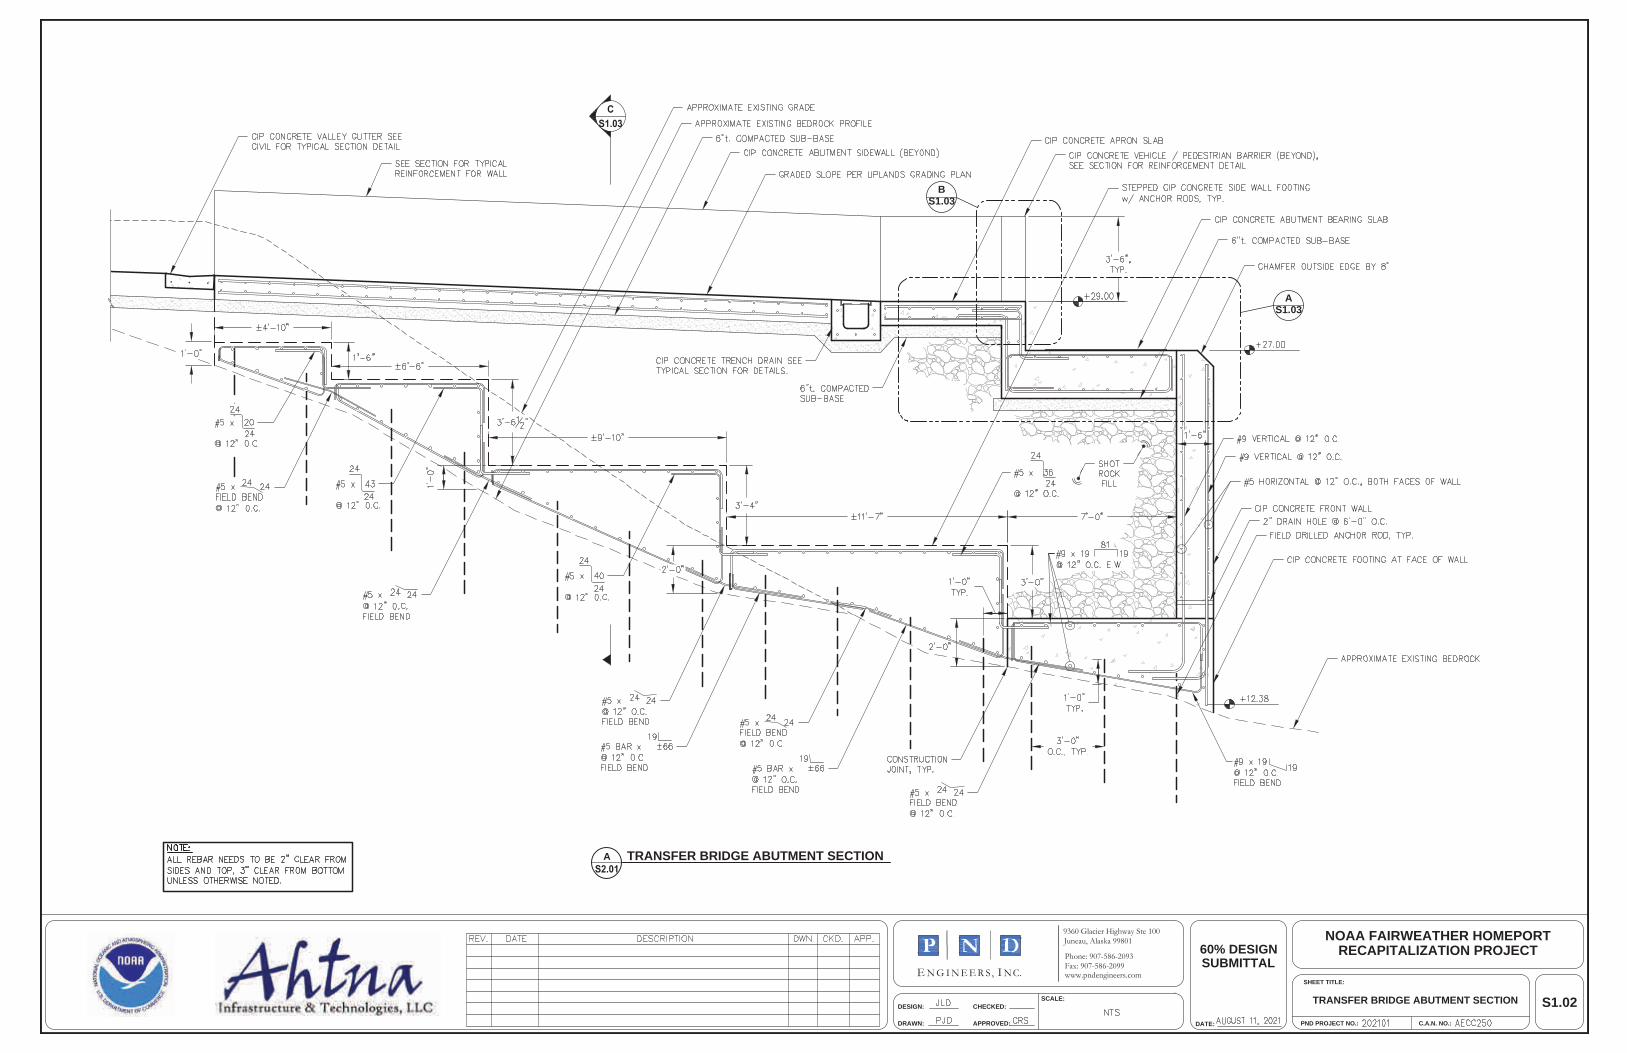
PND PROJECT NO.:APPROVED:DRAWN:
DESIGN: CHECKED:SCALE:
DATE:
SHEET TITLE:
9360 Glacier Highway Ste 100Juneau, Alaska 99801
www.pndengineers.comFax: 907-586-2099Phone: 907-586-2093
60% DESIGNSUBMITTAL
C.A.N. NO.:
NOAA FAIRWEATHER HOMEPORTRECAPITALIZATION PROJECT
E NN G I E E R S I NC, .
S1.02
A TRANSFER BRIDGE ABUTMENT SECTION
AS1.03
BS1.03
TRANSFER BRIDGE ABUTMENT SECTION

PND PROJECT NO.:APPROVED:DRAWN:
DESIGN: CHECKED:SCALE:
DATE:
SHEET TITLE:
9360 Glacier Highway Ste 100Juneau, Alaska 99801
www.pndengineers.comFax: 907-586-2099Phone: 907-586-2093
60% DESIGNSUBMITTAL
C.A.N. NO.:
NOAA FAIRWEATHER HOMEPORTRECAPITALIZATION PROJECT
E NN G I E E R S I NC, .
S1.03
A BRIDGE FOUNDATION SECTION
B VEHICLE BARRIER SECTION
C
D SECTION - ROCK ANCHOR TYPICAL E SECTION - ROCK ANCHOR TYPICAL
TYPICAL SIDEWALL SECTION
TRANSFER BRIDGE ABUTMENT DETAILS
F SCUPPER DRAIN DETAIL
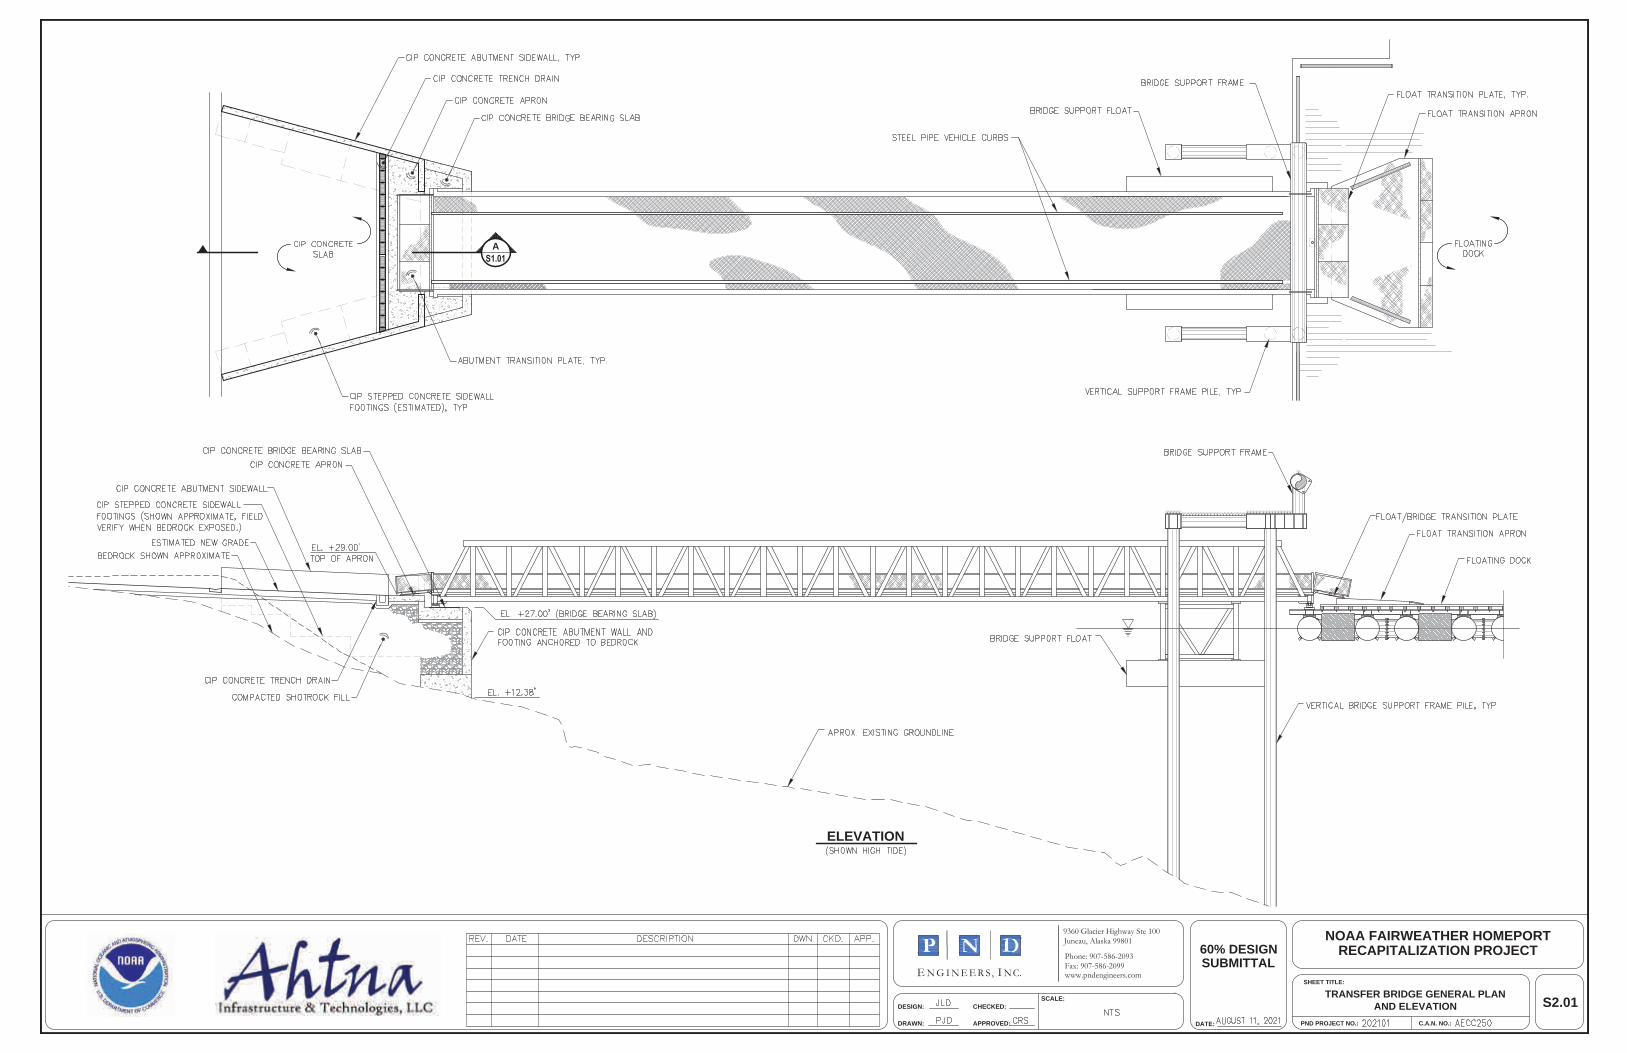
ELEVATION
TRANSFER BRIDGE GENERAL PLANAND ELEVATION
PND PROJECT NO.:APPROVED:DRAWN:
DESIGN: CHECKED:SCALE:
DATE:
SHEET TITLE:
9360 Glacier Highway Ste 100Juneau, Alaska 99801
www.pndengineers.comFax: 907-586-2099Phone: 907-586-2093
60% DESIGNSUBMITTAL
C.A.N. NO.:
NOAA FAIRWEATHER HOMEPORTRECAPITALIZATION PROJECT
E NN G I E E R S I NC, .
S2.01
A

BRIDGE PLAN AND ELEVATION
PND PROJECT NO.:APPROVED:DRAWN:
DESIGN: CHECKED:SCALE:
DATE:
SHEET TITLE:
9360 Glacier Highway Ste 100Juneau, Alaska 99801
www.pndengineers.comFax: 907-586-2099Phone: 907-586-2093
60% DESIGNSUBMITTAL
C.A.N. NO.:
NOAA FAIRWEATHER HOMEPORTRECAPITALIZATION PROJECT
E NN G I E E R S I NC, .
S2.02
FLOOR PLAN
ELEVATION

-A
TYPICAL SECTION
A-
SECTION AT FLOOR BEAM DECK CONNECTIONFENCE FRAME - ELEVATION
-B
B-
FENCE FRAME - SECTION
TYPICAL SECTION AND DETAILS
PND PROJECT NO.:APPROVED:DRAWN:
DESIGN: CHECKED:SCALE:
DATE:
SHEET TITLE:
9360 Glacier Highway Ste 100Juneau, Alaska 99801
www.pndengineers.comFax: 907-586-2099Phone: 907-586-2093
60% DESIGNSUBMITTAL
C.A.N. NO.:
NOAA FAIRWEATHER HOMEPORTRECAPITALIZATION PROJECT
E NN G I E E R S I NC, .
S2.03
CURB CONNECTION - ELEVATION

END BEAM - ELEVATION
-A
-B
CENTER BEARING - SECTIONA-
SLIDE BEARING - SECTIONB-
END BEAM DETAILS
PND PROJECT NO.:APPROVED:DRAWN:
DESIGN: CHECKED:SCALE:
DATE:
SHEET TITLE:
9360 Glacier Highway Ste 100Juneau, Alaska 99801
www.pndengineers.comFax: 907-586-2099Phone: 907-586-2093
60% DESIGNSUBMITTAL
C.A.N. NO.:
NOAA FAIRWEATHER HOMEPORTRECAPITALIZATION PROJECT
E NN G I E E R S I NC, .
S2.04

SLIDE BEARING - ELEVATION
SLIDE BEARING - PLAN
ROCKER PLATE - ELEVATION
FLOAT SUPPORT BEAM BEARING - ELEVATION
-B
CENTER BEARING SLIDE BEARING
-A
ROCKER PLATE - ELEVATIONCENTER BEARING - SECTIONA
-SLIDE BEARING - SECTIONB
-
FLOAT BEARING DETAILS
PND PROJECT NO.:APPROVED:DRAWN:
DESIGN: CHECKED:SCALE:
DATE:
SHEET TITLE:
9360 Glacier Highway Ste 100Juneau, Alaska 99801
www.pndengineers.comFax: 907-586-2099Phone: 907-586-2093
60% DESIGNSUBMITTAL
C.A.N. NO.:
NOAA FAIRWEATHER HOMEPORTRECAPITALIZATION PROJECT
E NN G I E E R S I NC, .
S2.05

SLIDE BEARING - FRONT ELEVATION
END BEAM PADEYE PADEYE - ELEVATION-A
SLIDE BEARING - SIDE ELEVATION
PONTOON PADEYE
-B
PADEYE - ELEVATION-B
SAFETY CHAIN DETAILS
PND PROJECT NO.:APPROVED:DRAWN:
DESIGN: CHECKED:SCALE:
DATE:
SHEET TITLE:
9360 Glacier Highway Ste 100Juneau, Alaska 99801
www.pndengineers.comFax: 907-586-2099Phone: 907-586-2093
60% DESIGNSUBMITTAL
C.A.N. NO.:
NOAA FAIRWEATHER HOMEPORTRECAPITALIZATION PROJECT
E NN G I E E R S I NC, .
S2.06

TRANSITION PLATE - PLAN
A-
B-
SECTIONA-
SECTIONB-
-C
SECTIONC-
TRANSITION PLATE DETAILS
PND PROJECT NO.:APPROVED:DRAWN:
DESIGN: CHECKED:SCALE:
DATE:
SHEET TITLE:
9360 Glacier Highway Ste 100Juneau, Alaska 99801
www.pndengineers.comFax: 907-586-2099Phone: 907-586-2093
60% DESIGNSUBMITTAL
C.A.N. NO.:
NOAA FAIRWEATHER HOMEPORTRECAPITALIZATION PROJECT
E NN G I E E R S I NC, .
S2.07

SUPPORT FLOAT - FRAMING PLAN
2.05A
2.05B
-C
-D
C-
SECTION
D-
SECTION
COUPLER - SECTION
BRIDGE SUPPORT FLOAT
PND PROJECT NO.:APPROVED:DRAWN:
DESIGN: CHECKED:SCALE:
DATE:
SHEET TITLE:
9360 Glacier Highway Ste 100Juneau, Alaska 99801
www.pndengineers.comFax: 907-586-2099Phone: 907-586-2093
60% DESIGNSUBMITTAL
C.A.N. NO.:
NOAA FAIRWEATHER HOMEPORTRECAPITALIZATION PROJECT
E NN G I E E R S I NC, .
S2.08

SECTIONA2.04
B2.04
SECTION
BASE PLATE - TYPICAL SECTIONANODE DETAIL BASE PLATE - PLAN
BRIDGE SUPPORT FLOAT
PND PROJECT NO.:APPROVED:DRAWN:
DESIGN: CHECKED:SCALE:
DATE:
SHEET TITLE:
9360 Glacier Highway Ste 100Juneau, Alaska 99801
www.pndengineers.comFax: 907-586-2099Phone: 907-586-2093
60% DESIGNSUBMITTAL
C.A.N. NO.:
NOAA FAIRWEATHER HOMEPORTRECAPITALIZATION PROJECT
E NN G I E E R S I NC, .
S2.09

FLOATING DOCK PLAN
3.02B
-A
PND PROJECT NO.:APPROVED:DRAWN:
DESIGN: CHECKED:SCALE:
DATE:
SHEET TITLE:
9360 Glacier Highway Ste 100Juneau, Alaska 99801
www.pndengineers.comFax: 907-586-2099Phone: 907-586-2093
60% DESIGNSUBMITTAL
C.A.N. NO.:
NOAA FAIRWEATHER HOMEPORTRECAPITALIZATION PROJECT
E NN G I E E R S I NC, .
S3.01FLOATING DOCK PLAN AND SECTION
A-
FLOATING DOCK SECTION

FLOATING DOCK FRAMING PLAN
PND PROJECT NO.:APPROVED:DRAWN:
DESIGN: CHECKED:SCALE:
DATE:
SHEET TITLE:
9360 Glacier Highway Ste 100Juneau, Alaska 99801
www.pndengineers.comFax: 907-586-2099Phone: 907-586-2093
60% DESIGNSUBMITTAL
C.A.N. NO.:
NOAA FAIRWEATHER HOMEPORTRECAPITALIZATION PROJECT
E NN G I E E R S I NC, .
S3.02FLOATING DOCK FRAMING PLAN& TYPICAL SECTION
A
B
C
A1
B1
C1
A2
B2
C3
B2
C2
D
B2
-B
3.01A
A
B-
FLOATING DOCK SECTION

MODULE "A", "A1" AND "A2" - PLAN
A-
MODULE SECTION
-A
PND PROJECT NO.:APPROVED:DRAWN:
DESIGN: CHECKED:SCALE:
DATE:
SHEET TITLE:
9360 Glacier Highway Ste 100Juneau, Alaska 99801
www.pndengineers.comFax: 907-586-2099Phone: 907-586-2093
60% DESIGNSUBMITTAL
C.A.N. NO.:
NOAA FAIRWEATHER HOMEPORTRECAPITALIZATION PROJECT
E NN G I E E R S I NC, .
S3.03FLOAT MODULE "A", "A1" AND "A2"

PND PROJECT NO.:APPROVED:DRAWN:
DESIGN: CHECKED:SCALE:
DATE:
SHEET TITLE:
9360 Glacier Highway Ste 100Juneau, Alaska 99801
www.pndengineers.comFax: 907-586-2099Phone: 907-586-2093
60% DESIGNSUBMITTAL
C.A.N. NO.:
NOAA FAIRWEATHER HOMEPORTRECAPITALIZATION PROJECT
E NN G I E E R S I NC, .
S3.04FLOAT MODULE "B", "B1", AND "B2"
-A
MODULE "B", "B1" AND "B2" - PLAN
A-
MODULE SECTION
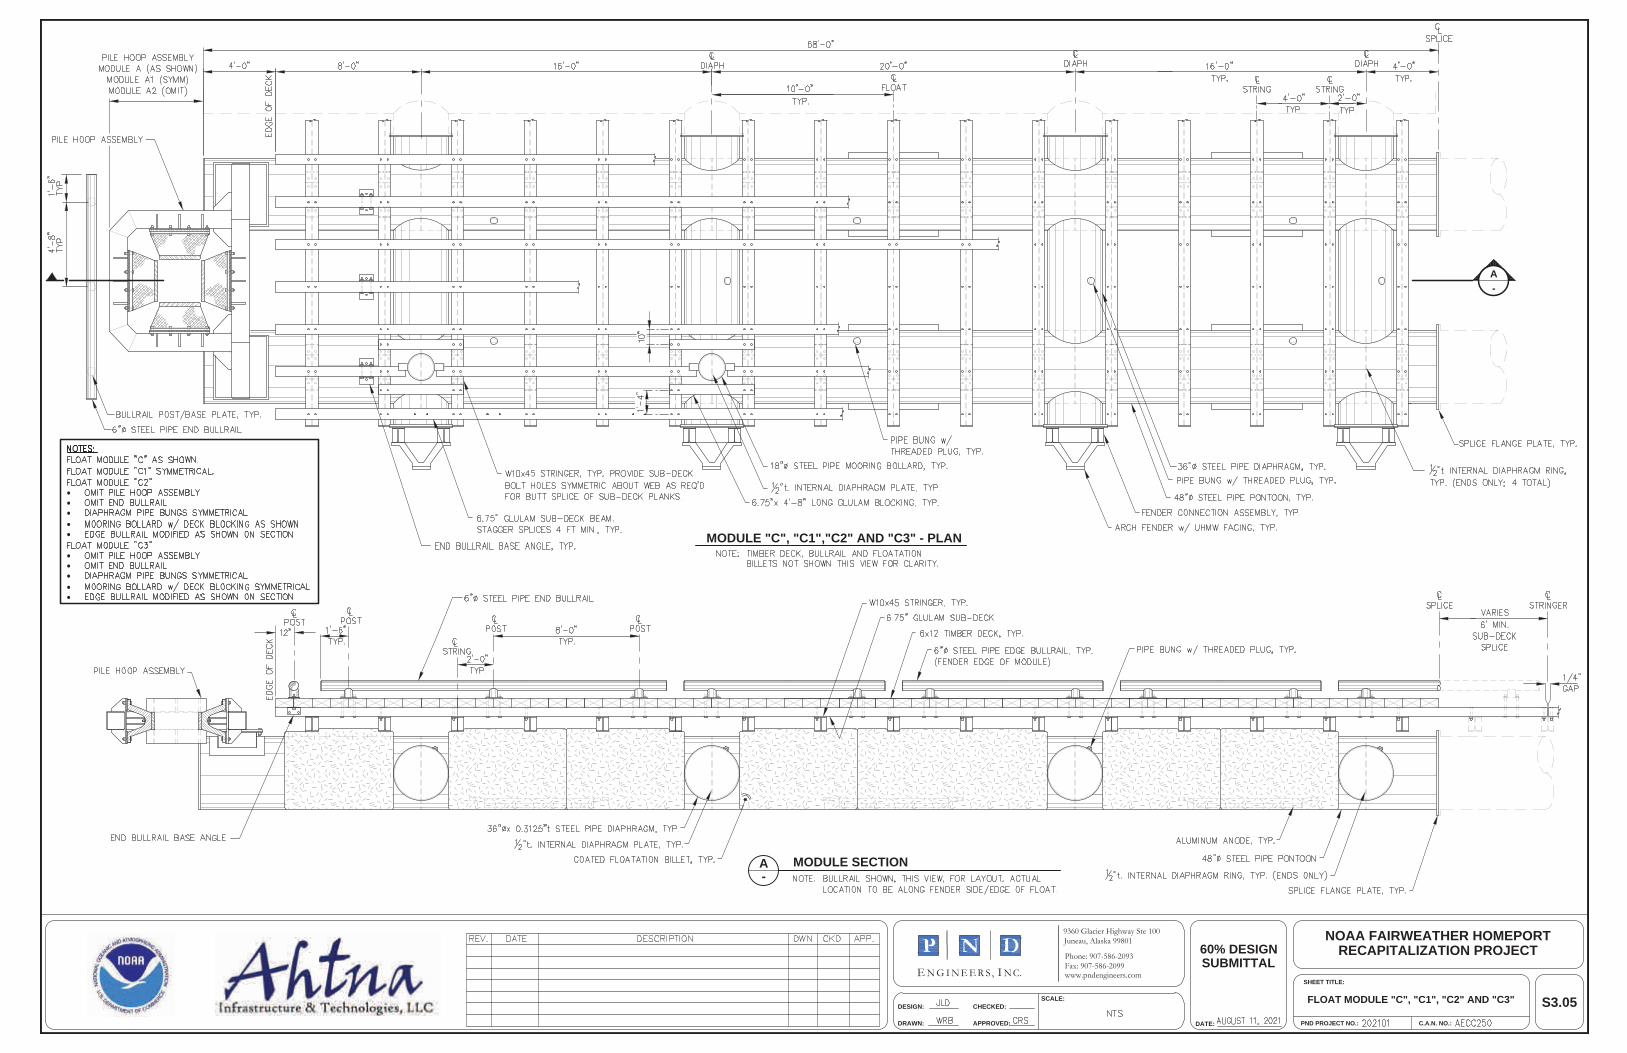
FLOAT MODULE "C", "C1", "C2" AND "C3"
PND PROJECT NO.:APPROVED:DRAWN:
DESIGN: CHECKED:SCALE:
DATE:
SHEET TITLE:
9360 Glacier Highway Ste 100Juneau, Alaska 99801
www.pndengineers.comFax: 907-586-2099Phone: 907-586-2093
60% DESIGNSUBMITTAL
C.A.N. NO.:
NOAA FAIRWEATHER HOMEPORTRECAPITALIZATION PROJECT
E NN G I E E R S I NC, .
S3.05
MODULE "C", "C1","C2" AND "C3" - PLAN
-A
A-
MODULE SECTION

FLOAT MODULE "D"
PND PROJECT NO.:APPROVED:DRAWN:
DESIGN: CHECKED:SCALE:
DATE:
SHEET TITLE:
9360 Glacier Highway Ste 100Juneau, Alaska 99801
www.pndengineers.comFax: 907-586-2099Phone: 907-586-2093
60% DESIGNSUBMITTAL
C.A.N. NO.:
NOAA FAIRWEATHER HOMEPORTRECAPITALIZATION PROJECT
E NN G I E E R S I NC, .
S3.06
MODULE "D" - PLAN
-A
A-
MODULE SECTION
3.07A

A-
SECTION AT CENTER BRIDGE SUPPORT BEAM
CENTER BEARING BEAM - SECTION
SLIDE BEARING BEAM - SECTION
PND PROJECT NO.:APPROVED:DRAWN:
DESIGN: CHECKED:SCALE:
DATE:
SHEET TITLE:
9360 Glacier Highway Ste 100Juneau, Alaska 99801
www.pndengineers.comFax: 907-586-2099Phone: 907-586-2093
60% DESIGNSUBMITTAL
C.A.N. NO.:
NOAA FAIRWEATHER HOMEPORTRECAPITALIZATION PROJECT
E NN G I E E R S I NC, .
S3.07BRIDGE SUPPORT BEAM

TYPICAL SECTIONC
TYPICAL SECTION
3.09A
B
TYPICAL SECTIONA
SADDLE WELDMENT
TYPICAL SECTIONS
PND PROJECT NO.:APPROVED:DRAWN:
DESIGN: CHECKED:SCALE:
DATE:
SHEET TITLE:
9360 Glacier Highway Ste 100Juneau, Alaska 99801
www.pndengineers.comFax: 907-586-2099Phone: 907-586-2093
60% DESIGNSUBMITTAL
C.A.N. NO.:
NOAA FAIRWEATHER HOMEPORTRECAPITALIZATION PROJECT
E NN G I E E R S I NC, .
S3.08

TYPICAL STEEL BULLRAIL - EDGE SECTION TYPICAL STEEL BULLRAIL - END SECTION
TYPICAL DECK CONNECTION
BULLRAIL BASE PLATE - PLAN END BULLRAIL CONNECTION ANGLE - PLAN
ELECTRICAL ACCESS PLATE - TYPE 1
A3.08
SECTION
FLOATING DOCK DETAILS
PND PROJECT NO.:APPROVED:DRAWN:
DESIGN: CHECKED:SCALE:
DATE:
SHEET TITLE:
9360 Glacier Highway Ste 100Juneau, Alaska 99801
www.pndengineers.comFax: 907-586-2099Phone: 907-586-2093
60% DESIGNSUBMITTAL
C.A.N. NO.:
NOAA FAIRWEATHER HOMEPORTRECAPITALIZATION PROJECT
E NN G I E E R S I NC, .
S3.09

SPLICE CONNECTION PLATE
AA
SECTION AA
ANODE DETAIL
SPLICE CONNECTION PLATE SECTION BB
TYPICAL SECTION - BOLLARD
FLOATING DOCK DETAILS
PND PROJECT NO.:APPROVED:DRAWN:
DESIGN: CHECKED:SCALE:
DATE:
SHEET TITLE:
9360 Glacier Highway Ste 100Juneau, Alaska 99801
www.pndengineers.comFax: 907-586-2099Phone: 907-586-2093
60% DESIGNSUBMITTAL
C.A.N. NO.:
NOAA FAIRWEATHER HOMEPORTRECAPITALIZATION PROJECT
E NN G I E E R S I NC, .
S3.10

PILE HOOP - PLAN
A-
B-
A-
SECTION
B-
SECTION
FENDER STIFFENER PLATE GUSSET PLATE INTERNAL STIFFENER PLATE
PILE HOOPS
PND PROJECT NO.:APPROVED:DRAWN:
DESIGN: CHECKED:SCALE:
DATE:
SHEET TITLE:
9360 Glacier Highway Ste 100Juneau, Alaska 99801
www.pndengineers.comFax: 907-586-2099Phone: 907-586-2093
60% DESIGNSUBMITTAL
C.A.N. NO.:
NOAA FAIRWEATHER HOMEPORTRECAPITALIZATION PROJECT
E NN G I E E R S I NC, .
S3.11

B-
A-
-C
TRANSITION APRON - PLAN
STEEL CURB
TRANSITION APRON CONNECTION ANGLE
TRANSITION PLATE
A-
SECTION
B-
SECTION
C-
SECTION
FLOATING DOCK TRANSITION APRON
PND PROJECT NO.:APPROVED:DRAWN:
DESIGN: CHECKED:SCALE:
DATE:
SHEET TITLE:
9360 Glacier Highway Ste 100Juneau, Alaska 99801
www.pndengineers.comFax: 907-586-2099Phone: 907-586-2093
60% DESIGNSUBMITTAL
C.A.N. NO.:
NOAA FAIRWEATHER HOMEPORTRECAPITALIZATION PROJECT
E NN G I E E R S I NC, .
S3.12

TYPICAL SECTION
TYPICAL PILE SPLICE WELD
ELEVATION
1
3
5
7
9
8
2
4
11
12
13
14
PILE LAYOUT - PLAN
6 10
NORTHWESTMOORINGPILE FRAME
SOUTHEASTMOORINGPILE FRAME
PILE SCHEDULE AND PILE DETAILS
PND PROJECT NO.:APPROVED:DRAWN:
DESIGN: CHECKED:SCALE:
DATE:
SHEET TITLE:
9360 Glacier Highway Ste 100Juneau, Alaska 99801
www.pndengineers.comFax: 907-586-2099Phone: 907-586-2093
60% DESIGNSUBMITTAL
C.A.N. NO.:
NOAA FAIRWEATHER HOMEPORTRECAPITALIZATION PROJECT
E NN G I E E R S I NC, .
S3.13
SOCKETED MOORING PILE

EAST/WEST MOORING FRAME - ELEVATION
-A
A-
SECTION PILE CAP A - BOTTOM PLATE PLAN
NW / SE MOORING FRAME DETAILS
PND PROJECT NO.:APPROVED:DRAWN:
DESIGN: CHECKED:SCALE:
DATE:
SHEET TITLE:
9360 Glacier Highway Ste 100Juneau, Alaska 99801
www.pndengineers.comFax: 907-586-2099Phone: 907-586-2093
60% DESIGNSUBMITTAL
C.A.N. NO.:
NOAA FAIRWEATHER HOMEPORTRECAPITALIZATION PROJECT
E NN G I E E R S I NC, .
S3.14

PILE CAP - BOTTOM PLATE PLAN
A-
SECTIONBRIDGE SUPPORT BEAM - ELEVATION
-A
PADEYE PLATE - ELEVATION
BRIDGE SUPPORT FRAME
PND PROJECT NO.:APPROVED:DRAWN:
DESIGN: CHECKED:SCALE:
DATE:
SHEET TITLE:
9360 Glacier Highway Ste 100Juneau, Alaska 99801
www.pndengineers.comFax: 907-586-2099Phone: 907-586-2093
60% DESIGNSUBMITTAL
C.A.N. NO.:
NOAA FAIRWEATHER HOMEPORTRECAPITALIZATION PROJECT
E NN G I E E R S I NC, .
S3.15

GANGWAY - PLAN
PND PROJECT NO.:APPROVED:DRAWN:
DESIGN: CHECKED:SCALE:
DATE:
SHEET TITLE:
9360 Glacier Highway Ste 100Juneau, Alaska 99801
www.pndengineers.comFax: 907-586-2099Phone: 907-586-2093
60% DESIGNSUBMITTAL
C.A.N. NO.:
NOAA FAIRWEATHER HOMEPORTRECAPITALIZATION PROJECT
E NN G I E E R S I NC, .
S4.01GANGWAY PLAN, ELEVATION ANDTYPICAL SECTION
TYPICAL SECTION
GANGWAY - ELEVATION
DETAIL "A" DETAIL "B"

PND PROJECT NO.:APPROVED:DRAWN:
DESIGN: CHECKED:SCALE:
DATE:
SHEET TITLE:
9360 Glacier Highway Ste 100Juneau, Alaska 99801
www.pndengineers.comFax: 907-586-2099Phone: 907-586-2093
60% DESIGNSUBMITTAL
C.A.N. NO.:
NOAA FAIRWEATHER HOMEPORTRECAPITALIZATION PROJECT
E NN G I E E R S I NC, .
S4.02GANGWAY DETAILS

PND PROJECT NO.:APPROVED:DRAWN:
DESIGN: CHECKED:SCALE:
DATE:
SHEET TITLE:
9360 Glacier Highway Ste 100Juneau, Alaska 99801
www.pndengineers.comFax: 907-586-2099Phone: 907-586-2093
60% DESIGNSUBMITTAL
C.A.N. NO.:
NOAA FAIRWEATHER HOMEPORTRECAPITALIZATION PROJECT
E NN G I E E R S I NC, .
S4.03GANGWAY DETAILS
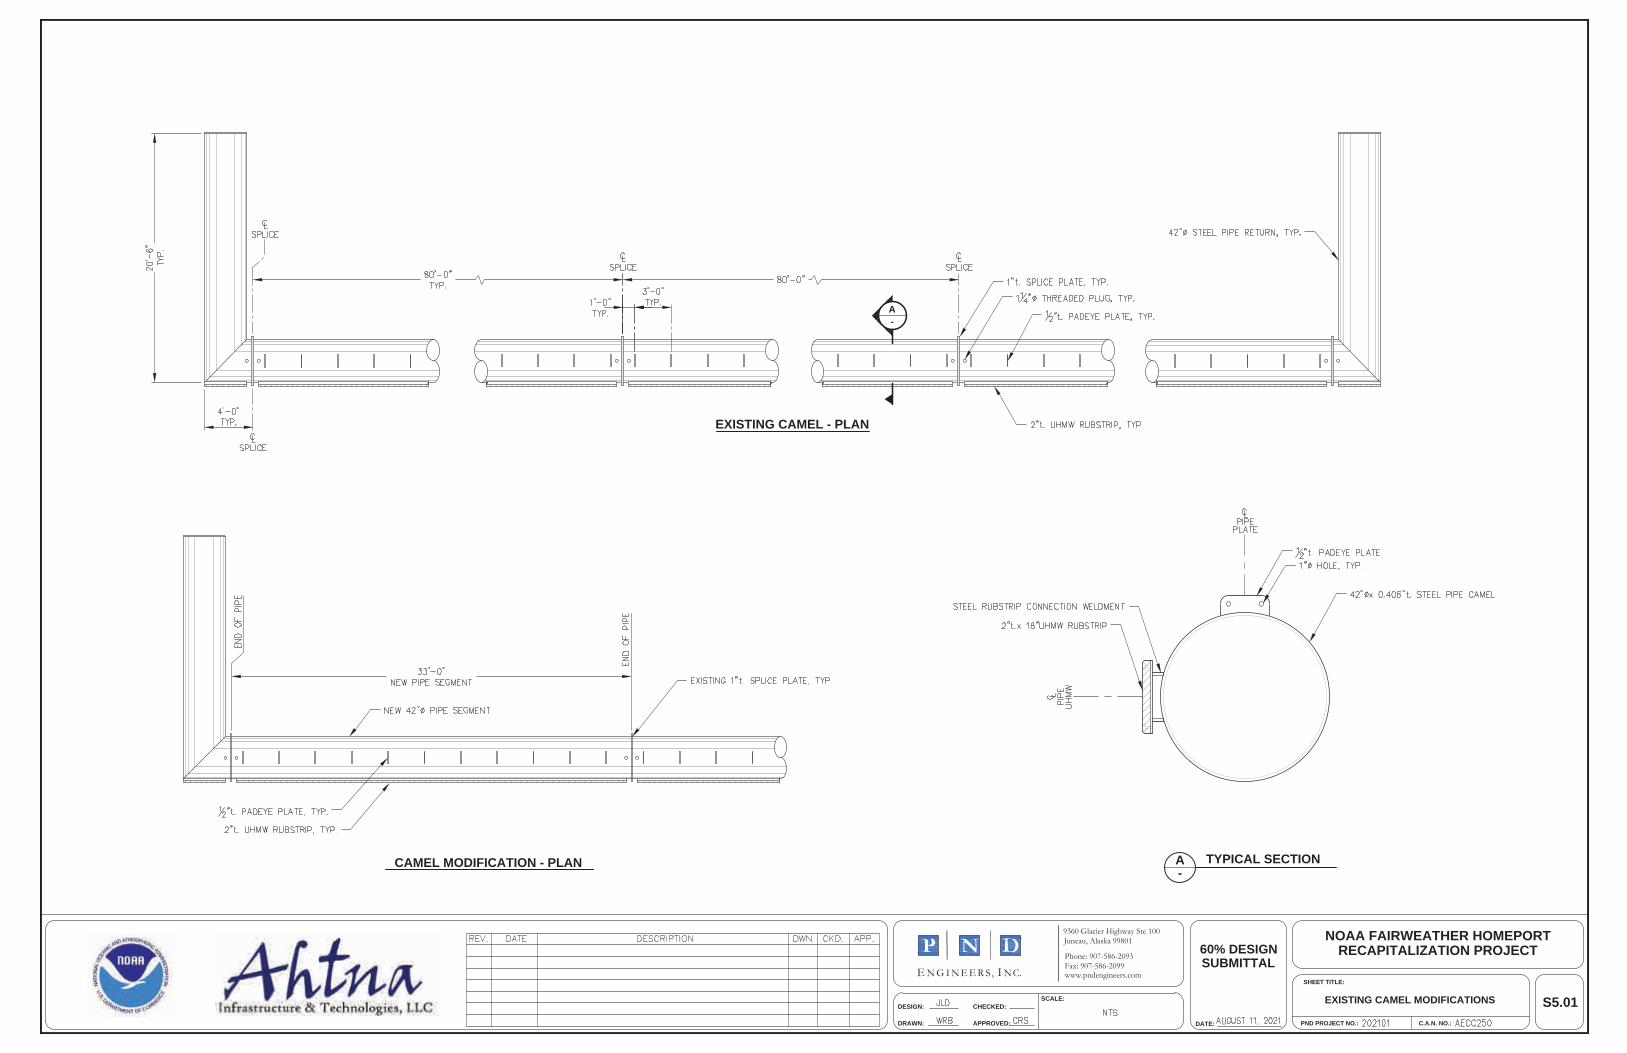
PND PROJECT NO.:APPROVED:DRAWN:
DESIGN: CHECKED:SCALE:
DATE:
SHEET TITLE:
9360 Glacier Highway Ste 100Juneau, Alaska 99801
www.pndengineers.comFax: 907-586-2099Phone: 907-586-2093
60% DESIGNSUBMITTAL
C.A.N. NO.:
NOAA FAIRWEATHER HOMEPORTRECAPITALIZATION PROJECT
E NN G I E E R S I NC, .
S5.01EXISTING CAMEL MODIFICATIONS
EXISTING CAMEL - PLAN
A-
TYPICAL SECTION
-A
CAMEL MODIFICATION - PLAN

PND PROJECT NO.:APPROVED:DRAWN:
DESIGN: CHECKED:SCALE:
DATE:
SHEET TITLE:
9360 Glacier Highway Ste 100Juneau, Alaska 99801
www.pndengineers.comFax: 907-586-2099Phone: 907-586-2093
60% DESIGNSUBMITTAL
C.A.N. NO.:
NOAA FAIRWEATHER HOMEPORTRECAPITALIZATION PROJECT
E NN G I E E R S I NC, .
S5.02CAMEL AND FENDER DETAILS
CAMEL AND FENDERING - PLAN
-A
CAMEL AND FENDERING - SECTIONFENDER CONNECTION WELDMENT A-
Appendix B: Underwater Noise Technical Memorandum
Underwater Noise Technical Memo for Installation/Removal of Piles, Proposed Ketchikan Port Facility Recapitalization Project (Ketchikan, AK) Prepared for: Ahtna Engineering Services, LLC 110 West 38th Avenue, Suite 200A Anchorage, AK 99503 Prepared by: AECOM Project No. 60640505 - NOAA OMAO Ketchikan EA 2020 July 2021 (updated October 21, 2021)
Underwater Noise Technical Memo for Installation/Removal of Piles, Proposed Ketchikan Port Facility Recapitalization Project Ketchikan, AK
AECOM Page | ii
TABLE OF CONTENTS 1. Introduction ........................................................................................................................................ 1 2. Fundamentals of Underwater Noise ................................................................................................... 1 3. Project Area Protected Species ........................................................................................................... 2
3.1 Humpback Whales .................................................................................................................... 3 3.2 Steller Sea Lions ....................................................................................................................... 3 3.3 Harbor Seals ............................................................................................................................. 4 3.4 Killer Whales ............................................................................................................................ 4 3.5 Dall’s Porpoise ......................................................................................................................... 4 3.6 Harbor Porpoise ........................................................................................................................ 4 3.7 Gray Whale ............................................................................................................................... 5 3.8 Pacific White-Sided Dolphin .................................................................................................... 5 3.9 Fish ........................................................................................................................................... 5
4. Applicable Noise Criteria ................................................................................................................... 6 5. Estimation of Pile Driving Noise ........................................................................................................ 7 6. Potential Effects Of Pile Driving Noise On Marine Mammals And Fish ......................................... 11
6.1.1 Impact Pile Driving (Last 1-Foot Portion of the Pile).................................................. 11 6.1.2 Rock Socket Drilling with Installing the Pile Using Impact Pile Driving Thresholds . 11 6.1.3 Pile Removal ................................................................................................................ 11
7. MM BIO: Underwater Noise Mitigation Measures Due To Pile Driving ......................................... 12 8. Statement of Limitations................................................................................................................... 12 9. References ........................................................................................................................................ 13 TABLES Table 1: Summary of the Five Functional Hearing Groups of Marine Mammals ........................................ 3 Table 2: EFH in the Project Area .................................................................................................................. 5 Table 3: Summary of PTS onset dual metric acoustic threshold levels* ...................................................... 6 Table 4: Interim Threshold Criteria for the Onset of Injury in Fish .............................................................. 7 Table 5: Expected Pile Driving Noise Levels and Distances of Criteria Level Exceedance Based on Mean Reference Levels ........................................................................................................................................... 9 Table 6: Expected Pile Driving Noise Levels and Distances of Criteria Level Exceedance Based on 90th Percentile Reference Levels ........................................................................................................................ 10

Underwater Noise Technical Memo for Installation/Removal of Piles, Proposed Ketchikan Port Facility Recapitalization Project Ketchikan, AK
AECOM Page | iii
ACRONYMS AND ABBREVIATIONS dB decibel dBA A-weighted decibels DON Department of the Navy DTH down the hole EEZ Exclusive Economic Zone FHWG Fisheries Hydroacoustic Working Group FTA Federal Transit Administration Hz hertz kHz kilohertz NOAA National Oceanic and Atmospheric Administration PTS Permanent Threshold Shifts rms root mean square SEL Sound Exposure Level SPL Sound Pressure Level µPa micro Pascal
Underwater Noise Technical Memo for Installation/Removal of Piles, Proposed Ketchikan Port Facility Recapitalization Project Ketchikan, AK
AECOM Page | 1
1. INTRODUCTION This technical memorandum presents the results of modeling for underwater noise that would be generated from pile removal and pile driving during the construction of the proposed action, and which could affect fish species and marine mammals nearby. The proposed action involves the demolition of derelict structures and the construction of a dedicated pier and shore facilities to support the berthing of the NOAA Ship Fairweather on a long-term basis, including the addition of a small boat ramp. One-hundred to 200 14-inch diameter timber piles would be removed under the proposed project. The piles would be removed from the bedrock using a vibratory pile driver, assuming two minutes operation to loosen the pile by vibratory hammer and lift by a crane. Eighteen 24-inch-diameter steel pipe piles would be installed under the proposed project. The piles would be inserted into the bedrock at a depth of up to 20 feet. The piles would be placed into the bedrock using the down the hole (DTH) rock socket drilling method. Impact pile driving would be used to proof the last 12 inches of each pile. All three pile driving methods (DTH rock socket drilling, vibratory and impact pile driving) are assessed and the results are provided individually in this report.
Impact pile driving includes a piston system with weights that are usually raised by a power source (e.g., diesel, hydraulic, or steam) then dropped onto the pile, hammering the pile into the ground. The noise produced during impact pile driving is impulsive and with high intensity. Potential impacts to fish species as a result of impact pile driving are described below. However, a vibratory driver works by inducing particle motion to the substrate immediately below and around the pile, causing liquefaction and allowing the pile to sink downward (for this reason, vibratory pile driving is suitable only where soft substrates are present). The noise produced during vibratory driving is lower in intensity and can be considered continuous in comparison to the impulsive noise produced during impact pile driving. The DTH system uses a combination of vibratory and impact movements and are now considered to be both impulsive (from the hammer action) and non-impulsive (from the rotary action). Different source levels were used for each component. Rock sockets would be drilled and the piles would be set in the sockets and the piles would be mostly installed using this system. Potential impacts to marine mammal and fish species as a result of the pile driving are described below.
2. FUNDAMENTALS OF UNDERWATER NOISE Sound can be described as the mechanical energy of a vibrating object transmitted by pressure waves through a liquid (e.g., water) or gaseous medium (e.g., air). Noise is generally defined as unwanted sound (i.e., loud, unexpected, or annoying sound). Acoustics is defined as the physics of sound. In acoustics, the fundamental scientific model consists of a sound (or noise) source, a receiver, and the propagation path between the two. The loudness of the noise source and obstructions or atmospheric factors affecting the propagation path to the receiver determines the sound level and characteristics of the noise perceived by the receiver. Sound typically is described by pitch and loudness. Pitch is the height or depth of a tone or sound, depending on the relative rapidity (frequency) of the vibrations by which it is produced. Loudness is the intensity of sound waves combined with the reception characteristics of the auditory system. Intensity may be compared with the height of an ocean wave because it is a measure of the amplitude of the sound wave. Acoustics addresses primarily the propagation and control of sound.
In addition to the concepts of pitch and loudness, several noise measurement scales are used to describe a sound. A dB is a unit of measurement describing the amplitude of sound; a dB is equal to 20 times the logarithm to base 10 of the ratio of the pressure of the sound measured to the reference pressure. For underwater sounds, a reference pressure of 1 micro pascal (µPa) commonly is used to describe sounds in terms of decibels. Therefore, 0 dB on the decibel scale would be a measure of a sound pressure of 1 µPa. Sound levels in decibels are calculated on a logarithmic basis. An increase of 10 decibels represents a ten-

Underwater Noise Technical Memo for Installation/Removal of Piles, Proposed Ketchikan Port Facility Recapitalization Project Ketchikan, AK
AECOM Page | 2
fold increase in acoustic energy, while 20 decibels is 100 times more intense, and 30 decibels is 1,000 times more intense.
The number of sound pressure peaks traveling past a given point in a single second is referred to as the frequency, expressed in cycles per second or Hertz (Hz). The amplitude of pressure waves generated by a sound source determines the perceived loudness of that source. Sound pressure amplitude is measured in micro-Pascals (µPa). One µPa is approximately one hundred billionths (0.00000000001) of normal atmospheric pressure. Sound pressure amplitudes for different kinds of noise environments can range from less than 100 µPa to 100,000,000 µPa. Because of this huge range of values, sound is rarely expressed in terms of pressure. Instead, a logarithmic scale is used to describe the sound pressure level (SPL) in terms of decibels (dB). Sound intensity for underwater applications is typically expressed in dB referenced to 1 micro Pascal (µPa).
When a pile-driving hammer strikes a pile, a pulse is created that propagates through the pile and radiates sound into the water, the ground substrate, and the air. Sound pressure pulse as a function of time is referred to as the waveform. In terms of acoustics, these sounds are described by the peak pressure, the RMS, and the sound exposure level (SEL).
The peak pressure is the highest absolute value of the measured waveform and can be a negative or positive pressure peak. For pile-driving pulses, the root mean square (RMS) level is determined by analyzing the waveform and computing the average of the squared pressures over the time that makes up that portion of the waveform containing the vast majority of the sound energy (Richardson et al. 1995). The pulse RMS has been approximated in the field for pile-driving sounds, by measuring the signal with a precision sound level meter, set to the “impulse” RMS setting, and typically is used to assess effects on marine mammals. SEL is an acoustic metric that provides an indication of the amount of acoustical energy contained in a sound event. For pile driving, the typical event can be one pile-driving pulse or many pulses, such as pile driving for one pile or for one day of driving multiple piles. Typically, SEL is measured for a single strike and a cumulative condition.
Another measure of the pressure waveform that can be used to describe the pulse is the sound energy itself. The total sound energy in the pulse is referred to in many ways, such as the “total energy flux” (Finerran et al. 2002). The “total energy flux” is equivalent to the unweighted SEL for a plane wave propagating in a free field, a common unit of sound energy used in airborne acoustics to describe short-duration events, referred to as dB re 1µPa2-sec. Peak pressures and RMS sound pressure levels are expressed in dB re 1 µPa. The total sound energy in an impulse accumulates over the duration of that pulse. A common unit of total sound energy used in acoustics to describe short-duration events is the sound exposure level (SEL).
The cumulative SEL associated with the driving of a pile can be estimated using the single-strike SEL value and the number of pile strikes, using the following equation:
SELCUMULATIVE = SELSINGLE STRIKE + 10 log (# of pile strikes)
For example, if a single-strike SEL for a pile is 165 dB and it takes 1,000 strikes to drive the pile, the cumulative SEL is 195 dB (165 dB + 30 dB = 195 dB), where 10 * Log10 (1000) = 30.
Peak intensity, RMS, and SEL are used by resource agencies to assess the effects of underwater noise on fish.
3. PROJECT AREA PROTECTED SPECIES Protected species that have a potential to occur in the project area and be affected by underwater noise that would be generated from pile removal and pile driving during the construction of the proposed action include: ESA-listed humpback whale; MMPA-protected minke whale, gray whale, killer whale, Pacific

Underwater Noise Technical Memo for Installation/Removal of Piles, Proposed Ketchikan Port Facility Recapitalization Project Ketchikan, AK
AECOM Page | 3
white-sided dolphin, harbor porpoise, Dall’s porpoise, Steller sea lion, and harbor seal; and EFH-managed Alaska stocks of Pacific salmon and the groundfish Dover sole.
To more accurately reflect marine mammal hearing capabilities, marine mammals are divided into functional hearing groups based on measured or estimated functional hearing ranges. NOAA modified the functional hearing groups as follows in Table 1 (NOAA 2018):
Table 1: Summary of the Five Functional Hearing Groups of Marine Mammals
Functional Hearing Group Estimated Auditory Bandwidth Species or Taxonomic Groups Species Potentially in
the Activity Area
Low frequency cetaceans (Mysticetes–Baleen whales)
7 Hz to 25 kHz (best hearing is generally below 1000 Hz, higher frequencies result from humpback whales)
All baleen whales Humpback whale, gray whale, minke whale
Middle frequency Cetaceans (Odontocetes)
150 Hz to 160 kHz (best hearing is from approximately 10 to 120 kHz)
Includes species in the following genera: Lagenorhynchus,Orcinus, Physeter, Delphinapterus, Monodon, Ziphius, Berardius, Mesoplodon
Killer whale, Pacific white-sided dolphins
High frequency cetaceans (Odontocetes)
200 Hz to 180 kHz (best hearing is from approximately 10 to 150kHz)
Includes species in the following genera: Phocoena, Phocoenoides
Harbor porpoise, Dall’s porpoise
Phocid pinnipeds (true seals)
75 Hz to 100 kHz (best hearing is from approximately 1 to 30 kHz)
All seals Harbor seal
Otariid pinnipeds (sea lions and fur seals)
100 Hz to 48 kHz (best hearing is from approximately 1 to 16 kHz)
All fur seals and sea lions Steller sea lion
Notes: Hz = hertz kHz = kilohertz Source: Southall et al. 2007 and NOAA 2018
3.1 Humpback Whales Acoustics and hearing: Humpback whales are known to produce three classes of vocalizations: 1) “songs” in the late fall, winter, and spring by solitary males; 2) sounds made within groups on the wintering (calving) grounds; and 3) social sounds made on the feeding grounds (Richardson et al. 1995). The main energy of humpback whale songs lies between 0.2 and 3.0 kHz, with frequency peaks at 4.7 kHz. Feeding calls, unlike song and social sounds, are highly stereotyped series of narrow-band trumpeting calls. They are 20 Hz to 2 kHz, less than 1 sec in duration, and have source levels of 175 to 192 dB re 1 μPa-m. The fundamental frequency of feeding calls is approximately 500 Hz (summarized in DON 2008b, and citations therein). Thus, humpback whales are in the low-frequency functional hearing group, with an estimated auditory bandwidth of 7 Hz to 22 kHz (Southall et al. 2007). Their vocal repertoire ranges from 20 Hz to greater than 10 kHz (DON 2008a) (Table 1).
3.2 Steller Sea Lions Acoustics and hearing: Steller sea lions have similar hearing thresholds in-air and underwater to other otariids. Hearing in air ranges from 0.250–30 kHz, with a region of best hearing sensitivity from 5–14.1 kHz (Muslow and Reichmuth 2010). The underwater audiogram shows the typical mammalian U-shape.
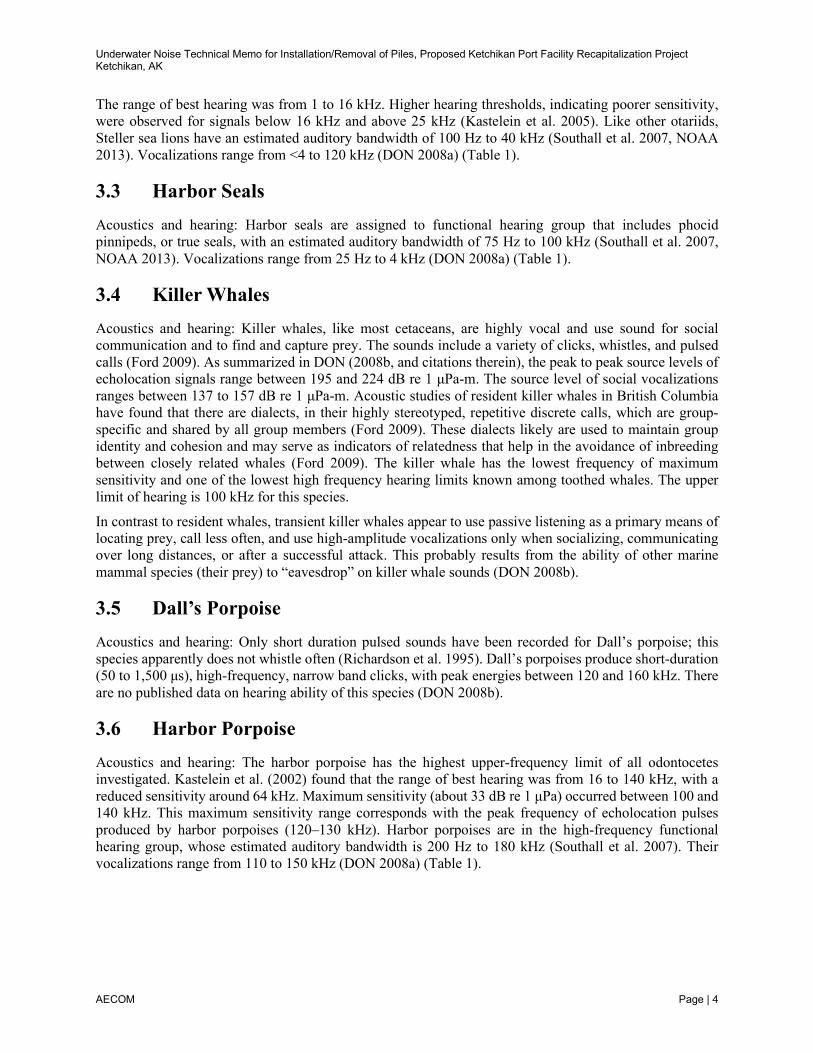
Underwater Noise Technical Memo for Installation/Removal of Piles, Proposed Ketchikan Port Facility Recapitalization Project Ketchikan, AK
AECOM Page | 4
The range of best hearing was from 1 to 16 kHz. Higher hearing thresholds, indicating poorer sensitivity, were observed for signals below 16 kHz and above 25 kHz (Kastelein et al. 2005). Like other otariids, Steller sea lions have an estimated auditory bandwidth of 100 Hz to 40 kHz (Southall et al. 2007, NOAA 2013). Vocalizations range from <4 to 120 kHz (DON 2008a) (Table 1).
3.3 Harbor Seals Acoustics and hearing: Harbor seals are assigned to functional hearing group that includes phocid pinnipeds, or true seals, with an estimated auditory bandwidth of 75 Hz to 100 kHz (Southall et al. 2007, NOAA 2013). Vocalizations range from 25 Hz to 4 kHz (DON 2008a) (Table 1).
3.4 Killer Whales Acoustics and hearing: Killer whales, like most cetaceans, are highly vocal and use sound for social communication and to find and capture prey. The sounds include a variety of clicks, whistles, and pulsed calls (Ford 2009). As summarized in DON (2008b, and citations therein), the peak to peak source levels of echolocation signals range between 195 and 224 dB re 1 μPa-m. The source level of social vocalizations ranges between 137 to 157 dB re 1 μPa-m. Acoustic studies of resident killer whales in British Columbia have found that there are dialects, in their highly stereotyped, repetitive discrete calls, which are group-specific and shared by all group members (Ford 2009). These dialects likely are used to maintain group identity and cohesion and may serve as indicators of relatedness that help in the avoidance of inbreeding between closely related whales (Ford 2009). The killer whale has the lowest frequency of maximum sensitivity and one of the lowest high frequency hearing limits known among toothed whales. The upper limit of hearing is 100 kHz for this species.
In contrast to resident whales, transient killer whales appear to use passive listening as a primary means of locating prey, call less often, and use high-amplitude vocalizations only when socializing, communicating over long distances, or after a successful attack. This probably results from the ability of other marine mammal species (their prey) to “eavesdrop” on killer whale sounds (DON 2008b).
3.5 Dall’s Porpoise Acoustics and hearing: Only short duration pulsed sounds have been recorded for Dall’s porpoise; this species apparently does not whistle often (Richardson et al. 1995). Dall’s porpoises produce short-duration (50 to 1,500 μs), high-frequency, narrow band clicks, with peak energies between 120 and 160 kHz. There are no published data on hearing ability of this species (DON 2008b).
3.6 Harbor Porpoise Acoustics and hearing: The harbor porpoise has the highest upper-frequency limit of all odontocetes investigated. Kastelein et al. (2002) found that the range of best hearing was from 16 to 140 kHz, with a reduced sensitivity around 64 kHz. Maximum sensitivity (about 33 dB re 1 μPa) occurred between 100 and 140 kHz. This maximum sensitivity range corresponds with the peak frequency of echolocation pulses produced by harbor porpoises (120–130 kHz). Harbor porpoises are in the high-frequency functional hearing group, whose estimated auditory bandwidth is 200 Hz to 180 kHz (Southall et al. 2007). Their vocalizations range from 110 to 150 kHz (DON 2008a) (Table 1).

Underwater Noise Technical Memo for Installation/Removal of Piles, Proposed Ketchikan Port Facility Recapitalization Project Ketchikan, AK
AECOM Page | 5
3.7 Gray Whale Acoustics and hearing: As summarized in Jones and Swartz (2009) and DON (2008b, and references therein), gray whales produce broadband signals ranging from 100 Hz to 4 kHz (and up to 12 kHz). The most common sounds on the breeding and feeding grounds are knocks which are broadband pulses from about 100 Hz to 2 kHz and most energy at 327 to 825 Hz (Richardson et al. 1995). The source level for knocks is approximately 142 dB re 1 μPa-m. During migration, individuals most often produce low-frequency moans. The structure of the gray whale ear is evolved for low-frequency hearing. Gray whale responses to noise include changes in swimming speed and direction to move away from the sound source; abrupt behavioral changes from feeding to avoidance, with a resumption of feeding after exposure; changes in calling rates and call structure; and changes in surface behavior, usually from traveling to milling.
3.8 Pacific White-Sided Dolphin Acoustics and hearing: The Pacific white sided dolphin belong under the Mid-frequency Cetacean hearing group, which includes all dolphins (NMFS 2018). The dolphin has a U-shaped audiometric curve. similar to other mammals with best sensitivities from 2 kHz to 128 kHz. Low-frequency noise can interrupt their normal behavior by potentially hindering their ability to use sound, which the species relies on to communicate, mate, forage, avoid predators, and navigate (NMFS 2021).
3.9 Fish There are no ESA-listed fish species occurring in the project area. Five species of Pacific salmon, pink (Oncorhynchus gorbuscha), chum (O. keta), sockeye (O. nerka), coho (O. kisutch), and Chinook salmon (O. tshawytscha), occur within the project area. The bays and coves of the area provide a protected habitat for Dungeness crabs (Cancer magister), Red king crab (Paralithodes camtschaticus), and tanner crab (Chionoecetes bairdi). Other invertebrates found in the area include shrimp, abalone, and shellfish species including geoduck clams (Panopea generosa).
Essential Fish Habitat (EFH) for species occurring within the project area includes Alaska stocks of Pacific salmon, and the ground fish Dover Sole (Table 2). Additional information on EFH can be found at: https://alaskafisheries.noaa.gov/habitat/efh.
Table 2: EFH in the Project Area
Species Life stages Habitat Description
Chinook Salmon Marine juveniles, marine immature and maturing adults
Marine juveniles: Marine juveniles: all marine waters off the coast of Alaska from the mean higher tide line to the 200-nm limit of the U.SEEZ, including the Gulf of Alaska. Marine immature and maturing adults: marine waters off the coast of Alaska to depths of 200 m and ranging from the mean higher tide line to the 200-nm limit of the EEZ, including the Gulf of Alaska.
Chum Salmon Marine juveniles, marine immature and maturing adults
Marine juveniles: all marine waters off the coast of Alaska to approximately 50 m in depth from the mean higher tide line to the 200-nm limit of the EEZ, including the Gulf of Alaska. Marine immature and maturing adults: Same as Chinook salmon
Coho Salmon Marine juveniles, marine immature and maturing adults
Marine juveniles: same as Chinook salmon. Marine immature and maturing adults: same as Chinook salmon.
Dover Sole Late juveniles, adults Late juveniles: lower portion of the water column along the middle (50 to 100 m), and outer (100 to 200 m) shelf and upper slope (200 to 500 m)

Underwater Noise Technical Memo for Installation/Removal of Piles, Proposed Ketchikan Port Facility Recapitalization Project Ketchikan, AK
AECOM Page | 6
Table 2: EFH in the Project Area
Species Life stages Habitat Description
throughout the Gulf of Alaska wherever there are substrates consisting of sand and mud. Adults: same as above late juveniles.
Pink Salmon Marine juveniles, marine immature and maturing adults
Marine juveniles: same as Chinook salmon. Marine immature and maturing adults: same as Chinook salmon
Sockeye Salmon Marine juveniles, marine immature and maturing adults
Marine juveniles: same as chum salmon Marine immature and maturing adults: same as Chinook salmon
Notes: EEZ = Exclusive Economic Zone m = meter(s) nm = nautical mile(s) Source: NPFMC 2012; 2015
4. APPLICABLE NOISE CRITERIA NOAA issued Guidance for Assessing the Effects of Anthropogenic Sound on Marine Mammal Hearing (NOAA 2018). NOAA has compiled, interpreted, and synthesized the best available science, including a recent Navy Technical Report (Finneran 2015), to produce updated acoustic threshold levels for the onset Permanent Threshold Shifts (PTS) and replace those currently in use by NOAA for determining PTS. Updates include a protocol for estimating PTS onset threshold levels for impulsive (e.g., airguns, impact pile drivers) and non-impulsive (e.g., sonar, vibratory pile drivers) sound sources, the formation of marine mammal functional hearing groups (low-, mid-, and high-frequency cetaceans, and otariid and phocid pinnipeds), and the incorporation of marine mammal auditory weighting functions into the calculation of PTS threshold levels. These acoustic threshold levels are presented using dual metrics of cumulative sound exposure level and peak sound pressure level.
The underwater acoustic threshold levels for onset of PTS are provided in Table 3. Dual metrics of SELcum and peak sound pressure level have been recommended as most appropriate for establishing PTS onset acoustic threshold levels for marine mammals (NOAA 2018).
Table 3: Summary of PTS onset dual metric acoustic threshold levels*
Hearing Group PTS Onset Threshold Levels (Received Level)
Impulsive Non-impulsive Low-Frequency (LF) Cetaceans 219 dBpeak & 183 dB SELcum 199 dB SELcum Mid-Frequency (MF) Cetaceans 230 dBpeak & 185 dB SELcum 198 dB SELcum High-Frequency (HF) Cetaceans 202 dBpeak & 155 dB SELcum 173 dB SELcum Phocid Pinnipeds (Underwater) (PW) 218 dBpeak & 185 dB SELcum 201 dB SELcum Otariid Pinnipeds (Underwater) (OW) 232 dBpeak & 203 dB SELcum 219 dB SELcum Notes: > = greater than; dB = decibel; SEL = sound exposure level; SPL = sound pressure level. * Dual metric acoustic threshold levels: Use whichever level [dBpeak or dB SELcum] exceeded first. All SELcum acoustic threshold levels (re: 1
µPa2-s) incorporate marine mammal auditory weighting functions, while peak pressure thresholds should not be weighted. Note: Acoustic threshold levels for impulsive or non-impulsive sources are based on temporal characteristics at the source and not the receiver.
The SELcum could be exceeded in multitude of ways (i.e., varying exposure levels and durations, duty cycle). It is valuable for action proponents, if possible, to indicate under what conditions these acoustic threshold levels will be exceeded.
Note: In this Table, dB peak, is equivalent to the ANSI abbreviation of Lpk and SELcum is equivalent to the ANSI abbreviation of LE (ANSI 2013).
Source: NOAA 2018. https://www.fisheries.noaa.gov/national/marine-mammal-protection/marine-mammal-acoustic-technical-guidance.

Underwater Noise Technical Memo for Installation/Removal of Piles, Proposed Ketchikan Port Facility Recapitalization Project Ketchikan, AK
AECOM Page | 7
NMFS assumes animals will be behaviorally disturbed (Level B harassment) by impulsive sounds (like impact hammer pile driving) with SPL above 160 dB re 1 µPa and by continuous sounds (like vibropiling and drilling) above 120 dB re 1 µPa. The sound level from vibratory pile driving at any point in time is lower than that generated by impact pile driving, but the exposure is continuous. Therefore, the threshold for Level B harassment—SPL 120 dB instead of 160 dB—is set lower than that for impulses. Due to the 40 dB difference between the two thresholds, behavioral disturbances from vibratory pile driving could occur at much greater distances than from impact driving.
Also, in June 2008, the Fisheries Hydroacoustic Working Group (FHWG) — whose members include the Southwest and Northwest Divisions of the NMFS; the California, Washington, and Oregon Departments of Transportation; the CDFW; and the U.S. Federal Highway Administration — issued interim threshold criteria, based on the best available science, for the onset of injury to fish from pile driving noise (FHWG 2008). This is a dual criterion including an SPL of 206 dB (peak) and a cumulative SEL of 187 dB for fish 2 grams and heavier or a cumulative SEL of 183 dB for fish smaller than 2 grams (Table 4). The FHWG has determined that noise at or above the 206 dB (peak) SPL can cause barotrauma to auditory tissues, the swim bladder, or other sensitive organs. Noise levels above the accumulated SEL may cause temporary hearing-threshold shifts in fish. Behavioral effects are not covered under these criteria but could occur at these levels or lower. Behavioral effects may include fleeing the area and the temporary cessation of feeding or spawning behaviors.
Table 4: Interim Threshold Criteria for the Onset of Injury in Fish Fish Size Peak Noise (SPL) (dB) Accumulated Noise (SEL) (dB)
Less than 2 grams >206 >183 Greater than or equal to 2 grams >206 >187 Notes: > = greater than; dB = decibel; SEL = sound exposure level; SPL = sound pressure level. Source: Fisheries Hydroacoustic Working Group (FHWG) 2008.
5. ESTIMATION OF PILE DRIVING NOISE Pile driving would be mostly conducted using down the hole (DTH) rock socket drilling and impact pile driving would be used to install the last foot of the piles. DTH rock socket drilling would be used for longer periods (i.e., to drive all but the last foot of the pile into the substrate) than the impact pile driving (which would only be used to proof the last 12 inches of each pile). A vibratory pile driver would also be used to remove existing timber piles. Therefore, three scenarios (vibratory pile driving, impact pile driving, and down the hole (DTH) rock socket drilling) were evaluated in this report.
To estimate underwater noise levels from pile removing activities, measurements from the Caltrans Guidance for Hydroacoustic Analysis (Caltrans 2020 Table I.2-1) were used for similar piles, and underwater pile driving conducted under similar circumstances (i.e., similar water depths in areas of similar substrate) was reviewed for source-level data at 10 meters. Reference level for DTH rock socket drilling was provided by NOAA (Dwayne Meadows, 2021). For installing the last foot of the pile using impact pile driving, reference noise levels from the Alaska DOT Hydroacoustic Pile Driving Noise Study (Denes et. al. 2016) were used.
Rock sockets would be drilled and the piles would be set in the sockets. This would occur over a duration of up to 45 minutes. The vibratory hammer would be used for pile removal and for up to two minutes per pile. The number of strikes for DTH pile driving was provided based on the length of 10 to 20 feet driven into bedrock, and conservatively assuming approximately four strikes/second for each inch of the pile to be driven. The number of strikes for impact hammer was, therefore, assumed to be approximately 50 in order to proof the last 12 inches of each pile. These analyses assumed that fish and marine mammals would be stationary during pile driving (i.e., would not relocate away from the source) and that all pile strikes would

Underwater Noise Technical Memo for Installation/Removal of Piles, Proposed Ketchikan Port Facility Recapitalization Project Ketchikan, AK
AECOM Page | 8
produce noise at the maximum peak SPL and SEL. Therefore, these calculations provided in Table 5 (based on Mean Reference Levels) and Table 6 (based on 90th percentile Reference Levels), represent the worst-case scenario for accumulated sound effects over a 24-hour period. User spreadsheets for noise calculations are provided in Attachment A.
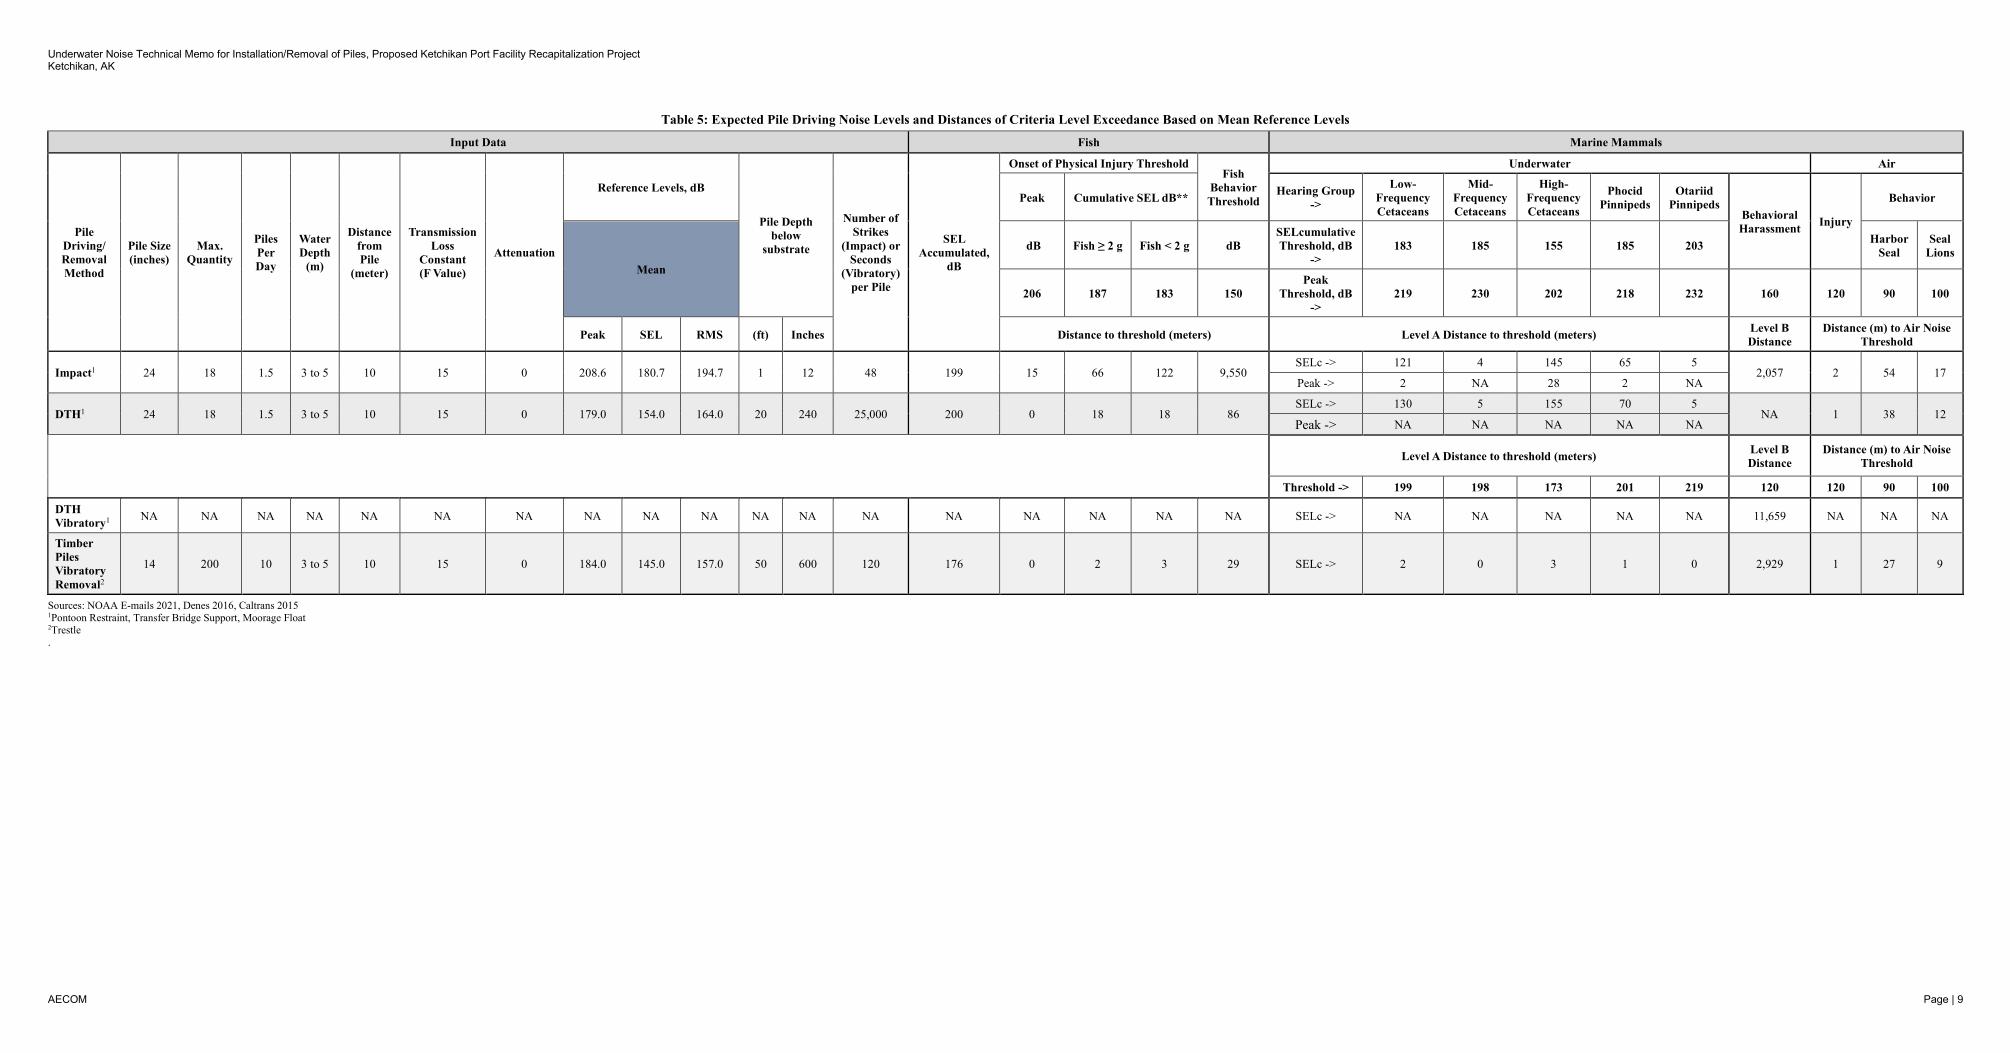
Underwater Noise Technical Memo for Installation/Removal of Piles, Proposed Ketchikan Port Facility Recapitalization Project Ketchikan, AK
AECOM Page | 9
Table 5: Expected Pile Driving Noise Levels and Distances of Criteria Level Exceedance Based on Mean Reference Levels
Input Data Fish Marine Mammals
Pile Driving/ Removal Method
Pile Size (inches)
Max. Quantity
Piles Per Day
Water Depth
(m)
Distance from Pile
(meter)
Transmission Loss
Constant (F Value)
Attenuation
Reference Levels, dB
Pile Depth below
substrate
Number of Strikes
(Impact) or Seconds
(Vibratory) per Pile
SEL Accumulated,
dB
Onset of Physical Injury Threshold Fish
Behavior Threshold
Underwater Air
Peak Cumulative SEL dB** Hearing Group ->
Low-Frequency Cetaceans
Mid-Frequency Cetaceans
High-Frequency Cetaceans
Phocid Pinnipeds
Otariid Pinnipeds
Behavioral Harassment Injury
Behavior
Mean
dB Fish ≥ 2 g Fish < 2 g dB SELcumulative Threshold, dB
-> 183 185 155 185 203 Harbor
Seal Seal
Lions
206 187 183 150 Peak
Threshold, dB ->
219 230 202 218 232 160 120 90 100
Peak SEL RMS (ft) Inches Distance to threshold (meters) Level A Distance to threshold (meters) Level B Distance
Distance (m) to Air Noise Threshold
Impact1 24 18 1.5 3 to 5 10 15 0 208.6 180.7 194.7 1 12 48 199 15 66 122 9,550 SELc -> 121 4 145 65 5
2,057 2 54 17 Peak -> 2 NA 28 2 NA
DTH1 24 18 1.5 3 to 5 10 15 0 179.0 154.0 164.0 20 240 25,000 200 0 18 18 86 SELc -> 130 5 155 70 5
NA 1 38 12 Peak -> NA NA NA NA NA
Level A Distance to threshold (meters) Level B Distance
Distance (m) to Air Noise Threshold
Threshold -> 199 198 173 201 219 120 120 90 100
DTH Vibratory1 NA NA NA NA NA NA NA NA NA NA NA NA NA NA NA NA NA NA SELc -> NA NA NA NA NA 11,659 NA NA NA
Timber Piles Vibratory Removal2
14 200 10 3 to 5 10 15 0 184.0 145.0 157.0 50 600 120 176 0 2 3 29 SELc -> 2 0 3 1 0 2,929 1 27 9
Sources: NOAA E-mails 2021, Denes 2016, Caltrans 2015 1Pontoon Restraint, Transfer Bridge Support, Moorage Float 2Trestle .

Underwater Noise Technical Memo for Installation/Removal of Piles, Proposed Ketchikan Port Facility Recapitalization Project Ketchikan, AK
AECOM Page | 10
Table 6: Expected Pile Driving Noise Levels and Distances of Criteria Level Exceedance Based on 90th Percentile Reference Levels
Input Data Fish Marine Mammals
Pile Driving/ Removal Method
Pile Size (inches)
Max. Quantity
Piles Per Day
Water Depth
(m)
Distance from Pile (meter)
Transmission Loss Constant
(F Value) Attenuation
Reference Levels, dB
Pile Depth below substrate
Number of Strikes
(Impact) or Seconds
(Vibratory) per Pile
SEL Accumulated,
dB
Onset of Physical Injury Fish
Behavior
Underwater Air
Peak Cumulative SEL dB** Hearing Group ->
Low-Frequency Cetaceans
Mid-Frequency Cetaceans
High-Frequency Cetaceans
Phocid Pinnipeds
Otariid Pinnipeds Behavioral
Harassment Injury Behavior
90th Percentile dB Fish ≥ 2 g Fish < 2 g dB SELcumulative
Threshold 183 185 155 185 203 Harbor Seal
Seal Lions
206 187 183 150 Peak Threshold -> 219 230 202 218 232 160 120 90 100
Peak SEL RMS (ft) Inches Distance to threshold (meters) Level A Distance to threshold (meters) Level B Distance
Distance (m) to Air Noise Threshold
Impact1 24 18 1.5 3 to 5 10 15 0 211.2 183.2 197.0 1 12 48 201 18 82 151 12,023 SELc -> 151 5 179 81 6
2,590 2 54 17 Peak -> 2 NA 33 3 NA
DTH1 24 18 1.5 3 to 5 10 15 0 179.0 154.0 164.0 20 240 25,000 200 0 18 18 86 SELc -> 130 5 155 70 5
NA 1 38 12 Peak -> NA NA NA NA NA
Level A Distance to threshold (meters) Level B Distance
Distance (m) to Air Noise Threshold
Threshold -> 199 198 173 201 219 120 120 90 100
DTH1 NA NA NA NA NA NA NA NA NA NA NA NA NA NA NA NA NA NA SELc -> NA NA NA NA NA 11,659 NA NA NA
Timber Piles Vibratory Removal2
14 50 10 3 to 5 10 12 0 184.0 145.0 157.0 50 600 120 176 0 2 3 29 SELc -> 2 0 3 1 0 2,929 1 27 9
Sources: NOAA E-mails 2021, Denes 2016, Caltrans 2015. 1Pontoon Restraint, Transfer Bridge Support, Moorage Float 2Trestle

Underwater Noise Technical Memo for Installation/Removal of Piles, Proposed Ketchikan Port Facility Recapitalization Project Ketchikan, AK
AECOM Page | 11
6. POTENTIAL EFFECTS OF PILE DRIVING NOISE ON MARINE MAMMALS AND FISH
Sound and acoustic pressure resulting from pile driving could affect special-status species listed above by causing behavioral avoidance of the construction area and/or injury. This would apply to both fish species and marine mammal species listed and described above.
6.1.1 Impact Pile Driving (Last 1-Foot Portion of the Pile)
With respect to fish, the 206 dB (peak) SPL noise criteria for injury to fish would not be exceeded by project activities beyond 18 meters (59 feet). The 187 dB and 183 dB cumulative SEL criteria for fish smaller than 2 grams would be exceeded up to 82 meters or 269 feet; and for fish greater than or equal to 2 grams would be exceeded up to 151 meters or 496 feet, as provided in Table 6. Similarly, with respect to marine mammals, the cumulative SELs of 183 dB, 185 dB, 155 dB, 185 dB, and 203 dB criteria for various types of marine mammals listed above, would be exceeded up to 179 meters or 588 feet, as provided in Table 6. Behavioral impact distance would reach up to 12,023 meters or 39,444 feet for fish species, and up to 2,590 meters or 8,498 feet for marine. Air noise impact distance due to pile driving to harbor seal species would reach up to 2 meters (6.6 feet) to injury threshold (Table 6), and up to 54 meters (177 feet) to behavioral impact threshold.
Implementing mitigation measures described below (MM BIO: Underwater Noise Mitigation Measures due to Pile Driving) would reduce the pile driving underwater noise impact distance. The cessation of pile driving at the end of each workday would allow cumulative noise levels to reset before driving continues the following day.
6.1.2 Rock Socket Drilling with Installing the Pile Using Impact Pile Driving Thresholds
With respect to fish, the 206 dB (peak) SPL noise criteria for injury to fish would not be exceeded beyond one meter (3.3 feet) by Project activities. The 187 dB and 183 dB cumulative SEL criteria for fish smaller than 2 grams and for fish greater than or equal to 2 grams would be exceeded, up to 18 meters or 61 feet, as shown in Table 6. Similarly, with respect to marine mammals, the cumulative SELs of 183 dB, 185 dB, 155 dB, 185 dB, and 203 dB criteria for various types of marine mammals listed above would be exceeded up to 155 meters or 509 feet, as provided in Table 6. Similarly, behavioral impact distance would reach up to 86 meters or 281 feet for fish species, and up to 11,659 meters or 152,284 feet for marine mammals during pile driving. Air noise impact distance due to pile driving to harbor seal species, as provided in Table 6, would reach up to 1 meter (3.3 feet) to injury threshold, and up to 38 meters (125 feet) to behavioral impact threshold.
Implementing mitigation measures described below (MM BIO: Underwater Noise Mitigation Measures due to Pile Driving) would enable agreed upon impact distances to remain static and would reduce the pile driving underwater noise impact distance, when necessary. The cessation of pile driving at the end of each workday would allow cumulative noise levels to reset before driving continues the following day.
6.1.3 Pile Removal
With respect to pile removal, as shown in Tables 5 and 6, the 206 dB (peak) SPL noise criteria for injury to fish would not be exceeded beyond 1 meter (3.3 feet). The 187 dB and 183 dB cumulative SEL criteria for fish smaller than 2 grams and for fish greater than or equal to 2 grams would be exceeded, up to three meters or 10 feet. The cumulative SELs of 183 dB, 185 dB, 155 dB, 185 dB, and 203 dB criteria for various

Underwater Noise Technical Memo for Installation/Removal of Piles, Proposed Ketchikan Port Facility Recapitalization Project Ketchikan, AK
AECOM Page | 12
types of marine mammals listed above, would be exceeded up to three meters or 10 feet. Similarly, behavioral impact distance would reach up to 29 meters or 96 feet for fish species, and up to 2,929 meters or 9,608 feet for marine mammals. Air noise impact distance due to pile driving to harbor seal species, as shown in Table 6, would reach up to 1 meter (3.3 feet) to injury threshold, and up to 27 meters (89 feet) to behavioral impact threshold.
Implementing mitigation measures described below (MM BIO: Underwater Noise Mitigation Measures due to Pile Driving) would enable agreed upon impact distances to remain static and would reduce the pile driving underwater noise impact distance, when necessary. The cessation of pile driving at the end of each workday would allow cumulative noise levels to reset before driving continues the following day.
7. MM BIO: UNDERWATER NOISE MITIGATION MEASURES DUE TO PILE DRIVING
Depending on the rate at which the piles are installed and removed, pile driving is expected to occur for at least 33 days (assuming one pile per day, a total of 14 piles to be installed and 10 piles per day removed, with a total of 50 piles to be removed) during the construction period. In areas where the SEL threshold would be exceeded, fish and marine mammals could experience temporary shifts in hearing thresholds and behavioral effects. These behavioral effects could result in the temporary cessation of feeding or movement out of the area during active pile driving. Following the cessation of pile driving, fish are expected to resume use of the area. Because of the shallow water depths in the vicinity (approximately 20 feet or less), attenuation rates likely would be higher than modeled in this analysis, which would decrease the affected area. To ensure that potential impacts to special-status fish species and marine mammals would be avoided or mitigated to less than significant, the following MM would be implemented to allow fish species and marine mammals to move away from the area before full power pile driving commences:
• Bio-observers will monitor some the impacted zones to ensure a shutdown can be prepared for when observers see a species get close. For non-ESA species the shutdown zone is set at the Level A isopleth distance rounded up to the next largest 10m. For ESA species to have zero take the shutdown would need to be at the full extent of the Level B isopleths. The observers also help to count the take that is occurring. The observers also gather data that meets the other monitoring requirements under the MMPA that are distinct from mitigation.
• Hydroacoustic monitoring will be conducted to determine the extent at which certain thresholds would be met, and to alert responsible parties of the need to further mitigate underwater noise.
Should reductions in noise levels below thresholds not be sustained, NOAA would implement the following noise attenuation method in order to sustain project-related noise below threshold levels:
• A soft start for impact drivers requires contractors to provide an initial set of strikes at reduced energy followed by a 30-second waiting period; this procedure is then repeated two additional times. A soft start would be implemented before pile driving begins each day and any time following the cessation of pile driving for a period of 30 minutes or longer.
8. STATEMENT OF LIMITATIONS This technical report is for the sole use and benefit of AECOM, Ahtna Engineering Services, LLC, NOAA and their authorized representatives. The scope of services performed in execution of this effort may not be appropriate to satisfy the needs of other users, and any use or reuse of this document or the findings, conclusions, or recommendations presented herein is at the sole risk of said user. No expressed or implied representation or warranty is included or intended in this document except that the work was performed with the customary thoroughness and competence of professionals working in the same area on similar projects.

Underwater Noise Technical Memo for Installation/Removal of Piles, Proposed Ketchikan Port Facility Recapitalization Project Ketchikan, AK
AECOM Page | 13
9. REFERENCES Caltrans. 2020. Technical Guidance for Assessment and Mitigation of the Hydroacoustic Effects of Pile
Driving on Fish. October 2020. Accessed at https://dot.ca.gov/-/media/dot-media/programs/environmental-analysis/documents/env/hydroacoustic-manual.pdf.
Finneran, J. J., C. E. Schlundt, R. Dear, D. A. Carder, and S. H. Ridgway. 2002 (June). Temporary Shift in Masked Hearing Thresholds in Odontocetes after Exposure to Single Underwater Impulses from a Seismic Watergun. Journal of the Acoustical Society of America.
Fisheries Hydroacoustic Working Group (FHWG). 2008. Memorandum: Agreement in Principle for Interim Criteria for Injury to Fish from Pile Driving Activities. Accessed at http://www.wsdot.wa.gov/NR/rdonlyres/4019ED62-B403-489C-AF05-5F4713D663C9/0/ InterimCriteriaAgreement.pdf
Denes, et. al. 2016. Alaska DOT Hydroacoustic Pile Driving Noise Study – Comprehensive Report. Accessed at: http://www.dot.state.ak.us/stwddes/research/assets/pdf/4000-135.pdf.
National Marine Fisheries Service (NMFS). 2009. NMFS Underwater Noise Calculation Spreadsheet. Prepared by J. Stadler, NMFS Northwest Region, and D. Woodbury, NMFS Southwest Region. Accessed at http://www.dot.ca.gov/hq/env/bio/files/NMFS%20Pile%20Driving%20Calculations.xls
Richardson, W. J., C. R. Greene Jr., C. I. Malme, and D. H. Thomson. 1995. Marine Mammals and Noise. Academic Press, San Diego, CA.
Department of the Navy (DON). 2008a. Final Atlantic fleet active sonar training environmental impact statement/overseas environmental impact statement. Submitted December 12, 2008. 876 pages.
Department of the Navy (DON). 2008b. Request for Letter of Authorization for the incidental harassment of marine mammals resulting from Navy training activities conducted within the northwest training range complex. September 2008. 323 pages.
Finneran, J.J. 2015. Auditory weighting functions and TTS/PTS exposure functions for cetaceans and marine carnivores. July 2015. San Diego: SSC Pacific.
Ford, J.K.B. 2009. Killer whale Orcinus orca. Pages 650-657, in W.F. Perrin, B. Würsig, and H.G.M. Thewissen (eds.), Encyclopedia of Marine Mammals, Academic Press, San Diego, CA. 1,316 pages.
Jones, M.L., and S. L. Swartz. 2009. Gray whale Eschrichtius robustus. Pages 503-511, in W.F. Perrin, B. Würsig, and H.G.M. Thewissen (eds.), Encyclopedia of Marine Mammals, Academic Press, San Diego, CA. 1,316 pages.
Kastelein, R.A., P. Bunskoek, M. Hagedoorn, W.L. Au, and D. Haan. 2002. Audiogram of a harbor porpoise (Phocoena phocoena) measured with narrow-band frequency-modulated signals. Journal of the Acoustical Society of America 112: 334-344.
Kastelein, R.A., R. van Schie, W. Verboom, and D. Haan. 2005. Underwater hearing sensitivity of a male and a female Steller sea lion (Eumetopias jubatus). Journal of the Acoustical Society of America 118: 1820-1829.
Muslow, J., and C. Reichmuth. 2010. Psychophysical and electrophysiological aerial audiograms of a Steller sea lion (Eumetopias jubatus). Journal of the Acoustical Society of America 127: 692-2701.
Meadows, Dwayne. 2021. E-mail from [email protected] to [email protected], April 14, 2021.

Underwater Noise Technical Memo for Installation/Removal of Piles, Proposed Ketchikan Port Facility Recapitalization Project Ketchikan, AK
AECOM Page | 14
NOAA. 2018. Revision to: Technical Guidance for Assessing the Effects of Anthropogenic Sound on Marine Mammal Hearing (Version 2.0). Underwater Thresholds for Onset of Permanent and Temporary Threshold Shifts. U.S. Department of Commerce, National Oceanic and Atmospheric Administration. Available at: https://www.fisheries.noaa.gov/national/marine-mammal-protection/marine-mammal-acoustic-technical-guidance.
NOAA. 2013. Draft guidance for assessing the effects of anthropogenic sound on marine mammals: Acoustic threshold levels for the onset of permanent and temporary threshold shifts. Available at: http://www.nmfs.noaa.gov/pr/acoustics/draft_acoustic_guidance_2013.pdf.
NMFS. 2021. NOAA Fisheries. Pacific White-sided Dolphin. Accessed online at https://www.fisheries.noaa.gov/species/pacific-white-sided-dolphin on August 13, 2021.
Southall, B.J., A.E. Bowles, W.T. Ellison, J.J. Finneran, R.L. Gentry, C.R. Greene Jr., D. Kastak, D.R. Ketten, J.H. Miller, P.E. Nachtigall, W.J. Richardson, J.A. Thomas, and P.L. Tyack. 2007. Marine mammal noise exposure criteria: Initial scientific recommendations. Aquatic Mammals 33: 411-521.

Underwater Noise Technical Memo for Installation/Removal of Piles, Proposed Ketchikan Port Facility Recapitalization Project Ketchikan, AK
AECOM Page | 15
ATTACHMENT A: USER SPREADSHEETS

90th Percentile ‐ Reference Level
Project TitlePile information (size, type, number, pile strikes, etc.)
Peak SEL RMS Effective QuietMeasured single strike level (dB) 210 182 196 150 101Distance (m) 10 10 10 15.24
20Estimated number of strikes 72
Cumulative SEL at measured distance201
Behavior
Peak RMS
dB Fish ≥ 2 g Fish < 2 g dBTransmission loss constant (15 if unknown) 206 187 183 150 160 120 90 100
15 18 82 151 12023 2590 2 54 17
Notes (source for estimates, etc.)
** This calculation assumes that single strike SELs < 150 dB do not accumulate to cause injury (Effective Quiet)
KetchikanImpact (Pontoon Restraint)
Fill in green cells: estimated sound levels and distances at which they were measured, estimated number of pile strikes per day, and transmision loss constant.
Acoustic Metric
Onset of Physical Injury
Beh
avio
ral
Har
assm
entCumulative SEL dB**
Distance (m) to threshold
Injury
Behavior, in Air, dB
Harbor Seal
Seal Lions
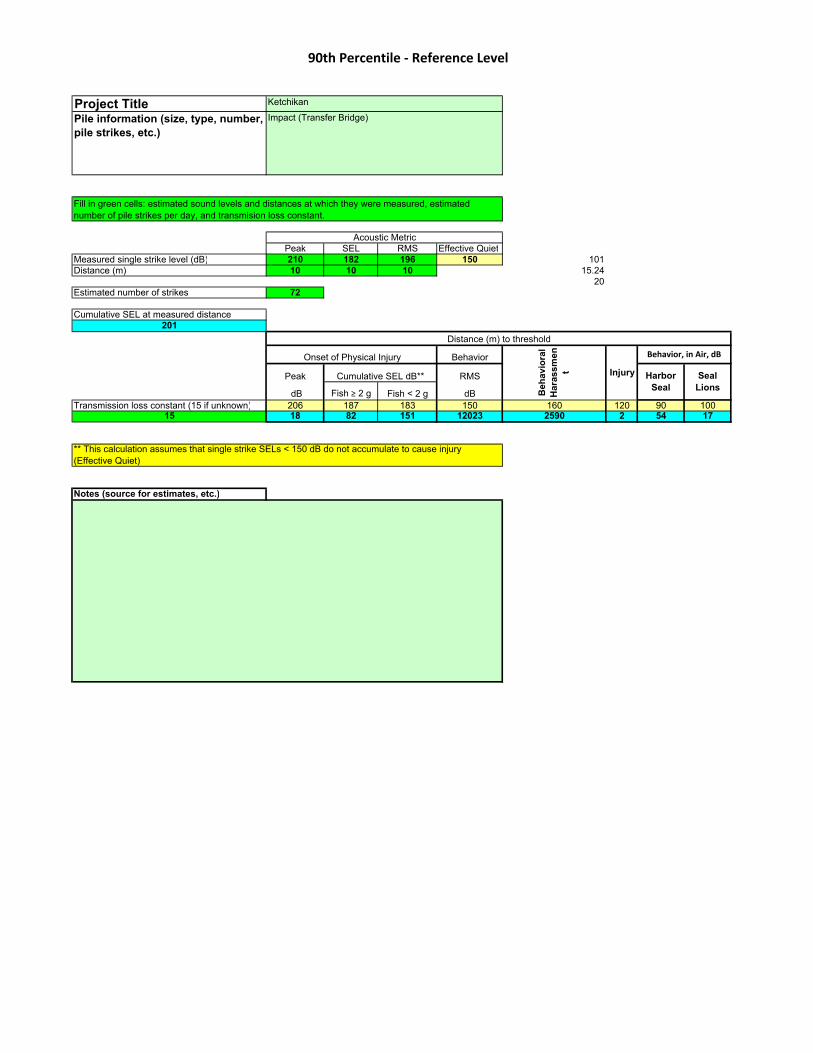
90th Percentile ‐ Reference Level
Project TitlePile information (size, type, number, pile strikes, etc.)
Peak SEL RMS Effective QuietMeasured single strike level (dB) 210 182 196 150 101Distance (m) 10 10 10 15.24
20Estimated number of strikes 72
Cumulative SEL at measured distance201
Behavior
Peak RMS
dB Fish ≥ 2 g Fish < 2 g dBTransmission loss constant (15 if unknown) 206 187 183 150 160 120 90 100
15 18 82 151 12023 2590 2 54 17
Notes (source for estimates, etc.)
** This calculation assumes that single strike SELs < 150 dB do not accumulate to cause injury (Effective Quiet)
KetchikanImpact (Transfer Bridge)
Fill in green cells: estimated sound levels and distances at which they were measured, estimated number of pile strikes per day, and transmision loss constant.
Acoustic Metric
Onset of Physical Injury
Beh
avio
ral
Har
assm
entCumulative SEL dB**
Distance (m) to threshold
Injury
Behavior, in Air, dB
Harbor Seal
Seal Lions

90th Percentile ‐ Reference Level
Project TitlePile information (size, type, number, pile strikes, etc.)
Peak SEL RMS Effective QuietMeasured single strike level (dB) 210 182 196 150 101Distance (m) 10 10 10 15.24
20Estimated number of strikes 72
Cumulative SEL at measured distance201
Behavior
Peak RMS
dB Fish ≥ 2 g Fish < 2 g dBTransmission loss constant (15 if unknown) 206 187 183 150 160 120 90 100
15 18 82 151 12023 2590 2 54 17
Notes (source for estimates, etc.)
Harbor Seal
Seal Lions
** This calculation assumes that single strike SELs < 150 dB do not accumulate to cause injury (Effective Quiet)
KetchikanImpact (Moorage Float)
Fill in green cells: estimated sound levels and distances at which they were measured, estimated number of pile strikes per day, and transmision loss constant.
Acoustic Metric
Distance (m) to threshold
Onset of Physical Injury
Beh
avio
ral
Har
assm
ent Injury
Behavior, in Air, dB
Cumulative SEL dB**

90th Percentile ‐ Reference Level
Project TitlePile information (size, type, number, pile strikes, etc.)
Peak SEL RMS Effective QuietMeasured single strike level (dB) 179 154 164 150 98Distance (m) 10 10 10 15.24
20Estimated number of strikes 37500
Cumulative SEL at measured distance200
Behavior
Peak RMS
dB Fish ≥ 2 g Fish < 2 g dBTransmission loss constant (15 if unknown) 206 187 183 150 160 120 90 100
15 0 18 18 86 18 1 38 12
Notes (source for estimates, etc.)
** This calculation assumes that single strike SELs < 150 dB do not accumulate to cause injury (Effective Quiet)
KetchikanDTH (Pontoon Restraint)
Fill in green cells: estimated sound levels and distances at which they were measured, estimated number of pile strikes per day, and transmision loss constant.
Acoustic Metric
Onset of Physical Injury
Beh
avio
ral
Har
assm
entCumulative SEL dB**
Distance (m) to threshold
Injury
Behavior, in Air, dB
Harbor Seal
Seal Lions

90th Percentile ‐ Reference Level
Project TitlePile information (size, type, number, pile strikes, etc.)
Peak SEL RMS Effective QuietMeasured single strike level (dB) 179 154 164 150 98Distance (m) 10 10 10 15.24
20Estimated number of strikes 37500
Cumulative SEL at measured distance200
Behavior
Peak RMS
dB Fish ≥ 2 g Fish < 2 g dBTransmission loss constant (15 if unknown) 206 187 183 150 160 120 90 100
15 0 18 18 86 18 1 38 12
Notes (source for estimates, etc.)
** This calculation assumes that single strike SELs < 150 dB do not accumulate to cause injury (Effective Quiet)
KetchikanDTH (Transfer Bridge)
Fill in green cells: estimated sound levels and distances at which they were measured, estimated number of pile strikes per day, and transmision loss constant.
Acoustic Metric
Onset of Physical Injury
Beh
avio
ral
Har
assm
entCumulative SEL dB**
Distance (m) to threshold
Injury
Behavior, in Air, dB
Harbor Seal
Seal Lions

90th Percentile ‐ Reference Level
Project TitlePile information (size, type, number, pile strikes, etc.)
Peak SEL RMS Effective QuietMeasured single strike level (dB) 179 154 164 150 98Distance (m) 10 10 10 15.24
20Estimated number of strikes 37500
Cumulative SEL at measured distance200
Behavior
Peak RMS
dB Fish ≥ 2 g Fish < 2 g dBTransmission loss constant (15 if unknown) 206 187 183 150 160 120 90 100
15 0 18 18 86 18 1 38 12
Notes (source for estimates, etc.)
Harbor Seal
Seal Lions
** This calculation assumes that single strike SELs < 150 dB do not accumulate to cause injury (Effective Quiet)
KetchikanDTH (Moorage Float)
Fill in green cells: estimated sound levels and distances at which they were measured, estimated number of pile strikes per day, and transmision loss constant.
Acoustic Metric
Distance (m) to threshold
Onset of Physical Injury
Beh
avio
ral
Har
assm
ent Injury
Behavior, in Air, dB
Cumulative SEL dB**

90th Percentile ‐ Reference Level
Project TitlePile information (size, type, number, pile strikes, etc.)
Peak SEL RMS Effective QuietMeasured single strike level (dB) 181 156 166 150 95Distance (m) 10 10 10 15.24
20Estimated number of strikes 37500
Cumulative SEL at measured distance202
Behavior
Peak RMS
dB Fish ≥ 2 g Fish < 2 g dBTransmission loss constant (15 if unknown) 206 187 183 150 120 120 90 100
15 0 25 25 117 11659 1 27 9
Notes (source for estimates, etc.)
** This calculation assumes that single strike SELs < 150 dB do not accumulate to cause injury (Effective Quiet)
KetchikanDTH Vibratory (Pontoon Restraint)
Fill in green cells: estimated sound levels and distances at which they were measured, estimated number of pile strikes per day, and transmision loss constant.
Acoustic Metric
Onset of Physical Injury
Beh
avio
ral
Har
assm
entCumulative SEL dB**
Distance (m) to threshold
Injury
Behavior, in Air, dB
Harbor Seal
Seal Lions

90th Percentile ‐ Reference Level
Project TitlePile information (size, type, number, pile strikes, etc.)
Peak SEL RMS Effective QuietMeasured single strike level (dB) 181 156 166 150 95Distance (m) 10 10 10 15.24
20Estimated number of strikes 37500
Cumulative SEL at measured distance202
Behavior
Peak RMS
dB Fish ≥ 2 g Fish < 2 g dBTransmission loss constant (15 if unknown) 206 187 183 150 120 120 90 100
15 0 25 25 117 11659 1 27 9
Notes (source for estimates, etc.)
** This calculation assumes that single strike SELs < 150 dB do not accumulate to cause injury (Effective Quiet)
KetchikanDTH Vibratory (Transfer Bridge)
Fill in green cells: estimated sound levels and distances at which they were measured, estimated number of pile strikes per day, and transmision loss constant.
Acoustic Metric
Onset of Physical Injury
Beh
avio
ral
Har
assm
entCumulative SEL dB**
Distance (m) to threshold
Injury
Behavior, in Air, dB
Harbor Seal
Seal Lions

90th Percentile ‐ Reference Level
Project TitlePile information (size, type, number, pile strikes, etc.)
Peak SEL RMS Effective QuietMeasured single strike level (dB) 181 156 166 150 95Distance (m) 10 10 10 15.24
20Estimated number of strikes 37500
Cumulative SEL at measured distance202
Behavior
Peak RMS
dB Fish ≥ 2 g Fish < 2 g dBTransmission loss constant (15 if unknown) 206 187 183 150 120 120 90 100
15 0 25 25 117 11659 1 27 9
Notes (source for estimates, etc.)
Harbor Seal
Seal Lions
** This calculation assumes that single strike SELs < 150 dB do not accumulate to cause injury (Effective Quiet)
KetchikanDTH Vibratory (Moorage Float)
Fill in green cells: estimated sound levels and distances at which they were measured, estimated number of pile strikes per day, and transmision loss constant.
Acoustic Metric
Distance (m) to threshold
Onset of Physical Injury
Beh
avio
ral
Har
assm
ent Injury
Behavior, in Air, dB
Cumulative SEL dB**

90th Percentile ‐ Reference Level
Project TitlePile information (size, type, number, pile strikes, etc.)
Peak SEL RMS Effective QuietMeasured single strike level (dB) 184 145 157 150 95 Sonic PileDistance (m) 10 10 10 15.24 Distance
20 Transmission Loss ConstantEstimated number of strikes 1200
Cumulative SEL at measured distance176
Behavior
Peak RMS
dB Fish ≥ 2 g Fish < 2 g dBTransmission loss constant (15 if unknown) 206 187 183 150 120 120 90 100
15 0 2 3 29 2929 1 27 9
Notes (source for estimates, etc.)
** This calculation assumes that single strike SELs < 150 dB do not accumulate to cause injury (Effective Quiet)
KetchikanTimber Piles Vibratory Removal (Trestle)
Fill in green cells: estimated sound levels and distances at which they were measured, estimated number of pile strikes per day, and transmision loss constant.
Acoustic Metric
Onset of Physical Injury
Beh
avio
ral
Har
assm
entCumulative SEL dB**
Distance (m) to threshold
Injury
Behavior, in Air, dB
Harbor Seal
Seal Lions

90th Percentile ‐ Reference Level
A.1: Vibratory Pile Driving (STATIONARY SOURCE: Non-Impulsive, Continuous)VERSION 2.2: 2020KEY
Action Proponent Provided Information
NMFS Provided Information (Technical Guidance)
Resultant Isopleth
STEP 1: GENERAL PROJECT INFORMATION
PROJECT TITLE Ketchikan 2021
PROJECT/SOURCE INFORMATION Timber piles (trestle)
Please include any assumptions
PROJECT CONTACT Project Manager
STEP 2: WEIGHTING FACTOR ADJUSTMENT
Specify if relying on source-specific WFA, alternative weighting/dB adjustment, or if using default value
Weighting Factor Adjustment (kHz)¥ 2.5
¥ Broadband: 95% frequency contour percentile (kHz) OR Narrowband: frequency (kHz); For appropriate default WFA: See INTRODUCTION tab † If a user relies on alternative weighting/dB adjustment rather than relying upon the WFA (source-specific
or default), they may override the Adjustment (dB) (row 48), and enter the new value directlyHowever, they must provide additional support and documentation supporting this modification

90th Percentile ‐ Reference Level
STEP 3: SOURCE-SPECIFIC INFORMATION
Sound Pressure Level (L rms),
specified at "x" meters (Cell B30)157
Number of piles within 24-h period 10
Duration to drive a single pile (minutes)
2
Duration of Sound Production within 24-h period (seconds)
1200
10 Log (duration of sound production) 30.79 NOTE: The User Spreadsheet tool provides a means to estimates distances associated
Transmission loss coefficient 15 with the Technical Guidance’s PTS onset thresholds. Mitigation and monitoring Distance of sound pressure level (L rms) measurement (meters) 10 requirements associated with a Marine Mammal Protection Act (MMPA) authorization or an
Endangered Species Act (ESA) consultation or permit are independent management decisions made in the context of the proposed activity and comprehensive effects analysis, and are beyond the scope of the Technical Guidance and the User Spreadsheet tool.
RESULTANT ISOPLETHS
Hearing GroupLow-Frequency
Cetaceans Mid-Frequency
Cetaceans High-Frequency
CetaceansPhocid
Pinnipeds Otariid
Pinnipeds
SELcum Threshold 199 198 173 201 219PTS Isopleth to threshold
(meters) 1.8 0.2 2.6 1.1 0.1
WEIGHTING FUNCTION CALCULATIONS
Weighting Function Parameters
Low-Frequency Cetaceans
Mid-Frequency Cetaceans
High-Frequency Cetaceans
Phocid Pinnipeds
Otariid Pinnipeds
a 1 1.6 1.8 1 2b 2 2 2 2 2f1 0.2 8.8 12 1.9 0.94f2 19 110 140 30 25 NOTE: If user decided to override these Adjustment values,
C 0.13 1.2 1.36 0.75 0.64 they need to make sure to download another copy
Adjustment (-dB)† -0.05 -16.83 -23.50 -1.29 -0.60 to ensure the built-in calculations function properly.
156.25 0.017826393 0.003528024 1.731301939 50.03208714157.25 1.132226089 1.079477462 2.731301939 65.17875984
1.034925779 1.001033325 1.000637857 1.013937114 1.02010.960108173 0.0157283 0.003266187 0.625161295 0.752488349

90th Percentile ‐ Reference Level
E.1: IMPACT PILE DRIVING (STATIONARY SOURCE: Impulsive, Intermittent)VERSION 2.2: 2020
KEYAction Proponent Provided Information
NMFS Provided Information (Technical Guidance)
Resultant Isopleth
STEP 1: GENERAL PROJECT INFORMATION
PROJECT TITLE Ketchikan 2021
PROJECT/SOURCE INFORMATION Impact (Transfer Bridge)
Please include any assumptions
PROJECT CONTACT Project Manager
STEP 2: WEIGHTING FACTOR ADJUSTMENT
Specify if relying on source-specific WFA, alternative weighting/dB adjustment, or if using default value
Weighting Factor Adjustment (kHz)¥ 2
¥ Broadband: 95% frequency contour percentile (kHz); For appropriate default WFA: See INTRODUCTION tab † If a user relies on alternative weighting/dB adjustment rather than relying upon the WFA (source-specific
or default), they may override the Adjustment (dB) (row 73), and enter the new value directlyHowever, they must provide additional support and documentation supporting this modification
STEP 3: SOURCE-SPECIFIC INFORMATION
NOTE: METHOD E.1-1 is PREFERRED method when SEL-based source levels are available (because pulse duration is not required). Only use method E.1-2 if SEL-based source levels are not available.
E.1-1: METHOD TO CALCULATE PK AND SELcum (SINGLE STRIKE EQUIVALENT) PREFERRED METHOD (pulse duration not needed)Unweighted SELcum (at measured distance) = SELss
+ 10 Log (# strikes)200.7
SELcum PK
Single Strike SELss (L E ,p, single strike) specified at "x" meters (Cell B32)
182L p,0-pk specified at "x" meters (Cell G29)
210
Number of strikes per pile 48Distance of L p,0-pk
measurement (meters)⁺
10
Number of piles per day 1.5 L p,0-pk Source level 224.8
Transmission loss coefficient 15Distance of single strike SELss (L E ,p, single
strike) measurement (meters) 10

90th Percentile ‐ Reference Level
RESULTANT ISOPLETHS* *Impulsive sounds have dual metric thresholds (SELcum & PK). Metric producing largest isopleth should be used.
Hearing GroupLow-Frequency
Cetaceans Mid-Frequency
Cetaceans High-Frequency
CetaceansPhocid
Pinnipeds Otariid
Pinnipeds
SELcum Threshold 183 185 155 185 203
PTS Isopleth to threshold (meters) 150.5 5.4 179.3 80.6 5.9
“NA”: PK source level is < to the threshold for PK Threshold 219 230 202 218 232
that marine mammal hearing group. PTS PK Isopleth to threshold (meters) 2.4 NA 33.1 2.8 NA
E.1-2: METHOD TO CALCULATE PK AND SELcum (USING RMS SPL SOURCE LEVEL)SELcum PK
Sound Pressure Level (L rms), specified at "x" meters (Cell B53)
L p,0-pk specified at "x" meters (Cell G47)
Number of piles per dayDistance of L p,0-pk
measurement (meters)⁺
Strike (pulse) DurationΔ (seconds) L p,0-pk Source level #NUM!Number of strikes per pile
Duration of Sound Production (seconds) 0
10 Log (duration of sound production) #NUM! NOTE: The User Spreadsheet tool provides a means to estimates distances associated
Transmission loss coefficient with the Technical Guidance’s PTS onset thresholds. Mitigation and monitoring Distance of sound pressure level (L rms) measurement (meters) requirements associated with a Marine Mammal Protection Act (MMPA) authorization or ΔWindow that makes up 90% of total cumulative energy (5%-95%) based on Madsen 2005 an Endangered Species Act (ESA) consultation or permit are independent management
decisions made in the context of the proposed activity and comprehensive effects analysis, and are beyond the scope of the Technical Guidance and the User Spreadsheet too
RESULTANT ISOPLETHS* *Impulsive sounds have dual metric thresholds (SELcum & PK). Metric producing largest isopleth should be used.
Hearing GroupLow-Frequency
Cetaceans Mid-Frequency
Cetaceans High-Frequency
CetaceansPhocid
Pinnipeds Otariid
Pinnipeds
SELcum Threshold 183 185 155 185 203
PTS Isopleth to threshold (meters) #NUM! #NUM! #NUM! #NUM! #NUM!
“NA”: PK source level is < to the threshold for PK Threshold 219 230 202 218 232
that marine mammal hearing group. PTS PK Isopleth to threshold (meters) #NUM! #NUM! #NUM! #NUM! #NUM!
WEIGHTING FUNCTION CALCULATIONS
Weighting Function Parameters
Low-Frequency Cetaceans
Mid-Frequency Cetaceans
High-Frequency Cetaceans
Phocid Pinnipeds
Otariid Pinnipeds
a 1 1.6 1.8 1 2b 2 2 2 2 2f1 0.2 8.8 12 1.9 0.94f2 19 110 140 30 25 NOTE: If user decided to override these Adjustment values,
C 0.13 1.2 1.36 0.75 0.64 they need to make sure to download another copy
Adjustment (-dB)† -0.01 -19.74 -26.87 -2.08 -1.15 to ensure the built-in calculations function properly.
100 0.008728738 0.001579994 1.108033241 20.49314289 the source either unweighted (i.e., set Adjustment to zero) or to input specific information101 1.083916614 1.050554535 2.108033241 30.54701342
1.022283439 1.000661266 1.000408205 1.008908642 1.012840960.968517118 0.008047639 0.001503348 0.520982928 0.6623668

90th Percentile ‐ Reference Level
E.1: IMPACT PILE DRIVING (STATIONARY SOURCE: Impulsive, Intermittent)VERSION 2.2: 2020
KEYAction Proponent Provided Information
NMFS Provided Information (Technical Guidance)
Resultant Isopleth
STEP 1: GENERAL PROJECT INFORMATION
PROJECT TITLE Ketchikan 2021
PROJECT/SOURCE INFORMATION Impact (Moorage Float)
Please include any assumptions
PROJECT CONTACT Project Manager
STEP 2: WEIGHTING FACTOR ADJUSTMENT
Specify if relying on source-specific WFA, alternative weighting/dB adjustment, or if using default value
Weighting Factor Adjustment (kHz)¥ 2
¥ Broadband: 95% frequency contour percentile (kHz); For appropriate default WFA: See INTRODUCTION tab † If a user relies on alternative weighting/dB adjustment rather than relying upon the WFA (source-specific
or default), they may override the Adjustment (dB) (row 73), and enter the new value directlyHowever, they must provide additional support and documentation supporting this modification
STEP 3: SOURCE-SPECIFIC INFORMATION
NOTE: METHOD E.1-1 is PREFERRED method when SEL-based source levels are available (because pulse duration is not required). Only use method E.1-2 if SEL-based source levels are not available.
E.1-1: METHOD TO CALCULATE PK AND SELcum (SINGLE STRIKE EQUIVALENT) PREFERRED METHOD (pulse duration not needed)Unweighted SELcum (at measured distance) = SELss
+ 10 Log (# strikes)200.7
SELcum PK
Single Strike SELss (L E ,p, single strike) specified at "x" meters (Cell B32)
182L p,0-pk specified at "x" meters (Cell G29)
210
Number of strikes per pile 48Distance of L p,0-pk
measurement (meters)⁺
10
Number of piles per day 1.5 L p,0-pk Source level 224.8
Transmission loss coefficient 15Distance of single strike SELss (L E ,p, single
strike) measurement (meters) 10

90th Percentile ‐ Reference Level
RESULTANT ISOPLETHS* *Impulsive sounds have dual metric thresholds (SELcum & PK). Metric producing largest isopleth should be used.
Hearing GroupLow-Frequency
Cetaceans Mid-Frequency
Cetaceans High-Frequency
CetaceansPhocid
Pinnipeds Otariid
Pinnipeds
SELcum Threshold 183 185 155 185 203
PTS Isopleth to threshold (meters) 150.5 5.4 179.3 80.6 5.9
“NA”: PK source level is < to the threshold for PK Threshold 219 230 202 218 232
that marine mammal hearing group. PTS PK Isopleth to threshold (meters) 2.4 NA 33.1 2.8 NA
E.1-2: METHOD TO CALCULATE PK AND SELcum (USING RMS SPL SOURCE LEVEL)SELcum PK
Sound Pressure Level (L rms), specified at "x" meters (Cell B53)
L p,0-pk specified at "x" meters (Cell G47)
Number of piles per dayDistance of L p,0-pk
measurement (meters)⁺
Strike (pulse) DurationΔ (seconds) L p,0-pk Source level #NUM!Number of strikes per pile
Duration of Sound Production (seconds) 0
10 Log (duration of sound production) #NUM! NOTE: The User Spreadsheet tool provides a means to estimates distances associated
Transmission loss coefficient with the Technical Guidance’s PTS onset thresholds. Mitigation and monitoring Distance of sound pressure level (L rms) measurement (meters) requirements associated with a Marine Mammal Protection Act (MMPA) authorization or ΔWindow that makes up 90% of total cumulative energy (5%-95%) based on Madsen 2005 an Endangered Species Act (ESA) consultation or permit are independent management
decisions made in the context of the proposed activity and comprehensive effects analysis, and are beyond the scope of the Technical Guidance and the User Spreadsheet tool
RESULTANT ISOPLETHS* *Impulsive sounds have dual metric thresholds (SELcum & PK). Metric producing largest isopleth should be used.
Hearing GroupLow-Frequency
Cetaceans Mid-Frequency
Cetaceans High-Frequency
CetaceansPhocid
Pinnipeds Otariid
Pinnipeds
SELcum Threshold 183 185 155 185 203
PTS Isopleth to threshold (meters) #NUM! #NUM! #NUM! #NUM! #NUM!
“NA”: PK source level is < to the threshold for PK Threshold 219 230 202 218 232
that marine mammal hearing group. PTS PK Isopleth to threshold (meters) #NUM! #NUM! #NUM! #NUM! #NUM!
WEIGHTING FUNCTION CALCULATIONS
Weighting Function Parameters
Low-Frequency Cetaceans
Mid-Frequency Cetaceans
High-Frequency Cetaceans
Phocid Pinnipeds
Otariid Pinnipeds
a 1 1.6 1.8 1 2b 2 2 2 2 2f1 0.2 8.8 12 1.9 0.94f2 19 110 140 30 25 NOTE: If user decided to override these Adjustment values,
C 0.13 1.2 1.36 0.75 0.64 they need to make sure to download another copy
Adjustment (-dB)† -0.01 -19.74 -26.87 -2.08 -1.15 to ensure the built-in calculations function properly.
100 0.008728738 0.001579994 1.108033241 20.49314289 the source either unweighted (i.e., set Adjustment to zero) or to input specifi101 1.083916614 1.050554535 2.108033241 30.54701342
1.022283439 1.000661266 1.000408205 1.008908642 1.012840960.968517118 0.008047639 0.001503348 0.520982928 0.6623668

90th Percentile ‐ Reference Level
E.2: DTH PILE DRIVING/INSTALLATION (STATIONARY SOURCE: Impulsive, Intermittent)VERSION 2.2: 2020
KEYAction Proponent Provided Information
NMFS Provided Information (Technical Guidance)
Resultant Isopleth
STEP 1: GENERAL PROJECT INFORMATION
PROJECT TITLE Ketchikan 2021
PROJECT/SOURCE INFORMATION Impact (Transfer Bridge)
Please include any assumptions
PROJECT CONTACT Project Manager
STEP 2: WEIGHTING FACTOR ADJUSTMENT
Specify if relying on source-specific WFA, alternative weighting/dB adjustment, or if using default value
Weighting Factor Adjustment (kHz)¥ 2
¥ Broadband: 95% frequency contour percentile (kHz); For appropriate default WFA: See INTRODUCTION tab † If a user relies on alternative weighting/dB adjustment rather than relying upon the WFA (source-specific
or default), they may override the Adjustment (dB) (row 50), and enter the new value directlyHowever, they must provide additional support and documentation supporting this modification

90th Percentile ‐ Reference Level
STEP 3: SOURCE-SPECIFIC INFORMATIONUnweighted SELcum (at measured distance) = SELss
+ 10 Log (# strikes)199.7
SELcum PK
Single Strike SELss (L E ,p, single strike) specified at "x" meters (Cell B30)
154L p,0-pk specified at "x" meters (Cell G26)
179
Strike rate (average strikes per second) 25Distance of L p,0-pk
measurement (meters)⁺
10
Duration to drive pile (minutes) 16.66666667 L p,0-pk Source level 194.0
Number of piles per day 1.5
Transmission loss coefficient 15
Distance of single strike SELss (L E ,p, single
strike) measurement (meters) 10
Total number of strikes in a 24-h period 37500
RESULTANT ISOPLETHS* *Impulsive sounds have dual metric thresholds (SELcum & PK). Metric producing largest isopleth should be used.
Hearing GroupLow-Frequency
Cetaceans Mid-Frequency
Cetaceans High-Frequency
CetaceansPhocid
Pinnipeds Otariid
Pinnipeds
SELcum Threshold 183 185 155 185 203
PTS Isopleth to threshold (meters) 130.4 4.6 155.4 69.8 5.1
“NA”: PK source level is < to the threshold for PK Threshold 219 230 202 218 232
that marine mammal hearing group. PTS PK Isopleth to threshold (meters) NA NA NA NA NA
WEIGHTING FUNCTION CALCULATIONS
Weighting Function Parameters
Low-Frequency Cetaceans
Mid-Frequency Cetaceans
High-Frequency Cetaceans
Phocid Pinnipeds
Otariid Pinnipeds
a 1 1.6 1.8 1 2b 2 2 2 2 2f1 0.2 8.8 12 1.9 0.94f2 19 110 140 30 25 NOTE: If user decided to override these Adjustment values,
C 0.13 1.2 1.36 0.75 0.64 they need to make sure to download another copy
Adjustment (-dB)† -0.01 -19.74 -26.87 -2.08 -1.15 to ensure the built-in calculations function properly.
100 0.008728738 0.001579994 1.108033241 20.49314289101 1.083916614 1.050554535 2.108033241 30.54701342
1.022283439 1.000661266 1.000408205 1.008908642 1.012840960.968517118 0.008047639 0.001503348 0.520982928 0.6623668

90th Percentile ‐ Reference Level
E.2: DTH PILE DRIVING/INSTALLATION (STATIONARY SOURCE: Impulsive, Intermittent)VERSION 2.2: 2020
KEYAction Proponent Provided Information
NMFS Provided Information (Technical Guidance)
Resultant Isopleth
STEP 1: GENERAL PROJECT INFORMATION
PROJECT TITLE Ketchikan 2021
PROJECT/SOURCE INFORMATION Impact (Moorage Float)
Please include any assumptions
PROJECT CONTACT Project Manager
STEP 2: WEIGHTING FACTOR ADJUSTMENT
Specify if relying on source-specific WFA, alternative weighting/dB adjustment, or if using default value
Weighting Factor Adjustment (kHz)¥ 2
¥ Broadband: 95% frequency contour percentile (kHz); For appropriate default WFA: See INTRODUCTION tab † If a user relies on alternative weighting/dB adjustment rather than relying upon the WFA (source-specific
or default), they may override the Adjustment (dB) (row 50), and enter the new value directlyHowever, they must provide additional support and documentation supporting this modification

90th Percentile ‐ Reference Level
STEP 3: SOURCE-SPECIFIC INFORMATIONUnweighted SELcum (at measured distance) = SELss
+ 10 Log (# strikes)199.7
SELcum PK
Single Strike SELss (L E ,p, single strike) specified at "x" meters (Cell B30)
154L p,0-pk specified at "x" meters (Cell G26)
179
Strike rate (average strikes per second) 25Distance of L p,0-pk
measurement (meters)⁺
10
Duration to drive pile (minutes) 16.66666667 L p,0-pk Source level 194.0
Number of piles per day 1.5
Transmission loss coefficient 15
Distance of single strike SELss (L E ,p, single
strike) measurement (meters) 10
Total number of strikes in a 24-h period 37500
RESULTANT ISOPLETHS* *Impulsive sounds have dual metric thresholds (SELcum & PK). Metric producing largest isopleth should be used.
Hearing GroupLow-Frequency
Cetaceans Mid-Frequency
Cetaceans High-Frequency
CetaceansPhocid
Pinnipeds Otariid
Pinnipeds
SELcum Threshold 183 185 155 185 203
PTS Isopleth to threshold (meters) 130.4 4.6 155.4 69.8 5.1
“NA”: PK source level is < to the threshold for PK Threshold 219 230 202 218 232
that marine mammal hearing group. PTS PK Isopleth to threshold (meters) NA NA NA NA NA
WEIGHTING FUNCTION CALCULATIONS
Weighting Function Parameters
Low-Frequency Cetaceans
Mid-Frequency Cetaceans
High-Frequency Cetaceans
Phocid Pinnipeds
Otariid Pinnipeds
a 1 1.6 1.8 1 2b 2 2 2 2 2f1 0.2 8.8 12 1.9 0.94f2 19 110 140 30 25 NOTE: If user decided to override these Adjustment values,
C 0.13 1.2 1.36 0.75 0.64 they need to make sure to download another copy
Adjustment (-dB)† -0.01 -19.74 -26.87 -2.08 -1.15 to ensure the built-in calculations function properly.
100 0.008728738 0.001579994 1.108033241 20.49314289101 1.083916614 1.050554535 2.108033241 30.54701342
1.022283439 1.000661266 1.000408205 1.008908642 1.012840960.968517118 0.008047639 0.001503348 0.520982928 0.6623668

Introduction
Effect Metric Fish mass Threshold
Peak pressure N/A 206 dB (re: 1 µPa)
≥ 2 g 187 dB (re: 1µPa2•sec)
< 2 g 183 dB (re: 1µPa2•sec)
Adverse behavioral effectsRoot Mean Square Pressure
(RMS) N/A 150 dB (re: 1 µPa)
Onset of physical injury Accumulated Sound Exposure Level (SEL)
The criteria used for the onset of physical injury and adverse behavioral effects are listed in the table below. The onset of physical injury uses dual criteria - peak pressure and SEL. The onset of physical injury is expected if either of these criteria are exceeded. The criterion for accumulated SEL is based upon the mass of the fishes under consideration. If fishes smaller than 2 grams are present, then the more conservative 183 dB SEL criterion may be required.
DISCLAIMER: This spreadsheet was developed by NMFS as an in-house tool for assessing the potential effect to fishes exposed to elevated levels of underwater sound produced during pile driving. NMFS assumes no responsibility for interpretation of the results of these models by non-NMFS users.
Please contact the following NMFS staff to report errors or submit questions: John Stadler, NMFS Northwest Region, 360-753-9576, [email protected] Jacqueline Meyer, NMFS Southwest Region, 707-575-6057, [email protected]
This model is used to estimate the levels of underwater sound (peak and RMS pressure, as well as accumulated Sound Exposure Level [SEL]) received by fishes that are exposed to elevated levels of underwater sound produced during pile driving. It calculates the distance from the pile that the sound attenuates to threshold levels.

Assumptions
Cells in light green are for project identification, project specifics, and comments.
Output: Read the blue cellsA16 is the calculated cumulative SEL, in dB (re: 1µPa2•s), at measured distance from pileB22 is the distance (m) at which 206 dB peak is expected to be exceededC22 is the distance (m) at which 187 dB accumulated SEL is expected to be exceededD22 is the distance (m) at which 183 dB accumulated SEL is expected to be exceededE22 is the distance (m) at which 150 dB rms is expected to be exceeded
E21 is the RMS criteria for adverse behavioral disruption (see table above)
C11 is the distance (m) from the pile where SEL was measuredD10 is the estimated single strike RMS pressure (dB re: 1µPa). If no direct measurement available, then RMS = peak pressure minus 15D11 is the distance (m) from the pile where RMS pressure was measuredB13 is the expected number of pile strikes A22 is the Transmission Loss Constant. Default is 15 unless site-specific transmission loss information is available.A28 is for comments on assumptions, sources of estimates of metrics, pile size, etc.
Preset ValuesE10 is the SEL for "effective quiet" (current set at 150 dB)B21 is the peak pressure criteria (see table above)C21 is the SEL criteria for when all fish are 2 grams or larger (see table above)D21 is the SEL criteria for when fish smaller than 2 grams are present (see table above)
C10 is the estimated single strike SEL (dB re: 1µPa2s). If no direct measurement available, then SEL = peak pressure minus 25.
1) Estimates of underwater sound are based on measured levels from similar size and type of pile. Please refer to Caltrans' compendium (http://www.dot.ca.gov/hq/env/bio/files/pile_driving_snd_comp9_27_07.pdf).2) Fish are assumed to remain stationary and the single strike SEL does not vary in magnitude between strikes. Cumulative SEL = single-strike SEL + 10*log(# strikes).3) Currently there are no data to support a tissue recovery allowance between pile strikes. Therefore, all strikes in any given day are counted, regardless of time between strikes. However, generally the accumulated SEL can be reset to zero overnight (or after a 12 hour period), especially in a river or tidally-influenced waterway when the fish should be moving.4) Effective Quiet. When the received SEL from an individual pile strike is below a certain level, then the accumulated energy from multiple strikes would not contribute to injury, regardless of how many pile strikes occur. This SEL is referred to as “effective quiet”, and is assumed, for the purposes of this spreadsheet, to be 150 dB (re: 1 µPa2*sec). Effective quiet establishes a limit on the maximum distance from the pile where injury to fishes is expected – the distance at which the single-strike SEL attenuates to 150 dB. Beyond this distance, no physical injury is expected, regardless of the number of pile strikes. However, the severity of the injury can increase within this zone as the number of strikes increases.5) NMFS recommends using the Practical Spreading Loss model (TL = 15*log(1/R0)), unless data are available to support adifferent model.
Worksheet CalculatorInput: Fill in the green colored cells - NOTE: THERE ARE NO DEFAULT VALUES FOR THE GREEN CELLSB10 is the estimated single strike peak pressure (dB re: 1µPa)B11 is the distance (m) from the pile where peak pressure was measured

Mean ‐ Reference Level
Project TitlePile information (size, type, number, pile strikes, etc.)
Peak SEL RMS Effective QuietMeasured single strike level (dB) 209 181 195 150 Level 101Distance (m) 10 10 10 Dist. 15.24
R 20Estimated number of strikes 72
Cumulative SEL at measured distance199
Behavior
Peak RMS
dB Fish ≥ 2 g Fish < 2 g dBTransmission loss constant (15 if unknown) 206 187 183 150 160 120 90 100
15 15 66 122 9550 2057 2 54 17
Notes (source for estimates, etc.)
KetchikanImpact (Pontoon Restraint)
Fill in green cells: estimated sound levels and distances at which they were measured, estimated number of pile strikes per day, and transmision loss constant.
Acoustic Metric
Onset of Physical Injury
Cumulative SEL dB**
Distance (m) to threshold
Injury Harbor Seal
Behavior, in Air, dB
Seal Lions
** This calculation assumes that single strike SELs < 150 dB do not accumulate to cause injury (EffectiveQuiet)
Be
ha
vio
ral
Ha
ras
sm
en
t

Mean ‐ Reference Level
Project TitlePile information (size, type, number, pile strikes, etc.)
Peak SEL RMS Effective QuietMeasured single strike level (dB 209 181 195 150 Level 101Distance (m) 10 10 10 Dist. 15.24
R 20Estimated number of strikes 72
Cumulative SEL at measured distance199
BehaviorPeak RMS dB Fish ≥ 2 g Fish < 2 g dB
Transmission loss constant (15 if unknown 206 187 183 150 160 120 90 10015 15 66 122 9550 2057 2 54 17
Notes (source for estimates, etc.)
** This calculation assumes that single strike SELs < 150 dB do not accumulate to cause injury (EffectiveQuiet)
KetchikanImpact (Transfer Bridge)
Fill in green cells: estimated sound levels and distances at which they were measured, estimated numbeof pile strikes per day, and transmision loss constant.
Acoustic Metric
Onset of Physical InjuryBehavioral
HarassmentCumulative SEL dB**
Distance (m) to thresholdBehavior, in Air, dBHarbor
SealSeal
LionsInjury

Mean ‐ Reference Level
Project TitlePile information (size, type, number, pile strikes, etc.)
Peak SEL RMS Effective QuietMeasured single strike level (dB 209 181 195 150 Level 101Distance (m) 10 10 10 Dist. 15.24
R 20Estimated number of strikes 72
Cumulative SEL at measured distance199
BehaviorPeak RMS dB Fish ≥ 2 g Fish < 2 g dB
Transmission loss constant (15 if unknown 206 187 183 150 160 120 90 10015 15 66 122 9550 2057 2 54 17
Notes (source for estimates, etc.)
Harbor Seal
Seal Lions
** This calculation assumes that single strike SELs < 150 dB do not accumulate to cause injury (EffectiveQuiet)
KetchikanImpact (Moorage Float)
Fill in green cells: estimated sound levels and distances at which they were measured, estimated numbeof pile strikes per day, and transmision loss constant.
Acoustic Metric
Distance (m) to thresholdOnset of Physical Injury
Behavioral Harassment
InjuryBehavior, in Air, dB
Cumulative SEL dB**

Mean ‐ Reference Level
Project TitlePile information (size, type, number, pile strikes, etc.)
Peak SEL RMS Effective QuietMeasured single strike level (dB) 179 154 164 150 Level 98Distance (m) 10 10 10 Dist. 15.24
R 20Estimated number of strikes 37500
Cumulative SEL at measured distance200
Behavior
Peak RMS
dB Fish ≥ 2 g Fish < 2 g dBTransmission loss constant (15 if unknown) 206 187 183 150 160 120 90 100
15 0 18 18 86 18 1 38 12
Notes (source for estimates, etc.)
Seal Lions
Injury
** This calculation assumes that single strike SELs < 150 dB do not accumulate to cause injury (EffectiveQuiet)
KetchikanDTH (Pontoon Restraint)
Fill in green cells: estimated sound levels and distances at which they were measured, estimated number of pile strikes per day, and transmision loss constant.
Acoustic Metric
Onset of Physical Injury
Be
ha
vio
ral
Ha
ras
sm
en
tCumulative SEL dB**
Distance (m) to thresholdBehavior, in Air, dB
Harbor Seal

Mean ‐ Reference Level
Project TitlePile information (size, type, number, pile strikes, etc.)
Peak SEL RMS Effective QuietMeasured single strike level (dB) 179 154 164 150 Level 98Distance (m) 10 10 10 Dist. 15.24
R 20Estimated number of strikes 37500
Cumulative SEL at measured distance200
Behavior
Peak RMS
dB Fish ≥ 2 g Fish < 2 g dBTransmission loss constant (15 if unknown) 206 187 183 150 160 120 90 100
15 0 18 18 86 18 1 38 12
Notes (source for estimates, etc.)
** This calculation assumes that single strike SELs < 150 dB do not accumulate to cause injury (EffectiveQuiet)
KetchikanDTH (Transfer Bridge)
Fill in green cells: estimated sound levels and distances at which they were measured, estimated number of pile strikes per day, and transmision loss constant.
Acoustic Metric
Onset of Physical Injury
Be
ha
vio
ral
Ha
ras
sm
en
tCumulative SEL dB**
Distance (m) to threshold
Injury
Behavior, in Air, dB
Harbor Seal
Seal Lions

Mean ‐ Reference Level
Project TitlePile information (size, type, number, pile strikes, etc.)
Peak SEL RMS Effective QuietMeasured single strike level (dB) 179 154 164 150 Level 98Distance (m) 10 10 10 Dist. 15.24
R 20Estimated number of strikes 37500
Cumulative SEL at measured distance200
Behavior
Peak RMS
dB Fish ≥ 2 g Fish < 2 g dBTransmission loss constant (15 if unknown) 206 187 183 150 160 120 90 100
15 0 18 18 86 18 1 38 12
Notes (source for estimates, etc.)
Harbor Seal
Seal Lions
** This calculation assumes that single strike SELs < 150 dB do not accumulate to cause injury (EffectiveQuiet)
KetchikanDTH (Moorage Float)
Fill in green cells: estimated sound levels and distances at which they were measured, estimated number of pile strikes per day, and transmision loss constant.
Acoustic Metric
Distance (m) to threshold
Onset of Physical Injury
Be
ha
vio
ral
Ha
ras
sm
en
t Injury
Behavior, in Air, dB
Cumulative SEL dB**
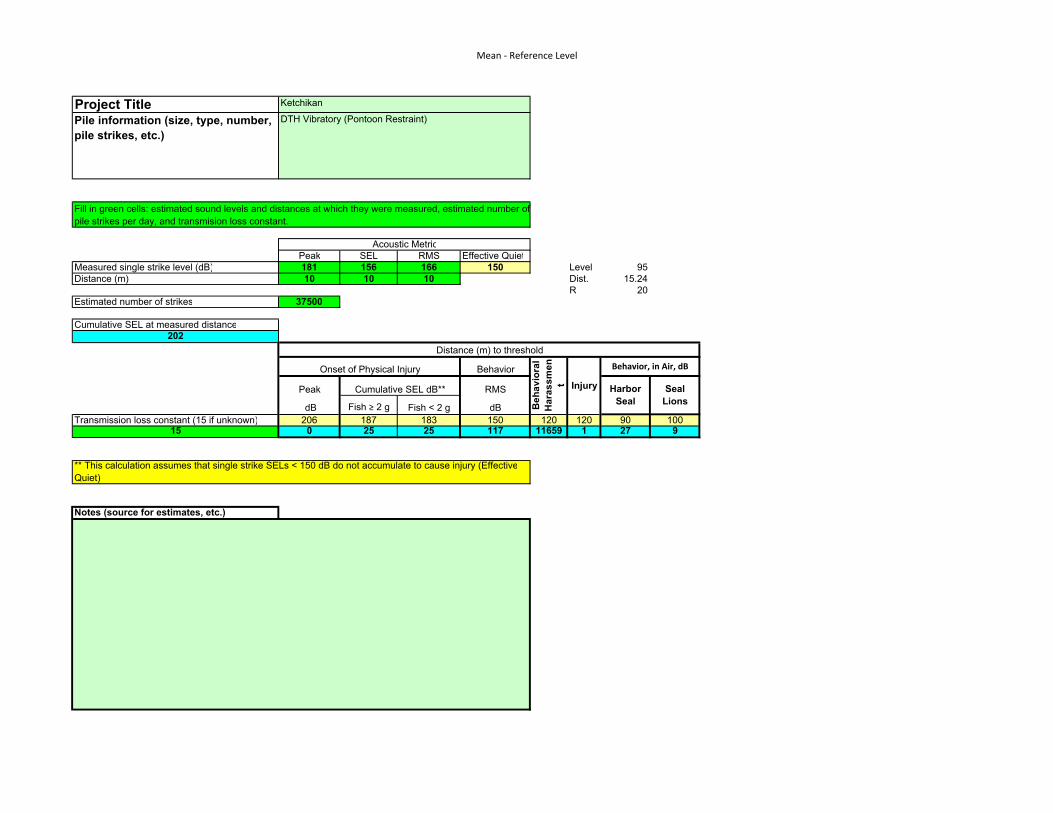
Mean ‐ Reference Level
Project TitlePile information (size, type, number, pile strikes, etc.)
Peak SEL RMS Effective QuietMeasured single strike level (dB) 181 156 166 150 Level 95Distance (m) 10 10 10 Dist. 15.24
R 20Estimated number of strikes 37500
Cumulative SEL at measured distance202
Behavior
Peak RMS
dB Fish ≥ 2 g Fish < 2 g dBTransmission loss constant (15 if unknown) 206 187 183 150 120 120 90 100
15 0 25 25 117 11659 1 27 9
Notes (source for estimates, etc.)
** This calculation assumes that single strike SELs < 150 dB do not accumulate to cause injury (EffectiveQuiet)
KetchikanDTH Vibratory (Pontoon Restraint)
Fill in green cells: estimated sound levels and distances at which they were measured, estimated number of pile strikes per day, and transmision loss constant.
Acoustic Metric
Onset of Physical Injury
Be
ha
vio
ral
Ha
ras
sm
en
tCumulative SEL dB**
Distance (m) to threshold
Injury
Behavior, in Air, dB
Harbor Seal
Seal Lions

Mean ‐ Reference Level
Project TitlePile information (size, type, number, pile strikes, etc.)
Peak SEL RMS Effective QuietMeasured single strike level (dB) 181 156 166 150 Level 95Distance (m) 10 10 10 Dist. 15.24
R 20Estimated number of strikes 37500
Cumulative SEL at measured distance202
Behavior
Peak RMS
dB Fish ≥ 2 g Fish < 2 g dBTransmission loss constant (15 if unknown) 206 187 183 150 120 120 90 100
15 0 25 25 117 11659 1 27 9
Notes (source for estimates, etc.)
** This calculation assumes that single strike SELs < 150 dB do not accumulate to cause injury (EffectiveQuiet)
KetchikanDTH Vibratory (Moorage Float)
Fill in green cells: estimated sound levels and distances at which they were measured, estimated number of pile strikes per day, and transmision loss constant.
Acoustic Metric
Onset of Physical Injury
Be
ha
vio
ral
Ha
ras
sm
en
tCumulative SEL dB**
Distance (m) to threshold
Injury
Behavior, in Air, dB
Harbor Seal
Seal Lions

Mean ‐ Reference Level
Project TitlePile information (size, type, number, pile strikes, etc.)
Peak SEL RMS Effective QuietMeasured single strike level (dB) 181 156 166 150 Level 95Distance (m) 10 10 10 Dist. 15.24
R 20Estimated number of strikes 37500
Cumulative SEL at measured distance202
Behavior
Peak RMS
dB Fish ≥ 2 g Fish < 2 g dBTransmission loss constant (15 if unknown) 206 187 183 150 120 120 90 100
15 0 25 25 117 11659 1 27 9
Notes (source for estimates, etc.)
Harbor Seal
Seal Lions
** This calculation assumes that single strike SELs < 150 dB do not accumulate to cause injury (EffectiveQuiet)
KetchikanDTH Vibratory (Moorage Float)
Fill in green cells: estimated sound levels and distances at which they were measured, estimated number of pile strikes per day, and transmision loss constant.
Acoustic Metric
Distance (m) to threshold
Onset of Physical Injury
Be
ha
vio
ral
Ha
ras
sm
en
t Injury
Behavior, in Air, dB
Cumulative SEL dB**

Mean ‐ Reference Level
Project TitlePile information (size, type, number, pile strikes, etc.)
Peak SEL RMS Effective QuietMeasured single strike level (dB) 184 145 157 150 Sonic Pile 95Distance (m) 10 10 10 Distance 15.24
Transmission Loss Constant 20Estimated number of strikes 1200
Cumulative SEL at measured distance176
Behavior
Peak RMS
dB Fish ≥ 2 g Fish < 2 g dBTransmission loss constant (15 if unknown) 206 187 183 150 120 120 90 100
15 0 2 3 29 2929 1 27 9
Notes (source for estimates, etc.)
** This calculation assumes that single strike SELs < 150 dB do not accumulate to cause injury (EffectiveQuiet)
KetchikanTimber Piles Vibratory Removal (Trestle)
Fill in green cells: estimated sound levels and distances at which they were measured, estimated number of pile strikes per day, and transmision loss constant.
Acoustic Metric
Onset of Physical Injury
Be
ha
vio
ral
Ha
ras
sm
en
tCumulative SEL dB**
Distance (m) to threshold
Injury
Behavior, in Air, dB
Harbor Seal
Seal Lions

Mean ‐ Reference Level
A.1: Vibratory Pile Driving (STATIONARY SOURCE: Non-Impulsive, Continuous)VERSION 2.2: 2020
KEYAction Proponent Provided Information
NMFS Provided Information (Technical Guidance)
Resultant Isopleth
STEP 1: GENERAL PROJECT INFORMATION
PROJECT TITLE Ketchikan 2021
PROJECT/SOURCE INFORMATIONTimber Piles Vibratory Removal (Trestle)
Please include any assumptions
PROJECT CONTACT Project Manager
STEP 2: WEIGHTING FACTOR ADJUSTMENT
Specify if relying on source-specific WFA, alternative weighting/dB adjustment, or if using default value
Weighting Factor Adjustment (kHz)¥ 2.5
¥ Broadband: 95% frequency contour percentile (kHz) OR Narrowband: frequency (kHz); For appropriate default WFA: See INTRODUCTION tab † If a user relies on alternative weighting/dB adjustment rather than relying upon the WFA (source-specific
or default), they may override the Adjustment (dB) (row 48), and enter the new value directly. However, they must provide additional support and documentation supporting this modification.
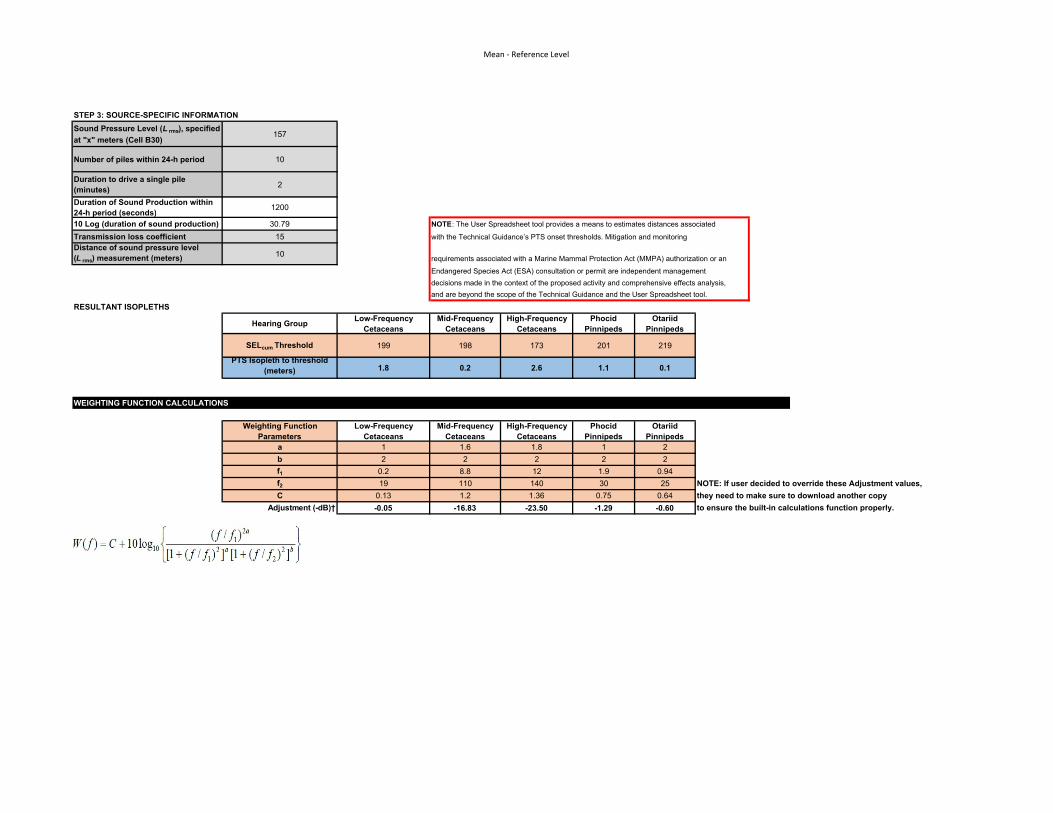
Mean ‐ Reference Level
STEP 3: SOURCE-SPECIFIC INFORMATION
Sound Pressure Level (L rms), specified
at "x" meters (Cell B30)157
Number of piles within 24-h period 10
Duration to drive a single pile (minutes)
2
Duration of Sound Production within 24-h period (seconds)
1200
10 Log (duration of sound production) 30.79 NOTE: The User Spreadsheet tool provides a means to estimates distances associated
Transmission loss coefficient 15 with the Technical Guidance’s PTS onset thresholds. Mitigation and monitoring Distance of sound pressure level (L rms) measurement (meters) 10 requirements associated with a Marine Mammal Protection Act (MMPA) authorization or an
Endangered Species Act (ESA) consultation or permit are independent management decisions made in the context of the proposed activity and comprehensive effects analysis, and are beyond the scope of the Technical Guidance and the User Spreadsheet tool.
RESULTANT ISOPLETHS
Hearing GroupLow-Frequency
Cetaceans Mid-Frequency
Cetaceans High-Frequency
CetaceansPhocid
Pinnipeds Otariid
Pinnipeds
SELcum Threshold 199 198 173 201 219
PTS Isopleth to threshold (meters) 1.8 0.2 2.6 1.1 0.1
WEIGHTING FUNCTION CALCULATIONS
Weighting Function Parameters
Low-Frequency Cetaceans
Mid-Frequency Cetaceans
High-Frequency Cetaceans
Phocid Pinnipeds
Otariid Pinnipeds
a 1 1.6 1.8 1 2b 2 2 2 2 2f1 0.2 8.8 12 1.9 0.94f2 19 110 140 30 25 NOTE: If user decided to override these Adjustment values,
C 0.13 1.2 1.36 0.75 0.64 they need to make sure to download another copy
Adjustment (-dB)† -0.05 -16.83 -23.50 -1.29 -0.60 to ensure the built-in calculations function properly.
156.25 0.017826393 0.003528024 1.731301939 50.03208714157.25 1.132226089 1.079477462 2.731301939 65.17875984
1.034925779 1.001033325 1.000637857 1.013937114 1.02010.960108173 0.0157283 0.003266187 0.625161295 0.752488349

Mean ‐ Reference Level
E.1: IMPACT PILE DRIVING (STATIONARY SOURCE: Impulsive, Intermittent)VERSION 2.2: 2020KEY
Action Proponent Provided Information
NMFS Provided Information (Technical Guidance)
Resultant Isopleth
STEP 1: GENERAL PROJECT INFORMATION
PROJECT TITLE Ketchikan 2021
PROJECT/SOURCE INFORMATION Impact (Transfer Bridge)
Please include any assumptions
PROJECT CONTACT Project Manager
STEP 2: WEIGHTING FACTOR ADJUSTMENT
Specify if relying on source-specific WFA, alternative weighting/dB adjustment, or if using default value
Weighting Factor Adjustment (kHz) ¥ 2
¥ Broadband: 95% frequency contour percentile (kHz); For appropriate default WFA: See INTRODUCTION tab † If a user relies on alternative weighting/dB adjustment rather than relying upon the WFA (source-specific
or default), they may override the Adjustment (dB) (row 73), and enter the new value directHowever, they must provide additional support and documentation supporting this modificat
STEP 3: SOURCE-SPECIFIC INFORMATIONNOTE: METHOD E.1-1 is PREFERRED method when SEL-based source levels are available (because pulse duration is not required). Only use method E.1-2 if SEL-based source levels are not available.E.1-1: METHOD TO CALCULATE PK AND SELcum (SINGLE STRIKE EQUIVALENT) PREFERRED METHOD (pulse duration not needed)Unweighted SEL cum (at measured distance) = SELss
+ 10 Log (# strikes) 199.3
SELcum PK
Single Strike SELss (L E ,p, single strike) specified at "x" meters (Cell B32)
181L p,0-pk specified at "x" meters (Cell G29)
209
Number of strikes per pile 48Distance of L p,0-pk
measurement (meters) ⁺
10
Number of piles per day 1.5 L p,0-pk Source level 223.6
Transmission loss coefficient 15Distance of single strike SEL ss (L E ,p, single
strike) measurement (meters)10
RESULTANT ISOPLETHS* *Impulsive sounds have dual metric thresholds (SELcum & PK). Metric producing largest isopleth should be used.
Hearing GroupLow-Frequency
Cetaceans Mid-Frequency
Cetaceans High-Frequency
CetaceansPhocid
Pinnipeds Otariid
Pinnipeds
SELcum Threshold 183 185 155 185 203
PTS Isopleth to threshold (meters) 121.4 4.3 144.6 65.0 4.7
“NA”: PK source level is < to the threshold for PK Threshold 219 230 202 218 232
that marine mammal hearing group. PTS PK Isopleth to threshold (meters) 2.0 NA 27.5 2.4 NA

Mean ‐ Reference Level
E.1-2: METHOD TO CALCULATE PK AND SELcum (USING RMS SPL SOURCE LEVEL)SELcum PK
Sound Pressure Level ( L rms), specified at "x" meters (Cell B53)
L p,0-pk specified at "x" meters (Cell G47)
Number of piles per dayDistance of L p,0-pk
measurement (meters) ⁺
Strike (pulse) DurationΔ (seconds) L p,0-pk Source level #NUM!Number of strikes per pile
Duration of Sound Production (seconds) 0
10 Log (duration of sound production) #NUM! NOTE: The User Spreadsheet tool provides a means to estimates distances associated Transmission loss coefficient with the Technical Guidance’s PTS onset thresholds. Mitigation and monitoring Distance of sound pressure level ( L rms) measurement (meters) requirements associated with a Marine Mammal Protection Act (MMPA) authorization or ΔWindow that makes up 90% of total cumulative energy (5%-95%) based on Madsen 2005 an Endangered Species Act (ESA) consultation or permit are independent management
decisions made in the context of the proposed activity and comprehensive effects analysis, and are beyond the scope of the Technical Guidance and the User Spreadsheet too
RESULTANT ISOPLETHS* *Impulsive sounds have dual metric thresholds (SELcum & PK). Metric producing largest isopleth should be used.
Hearing GroupLow-Frequency
Cetaceans Mid-Frequency
Cetaceans High-Frequency
CetaceansPhocid
Pinnipeds Otariid
Pinnipeds
SELcum Threshold 183 185 155 185 203
PTS Isopleth to threshold (meters) #NUM! #NUM! #NUM! #NUM! #NUM!
“NA”: PK source level is < to the threshold for PK Threshold 219 230 202 218 232
that marine mammal hearing group. PTS PK Isopleth to threshold (meters) #NUM! #NUM! #NUM! #NUM! #NUM!
WEIGHTING FUNCTION CALCULATIONS
Weighting Function Parameters
Low-Frequency Cetaceans
Mid-Frequency Cetaceans
High-Frequency Cetaceans
Phocid Pinnipeds
Otariid Pinnipeds
a 1 1.6 1.8 1 2b 2 2 2 2 2f1 0.2 8.8 12 1.9 0.94f2 19 110 140 30 25 NOTE: If user decided to override these Adjustment values,
C 0.13 1.2 1.36 0.75 0.64 they need to make sure to download another copy
Adjustment (-dB)† -0.01 -19.74 -26.87 -2.08 -1.15 to ensure the built-in calculations function properly.
100 0.008728738 0.001579994 1.108033241 20.49314289 the source either unweighted (i.e., set Adjustment to zero) or to input specifi101 1.083916614 1.050554535 2.108033241 30.54701342
1.022283439 1.000661266 1.000408205 1.008908642 1.012840960.968517118 0.008047639 0.001503348 0.520982928 0.6623668

Mean ‐ Reference Level
E.1: IMPACT PILE DRIVING (STATIONARY SOURCE: Impulsive, Intermittent)VERSION 2.2: 2020KEY
Action Proponent Provided Information
NMFS Provided Information (Technical Guidance)
Resultant Isopleth
STEP 1: GENERAL PROJECT INFORMATION
PROJECT TITLE Ketchikan 2021
PROJECT/SOURCE INFORMATION Impact (Transfer Bridge)
Please include any assumptions
PROJECT CONTACT Project Manager
STEP 2: WEIGHTING FACTOR ADJUSTMENT
Specify if relying on source-specific WFA, alternative weighting/dB adjustment, or if using default value
Weighting Factor Adjustment (kHz) ¥ 2
¥ Broadband: 95% frequency contour percentile (kHz); For appropriate default WFA: See INTRODUCTION tab † If a user relies on alternative weighting/dB adjustment rather than relying upon the WFA (source-specific
or default), they may override the Adjustment (dB) (row 73), and enter the new value direcHowever, they must provide additional support and documentation supporting this modificatio
STEP 3: SOURCE-SPECIFIC INFORMATIONNOTE: METHOD E.1-1 is PREFERRED method when SEL-based source levels are available (because pulse duration is not required). Only use method E.1-2 if SEL-based source levels are not available.E.1-1: METHOD TO CALCULATE PK AND SELcum (SINGLE STRIKE EQUIVALENT) PREFERRED METHOD (pulse duration not needed)Unweighted SEL cum (at measured distance) = SELss
+ 10 Log (# strikes) 199.3
SELcum PK
Single Strike SELss (L E ,p, single strike) specified at "x" meters (Cell B32)
181L p,0-pk specified at "x" meters (Cell G29)
209
Number of strikes per pile 48Distance of L p,0-pk
measurement (meters) ⁺
10
Number of piles per day 1.5 L p,0-pk Source level 223.6
Transmission loss coefficient 15Distance of single strike SEL ss (L E ,p, single
strike) measurement (meters)10
RESULTANT ISOPLETHS* *Impulsive sounds have dual metric thresholds (SELcum & PK). Metric producing largest isopleth should be used.
Hearing GroupLow-Frequency
Cetaceans Mid-Frequency
Cetaceans High-Frequency
CetaceansPhocid
Pinnipeds Otariid
Pinnipeds
SELcum Threshold 183 185 155 185 203
PTS Isopleth to threshold (meters) 121.4 4.3 144.6 65.0 4.7
“NA”: PK source level is < to the threshold for PK Threshold 219 230 202 218 232
that marine mammal hearing group. PTS PK Isopleth to threshold (meters) 2.0 NA 27.5 2.4 NA

Mean ‐ Reference Level
E.1-2: METHOD TO CALCULATE PK AND SELcum (USING RMS SPL SOURCE LEVEL)SELcum PK
Sound Pressure Level ( L rms), specified at "x" meters (Cell B53)
L p,0-pk specified at "x" meters (Cell G47)
Number of piles per dayDistance of L p,0-pk
measurement (meters) ⁺
Strike (pulse) DurationΔ (seconds) L p,0-pk Source level #NUM!Number of strikes per pile
Duration of Sound Production (seconds) 0
10 Log (duration of sound production) #NUM! NOTE: The User Spreadsheet tool provides a means to estimates distances associated Transmission loss coefficient with the Technical Guidance’s PTS onset thresholds. Mitigation and monitoring Distance of sound pressure level ( L rms) measurement (meters) requirements associated with a Marine Mammal Protection Act (MMPA) authorization or ΔWindow that makes up 90% of total cumulative energy (5%-95%) based on Madsen 2005 an Endangered Species Act (ESA) consultation or permit are independent management
decisions made in the context of the proposed activity and comprehensive effects analysis, and are beyond the scope of the Technical Guidance and the User Spreadsheet too
RESULTANT ISOPLETHS* *Impulsive sounds have dual metric thresholds (SELcum & PK). Metric producing largest isopleth should be used.
Hearing GroupLow-Frequency
Cetaceans Mid-Frequency
Cetaceans High-Frequency
CetaceansPhocid
Pinnipeds Otariid
Pinnipeds
SELcum Threshold 183 185 155 185 203
PTS Isopleth to threshold (meters) #NUM! #NUM! #NUM! #NUM! #NUM!
“NA”: PK source level is < to the threshold for PK Threshold 219 230 202 218 232
that marine mammal hearing group. PTS PK Isopleth to threshold (meters) #NUM! #NUM! #NUM! #NUM! #NUM!
WEIGHTING FUNCTION CALCULATIONS
Weighting Function Parameters
Low-Frequency Cetaceans
Mid-Frequency Cetaceans
High-Frequency Cetaceans
Phocid Pinnipeds
Otariid Pinnipeds
a 1 1.6 1.8 1 2b 2 2 2 2 2f1 0.2 8.8 12 1.9 0.94f2 19 110 140 30 25 NOTE: If user decided to override these Adjustment values,
C 0.13 1.2 1.36 0.75 0.64 they need to make sure to download another copy
Adjustment (-dB)† -0.01 -19.74 -26.87 -2.08 -1.15 to ensure the built-in calculations function properly.
100 0.008728738 0.001579994 1.108033241 20.49314289 the source either unweighted (i.e., set Adjustment to zero) or to input specific informatio101 1.083916614 1.050554535 2.108033241 30.54701342
1.022283439 1.000661266 1.000408205 1.008908642 1.012840960.968517118 0.008047639 0.001503348 0.520982928 0.6623668

Mean ‐ Reference Level
E.1: IMPACT PILE DRIVING (STATIONARY SOURCE: Impulsive, Intermittent)VERSION 2.2: 2020KEY
Action Proponent Provided Information
NMFS Provided Information (Technical Guidance)
Resultant Isopleth
STEP 1: GENERAL PROJECT INFORMATION
PROJECT TITLE Ketchikan 2021
PROJECT/SOURCE INFORMATION Impact (Moorage Float)
Please include any assumptions
PROJECT CONTACT Project Manager
STEP 2: WEIGHTING FACTOR ADJUSTMENT
Specify if relying on source-specific WFA, alternative weighting/dB adjustment, or if using default value
Weighting Factor Adjustment (kHz)¥ 2
¥ Broadband: 95% frequency contour percentile (kHz); For appropriate default WFA: See INTRODUCTION tab † If a user relies on alternative weighting/dB adjustment rather than relying upon the WFA (source-specific
or default), they may override the Adjustment (dB) (row 73), and enter the new value directlyHowever, they must provide additional support and documentation supporting this modification
STEP 3: SOURCE-SPECIFIC INFORMATION
NOTE: METHOD E.1-1 is PREFERRED method when SEL-based source levels are available (because pulse duration is not required). Only use method E.1-2 if SEL-based source levels are not available.
E.1-1: METHOD TO CALCULATE PK AND SELcum (SINGLE STRIKE EQUIVALENT) PREFERRED METHOD (pulse duration not needed)Unweighted SELcum (at measured distance) = SELss
+ 10 Log (# strikes)199.3
SELcum PK
Single Strike SELss (L E ,p, single strike ) specified at "x" meters (Cell B32)
181L p,0-pk specified at "x" meters (Cell G29)
209
Number of strikes per pile 48Distance of L p,0-pk
measurement (meters)⁺
10
Number of piles per day 1.5 L p,0-pk Source level 223.6
Transmission loss coefficient 15Distance of single strike SELss (L E ,p, single
strike ) measurement (meters)10

Mean ‐ Reference Level
RESULTANT ISOPLETHS* *Impulsive sounds have dual metric thresholds (SELcum & PK). Metric producing largest isopleth should be used.
Hearing GroupLow-Frequency
Cetaceans Mid-Frequency
Cetaceans High-Frequency
CetaceansPhocid
Pinnipeds Otariid
Pinnipeds
SELcum Threshold 183 185 155 185 203
PTS Isopleth to threshold (meters) 121.4 4.3 144.6 65.0 4.7
“NA”: PK source level is < to the threshold for PK Threshold 219 230 202 218 232
that marine mammal hearing group. PTS PK Isopleth to threshold (meters) 2.0 NA 27.5 2.4 NA
E.1-2: METHOD TO CALCULATE PK AND SELcum (USING RMS SPL SOURCE LEVEL)SELcum PK
Sound Pressure Level ( L rms), specified at "x" meters (Cell B53)
L p,0-pk specified at "x" meters (Cell G47)
Number of piles per dayDistance of L p,0-pk
measurement (meters)⁺
Strike (pulse) DurationΔ (seconds) L p,0-pk Source level #NUM!Number of strikes per pile
Duration of Sound Production (seconds) 0
10 Log (duration of sound production) #NUM! NOTE: The User Spreadsheet tool provides a means to estimates distances associated Transmission loss coefficient with the Technical Guidance’s PTS onset thresholds. Mitigation and monitoring Distance of sound pressure level ( L rms) measurement (meters) requirements associated with a Marine Mammal Protection Act (MMPA) authorization or ΔWindow that makes up 90% of total cumulative energy (5%-95%) based on Madsen 2005 an Endangered Species Act (ESA) consultation or permit are independent management
decisions made in the context of the proposed activity and comprehensive effects analysis, and are beyond the scope of the Technical Guidance and the User Spreadsheet tool.
RESULTANT ISOPLETHS* *Impulsive sounds have dual metric thresholds (SELcum & PK). Metric producing largest isopleth should be used.
Hearing GroupLow-Frequency
Cetaceans Mid-Frequency
Cetaceans High-Frequency
CetaceansPhocid
Pinnipeds Otariid
Pinnipeds
SELcum Threshold 183 185 155 185 203
PTS Isopleth to threshold (meters) #NUM! #NUM! #NUM! #NUM! #NUM!
“NA”: PK source level is < to the threshold for PK Threshold 219 230 202 218 232
that marine mammal hearing group. PTS PK Isopleth to threshold (meters) #NUM! #NUM! #NUM! #NUM! #NUM!
WEIGHTING FUNCTION CALCULATIONS
Weighting Function Parameters
Low-Frequency Cetaceans
Mid-Frequency Cetaceans
High-Frequency Cetaceans
Phocid Pinnipeds
Otariid Pinnipeds
a 1 1.6 1.8 1 2b 2 2 2 2 2f1 0.2 8.8 12 1.9 0.94f2 19 110 140 30 25 NOTE: If user decided to override these Adjustment values,
C 0.13 1.2 1.36 0.75 0.64 they need to make sure to download another copy
Adjustment (-dB)† -0.01 -19.74 -26.87 -2.08 -1.15 to ensure the built-in calculations function properly.
100 0.008728738 0.001579994 1.108033241 20.49314289 the source either unweighted (i.e., set Adjustment to zero) or to input specific information o101 1.083916614 1.050554535 2.108033241 30.54701342
1.022283439 1.000661266 1.000408205 1.008908642 1.012840960.968517118 0.008047639 0.001503348 0.520982928 0.6623668

Mean ‐ Reference Level
E.2: DTH PILE DRIVING/INSTALLATION (STATIONARY SOURCE: Impulsive, Intermittent)VERSION 2.2: 2020KEY
Action Proponent Provided Information
NMFS Provided Information (Technical Guidance)
Resultant Isopleth
STEP 1: GENERAL PROJECT INFORMATION
PROJECT TITLE Ketchikan 2021
PROJECT/SOURCE INFORMATION Impact (Transfer Bridge)
Please include any assumptions
PROJECT CONTACT Project Manager
STEP 2: WEIGHTING FACTOR ADJUSTMENT
Specify if relying on source-specific WFA, alternative weighting/dB adjustment, or if using default value
Weighting Factor Adjustment (kHz)¥ 2
¥ Broadband: 95% frequency contour percentile (kHz); For appropriate default WFA: See INTRODUCTION tab † If a user relies on alternative weighting/dB adjustment rather than relying upon the WFA (source-specific
or default), they may override the Adjustment (dB) (row 50), and enter the new value directly. However, they must provide additional support and documentation supporting this modificatio
STEP 3: SOURCE-SPECIFIC INFORMATIONUnweighted SELcum (at measured distance) = SELss
+ 10 Log (# strikes)199.7
SELcum PK
Single Strike SELss (L E ,p, single strike) specified
at "x" meters (Cell B30)154
L p,0-pk specified at
"x" meters (Cell G26)
179
Strike rate (average strikes per second) 25Distance of L p,0-pk
measurement (meters)⁺
10
Duration to drive pile (minutes) 16.66666667 L p,0-pk Source level 194.0
Number of piles per day 1.5
Transmission loss coefficient 15
Distance of single strike SELss (L E ,p, single
strike) measurement (meters)10
Total number of strikes in a 24-h period 37500

Mean ‐ Reference Level
RESULTANT ISOPLETHS* *Impulsive sounds have dual metric thresholds (SELcum & PK). Metric producing largest isopleth should be used.
Hearing GroupLow-Frequency
Cetaceans Mid-Frequency
Cetaceans High-Frequency
CetaceansPhocid
Pinnipeds Otariid
Pinnipeds
SELcum Threshold 183 185 155 185 203
PTS Isopleth to threshold(meters) 130.4 4.6 155.4 69.8 5.1
“NA”: PK source level is < to the threshold for PK Threshold 219 230 202 218 232
that marine mammal hearing group. PTS PK Isopleth to threshold(meters) NA NA NA NA NA
WEIGHTING FUNCTION CALCULATIONS
Weighting Function Parameters
Low-Frequency Cetaceans
Mid-Frequency Cetaceans
High-Frequency Cetaceans
Phocid Pinnipeds
Otariid Pinnipeds
a 1 1.6 1.8 1 2b 2 2 2 2 2f1 0.2 8.8 12 1.9 0.94f2 19 110 140 30 25 NOTE: If user decided to override these Adjustment values,
C 0.13 1.2 1.36 0.75 0.64 they need to make sure to download another copy
Adjustment (-dB)† -0.01 -19.74 -26.87 -2.08 -1.15 to ensure the built-in calculations function properly.
100 0.008728738 0.001579994 1.108033241 20.49314289101 1.083916614 1.050554535 2.108033241 30.54701342
1.022283439 1.000661266 1.000408205 1.008908642 1.012840960.968517118 0.008047639 0.001503348 0.520982928 0.6623668

Mean ‐ Reference Level
E.2: DTH PILE DRIVING/INSTALLATION (STATIONARY SOURCE: Impulsive, Intermittent)VERSION 2.2: 2020
KEYAction Proponent Provided Information
NMFS Provided Information (Technical Guidance)
Resultant Isopleth
STEP 1: GENERAL PROJECT INFORMATION
PROJECT TITLE Ketchikan 2021
PROJECT/SOURCE INFORMATION Impact (Transfer Bridge)
Please include any assumptions
PROJECT CONTACT Project Manager
STEP 2: WEIGHTING FACTOR ADJUSTMENT
Specify if relying on source-specific WFA, alternative weighting/dB adjustment, or if using default value
Weighting Factor Adjustment (kHz) ¥ 2
¥ Broadband: 95% frequency contour percentile (kHz); For appropriate default WFA: See INTRODUCTION tab † If a user relies on alternative weighting/dB adjustment rather than relying upon the WFA (source-specific
or default), they may override the Adjustment (dB) (row 50), and enter the new value directly. However, they must provide additional support and documentation supporting this modification

Mean ‐ Reference Level
STEP 3: SOURCE-SPECIFIC INFORMATIONUnweighted SEL cum (at measured distance) = SELss +
10 Log (# strikes)199.7
SELcum PK
Single Strike SELss (L E ,p, single strike) specified
at "x" meters (Cell B30)154
L p,0-pk specified at
"x" meters (Cell G26)
179
Strike rate (average strikes per second) 25Distance of L p,0-pk
measurement (meters)⁺
10
Duration to drive pile (minutes) 16.66666667 L p,0-pk Source level 194.0
Number of piles per day 1.5
Transmission loss coefficient 15
Distance of single strike SEL ss (L E ,p, single
strike) measurement (meters)10
Total number of strikes in a 24-h period 37500
RESULTANT ISOPLETHS* *Impulsive sounds have dual metric thresholds (SELcum & PK). Metric producing largest isopleth should be used.
Hearing GroupLow-Frequency
Cetaceans Mid-Frequency
Cetaceans High-Frequency
CetaceansPhocid
Pinnipeds Otariid
Pinnipeds
SELcum Threshold 183 185 155 185 203
PTS Isopleth to threshold (meters) 130.4 4.6 155.4 69.8 5.1
“NA”: PK source level is < to the threshold for PK Threshold 219 230 202 218 232
that marine mammal hearing group. PTS PK Isopleth to threshold (meters) NA NA NA NA NA
WEIGHTING FUNCTION CALCULATIONS
Weighting Function Parameters
Low-Frequency Cetaceans
Mid-Frequency Cetaceans
High-Frequency Cetaceans
Phocid Pinnipeds
Otariid Pinnipeds
a 1 1.6 1.8 1 2b 2 2 2 2 2f1 0.2 8.8 12 1.9 0.94f2 19 110 140 30 25 NOTE: If user decided to override these Adjustment values,
C 0.13 1.2 1.36 0.75 0.64 they need to make sure to download another copy
Adjustment (-dB)† -0.01 -19.74 -26.87 -2.08 -1.15 to ensure the built-in calculations function properly.
100 0.008728738 0.001579994 1.108033241 20.49314289101 1.083916614 1.050554535 2.108033241 30.54701342
1.022283439 1.000661266 1.000408205 1.008908642 1.012840960.968517118 0.008047639 0.001503348 0.520982928 0.6623668

Mean ‐ Reference Level
E.2: DTH PILE DRIVING/INSTALLATION (STATIONARY SOURCE: Impulsive, Intermittent)VERSION 2.2: 2020
KEYAction Proponent Provided Information
NMFS Provided Information (Technical Guidance)
Resultant Isopleth
STEP 1: GENERAL PROJECT INFORMATION
PROJECT TITLE Ketchikan 2021
PROJECT/SOURCE INFORMATION Impact (Moorage Float)
Please include any assumptions
PROJECT CONTACT Project Manager
STEP 2: WEIGHTING FACTOR ADJUSTMENT
Specify if relying on source-specific WFA, alternative weighting/dB adjustment, or if using default value
Weighting Factor Adjustment (kHz) ¥ 2
¥ Broadband: 95% frequency contour percentile (kHz); For appropriate default WFA: See INTRODUCTION tab † If a user relies on alternative weighting/dB adjustment rather than relying upon the WFA (source-specific
or default), they may override the Adjustment (dB) (row 50), and enter the new value directly. However, they must provide additional support and documentation supporting this modification

Mean ‐ Reference Level
STEP 3: SOURCE-SPECIFIC INFORMATIONUnweighted SEL cum (at measured distance) = SELss +
10 Log (# strikes)199.7
SELcum PK
Single Strike SELss (L E ,p, single strike) specified
at "x" meters (Cell B30)154
L p,0-pk specified at
"x" meters (Cell G26)
179
Strike rate (average strikes per second) 25Distance of L p,0-pk
measurement (meters)⁺
10
Duration to drive pile (minutes) 16.66666667 L p,0-pk Source level 194.0
Number of piles per day 1.5
Transmission loss coefficient 15
Distance of single strike SEL ss (L E ,p, single
strike) measurement (meters)10
Total number of strikes in a 24-h period 37500
RESULTANT ISOPLETHS* *Impulsive sounds have dual metric thresholds (SELcum & PK). Metric producing largest isopleth should be used.
Hearing GroupLow-Frequency
Cetaceans Mid-Frequency
Cetaceans High-Frequency
CetaceansPhocid
Pinnipeds Otariid
Pinnipeds
SELcum Threshold 183 185 155 185 203
PTS Isopleth to threshold (meters) 130.4 4.6 155.4 69.8 5.1
“NA”: PK source level is < to the threshold for PK Threshold 219 230 202 218 232
that marine mammal hearing group. PTS PK Isopleth to threshold (meters) NA NA NA NA NA
WEIGHTING FUNCTION CALCULATIONS
Weighting Function Parameters
Low-Frequency Cetaceans
Mid-Frequency Cetaceans
High-Frequency Cetaceans
Phocid Pinnipeds
Otariid Pinnipeds
a 1 1.6 1.8 1 2b 2 2 2 2 2f1 0.2 8.8 12 1.9 0.94f2 19 110 140 30 25 NOTE: If user decided to override these Adjustment values,
C 0.13 1.2 1.36 0.75 0.64 they need to make sure to download another copy
Adjustment (-dB)† -0.01 -19.74 -26.87 -2.08 -1.15 to ensure the built-in calculations function properly.
100 0.008728738 0.001579994 1.108033241 20.49314289101 1.083916614 1.050554535 2.108033241 30.54701342
1.022283439 1.000661266 1.000408205 1.008908642 1.012840960.968517118 0.008047639 0.001503348 0.520982928 0.6623668

Appendix C: Biological Assessment

Appendix C: Biological Assessment Request for Incidental Harassment Authorization
October 2021 C-2
Biological Assessment Introduction
This Biological Assessment (BA) evaluates potential effects to Endangered Species Act (ESA)-listed species and critical habitats from National Oceanic and Atmospheric Administration’s (NOAA’s) proposal to recapitalize property and facilities operated by its Office of Marine and Aviation Operations (OMAO) at their Marine Operations Center-Pacific Ketchikan Port Facility in Ketchikan, Alaska (see Figure 1-1 of the Incidental Harassment Authorization [IHA] application package). This BA has been prepared pursuant to the Endangered Species Act (ESA) of 1973 (16 United States Code [U.S.C.] 1531 et seq.), as amended.
To streamline the consultation process and avoid duplication, this BA is combined with other environmental review procedures, including the project’s request for Incidental Harassment Authorization (IHA), required under the Marine Mammal Protection Act, as well as documentation to support compliance with National Environmental Policy Act and the Magnuson-Stevens Fishery Conservation and Management Act. This abbreviated BA is not intended to be a stand-alone document and uses information embedded in the IHA application package. References to various sections in the IHA application package are included in the BA as appropriate.
Project Description
The Proposed Action at the Ketchikan Port Facility would require demolition, disposal, and replacement of key structures and infrastructure within portions of a 77,000-square-foot (1.8-acre) upland area and a 102,000-square-foot (2.3-acre) in-water area owned by NOAA. Nearly all the existing OMAO facilities and assets at its Ketchikan Port Facility would be affected. A detailed description of the Proposed Action is provided in Section 1 of the IHA application package. In-water work including pile removal and placement is anticipated to occur for approximately 47 days on an intermittent basis between February 2022 and December 2022. Proposed minimization and avoidance measures are provided in Section 11 of the IHA application package.
Project and Action Areas
The project area is defined as the geographic extent of proposed activities and where direct effects to species and critical habitats may occur (see Figure 1-2 of IHA application package). The action area includes all areas affected directly or indirectly by the federal action and not merely the immediate area involved in the action (50 Code of Federal Regulations [CFR] § 402.02). The action area encompasses the project area as well as the estimated maximum spatial extent for underwater noise (12 kilometers) and airborne noise (1 kilometer). The complete action area, including terrestrial and aquatic portions, is shown in Figure C-1. The action area limits were established based on a review of underwater noise propagation from the project that could affect marine mammals. Marine mammal injury and disturbance threshold criteria are provided in Section 6 of the IHA application package. An Underwater Noise Technical Memorandum prepared for removal/installation of piles at Ketchikan Port Facility is provided in Appendix B of the IHA application package.

Appendix C: Biological Assessment Request for Incidental Harassment Authorization
October 2021 C-3
Figure C-1. Action Area

Appendix C: Biological Assessment Request for Incidental Harassment Authorization
October 2021 C-4
Description of ESA-Listed Species and their Habitats
This BA only addresses the Mexico distinct population segment (DPS) of humpback whale (Megaptera novaeangliae). The Proposed Action would have no effect on ESA-listed fin whale (Balaenoptera physalus) or Steller sea lion (Eumetopias jubatus), as they are not expected to be present within the action area. No critical habitat for any listed species has been designated within the action area.
Fin Whale
While the fin whale is mapped as having a range extending into the action area, there are no known sightings in Tongass Narrows, and recent IHAs issued by the National Marine Fisheries Service (NMFS) in the Ketchikan area have not included the fin whale (Dalheim et al. 2009; HDR 2019). It would be unlikely for a fin whale to enter the action area, as they are generally associated with deeper, “intermediate offshore waters” (NMFS 2010). Based on this information, the fin whale is not considered further in this BA.
Steller Sea Lion
The Western DPS (wDPS) of Steller sea lion generally occurs west of Cape Suckling, with the centers of abundance and distribution located in the Gulf of Alaska and Aleutian Islands. While there is some mixing of the wDPS east of the 144°W line, Hastings et al. 2020 considered the Ketchikan area to be outside of the mixing zone; there are no known occurrences of wDPS animals in Tongass Narrows. As such, the wDPS is not considered further in this BA.
Humpback Whale
Status and Management
In 1970, the humpback whale was listed as endangered under the Endangered Species Conservation Act (35 Federal Register [FR] 18319). In 2015, NMFS conducted a global status review and reassessed the status of humpback whales under the ESA (Bettridge et al. 2015).1 Based on that review, 14 DPSs of humpback whales were identified, and listing status was revised (81 FR 62260).
In the North Pacific, five DPSs that breed in subtropical and tropical waters from Asia to Central America and migrate north to feed in highly productive North Pacific feeding grounds were identified (Bettridge et al. 2015). Whales from three of these DPSs migrate to Alaskan waters: the Mexico DPS (ESA-listed as threatened), the Western North Pacific DPS (ESA-listed as endangered), and the Hawaii DPS (delisted) (81 FR 62260). These DPSs generally represent the California/Oregon/Washington, Western North Pacific, and Central North Pacific stocks, respectively.
Distribution
The humpback whale is distributed worldwide in all ocean basins. Relatively high densities of humpback whales are found in feeding grounds in Southeast Alaska and northern British Columbia, particularly during summer months. Based on extensive photo identification data, NMFS has determined that individual humpback whales encountered in Southeast Alaska and northern British Columbia have a 98 percent probability of being from the recovered (delisted) Hawaii DPS and a 2 percent probability of being from the currently threatened (ESA-listed) Mexico DPS (coefficient of variation [CV] = 0.03) (Wade 2021). There is a zero percent probability that humpback whales in Southeast Alaska are from the endangered Western North Pacific DPS (Wade 2021). Intermixed DPSs are not visually distinguishable; their identity can only be determined by DNA or photo identification. Therefore, we will use Wade (2021) DPS ratio that assumes 98 percent of humpbacks in Southeast Alaska are from the Hawaii DPS and 2 percent are from the Mexico DPS.
Humpback whales migrate to Alaska to feed after months of fasting in the low latitude breeding grounds. The timing of migration varies among individuals; most begin returning to Alaska in spring, and most
1 The Endangered Species Conservation Act was replaced by the ESA in 1973.

Appendix C: Biological Assessment Request for Incidental Harassment Authorization
October 2021 C-5
depart Alaska for southern breeding grounds in fall or winter. Numbers of humpbacks in Southeast Alaska peak during late summer to early fall, but because there is significant overlap between departing and returning whales, humpbacks can be found in Alaska feeding grounds in every month of the year (Baker et al. 1985; Straley 1990; Witteveen and Wynne 2009). There is also an apparent increase in the number of humpback whales overwintering in feeding grounds in Alaska, including reports in Ketchikan during some years in the winter (Straley et al. 2017; Liddle 2015; 84 FR 36891).
Whales in the Mexico DPS typically breed off of Mexico and migrate to northern feeding grounds ranging from British Columbia to the western Gulf of Alaska. Given their widespread range and their opportunistic foraging strategies, Mexico DPS humpback whales may be in the vicinity during the proposed project activities. In the final rule changing the status of humpback whales under the ESA (81 FR 62260), the abundance of the Mexico DPS was estimated to be 2,900 individuals (CV = 0.06), with an unknown trend. Note that only a portion of the Mexico DPS migrates to Alaska for feeding; the probability that a whale encountered in Southeast Alaska and northern British Columbia is from the Mexico DPS is—as noted earlier—2 percent (Wade 2021).
Site-Specific Occurrence
Humpback whales occur frequently in Tongass Narrows and the adjacent Clarence Strait during summer and fall months to feed. Data on the distribution suggest that both the Mexico DPS and Hawaii DPS of humpback whales may be present in the Tongass Narrows area. Because humpback whale individuals of different DPS (natal) origin are generally visually indistinguishable, the frequency of occurrence is estimated using the DPS ratio (noted above) (Wade 2021). Local anecdotal reports indicate that humpback whales are becoming more common and abundant in Tongass Narrows during August and September, which is consistent with research in Southeast Alaska.
Dahlheim et al. (2009) found significant differences in the mean group size of humpback whales in Southeast Alaska from year to year and also found that the average group size was largest in the fall (September through October). Numbers of humpback whales peak in the summer and fall and are more uniformly distributed throughout the region. Humpback whales were observed in Clarence Strait every year, although less frequently than other areas of Southeast Alaska (Dahlheim et al. 2009).
The average group size during the fall surveys was two whales. During the spring months, humpback whales tend to congregate in areas outside of the Ketchikan area, such as Lynn Canal and Fredrick Sound (Dahlheim et al. 2009). Local reports of humpback whale group size in Tongass Narrows is similar, with the typical size being between one and three whales. Local residents report humpback whales in Tongass Narrows anywhere from once a month to several times weekly. There have also been several instances where whales have been observed more frequently, including a single whale that was observed by a ferry terminal employee every few days for several months (85 FR 673).
The City of Ketchikan Rock Pinnacle project reported one humpback whale sighting of one individual during the project (December 2019 through January 2020) in the Level B behavioral harassment zone.2 The sighting was 55 minutes post-blast and not recorded as a take (Sitkiewicz 2020).
Marine mammal monitoring and sighting data in the Tongass Narrows for the Alaska Department of Transportation’s Gravina Access project from October 2020 to February 2021 and May 2021 to July 2021 reported a mean group size of 1.3, with a range of one to four humpback whales. Sightings at the Alaska Department of Transportation’s Ward Cove project resulted in similar data, with a mean group size of 1.7 and range of one to six humpback whales.
In the Biological Opinion issued for the Alaska Department of Transportation’s ferry terminal project IHA application, NMFS determined that up to two humpback whales may be present twice per week, based on a year-round project and the fluctuating seasonal abundance (NMFS 2019). Given that the action area for this project encompasses a similar portion of Tongass Narrows and is consistent with local anecdotal and
2 The Level B behavioral harassment zone is the area in which underwater noise generated from pile installation is greater than the sound thresholds established for marine mammal behavioral disturbance. The different zones of impact for this project are described in Section 6 of the IHA application package.

Appendix C: Biological Assessment Request for Incidental Harassment Authorization
October 2021 C-6
survey observations together with the NMFS determination, this estimate of up to two humpback whales twice per week is a conservative estimate of humpback whale presence in the action area.
Humpback Whale Critical Habitat
The final rule to designate critical habitat for the endangered Western North Pacific DPS, the endangered Central America DPS, and the threatened Mexico DPS of humpback whales was published on April 21, 2021, (86 FR 21082) and became effective on May 21, 2021. The final rule excludes Southeast Alaska Unit 10, which includes the proposed action area.
Environmental Baseline
The “environmental baseline” refers to the condition of the listed species or its designated critical habitat in the action area, without the consequences to the listed species or designated critical habitat caused by the Proposed Action. The environmental baseline includes the past and present impacts of all federal, state, or private actions and other human activities in the action area; the anticipated impacts of all proposed Federal projects in the action area that have already undergone formal or early section 7 consultation; and the impact of state or private actions that are contemporaneous with the consultation in process. The consequences to listed species or designated critical habitat from ongoing agency activities or existing agency facilities that are not within the agency’s discretion to modify are part of the environmental baseline (50 CFR § 402.02).
The geographic setting of the project area is described in Section 2.2 of the IHA application package. The project area and vicinity has been subject to high human use and habitat alteration for many years. Ongoing human activity in the action area that impacts marine mammals includes marine vessel activity, pollution, climate change, noise (e.g., aircraft, vessel, pile-driving, etc.), and coastal zone development and has been described by NMFS in a number of biological opinions for construction projects in Tongass Narrows in recent years, including the following:
City of Ketchikan Berth III Mooring Dolphins Project (AKRO-2020-02183), City of Ketchikan, February 2021
Tongass Narrows (Gravina Access) Project (AKRO-2019-03432), Alaska Department of Transportation and Public Facilities, December 2019
These biological opinions are available on the NMFS Alaska Region website at: https://www.fisheries.noaa.gov/alaska/consultations/section-7-biological-opinions-issued-alaska-region.
Effects of the Action
“Effects of the action” are all consequences to listed species or critical habitat that are caused by the Proposed Action, including the consequences of other activities that are caused by the Proposed Action. A consequence is caused by the proposed action if it would not occur but for the Proposed Action and it is reasonably certain to occur. Effects of the action may occur later in time and may include consequences occurring outside the immediate area involved in the action (50 CFR § 402.02).
As described in the IHA application package, the Proposed Action may cause the following effects to listed humpback whale:
Vessel interactions Underwater noise produced by impulsive and continuous noise sources related to pile driving
activities including vibratory pile driving and removal, impact pile driving, and down-the-hole drilling
Disturbance to benthic and pelagic habitat, and prey species
Vessel Interactions
The project area is expected to experience a slight increase in the amount of vessel traffic within marine mammal habitat; however, due to the substantial amount of existing vessel traffic in the area coupled with the continued use of the habitat by marine mammals, the effects on Mexico DPS humpback whales from project vessel interactions are expected to be negligible.

Appendix C: Biological Assessment Request for Incidental Harassment Authorization
October 2021 C-7
Underwater Noise
Because Mexico DPS humpback whales may be present within the action area when in-water work is conducted (particularly from May through September), they could be exposed to temporarily elevated underwater noise levels resulting in harassment. Possible responses by Mexico DPS humpback whales to underwater noise include temporary hearing impairment; auditory interference; change in dive, respiration, or feeding behavior; change in vocalization; and avoidance or displacement. Pile placement and removal would generate in-air noise, which is not expected to impact humpback whales.
As described in Section 6 of the IHA application package, temporarily elevated underwater noise during pile driving activities has the potential to result in Level B (behavioral) harassment of humpback whales. Level A harassment (resulting in injury) is not expected to occur as a result of the Proposed Action because shutdown zones would be implemented, and proposed mitigation measures proposed in Section 11 of the IHA application package would reduce the potential for exposure to levels of underwater noise above the injury thresholds. Exposure estimate and take requested for Mexico DPS humpback whale is one animal and represents 0.03 percent of the stock (Table 6-9 of the IHA application package).
The nearshore and intertidal habitat where the project would occur is an area of relatively high marine vessel traffic, industrial noise, and float plane activity. Although Mexico DPS humpback whales are not expected to occur in the project footprint, temporary and intermittent habitat avoidance may result from increased noise levels within the action area.
Habitat and Prey
Construction of the project would involve pile and pier removal work and placement of structures in the Tongass Narrows, which would result in direct impacts to aquatic habitat. A summary of direct impacts to aquatic habitats associated with new project structures based on 30-percent design documents is provided in Table C-1.
Table C-1: Direct Impacts
Structures Fill Material Pile
Quantity
Seafloor Footprint
(square feet)
Over-Water Footprint
(square feet)
Floating Pier Steel piles, 24-inch diameter,
10 31 12,000
Transfer Bridge N/A N/A N/A 2,448
Transfer Bridge Support Frame and Float
Steel piles, 24-inch diameter,
4 13 5281
Transfer Bridge Abutment
Concrete, shot rock, armor rock, base course
N/A 620 N/A
Small Boat Dock Steel piles N/A 13 1,264
Small Boat Dock Suspended Gangway
N/A 4 N/A 150
Suspended Gangway/Catwalk Mooring Dolphins
N/A N/A N/A N/A
Small Boat Launch Ramp
Concrete, shot rock, armor rock, base course
N/A 11,190 N/A
Total 18 11,867
(0.27 acre) 16,390
(0.38 acre)
Notes: 1The bridge support float would overlap with that of the bridge itself, therefore the support float area is excluded from the calculation of total over-water footprint. N/A = not applicable

Appendix C: Biological Assessment Request for Incidental Harassment Authorization
October 2021 C-8
Data in this table are AECOM estimates and were calculated using maximum quantities and dimensions so they provide a conservative estimate of project impacts.
Construction of the project would involve installation of 18 piles and in-water fill associated with the transfer bridge abutment and the small boat launch ramp, which would modify approximately 0.27 acre of marine substrate. Proposed in-water infrastructure would have an estimated over-water footprint of approximately 0.38 acre. These structures would remain present through operations of the NOAA Ketchikan port (20 to 50 years) and would be removed according to industry standards at the time of decommissioning, unless continued for future use. These direct impacts would be partially offset by removal of existing dilapidated in-water structures; approximately 100 to 200 pilings (approximately 0.009 to 0.014 acre, depending on exact number and diameter of removed piles) and approximately 0.36 acre of over-water infrastructure would be removed. Therefore, the net increase in seafloor footprint at the project site would be approximately 0.27 acre, whereas the net increase in over-water footprint would be approximately 0.02 acre.
The Proposed Action would result in temporary and intermittent changes to water quality (increases in turbidity levels) and on prey species distribution. Pile installation and removal may cause temporary and localized turbidity through sediment disturbance; any turbidity plumes are expected to be localized to the immediate vicinity of the pile. Due to temporary, localized, and low levels of turbidity increases, turbidity would not result in long-term effects to the Mexico DPS humpback whale or their prey.
Interdependent actions are actions having no independent utility apart from the project. Interrelated actions are actions that are part of a larger action and depend on the larger action for their justification (50 CFR § 402.02). Future operation and maintenance of the facility are considered interdependent. NOAA is required to follow federal, state, and local laws, many of which require implementation of best management practices to avoid and minimize potential impacts on aquatic habitats when maintenance is needed.
Effects Determination
The effects determinations for ESA-listed species and critical habitats are summarized in Table C-2.
Table C-2: Effects Determination for ESA-listed Species and Critical Habitats
Common Name Scientific Name
DPS ESA Status Listing
Effects Determination for Species
Effects Determination for Critical Habitat
Humpback Whale Megaptera novaeangliae (Mexico DPS)
Threatened 81 FR 62260 May affect, likely to
adversely affect
No effect, not designated in action
area.
Notes: DPS = Distinct Population Segment; ESA = Endangered Species Act; FR = Federal Register.
A may affect, likely to adversely affect determination is warranted for Mexico DPS humpback whale because:
Humpback whales have been documented in the action area and may be present during pile removal or placement activities at the Ketchikan Port Facility, and
Humpback whales may be exposed to acoustic harassment from pile removal or placement activities if they are present in the action area during project activities
Underwater noise from pile driving activities is the primary reason why the Proposed Action is likely to adversely affect Mexico DPS humpback whales. This is the appropriate conclusion because these effects cannot conclusively be classified as “discountable, insignificant, or beneficial” (USFWS and NMFS 1998). However, no injury or mortality is anticipated or authorized as part of the Proposed Action. Exposure could temporarily disrupt one or more behavioral patterns but is not expected to affect overall Mexico DPS humpback whale fitness, reproduction, or survival. Incidental take (Level B harassment) of one Mexico DPS humpback whale has been requested in the IHA application package.

Appendix C: Biological Assessment Request for Incidental Harassment Authorization
October 2021 C-9
References
Baker, C.S., L.M. Herman, A. Perry, W.S. Lawton, J.M. Straley, and J.H. Straley. 1985. Population characteristics and migration of summer and late-season humpback whales (Megaptera novaeangliae) in southeastern Alaska. Mar. Mamm. Sci. 1:304-323.
Bettridge, S., C.S. Baker, J. Barlow, P.J. Clapham, M. Ford, D. Gouveia, D.K. Mattila, R.M. Pace, III, P.E. Rosel, G.K. Silber, and P.R. Wade. 2015. Status Review of The Humpback Whale (Megaptera novaeangliae) Under the Endangered Species Act. March 2015. Department of Commerce, NOAA Technical Memo. NOAA-TM-NMFS-SWFSC-540
Dahlheim, M.E., P.A. White, and J.M. Waite. 2009. Cetaceans of Southeast Alaska: distribution and seasonal occurrence. Journal of Biogeography 36:410–426.
Hastings, K., M. Rehberg, G. O’Corry-Crowe, G. Pendleton, L. Jemison and T. Gelatt. 2020. Demographic consequences and characteristics of recent population mixing and colonization in Steller sea lions, Eumetopias jubatus. Journal of Mammalogy. Submitted June 2019.
HDR. 2019. Tongass Narrows Project: Application for MMPA Incidental Harassment Authorizations Revision Number 4. Report prepared for Alaska Department of Transportation & Public Facilities, Juneau, Alaska.
Liddle, Joseph. 2015. Population Dynamics of Pacific Herring and Humpback Whales, Sitka Sound, Alaska 1981-2011 (doctoral dissertation). University of Alaska Fairbanks.
National Marine Fisheries Service (NMFS). 2010. Recovery plan for the fin whale (Balaenoptera physalus). National Marine Fisheries Service, Silver Spring, MD. 121 pp.
NMFS. 2019. Biological Opinion for the Tongass Narrows Project (Gravina Access). NMFS Consultation Number: AKRO-2019-03432. Juneau, Alaska.
Sitkiewicz, S. 2020. 2019-2020 City of Ketchikan Rock pinnacle Removal Project Marine Mammal Monitoring and Mitigation Report. Prepared for National Marine Fisheries Service, Alaska Region, Protected Resources Division, 222 W. 7th Avenue, #43 Anchorage, AK 99513; National Marine Fisheries Service, Permits and Conservation Division, Office of Protected Resources, 1315 East-West Highway, Silver Spring, MD, 20910. Prepared by Fairweather Science, LLC, 301 Calista Court, Anchorage, AK 99518. April 2020.
Straley, J.M. 1990. Fall and winter occurrence of humpback whales (Megaptera novaeangliae) in southeastern Alaska. pp 319-323 in Hammond, PS, SA Mizroch, and GP Donovan (eds) Rept. Int. Whal. Commn. (Special Issue 12): Individual Recognition of Cetaceans: Use of Photo-Identification and Other Techniques to Estimate Population Parameters. International Whaling Commission.
Straley, J.M., J.R. Moran, K.M. Boswell, J.J. Vollenweider, R.A. Heintz, T.J. Quinn II, B.H. Witteveen, and S D. Rice. 2017. Seasonal presence and potential influence of humpback whales on wintering Pacific herring populations in the Gulf of Alaska. Deep-Sea Research Part II: Topical Studies in Oceanography http://dx.doi.org/10.1016/j.dsr2.2017.08.008.
United States Fish and Wildlife Service and National Marine Fisheries Service (USFWS and NMFS). 1998. Endangered Species Act Consultation Handbook - Procedures for Conducting Section 7 Consultations and Conferences. March 1998.
Wade, P. R. 2021. Estimates of abundance and migratory destination for North Pacific humpback whales in both summer feeding areas and winter mating and calving areas. International Whaling Commission. SC/68c/IA/03. 32 pp. https://archive.iwc.int/.
Witteveen, B.H. and K.M. Wynne. 2017. Site fidelity and movement of humpback whales (Megaptera novaeangliae) in the western Gulf of Alaska as revealed by photo-identification. Can. J. Zool. 95: 169–175 dx.doi.org/10.1139/cjz-2016-0101

Appendix C: Biological Assessment Request for Incidental Harassment Authorization
October 2021 C-10
Witteveen, B. Worth, G. Roth, J. 2009. Tracing Migratory movements of breeding North Pacific humpback whales using stable isotope analysis. Mar. Ecol. Prog. Ser. 393 (2009), pages 173 – 183.

Appendix D: Essential Fish Habitat Assessment

Appendix D: Essential Fish Habitat Assessment Request for Incidental Harassment Authorization
October 2021 D-2
Essential Fish Habitat Assessment Introduction
This Essential Fish Habitat (EFH) assessment evaluates potential effects on EFH as defined by the Magnuson-Stevens Fishery Conservation and Management Act (Magnuson-Stevens Act), as amended by the Sustainable Fisheries Act of 1996 (16 United States Code [U.S.C.] 1801 et seq.).
The Magnuson-Stevens Act, as amended by the Sustainable Fisheries Act of 1996 (Public Law 104-267), requires federal agencies to consult with National Marine Fisheries Service (NMFS) on activities that may adversely affect EFH. EFH is defined as “those waters and substrates necessary to fish for spawning, breeding, feeding, or growth to maturity.”
The objective of this EFH assessment is to determine whether the proposed action(s) “may adversely affect” designated EFH for commercially relevant, federally managed fisheries species within the proposed action area. The EFH Guidelines, 50 Code of Federal Regulations (CFR) §§ 600.05 – 600.930, outline procedures that federal agencies must follow to satisfy Magnuson-Stevens Act consultation requirements. Federal agencies must provide NMFS with an EFH Assessment if the federal action may adversely affect EFH. An EFH Assessment is to include the following contents (50 CFR § 600.920[e]): (1) a description of the action; (2) an analysis of the potential adverse effects of the action on EFH and the managed species; (3) the federal agency’s conclusions regarding the effects of the action on EFH; and (4) proposed mitigation, if necessary.
To streamline requirements and avoid duplication, this EFH assessment is combined with existing environmental review procedures required under the Marine Mammal Protection Act and the project’s request for Incidental Harassment Authorization (IHA), in additional to National Environmental Policy Act and Endangered Species Act. This abbreviated EFH assessment is not intended to be a stand-alone document and uses information embedded in the IHA application package. References to various sections in the IHA application package are included in this EFH assessment as appropriate.
Project Description
The Proposed Action at the Ketchikan Port Facility would require demolition, disposal, and replacement of key structures and infrastructure within portions of a 77,000-square-foot (1.8-acre) upland area and a 102,000-square foot (2.3-acre) in-water area owned by the National Oceanic and Atmospheric Administration (NOAA). Nearly all the existing NOAA Office of Marine and Aviation Operations facilities and assets at its Ketchikan Port Facility would be affected. A detailed description of the Proposed Action is provided in Section 1 of the IHA application package. In-water work including pile removal and placement is anticipated to occur for approximately 47 days on an intermittent basis between February 2022 and December 2022. Proposed minimization and avoidance measures are provided in Section 11 of the IHA application package.
Project and Action Areas
The project area is defined as the geographic extent of proposed activities and where direct effects to species and critical habitats may occur (see Figure 1-2 of IHA application package). The action area includes all areas affected directly or indirectly by the federal action and not merely the immediate area involved in the action (50 CFR § 402.02). The action area encompasses the project area as well as the estimated maximum spatial extent for underwater noise (12 kilometers) and airborne noise (1 kilometer). The complete action area, including terrestrial and aquatic portions, is shown in IHA application package Figure 2-1. The action area limits were established based on a review of underwater noise propagation from the project that could affect marine mammals. Marine mammal injury and disturbance threshold criteria are provided in Section 6 of the IHA application package. An Underwater Noise Technical Memorandum prepared for removal/installation of piles at Ketchikan Port Facility is provided in Appendix B of the IHA application package.

Appendix D: Essential Fish Habitat Assessment Request for Incidental Harassment Authorization
October 2021 D-3
Essential Fish Habitat in the Action Area
EFH in Alaska is identified in Fishery Management Plans developed by the North Pacific Fishery Management Council (NPFMC) and approved by the Secretary of Commerce. EFH for species occurring in the action area (Tongass Narrows and Revillagigedo Channel) includes Alaska stocks of Pacific salmon and the groundfish Dover sole (Microstomus pacificus) (NMFS 2021) (Table D-1). Within the action area, there are 10 anadromous fish streams listed in the Alaska Department of Fish and Game (ADF&G 2021) Anadromous Waters Catalog (Figure D-1; Table D-2).
Table D-1: EFH in the Action Area
Species Life Stages Habitat Description
Chinook Salmon Marine juveniles, marine immature and maturing adults
Marine juveniles: all marine waters off the coast of Alaska from the mean higher tide line to the 200-nm limit of the EEZ, including the GOA.
Marine immature and maturing adults: marine waters off the coast of Alaska to depths of 200 m and ranging from the mean higher tide line to the 200-nm limit of the EEZ including the GOA.
Chum Salmon Marine juveniles, marine immature and maturing adults
Marine juveniles: all marine waters off the coast of Alaska to approximately 50 m in depth from the mean higher tide line to the 200-nm limit of the EEZ, including the GOA.
Marine immature and maturing adults: Same as Chinook salmon.
Coho Salmon Marine juveniles, marine immature and maturing adults
Marine juveniles: same as Chinook salmon.
Marine immature and maturing adults: same as Chinook salmon.
Pink Salmon Marine juveniles, marine immature and maturing adults
Marine juveniles: same as Chinook salmon.
Marine immature and maturing adults: same as Chinook salmon.
Sockeye Salmon Marine juveniles, marine immature and maturing adults
Marine juveniles: same as chum salmon.
Marine immature and maturing adults: same as Chinook salmon.
Dover Sole Late juveniles, adults
Late juveniles: lower portion of the water column along the middle (50 to 100 m) and outer (100 to 200 m) shelf and upper slope (200 to 500 m) throughout the GOA wherever there are substrates consisting of sand and mud.
Adults: same as for late juveniles. Notes: EEZ = Exclusive Economic Zone; GOA = Gulf of Alaska; m = meter(s); nm = nautical mile.
Source: NPFMC 2015, 2018; ADF&G 2021

Appendix D: Essential Fish Habitat Assessment Request for Incidental Harassment Authorization
October 2021 D-4
Figure D-1: Anadromous Waters in the Action Area

Appendix D: Essential Fish Habitat Assessment Request for Incidental Harassment Authorization
October 2021 D-5
Table D-2. Anadromous Waters in the Action Area
Map ID
(Stream Number) AWC Code Species Habitat Use
1 101-47-10400 (Government Creek)
Chum, Coho, and Pink Salmon Present (Chum and Coho); Spawning and Rearing (Pink Only)
2 101-47-10380 (Unnamed)
Coho Salmon Present
3 101-47-10350
(Long Lake Creek) Coho Salmon Present
4 101-47-10340 (Unnamed)
Coho Salmon Present
5 101-47-10180
(Carlanna Creek) Chum, Coho, and Pink Salmon Present
6 101-47-10200
(Hoadley Creek) Coho and Pink Salmon
Present (Coho); Spawning (Pink)
7 101-47-10250 (Ketchikan Creek)
Chum, Coho, Chinook, Pink and Sockeye Salmon;
Steelhead and Cutthroat Trout
Present
8 101-47-10300 (Unnamed)
Chum and Pink Salmon Present
9 101-41-10005
(Adams Creek) Pink Salmon Spawning
10 101-41-10010 (Unnamed)
Coho and Pink Salmon Rearing (Coho); Spawning (Pink)
Notes: AWC = Anadromous Waters Catalog; ID = unique identifier
Source: ADF&G 2021
Potential Adverse Effects of Proposed Action
Construction of the project would involve pile and pier removal work and placement of structures in the Tongass Narrows, which would result in direct impacts to EFH. A summary of direct impacts to aquatic habitats associated with new project structures from the 30 percent design is provided in Table D-3.
Table D-3. Estimate of Direct Impacts to Aquatic Habitats from Proposed Structures
Structures Fill Material Pile
Quantity
Seafloor Footprint
(square feet)
Over-Water Footprint
(square feet)
Floating Pier Steel piles, 24-inch diameter,
10 31 12,000
Transfer Bridge N/A N/A N/A 2,448
Transfer Bridge Support Frame and Float
Steel piles, 24-inch diameter,
4 13 5281
Transfer Bridge Abutment
Concrete, shot rock, armor rock, base course
N/A 620 N/A
Small Boat Dock Steel piles N/A 13 1,264

Appendix D: Essential Fish Habitat Assessment Request for Incidental Harassment Authorization
October 2021 D-6
Structures Fill Material Pile
Quantity
Seafloor Footprint
(square feet)
Over-Water Footprint
(square feet)
Small Boat Dock Suspended Gangway
N/A 4 N/A 150
Suspended Gangway/Catwalk Mooring Dolphins
N/A N/A N/A N/A
Small Boat Launch Ramp
Concrete, shot rock, armor rock, base course
N/A 11,190 N/A
Total 18 11,867
(0.27 acre) 16,390
(0.38 acre)
Notes: 1The bridge support float would overlap with that of the bridge itself, therefore the support float area is excluded from the calculation of total over-water footprint. N/A = not applicable Data in this table are AECOM estimates and were calculated using maximum quantities and dimensions so they provide a conservative estimate of project impacts.
Construction of the project would involve installation of 18 piles and in-water fill associated with the transfer bridge abutment and the small boat launch ramp, which would modify approximately 0.27 acre of marine substrate. Proposed in-water infrastructure would have an estimated over-water footprint of approximately 0.38 acre. These structures would remain present through operations of the NOAA Ketchikan port (20 to 50 years) and would be removed according to industry standards at the time of decommissioning, unless continued for future use. These direct impacts would be partially offset by removal of existing dilapidated in-water structures; approximately 100 to 200 pilings (approximately 0.009 to 0.014 acre, depending on exact number and diameter of removed piles) and approximately 0.36 acre of over-water infrastructure would be removed. Therefore, the net increase in seafloor footprint at the project site would be approximately 0.27 acre, whereas the net increase in over-water footprint would be approximately 0.02 acre. However, no spawning habitat occurs at the site, and EFH-managed fish are expected to only use the habitat for migration.
The Proposed Action would have temporary impacts on water quality (increases in turbidity levels) and on EFH-managed species distribution. Pile driving may cause temporary and localized turbidity through sediment disturbance. Turbidity plumes during pile installation and removal would be localized around the pile. Due to temporary, localized, and low levels of turbidity increases, turbidity would not result in long-term effects to EFH or EFH-managed species.
Potential indirect effects, as defined for EFH consultations under 50 CFR § 600.810, include the short-term (i.e., hours to weeks) disturbance of benthic food organisms. The disturbances caused by the Proposed Action would be limited to specific in-water work areas and would not have a significant adverse effect on EFH over the long term.
Effects Determination
The effects determinations for EFH are summarized in Table D-4.
Table D-4: Effects Determination for Essential Fish Habitat
Essential Fish Habitat Designation Species or Resource in Essential Fish Habitat
Effects Determination
Pacific Coast Salmon EFH Chinook, Chum, Coho, Pink, and
Sockeye Salmon May adversely affect
Groundfish EFH Dover Sole May adversely affect
Notes: EFH = Essential Fish Habitat.

Appendix D: Essential Fish Habitat Assessment Request for Incidental Harassment Authorization
October 2021 D-7
References
Alaska Department of Fish and Game (ADF&G). 2021. Anadromous Waters Catalogue; Online Mapper. Available at: https://adfg.maps.arcgis.com/apps/MapSeries/index.html?appid=a05883caa7ef4f7ba17c99274f2c198f. Last Accessed August 26, 2021.
National Marine Fisheries Service (NMFS). 2021. Alaska Essential Fish Habitat Mapper. Essential Fish Habitat ArcGIS web application. Last updated by Alaska Regional Office on 19 November 2019. Available at: https://www.fisheries.noaa.gov/resource/map/alaska-essential-fish-habitat-efh-mapper
North Pacific Fishery Management Council (NPFMC). 2015. Fishery Management Plan for Groundfish of the Gulf of Alaska. Prepared by the North Pacific Fishery Management Council. Anchorage, AK. 152 pp.
NPFMC. 2018. Fishery Management Plan for the Salmon Fisheries in the EEZ off Alaska. Prepared by the North Pacific Fishery Management Council, National Marine Fisheries Service, Alaska Region, and State of Alaska Department of Fish and Game. Anchorage, AK. 152 pp.

Appendix E: List of Invited Parties

Ketchikan Section 106 Alaska Native Corporations/Communities
Ms. Rosita Worl President Sealaska Heritage Institute One Sealaska Plaza, Suite 301 Juneau, AK 99801 Mr. Richard Peterson President Central Council of the Tlingit and Haida Indian Tribes of Alaska 320 W. Willoughby Ave., Suite 300 Juneau, AK 99801
Ms. Gloria Burns President Ketchikan Indian Community 2960 Tongass Ave. Ketchikan, Alaska 99901
Karl Cook Mayor Metlakatla Indian Community PO Box 8 Metlakatla, AK 99926
Lee Wallace President Organized Village of Saxman Route 2, Box 2 - Saxman Ketchikan, AK 99901
Clifford Blair President Cape Fox Corporation 2851 S Tongass Hwy PO Box 8558 Ketchikan, AK 99901
Recommended