Citation: Kumar, S.; Ahmed, F.;
Ahmad, N.; Shaalan, N.M.; Kumar,
R.; Alshoaibi, A.; Arshi, N.; Dalela, S.;
Albossed, M.; Chae, K.H.; et al. Role
of Cr Doping on the Structure,
Electronic Structure, and
Electrochemical Properties of BiFeO3
Nanoparticles. Materials 2022, 15,
4118. https://doi.org/10.3390/
ma15124118
Academic Editor: Qing-feng Liu
Received: 6 May 2022
Accepted: 7 June 2022
Published: 9 June 2022
Publisher’s Note: MDPI stays neutral
with regard to jurisdictional claims in
published maps and institutional affil-
iations.
Copyright: © 2022 by the authors.
Licensee MDPI, Basel, Switzerland.
This article is an open access article
distributed under the terms and
conditions of the Creative Commons
Attribution (CC BY) license (https://
creativecommons.org/licenses/by/
4.0/).
materials
Article
Role of Cr Doping on the Structure, Electronic Structure,and Electrochemical Properties of BiFeO3 NanoparticlesShalendra Kumar 1,2,* , Faheem Ahmed 1 , Naushad Ahmad 3, Nagih M. Shaalan 1,4 , Rajesh Kumar 5,Adil Alshoaibi 1 , Nishat Arshi 6, Saurabh Dalela 7 , Mohammed Albossed 1, Keun Hwa Chae 8 ,Parvez Ahmad Alvi 9 and Kavita Kumari 10
1 Department of Physics, College of Science, King Faisal University, P.O. Box 400, Al-Ahsa 31982, Saudi Arabia;[email protected] (F.A.); [email protected] (N.M.S.); [email protected] (A.A.);[email protected] (M.A.)
2 Department of Physics, University of Petroleum & Energy Studies, Dehradun 248007, India3 Department of Chemistry, College of Science, King Saud University, P.O. Box 2455,
Riyadh 11451, Saudi Arabia; [email protected] Physics Department, Faculty of Science, Assiut University, Assiut 71516, Egypt5 University School of Basic and Applied Sciences, Guru Gobind Singh Indraprastha University,
New Delhi 110078, India; [email protected] Department of Basic Sciences, Preparatory Year Deanship, King Faisal University, P.O. Box 400,
Hofuf Al-Ahsa 31982, Saudi Arabia; [email protected] Department of Pure & Applied Physics, University of Kota, Kota 324005, India; [email protected] Advanced Analysis Center, Korea Institute of Science and Technology, Seoul 136-791, Korea; [email protected] Department of Physics, Banasthali Vidyapith, Banasthali 304022, India; [email protected] School of Materials Science and Engineering, Changwon National University, Changwon 51140, Korea;
[email protected]* Correspondence: [email protected]
Abstract: BiFe1−xCrxO3, (0 ≤ x ≤ 10) nanoparticles were prepared through the sol–gel technique. Thesynthesized nanoparticles were characterized using various techniques, viz., X-ray diffraction, high-resolution field emission scanning electron microscopy (HRFESEM), energy dispersive spectroscopy(EDS), UV–Vis absorption spectroscopy, photoluminescence (PL), dc magnetization, near-edge X-rayabsorption spectroscopy (NEXAFS) and cyclic voltammetry (CV) measurements, to investigate thestructural, morphological, optical, magnetic and electrochemical properties. The structural analysisshowed the formation of BiFeO3 with rhombohedral (R3c) as the primary phase and Bi25FeO39 as thesecondary phase. The secondary phase percentage was found to reduce with increasing Cr content,along with reductions in crystallite sizes, lattice parameters and enhancement in strain. Nearly spher-ical shape morphology was observed via HRFESEM with Bi, Fe, Cr and O as the major contributingelements. The bandgap reduced from 1.91 to 1.74 eV with the increase in Cr concentration, and PLspectra revealed emissions in violet, blue and green regions. The investigation of magnetic field(H)-dependent magnetization (M) indicated a significant effect of Cr substitution on the magneticproperties of the nanoparticles. The ferromagnetic character of the samples was found to increasewith the increase in the Cr concentration and the increase in the saturation magnetization. The Fe(+3/+4) was dissolved in mixed-valence states, as found through NEXAFS analysis. Electrochemicalstudies showed that 5%-Cr-doped BFO electrode demonstrated outstanding performance for super-capacitors through a specific capacitance of 421 F g−1 measured with a scan rate of 10 mV s−1. It alsodemonstrated remarkable cyclic stability through capacitance retention of >78% for 2000 cycles.
Keywords: Cr doped BiFeO3; supercapacitor; electrochemical; ferromagnetic; band gap
1. Introduction
Electrochemical energy storage devices, including batteries, fuel cells and superca-pacitors, adequately meet the constantly increasing demands of portable energy devices.
Materials 2022, 15, 4118. https://doi.org/10.3390/ma15124118 https://www.mdpi.com/journal/materials
Materials 2022, 15, 4118 2 of 19
Recently, supercapacitors have become a significant area of interest for the research com-munity due to their high specific capacitance and remarkable cyclic stability [1–5]. Thesupercapacitor electrodes combine the faradaic redox reaction and the non-faradaic electro-static charge storage mechanisms and provide fast ion diffusion and a high specific surfacearea, which helps to achieve high energy density. Researchers have been working on thedevelopment of an electrode material which can involve both rapid charging/dischargingof supercapacitors and high energy density of the batteries. The performance of the super-capacitor can be enhanced by increasing the energy density and electrochemical cyclingstability, leading to highly efficient electrode materials [6,7]. The measurement of thesupercapacitance performance of the electrode material is performed by cyclic voltammetry(CV) galvanostatic charging–discharging. The electrode material should be fabricatedusing a material with high specific capacitance and a large number of charge–dischargecycles [8]. For this purpose, bismuth ferrite (BFO) has emerged as a promising materialowing to its modifiable redox properties and charge storage capacity [9–15]. Devi et al.have well described the energy storage applications of the Bi-based materials, includingLi-ion batteries, fuel cells, etc. [6].
Moreover, in the last few decades, multiferroic materials have gained the great atten-tion of the scientific community due to their advanced technological applications [16–21].Among them, BFO also possesses vital coexisting multiferroic properties such as ferromag-netism and ferroelectricity. The distorted rhombohedral crystal structure of BFO allowsdeformation in the central-local symmetry due to the spontaneous polarization caused by6s2 lone pairs of Bi3+ ions which give rise to the ferroelectric properties of the material. Onthe other hand, the exchange interactions involving Fe3+ ions result in the ferromagneticordering [22]. BFO demonstrates a ferromagnetic curie temperature of ~1102 K and anantiferromagnetic Neel temperature of ~644 K. There are many existing reports which showsignificant multiferroic properties in BFO [23]. Interestingly, both the properties functionsimultaneously, showing a co-dependent magnetoelectric relationship. Due to these re-markable properties, BFO has been established as a potential candidate for technologicalapplications in the fields of spintronics and communications. However, the synthesis ofsingle-phase BFO is very challenging because of the formation of secondary phases alongwith the BiFeO3 phase. Generally, the BiFeO3 phase is accompanied by secondary phases—Bi2Fe4O9, Bi25FeO39, etc. [8,24,25]. Suppressing the secondary phases is a quite challengingtask. Even so, the values of the high specific capacitance make BFO an important candidatefor electrochemical applications. The formation of a single phase and the enhancement inspecific capacitance of BFO can be accomplished by the doping of rare earth or transitionsmetal elements at the A site or B site, respectively. The doping of foreign elements atthe position of the host cation at low concentrations can work wonders when it comes toreducing the secondary phases and enhancing the values of specific capacitance. Recently,Kumar et al. have obtained a specific capacitance of 328 F/g in La-doped BFO, resulting inan excellent supercapacitor performance [3]. For this reason, BFO has been highly exploredlately for obtaining an electrode material with enhanced supercapacitance performance.
Therefore, in the present work, we have prepared BiFe1−xCrxO3, (0 ≤ x ≤ 10) nanopar-ticles via sol–gel chemical route. The synthesized nanoparticles were characterized viavarious characterization techniques, viz., X-ray diffraction, high-resolution field emissionscanning electron microscopy (HRFESEM), energy dispersive spectroscopy (EDS), UV–vis absorption spectroscopy, photoluminescence (PL), dc magnetization, near-edge X-rayabsorption spectroscopy (NEXAFS) and electrochemical measurements to investigate thestructural, morphological, optical and magnetic properties and electrochemical performance.
2. Experimental Details2.1. Materials
Bismuth nitrate pentahydrate [Bi(NO3)3·5H2O]; iron nitrate nonahydrate [Fe(NO3)3·9H2O];chromium nitrate hexahydrate [Cr(NO3)3·6H2O], citric acid (C6H8O7), concentrated nitric
Materials 2022, 15, 4118 3 of 19
acid (HNO3) and ethylene glycol. All precursor salts and reagents were of high purity(>97%) and purchased from Central Drug House, (CDH, New Delhi, India).
2.2. Method
BiFe1−xCrxO3, (0 ≤ x ≤ 10) nanoparticles were synthesized using the sol–gel method.An appropriate amount of citric acid (C6H8O7) was dissolved in 50 mL of DI water to obtaina molar concentration of 0.1 M. The ratio of metal nitrate and citric acid was kept at 1:1.The mixture was stirred at room temperature to make a solvent for further reaction. Then,Bi(NO3)3·5H2O was added to the solvent, followed by an appropriate amount of concen-trated HNO3 to dissolve Bi(NO3)3·5H2O. Once Bi(NO3)3·5H2O was dissolved, chromiumnitrate hexahydrate [Cr (NO3)3·6H2O] and iron nitrate nonahydrate (Fe(NO3)3·9H2O) wereadded as per their pre-decided ratio. These precursor salts were mixed well at room tem-perature. Finally, ethylene glycol was added to the mixture under vigorous stirring at 90 Cto form a gel and allowed to dry completely. The obtained product was grinded well andcalcined at 550 C for 2 h.
2.3. Sample Characterizations
The synthesized products were characterized using X-ray diffraction, high-resolutionfield emission scanning electron microscopy (HRFESEM), energy dispersive spectroscopy(EDS), UV–vis absorption spectroscopy, photoluminescence (PL) and dc magnetization.A Bruker AXS D8 X-ray diffractometer with Cu Kα radiation (λ = 1.54178 Å; 2θ range:10–90), at a scanning rate of 0.02/s, was used to study the phase purity of the samples.The HRFESEM micrographs and EDS spectra were obtained with a field emission electronmicroscope (FESEM, JSM-7500, JEOL, Tokyo, Japan). The optical properties were studiedusing UV–vis absorption spectroscopy performed using a photo-spectrometer (S-4100) fromSINCO Instrument Co. Seoul, Korea. The PL spectra were obtained at Model LAMBDA35, PerkinElmer (Waltham, MA, USA). The M-H hysteresis loop measurements werecarried out using Quantum Design physical properties measurement setup (PPMS-6000,Quantum Design, San Diego, CA, USA). The Fe L3,2 and O K-edge spectra were measuredwith the soft X-ray beamline 10D XAS KIST (Korea Institute of Science and Technology)of Pohang Accelerator Laboratory (PAL). A typical three-electrode experimental cell ofan electrochemical analyzer (Corrtest-CS150, Wuhan, China) was used to perform theelectrochemical measurements of Cr doped BiFeO3 nanoparticles. The pretreated nickelfoam of the size 2 cm × 1 cm was used to prepare the electrode. The mechanism of theelectrode fabrication was as follows: Pure and Cr doped BiFeO3 in different concentrations,polyvinylidene fluoride (PVDF) and carbon black were mixed in the ratio of 80:10:10. Allthe chemicals were mixed homogeneously using n-methyl-2 pyrrolidinone (NMP) as asolvent to form a slurry and then coated onto the nickel foam. Finally, the nickel foam waskept for drying at 80 C in the oven for 24 h. All the experiments were performed in a 2 MKOH aqueous solution as an electrolyte, at room temperature, with Ag/AgCl as a referenceelectrode and Pt wire as a counter electrode. The electrochemical property of Cr dopedBiFeO3 was examined with cyclic voltammetry (CV). The CV measurements were in therange of 0.0 to 0.6 V. The specific capacitances (C, (F/g)) of all the studied samples weredetermined using the relation [3]:
C =1
2mVk
∫ V+
V−I(V)dV By CV (1)
where C (F g−1) defines the specific capacitance, I (A) represents discharge current, V (V)corresponds to the potential range, m (g) represents the mass of the active material and k(V s−1) is scan rate. Electrochemical impedance spectroscopies (EIS) measurements werecarried out between 1 and 100 MHz using a sinusoidal perturbation of amplitude 10 mV.
Materials 2022, 15, 4118 4 of 19
3. Results and Discussion3.1. XRD Analysis
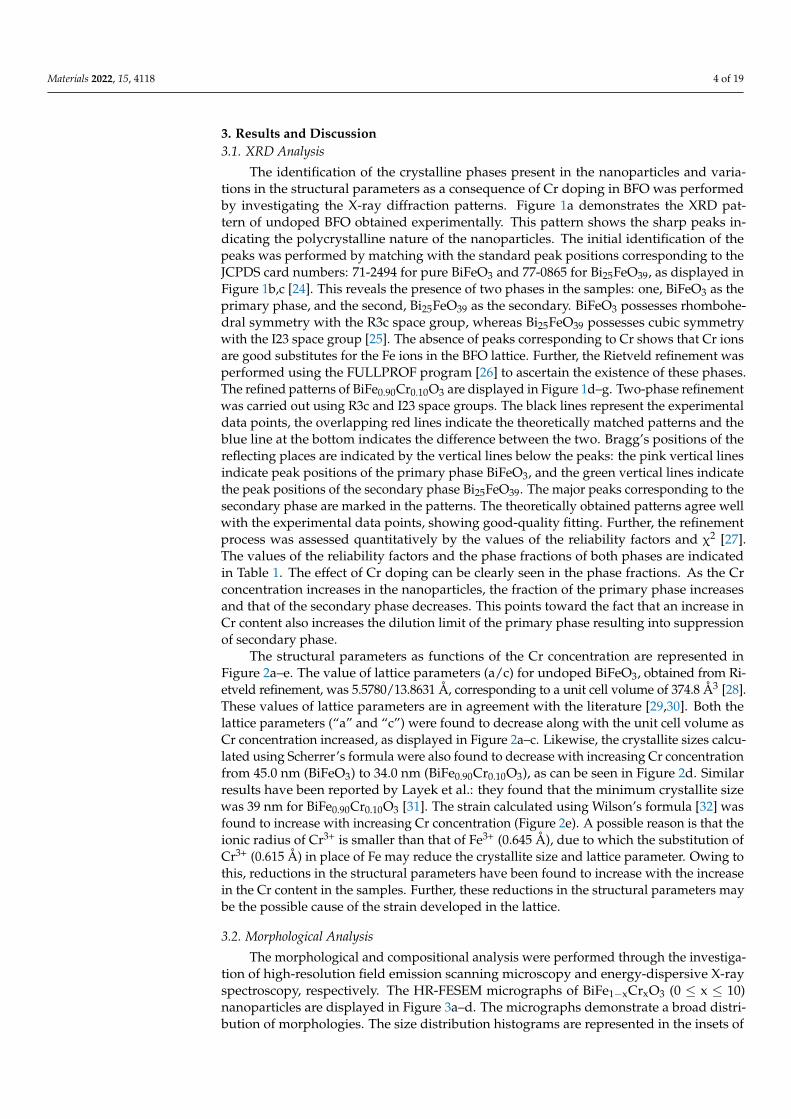
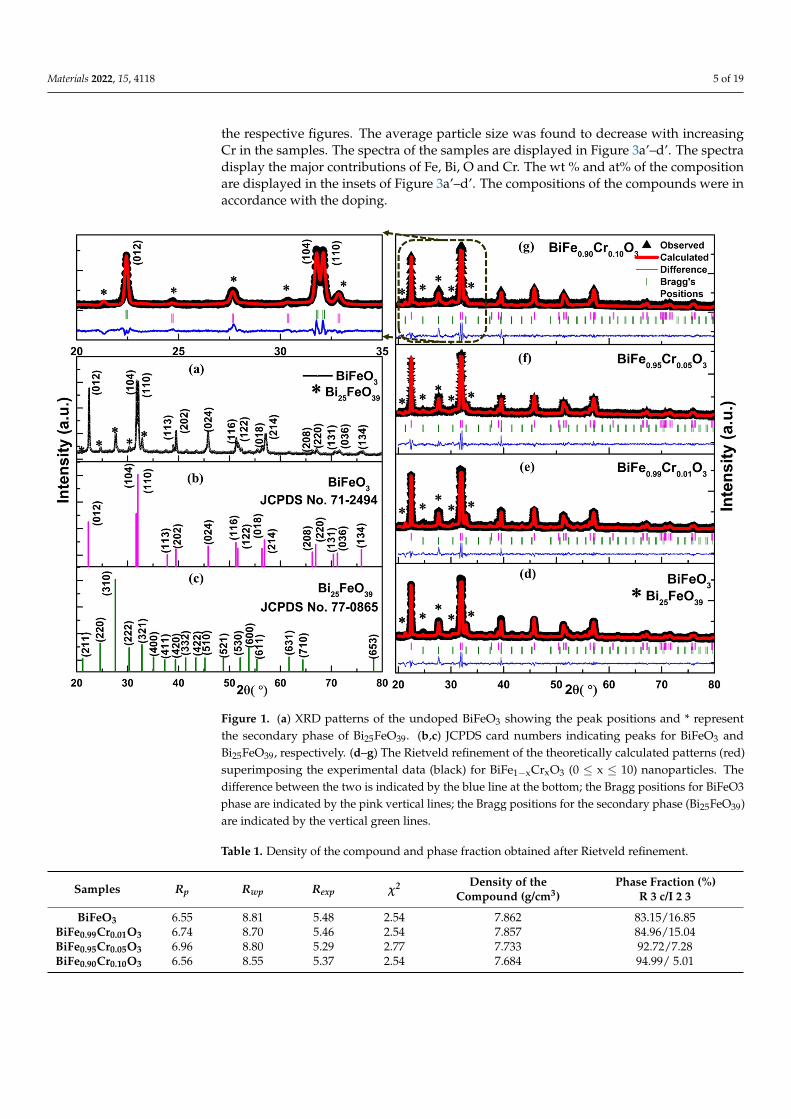
The identification of the crystalline phases present in the nanoparticles and varia-tions in the structural parameters as a consequence of Cr doping in BFO was performedby investigating the X-ray diffraction patterns. Figure 1a demonstrates the XRD pat-tern of undoped BFO obtained experimentally. This pattern shows the sharp peaks in-dicating the polycrystalline nature of the nanoparticles. The initial identification of thepeaks was performed by matching with the standard peak positions corresponding to theJCPDS card numbers: 71-2494 for pure BiFeO3 and 77-0865 for Bi25FeO39, as displayed inFigure 1b,c [24]. This reveals the presence of two phases in the samples: one, BiFeO3 as theprimary phase, and the second, Bi25FeO39 as the secondary. BiFeO3 possesses rhombohe-dral symmetry with the R3c space group, whereas Bi25FeO39 possesses cubic symmetrywith the I23 space group [25]. The absence of peaks corresponding to Cr shows that Cr ionsare good substitutes for the Fe ions in the BFO lattice. Further, the Rietveld refinement wasperformed using the FULLPROF program [26] to ascertain the existence of these phases.The refined patterns of BiFe0.90Cr0.10O3 are displayed in Figure 1d–g. Two-phase refinementwas carried out using R3c and I23 space groups. The black lines represent the experimentaldata points, the overlapping red lines indicate the theoretically matched patterns and theblue line at the bottom indicates the difference between the two. Bragg’s positions of thereflecting places are indicated by the vertical lines below the peaks: the pink vertical linesindicate peak positions of the primary phase BiFeO3, and the green vertical lines indicatethe peak positions of the secondary phase Bi25FeO39. The major peaks corresponding to thesecondary phase are marked in the patterns. The theoretically obtained patterns agree wellwith the experimental data points, showing good-quality fitting. Further, the refinementprocess was assessed quantitatively by the values of the reliability factors and χ2 [27].The values of the reliability factors and the phase fractions of both phases are indicatedin Table 1. The effect of Cr doping can be clearly seen in the phase fractions. As the Crconcentration increases in the nanoparticles, the fraction of the primary phase increasesand that of the secondary phase decreases. This points toward the fact that an increase inCr content also increases the dilution limit of the primary phase resulting into suppressionof secondary phase.
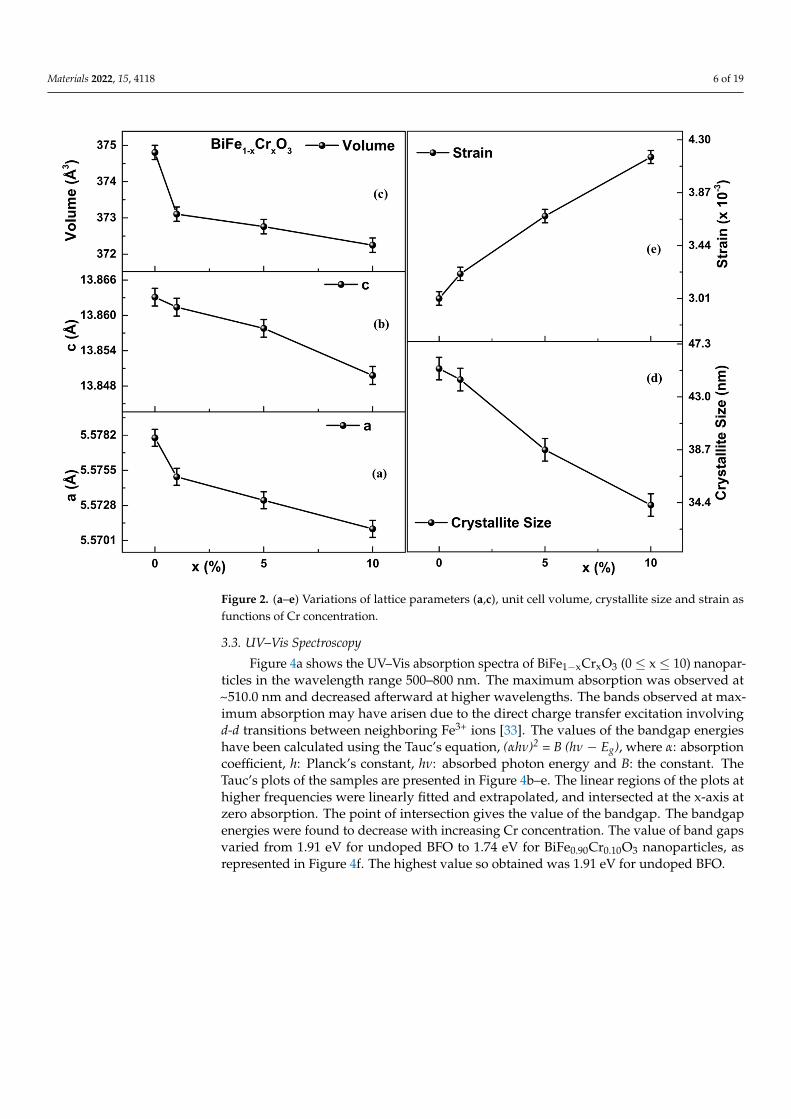
The structural parameters as functions of the Cr concentration are represented inFigure 2a–e. The value of lattice parameters (a/c) for undoped BiFeO3, obtained from Ri-etveld refinement, was 5.5780/13.8631 Å, corresponding to a unit cell volume of 374.8 Å3 [28].These values of lattice parameters are in agreement with the literature [29,30]. Both thelattice parameters (“a” and “c”) were found to decrease along with the unit cell volume asCr concentration increased, as displayed in Figure 2a–c. Likewise, the crystallite sizes calcu-lated using Scherrer’s formula were also found to decrease with increasing Cr concentrationfrom 45.0 nm (BiFeO3) to 34.0 nm (BiFe0.90Cr0.10O3), as can be seen in Figure 2d. Similarresults have been reported by Layek et al.: they found that the minimum crystallite sizewas 39 nm for BiFe0.90Cr0.10O3 [31]. The strain calculated using Wilson’s formula [32] wasfound to increase with increasing Cr concentration (Figure 2e). A possible reason is that theionic radius of Cr3+ is smaller than that of Fe3+ (0.645 Å), due to which the substitution ofCr3+ (0.615 Å) in place of Fe may reduce the crystallite size and lattice parameter. Owing tothis, reductions in the structural parameters have been found to increase with the increasein the Cr content in the samples. Further, these reductions in the structural parameters maybe the possible cause of the strain developed in the lattice.
3.2. Morphological Analysis
The morphological and compositional analysis were performed through the investiga-tion of high-resolution field emission scanning microscopy and energy-dispersive X-rayspectroscopy, respectively. The HR-FESEM micrographs of BiFe1−xCrxO3 (0 ≤ x ≤ 10)nanoparticles are displayed in Figure 3a–d. The micrographs demonstrate a broad distri-bution of morphologies. The size distribution histograms are represented in the insets of
Materials 2022, 15, 4118 5 of 19
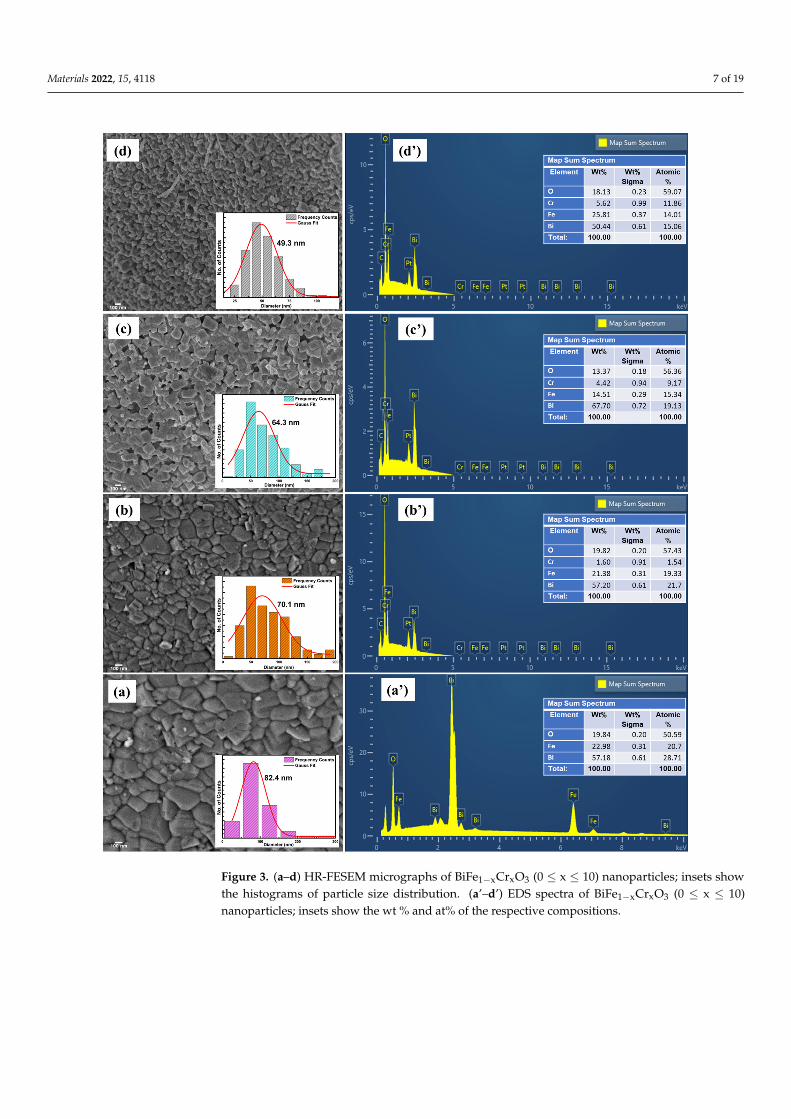
the respective figures. The average particle size was found to decrease with increasingCr in the samples. The spectra of the samples are displayed in Figure 3a’–d’. The spectradisplay the major contributions of Fe, Bi, O and Cr. The wt % and at% of the compositionare displayed in the insets of Figure 3a’–d’. The compositions of the compounds were inaccordance with the doping.
Materials 2022, 15, x FOR PEER REVIEW 5 of 20
Figure 1. (a) XRD patterns of the undoped BiFeO3 showing the peak positions and * represent the secondary phase of Bi25FeO39. (b,c) JCPDS card numbers indicating peaks for BiFeO3 and Bi25FeO39, respectively. (d–g) The Rietveld refinement of the theoretically calculated patterns (red) superim-posing the experimental data (black) for BiFe1−xCrxO3 (0 ≤ x ≤ 10) nanoparticles. The difference be-tween the two is indicated by the blue line at the bottom; the Bragg positions for BiFeO3 phase are indicated by the pink vertical lines; the Bragg positions for the secondary phase (Bi25FeO39) are indi-cated by the vertical green lines.
The structural parameters as functions of the Cr concentration are represented in Fig-ure 2a–e. The value of lattice parameters (a/c) for undoped BiFeO3, obtained from Rietveld refinement, was 5.5780/13.8631 Å, corresponding to a unit cell volume of 374.8 Å3 [28]. These values of lattice parameters are in agreement with the literature [29,30]. Both the lattice parameters (“a” and “c”) were found to decrease along with the unit cell volume as Cr concentration increased, as displayed in Figure 2a–c. Likewise, the crystallite sizes calculated using Scherrer’s formula were also found to decrease with increasing Cr con-centration from 45.0 nm (BiFeO3) to 34.0 nm (BiFe0.90Cr0.10O3), as can be seen in Figure 2d. Similar results have been reported by Layek et al.: they found that the minimum crystallite size was 39 nm for BiFe0.90Cr0.10O3 [31]. The strain calculated using Wilson’s formula [32] was found to increase with increasing Cr concentration (Figure 2e). A possible reason is that the ionic radius of Cr3+ is smaller than that of Fe3+ (0.645 Å), due to which the substi-tution of Cr3+ (0.615 Å) in place of Fe may reduce the crystallite size and lattice parameter. Owing to this, reductions in the structural parameters have been found to increase with the increase in the Cr content in the samples. Further, these reductions in the structural parameters may be the possible cause of the strain developed in the lattice.
Figure 1. (a) XRD patterns of the undoped BiFeO3 showing the peak positions and * representthe secondary phase of Bi25FeO39. (b,c) JCPDS card numbers indicating peaks for BiFeO3 andBi25FeO39, respectively. (d–g) The Rietveld refinement of the theoretically calculated patterns (red)superimposing the experimental data (black) for BiFe1−xCrxO3 (0 ≤ x ≤ 10) nanoparticles. Thedifference between the two is indicated by the blue line at the bottom; the Bragg positions for BiFeO3phase are indicated by the pink vertical lines; the Bragg positions for the secondary phase (Bi25FeO39)are indicated by the vertical green lines.
Table 1. Density of the compound and phase fraction obtained after Rietveld refinement.
Samples Rp Rwp Rexp χ2 Density of theCompound (g/cm3)
Phase Fraction (%)R 3 c/I 2 3
BiFeO3 6.55 8.81 5.48 2.54 7.862 83.15/16.85BiFe0.99Cr0.01O3 6.74 8.70 5.46 2.54 7.857 84.96/15.04BiFe0.95Cr0.05O3 6.96 8.80 5.29 2.77 7.733 92.72/7.28BiFe0.90Cr0.10O3 6.56 8.55 5.37 2.54 7.684 94.99/ 5.01
Materials 2022, 15, 4118 6 of 19Materials 2022, 15, x FOR PEER REVIEW 6 of 20
Figure 2. (a–e) Variations of lattice parameters (a/c), unit cell volume, crystallite size and strain as functions of Cr concentration.
3.2. Morphological Analysis The morphological and compositional analysis were performed through the investi-
gation of high-resolution field emission scanning microscopy and energy-dispersive X-ray spectroscopy, respectively. The HR-FESEM micrographs of BiFe1−xCrxO3 (0 ≤ x ≤ 10) nanoparticles are displayed in Figure 3a–d. The micrographs demonstrate a broad distri-bution of morphologies. The size distribution histograms are represented in the insets of the respective figures. The average particle size was found to decrease with increasing Cr in the samples. The spectra of the samples are displayed in Figure 3a’–d’. The spectra dis-play the major contributions of Fe, Bi, O and Cr. The wt % and at% of the composition are displayed in the insets of Figure 3a’–d’. The compositions of the compounds were in ac-cordance with the doping.
Figure 2. (a–e) Variations of lattice parameters (a,c), unit cell volume, crystallite size and strain asfunctions of Cr concentration.
3.3. UV–Vis Spectroscopy
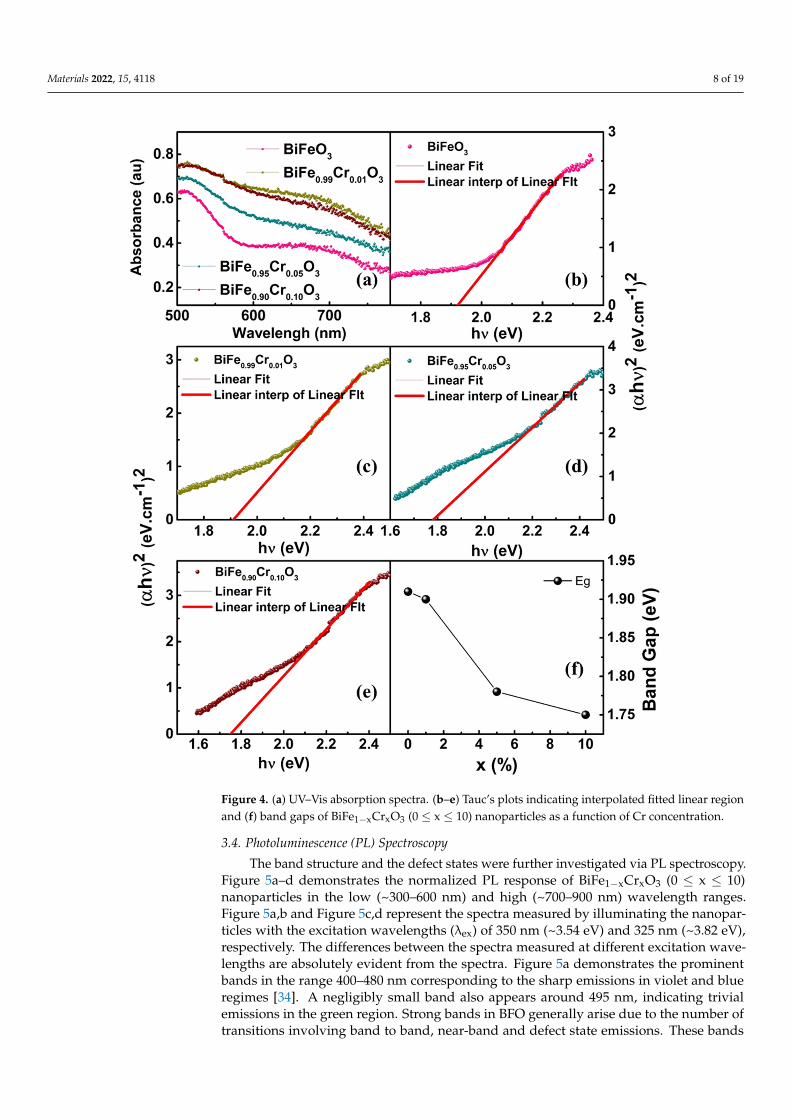
Figure 4a shows the UV–Vis absorption spectra of BiFe1−xCrxO3 (0 ≤ x ≤ 10) nanopar-ticles in the wavelength range 500–800 nm. The maximum absorption was observed at~510.0 nm and decreased afterward at higher wavelengths. The bands observed at max-imum absorption may have arisen due to the direct charge transfer excitation involvingd-d transitions between neighboring Fe3+ ions [33]. The values of the bandgap energieshave been calculated using the Tauc’s equation, (αhν)2 = B (hν − Eg), where α: absorptioncoefficient, h: Planck’s constant, hν: absorbed photon energy and B: the constant. TheTauc’s plots of the samples are presented in Figure 4b–e. The linear regions of the plots athigher frequencies were linearly fitted and extrapolated, and intersected at the x-axis atzero absorption. The point of intersection gives the value of the bandgap. The bandgapenergies were found to decrease with increasing Cr concentration. The value of band gapsvaried from 1.91 eV for undoped BFO to 1.74 eV for BiFe0.90Cr0.10O3 nanoparticles, asrepresented in Figure 4f. The highest value so obtained was 1.91 eV for undoped BFO.
Materials 2022, 15, 4118 7 of 19Materials 2022, 15, x FOR PEER REVIEW 7 of 20
Figure 3. (a–d) HR-FESEM micrographs of BiFe1−xCrxO3 (0 ≤ x ≤ 10) nanoparticles; insets show the histograms of particle size distribution. (a’–d’) EDS spectra of BiFe1−xCrxO3 (0 ≤ x ≤ 10) nanoparticles; insets show the wt % and at% of the respective compositions.
3.3. UV–Vis Spectroscopy Figure 4a shows the UV–Vis absorption spectra of BiFe1−xCrxO3 (0 ≤ x ≤ 10) nanopar-
ticles in the wavelength range 500–800 nm. The maximum absorption was observed at ~510.0 nm and decreased afterward at higher wavelengths. The bands observed at maxi-mum absorption may have arisen due to the direct charge transfer excitation involving d-d transitions between neighboring Fe3+ ions [33]. The values of the bandgap energies have
Figure 3. (a–d) HR-FESEM micrographs of BiFe1−xCrxO3 (0 ≤ x ≤ 10) nanoparticles; insets showthe histograms of particle size distribution. (a’–d’) EDS spectra of BiFe1−xCrxO3 (0 ≤ x ≤ 10)nanoparticles; insets show the wt % and at% of the respective compositions.
Materials 2022, 15, 4118 8 of 19
Materials 2022, 15, x FOR PEER REVIEW 8 of 20
been calculated using the Tauc’s equation, (αhν)2 = B (hν − Eg), where α: absorption coeffi-cient, h: Planck’s constant, hν: absorbed photon energy and B: the constant. The Tauc’s plots of the samples are presented in Figure 4b–e. The linear regions of the plots at higher frequencies were linearly fitted and extrapolated, and intersected at the x-axis at zero ab-sorption. The point of intersection gives the value of the bandgap. The bandgap energies were found to decrease with increasing Cr concentration. The value of band gaps varied from 1.91 eV for undoped BFO to 1.74 eV for BiFe0.90Cr0.10O3 nanoparticles, as represented in Figure 4f. The highest value so obtained was 1.91 eV for undoped BFO.
Figure 4. (a) UV–Vis absorption spectra. (b–e) Tauc’s plots indicating interpolated fitted linear re-gion and (f) band gaps of BiFe1−xCrxO3 (0 ≤ x ≤ 10) nanoparticles as a function of Cr concentration.
Figure 4. (a) UV–Vis absorption spectra. (b–e) Tauc’s plots indicating interpolated fitted linear regionand (f) band gaps of BiFe1−xCrxO3 (0 ≤ x ≤ 10) nanoparticles as a function of Cr concentration.
3.4. Photoluminescence (PL) Spectroscopy
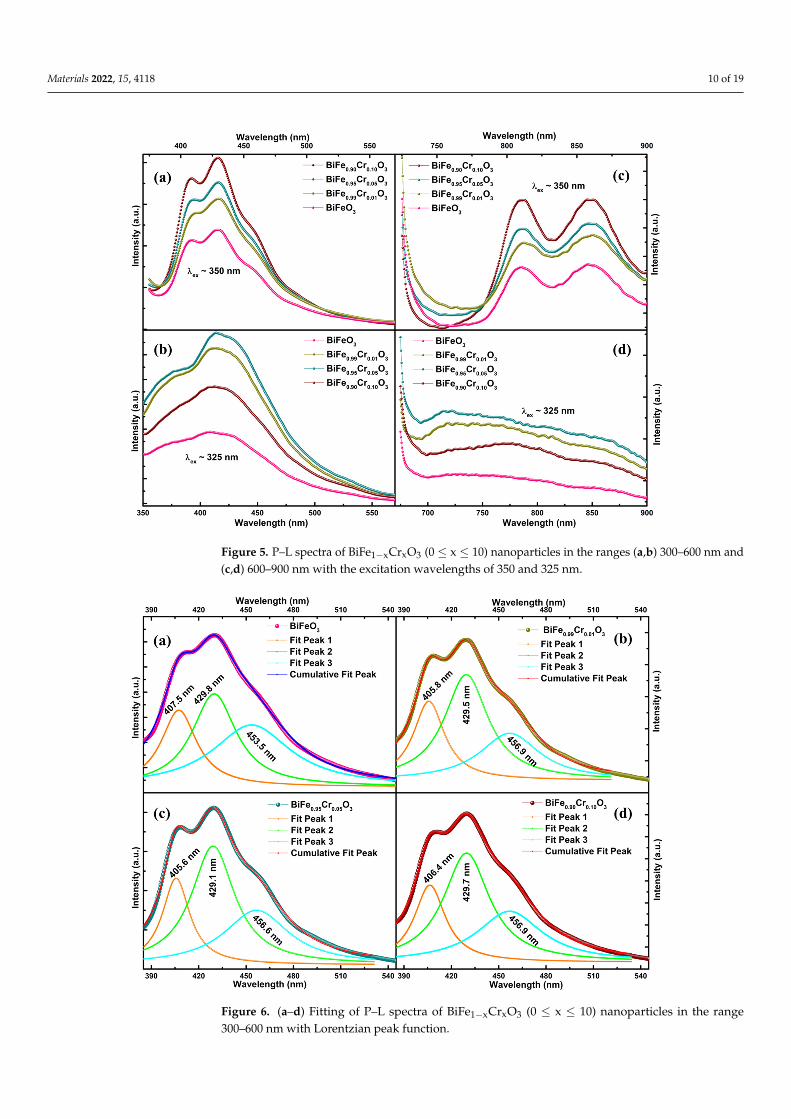
The band structure and the defect states were further investigated via PL spectroscopy.Figure 5a–d demonstrates the normalized PL response of BiFe1−xCrxO3 (0 ≤ x ≤ 10)nanoparticles in the low (~300–600 nm) and high (~700–900 nm) wavelength ranges.Figure 5a,b and Figure 5c,d represent the spectra measured by illuminating the nanopar-ticles with the excitation wavelengths (λex) of 350 nm (~3.54 eV) and 325 nm (~3.82 eV),respectively. The differences between the spectra measured at different excitation wave-lengths are absolutely evident from the spectra. Figure 5a demonstrates the prominentbands in the range 400–480 nm corresponding to the sharp emissions in violet and blueregimes [34]. A negligibly small band also appears around 495 nm, indicating trivialemissions in the green region. Strong bands in BFO generally arise due to the number oftransitions involving band to band, near-band and defect state emissions. These bands
Materials 2022, 15, 4118 9 of 19
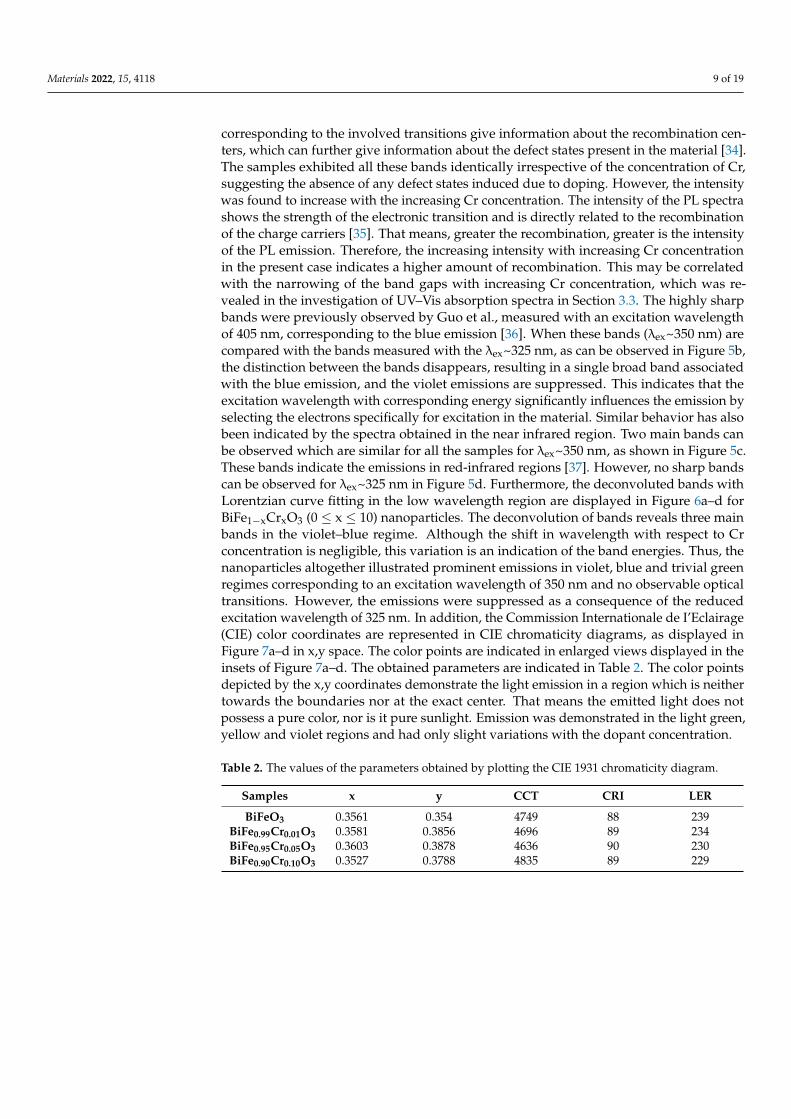
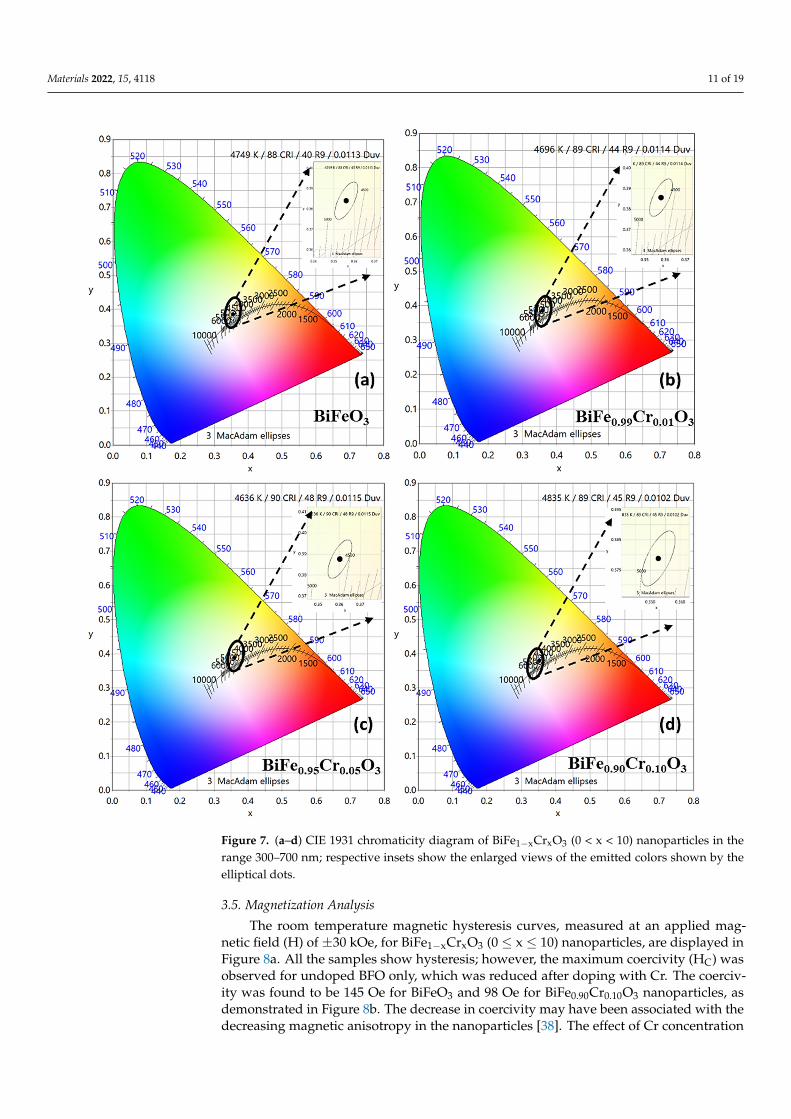
corresponding to the involved transitions give information about the recombination cen-ters, which can further give information about the defect states present in the material [34].The samples exhibited all these bands identically irrespective of the concentration of Cr,suggesting the absence of any defect states induced due to doping. However, the intensitywas found to increase with the increasing Cr concentration. The intensity of the PL spectrashows the strength of the electronic transition and is directly related to the recombinationof the charge carriers [35]. That means, greater the recombination, greater is the intensityof the PL emission. Therefore, the increasing intensity with increasing Cr concentrationin the present case indicates a higher amount of recombination. This may be correlatedwith the narrowing of the band gaps with increasing Cr concentration, which was re-vealed in the investigation of UV–Vis absorption spectra in Section 3.3. The highly sharpbands were previously observed by Guo et al., measured with an excitation wavelengthof 405 nm, corresponding to the blue emission [36]. When these bands (λex~350 nm) arecompared with the bands measured with the λex~325 nm, as can be observed in Figure 5b,the distinction between the bands disappears, resulting in a single broad band associatedwith the blue emission, and the violet emissions are suppressed. This indicates that theexcitation wavelength with corresponding energy significantly influences the emission byselecting the electrons specifically for excitation in the material. Similar behavior has alsobeen indicated by the spectra obtained in the near infrared region. Two main bands canbe observed which are similar for all the samples for λex~350 nm, as shown in Figure 5c.These bands indicate the emissions in red-infrared regions [37]. However, no sharp bandscan be observed for λex~325 nm in Figure 5d. Furthermore, the deconvoluted bands withLorentzian curve fitting in the low wavelength region are displayed in Figure 6a–d forBiFe1−xCrxO3 (0 ≤ x ≤ 10) nanoparticles. The deconvolution of bands reveals three mainbands in the violet–blue regime. Although the shift in wavelength with respect to Crconcentration is negligible, this variation is an indication of the band energies. Thus, thenanoparticles altogether illustrated prominent emissions in violet, blue and trivial greenregimes corresponding to an excitation wavelength of 350 nm and no observable opticaltransitions. However, the emissions were suppressed as a consequence of the reducedexcitation wavelength of 325 nm. In addition, the Commission Internationale de I’Eclairage(CIE) color coordinates are represented in CIE chromaticity diagrams, as displayed inFigure 7a–d in x,y space. The color points are indicated in enlarged views displayed in theinsets of Figure 7a–d. The obtained parameters are indicated in Table 2. The color pointsdepicted by the x,y coordinates demonstrate the light emission in a region which is neithertowards the boundaries nor at the exact center. That means the emitted light does notpossess a pure color, nor is it pure sunlight. Emission was demonstrated in the light green,yellow and violet regions and had only slight variations with the dopant concentration.
Table 2. The values of the parameters obtained by plotting the CIE 1931 chromaticity diagram.
Samples x y CCT CRI LER
BiFeO3 0.3561 0.354 4749 88 239BiFe0.99Cr0.01O3 0.3581 0.3856 4696 89 234BiFe0.95Cr0.05O3 0.3603 0.3878 4636 90 230BiFe0.90Cr0.10O3 0.3527 0.3788 4835 89 229
Materials 2022, 15, 4118 10 of 19
Materials 2022, 15, x FOR PEER REVIEW 10 of 20
Table 2. The values of the parameters obtained by plotting the CIE 1931 chromaticity diagram.
Samples x y CCT CRI LER BiFeO3 0.3561 0.354 4749 88 239
BiFe0.99Cr0.01O3 0.3581 0.3856 4696 89 234 BiFe0.95Cr0.05O3 0.3603 0.3878 4636 90 230 BiFe0.90Cr0.10O3 0.3527 0.3788 4835 89 229
Figure 5. P–L spectra of BiFe1−xCrxO3 (0 ≤ x ≤ 10) nanoparticles in the ranges (a,b) 300–600 nm and (c,d) 600–900 nm with the excitation wavelengths of 350 and 325 nm. Figure 5. P–L spectra of BiFe1−xCrxO3 (0 ≤ x ≤ 10) nanoparticles in the ranges (a,b) 300–600 nm and
(c,d) 600–900 nm with the excitation wavelengths of 350 and 325 nm.Materials 2022, 15, x FOR PEER REVIEW 11 of 20
Figure 6. (a–d) Fitting of P–L spectra of BiFe1−xCrxO3 (0 ≤ x ≤ 10) nanoparticles in the range 300–600 nm with Lorentzian peak function. Figure 6. (a–d) Fitting of P–L spectra of BiFe1−xCrxO3 (0 ≤ x ≤ 10) nanoparticles in the range
300–600 nm with Lorentzian peak function.
Materials 2022, 15, 4118 11 of 19Materials 2022, 15, x FOR PEER REVIEW 12 of 20
Figure 7. (a–d) CIE 1931 chromaticity diagram of BiFe1−xCrxO3 (0 < x < 10) nanoparticles in the range 300–700 nm; respective insets show the enlarged views of the emitted colors shown by the elliptical dots.
3.5. Magnetization Analysis The room temperature magnetic hysteresis curves, measured at an applied magnetic
field (H) of ±30 kOe, for BiFe1−xCrxO3 (0 ≤ x ≤ 10) nanoparticles, are displayed in Figure 8a. All the samples show hysteresis; however, the maximum coercivity (HC) was observed for undoped BFO only, which was reduced after doping with Cr. The coercivity was found to be 145 Oe for BiFeO3 and 98 Oe for BiFe0.90Cr0.10O3 nanoparticles, as demonstrated in Figure 8b. The decrease in coercivity may have been associated with the decreasing mag-netic anisotropy in the nanoparticles [38]. The effect of Cr concentration on the magneti-zation (M) is quite evident, showing the increase in magnetization with an increase in Cr
Figure 7. (a–d) CIE 1931 chromaticity diagram of BiFe1−xCrxO3 (0 < x < 10) nanoparticles in therange 300–700 nm; respective insets show the enlarged views of the emitted colors shown by theelliptical dots.
3.5. Magnetization Analysis
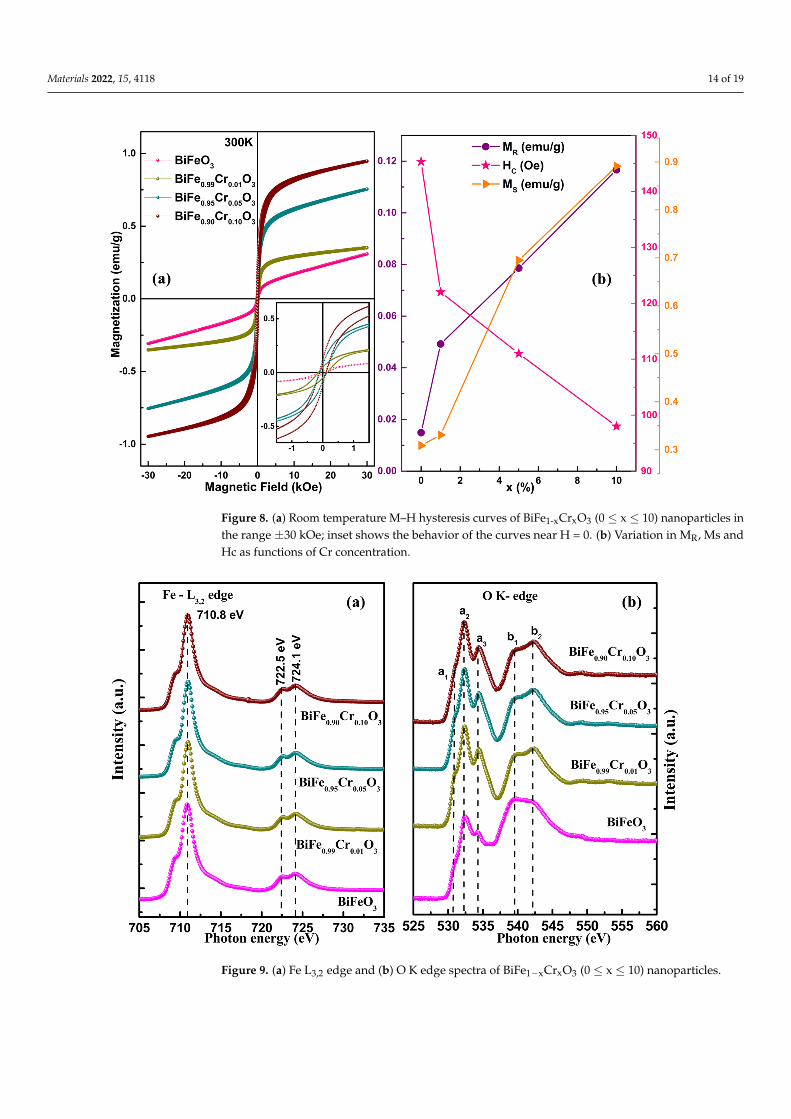
The room temperature magnetic hysteresis curves, measured at an applied mag-netic field (H) of ±30 kOe, for BiFe1−xCrxO3 (0 ≤ x ≤ 10) nanoparticles, are displayed inFigure 8a. All the samples show hysteresis; however, the maximum coercivity (HC) wasobserved for undoped BFO only, which was reduced after doping with Cr. The coerciv-ity was found to be 145 Oe for BiFeO3 and 98 Oe for BiFe0.90Cr0.10O3 nanoparticles, asdemonstrated in Figure 8b. The decrease in coercivity may have been associated with thedecreasing magnetic anisotropy in the nanoparticles [38]. The effect of Cr concentration
Materials 2022, 15, 4118 12 of 19
on the magnetization (M) is quite evident, showing the increase in magnetization withan increase in Cr concentration. Although all the samples exhibited room-temperatureferromagnetic behavior, as displayed by the inset of Figure 8a, saturation was not attainedat ±30 kOe. This may have been due to the G-Type antiferromagnetic nature originallyexhibited by BFO. The ferromagnetic behavior shown by undoped BFO may have been dueto its reduced crystallite dimensions resulting in the distortion of its crystalline structure.Sinha et al. have also reported that the reduction of crystalline dimensions below 62.0 nmbrings ferromagnetic character in the material; otherwise, BFO is antiferromagnetic [38].Therefore, to obtain saturation magnetization (MS), 1/M Vs H were plotted. The values ofMS are displayed in Figure 8b. Unlike HC, MS was found to increase from 0.31 emu/g forBiFeO3 to 0.98 emu/g for BiFe0.90Cr0.10O3 with increasing Cr concentration. Similarly, rem-nant magnetization (MR) was also found to increase with increasing Cr concentration from0.01 emu/g to 0.1 emu/g. These values of the magnetization parameters are comparablewith other reported values [39]. Kharel et al. have also reported the enhancement in themagnetic properties of Cr doped BiFeO3 [40]. The enhancement in the magnetization of thenanoparticles as a result of increasing Cr concentration may be associated with the strongmagnetic interactions caused by Fe3+–O–Cr3+ coupling. The substitution of Cr3+ ions inplace of Fe3+ ions leads to strong super-exchange interactions which significantly influencethe magnetic parameters by causing structural distortions [36,41]. Moreover, the enhance-ment in magnetization may also be associated with the secondary phase Bi25FeO39 [38].However, this should not be the reason in present case because of the reduction of sec-ondary phase fraction with increasing Cr concentration. Therefore, it can be concluded thatincreasing the doping concentration of Cr in BiFeO3 enhances the magnetic properties ofthe material due to the enhanced Fe3+–O–Cr3+ interactions.
3.6. Near Edge X-Ray Absorption Spectroscopy3.6.1. Fe L3,2 Edge
The Fe L3,2 edge spectra of BiFe1−xCrxO3 (0 ≤ x ≤ 10) nanoparticles is displayed inFigure 9a in the range 705–735 eV. The L-edge spectra arise as a result of the transitionsbetween Fe 2p and Fe 3d states. Since the spectra have resulted from the core electronictransitions among Fe 2p3/2 and Fe 2p1/2 states, they provide evidence of the unoccupiedstates of the probed element. The L-edge spectra were further split into L3 and L2 becausethe neighboring spin-up and spin-down states experience strong exchange interactions.The highest intensity peak (L3-edge) was observed at 710.8 eV with a small shoulder on theright side. The other peak (L2-edge) observed at higher energies shows peak splitting of~1.6 eV, indicating peaks at 722.5 and 724.1 eV. The small shoulder peak on the right side ofthe L3-edge and the splitting in the L2 edge may be associated with the crystal field effectscaused by the octahedral structural symmetry. No detectable shift in the edge positionswas obtained due to varying Cr concentration. This reveals that the ionic state remains thesame irrespective of the Cr concentration. By comparing these with the NEXAFS spectra of(Fe2+)O, (Fe3+)2O3 and (Fe+3/+4)3O4 [3], the Fe in the present samples was confirmed to bein the mixed-valence state.
3.6.2. O K Edge
The O K edge spectrum of BiFe1−xCrxO3 (0 ≤ x ≤ 10) nanoparticles is displayed inFigure 9b for the range 525–560 eV. The O K edge spectra involve a transition from O 2pcore states to higher-order states. The peaks observed at 530.5 eV (a1) and 532.3 eV (a2) maybe attributed to the hybridization between the O 2p and Fe 3d states, and the peak observedat 534.2 eV (a3) may be attributed to the hybridization between O 2p and Bi 6sp states. Theintensity of these peaks indicates the density of unoccupied highly states [42,43]. Anotherset of peaks (b1 and b2) with comparatively smaller intensities is present at higher energies.The origin of these peaks has been associated with the hybridization between O 2p and Fe4s and Fe 4p states. The intensities of b1 and b2 disclose the charge transfer phenomenaoccurring from O 2p to its ligand states [44–46].
Materials 2022, 15, 4118 13 of 19
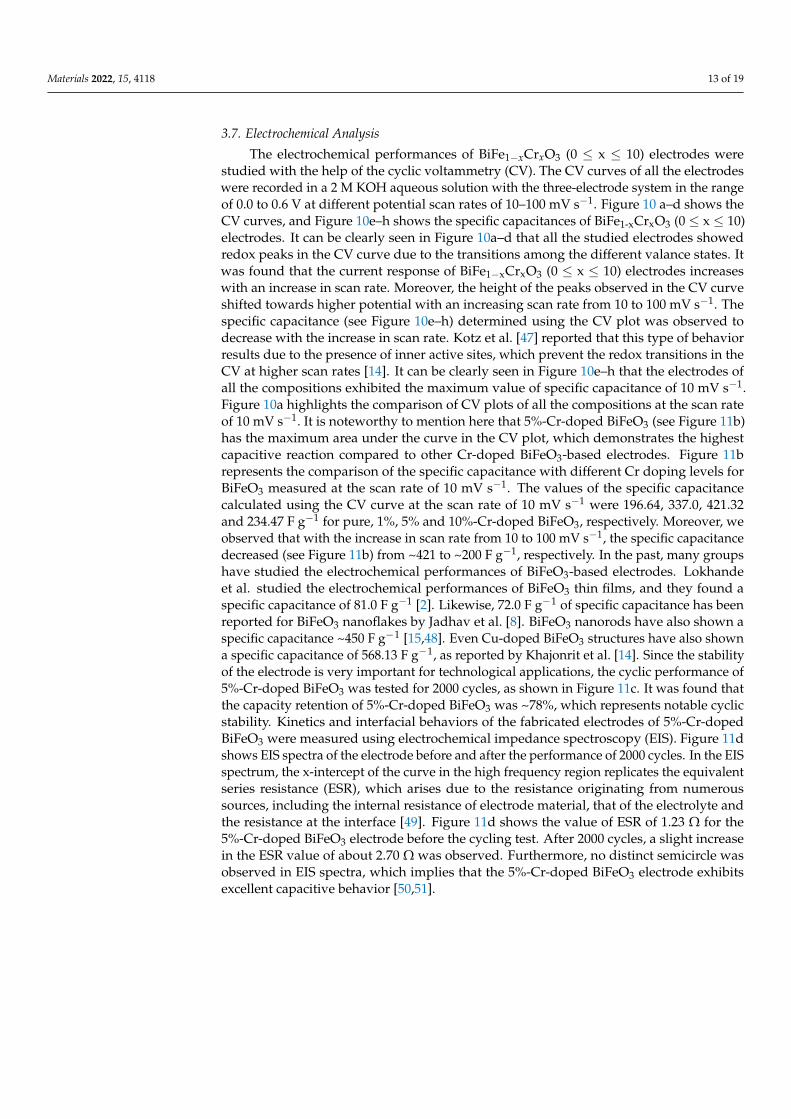
3.7. Electrochemical Analysis
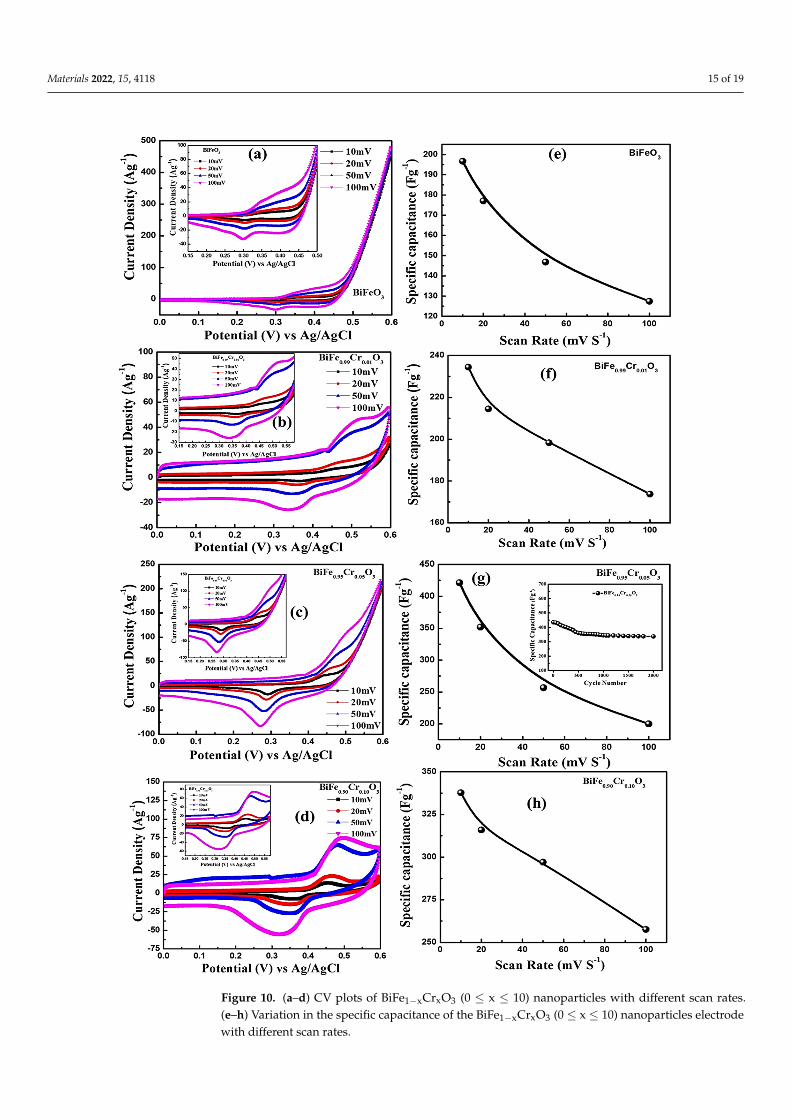
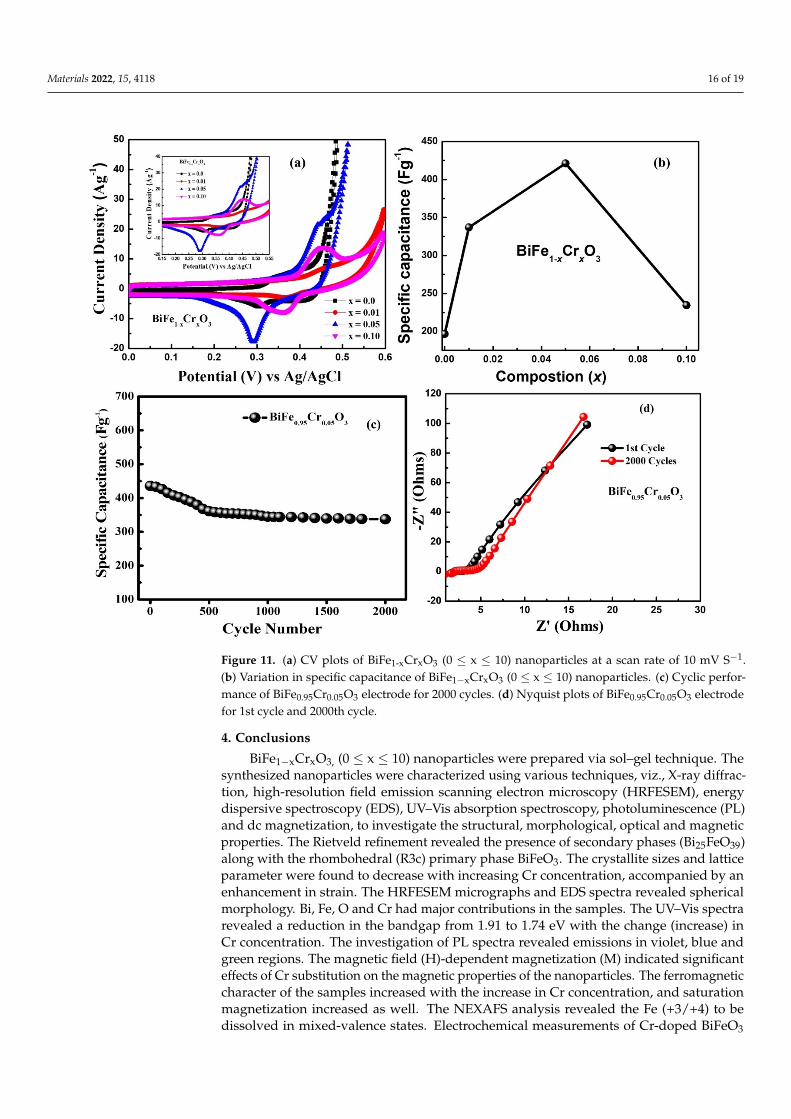
The electrochemical performances of BiFe1−xCrxO3 (0 ≤ x ≤ 10) electrodes werestudied with the help of the cyclic voltammetry (CV). The CV curves of all the electrodeswere recorded in a 2 M KOH aqueous solution with the three-electrode system in the rangeof 0.0 to 0.6 V at different potential scan rates of 10–100 mV s−1. Figure 10 a–d shows theCV curves, and Figure 10e–h shows the specific capacitances of BiFe1-xCrxO3 (0 ≤ x ≤ 10)electrodes. It can be clearly seen in Figure 10a–d that all the studied electrodes showedredox peaks in the CV curve due to the transitions among the different valance states. Itwas found that the current response of BiFe1−xCrxO3 (0 ≤ x ≤ 10) electrodes increaseswith an increase in scan rate. Moreover, the height of the peaks observed in the CV curveshifted towards higher potential with an increasing scan rate from 10 to 100 mV s−1. Thespecific capacitance (see Figure 10e–h) determined using the CV plot was observed todecrease with the increase in scan rate. Kotz et al. [47] reported that this type of behaviorresults due to the presence of inner active sites, which prevent the redox transitions in theCV at higher scan rates [14]. It can be clearly seen in Figure 10e–h that the electrodes ofall the compositions exhibited the maximum value of specific capacitance of 10 mV s−1.Figure 10a highlights the comparison of CV plots of all the compositions at the scan rateof 10 mV s−1. It is noteworthy to mention here that 5%-Cr-doped BiFeO3 (see Figure 11b)has the maximum area under the curve in the CV plot, which demonstrates the highestcapacitive reaction compared to other Cr-doped BiFeO3-based electrodes. Figure 11brepresents the comparison of the specific capacitance with different Cr doping levels forBiFeO3 measured at the scan rate of 10 mV s−1. The values of the specific capacitancecalculated using the CV curve at the scan rate of 10 mV s−1 were 196.64, 337.0, 421.32and 234.47 F g−1 for pure, 1%, 5% and 10%-Cr-doped BiFeO3, respectively. Moreover, weobserved that with the increase in scan rate from 10 to 100 mV s−1, the specific capacitancedecreased (see Figure 11b) from ~421 to ~200 F g−1, respectively. In the past, many groupshave studied the electrochemical performances of BiFeO3-based electrodes. Lokhandeet al. studied the electrochemical performances of BiFeO3 thin films, and they found aspecific capacitance of 81.0 F g−1 [2]. Likewise, 72.0 F g−1 of specific capacitance has beenreported for BiFeO3 nanoflakes by Jadhav et al. [8]. BiFeO3 nanorods have also shown aspecific capacitance ~450 F g−1 [15,48]. Even Cu-doped BiFeO3 structures have also showna specific capacitance of 568.13 F g−1, as reported by Khajonrit et al. [14]. Since the stabilityof the electrode is very important for technological applications, the cyclic performance of5%-Cr-doped BiFeO3 was tested for 2000 cycles, as shown in Figure 11c. It was found thatthe capacity retention of 5%-Cr-doped BiFeO3 was ~78%, which represents notable cyclicstability. Kinetics and interfacial behaviors of the fabricated electrodes of 5%-Cr-dopedBiFeO3 were measured using electrochemical impedance spectroscopy (EIS). Figure 11dshows EIS spectra of the electrode before and after the performance of 2000 cycles. In the EISspectrum, the x-intercept of the curve in the high frequency region replicates the equivalentseries resistance (ESR), which arises due to the resistance originating from numeroussources, including the internal resistance of electrode material, that of the electrolyte andthe resistance at the interface [49]. Figure 11d shows the value of ESR of 1.23 Ω for the5%-Cr-doped BiFeO3 electrode before the cycling test. After 2000 cycles, a slight increasein the ESR value of about 2.70 Ω was observed. Furthermore, no distinct semicircle wasobserved in EIS spectra, which implies that the 5%-Cr-doped BiFeO3 electrode exhibitsexcellent capacitive behavior [50,51].
Materials 2022, 15, 4118 14 of 19
Materials 2022, 15, x FOR PEER REVIEW 13 of 20
concentration. Although all the samples exhibited room-temperature ferromagnetic be-havior, as displayed by the inset of Figure 8a, saturation was not attained at +30 kOe. This may have been due to the G-Type antiferromagnetic nature originally exhibited by BFO. The ferromagnetic behavior shown by undoped BFO may have been due to its reduced crystallite dimensions resulting in the distortion of its crystalline structure. Sinha et al. have also reported that the reduction of crystalline dimensions below 62.0 nm brings fer-romagnetic character in the material; otherwise, BFO is antiferromagnetic [38]. Therefore, to obtain saturation magnetization (MS), 1/M Vs H were plotted. The values of MS are displayed in Figure 8b. Unlike HC, MS was found to increase from 0.31 emu/g for BiFeO3 to 0.98 emu/g for BiFe0.90Cr0.10O3 with increasing Cr concentration. Similarly, remnant magnetization (MR) was also found to increase with increasing Cr concentration from 0.01 emu/g to 0.1 emu/g. These values of the magnetization parameters are comparable with other reported values [39]. Kharel et al. have also reported the enhancement in the mag-netic properties of Cr doped BiFeO3 [40]. The enhancement in the magnetization of the nanoparticles as a result of increasing Cr concentration may be associated with the strong magnetic interactions caused by Fe3+–O–Cr3+ coupling. The substitution of Cr3+ ions in place of Fe3+ ions leads to strong super-exchange interactions which significantly influence the magnetic parameters by causing structural distortions [36,41]. Moreover, the enhance-ment in magnetization may also be associated with the secondary phase Bi25FeO39 [38]. However, this should not be the reason in present case because of the reduction of sec-ondary phase fraction with increasing Cr concentration. Therefore, it can be concluded that increasing the doping concentration of Cr in BiFeO3 enhances the magnetic properties of the material due to the enhanced Fe3+–O–Cr3+ interactions.
Figure 8. (a) Room temperature M–H hysteresis curves of BiFe1-xCrxO3 (0 ≤ x ≤ 10) nanoparticles in the range ±30 kOe; inset shows the behavior of the curves near H = 0. (b) Variation in MR, Ms and Hc as functions of Cr concentration.
Figure 8. (a) Room temperature M–H hysteresis curves of BiFe1-xCrxO3 (0 ≤ x ≤ 10) nanoparticles inthe range ±30 kOe; inset shows the behavior of the curves near H = 0. (b) Variation in MR, Ms andHc as functions of Cr concentration.
Materials 2022, 15, x FOR PEER REVIEW 14 of 20
3.6. Near Edge X-Ray Absorption Spectroscopy 3.6.1. Fe L3,2 Edge
The Fe L3,2 edge spectra of BiFe1−xCrxO3 (0 ≤ x ≤ 10) nanoparticles is displayed in Figure 9a in the range 705–735 eV. The L-edge spectra arise as a result of the transitions between Fe 2p and Fe 3d states. Since the spectra have resulted from the core electronic transitions among Fe 2p3/2 and Fe 2p1/2 states, they provide evidence of the unoccupied states of the probed element. The L-edge spectra were further split into L3 and L2 because the neigh-boring spin-up and spin-down states experience strong exchange interactions. The highest intensity peak (L3-edge) was observed at 710.8 eV with a small shoulder on the right side. The other peak (L2-edge) observed at higher energies shows peak splitting of ~1.6 eV, in-dicating peaks at 722.5 and 724.1 eV. The small shoulder peak on the right side of the L3-edge and the splitting in the L2 edge may be associated with the crystal field effects caused by the octahedral structural symmetry. No detectable shift in the edge positions was ob-tained due to varying Cr concentration. This reveals that the ionic state remains the same irrespective of the Cr concentration. By comparing these with the NEXAFS spectra of (Fe2+)O, (Fe3+)2O3 and (Fe+3/+4)3O4 [3], the Fe in the present samples was confirmed to be in the mixed-valence state.
Figure 9. (a) Fe L3,2 edge and (b) O K edge spectra of BiFe1−xCrxO3 (0 ≤ x ≤ 10) nanoparticles.
3.6.2. O K Edge The O K edge spectrum of BiFe1−xCrxO3 (0 ≤ x ≤ 10) nanoparticles is displayed in Fig-
ure 9b for the range 525–560 eV. The O K edge spectra involve a transition from O 2p core states to higher-order states. The peaks observed at 530.5 eV (a1) and 532.3 eV (a2) may be attributed to the hybridization between the O 2p and Fe 3d states, and the peak observed at 534.2 eV (a3) may be attributed to the hybridization between O 2p and Bi 6sp states. The intensity of these peaks indicates the density of unoccupied highly states [42,43]. Another set of peaks (b1 and b2) with comparatively smaller intensities is present at higher energies. The origin of these peaks has been associated with the hybridization between O 2p and Fe
Figure 9. (a) Fe L3,2 edge and (b) O K edge spectra of BiFe1−xCrxO3 (0 ≤ x ≤ 10) nanoparticles.
Materials 2022, 15, 4118 15 of 19Materials 2022, 15, x FOR PEER REVIEW 16 of 20
Figure 10. (a–d) CV plots of BiFe1−xCrxO3 (0 ≤ x ≤ 10) nanoparticles with different scan rates. (e–h) Variation in the specific capacitance of the BiFe1−xCrxO3 (0 ≤ x ≤ 10) nanoparticles electrode with different scan rates.
Figure 10. (a–d) CV plots of BiFe1−xCrxO3 (0 ≤ x ≤ 10) nanoparticles with different scan rates.(e–h) Variation in the specific capacitance of the BiFe1−xCrxO3 (0 ≤ x ≤ 10) nanoparticles electrodewith different scan rates.
Materials 2022, 15, 4118 16 of 19Materials 2022, 15, x FOR PEER REVIEW 17 of 20
Figure 11. (a) CV plots of BiFe1-xCrxO3 (0 ≤ x ≤ 10) nanoparticles at a scan rate of 10 mV S−1. (b) Variation in specific capacitance of BiFe1−xCrxO3 (0 ≤ x ≤ 10) nanoparticles. (c) Cyclic performance of BiFe0.95Cr0.05O3 electrode for 2000 cycles. (d) Nyquist plots of BiFe0.95Cr0.05O3 electrode for 1st cycle and 2000th cycle.
4. Conclusions BiFe1−xCrxO3, (0 ≤ x ≤ 10) nanoparticles were prepared via sol–gel technique. The syn-
thesized nanoparticles were characterized using various techniques, viz., X-ray diffrac-tion, high-resolution field emission scanning electron microscopy (HRFESEM), energy dispersive spectroscopy (EDS), UV–Vis absorption spectroscopy, photoluminescence (PL) and dc magnetization, to investigate the structural, morphological, optical and magnetic properties. The Rietveld refinement revealed the presence of secondary phases (Bi25FeO39) along with the rhombohedral (R3c) primary phase BiFeO3. The crystallite sizes and lattice parameter were found to decrease with increasing Cr concentration, accompanied by an enhancement in strain. The HRFESEM micrographs and EDS spectra revealed spherical morphology. Bi, Fe, O and Cr had major contributions in the samples. The UV–Vis spectra revealed a reduction in the bandgap from 1.91 to 1.74 eV with the change (increase) in Cr concentration. The investigation of PL spectra revealed emissions in violet, blue and green regions. The magnetic field (H)-dependent magnetization (M) indicated significant effects of Cr substitution on the magnetic properties of the nanoparticles. The ferromagnetic char-acter of the samples increased with the increase in Cr concentration, and saturation mag-netization increased as well. The NEXAFS analysis revealed the Fe (+3/+4) to be dissolved in mixed-valence states. Electrochemical measurements of Cr-doped BiFeO3 nanoparticles
Figure 11. (a) CV plots of BiFe1-xCrxO3 (0 ≤ x ≤ 10) nanoparticles at a scan rate of 10 mV S−1.(b) Variation in specific capacitance of BiFe1−xCrxO3 (0 ≤ x ≤ 10) nanoparticles. (c) Cyclic perfor-mance of BiFe0.95Cr0.05O3 electrode for 2000 cycles. (d) Nyquist plots of BiFe0.95Cr0.05O3 electrodefor 1st cycle and 2000th cycle.
4. Conclusions
BiFe1−xCrxO3, (0 ≤ x ≤ 10) nanoparticles were prepared via sol–gel technique. Thesynthesized nanoparticles were characterized using various techniques, viz., X-ray diffrac-tion, high-resolution field emission scanning electron microscopy (HRFESEM), energydispersive spectroscopy (EDS), UV–Vis absorption spectroscopy, photoluminescence (PL)and dc magnetization, to investigate the structural, morphological, optical and magneticproperties. The Rietveld refinement revealed the presence of secondary phases (Bi25FeO39)along with the rhombohedral (R3c) primary phase BiFeO3. The crystallite sizes and latticeparameter were found to decrease with increasing Cr concentration, accompanied by anenhancement in strain. The HRFESEM micrographs and EDS spectra revealed sphericalmorphology. Bi, Fe, O and Cr had major contributions in the samples. The UV–Vis spectrarevealed a reduction in the bandgap from 1.91 to 1.74 eV with the change (increase) inCr concentration. The investigation of PL spectra revealed emissions in violet, blue andgreen regions. The magnetic field (H)-dependent magnetization (M) indicated significanteffects of Cr substitution on the magnetic properties of the nanoparticles. The ferromagneticcharacter of the samples increased with the increase in Cr concentration, and saturationmagnetization increased as well. The NEXAFS analysis revealed the Fe (+3/+4) to bedissolved in mixed-valence states. Electrochemical measurements of Cr-doped BiFeO3
Materials 2022, 15, 4118 17 of 19
nanoparticles imply that 5%-Cr-doped BFO showed the highest value of specific capaci-tance: 421 F g−1, measured with a scan rate of 10 mV s−1. It also demonstrated notablecyclic stability through capacitance retention of >78% for 2000 cycles.
Author Contributions: Conceptualization, S.K., K.K. and F.A.; data curation, K.K., N.M.S. and S.D.;formal analysis, S.K., R.K., S.D. and K.K., funding acquisition, S.K. and A.A.; resources, S.K., K.H.C.,P.A.A. and M.A.; visualization, S.K. and N.A. (Naushad Ahmad), N.A. (Nishat Arshi), R.K.; writing—original draft, S.K. and K.K.; writing—review and editing, F.A. and N.M.S. All authors have read andagreed to the published version of the manuscript.
Funding: This research was funded by King Faisal University, Saudi Arabia, Project No. AN000117.
Institutional Review Board Statement: Not applicable.
Informed Consent Statement: Not applicable.
Data Availability Statement: Not applicable.
Acknowledgments: This work was supported through the Annual Funding track by the Deanshipof Scientific Research, Vice Presidency for Graduate Studies and Scientific Research, King FaisalUniversity, Saudi Arabia (project number AN000116).
Conflicts of Interest: The authors declare no conflict of interest.
References1. Haromae, H.; Pattananuwat, P. Preparation of bismuth ferrite as photo-supercapacitive electrode. IOP Conf. Ser. Mater. Sci. Eng.
2019, 600, 012005. [CrossRef]2. Lokhande, C.; Gujar, T.; Shinde, V.; Mane, R.; Han, S.-H. Electrochemical supercapacitor application of pervoskite thin films.
Electrochem. Commun. 2007, 9, 1805–1809. [CrossRef]3. Kumar, S.; Srivastava, G.; Almutairi, G.; Ahmed, F.; Shaalan, N.M.; Dalela, S.; Kumar, R.; Kumar, A.P.; Alvi, P.; Chae, K.; et al.
Electronic structure and electrochemical properties of La-doped BiFeO3 nanoparticles. J. Electron. Spectrosc. Relat. Phenom. 2021,253, 147138. [CrossRef]
4. Kumar, V.; Soam, A.; Sahoo, P.K.; Panda, H.S. Enhancement of electrochemical properties of carbon solution doped bismuthferrite for supercapacitor application. Mater. Today Proc. 2020, 41, 165–171. [CrossRef]
5. Zhong, C.; Deng, Y.; Hu, W.; Qiao, J.; Zhang, L.; Zhang, J. A review of electrolyte materials and compositions for electrochemicalsupercapacitors. Chem. Soc. Rev. 2015, 44, 7484–7539. [CrossRef] [PubMed]
6. Devi, N.; Ray, S.S. Performance of bismuth-based materials for supercapacitor applications: A review. Mater. Today Commun. 2020,25, 101691. [CrossRef]
7. Shao, Y.; El-Kady, M.F.; Wang, L.J.; Zhang, Q.; Li, Y.; Wang, H.; Mousavi, M.F.; Kaner, R.B. Graphene-based materials for flexiblesupercapacitors. Chem. Soc. Rev. 2015, 44, 3639–3665. [CrossRef]
8. Jadhav, V.V.; Zate, M.K.; Liu, S.; Naushad, M.; Mane, R.S.; Hui, K.N.; Han, S.-H. Mixed-phase bismuth ferrite nanoflake electrodesfor supercapacitor application. Appl. Nanosci. 2015, 6, 511–519. [CrossRef]
9. Durai, L.; Moorthy, B.; Thomas, C.I.; Kim, D.K.; Bharathi, K.K. Electrochemical properties of BiFeO 3 nanoparticles: Anodematerial for sodium-ion battery application. Mater. Sci. Semicond. Process. 2017, 68, 165–171. [CrossRef]
10. Shameem, A.; Devendran, P.; Siva, V.; Murugan, A.; Sasikumar, S.; Nallamuthu, N.; Hussain, S.; Bahadur, S.A. Robust one-stepsynthesis of bismuth molybdate nanocomposites: A promising negative electrode for high end ultracapacitors. Solid State Sci.2020, 106, 106303. [CrossRef]
11. Ma, C.-J.; Chen, Y.; Zhu, C.; Chen, Q.; Song, W.-L.; Jiao, S.; Chen, H.-S.; Fang, D. Bismuth ferrite: An abnormal perovskite withelectrochemical extraction of ions from A site. J. Mater. Chem. A 2019, 7, 12176–12190. [CrossRef]
12. Moitra, D.; Anand, C.; Ghosh, B.K.; Chandel, M.; Ghosh, N.N. One-Dimensional BiFeO3 Nanowire-Reduced Graphene OxideNanocomposite as Excellent Supercapacitor Electrode Material. ACS Appl. Energy Mater. 2018, 1, 464–474. [CrossRef]
13. Yuan, P. Electrode behaviors of BiFeO3 powders: A possible application of Bi2O3 oxide in rechargeable battery. Int. J. Electrochem.Sci. 2017, 12, 3686–3696. [CrossRef]
14. Khajonrit, J.; Phumying, S.; Maensiri, S. Structure and magnetic/electrochemical properties of Cu-doped BiFeO3 nanoparticlesprepared by a simple solution method. Jpn. J. Appl. Phys. 2016, 55, 06GJ14. [CrossRef]
15. Rana, S.; Dutta, N.; Bandyopadhyay, S.K.; Sen, P.; Himanshu, A.K. High capacitance in BiFeO3 nanorod structure. AIP Conf. Proc.2014, 1591, 254–255. [CrossRef]
16. Rajeevan, N.E.; Pradyumnan, P.P.; Kumar, R.; Shukla, D.K.; Kumar, S.; Singh, A.K.; Patnaik, S.; Arora, S.K.; Shvets, I.V.Magnetoelectric properties of BixCo2−xMnO4 (0 ≤ x ≤ 0.3). Appl. Phys. Lett. 2008, 92, 102910. [CrossRef]
17. Wu, J.; Fan, Z.; Xiao, D.; Zhu, J.; Wang, J. Multiferroic bismuth ferrite-based materials for multifunctional applications: Ceramicbulks, thin films and nanostructures. Prog. Mater. Sci. 2016, 84, 335–402. [CrossRef]
Materials 2022, 15, 4118 18 of 19
18. Guennou, M.; Viret, M.; Kreisel, J. Bismuth-based perovskites as multiferroics. Comptes Rendus. Phys. 2015, 16, 182–192. [CrossRef]19. Zhang, S.T.; Lu, M.H.; Wu, D.; Chen, Y.F.; Ming, N.B. Larger polarization and weak ferromagnetism in quenched BiFeO3 ceramics
with a distorted rhombohedral crystal structure. Appl. Phys. Lett. 2005, 87, 262907. [CrossRef]20. Kumari, A.; Kumari, K.; Ahmed, F.; Alshoaibi, A.; Alvi, P.A.; Dalela, S.; Ahmad, M.M.; Aljawfi, R.N.; Dua, P.; Vij, A.; et al.
Influence of Sm doping on structural, ferroelectric, electrical, optical and magnetic properties of BaTiO3. Vacuum 2021, 184, 109872.[CrossRef]
21. Kumari, A.; Kumari, K.; Ahmed, F.; Ahmad, M.M.; Sharma, J.; Vij, A.; Kumar, S. Role of Bi-excess on structural, electrical, optical,and magnetic properties BiFeO3 nanoparticles. J. Mater. Sci. Mater. Electron. 2021, 32, 23968–23982. [CrossRef]
22. Kumari, A.; Kumari, K.; Aljawfi, R.N.; Alvi, P.A.; Dalela, S.; Ahmad, M.M.; Chawla, A.K.; Kumar, R.; Vij, A.; Kumar, S. Role of Lasubstitution on structural, optical, and multiferroic properties of BiFeO3 nanoparticles. Appl. Nanosci. 2021, 1–20. [CrossRef]
23. Yang, C.-H.; Koo, T.; Jeong, Y. How to obtain magnetocapacitance effects at room temperature: The case of Mn-doped BiFeO3.Solid State Commun. 2005, 134, 299–301. [CrossRef]
24. Xue, J.; Zhang, H.; Han, J.; Ling, Y. Thermal, magnetic and photoelectrical behaviors of sillenite Bi25FeO39 microcrystals. Ceram.Int. 2020, 47, 9941–9947. [CrossRef]
25. Lopes, A.M.L.; Araújo, J.P.; Ferdov, S. Room temperature synthesis of Bi25FeO39 and hydrothermal kinetic relations betweensillenite- and distorted perovskite-type bismuth ferrites. Dalton Trans. 2014, 43, 18010–18016. [CrossRef]
26. Casas-Cabanas, M.; Reynaud, M.; Rikarte, J.; Horbach, P.; Rodríguez-Carvajal, J. FAULTS: A program for refinement of structureswith extended defects. J. Appl. Crystallogr. 2016, 49, 2259–2269. [CrossRef]
27. Kumar, A.; Varshney, D. Crystal structure refinement of Bi1−xNdxFeO3 multiferroic by the Rietveld method. Ceram. Int. 2012, 38,3935–3942. [CrossRef]
28. Muneeswaran, M.; Jegatheesan, P.; Giridharan, N.V. Synthesis of nanosized BiFeO3 powders by co-precipitation method. J. Exp.Nanosci. 2013, 8, 341–346. [CrossRef]
29. Arafat, S.S. Structural and magnetic properties of BiFe1−xCrxO3 synthesized samples. Chin. Phys. B 2014, 23, 066101. [CrossRef]30. Luo, B.-C.; Chen, C.-L.; Xu, Z.; Xie, Q. Effect of Cr substitution on the multiferroic properties of BiFe1−xCrxO3 compounds. Phys.
Lett. A 2010, 374, 4265–4268. [CrossRef]31. Layek, S.; Saha, S.; Verma, H.C. Preparation, structural and magnetic studies on BiFe1-xCrxO3(x = 0.0, 0.05 and 0.1) multiferroic
nanoparticles. AIP Adv. 2013, 3, 032140. [CrossRef]32. Kumari, K.; Vij, A.; Chae, K.H.; Hashim, M.; Aljawfi, R.N.; Alvi, P.A.; Kumar, S. Near-edge X-ray absorption fine structure
spectroscopy and structural properties of Ni-doped CeO2 nanoparticles. Radiat. Eff. Defects Solids 2017, 172, 985–994. [CrossRef]33. Ramachandran, B.; Rao, M.S.R. Low temperature magnetocaloric effect in polycrystalline BiFeO3 ceramics. Appl. Phys. Lett. 2009,
95, 142505. [CrossRef]34. Pandey, D.K.; Modi, A.; Pandey, P.; Gaur, N.K. Variable excitation wavelength photoluminescence response and optical absorption
in BiFeO3 nanostructures. J. Mater. Sci. Mater. Electron. 2017, 28, 17245–17253. [CrossRef]35. Cebela, M.; Zagorac, D.; Batalovic, K.; Radakovic, J.; Stojadinovic, B.; Spasojevic, V.; Hercigonja, R. BiFeO3 perovskites: A
multidisciplinary approach to multiferroics. Ceram. Int. 2017, 43, 1256–1264. [CrossRef]36. Guo, B.; Deng, H.; Zhai, X.; Zhou, W.; Meng, X.; Weng, G.; Chen, S.; Yang, P.; Chu, J. Cr doping-induced structural phase
transition, optical tuning and magnetic enhancement in BiFeO3 thin films. Mater. Lett. 2016, 186, 198–201. [CrossRef]37. Rhaman, M.; Matin, M.; Hakim, M.; Islam, M. Bandgap tuning of samarium and cobalt co-doped bismuth ferrite nanoparticles.
Mater. Sci. Eng. B 2020, 263, 114842. [CrossRef]38. Sinha, A.K.; Bhushan, B.; Sharma, R.K.; Sen, S.; Mandal, B.P.; Meena, S.S.; Bhatt, P.; Prajapat, C.L.; Priyam, A.; Mishra, S.K.; et al.
Enhanced dielectric, magnetic and optical properties of Cr-doped BiFeO3 multiferroic nanoparticles synthesized by sol-gel route.Results Phys. 2019, 13, 102299. [CrossRef]
39. Yousaf, M.; Lu, Y.; Hu, E.; Wang, B.; Akhtar, M.N.; Noor, A.; Akbar, M.; Shah, M.Y.; Wang, F.; Zhu, B. Tunable magneto-opticaland interfacial defects of Nd and Cr-doped bismuth ferrite nanoparticles for microwave absorber applications. J. Colloid InterfaceSci. 2021, 608, 1868–1881. [CrossRef]
40. Kharel, P.; Talebi, S.; Ramachandran, B.; Dixit, A.; Naik, V.M.; Sahana, M.B.; Sudakar, C.; Naik, R.; Rao, M.S.R.; Lawes, G.Structural, magnetic, and electrical studies on polycrystalline transition-metal-doped BiFeO3 thin films. J. Phys. Condens. Matter2008, 21, 036001. [CrossRef]
41. Hashim, M.; Kumar, S.; Koo, B.H.; Shirsath, S.E.; Mohammed, E.M.; Shah, J.; Kotnala, R.K.; Choi, H.K.; Chung, H.; Kumar, R.Structural, electrical and magnetic properties of Co–Cu ferrite nanoparticles. J. Alloys Compd. 2011, 518, 11–18. [CrossRef]
42. Kumar, S.; Park, J.; Kim, D.; Lee, M.; Song, T.K.; Gautam, S.; Chae, K.; Kim, S.; Kim, M.-H. Electronic structure and magneticproperties of Co doped TiO2 thin films using X-ray absorption spectroscopy. Ceram. Int. 2015, 41, S370–S375. [CrossRef]
43. Kumar, S.; Vats, P.; Gautam, S.; Gupta, V.; Verma, K.; Chae, K.; Hashim, M.; Choi, H. Electronic structure, magnetic and structuralproperties of Ni doped ZnO nanoparticles. Mater. Res. Bull. 2014, 59, 377–381. [CrossRef]
44. Kumar, S.; Gautam, S.; Song, T.; Chae, K.H.; Jang, K.; Kim, S. Electronic structure study of Co doped CeO2 nanoparticles usingX-ray absorption fine structure spectroscopy. J. Alloys Compd. 2014, 611, 329–334. [CrossRef]
45. Sharma, A.; Singh, J.P.; Won, S.O.; Chae, K.H.; Sharma, S.K.; Kumar, S. Introduction to X-Ray Absorption Spectroscopy and ItsApplications in Material Science; Springer: Berlin/Heidelberg, Germany, 2018; pp. 497–548. [CrossRef]

Materials 2022, 15, 4118 19 of 19
46. Hashim, M.; Alimuddin; Kumar, S.; Shirsath, S.; Kotnala, R.; Shah, J.; Kumar, R. Influence of Cr3+ ion on the structural, acconductivity and magnetic properties of nanocrystalline Ni–Mg ferrite. Ceram. Int. 2013, 39, 1807–1819. [CrossRef]
47. Kötz, R.; Carlen, M. Principles and applications of electrochemical capacitors. Electrochim. Acta 2000, 45, 2483–2498. [CrossRef]48. Dutta, N.; Bandyopadhyay, S.K.; Rana, S.; Sen, P.; Himanshu, A.K. Remarkably high value of Capacitance in BiFeO3 Nanorod.
arXiv 2013, arXiv:1309.5690. [CrossRef]49. Zhang, J.; Kong, L.-B.; Cai, J.-J.; Luo, Y.-C.; Kang, L. Nanoflake-like cobalt hydroxide/ordered mesoporous carbon composite for
electrochemical capacitors. J. Solid State Electrochem. 2010, 14, 2065–2075. [CrossRef]50. Niu, H.; Zhou, D.; Yang, X.; Li, X.; Wang, Q.; Qu, F.Y. Towards three-dimensional hierarchical ZnO nano-fiber@Ni(OH)2nanoflake
core–shell heterostructures for high performance asymmetric supercapacitors. J. Mater. Chem. A 2015, 3, 18413–18421. [CrossRef]51. Ahmed, F.; Almutairi, G.; AlOtaibi, B.; Kumar, S.; Arshi, N.; Hussain, S.G.; Umar, A.; Ahmad, N.; Aljaafari, A. Binder-Free
Electrode Based on ZnO Nanorods Directly Grown on Aluminum Substrate for High Performance Supercapacitors. Nanomaterials2020, 10, 1979. [CrossRef]
Recommended


