
1
Scoping note on subnational competitiveness in Georgia
July 24, 2020
World Bank Group1
1 The note was prepared by Austin Kilroy (Senior Economist) and Ceylan Oymak (Consultant), under the guidance of Marialisa
Motta and Ilias Skamnelos (Practice Managers), Sebastian Molineus (Country Director), and Evgenij Najdov (Program Leader).
The team is grateful for inputs and advice from Mariam Dolidze (Senior Economist), Tengiz Gogotishvili (Senior Urban Specialist),
Gabriel Goddard (Lead Economist), Dmitry Sivaev (Urban Specialist), Ifeyinwa Onugha (Private Sector Specialist), Nadeem
Karmali (Senior Economist), Conor Kearney (Regional Economic Development Consultant), the Tbilisi-based team of the United
Nations Development Programme, and most of all to the National Statistics Office of Georgia – Geostat for graciously sharing data
for the analysis. None of the detailed analysis in this document could have been done without the excellent firm-level data collected
by Geostat each year.
Pub
lic D
iscl
osur
e A
utho
rized
Pub
lic D
iscl
osur
e A
utho
rized
Pub
lic D
iscl
osur
e A
utho
rized
Pub
lic D
iscl
osur
e A
utho
rized

2
Executive Summary
The objective of this scoping note is to inform decisions between the World Bank Group and the
Government of Georgia on engagements related to subnational growth and economic development.
The note is intended to be an initial review of the policy landscape and economic situation, using readily
available information and data. It provides information to determine if the topic of subnational
competitiveness could be pursued further within the partnership between the World Bank Group and the
Government of Georgia.
The note consists of three sections:
1. Review of the policy environment related to subnational competitiveness;
2. Benchmarking and recommendations for subnational competitiveness;
3. Estimating the impact of Covid-19 at subnational level.
1. Policy environment
• Georgia’s subnational competitiveness agenda is established by the Regional Development
Programme (RDP) 2018-2021. The RDP 2018-2021 aims to address competitiveness of Georgia’s
regions, leading to increased equality of economic outcomes in regions. It outlines five key
priorities for action: infrastructure; economy; human resources; endogenous development (local
initiatives and specializations); and institutional development. The RDP 2018-2021 is a relatively
comprehensive document and includes proposals for economic specialization of each of Georgia’s
regions.
• In preparation for the next RDP, a few key questions can illuminate issues to explore further.
Are the proposed economic specializations realistic? Will they be sufficient to guide investment
choices? Will the investments be effective in achieving their goals? A second set of questions
relates to the emphasis of the RDP on the regional scale (mkhare) for analysis and action. Georgia’s
subnational economy, like those in other countries, is driven by urban hubs. Does the RDP leverage
these growth drivers in its approach? The analysis in the subsequent section of the document aims
to provide information and ideas that can inform preparation of RDP 2022-2025, and/or substantiate
a discussion between the World Bank Group and Government of Georgia on subnational
competitiveness issues more broadly.
2. Benchmarking and recommendations for subnational competitiveness
• The Government’s emphasis on addressing inequalities between Tbilisi and other regions in
Georgia seems well-founded. Regional inequality of GDP per capita is substantially higher in
Georgia than in comparator countries such as Armenia, Turkey, Poland, or Hungary. Tbilisi
accounts for 32 percent of Georgia’s population, but 67 percent its gross value added, and 81 percent
of its foreign investment. The structure of economic activity is dramatically polarized: in Tbilisi,
70 percent of the population are formally employed, but outside Tbilisi only around 30 percent of
the population have formal jobs. The severity of the disparity means that regions outside Tbilisi
even lack enterprises that can generate economic growth. Large firms have been the strongest
drivers of economic growth in Georgia, and these large firms are concentrated in Tbilisi and a few
other cities.
• The regional economic specializations proposed by the RDP could be more selective, more
specific, and should be appraised before investment decisions are made. The RDP proposes
that some sectors (tourism, agro-processing, and renewable energy) have an economic potential in
most or all Georgia’s regions, yet economic data shows that agro-processing is mostly concentrated
in four regions. Wine-making, higher education and innovation, and mining and renewable energy

3
are concentrated in fewer regions than indicated in the RDP. Meanwhile light manufacturing is not
mentioned at all despite being successful in several regions. Overall, a more selective set of
specializations may be more realistic. The competitiveness requirements for each of these sectors
will need to be defined in more detail, and then appraised, before investment decisions can be taken.
Numerous industry studies and value chain studies have been carried out in Georgia, so the results
of those studies could be consolidated and leveraged.
• Georgia does have secondary nodes of economic activity outside Tbilisi—particularly at the
municipal level. These secondary cities can be leveraged in regional development efforts.
Examining the spatial distribution of sectors within regions can help focus public investments in
nodes of competitiveness. According to data from Georgia’s firm-level survey, agro-processing is
concentrated in Georgia’s cities, while 38 out of 64 municipalities have negligible or zero activity
in agro-processing. Agriculture is concentrated in some municipalities, with substantial variation
even between rural municipalities. High-value subsectors are concentrated in Tbilisi and a few other
municipalities: meat and dairy processing is focused in Tbilisi; high value manufacturing is found
mainly in Tbilisi, Rustavi, and Zestafoni. This analysis of high-value subsectors is useful to indicate
locations where each industry is most advanced and competitive. Such geographic concentrations
have increased over time. Existing nodes of activity in each sector have grown further, while other
municipalities have shrunk. New investment has focused on municipalities that are existing nodes
of economic activity (see Figure 1).
Figure 1: Sales (above) and investments (below) in high-value subsectors are concentrated in a few municipalities
Source: World Bank analysis of Geostat survey data
• The next RDP could be sharpened by focusing on nodes of growth within and across regions.
Georgia’s constraints on competitiveness and growth are likely to vary by sector, region, and
municipality. The current RDP focuses on economic specializations for each region, which may

4
have a strong basis in the political economy in Georgia, and resonates with the way Georgians
consider the geography of their country. However, this regional lens misses crucial elements of
economic development, particularly the concentration of economic activities in municipalities
within each region. The next RDP could focus on Georgia’s urban centres with populations above
40,0002, and the functional economic areas around them. Existing nodes of economic activity would
be the natural locations for specific investments to release those constraints, balancing the objectives
of economic growth and spatial equity. This approach would reach 80-90 percent of Georgia’s
population.
3. Estimating the impact of Covid-19 at subnational level
• The impact of a Covid-19 downturn will differ across Georgia, and therefore may require a
subnational lens on economic support measures. We estimated the likely effect on each
municipality, based on the mix of sectors in each municipality’s economy, and an estimate of the
impact of the pandemic per sector. Overall the economic shock induced by the pandemic will likely
impact most severely the smaller municipalities, because they have a higher share of sectors more
heavily affected by the downturn—especially tourism and transportation. Municipalities in Adjara,
Kakheti, plus Samtredia and Guria, are estimated to be affected most. The analysis is summarized
in Figure 2.
Figure 2: Estimated impact of Covid-19 at the municipality level
Source: World Bank analysis of Geostat survey data
Next steps
On the basis of these observations, some recommendations can be made for next steps on subnational
competitiveness work. These recommendations are:
I. Combine sectoral and regional studies to assist in prioritizing subnational investments and
interventions. Consolidate and leverage the industry and value chain studies for ‘economic
2 Tbilisi, Batumi, Kutaisi, Rustavi, Gori, Zugdidi, and Poti.

5
potential’ sectors to identify a more specific, targeted and appraised set of proposed regional
investments. For example, a lack of cold storage and packing facilities in fruit producing regions;
a need for training in emergency response in tourism regions; managerial capabilities in firms in
municipalities with concentrations of light manufacturing firms. Some constraints may affect many
regions—such as access to banks and finance, which may be a constraint in most municipalities
outside Tbilisi and some other cities. The approach should nuance the understanding of subnational
competitiveness by focusing on nodes of economic activity in municipalities within each region.
II. Assign specific responsibilities amongst government bodies to release constraints on
subnational competitiveness. In the next RDP, the constraints identified in the first step of analysis
could be mapped, and responsibilities for key investments and actions would be allocated to the
various levels of government (national, regional, and municipal). A roadmap would be created with
clearly defined targets and timelines for those investments and actions. The various ministries and
agencies would need to be accountable for achieving the milestones in the roadmap, and so the set
of actions must be specific and realistic.
III. Financing for subnational competitiveness. Develop a subnational competitiveness fund to
finance interventions to support competitiveness at the municipal and regional level. The fund
would balance the objectives of dispersing regional development outside Tbilisi while concentrating
it in nodes with the best chance of success. The fund could be institutionalized as a window within
the Municipal Development Fund (which until now has focused mainly local infrastructure), or
alternatively could be established separately by the Ministry of Economy. Funds could be applied
for by regions or municipalities through competition. Access to the funds would be conditional on
minimum access criteria (e.g. municipal and regional objectives that are approved by the national
government as being in line with the RDP; acceptable financial management processes; etc), and
perhaps can incorporate performance management through financial bonuses for achieving agreed
targets. The implementation structure for the fund could build on lessons from the Pilot Integrated
Regional Development Programmes (PIRDPs) in Georgia, by retaining the managing authority and
the structure of calls for proposals, and adding a performance framework at regional and municipal
levels.

6
Contents
Executive Summary ...................................................................................................................................... 2
1. Review of Georgia’s subnational competitiveness policy environment ............................................ 7
1.1. Government aims for subnational economic development ............................................................ 7
1.2. Actions, reforms and investments in support of the spatial priorities ............................................ 7
1.3. Notable features of the RDP approach ........................................................................................... 9
a. Are the proposed economic specializations realistic, sufficient, and effective? ............................ 9
b. Are regions the best scale for analysis and action? ...................................................................... 11
2. Benchmarking and recommendations for subnational competitiveness ........................................ 14
2.1. Does Georgia have an unusually severe problem in regional development? ............................... 14
2.2. Where are the best opportunities for subnational growth? ........................................................... 18
a. Where are Georgia’s tradable sectors currently concentrated in the regions?.............................. 18
b. How is regional concentration changing over time? .................................................................... 22
c. What interventions will be important for these subsectors? ......................................................... 31
3. Estimating the impact of Covid-19 at the subnational level ............................................................ 33
Next steps: Industry-level Diagnostics and Policy Levers ....................................................................... 35
4. Technical Appendix ............................................................................................................................ 37
4.1. Firm-level analysis of economic activity at the municipal level .................................................. 37
a. Firm-level survey data .................................................................................................................. 37
b. Limitations ................................................................................................................................... 37
c. Sector-based analysis ................................................................................................................... 39
d. Measuring economic activity ....................................................................................................... 40
e. High-value subsectors .................................................................................................................. 42
4.2. Coefficient of variation of regional inequality ............................................................................. 44
4.3. Disruption of economy activity during Covid-19 ........................................................................ 44

7
1. Review of Georgia’s subnational competitiveness policy environment
The purpose of this section is to summarize the main strategic priorities and actions undertaken at national
and subnational level. Key questions are:
• What are the Government’s declared aims for subnational economic development?
• What actions, reforms and investments are being undertaken?
• What opportunities may exist to improve these regional development initiatives?
1.1. Government aims for subnational economic development
The key strategic document for regional development in Georgia is the Regional Development
Programme (RDP) 2018-2021. The RDP 2018-2021 follows the RDP 2015-2017 and the State Strategy
for Regional Development 2010-2017. The RDP takes inspiration from “European Union recent approaches
to social-economic cohesion policy, including territorial integrated interventions and focus on the
exploitation of territorially differentiated potentials.”
The RDP outlines three key needs to be addressed:
1. Increased competitiveness of Georgian economy, through addressing socio-economic
characteristics of individual regions;
2. Increased equality of outcomes in regions (employment, poverty, focus on agriculture outside
Tbilisi [this is presented as a bad thing], depopulation, aging, access to basic services, healthcare).
3. A legal basis for regional development policy, including enhanced financial powers and institutional
capacity for local authorities.
These needs respond to a diagnosis of regional development problems in Georgia, especially:
• High emigration rate. Georgia lost more than 30 percent of its population in the last 25 years, with
outlying regions such as Racha-Lechkumi and Kvemo-Svaneti especially affected.
• High inequalities. For example: wages outside Tbilisi are 40-60% lower than wages in Tbilisi.
• Access to basic public services. For example: in some regions only 34% of households have a piped
water supply.
• Lack of equality of opportunity. For example: vocational education and training institutions are very
scarce in Kvemo Kartli and Samtskhe-Javakheti regions.
A total budget of GEL 18 billion is assigned to the RDP 2018-2021. The budget is drawn from the state
budget, donor funding, and cofinancing by beneficiaries of RDP support.
1.2. Actions, reforms and investments in support of the spatial priorities
The RDP 2018-2021 outlines five key priorities for action:
1. Infrastructure: transport, environmental, energy;
2. Economy: support to entrepreneurs; increased access to finance for innovative firms; improved
connections in the innovation system; increased exports of higher value-added products through
applying a smart specialization approach; support to development of tourism and agri-food;
increased investments including FDI.
3. Human resources: education reforms; social infrastructure; VET; higher education; R&D
institutions; labor market reforms to reduce skills mismatch; active labor market programs.
4. ‘Endogenous development’: involvement of citizens in improving living conditions at level of
municipalities; small scale infrastructure; diversification of local economies; increased availability
of public services in high mountainous areas; development of Black Sea ports for logistics
development; connection of Tbilisi with neighboring municipalities.

8
5. Institutional development: capacities of national and local authorities to support implementation of
RDP; strengthened analytic capacity of ministries including GEOSTAT’s capabilities for trends
analyses and regional data; a partnership principle in the policy cycle; and preparation of pilot
integrated regional development programmes co-financed by the EU.
There is a strong continuity between RDP 2018-2021 and RDP 2015-2017. The strategic diagnostic and
analysis in RDP 2018-2021 is substantially stronger, more detailed and sophisticated than the RDP 2015-
2017. Yet the proposed priorities are very similar: the first three priorities are almost the same as advocated
in RDP 2015-2017; the priorities of rural development and tourism in the RDP 2015-2017 have been
subsumed in the first three priorities in RDP 2018-2021; and the fourth and fifth priorities in RDP 2018-
2021 are new.
The RDP proposes economic ‘potentials’ for all regions in Georgia. These are summarized in Table 1:
the green cells indicate regions and sectors proposed by the RDP as economic potentials. The rationale for
these proposed specializations is not always clear: were they chosen according to actual historical
performance, or according to potential opportunities, or a combination of both? Some combination seems
likely: existing nodes of economic activity, plus expectations for tourism or agriculture in the weaker regions.
Table 1: Summary of regional ‘potentials’ proposed in RDP 2018-2021
Source: World Bank team summary of material in RDP 2018-2021, pages 60-63.
Each of the five priorities are defined with detailed Measures, and single main responsibilities are
assigned to line Ministries. The RDP is intended to be implemented by a network of relevant Ministries,
agencies, and other stakeholders. These include the following:
• Government Commission on Regional Development (GCRD), which coordinates activities between
ministries, discusses and endorses all strategic documents for RDP programming and
implementation, and facilitates thematic coordination with development partners.
• Ministry of Regional Development and Infrastructure (MRDI), which coordinates implementation,
liaises with line ministries on implementing program measures, reports on progress to the GCRD,
RDP Monitoring Committee, rest of the Government, and general public.
• Technical Coordination Unit, which acts as an inter-ministerial and interagency working group;
• Coordination Unit for donor programs
• Intermediate Bodies
• Local self-government bodies
• State Audit Office
• Other stakeholders, such as the National Council of Mountain Development, the Interagency
Coordination Council on Rural Development of Georgia, and the Georgian Regional Development
and Local Self-government Reform Commission.
Tbilisi Adjara Guria Imereti KakhetiMtskheta-
MtianetiRacha
Samegrel
o
Samtskh
e-
Javakheti
Kvemo
Kartli
Shida
Kartli
Agro-processing
Wine-making
Tourism
Mining
& renewable energy
Logistics
Higher education
& innovation

9
Main responsibilities are assigned to line Ministries. For example: support to enterprises is assigned to the
Ministry of Economy and Sustainable Development; integration of vulnerable groups is assigned to the
Ministry of Internally Displaced Persons; functional integration of Georgian urban territories is assigned to
the Ministry of Economy and Sustainable Development3.
Four pilot regions have been chosen for pilot integrated regional development programmes (PIRDPs).
The pilot regions are: Samtske-Javakheti, Imereti, Samegrelo-Zemo Svaneti, and Kakheti. Action in these
regions will be boosted by a total budget of EUR 67.2 million, including budget support from the EU of
EUR 40.5m4. The rationale for the PIRDPs is:
“the best way to build capacity of the administration and achieving tangible development results is the
preparation and realisation of pilot integrated regional development programmes. Such pilot programme (-s)
co-financed and managed at first stage directly by the European Commission, should be developed in line with
regional development strategy (-ies) and involve a broad range of national, regional and local stakeholders
allowing for mutual exchange and cooperation with use of Multi- Level Governance approach.”5
The PIRDP initiatives will prioritize:
(i) Urban renewal;
(ii) Unique tourism potential;
(iii) Improved competitiveness and support to innovations of SMEs;
(iv) Integrated local development;
(v) Technical support and capacity building of central and local administrations.
The implementation mechanisms for the PIRDPs are similar to those of operational programmes of
European Structural and Investment Funds in European Union member states. Calls for proposals are
issued; then project proposals are made by private sector, municipalities, civil society organizations, and
other stakeholders; proposals are evaluated; grants are contracted to recipients; and final compliance checks
are done by a technical coordination unit of the MRDI acting as a ‘Managing Authority’.
1.3. Notable features of the RDP approach
The RDP 2018-2021 is a comprehensive document and reflects many elements of good practice. It is
based on diagnostic analysis of the current situation and potential opportunities. Its framework for economic
development is based on specialization in selected economic sectors and niches, supported by interventions
to catalyze those opportunities. The scope of interventions covers a full range of constraints to growth.
These are good practices in designing regional development interventions. Box 1 outlines some of the World
Bank Group’s experience with subnational economic development which can help inform policies and
interventions in this area.
This section of the document will focus on two key features of the RDP which underpin its proposals
for subnational competitiveness: (a) prioritization of economic sectors; and (b) the emphasis on
regions. Each of these features is examined in turn. These issues are examined to provide ideas for a revised
approach to Georgia’s RDP, which could be implemented as part of a subsequent RDP (e.g. for years 2022-
2025).
a. Are the proposed economic specializations realistic, sufficient, and effective?
The RDP 2018-2021 proposes economic specializations for each region of the country. As summarized
by Table 1, above:
3 Regional Development Programme (RDP) of Georgia 2018-2021, Ministry of Regional Development and Infrastructure of
Georgia, p. 130. 4 ‘Regional Development Policy in Georgia’, presentation made by Deputy Minister of the Ministry of Regional Development and
Infrastructure, at European Week of Regions and Cities, Brussels, 7-10 October 2019. 5 RDP 2018-2021, p. 59.

10
• All regions are indicated as having
potential in tourism and in mining or
renewable energy;
• Almost all regions are indicated as having
potential in agro-processing and in
logistics;
• Very few regions are prioritized for higher
education or wine-making;
• None of the regions are listed with
potential for manufacturing.
For a policymaker, there are three critical
questions: Are these proposed specializations
realistic; Are they sufficient to guide investment
choices; and Will they be effective in achieving
their intended goals?
(i) Are the specializations realistic? The
proposed regional specializations will
need to be more selective. Georgia is
unlikely to have sufficient resources to
invest in tourism development, renewable
energy, and agro-processing equally in all
regions; nor is it realistic that all regions
would have equivalent potential in these
sectors. There might also be some doubt
that no region has potential in
manufacturing, despite the presence, for
example, of light manufacturing of
apparel in Batumi, Tbilisi and Kutaisi11.
Arguably the only truly strategic
proposals are to focus resources for higher
education and wine-making on three
regions which have special potential. A
similar regional selectivity should be
made in the other proposed sectors.
(ii) Are the specializations sufficient to
guide investment choices? A further
analysis of constraints on each
economic sector will be required. The
RDP 2018-2021 advocates a wide range
of interventions, such as infrastructure,
workforce skills, and access to finance—
but Ministries and agencies will need to
determine investment plans for specific
interventions, including what kind of
infrastructure/skills/finance will be
invested in. For instance: should agro-
processing infrastructure focus on
irrigation infrastructure, post-harvest
infrastructure of warehouses and cold
storage, transport and logistics
infrastructure, or all of the above, or
Box 1: Views on regional economic development
The World Bank Group has accumulated institutional
knowledge on subnational economic development through
analytic work and operations.
Main insights on ‘good practice’ include:
- World Development Report 2009: ‘Reshaping
Economic Geography’6. This flagship report reviewed
the evidence that urbanization is a crucial part of
building the economic efficiencies that are part of
economic growth and development. It proposed a
policy framework of 3 I’s: countries should primarily
focus on universal provision of basic ‘Institutions’
(education, healthcare, water, sanitation, and similar
essentials). Once those are established, leading regions
will have emerged, and ‘Infrastructure’ can be planned
to link lagging to leading areas. ‘Interventions’ such as
special regional development initiatives should be
considered only as a last resort, since they tend to be
risky to get right, and are inefficient. This paradigm has
informed the preparation of Urbanization Reviews7 in
many countries including Georgia, to benchmark each
country’s urban evolution against those three I’s, and to
recommend priority actions. The Georgia Urbanization
Review 8 recommended improvements in land
management systems, increased local government
capacity, and a ‘systems of cities’ approach to leverage
the economic specializations of Georgia’s major cities.
- Competitive Cities for Jobs and Growth9 provides a
knowledge base on competitiveness interventions at the
city and subnational levels. The report reviews the
experience of secondary cities around the world which
have outperformed their national economies. It
proposes four pillars for interventions to facilitate
increased productivity and competitiveness in city
economies: Institutions & Regulation; Infrastructure &
Land; Skills & Innovation; and Enterprise Support &
Finance. The report also highlights the crucial role of
public-private dialogue and creating a local growth
coalition; and in establishing an efficient
implementation structure to get action on the ground.
- A report on lagging regions across the European
Union10. Across Europe, inequalities between countries
are declining, but inequalities within countries are
growing. The report recommends focusing on equality
of opportunity and maximizing potential of each region.
Five policy priorities are: (i) addressing macro
weaknesses that hinder regional potential; (ii)
improving the regional business environment; (iii)
leveraging the productive potential of cities; (iv)
investing in workforce skills; and (b) strengthening local
governments and institutions.
- Analytic and operational work on lagging regions in
Europe, working closely with the European
Commission DG REGIO (the Directorate General for
Regional and Urban Policy). Projects have included: the
‘Catch-Up Regions’ projects in Poland and Slovakia;
the Danube Delta Integrated Territorial Investment (ITI)
in Romania; innovation programs at the subnational
level in Romania; and ‘Growth and Jobs in Eastern
Croatia’.

11
something else? Those choices should be informed by an analysis of each proposed economic sector
proposed to have a regional ‘potential’ (see Table 1, above), so that the interventions are configured
to release binding constraints on growth and development. For example, some regions may have
potential in citrus and tea, while others have potential in herbs, honey, or nuts. Different crops may
have different investment needs. These choices will be needed quickly, since the timespan of the
RDP is only three years, and there is insufficient time to invest in the full list of interventions
envisaged in the document12. Much of this analysis may be derived from the industry studies and
value chain studies already carried out by the Government and various other organizations in
Georgia. The results of those studies could be consolidated and leveraged by the implementers of
the RDP 2018-2021 to guide investment choices.
(iii) Will the investments be effective in achieving their goals? An appraisal of main proposed
investments will be necessary to ensure they are cost-effective and mitigate risks to meet their
goals. The RDP includes a diagnostic of the main dimensions of economic development—including
infrastructure, businesses, innovation, skills, and social services—but does not include an appraisal
of the feasibility for growth in each of the identified industries. For example, the RDP includes a
proposal for economic growth based on the logistics sector, but does not explain how logistics drives
growth. Presumably demand for logistics is derived from demand for consumer and industry goods,
so the logistics industry will grow only if other industries are growing. Additionally: would value
be derived from logistics services, or would goods simply transit Georgia on their way to larger
markets? And would logistics companies shipping freight find it more efficient to route through
Georgia or the South Caucasus compared to other routes? Appraisals would also examine if the
proposed interventions are the most optimal amongst alternatives. For example: to increase
productivity and competitiveness of firms in multiple sectors, a key constraint is often a lack of
managerial skills in private firms. Based on surveys in multiple countries, it seems that management
practices explain around 30 percent of the cross-country gap in total factor productivity—and as
much as 40 percent or more in countries such as Poland, Sweden, or Italy13. But managerial skills
are not mentioned in the RDP. Overall, these analyses—a clear theory of change, and an appraisal
of the proposed interventions—will be crucial to ensure that interventions achieve their intended
goals.
b. Are regions the best scale for analysis and action?
The RDP focuses on regions as the main unit of analysis and action. The choice of a regional scale
(rather than municipal or other spatial scale) is not explained clearly in the RDP, but may be connected with
the political economy of national-local government relations. Georgia’s 12 regions each have a regional
administration headed by a State commissioner, appointed by the Government of Georgia. By contrast, its
64 municipalities are controlled by Sakrebulo councils that are elected by local communities, and the five
largest cities have directly-elected Meri (mayors). This structure implies a political economy in which the
central Government will usually have a stronger link to regional administrations, which it appoints. The
6 World Bank (2008), World Development Report 2009: Reshaping Economic Geography, Washington DC: World Bank. 7 World Bank (2013), Planning, Connecting, and Financing Cities—Now: What city leaders need to know, Washington DC: World
Bank. 8 World Bank (2014), Georgia Urbanization Review: towards an urban sector strategy, report 86240 rev. 9 World Bank (2015), Competitive Cities for Jobs and Growth: What, Who, and How, Washington DC: World Bank. 10 Farole, Goga & Ionescu-Heroiu (2018), Rethinking Lagging Regions: using cohesion policy to deliver on the potential of
Europe’s regions, Washington DC: World Bank. http://pubdocs.worldbank.org/en/739811525697535701/RLR-FULL-online-2018-
05-01.pdf 11 The RDP mentions in its diagnostic section that industry and manufacturing are the most important economic activity sectors for
Kvemo-Kartli, Shida Kartli and Mtskheta-Mitaneti regions (constituting 25-31 percent of the gross value added), but does not list
manufacturing as having economic potential in any of the regions. 12 Some of these analyses may already be available in the strategies of line Ministries and other key documents. For example, the
agricultural specializations of each region in Georgia are summarized by crop and agricultural product in the Ministry of Regional
Development and Infrastructure’s regional development strategies for 2014-2021 produced in 2013—excerpted in World Bank
(2016), pp. 77-78. 13 Bloom, Sadun & Van Reenen (2017), ‘Management as a Technology?’, National Bureau of Economic Research Working Paper
22327, https://www.nber.org/papers/w22327

12
focus on regional boundaries will also naturally resonate with Georgians, who consider their regions almost
akin to small states with different traditions, culture, food, and mentality.
However, regions are not usually the most coherent scale for economic development. On one hand, the
European Union has channeled a substantial proportion of its regional development funds through the lens
of NUTS-2 regions14, especially for economic development through smart specialization. Yet cities are the
main nodes of economic growth: they are the natural scale for economic interactions. Agglomeration
economies play a substantial role in economic development—through ‘sharing, learning, and matching’ of
infrastructure, knowledge, and labor pools—to the extent that no country in the world has attained middle-
income status without moving to an urbanization level of around 45 percent or higher15. In other words:
cities, more than regions, are how economies function in practice. Accordingly the European Union is
presently transitioning towards strategies and interventions at the NUTS-3 level (the geographic scale below
regions). The 2021-2027 budget for European Union regional development funds emphasizes integrated
territorial interventions (ITIs) which can be focused on NUTS-3 administrative units. In Georgia, the choice
of regions as the scale for interventions will depend on how closely aligned they are with Georgia’s urban
and economic geography.
Georgia’s regions do include urban hubs, but overall the regional geographic boundaries do not align
with the urban network. Georgia is divided into 12 administrative and statistical regions, of substantially
differing sizes. The largest region (not counting Tbilisi) has 17 times as many inhabitants as smallest region.
All regions except Tbilisi and Adjara are predominantly rural, but there are nodal cities within each region.
The RDP recognizes there does exist a mismatch of administrative boundaries with economic activity: it
states that “in geographic terms, some socio-economic problems and potentials tend to cluster not necessarily
following the logic of administrative (or planning regions)…Black Sea Coastal Area, Tbilisi Functional Area
(Tbilisi, Mtskheta-Mtianeti, Kvemo Kartli), and high mountainous region” (page 11). However, the RDP
focuses on administrative regions, without a spatial lens within each region and across regions. If economic
activity is concentrated in nodes within each region, and often agglomerates across regional boundaries, how
could the RDP 2018-2021 framework be further nuanced to reflect this de facto economic geography?
In a revised approach during RDP 2022-2025, regions could take some actions, but with a spatial focus
on cities within each region plus a view across regional boundaries. In a city-focused framework, cities
would be prioritized as nodes for economic development, together with their economic hinterlands. Regions
would accept that economic activities are concentrated in cities, and therefore would plan strategic
interventions to leverage the potential of cities. The concentration of economic activities within each region
would need to be understood, to ensure that investments are not fragmented and disbursed thinly across the
whole area, but instead concentrated in the places where economic potential is highest.
The economic payoffs to the region will be driven by functional economic areas. Georgia has seven
urban centers with populations above 40,000: Tbilisi, Gori, Kutaisi, Batumi, Poti, Zugdidi-Anaklia, and
Rustavi. Telavi, Akhaltsikhe, Ozurgeti, Mtskheta, and perhaps Ambrolauri16 could be added, if each region
must have at least one designated urban center17. Each of these urban centers has a ‘functional economic
area’ around it: workers commute to jobs; farmers sell to urban markets; companies supply locally-traded
goods and services. A radius of 45-minute drive time could define the reach of each functional area, as a
typical upper bound for commuting and trading distance. When added together, this structure of urban
centers and functional economic areas covers 80-90 percent of Georgia’s population18. As shown in Figure
14 NUTS-2 is a statistical unit in the European Union, as an abbreviation of ‘Nomenclature of Territorial Units for Statistics’, level
2. Level 2 NUTS regions are typically provinces or other large regions within a country. The typical size for a NUTS-2 region is
two million inhabitants. 15 World Bank (2008), World Development Report 2009: Reshaping Economic Geography, Washington DC: World Bank, Figure 1. 16 The populations of these smaller municipalities are as follows: Telavi approximately 20,000; Akhalsikhe approximately 18,000;
Ozurgeti approximately 15,000; Mtskheta approximately 8,000; Ambrolauri approximately 2,500. 17 These 12 urban centers were earlier granted the status of ‘self-governing cities’ in Georgia’s Local Self-Government code,
approved by the Georgian parliament on February 5, 2014. Subsequently on June 30, 2017, the status of seven of these self-
governing cities was revoked, leaving only Tbilisi, Kutaisi, Rustavi, Poti, and Batumi. Summarized in Council of Europe (2018),
‘Local and regional democracy in Georgia’, Report on 35th Session, November 7, 2018. p.9.
https://rm.coe.int/CoERMPublicCommonSearchServices/DisplayDCTMContent?documentId=09000016808e551a 18 A very similar proposal has been made in NALAG (2013), ‘Decentralization, Region Development, Spatial Planning Aspects and
Policy Milestones for Georgia’, Tbilisi: National Association of Local Authorities of Georgia (NALAG), pp. 83-89.

13
3, all of these urban centers are within 20-40 kilometers of Georgia’s main east-west highway19, meaning
that they are all linked to each other.
Figure 3: Population density of self-governing units (left side) and distance from Georgia’s major highway (right side)
Source: Tbilisi State University and Jumpstart Georgia 2012, compiled for World Bank (2014) Georgia Urbanization
Review
This approach finds a balance between a focus on Georgia’s largest cities and a focus on all regions.
At certain times it has been proposed in Georgia to focus on the ‘Big Four’ cities: Tbilisi, Batumi, Kutaisi,
and Rustavi. That approach might be most efficient, but it is likely to sacrifice a degree of spatial equity,
since it covers only 41 percent of the country’s population. But a regional approach aiming to cover all
regions neglects the real-world structure of population and economic activity. The approach of functional
economic areas presented in this analysis proposes an intermediate framework, which brings some of the
benefits of both approaches. In other words, the emphasis on regions may be maintained because of
Georgia’s governance structure, but each region will need to focus on functional areas within their territory,
and to plan interventions with neighboring regions to leverage functional areas that span across
administrative boundaries.
The RDP does include a measure to support functional integration of urban areas of Georgia, but it is
tiny in relation to the other measures. The total budget for this measure is GEL 0.2 million, which may
imply it is not taken seriously. The measure provides for a pre-feasibility study of effective cooperation
systems in the functional areas of Georgia’s biggest cities, especially in the areas of spatial planning, basic
services and education, and business cooperation. Arguably the study should have been conducted before
the RDP was finalized, not during implementation, so that it could help configure all other measures of the
RDP. These initiatives could be greatly scaled-up in the RDP 2022-2025. Concerted attention will also
need to be given to implementation mechanisms, since local government capacity for economic development
is likely to be relatively low. In principle, implementation mechanisms might still be focused on regional
governments, but with a stronger set of criteria and filters for investments to take place at municipal level.
19 Indeed 68 percent of Georgia’s population lives within 20km of the national highway, and 81 percent lives within 40km of the
national highway.

14
2. Benchmarking and recommendations for subnational competitiveness
The purpose of this section is to clarify subnational competitiveness objectives in Georgia. It is based
on a benchmarking of subnational competitiveness outcomes, which can provide guidance for policymakers.
Strategies for regional economic development are notoriously contentious, and it will be impossible to
satisfy all experts on this topic. For some practitioners, the RDP approach is overly focused on achieving
spatial equity, in trying to find economic solutions for all regions, rather than focusing on healthcare,
education and governance and letting the market then take its course20. For other practitioners, spatial
interventions are acceptable, but the RDP approach could be criticized for overemphasizing the ability of
policymakers to accurately ‘pick’ economic sectors for regional specialization21.
Two key questions help resolve this uncertainty. The deep disagreements on regional development
paradigms will not be resolved anytime soon globally. However, we can shed light on their relevance in
Georgia by asking two key questions:
1. Does Georgia have an unusually severe problem in regional development? If not, then perhaps
the preoccupation with spatial equity is misplaced; but if yes, then policymakers are correct to try
to address this problem.
2. Are the proposed specializations realistic, compared to current economic activities? The risk of
‘picking’ the wrong sectors is decreased if they are based on an understanding of current economic
activities. How do the proposed specializations match up with current economic activities, by sector
and location?
The analysis in this section is shaped by the insights of the previous section: that municipalities rather than
regions are likely to be a better unit for analysis; and that strategic prioritization will need to be more detailed.
2.1. Does Georgia have an unusually severe problem in regional development?
Compared to other countries of similar size and income level, Georgia’s regional disparities are
unusually severe. The RDP repeatedly emphasizes the disparity between the growth and prosperity of
Tbilisi and the stagnation and poverty of the rest of Georgia. The divergence in the value added by region
is considered one of the biggest barriers to the growth and prosperity of the country, exacerbated by poor
connectivity and weak infrastructure in the majority of the country22. But are Georgia’s regional disparities
unusually severe, or are they a ‘normal’ part of any country’s development trajectory? We calculated the
variance in GDP per capita by region, as shown in Table 2. This regional data indicates that Georgia has a
substantially higher variation in regional economic outcomes than comparator countries. The coefficient of
variation in GDP per capita across regions23 is 0.4 in Georgia, 0.31 in Armenia, 0.29 in Turkey, 0.15 in
Poland, and 0.10 in Hungary. Bulgaria has a slightly higher coefficient of variation, at 0.44. The main driver
of this high regional inequality in Georgia is Tbilisi: Tbilisi produces 45-67 percent of Georgia’s gross value
added24, and receives 81 percent of its foreign investment25. The coefficient of variation in GDP per capita
falls to 0.28 if Tbilisi is excluded. The same table also shows the ratio of GDP per capita in the largest city
to average GDP per capita in each country. On this measure, Georgia’s situation is less severe than in Poland
or Hungary, and is comparable to Bulgaria.
20 See, for example, the approach advocated by World Bank (2008), World Development Report 2009: Reshaping Economic
Geography, Washington DC: World Bank. 21 See pp. 72-77 in Farole, Goga & Ionescu-Heroiu (2018), Rethinking Lagging Regions: using cohesion policy to deliver on the
potential of Europe’s regions, Washington DC: World Bank. http://pubdocs.worldbank.org/en/739811525697535701/RLR-FULL-
online-2018-05-01.pdf 22 The Regional Development Programme of Georgia 2018-2021 23 The coefficient of variation is a measure of the magnitude by which GDP per capita varies across regions. It is calculated as the
standard deviation of the values, divided by the mean. 24 Figures vary depending on the source of data. 45 percent is taken from Geostat survey results. 67 percent appeared in a
presentation of the Georgian Ministry of Regional Development and Infrastructure. 25 Giorgobiani, Mzia (2019), ‘Regional Development Policy in Georgia’, presentation at European Week of Regions & Cities,
Brussels, 7-10 October 2019.

15
Table 2: Coefficient of variation in Georgia and for comparator countries26
Number
of
regions
Population
(millions,
2019)
Population
in the
largest city
(%)
National
GDP per
capita
(2018)
GDP per
capita in
the largest
city
Coefficient of
variation of
GDP per
capita across
regions
Proportion
of national
GDP in the
largest city
(%)
Georgia* 11 3.73 32 $4,717 $7,816 0.40 45
Armenia* 11 2.97 61 $4,212 -- 0.31 --
Bulgaria 29 7 18 $9,272 $15,657 0.44 40
Hungary 8 9.77 18 $16,161 $34,038 0.10 36
Poland 17 37.97 5 $15, 420 $34,770 0.15 17
Turkey 25 82 18 $9,370 $11,747 0.29 31 Note: * indicates nominal monthly wages at the regional level were used to compare regional inequality. -- denotes data not available.
GDP per capita at the urban level is from 2016 data for Bulgaria, 2017 data for Turkey and uses 2018 data for Georgia and Hungary. Regional
monthly wage distribution is based on 2018 data for Armenia and 2017 data for Georgia.
Sources: Geostat, World Bank, Organization for Economic Cooperation and Development (OECD), National Statistical Institute of Bulgaria, Turkish Statistical Institute, European Commission
The structure of economic activity is dramatically different between the capital city and Georgia’s
regions. As shown in Figure 4, in Tbilisi, nearly 70 percent of the population are formally employed, 13
percent are self-employed, and 17 percent are unemployed. Outside of Tbilisi, only around 30 percent of
the population are formally employed, while fully 60 percent are categorized as self-employed.27 Either this
implies a strong spirit of entrepreneurship outside the capital city, or—more likely—it implies a reliance on
survival entrepreneurship, i.e. any activities that will provide a minimal income. In other words, there is a
profound lack of formal jobs in most areas outside Tbilisi. A strategy of regional economic development
should take this finding into account: the companies that can generate economic growth mostly do not exist
outside Tbilisi.
Figure 4: Labor force distribution at the regional level, 2019.
Source: World Bank analysis of Geostat survey data.
Georgia’s regional disparities have been shaped by the concentration of large firms in a few places.
Large firms are the primary driver of higher economic activity, and they are concentrated in Tbilisi and a
few other places, as shown in Figure 5, panel (a). In this sense, the locations of large firms underpin
Georgia’s regional economic disparities. Larger firms have also grown faster than other firms in almost all
26 The comparators were chosen for being neighboring countries, and/or for having similar levels of income or populations. The
analysis could be extended to other countries with similar income levels to Georgia, but regional economic data was not readily
available outside the OECD and EU countries. 27 Geostat Survey - Regional Statistics on Economic Activity 2019
69
39 3448
33 36 31 3241 36
0
20
40
60
80
100
Tb
ilisi
Sh
ida
Kart
li
Kvem
o K
art
li
Ad
jara
A/R
Sa
megre
lo
Imere
ti
Sa
mts
khe-J
ava
kheti
Guria
Mts
kheta
-Mtia
neti
Racha-L
ech
khum
i
Pe
rce
nt o
f to
tal la
bo
r fo
rce
Unemployed
Self-employed
Hired
16
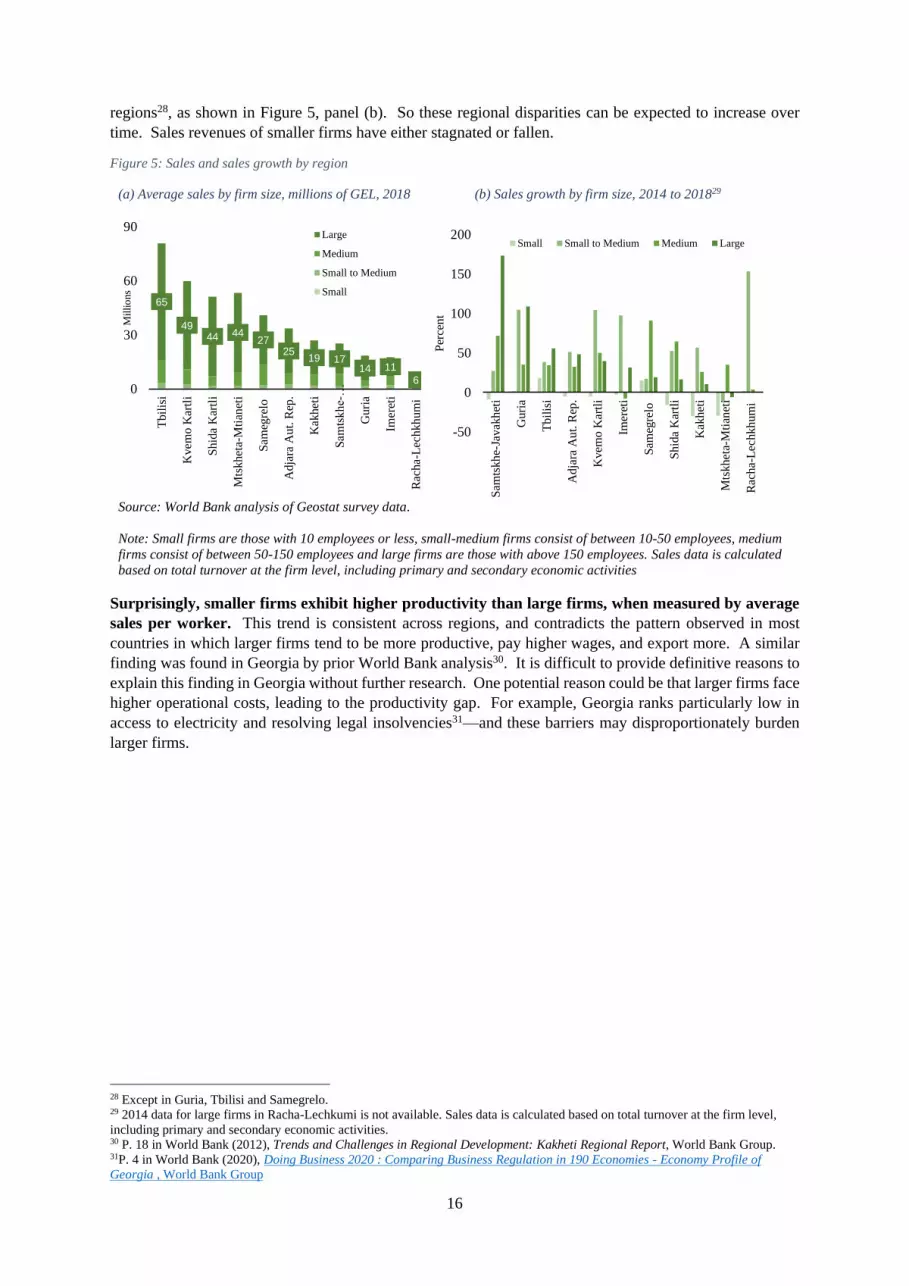
regions28, as shown in Figure 5, panel (b). So these regional disparities can be expected to increase over
time. Sales revenues of smaller firms have either stagnated or fallen.
Figure 5: Sales and sales growth by region
(a) Average sales by firm size, millions of GEL, 2018 (b) Sales growth by firm size, 2014 to 201829
Source: World Bank analysis of Geostat survey data.
Note: Small firms are those with 10 employees or less, small-medium firms consist of between 10-50 employees, medium
firms consist of between 50-150 employees and large firms are those with above 150 employees. Sales data is calculated
based on total turnover at the firm level, including primary and secondary economic activities
Surprisingly, smaller firms exhibit higher productivity than large firms, when measured by average
sales per worker. This trend is consistent across regions, and contradicts the pattern observed in most
countries in which larger firms tend to be more productive, pay higher wages, and export more. A similar
finding was found in Georgia by prior World Bank analysis30. It is difficult to provide definitive reasons to
explain this finding in Georgia without further research. One potential reason could be that larger firms face
higher operational costs, leading to the productivity gap. For example, Georgia ranks particularly low in
access to electricity and resolving legal insolvencies31—and these barriers may disproportionately burden
larger firms.
28 Except in Guria, Tbilisi and Samegrelo. 29 2014 data for large firms in Racha-Lechkumi is not available. Sales data is calculated based on total turnover at the firm level,
including primary and secondary economic activities. 30 P. 18 in World Bank (2012), Trends and Challenges in Regional Development: Kakheti Regional Report, World Bank Group. 31P. 4 in World Bank (2020), Doing Business 2020 : Comparing Business Regulation in 190 Economies - Economy Profile of
Georgia , World Bank Group
65
4944 44
2725
19 1714 11
60
30
60
90
Tbil
isi
Kvem
o K
artl
i
Shid
a K
artl
i
Mts
khet
a-M
tian
eti
Sam
egre
lo
Adja
ra A
ut.
Rep
.
Kak
het
i
Sam
tskh
e-…
Guri
a
Imer
eti
Rac
ha-
Lec
hkh
um
i
Mil
lio
ns
Large
Medium
Small to Medium
Small
-50
0
50
100
150
200
Sam
tskh
e-Ja
vak
het
i
Guri
a
Tbil
isi
Adja
ra A
ut.
Rep
.
Kvem
o K
artl
i
Imer
eti
Sam
egre
lo
Shid
a K
artl
i
Kak
het
i
Mts
khet
a-M
tian
eti
Rac
ha-
Lec
hkh
um
i
Per
cen
t
Small Small to Medium Medium Large

17
Figure 6: Average productivity by firm size, thousand GELs per worker, 2018
Source: World Bank analysis of Geostat survey data. Sales data is calculated based on total turnover at the firm level,
including primary and secondary economic activities
This unusual trend in productivity levels changes when the analysis is restricted to only manufacturing
sectors. There are regional variations in productivity levels by firm size, where in 4 of the 11 regions, large
firms exhibit higher levels of productivity and in the remaining regions except Imereti, small-to-medium or
medium size firms are higher in productivity compared to small firms. Further research and between-sector
comparisons can provide insight into the experiences of types of firms across sectors.
Figure 7: Average productivity by firm size in manufacturing, thousand GELs per worker, 2018
Source: World Bank analysis of Geostat survey data. Sales data is calculated based on total turnover at the firm level/
0
100
200
300
400
500
600
700
Adja
ra A
ut.
Rep
.
Guri
a
Imer
eti
Kak
het
i
Kvem
o K
artl
i
Mts
khet
a-M
tian
eti
Rac
ha-
Lec
hkh
um
i
Sam
egre
lo a
nd Z
emo
Sam
tskh
e-Ja
vak
het
i
Shid
a K
artl
i
Tbil
isi
Small Small to Medium Medium Large
Sales per worker, thousands GEL
0
50
100
150
200
250
300
Adja
ra A
ut.
Rep
.
Guri
a
Imer
eti
Kak
het
i
Kvem
o K
artl
i
Mts
khet
a-M
tian
eti
Rac
ha
Sam
egre
lo a
nd Z
emo
Sam
tskh
e-Ja
vak
het
i
Shid
a K
artl
i
Tbil
isi
Small Small to Medium Medium Large

18
2.2. Where are the best opportunities for subnational growth?
In this section, two channels of analysis help determine how the regional economic specializations
proposed by the RDP might be optimized.
• First, we examine the location of the economic sectors proposed by the RDP.
• Second, we examine how this spatial landscape is changing over time, and where the future of
these sectors is likely to be.
These two analyses can be compared with the specializations proposed in the RDP.
Most analysis in this section is derived from the Geostat firm-level survey. The survey covers 5,000-6,000
firms and individual entrepreneurs for the years of 2014, 2015, 2016, 2017, and 2018. More information
on the survey is given in Appendix 1.
a. Where are Georgia’s tradable sectors currently concentrated in the regions?
Examining regional and firm-level data, the following observations can be noted:
(i) Tbilisi dominates all economic sectors except agriculture, forestry and fishing. Table 4 shows
industry output by region of Georgia, and clearly demonstrates the dominance of Tbilisi in all sectors
of the economy except agriculture. Some secondary nodes are visible: for example, Manufacturing
shows secondary nodes in Kvemo Kartli and Imereti; and Transport and Storage shows a secondary
node in Samegrelo32.
Table 4: GDP of all regions, 2018 (million GEL)
Source: World Bank analysis of Geostat 2018 regional statistics
(ii) However, in relative terms, each region has one or more economic specializations. Table 5
shows the relative specializations of each region of Georgia, by calculating location quotients33. For
32 In Agriculture, forestry and fishing, Kakheti dominates the sector. Indeed, 38 percent of all Georgia’s agricultural land is located
in Kakheti—according to Government of Georgia, Ministry of Regional Development and Infrastructure. (2013) ‘Kakheti Regional
Development Plan 2014-2021’. Secondary nodes for agriculture are in Kvemo Kartli, Imereti. Shida Kartli, and some other regions. 33 The methodology for these calculations is to divide the share of each industry in the regional economy by the share of each
industry in the national economy. The logic for this calculation is the same as for Revealed Comparative Advantage calculations
using export data. If the quotient is above 1 then the region specializes in that industry (relative to the region’s share in the national
economy), and if the number is below 1 then the industry is underrepresented in that region.
NACE rev.
2Economic Activities Tbilisi Adjara Guria Imereti Kakheti
Mtskheta-
MtianetiRacha
Samegrel
o
Samtskhe-
Javakheti
Kvemo
Kartli
Shida
KartliTOTAL
A Agriculture, forestry and fishing 44 145 83 414 741 80 40 299 269 522 379 3 016
B Mining and quarrying 189 19 6 56 24 21 3 20 24 82 14 457
C Manufacturing 1 625 167 50 481 205 185 23 171 206 707 120 3 940
D Electricity, gas, steam and air conditioning supply 404 42 12 120 51 46 6 42 51 176 30 980
E Water supply; sewerage, waste management, remediation 121 12 4 36 15 14 2 13 15 53 9 293
F Construction 2 185 581 24 91 39 15 9 74 71 85 39 3 213
G Wholesale and retail trade; repair of motor vehicles 4 160 372 35 246 81 29 4 136 50 195 99 5 406
H Transportation and storage 1 676 254 9 76 8 15 1 353 7 51 11 2 462
I Accommodation and food service activities 1 113 319 38 65 52 80 10 38 63 19 3 1 800
J Information and communication 763 73 5 63 26 19 4 32 14 48 31 1 077
K Financial and insurance activities 1 328 128 50 268 132 27 16 109 37 137 119 2 350
L Real estate activities 2 411 540 127 402 163 147 23 180 138 187 112 4 431
M Professional, scientific and technical activities 669 53 12 104 21 15 6 29 10 48 36 1 005
N Administrative and support service activities 289 50 5 49 23 20 3 9 9 32 23 510
O Public administration, defence, social security 1 082 236 63 384 129 94 23 241 93 323 232 2 900
P Education 583 168 54 274 139 42 16 137 76 146 104 1 740
Q Human health and social work activities 701 164 19 260 92 48 16 107 25 101 100 1 633
R Arts, entertainment and recreation 551 132 52 145 53 27 9 52 26 101 33 1 182
S Other service activities 160 30 3 48 21 7 3 21 14 23 16 347
T Activities of households as employers 11 5 2 6 1 0 0 5 0 3 2 37
(=) GDP at basic prices 20 064 3 492 651 3 587 2 018 932 214 2 068 1 200 3 040 1 514 38 779
(+) Taxes on products 3 120 543 101 558 314 145 33 322 187 473 235 6 031
(-) Subsidies on products 109 19 4 19 11 5 1 11 7 16 8 210
(=) GDP at market prices 23 075 4 016 749 4 126 2 320 1 072 246 2 378 1 380 3 496 1 741 44 599

19
example, Racha has a relative specialization in Agriculture, Forestry and Fishing; Education; Health
and Social Work; Household Activities; and some other sectors (where ‘location quotients’ are
above 1.0). Adjara has clear specializations in Construction, and Accommodation and Food Service
(as a proxy for Tourism). These specializations are not obvious from the absolute values of industry
output shown in Table 4: they appear only once relative sizes of the regional economies are
considered.
Table 5: Location quotients of all regions, 2018
Source: World Bank analysis of Geostat regional statistics
(iii) However, these regional economic specializations are not fully consistent with the potentials
proposed by the RDP. Table 6: Location quotients of all regions using firm-level data for
subsectors, 2018 shows location quotient calculations for the economic sectors proposed in the
RDP34. The table highlights the cells with location quotients above 1.0, indicating the regions with
disproportionately large shares of each industry. These can be compared with the economic
specializations proposed by the RDP, in green text.
Table 6: Location quotients of all regions using firm-level data for subsectors, 2018
Source: World Bank analysis of Geostat firm-level survey
Some observations can be made about the consistency of the RDP economic potentials with current
economic activities:
34 Close approximations are utilized; for example: ‘Tourism’ is accommodation and food services; ‘Logistics’ is Transportation and
storage; ‘Mining’ includes renewable energy sectors; ‘Higher education’ includes research and development and ‘Professional
Services’ include construction.
Economic Activities Tbilisi Adjara Guria Imereti KakhetiMtskheta-
MtianetiRacha Samegrelo
Samtskhe-
Javakheti
Kvemo
KartliShida Kartli
Agriculture, forestry and fishing 0.0 0.5 1.6 1.5 4.7 1.1 2.4 1.9 2.9 2.2 3.2
Mining and quarrying 0.8 0.5 0.8 1.3 1.0 2.0 1.0 0.8 1.7 2.3 0.8
Manufacturing 0.8 0.5 0.8 1.3 1.0 2.0 1.0 0.8 1.7 2.3 0.8
Electricity, gas, steam and air conditioning supply 0.8 0.5 0.8 1.3 1.0 2.0 1.0 0.8 1.7 2.3 0.8
Water supply; sewerage, waste management, remediation 0.8 0.5 0.8 1.3 1.0 2.0 1.0 0.8 1.7 2.3 0.8
Construction 1.3 2.0 0.5 0.3 0.2 0.2 0.5 0.4 0.7 0.3 0.3
Wholesale and retail trade; repair of motor vehicles 1.5 0.8 0.4 0.5 0.3 0.2 0.1 0.5 0.3 0.5 0.5
Transportation and storage 1.3 1.1 0.2 0.3 0.1 0.3 0.1 2.7 0.1 0.3 0.1
Accommodation and food service activities 1.2 2.0 1.2 0.4 0.6 1.8 1.0 0.4 1.1 0.1 0.0
Information and communication 1.4 0.8 0.3 0.6 0.5 0.7 0.6 0.5 0.4 0.6 0.7
Financial and insurance activities 1.1 0.6 1.3 1.2 1.1 0.5 1.2 0.9 0.5 0.7 1.3
Real estate activities 1.1 1.4 1.7 1.0 0.7 1.4 0.9 0.8 1.0 0.5 0.6
Professional, scientific and technical activities 1.3 0.6 0.7 1.1 0.4 0.6 1.1 0.5 0.3 0.6 0.9
Administrative and support service activities 1.1 1.1 0.5 1.0 0.9 1.6 1.0 0.3 0.6 0.8 1.1
Public administration, defence, social security 0.7 0.9 1.3 1.4 0.9 1.4 1.4 1.6 1.0 1.4 2.0
Education 0.6 1.1 1.8 1.7 1.5 1.0 1.7 1.5 1.4 1.1 1.5
Human health and social work activities 0.8 1.1 0.7 1.7 1.1 1.2 1.7 1.2 0.5 0.8 1.6
Arts, entertainment and recreation 0.9 1.2 2.6 1.3 0.9 1.0 1.3 0.8 0.7 1.1 0.7
Other service activities 0.9 1.0 0.5 1.5 1.2 0.8 1.5 1.1 1.3 0.9 1.2
Activities of households as employers 0.6 1.6 3.3 1.6 0.6 0.5 1.6 2.5 0.3 1.1 1.7
Tbilisi Adjara Guria Imereti KakhetiMtskheta-
MtianetiRacha Samegrelo
Samtskhe-
Javakheti
Kvemo
KartliShida Kartli
Agriculture 0.3 0.1 1.4 1.0 2.4 0.7 5.7 1.2 0.4 4.4 1.9
Agro-processing 1.1 0.0 0.1 0.1 3.1 2.9 1.4 0.5 3.1 0.0 0.7
Wine making 0.6 0.0 0.0 0.0 8.5 0.6 3.6 0.0 0.0 0.0 1.2
Tourism 1.4 1.4 2.3 0.5 0.2 1.1 0.8 0.1 1.6 0.1 0.2
Mining 0.1 0.6 8.4 7.0 1.3 1.7 7.9 0.7 2.3 1.7 1.6
Logistics 1.1 1.3 0.7 0.6 0.0 0.2 0.2 2.6 0.2 0.3 0.2
Higher education 1.5 1.2 0.1 0.5 0.0 0.0 0.0 0.0 0.1 0.4 0.3
Information Technology 1.5 0.1 0.0 0.5 0.1 0.1 0.0 0.0 0.1 0.1 3.6
Manufacturing 0.7 1.2 0.6 2.0 0.1 1.0 0.6 0.4 0.7 2.6 2.2

20
• Agro-processing is envisaged in the RDP to be an economic potential for 7 of 11 regions (all
except Adjara, Guria, Imereti, and Tbilisi). But economic data indicate that agro-processing is
concentrated in only three regions: Kakheti, Mtskheta Mtianeti, and Samtskhe-Javakheti;
• Tourism is envisaged in the RDP to be an economic potential for all regions; yet tourism
activities are weak in in Imereti, Kakheti, Racha, Samegrelo, Kvemo Kartli, and Shida Kartli.
(N.B. The low figures for tourism activities in some regions may be because activities like
wine-tasting and accommodation are conducted by enterprises for which wine-making is the
primary economic activity. So revenue is counted here under wine-making rather than
tourism).
• Wine-making is envisaged to be an economic potential in Kakheti, Shida Kartli, and Imereti
regions; yet wine-making is indicated not to be widespread in Imereti, and meanwhile is
indicated to be a relative specialization in Racha;
• Higher education and innovation is envisaged by the RDP to be an economic potential in
Tbilisi, Adjara, Kakheti, Samtskhe-Javakheti, and Imereti; yet the data indicates an existing
specialization only in Tbilisi and Adjara.
• Mining and renewable energy is envisaged in the RDP to be an economic potential for all 11
regions. However, activity is currently focused in Kvemo Kartli, Imereti, with very little in
other regions.
(iv) These surprising conclusions can be explained by looking within each region. ‘Regional’
economic potentials are concentrated in specific municipalities within each region. Maps are
shown in Figure 8 and Figure 9. For example:
• In Agro-processing, clear nodes exist around Georgia’s major cities, especially Tbilisi, Poti,
Zugdidi, Gori, Borjomi, and Telavi. But in 38 out of 64 municipalities, activity in agro-
processing is negligible (less than GEL 1 million in sales).
• Even in Agriculture, there are clear disparities between municipalities in rural areas, with
intense activity in some municipalities, but very low activity in others. For example,
municipalities of Chiatura, Ninotsminda, and Dusheti exhibit low activity, and municipalities
such as Sagarejo, Gardabani, Tetritskaro exhibit intense activity.
• In Tourism, there is a concentration in urban areas, plus some additional areas with mountains
or cultural heritage. Municipalities around Kazbegi, Svaneti, Gori, Borjomi, Telavi, and the
Black Sea coast have high tourism sales revenues, while neighboring municipalities even
within the same region have very low or zero revenues from tourism (such as Dedoplis Tskaro,
Aspindza, or Gardabani).
• In Wine-making, activity is concentrated in 1 out of 4 municipalities in Shida Kartli, and 3 out
of 12 in Imereti.
• Mining and renewable energy is highly concentrated in a few municipalities in each region.
• Higher education and innovation is concentrated in the larger cities in each region—i.e.
Tbilisi, Batumi, Kutaisi, Akhalsikhe, Rustavi, Telavi, Zugdidi, Gori, and a couple of others.
The confidence interval for these results is relatively wide, since the survey was not designed to be
representative by industry at the municipality level, so should be considered indicative rather than
conclusive.

21
Figure 8: Sales revenue by primary economic activity, 2018 (sectors mentioned in RDP)
Source: World Bank analysis of Geostat survey data

22
Figure 9: Sales revenue by primary economic activity, 2018 (additional sectors)
Source: World Bank analysis of Geostat survey data
b. How is regional concentration changing over time?
Examining data on employment and sales revenues, we find that sectoral concentrations are increasing
over time. Data on employment is shown in the maps in Figure 10 and Figure 11. Two main observations
can be made:
• None of the economic sectors are growing uniformly across the country. In all sectors, some
municipalities have shrunk in size while others have grown. For example in wine-making,
Ambrolauri and Gori have grown, while Akhmeta and Zestafoni municipalities have shrunk.
• Sectoral concentration has increased over time. For example, employment in tourism has grown
in the existing tourism nodes (Tbilisi, Kazbegi, Borjomi, Svaneti, Adjara, and some areas of
Kakheti) and has shrunk in rural non-mountainous areas, mostly along the east-west highway. As
another example, employment in agro-processing has grown in the existing nodes (some
municipalities of Kakheti, Shida Kartli and Svaneti) and has shrunk in other municipalities of those
same regions (mostly where it was not already strong).

23
Figure 10: Change in employment, 2014-2018 (sectors mentioned in RDP)
Source: World Bank analysis of Geostat survey data
24
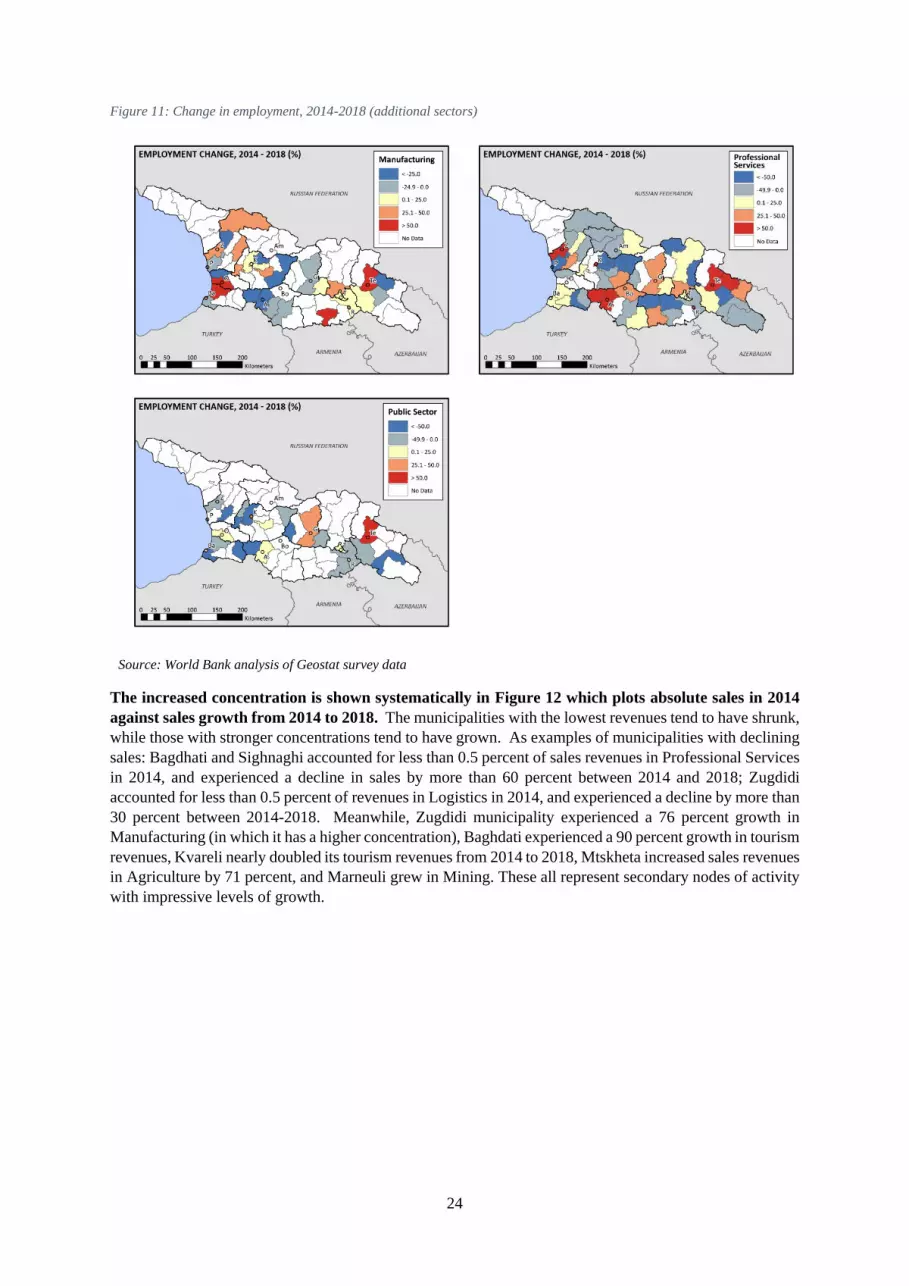
Figure 11: Change in employment, 2014-2018 (additional sectors)
Source: World Bank analysis of Geostat survey data
The increased concentration is shown systematically in Figure 12 which plots absolute sales in 2014
against sales growth from 2014 to 2018. The municipalities with the lowest revenues tend to have shrunk,
while those with stronger concentrations tend to have grown. As examples of municipalities with declining
sales: Bagdhati and Sighnaghi accounted for less than 0.5 percent of sales revenues in Professional Services
in 2014, and experienced a decline in sales by more than 60 percent between 2014 and 2018; Zugdidi
accounted for less than 0.5 percent of revenues in Logistics in 2014, and experienced a decline by more than
30 percent between 2014-2018. Meanwhile, Zugdidi municipality experienced a 76 percent growth in
Manufacturing (in which it has a higher concentration), Baghdati experienced a 90 percent growth in tourism
revenues, Kvareli nearly doubled its tourism revenues from 2014 to 2018, Mtskheta increased sales revenues
in Agriculture by 71 percent, and Marneuli grew in Mining. These all represent secondary nodes of activity
with impressive levels of growth.

25
Figure 12: Sales revenues, 2018 and Growth in sales revenues, 2014-2018 (by municipality)
Source: World Bank analysis of Geostat survey data
N.B.: Observations with 2014 sales below 1,000,000 GEL were dropped to avoid misleading results from small sample
sizes. Observations with sales growth higher than 100 percent were also dropped, since they represent very small
municipalities where small additions or subtractions to sales revenues lead to huge changes in ‘growth’.
This trend of increasing concentration is supported by new investments, which have concentrated in
areas where economic activity in each sector is already strong. For example, Agro-processing
investments of more than 5 million GEL are almost always in municipalities where Agro-processing sales
are already above 5 million GEL. As another example, Tourism investments have concentrated in Batumi,
Borjomi, Kobuleti and Tbilisi—all places where sales and employment in the tourism sector have grown and
are among the leading municipalities in Tourism sales revenues. Investment in higher education has included
Telavi, Kutaisi, and Batumi, where the sector is growing; meanwhile other municipalities such as
Akhaltsikhe where employment and sales are shrinking have received lower investments.
-100
-80
-60
-40
-20
0
20
40
60
80
100G
row
th in
sal
es r
even
ues
20
14
-20
18
(%
)
Sales revenues, 2014(GEL)
Agriculture
Mining
Agro processing
Wine making
Manufacturing
Tourism
Logistics
InformationTechnologyHigher education

26
Figure 13: Total investment, 2014-2018 (sectors mentioned in RDP)
Source: World Bank analysis of Geostat survey data

27
Figure 14: Total investment, 2014-2018 (other sectors)
Source: World Bank analysis of Geostat survey data
Figure 15 shows this pattern systematically by plotting sales revenues against investments. Each
observation in the graph corresponds to a sector in a municipality, at the two-digit sector level. The
correlation between these two variables indicates municipalities with larger sales in a given sector received
more investment. We show investment over the full five year period (2014-2018) to avoid distorting the
values with investments that are lumpy from year to year.
Figure 15: Sales revenue in 2014 vs. Investment received 2014-2018, (by sector-municipality)
Source: World Bank analysis of Geostat data
Note: Sales revenue under 1 mil. Lari in 2014 are excluded from the data.
0
10,000
20,000
30,000
40,000
50,000
60,000
70,000
80,000
90,000
100,000
Inve
stm
ent
(th
ou
san
ds
GEL
), 2
01
4-
20
18
Sales revenues (GEL), 2014
Mining
Wine making
Tourism
InformationTechnologyProfessional services
Agriculture
Agro-processing
Manufacturing, other
Logistics

28
Incidentally, this pattern does not hold when normalizing for absolute size of the municipality. Figure
16 plots sales per employee against investment per employee. Each observation in the graph corresponds to
a sector in a municipality, at the two-digit sector level. Sales per employee and investment per employee do
not appear to be correlated35; i.e. more ‘productive’ municipalities [by sales revenue per employee] do not
appear to receive a higher rate of investment per employee.
Figure 16. Sales per employee (2018) vs. Aggregated investment per employee (2014-2018)
Source: World Bank analysis of Geostat survey data
Note: The sectors represent two digit NACE categories. The scatterplot does not include Total Investment over 600,000
GEL (3 observations omitted) and Total Sales over 400,000 GEL (5 observations omitted) as outliers, so that the graph is
readable.
The location of high-value subsectors provides an additional insight: these innovative and
competitive activities are concentrated in only a few municipalities. We focus on high-value
subsectors as an indicator of Georgia’s competitive municipalities in each sector. High-value subsectors
may indicate the municipalities in which the ‘future’ of each sector is being manifested: the more
innovative and more competitive firms and activities. These high-value subsectors were selected by
reference to a global index of the sophistication of all manufactured goods36. The maps in Figure 17 and
Figure 18 show the locations of these high-value subsectors37. Our main observations are:
• Across industries, high-value subsectors tend to be concentrated in Tbilisi and very few other
municipalities. In four industries – Professional Services, Information-technology, Higher-education
and Agro-processing, more than half the sales revenues for the high-value sub-sectors was generated in
Tbilisi, reaching above 80 percent for Professional Services and Information Technology. But nodes do
also exist outside Tbilisi. For example, high-value subsectors in the agro-processing industry (meat and
dairy products) are located in Tbilisi and one city in Mtskheta-Mtianeti with high proximity to Tbilisi.
As Figure 17 shows, in a majority of the regions, including most municipalities in Kakheti and Adjara,
sales revenue in the high-value agro-processing sectors is below GEL 100,000. Manufacturing sectors
35 Dividing the figures for sales and investments by total employment will tend to bias upwards the per capita values for small rural
municipalities with low formal employment, but since both variables have the same denominator it will not affect the overall trend. 36 This is the PRODY global index, which assigns an income value to each product. The income value is calculated as a weighted
average of the GDP per capita of all countries that export each product. In these maps, the ‘high-value subsectors’ were selected as
having PRODY values of more than $29,500 (this value is calculated as the simple unweighted mean for all PRODY codes globally
at the 4-digit level). Applying this filter to subsectors, in agro-processing, 9 out of 33 subsectors are deemed to be high-value (meat,
dairy, prepared foods, etc); in manufacturing, 69 out of 215 subsectors are deemed to be high-value (pharmaceuticals, metals and
machinery, furniture, electronics, etc). 37 N.B. Only the main subsector of each firm is shown here. The Geostat survey asks firms to list their sales in first, second, and
third most important sales activities; but most firms have not responded on second and third activities. So to bring some uniformity
to the analysis, we show only the main subsector for each firm.

29
show similar results. High-value manufacturing subsectors are found in Tbilisi, Kvemo Kartli (Rustavi
municipality) and Imereti (Zestafoni municipality). Municipalities in high proximity to Tbilisi and the
to the East-West highway generally show higher sales revenues. Within the professional services
industry—for example, real-estate or financial intermediation—high-value subsectors are concentrated
in Tbilisi, Adjara (Batumi) and Imereti (Kutaisi). Zestafoni and Kutaisi are both in high-proximity to
the East-west highway. This data is presented systematically in Table 3.
Figure 17. Sales by primary activity in high-value subsectors, 2018
Source: World Bank analysis of Geostat survey data
Note: Please see the Appendix for a detailed list of high-value sectors.
Table 3. Percentage distribution of revenues from high-value sectors by municipality, 2018
Sectors Tbilisi (%) Outside Tbilisi (%) …including main
concentrations in… (%)
Agriculture 12 88 Gardabani (34)
Agri Processing 53 47 Mtshkheta (29)
Wine-making 31 69 Telavi (31)
Manufacturing 44 56 Rustavi (26)
ICT 81 19 Gori (13)
Higher Education 54 46 Batumi (26)
Professional 84 15 Batumi (6)
Source: World Bank analysis of Geostat data
• Municipalities with higher concentration of high-value subsectors are those which have also
received higher investment in these subsectors. As Figure 18 shows, four municipalities in close
proximity to Tbilisi and the East-West highway received over 5 million GEL in investment in the last 5
years in manufacturing high-value subsectors. Tbilisi received the highest level of investment in Agro-
processing high value subsectors from 2014-2018, at 60 percent of total investment. The second
municipality to receive the highest level of investment was Mtskheta, at 32 percent of total investment
in agro-processing high-value subsectors.

30
Figure 18: Investment in high-value subsectors, 2014-2018
Source: World Bank analysis of Geostat survey data
Note: Please see Appendix 5.1.4 for a detailed list of high-value sectors.
We tested the extent to which ‘high-value subsectors’ do indeed exhibit higher productivity and higher
wages—and found that in Georgia in fact these subsectors have a surprisingly similar distribution to
other subsectors. The data for sales per employee and average wages are shown in Figure 19. It seems
there are not substantial differences between high-value subsectors (plotted in black) and non high-value
subsectors (plotted in red). So the importance of high-value subsectors may be more about the progression
of the industry than the payoffs for workers in that industry.
Figure 19: Average earnings vs. sales per employee among high-value and non-high value sectors38
Source: World Bank analysis of Geostat survey data
Note: Average wages and sales per employee are in thousands of GEL.
38 Three outliers with average annual wages above 30000 GEL and one outlier sales per employee above 1 Mil GEL are excluded
from the sample, so that the majority of municipalities can be seen clearly on the graph.

31
c. What interventions will be important for these subsectors?
Regional economic outcomes could be improved by focusing interventions to catalyze the growth
drivers of each industry. Each industry may be affected by multiple constraints on growth. A diagnostic
of those constraints might highlight some of the following ‘typical’ constraints: land; workforce skills;
transport and logistics; industry-specific infrastructure; innovation; access to finance; business environment
and regulatory issues. Each of these factors would be examined for availability, quality, and cost. The aim
must be to identify interventions which can remove constraints and catalyze growth.
Many industry diagnostics do already exist in Georgia. Studies from various organizations have
examined the dynamics of agricultural industries, tourism, manufacturing, information technology, wine-
making, and various other industries.39
The data analyzed for this scoping note makes only two further observations, which could be pursued
in further work:
• The constraints on each industry are likely to vary by region and by municipality. For
example, business environment constraints often vary across different cities and regions in a single
country—even when they have been set according to national regulations40. This is because of
differing local interpretations of national regulations, and different implementation standards (and
sometimes because of further local regulations and procedures). As another example, utility costs
may also vary by location, and may be a more costly burden for some firms than others. An initial
indication is provided by the data mapped in Figure 20, which shows utility costs as a proportion of
sales revenues. The data indicates that utility costs are more than 8 percent of sales revenues for
firms in some municipalities, but less than 4-6 percent of sales revenues in other locations. These
discrepancies may be worthy of further investigation.
Figure 20: Utility costs as a proportion of sales revenues
Source: World Bank analysis of Geostat survey data
• Interventions to release those constraints will likely be most effective if they are made in the
same locations as the economic activities. The geographic data shows clear concentrations of
economic activity in specific municipalities. These existing nodes would be the natural locations
for specific investments, since they are where economic activities are concentrated. For instance,
in agriculture and agro-processing industries, access to industry infrastructure (such as warehousing,
cold storage, shared facilities) may be highly important for competitiveness; and location of those
39 World Bank (2014). Georgia: seizing the opportunity to prosper - country economic memorandum (English). World Bank Group.
http://documents1.worldbank.org/curated/en/pdf. 40 See Subnational Doing Business reports, https://www.doingbusiness.org/en/reports/subnational-reports

32
investments will matter—ideally to be chosen by considering the locations of producers and
markets. Similarly in tourism, investments in tourism infrastructure would reasonably focus on
locations where there is already a proven need—demonstrated by existing concentrations of tourism
revenues. Investments in new locations would need to demonstrate a very strong case on why those
locations deserve investments when they do not yet show tourism activity. Likewise in
manufacturing, logistics, information technology and all other economic sectors: local investments
would most reasonably be considered for existing nodes of activity.

33
3. Estimating the impact of Covid-19 at the subnational level
Georgia, like most other countries, will experience a substantial economic downturn owing to the
Covid-19 induced slowdown in economic activity. Cumulative Covid-19 cases in Georgia have remained
low at 900 confirmed cases with 14 deaths41. While the public health crisis is well-managed and maintained
under control, the economic downturn caused by the pandemic is expected to shrink the Georgian economy
at 4.8 percent in 2020, followed by a recovery of 4 percent in the next year.42 For a period of two months
(March 21st to May 22nd), the Georgian government imposed strict containment measures which include
closure of schools and non-essential stores, banning of traveling between cities (both by public and private
transport) and international tourism.43 The restrictions on traveling between cities with private transportation
ended towards the end of April, while the travel with public transportation lasted until the end of May.
The economic shock is expected to differ by industry. Globally, the pandemic has resulted in an economic
shock to supply and demand, stemming from restrictions on human-to-human interactions and mobility. The
shock differs by industry. Tourism has been among the sectors which received the largest hit due to countries
closing borders and bans on international/domestic travel at the global level. Industries requiring physical
presence of workers (e.g. manufacturing) have sometimes needed to cease work entirely, and are restarting
with modified work schedules and layouts.
We aim to estimate the impact of the economic contraction at the municipality level in Georgia. The
first step is to estimate the expected downturn by industry. For this purpose, we used the movement in stock
price of companies in the MSCI price share index44 as a proxy for the anticipated magnitude of change in
economic activity. As examples, based on this technique: hotels are expected to have a decline in revenues
of nearly 40 percent; food and beverage manufacturers at 5 percent; and the transportation sector at 16
percent. Due to data limitations, we analyzed the impact of Covid-19 on the following sectors: mining, food
and beverage manufacturing, wholesale of food and beverage products, motor vehicle sales, hospitality
sector, transportation, health and social services and information technology. We then apply the estimates
of this downturn to the sectoral mix for each municipality—e.g. municipalities with a greater reliance on
tourism will be affected more; municipalities with more reliance on food and beverages will be affected less.
Our estimates of the magnitude of downturn are mapped in Figure 21. They indicate the following:
• Smaller municipalities are likely to be impacted more severely by the downturn. Smaller
municipalities have less diversified local economies, and are more likely to be reliant on industries that
experience a relatively large downturn. The largest four cities – Tbilisi, Batumi, Kutaisi and Rustavi –
are estimated to experience a disruption of 1 percent or less. This is because of their greater
concentration in professional services, food and beverage manufacturing, and other sectors which are
less affected. This finding is consistent with findings in countries of the European Union45.
• Municipalities likely to be more severely impacted are in Adjara, one municipality in Imereti
(Samtredia) and three municipalities in Kakheti (including Akhmeta), followed by a municipality in
Guria. These municipalities are likely to experience a decline in sales revenues between 2 and 5 percent
in turnover (an indicator of economic activity) during the course of 2020.
These estimates should probably be interpreted as underestimates, for two key reasons: (i) data was
available only for some sectors; (ii) we estimate direct effects of the downturn on industries, but do not
account for indirect effects (i.e. the decline in demand for inputs and intermediate goods from those
industries) nor for induced effects (i.e. the decline in consumer spending by workers in those industries, as
a knock-on effect of the direct and indirect effects).
41 Johns Hopkins University of Medicine, Coronavirus Resource Center. https://coronavirus.jhu.edu/us-map 42 World Bank (2020), Global Economic Prospects June 2020, World Bank Group. Global-economic-prospects.worldbank 43 Policy Responded to Covid-19, International Monetary Fund, Policy Tracker. IMF.org/Policy-responses-to-Covid 44 The MSCI Index measures the stock performance of companies in particular domains. MSCI stands for Morgan Stanley Capital
International and covers 1600 indices. The data reflects 1640 companies in 28 countries. 45 Garrote Sanchez, Gomez Parra, Ozden & Rijkers (2020), ‘Which jobs are most vulnerable to COVID-19? What an analysis of
the European Union reveals’, Research & Policy Brief no. 34, Kuala Lumpur: World Bank.
http://documents.worldbank.org/curated/en/820351589209840894/
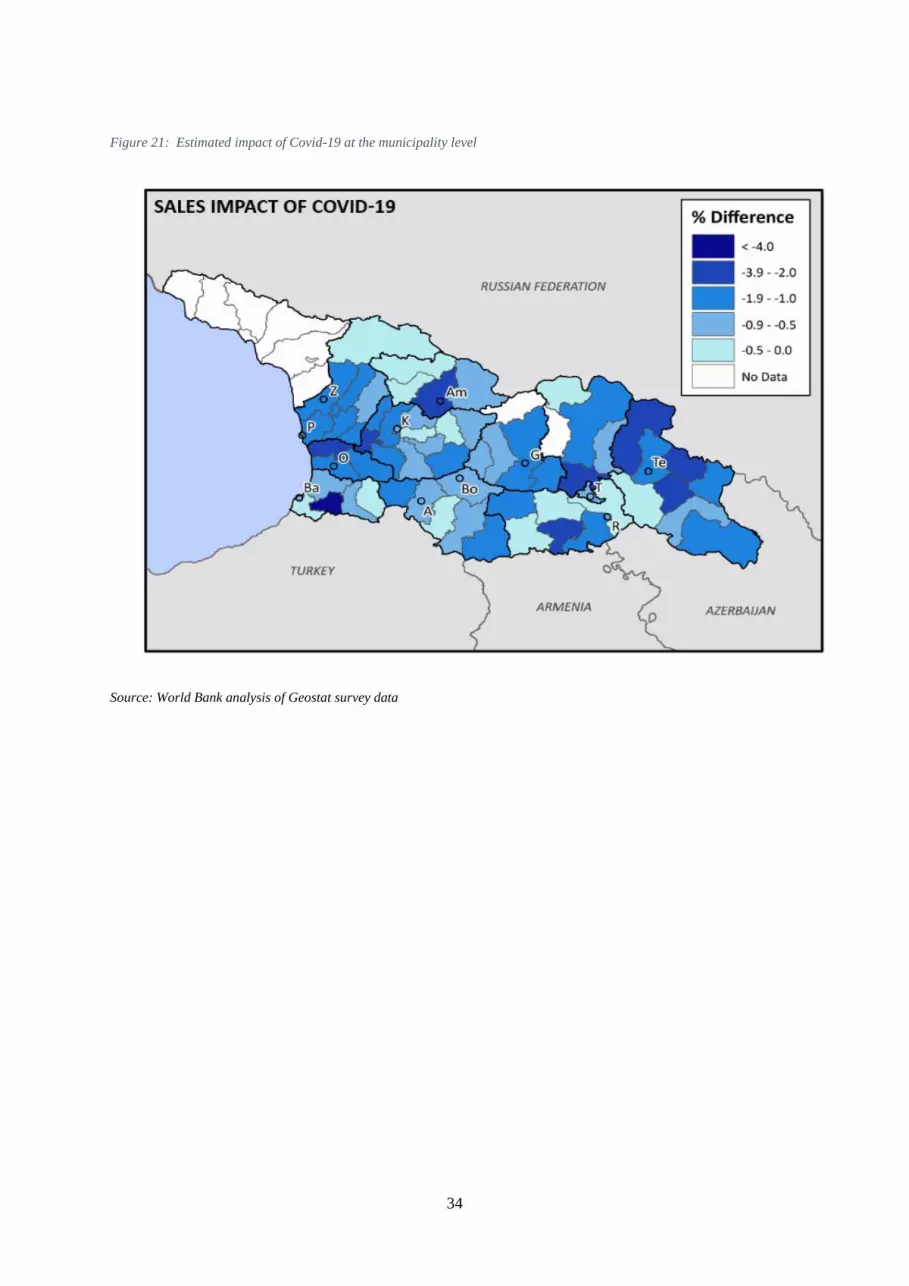
34
Figure 21: Estimated impact of Covid-19 at the municipality level
Source: World Bank analysis of Geostat survey data

35
Next steps: Industry-level Diagnostics and Policy Levers
This scoping note has made the following main
findings:
• The Government’s emphasis on
addressing inequalities between Tbilisi
and other regions in Georgia is well-
founded, given the severe regional
inequalities in Georgia.
• The regional economic specializations
proposed by the RDP will need to be
more selective, more specific, and
should be appraised before investment
decisions are made.
• The constraints on competitiveness and
growth are likely to vary by sector, by
region, and by municipality.
Implementation of the RDP could be
improved by focusing on nodes of
economic activity within reach region,
and supporting functional integration of
neighboring urban areas of Georgia.
• The impact of the Covid-19 downturn
will differ across Georgia, and therefore
may require a subnational lens on
economic support measures.
The next stages of work could respond to the
note’s main recommendations, and would
provide information and analysis that can
inform a new RDP. Our recommendations are
that the work should:
I. Combine sectoral and regional
studies to assist in prioritizing
subnational investments and
interventions. The analysis would
consolidate and leverage the industry
and value chain studies for ‘economic
potential’ sectors to identify a more
specific, targeted and appraised set of
proposed regional investments.
Findings should be tangible and specific, such as identifying the main constraints to development
of citrus agri-processing in some regions and municipalities (such as a lack of cold storage and
packing facilities); the main constraints to apparel manufacturing in some regions and municipalities
(such as managerial capabilities and industry growth strategy); and the main constraints to higher
value tourism development in some regions and municipalities (such as a lack of training in
emergency response). Some constraints may affect many regions—such as access to banks and
finance, which may be a constraint in most municipalities outside Tbilisi and some other cities. The
approach should nuance the understanding of subnational competitiveness by focusing on nodes of
economic activity in municipalities within each region.
II. Assign specific responsibilities amongst government bodies to release constraints on
subnational competitiveness. In the next RDP, the constraints identified in the first step of analysis
Box 2: Subnational competitiveness in Croatia
Croatia’s economy is lagging behind its neighbors in the
European Union, and inequalities in the country have
widened in recent years. Income in the poorest regions of
Croatia are only one-third of those in the capital city,
Zagreb.
The Croatian government approached the World Bank
Group to help design a strategy and projects to boost the
economy in lagging regions. As part of a three-year program
of support, the Bank team has provided:
• a multi-sector diagnostic report, to identify main
economic opportunities and constraints to growth,
focusing on five high priority industries;
• a prioritization framework for regional development
projects and recommendations for improving the
project pipeline proposed by local governments;
• fully costed designs for five strategic projects to
address major gaps in foreign investment attraction,
managerial capabilities, vocational skills, innovation
financing, and rural enterprises run by women;
• a rapid review of development funds and
implementation mechanisms in Croatia, to assist in
improving the way funds are managed and deployed in
the region;
The team is now starting work on a territorial strategy of
integrated projects and reforms for the 2021-2027
financing period.
The Bank team has so far involved approximately 100 staff
and consultants, of which the core team is pictured here
together with national and local government counterparts.
Some elements of this approach may be relevant in Georgia.

36
could be mapped, and responsibilities for key investments and actions would be allocated to the
various levels of government (national, regional, and municipal). A rapid review could also be
included of the performance of the RDP 2018-2021 against its targets. That review would provide
useful information for strengthening the RDP 2022-2025. A roadmap would be created with clearly
defined targets and timelines for those investments and actions. The various ministries and agencies
would need to be accountable for achieving the milestones in the roadmap, and so the set of actions
must be specific and realistic. The matrix could indicate where advisory services may be required
to support work of Ministries and/or regions and municipalities in designing and implementing these
interventions.
III. If the next stages of work will lead to investments and actions for subnational development,
financial instruments for subnational competitiveness can be prepared. These financing
instruments could take the form of a subnational competitiveness fund to which regions and/or
municipalities can apply. The fund would balance the objectives of dispersing regional development
outside Tbilisi while concentrating it in nodes with the best chance of success. The fund could be
institutionalized as a window within the Municipal Development Fund (which until now has focused
mainly local infrastructure), or alternatively could be established separately by the Ministry of
Economy. Funds could be applied for by regions or municipalities through competition. Access to
the funds would be conditional on minimum access criteria (e.g. municipal and regional objectives
that are approved by the national government as being in line with the RDP; acceptable financial
management processes; etc), and perhaps can incorporate performance management through
financial bonuses for achieving agreed targets. The implementation structure for the fund could
build on lessons from the Pilot Integrated Regional Development Programmes (PIRDPs) in Georgia,
by retaining the managing authority and the structure of calls for proposals, and adding a
performance framework at regional and municipal levels.

37
4. Technical Appendix
4.1. Firm-level analysis of economic activity at the municipal level
a. Firm-level survey data
Several sections of this scoping note utilize firm-level survey data from the National Statistical
Agency in Georgia – Geostat. The survey represents 64 municipalities across the 11 regions, and was
kindly shared with the World Bank team for years 2014, 2015, 2016, 2017 and 2018.
The sampling methodology for the survey is summarized as follows:
• Full coverage of large enterprises. In the survey, large firms are defined as those either with
turnover of more than 1.5 mil. GEL or employing more than 100 employees.
• Stratified sample of other enterprises. Enterprises who fall below the revenue and the
employee threshold for large firms are sampled using a random stratified method, based on firm
size and type of economic activity.
The survey distinguishes between legal enterprises and individually registered entrepreneurs. For the
purposes of this analysis, we merged the databases for individual entrepreneurs and legal firms.
The number of observations per variable is shown in Table 4. As can be seen, the number of
observations varies by variable. This appears to be because survey respondents often do not answer all
questions in the survey. There are approximately 5,000 to 6,000 observations by variable.
Table 4: Number of observations in the Geostat firm-level survey by variable
Year
2014 2015 2016 2017 2018
Va
ria
ble
Sales 5384 6188
Employment 5384 6188
Investment 4818 5286 5184 5312 5460
Utility Burden 5085 5568 5450 5635 5799
b. Limitations
The coverage at the municipal level has some limitations due to the small size of the sample. The
survey was not designed to be representative at municipal level by sector or by firm-size, and so the results
should be treated with some degree of caution. Significance testing and predictive analysis using this data
at municipality level will be subject to a higher probability of Type 2 error (false rejection of the null
hypothesis), with a confidence interval of more than 10 percent. Table A1 shows the number of
observations per municipality.
With these limitations in mind, we have presented much of the analysis of this data in the form of
maps. The maps allow presentation of general trends, without an attempt to attribute precise figures.
We did also quantify the variation in survey results between years for each municipality. The results
indicate that most municipalities have a coefficient of variation below 0.4, but four municipalities have
coefficients of variation substantially higher (above 0.6 standard deviations.) These are small
municipalities of populations of 9,200 or less.

38
Figure A 1. Coefficient of variation of revenues 2014-2018 vs. municipal population
Source: World Bank analysis of Geostat data.
Note. Tbilisi is excluded as an outlier. Population data for some municipalities is based on the 2019 census
– except some municipalities for which data wasn’t available (Mestia, Adogenia, Shuakhevi, Vani and
Lentekhi), estimates from the 2014 census were used. The figure is based on a sample of 41 municipalities
where population data was available.
Table A 1: Number of observations per municipality
Region Municipality Observations (2018)
Tbilisi Tbilisi 2714
Adjara Aut. Rep. Batumi 574
Adjara Aut. Rep. Keda Municipality 18
Adjara Aut. Rep. Kobuleti Municipality 49
Adjara Aut. Rep. Shuakhevi Municipality 10
Adjara Aut. Rep. Khelvachauri Municipality 49
Adjara Aut. Rep. Khulo Municipality 15
Guria Lanchkhuti Municipality 28
Guria Ozurgeti Municipality 93
Guria Chokhatauri Municipality 29
Imereti Kutaisi 295
Imereti Tkibuli Municipality 14
Imereti Tskaltubo Municipality 41
Imereti Chiatura Municipality 71
Imereti Baghdati Municipality 21
Imereti Vani Municipality 9
Imereti Zestafoni Municipality 43
Imereti Terjola Municipality 30
Imereti Samtredia Municipality 26
Imereti Sachkhere Municipality 16
Imereti Kharagauli Municipality 17
Imereti Khoni Municipality 8
Kakheti Akhmeta Municipality 22
Kakheti Gurjaani Municipality 59
Kakheti Dedoplistskaro Municipality 22
Kakheti Telavi Municipality 122
Kakheti Lagodekhi Municipality 19
Kakheti Sagaredjo Municipality 48
Kakheti Sighnaghi Municipality 21

39
Kakheti Kvareli Municipality 66
Mtskheta-Mtianeti Dusheti Municipality 42
Mtskheta-Mtianeti Tianeti Municipality 16
Mtskheta-Mtianeti Mtskheta municipality 135
Mtskheta-Mtianeti Kazbegi Municipality 23
Racha-Lechkhumi and Kvemo Ambrolauri Municipality 46
Racha-Lechkhumi and Kvemo Lentekhi Municipality 12
Racha-Lechkhumi and Kvemo Oni Municipality 14
Racha-Lechkhumi and Kvemo Tsageri Municipality 20
Samegrelo and Zemo Poti 143
Samegrelo and Zemo Abasha Municipality 14
Samegrelo and Zemo Zugdidi Municipality 101
Samegrelo and Zemo Martvili Municipality 19
Samegrelo and Zemo Mestia Municipality 18
Samegrelo and Zemo Senaki Municipality 19
Samegrelo and Zemo Chkhorotsku Municipality 8
Samegrelo and Zemo Tsalenjikha Municipality 20
Samegrelo and Zemo Khobi Municipality 27
Samtskhe-Javakheti Adogeni Municipality 15
Samtskhe-Javakheti Aspindza Municipality 11
Samtskhe-Javakheti Akhalkalaki Municipality 26
Samtskhe-Javakheti Akhaltsikhe Municipality 61
Samtskhe-Javakheti Borjomi Municipality 85
Samtskhe-Javakheti Ninotsminda Municipality 18
Kvemo Kartli Rustavi 202
Kvemo Kartli Bolnisi Municipality 43
Kvemo Kartli Gardabani Municipality 97
Kvemo Kartli Dmanisi Municipality 14
Kvemo Kartli Tetritskaro Municipality 13
Kvemo Kartli Marneuli Municipality 72
Kvemo Kartli Tsalka Municipality 22
Shida Kartli Gori Municipality 138
Shida Kartli Kaspi Municipality 63
Shida Kartli Kareli Municipality 20
Shida Kartli Khashuri Municipality 62
c. Sector-based analysis
The firms represented in the survey overall covered 1,642 economic activities recorded at the 4-digit
NACE categories. For the purposes of this analysis, the following sub-sectors were excluded in the
aggregation of broad sectoral groups (see Table A2). These sectors were excluded in order to focus on
tradable goods and services.
Table A 2: Sectors excluded from the analysis on economic activity at the municipality level
02
Forestry, logging and related service activities
40 Electricity, gas, steam and hot water supply
41 Collection, purification and distribution of water
50 Sale, maintenance and repair of motor vehicles and motorcycles; retail sale of automotive fuel
51 Wholesale trade and commission trade, except of motor vehicles and motorcycles
52 Retail trade, except of motor vehicles and motorcycles; repair of personal and household goods
90 Sewage and refuse disposal, sanitation and similar activities
91 Activities of membership organizations
92 Recreational, cultural and sporting activities
93 Other service activities
95 Activities of households as employers of domestic staff
96 Undifferentiated goods producing activities of private households for own use
97 Undifferentiated services producing activities of private households for own use
99 Extra-territorial organizations and bodies

40
d. Measuring economic activity
The computation of each measure described below, aggregated at the broad-sector municipal level was
conducted using Stata 16. The estimates are weighted by sampling weights.
The measures below are represented at 11 broad-sectoral groups:
• Agriculture
• Mining
• Agri-processing
• Wine-making
• Manufacturing
• Tourism
• Logistics
• Information Technology
• Higher education
• Professional Services
• Public Sector
Revenue from sales - 2018
For each municipality, total revenue from sales were obtained at the sub-sector-municipal level and then
aggregated the 11 broad NACE categories. The sales revenue only includes the primary economic activity
of the firm. The survey item is the following “Sales or income derived from selling goods and services
(including barter) without VAT and excise.”
Growth in employment – 2018-2014
Employment growth measured the percent change in the number of employees within firms at the broader
sector level. Total number of employees were computed at the sub-sector level for each sector-
municipality and then aggregated to the broader sectoral groups separately for 2014 and 2018. The percent
change was calculated based on these totals at the broad-sector level. The survey item is the following:
“Average number of persons employed (employees, employed shareholders and employed family members
in case of family owned enterprise) in enterprise during the year.”
Outliers where the differences between the two years exceeded 150 percent were also removed from the
sample due to potential sampling issues between the two years.
Utility burden - 2018
The utility burden measures the utility expenses in ratio to the total revenue from sales by primary activity.
The total utility expenses were collapsed at the municipality level and then divided by the total number of
sales across all economic activities (total turnover) within corresponding municipality in order to
understand the utility burden for sectors. The survey item is the following: “Cost of heat, fuel and energy
used (consumed) during the reporting period, without VAT.”
Due to missing observations, this indicator is not disaggregated at the 2-digit sectors and only show
municipality-level data.
Investment – All years
Total investment was calculated within each municipality at the sub-sector level from 2014 to 2018,
including each all 5 years available in the survey. These totals covering 2014-2018 were then aggregated to
broader sector groups. The survey item is the following: “Non-financial and financial (invested for the
purpose of increasing financial assets or / and repayment of liabilities) investments made in the form of
own funds or funds attracted from other entities or transferring the property directly to the company; net
growth of unfinished goods production, finished products, raw and other materials shall also belong to
investments made in working capital; financial resources derived from sale of shares issued by the
company or other securities.”

41
Table A 3.1: Observations at the sector-region level in 2018
Table A3.2: Observations at the sector-region level in 2017
Table A3.3: Observations at the sector-region level in 2016
Table A3.4: Observations at the sector-region level in 2015
Year Region Agriculture Mining Agro-processing Wine-making Manufacturing Tourism Logistics ICT Higher education Professional
services
Public sector
2018 Tbilisi 21 9 52 19 577 169 293 110 51 1166 247
2018 Adjara AR 14 14 14 2 144 80 108 6 14 262 57
2018 Guria 18 8 2 0 25 12 23 2 1 46 13
2018 Imereti 20 90 18 3 170 24 44 15 8 140 59
2018 Kakheti 51 16 57 48 69 25 16 9 5 66 17
2018 Mtskheta-Mtianeti 17 15 14 4 45 26 19 4 1 55 16
2018 Racha-Lechkhumi and
Kvemo Svaneti
14 6 9 4 7 13 4 1 0 33 1
2018 Samegrelo-Zemo
Svaneti
23 15 15 2 70 18 110 6 3 74 33
2018 Samtskhe-Javakheti 7 16 9 1 42 23 22 5 6 68 17
2018 Kvemo Kartli 35 31 8 1 155 17 55 7 3 113 38
2018 Shida Kartli 33 12 14 5 94 17 17 8 4 53 26
Year Region Agriculture Mining Agro-processing Wine-making Manufacturing Tourism Logistics ICT Higher education Professional
services
Public sector
2017 Tbilisi 21 11 51 18 642 173 301 120 56 1159 244
2017 Adjara AR 8 13 8 2 138 73 99 11 14 224 57
2017 Guria 9 9 4 0 21 19 28 1 1 44 11
2017 Imereti 16 67 19 3 177 23 52 11 12 127 57
2017 Kakheti 29 14 59 51 66 18 16 7 6 79 22
2017 Mtskheta-Mtianeti 11 11 12 2 33 27 19 1 1 41 13
2017 Racha-Lechkhumi and
Kvemo Svaneti
15 6 6 5 9 11 8 1 0 36 1
2017 Samegrelo-Zemo
Svaneti
16 15 9 1 71 19 90 6 5 89 25
2017 Samtskhe-Javakheti 9 10 9 2 45 25 18 6 4 60 16
2017 Kvemo Kartli 24 34 6 1 147 19 39 8 3 107 39
2017 Shida Kartli 17 12 14 4 86 13 22 7 4 63 25
Year Region Agriculture Mining Agro-processing Wine-making Manufacturing Tourism Logistics ICT Higher education Professional
services
Public sector
2016 Tbilisi 28 13 39 14 546 142 279 87 66 1072 234
2016 Adjara AR 14 11 10 1 145 59 85 15 16 223 52
2016 Guria 13 8 2 0 21 17 21 2 1 51 10
2016 Imereti 19 63 16 5 179 28 34 10 11 127 54
2016 Kakheti 40 15 57 50 71 26 23 8 5 86 21
2016 Mtskheta-Mtianeti 14 10 14 5 39 29 19 3 2 53 8
2016 Racha-Lechkhumi and
Kvemo Svaneti
13 7 7 6 6 11 7 1 0 36 3
2016 Samegrelo-Zemo
Svaneti
27 11 12 1 65 24 104 7 6 77 28
2016 Samtskhe-Javakheti 11 12 8 1 32 27 18 3 4 63 14
2016 Kvemo Kartli 33 25 10 2 186 19 40 11 7 102 31
2016 Shida Kartli 29 11 13 6 75 16 19 7 5 76 21
Year Region Agriculture Mining Agro-processing Wine-making Manufacturing Tourism Logistics ICT Higher education Professional
services
Public sector
2015 Tbilisi 28 20 44 12 635 166 272 90 61 1032 298
2015 Adjara AR 16 12 4 0 134 83 81 6 12 221 52
2015 Guria 13 7 0 0 25 12 17 3 1 42 11
2015 Imereti 25 49 14 3 211 29 50 11 10 151 61
2015 Kakheti 44 18 48 43 58 21 13 2 1 71 15
2015 Mtskheta-Mtianeti 12 8 11 2 41 26 18 3 2 48 7
2015 Racha-Lechkhumi and
Kvemo Svaneti
16 7 5 2 8 6 5 0 0 33 2
2015 Samegrelo-Zemo
Svaneti
26 16 9 2 74 34 137 4 7 104 23
2015 Samtskhe-Javakheti 8 8 5 1 37 22 16 4 6 51 10
2015 Kvemo Kartli 39 24 11 0 151 23 31 12 6 135 28
2015 Shida Kartli 23 11 10 4 73 12 18 7 6 60 22

42
Table A3.5: Observations at the sector-region level in 2014
e. High-value subsectors
High-value subsectors were selected according to a global estimate of their sophistication. We used
the PRODY global index, which assigns an income value to each product. The PRODY value is calculated
as a weighted average of the GDP per capita of all countries that export each product. For this analysis, we
selected ‘high-value subsectors’ with PRODY values of more than $29,500 (this value is calculated as the
simple unweighted mean for all PRODY values globally at the 4-digit level). Applying this filter to
subsectors, in agro-processing, 9 out of 33 subsectors are deemed to be high-value (meat, dairy, prepared
foods, etc); in manufacturing, 69 out of 215 subsectors are deemed to be high-value (pharmaceuticals,
metals and machinery, furniture, electronics, etc).
Table A 4: High-value subsectors
Industry NACE
Code
Sector description
Agriculture,
livestock, and
fishing
01.21 Farming of cattle, dairy farming
01.22 Farming of sheep, goats, horses, asses, mules and hinnies
01.23 Farming of swine
01.24 Farming of poultry
Agro-processing 15.13 Production of meat and poultry meat products
15.31 Processing and preserving of potatoes
15.51 Operation of dairies and cheese making
15.71 Manufacture of prepared feeds for farm animals
15.72 Manufacture of prepared pet foods
15.84 Manufacture of cocoa; chocolate and sugar confectionery
15.88 Manufacture of homogenized food preparations and dietetic food
15.95 Manufacture of other non-distilled fermented beverages
15.96 Manufacture of beer
Wine-making 15.93 Manufacture of wines
Manufacturing 17.53 Manufacture of non-wovens and articles made from non-wovens, except apparel
17.54 Manufacture of other textiles n.e.c.
20.3 Manufacture of builders’ carpentry and joinery
20.4 Manufacture of wooden containers
21.12 Manufacture of paper and paperboard
23 Manufacture of coke, refined petroleum products and nuclear fuel
24.11 Manufacture of industrial gases
24.12 Manufacture of dyes and pigments
24.13 Manufacture of other inorganic basic chemicals
24.14 Manufacture of other organic basic chemicals
24.16 Manufacture of plastics in primary forms
24.17 Manufacture of synthetic rubber in primary forms
24.3 Manufacture of paints, varnishes and similar coatings, printing ink and mastics
24.41 Manufacture of basic pharmaceutical products
24.42 Manufacture of pharmaceutical preparations
24.51 Manufacture of soap and detergents, cleaning and polishing preparations
Year Region Agriculture Mining Agro-processing Wine-making Manufacturing Tourism Logistics ICT Higher education Professional
services
Public sector
2014 Tbilisi 27 19 45 12 475 197 289 71 44 1004 228
2014 Adjara AR 13 9 8 0 134 85 79 7 14 228 48
2014 Guria 12 10 2 0 26 12 14 3 0 35 7
2014 Imereti 20 50 16 5 160 33 26 9 7 130 60
2014 Kakheti 31 14 52 44 42 18 15 4 5 62 17
2014 Mtskheta-Mtianeti 11 9 10 3 26 29 13 2 2 43 12
2014 Racha-Lechkhumi and
Kvemo Svaneti
7 6 4 3 11 6 7 0 1 34 1
2014 Samegrelo-Zemo
Svaneti
19 13 14 2 54 17 105 3 5 104 29
2014 Samtskhe-Javakheti 10 8 8 1 31 24 16 1 4 55 11
2014 Kvemo Kartli 27 24 8 0 132 24 23 8 7 92 33
2014 Shida Kartli 22 18 14 7 55 16 20 7 7 62 27

43
24.52 Manufacture of perfumes and toilet preparations
24.62 Manufacture of glues and gelatines
24.63 Manufacture of essential oils
24.66 Manufacture of other chemical products
24.7 Manufacture of man-made fibres
25.11 Manufacture of rubber tyres and tubes
25.13 Manufacture of other rubber products
25.21 Manufacture of plastic plates, sheets, tubes and profiles
25.22 Manufacture of plastic packing goods
25.23 Manufacture of builders’ ware of plastics
25.24 Manufacture of other plastic products
26.11 Manufacture of flat glass
26.12 Shaping and processing of flat glass
26.14 Manufacture of glass fibres
26.15 Manufacture and processing of other glass, including technical glassware
26.21 Manufacture of ceramic household and ornamental articles
26.23 Manufacture of ceramic insulators and insulating fittings
26.24 Manufacture of other technical ceramic products
26.25 Manufacture of other ceramic products
26.61 Manufacture of concrete products for construction purposes
26.62 Manufacture of plaster products for construction purposes
26.81 Production of abrasive products
26.82 Manufacture of other non-metallic mineral products n.e.c.
27.1 Manufacture of basic iron and steel and of ferro-alloys
27.2 Manufacture of tubes
27.3 Other first processing of iron or steel
27.42 Aluminium production
27.51 Casting of iron
27.52 Casting of steel
28.11 Manufacture of metal structures and parts of structures
28.22 Manufacture of central heating radiators and boilers
28.3 Manufacture of steam generators, except central heating hot water boilers
28.62 Manufacture of tools
28.63 Manufacture of locks and hinges
28.71 Manufacture of steel drums and similar containers
28.73 Manufacture of wire products
28.74 Manufacture of fasteners, screw machine products, chain and springs
29 Manufacture of machinery and equipment n.e.c.
30 Manufacture of office machinery and computers
31.62 Manufacture of other electrical equipment n.e.c.
32 Manufacture of radio, television and communication equipment and apparatus
33 Manufacture of medical, precision and optical instruments, watches and clocks
34 Manufacture of motor vehicles, trailers and semi-trailers
35.1 Building and repairing of ships and boats
35.2 Manufacture of railway and tramway locomotives and rolling stock
35.3 Manufacture of aircraft and spacecraft
35.41 Manufacture of motorcycles
35.5 Manufacture of other transport equipment n.e.c.
36.11 Manufacture of chairs and seats
36.13 Manufacture of other kitchen furniture
36.21 Striking of coins
36.3 Manufacture of musical instruments
36.4 Manufacture of sports goods
36.5 Manufacture of games and toys
ICT 72 Computer and related activities
Higher education
in STEM
73 Research and development
74.3 Technical testing and analysis
Professional
services
65 Financial intermediation, except insurance and pension funding
66 Insurance and pension funding, except compulsory social security
67 Activities auxiliary to financial intermediation
70 Real estate activities
74.1 Legal, accounting, book-keeping and auditing activities; tax consultancy; market
research and public opinion polling; business and management consultancy; holdings
74.2 Architectural and engineering activities and related technical consultancy
74.4 Advertising

44
4.2. Coefficient of variation of regional inequality
The objective of the coefficient of variation analysis is to compare the divergence of income per capita
across Georgia’s regions to the regional divergence in comparator countries. The coefficient of variation is
computed by diving the standard deviation of regional income per capita measured in local currency, by
the average income per capita across regions:
𝜇 =∑𝑖𝑛𝑐𝑜𝑚𝑒𝑝𝑒𝑟𝑐𝑎𝑝𝑖𝑡𝑎
𝑛𝑟𝑒𝑔𝑖𝑜𝑛
𝜕 =√∑(𝑥− 𝜇)2
𝑛−1
CV= 𝜕/𝜇
Five comparator countries were chosen for the analysis, based on geographic proximity, level of income,
and availability of data: Armenia, Bulgaria, Hungary, Poland and Turkey. The data sources primarily used
were the National Statistical Agencies of respective countries or OECD data. Only while comparing with
Armenia, we used the distribution of average monthly wages (unadjusted for PPP) as our comparison
indicator due to data availability restrictions.
4.3. Disruption of economy activity during Covid-19
We used the magnitudes for changes in the stock performance across sectors to estimate how they would
impact the Georgian economy. The companies listed under the MSCI index were grouped into broader
sector groups. For this analysis, these sectors listed under the MSCI index were mapped on to the 2-digit
NACE sectors in the Geostat survey where applicable, using Geostat 2018 survey data. The estimated
impact at the 2 digit-level sectors were later applied to the sub-sectors. For example, for food
manufacturing firms, the stock market performance was subdued by -5 percent. Thus, we applied the -5
percent coefficient across all food manufacturers in the survey data, as a proxy of disruption in economic
activity.
The magnitude of the change based on the MSCI index was applied to sales (only including the primary
activity) in order to determine the impact on the sales.
Table A 5: Magnitude of the Covid-19 disruption by selected sectors
NACE
Code Sector description
Magnitude of the
disruption (%)
13.20 Mining of non-ferrous metal ores, except uranium and thorium ores -23
15.10 Production, processing and preserving of meat and meat products -5
15.11 Production and preserving of meat -5
15.12 Production and preserving of poultrymeat -5
15.13 Production of meat and poultrymeat products -5
15.2 Processing and preserving of fish and fish products -5
15.2 Processing and preserving of fish and fish products -5
15.3 Processing and preserving of fruit and vegetables -5
15.31 Processing and preserving of potatoes -5
15.32 Manufacture of fruit and vegetable juice -5
15.33 Processing and preserving of fruit and vegetables n.e.c. -5
15.4 Manufacture of vegetable and animal oils and fats -5
15.41 Manufacture of crude oils and fats -5
15.42 Manufacture of refined oils and fats -5
15.43 Manufacture of margarine and similar edible fats -5
15.50 Manufacture of dairy products -5
15.51 Operation of dairies and cheese making -5
15.52 Manufacture of ice cream -5
15.60 Manufacture of grain mill products, starches and starch products -5
15.61 Manufacture of grain mill products -5
15.62 Manufacture of starches and starch products -5

45
15.70 Manufacture of prepared animal feeds -5
15.71 Manufacture of prepared feeds for farm animals -5
15.72 Manufacture of prepared pet foods -5
15.8 Manufacture of other food products -5
15.81 Manufacture of bread; manufacture of fresh pastry goods and cakes -5
15.82 Manufacture of rusks and biscuits; manufacture of preserved pastry goods and cakes -5
15.83 Manufacture of sugar -5
15.84 Manufacture of cocoa; chocolate and sugar confectionery -5
15.85 Manufacture of macaroni, noodles, couscous and similar farinaceous products -5
15.86 Processing of tea and coffee -5
15.87 Manufacture of condiments and seasonings -5
15.88 Manufacture of homogenized food preparations and dietetic food -5
15.89 Manufacture of other food products n.e.c. -5
15.9 Manufacture of beverages -5
15.9 Manufacture of beverages -17
15.91 Manufacture of distilled potable alcoholic beverages -5
15.92 Production of ethyl alcohol from fermented materials -5
15.93 Manufacture of wines -5
15.94 Manufacture of cider and other fruit wines -5
15.95 Manufacture of other non-distilled fermented beverages -5
15.96 Manufacture of beer -5
15.97 Manufacture of malt -5
16 Tobacco -16
24 Manufacture of chemicals and chemical products -15
27.41 Precious metals production 44
50
Sale, maintenance and repair of motor vehicles and motorcycles; retail sale of automotive
fuel -10
50.1 Sale of motor vehicles -10
50.2 Maintenance and repair of motor vehicles -10
50.3 Sale of motor vehicle parts and accessories -10
50.4 Sale, maintenance and repair of motorcycles and related parts and accessories -10
50.5 Retail sale of automotive fuel -10
51.4 Wholesale of household goods -7
51.41 Wholesale of textiles -7
51.42 Wholesale of clothing and footwear -7
51.43 Wholesale of electrical household appliances and radio and television goods -7
51.44 Wholesale of china and glassware, wallpaper and cleaning materials -7
51.45 Wholesale of perfume and cosmetics -7
51.46 Wholesale of pharmaceutical goods -7
51.47 Wholesale of other household goods -7
52.11 Retail sale in non-specialized stores with food, beverages or tobacco predominating -2
52.2 Retail sale of food, beverages and tobacco in specialized stores -2
52.2 Retail sale of food, beverages and tobacco in specialized stores -8
55.1 Hotels -38
55.2 Camping sites and other provision of short-stay accommodation -38
55.3 Restaurants -21
55.4 Bars -21
60 Land transport; transport via pipelines -16
60.1 Transport via railways -16
60.1 Transport via railways -16
60.2 Other land transport -16
60.21 Other scheduled passenger land transport -16
60.22 Taxi operation -16
60.23 Other land passenger transport -16
60.24 Freight transport by road -16
60.30 Transport via pipelines -16
64 Post and telecommunications -3
64.11 National post activities -3
64.12 Courier activities other than national post activities -3
64.20 Telecommunications -3
65 Financial intermediation, except insurance and pension funding -33
67.11 investment -9
72.20 Software consultancy and supply 6
72.21 Publishing of software -3
72.22 Other software consultancy and supply -3
72.30 Data processing -3
72.40 Database activities -3
74.50 Labour recruitment and provision of personnel -19

46
85.00 Health and social work -6
85.10 Human health activities -6
85.11 Hospital activities -6
85.12 Medical practice activities -6
85.13 Dental practice activities -6
85.14 Other human health activities -6
85.20 Veterinary activities -6
85.3 Social work activities -6
85.31 Social work activities with accommodation -6
85.32 Social work activities without accommodation -6
Recommended


