Prepared by
7/1/2020
Seven Year Student Population Projections
By Residence
Fall 2020-2026
(Based on Fall 2019 Data)
SY2019/20 Demographic Report
TABLE OF CONTENTS
Introduction and District Background
Executive Summary Table 1: Projected Districtwide Enrollment Student Populations (SY2020 – SY2026)
Section One: Methodology 1
Sources of Data 1
Table 2: Student Accounting Summary 2
Chart 1: Student Population SY2019 by Race 2
Maps 1 -6: Student Population SY2019 by Race 3
Map 7: Active or Planned Residential Development 9
Seven-Year Projection Methodology 10
Projection Variables 11
Table 3: Birth Factors used in Projections 11
Table 4: Mobility Factors by Elementary Attendance Area 13
Table 5: Student Yield factors Used for 2019/20 Projections 14
Applying the Variables to the Generate Projections 16
Chart 2: Projections by Residence Flowchart 17
Section Two: Planned Residential Development 18
Chart 3: Active or Planned Housing Projects in VUSD (2019) 18
Map 8: Active or Planned Residential Development in VUSD 19
Table 6: Active or Planned Residential Development in VUSD 20
Section Three: Attendance Matrices 22
Table 7: K-5 Elementary School Attendance Matrix 23
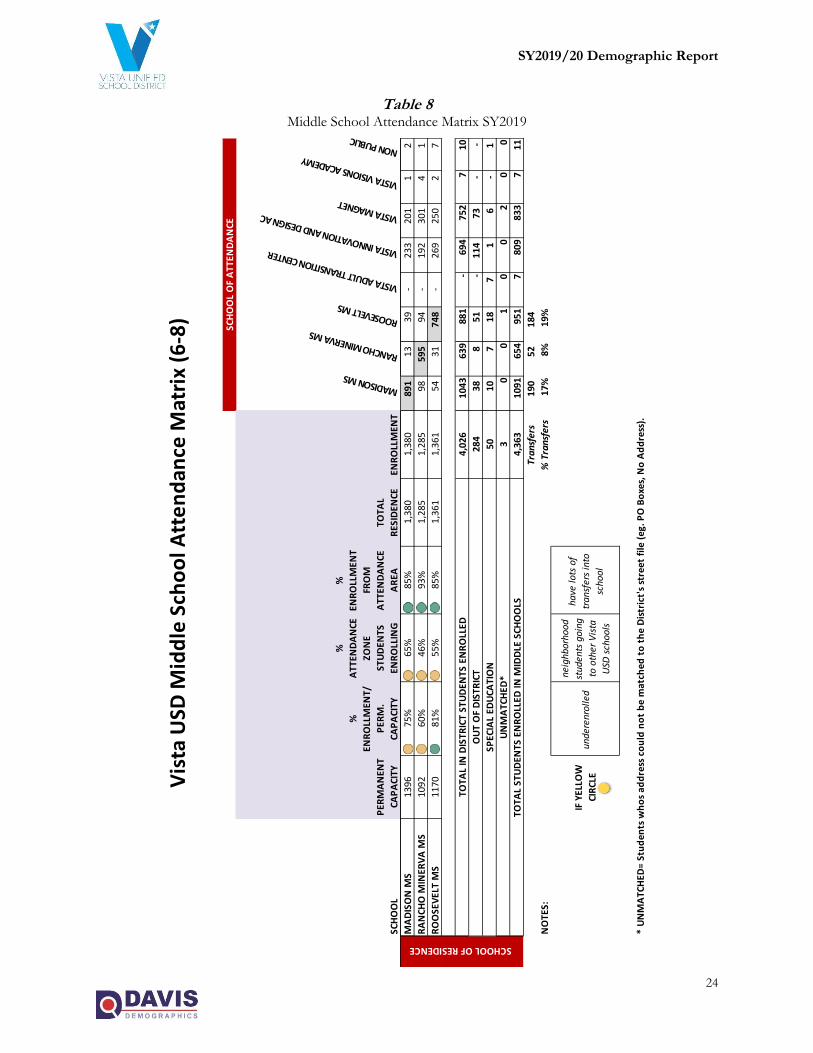
Table 8: Middle School Attendance Matrix 24
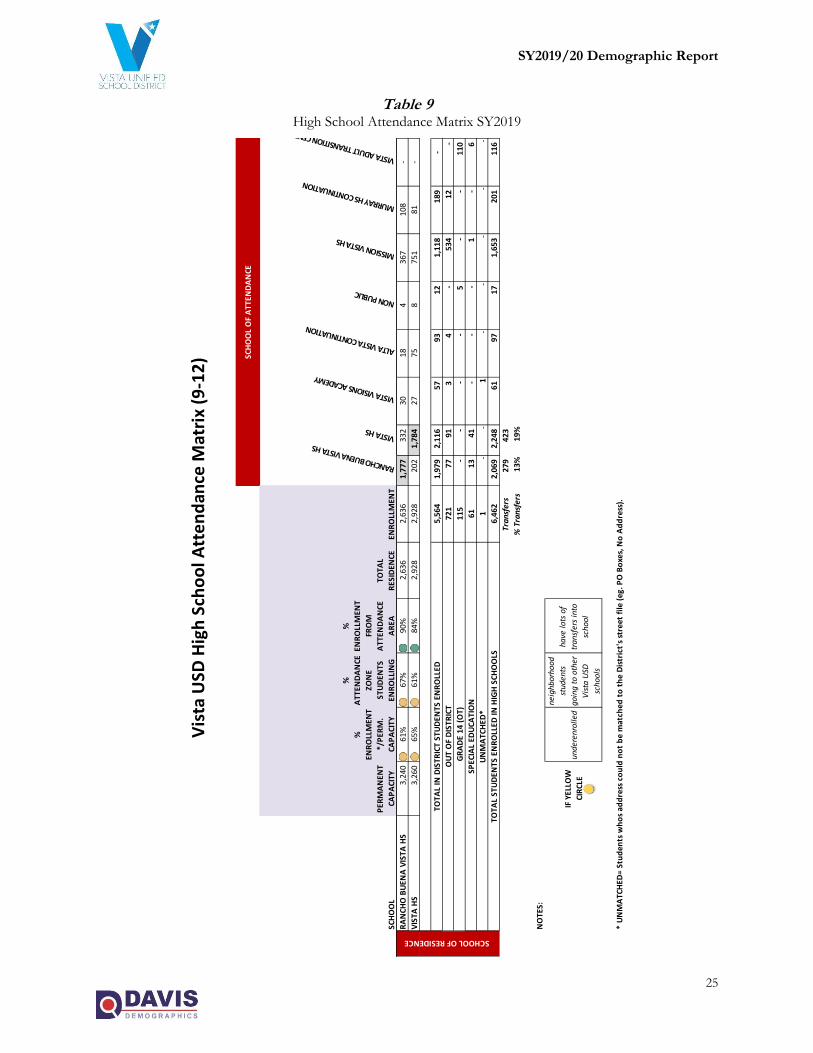
Table 9: High School Attendance Matrix 25
Section Four: District-Wide Student Projections 26
Table 10: Projected Resident Students in VUSD (SY2020 – SY2026) 26
Chart 4: District Historic Enrollment and Seven-Year Projections 27
Chart 5: District Historic and Projected Student Distribution 27
Section Five: Attendance Area Projections by Residence 29
Elementary Student Population Projections Trends 29
Chart 6: Historic Elementary Enrollment and Seven-Year Projections 29
Chart 7: Forecasted Change in Elementary Attendance Areas SY2019 – SY2026 30
Maps 9: Projected Elementary School Projected Change 38
Table 11: Projected Resident Elementary School Students by Attendance Area 39
Middle School Student Population Projections Trends 43
Chart 8: Historic and Projected Resident Middle School Students SY2020 – SY2026 43
Maps 10: Projected Middle School Projected Change 46
Table 13: Projected Resident Middle School Students by Attendance Area 47
High School Student Population Projections Trends 48
Chart 9: Historic and Projected Resident High School Students SY2020 – SY2026 48
Chart 10: Average High School Class Size 49
Maps 11: Projected High School Projected Change 52
Table 13: Projected Resident High School Students by Attendance Area 53
SY2019/20 Demographic Report
INTRODUCTION
INTRODUCTION AND DISTRICT BACKGROUND
The Vista Unified School District (VUSD) has contracted with Davis Demographics (DDP) to develop and analyze demographic data relevant to the District’s facility planning efforts. The scope of contracted work includes: updating District mapping files, analyzing the District’s past four years of geocoded student data files, developing and researching pertinent demographic data in and around the District, identifying current and future residential development plans and preparing a Seven-Year student population projection.
The purpose of this report is to identify and inform the District of the demographic trends occurring within the community; how these trends may affect future student populations; and to assist the District in making facility adjustments that may be necessary to accommodate the potential student population shifts and the need for potential attendance area boundary changes and/or the construction of additional capacity.
VUSD has contracted with DDP, a non-biased third-party consultant, to prepare an annual Seven-Year demographic study. In this study, DDP produces detailed neighborhood and attendance area population projections based on the residential address of Vista USD students. DDP bases its projections on the belief that school facility planning is more accurate when facilities are located where the greatest number of students live or will live in the future. This study is intended to help the District notice specific demographic trends that could assist them in making informed decisions regarding long-range planning efforts.
The Sources of Data section details how the two sources of data, both geographic and non-geographic, are collected and used in the Seven-Year student population projection model.
The Seven-Year Projection Methodology section discusses, in detail, how the factors used in the study are calculated, and how they are used. These factors include area birthrates, and their effect on incoming kindergarten classes; the effects of student mobility within and out of the District; student yield factors, based on historic housing data and trends; and a detailed view of future residential development within the District.
The Student Resident Projection Summary sections offer a review of this year's student resident projection results. Included in these sections are the district-wide student population projection summary and a projected resident student population summary for each of the existing attendance areas and of the individual Study Areas from which they were calculated.
While reading this report, it is important to remember that it is based on data gathered during the last several months of 2019. Because population demographics, development plans, funding opportunities and District priorities are all subject to change, it is recommended that these factors are re-evaluated on an annual basis, with new Seven-Year resident projections produced annually.
SY2019/20 Demographic Report
EXECUTIVE SUMMARY
EXECUTIVE SUMMARY
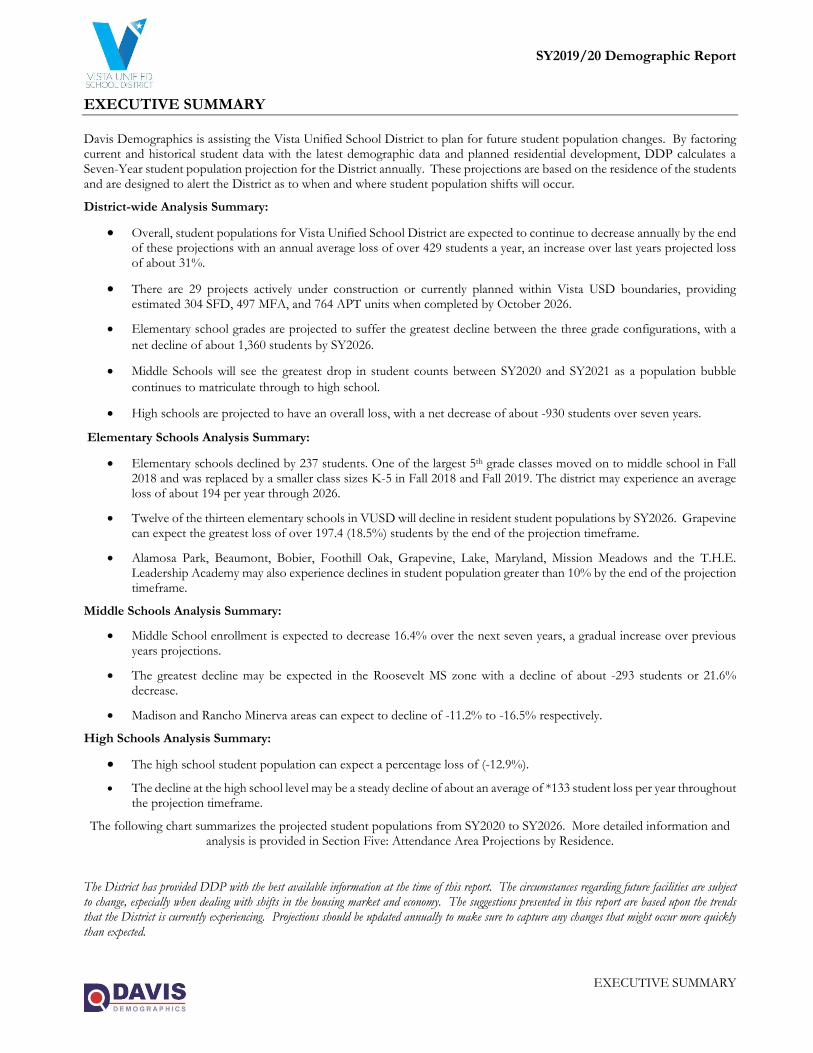
Davis Demographics is assisting the Vista Unified School District to plan for future student population changes. By factoring current and historical student data with the latest demographic data and planned residential development, DDP calculates a Seven-Year student population projection for the District annually. These projections are based on the residence of the students and are designed to alert the District as to when and where student population shifts will occur.
District-wide Analysis Summary:
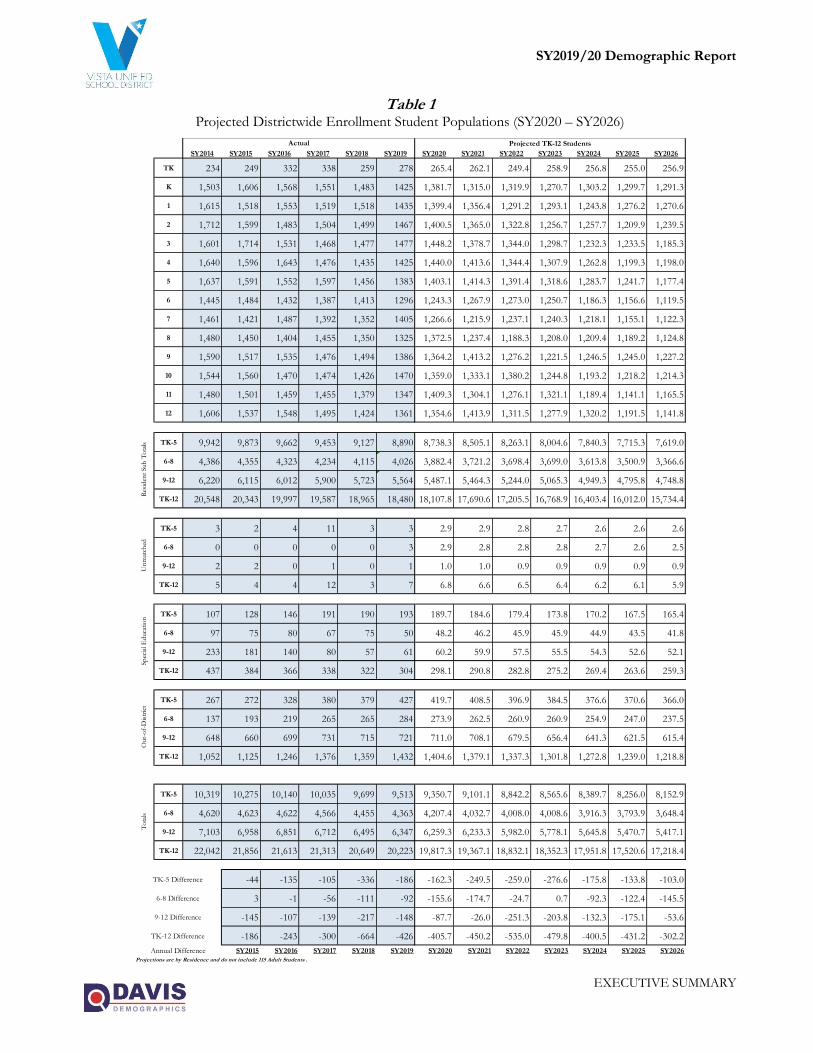
• Overall, student populations for Vista Unified School District are expected to continue to decrease annually by the end of these projections with an annual average loss of over 429 students a year, an increase over last years projected loss of about 31%.
• There are 29 projects actively under construction or currently planned within Vista USD boundaries, providing estimated 304 SFD, 497 MFA, and 764 APT units when completed by October 2026.
• Elementary school grades are projected to suffer the greatest decline between the three grade configurations, with a
net decline of about 1,360 students by SY2026.
• Middle Schools will see the greatest drop in student counts between SY2020 and SY2021 as a population bubble
continues to matriculate through to high school.
• High schools are projected to have an overall loss, with a net decrease of about -930 students over seven years.
Elementary Schools Analysis Summary:
• Elementary schools declined by 237 students. One of the largest 5th grade classes moved on to middle school in Fall 2018 and was replaced by a smaller class sizes K-5 in Fall 2018 and Fall 2019. The district may experience an average loss of about 194 per year through 2026.
• Twelve of the thirteen elementary schools in VUSD will decline in resident student populations by SY2026. Grapevine can expect the greatest loss of over 197.4 (18.5%) students by the end of the projection timeframe.
• Alamosa Park, Beaumont, Bobier, Foothill Oak, Grapevine, Lake, Maryland, Mission Meadows and the T.H.E. Leadership Academy may also experience declines in student population greater than 10% by the end of the projection timeframe.
Middle Schools Analysis Summary:
• Middle School enrollment is expected to decrease 16.4% over the next seven years, a gradual increase over previous years projections.
• The greatest decline may be expected in the Roosevelt MS zone with a decline of about -293 students or 21.6% decrease.
• Madison and Rancho Minerva areas can expect to decline of -11.2% to -16.5% respectively.
High Schools Analysis Summary:
• The high school student population can expect a percentage loss of (-12.9%).
• The decline at the high school level may be a steady decline of about an average of *133 student loss per year throughout the projection timeframe.
The following chart summarizes the projected student populations from SY2020 to SY2026. More detailed information and analysis is provided in Section Five: Attendance Area Projections by Residence.
The District has provided DDP with the best available information at the time of this report. The circumstances regarding future facilities are subject to change, especially when dealing with shifts in the housing market and economy. The suggestions presented in this report are based upon the trends that the District is currently experiencing. Projections should be updated annually to make sure to capture any changes that might occur more quickly than expected.
SY2019/20 Demographic Report
EXECUTIVE SUMMARY
Table 1 Projected Districtwide Enrollment Student Populations (SY2020 – SY2026)
SY2014 SY2015 SY2016 SY2017 SY2018 SY2019 SY2020 SY2021 SY2022 SY2023 SY2024 SY2025 SY2026
TK 234 249 332 338 259 278 265.4 262.1 249.4 258.9 256.8 255.0 256.9
K 1,503 1,606 1,568 1,551 1,483 1425 1,381.7 1,315.0 1,319.9 1,270.7 1,303.2 1,299.7 1,291.3
1 1,615 1,518 1,553 1,519 1,518 1435 1,399.4 1,356.4 1,291.2 1,293.1 1,243.8 1,276.2 1,270.6
2 1,712 1,599 1,483 1,504 1,499 1467 1,400.5 1,365.0 1,322.8 1,256.7 1,257.7 1,209.9 1,239.5
3 1,601 1,714 1,531 1,468 1,477 1477 1,448.2 1,378.7 1,344.0 1,298.7 1,232.3 1,233.5 1,185.3
4 1,640 1,596 1,643 1,476 1,435 1425 1,440.0 1,413.6 1,344.4 1,307.9 1,262.8 1,199.3 1,198.0
5 1,637 1,591 1,552 1,597 1,456 1383 1,403.1 1,414.3 1,391.4 1,318.6 1,283.7 1,241.7 1,177.4
6 1,445 1,484 1,432 1,387 1,413 1296 1,243.3 1,267.9 1,273.0 1,250.7 1,186.3 1,156.6 1,119.5
7 1,461 1,421 1,487 1,392 1,352 1405 1,266.6 1,215.9 1,237.1 1,240.3 1,218.1 1,155.1 1,122.3
8 1,480 1,450 1,404 1,455 1,350 1325 1,372.5 1,237.4 1,188.3 1,208.0 1,209.4 1,189.2 1,124.8
9 1,590 1,517 1,535 1,476 1,494 1386 1,364.2 1,413.2 1,276.2 1,221.5 1,246.5 1,245.0 1,227.2
10 1,544 1,560 1,470 1,474 1,426 1470 1,359.0 1,333.1 1,380.2 1,244.8 1,193.2 1,218.2 1,214.3
11 1,480 1,501 1,459 1,455 1,379 1347 1,409.3 1,304.1 1,276.1 1,321.1 1,189.4 1,141.1 1,165.5
12 1,606 1,537 1,548 1,495 1,424 1361 1,354.6 1,413.9 1,311.5 1,277.9 1,320.2 1,191.5 1,141.8
TK-5 9,942 9,873 9,662 9,453 9,127 8,890 8,738.3 8,505.1 8,263.1 8,004.6 7,840.3 7,715.3 7,619.0
6-8 4,386 4,355 4,323 4,234 4,115 4,026 3,882.4 3,721.2 3,698.4 3,699.0 3,613.8 3,500.9 3,366.6
9-12 6,220 6,115 6,012 5,900 5,723 5,564 5,487.1 5,464.3 5,244.0 5,065.3 4,949.3 4,795.8 4,748.8
TK-12 20,548 20,343 19,997 19,587 18,965 18,480 18,107.8 17,690.6 17,205.5 16,768.9 16,403.4 16,012.0 15,734.4
TK-5 3 2 4 11 3 3 2.9 2.9 2.8 2.7 2.6 2.6 2.6
6-8 0 0 0 0 0 3 2.9 2.8 2.8 2.8 2.7 2.6 2.5
9-12 2 2 0 1 0 1 1.0 1.0 0.9 0.9 0.9 0.9 0.9
TK-12 5 4 4 12 3 7 6.8 6.6 6.5 6.4 6.2 6.1 5.9
TK-5 107 128 146 191 190 193 189.7 184.6 179.4 173.8 170.2 167.5 165.4
6-8 97 75 80 67 75 50 48.2 46.2 45.9 45.9 44.9 43.5 41.8
9-12 233 181 140 80 57 61 60.2 59.9 57.5 55.5 54.3 52.6 52.1
TK-12 437 384 366 338 322 304 298.1 290.8 282.8 275.2 269.4 263.6 259.3
TK-5 267 272 328 380 379 427 419.7 408.5 396.9 384.5 376.6 370.6 366.0
6-8 137 193 219 265 265 284 273.9 262.5 260.9 260.9 254.9 247.0 237.5
9-12 648 660 699 731 715 721 711.0 708.1 679.5 656.4 641.3 621.5 615.4
TK-12 1,052 1,125 1,246 1,376 1,359 1,432 1,404.6 1,379.1 1,337.3 1,301.8 1,272.8 1,239.0 1,218.8
TK-5 10,319 10,275 10,140 10,035 9,699 9,513 9,350.7 9,101.1 8,842.2 8,565.6 8,389.7 8,256.0 8,152.9
6-8 4,620 4,623 4,622 4,566 4,455 4,363 4,207.4 4,032.7 4,008.0 4,008.6 3,916.3 3,793.9 3,648.4
9-12 7,103 6,958 6,851 6,712 6,495 6,347 6,259.3 6,233.3 5,982.0 5,778.1 5,645.8 5,470.7 5,417.1
TK-12 22,042 21,856 21,613 21,313 20,649 20,223 19,817.3 19,367.1 18,832.1 18,352.3 17,951.8 17,520.6 17,218.4
-44 -135 -105 -336 -186 -162.3 -249.5 -259.0 -276.6 -175.8 -133.8 -103.0
3 -1 -56 -111 -92 -155.6 -174.7 -24.7 0.7 -92.3 -122.4 -145.5
-145 -107 -139 -217 -148 -87.7 -26.0 -251.3 -203.8 -132.3 -175.1 -53.6
-186 -243 -300 -664 -426 -405.7 -450.2 -535.0 -479.8 -400.5 -431.2 -302.2
SY2015 SY2016 SY2017 SY2018 SY2019 SY2020 SY2021 SY2022 SY2023 SY2024 SY2025 SY2026Projections are by Residence and do not include 115 Adult Students .
Annual Difference
Projected TK-12 StudentsR
esid
ent
Sub
To
tals
Un
mat
ched
Out-
of-
Dis
tric
tT
ota
lsSp
ecia
l E
duca
tio
n
6-8 Difference
TK-5 Difference
9-12 Difference
TK-12 Difference
Actual
SY2019/20 Demographic Report
1
SECTION ONE: METHODOLOGY
SOURCES OF DATA
A. Geographic Map Data
Five geographic data layers were modified or created for use in the Seven-Year student population projections:
1. Street Centerline Database / Address Points 2. Study Areas 3. Schools 4. Vista USD Students – Historic and Current 5. Active or Planned Residential Development
1) Street Centerline Data / Address Points
The main function of this data file is in the geocoding process of the student data. The geocoding process places a point on the map for every student in the exact location that student resides. Each student is geocoded to the streets by their given residence address. This enables DDP to analyze student data in a geographic manner.
2) Study Areas
Study Areas are small geographic areas, similar to neighborhoods or portions of neighborhoods, and are the building blocks of school district attendance areas. Study Areas are geographically defined following logical boundaries of the neighborhood such as freeways, streets, railroad tracks, or green space. Each Study Area is then coded with the corresponding elementary, middle, and high schools that the students in the area are assigned to attend. By gathering information about the district at the Study Area level, DDP and the District can closely monitor growth and demographic trends in particular regions and identify potential need for boundary or facility adjustments. Currently, 345 Study Areas make up the Vista USD boundary.
3) Schools
School facility information including school name, address, unique identifying code, grade ranges, and permanent capacity were provided to DDP by District staff.
4) Student Data
a. Historic Student Data - Historic population data is used to compare past student population trends as well as the effects of mobility (student movement in or out of existing housing) throughout the District. The District provided the last three years of student data (SY2016 - SY2019) to serve as the basis for calculating student Mobility Factors.
b. Current Student Data - A student data file representing student membership on the first CBEDS reporting (October 2019) was provided to DDP by District staff. This data was summarized by grade level and each student was located by residential address to identify current Study Area populations. This data is used as a base for student population projections. The projections run each of the next seven years from SY2020 through SY2026.
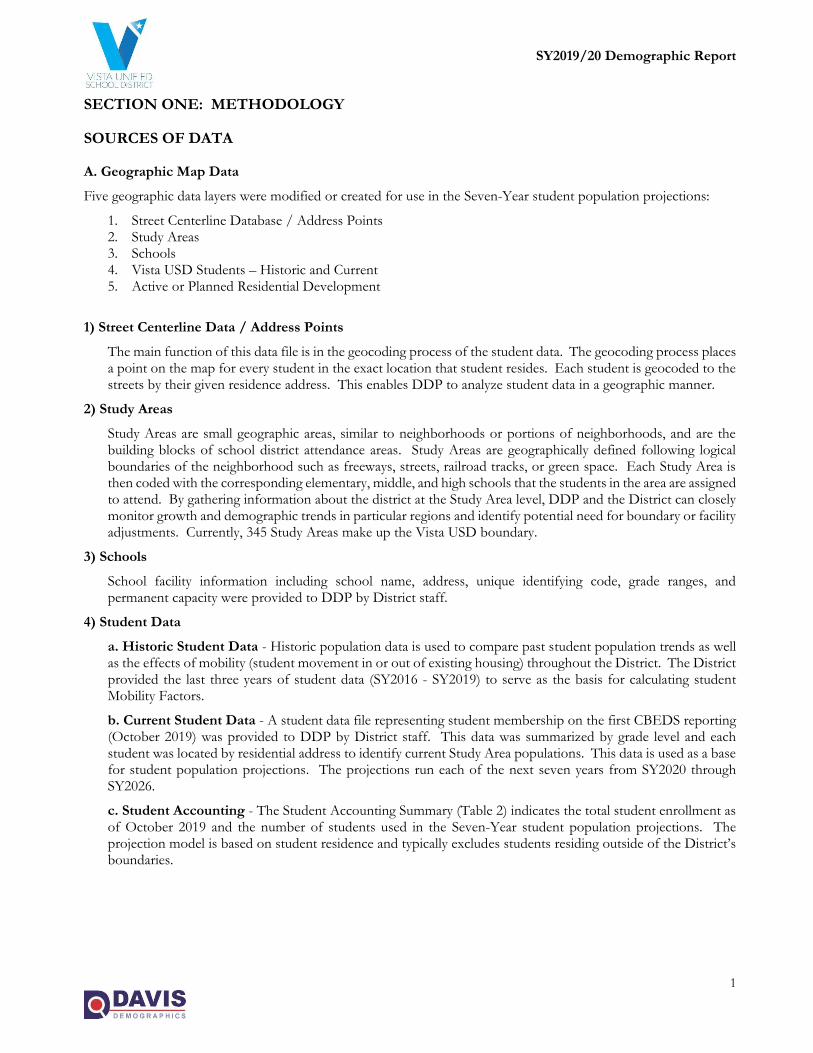
c. Student Accounting - The Student Accounting Summary (Table 2) indicates the total student enrollment as of October 2019 and the number of students used in the Seven-Year student population projections. The projection model is based on student residence and typically excludes students residing outside of the District’s boundaries.
SY2019/20 Demographic Report
2
Table 2 Student Accounting Summary
School Year 2019-20 Actual Enrollment (representing October 2019)
All Vista USD Students (Provided by District File) 20,338
Out of District Students -1,432
Adult Students -115
Special Education Students -304
Unmatched Students -7
VUSD RESIDENT STUDENTS USED IN THE PROJECTIONS 18,965
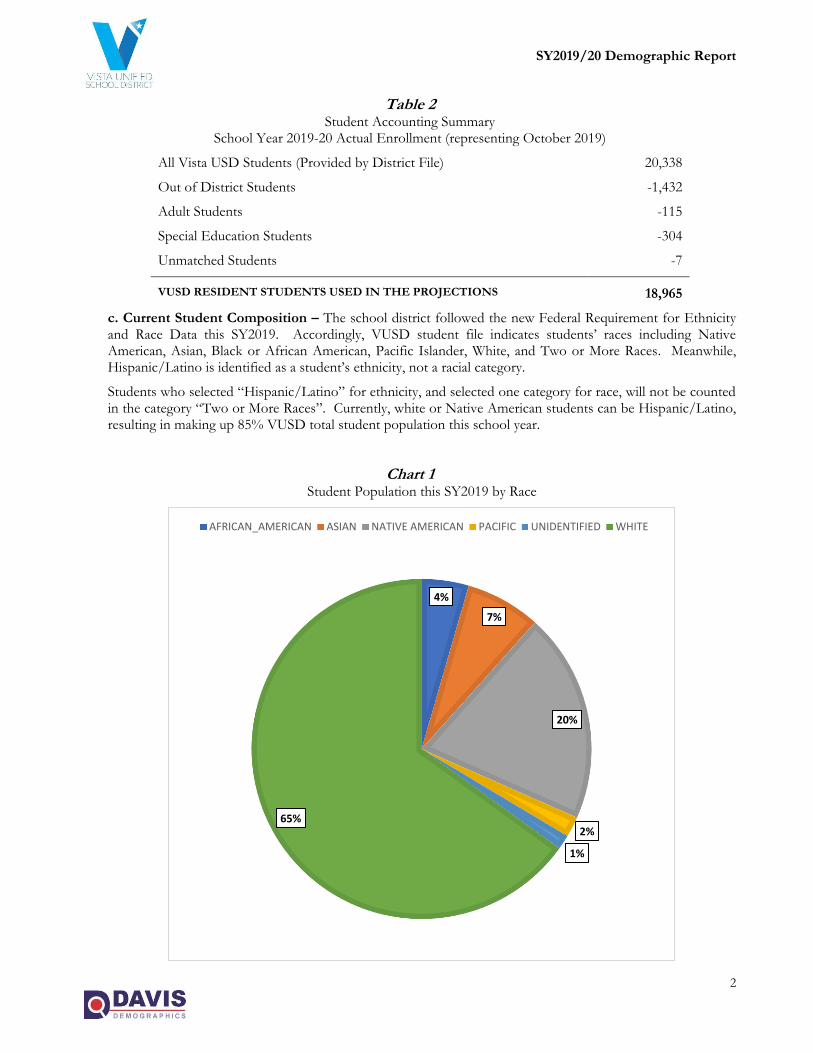
c. Current Student Composition – The school district followed the new Federal Requirement for Ethnicity and Race Data this SY2019. Accordingly, VUSD student file indicates students’ races including Native American, Asian, Black or African American, Pacific Islander, White, and Two or More Races. Meanwhile, Hispanic/Latino is identified as a student’s ethnicity, not a racial category.
Students who selected “Hispanic/Latino” for ethnicity, and selected one category for race, will not be counted in the category “Two or More Races”. Currently, white or Native American students can be Hispanic/Latino, resulting in making up 85% VUSD total student population this school year.
Chart 1 Student Population this SY2019 by Race
4%
7%
20%
2%
1%
65%
AFRICAN_AMERICAN ASIAN NATIVE AMERICAN PACIFIC UNIDENTIFIED WHITE
SY2019/20 Demographic Report
3
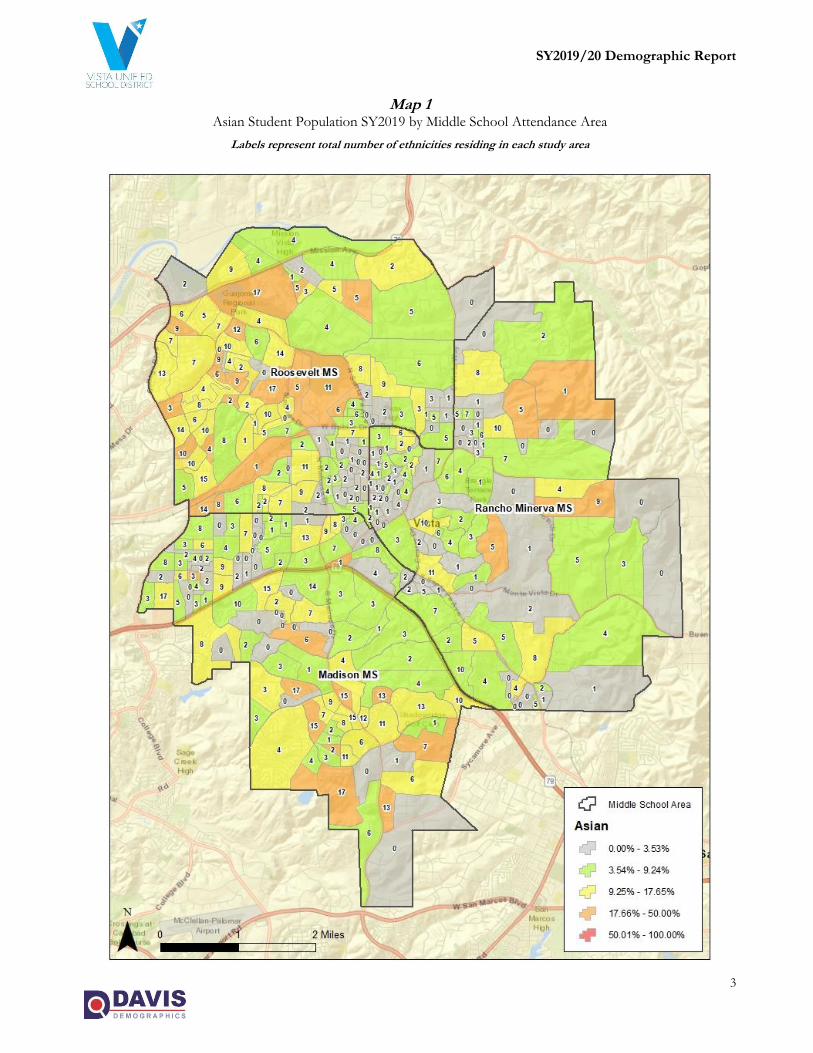
Map 1 Asian Student Population SY2019 by Middle School Attendance Area
Labels represent total number of ethnicities residing in each study area
SY2019/20 Demographic Report
4
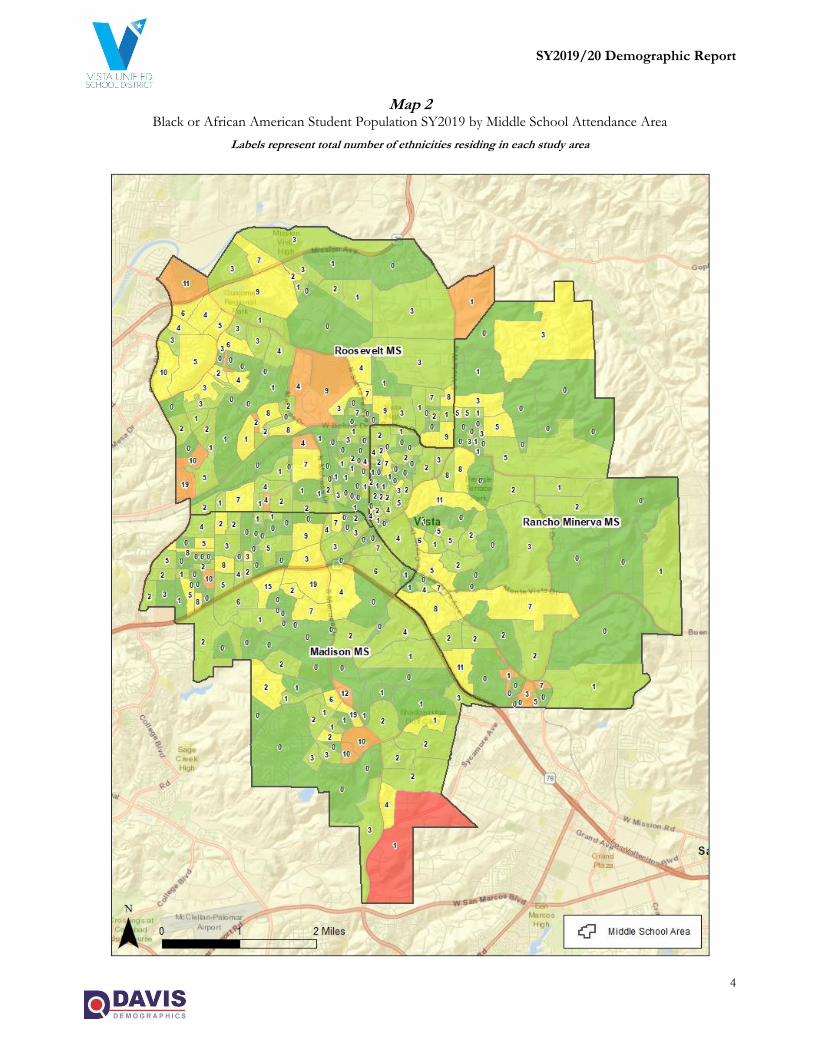
Map 2 Black or African American Student Population SY2019 by Middle School Attendance Area
Labels represent total number of ethnicities residing in each study area
SY2019/20 Demographic Report
5
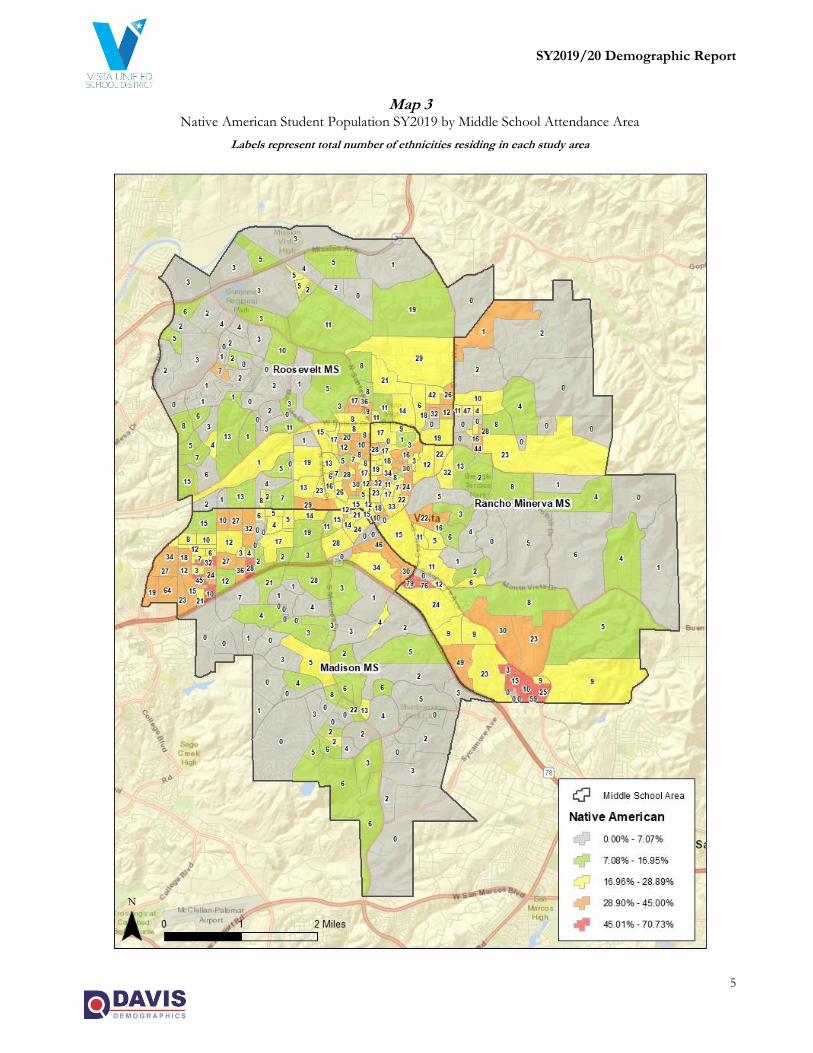
Map 3 Native American Student Population SY2019 by Middle School Attendance Area
Labels represent total number of ethnicities residing in each study area
SY2019/20 Demographic Report
6
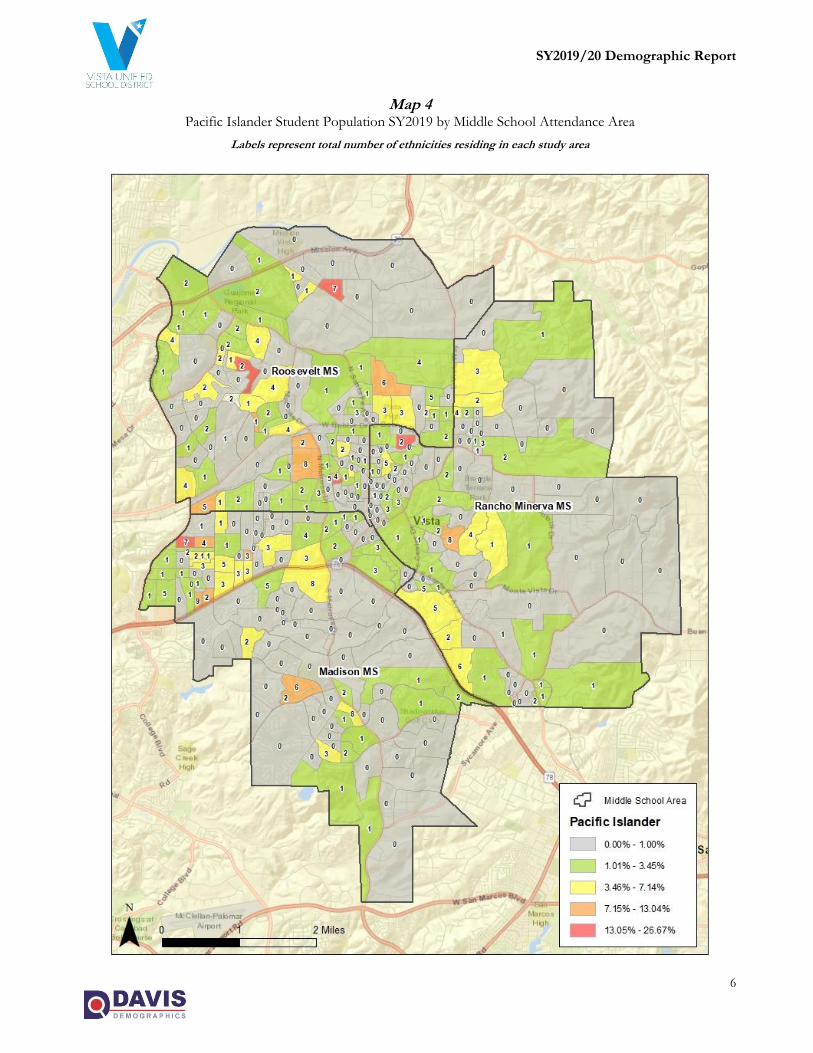
Map 4 Pacific Islander Student Population SY2019 by Middle School Attendance Area
Labels represent total number of ethnicities residing in each study area
SY2019/20 Demographic Report
7
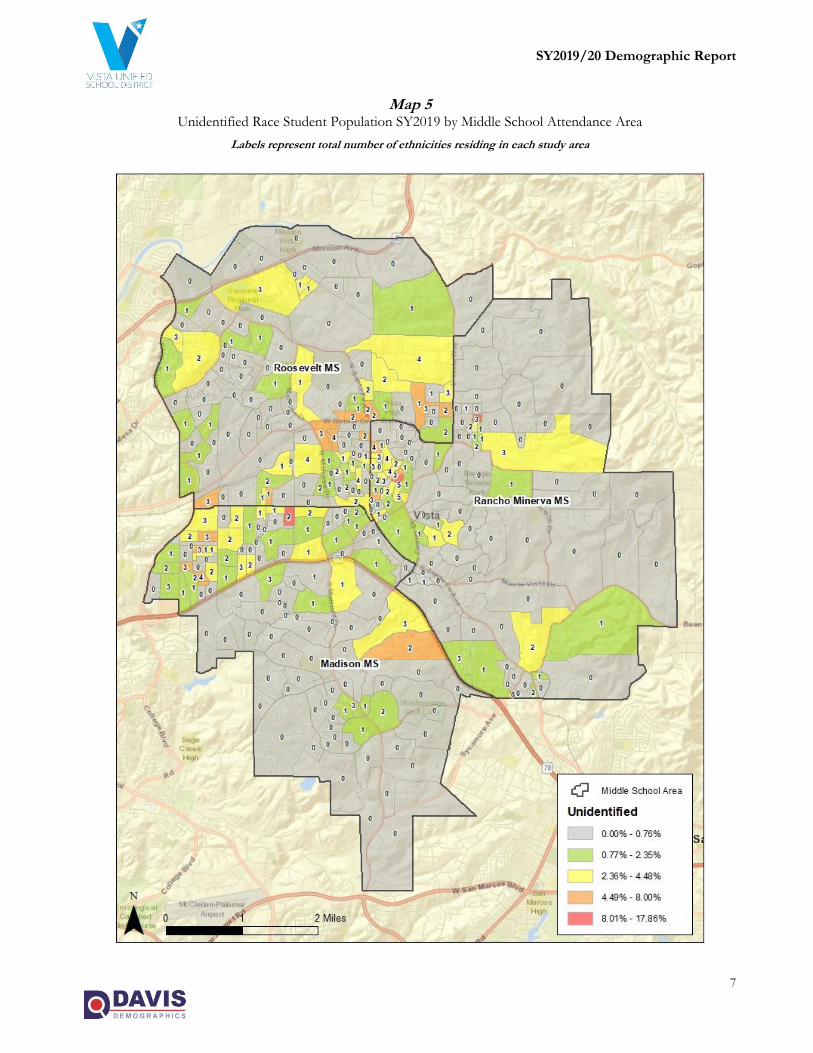
Map 5 Unidentified Race Student Population SY2019 by Middle School Attendance Area
Labels represent total number of ethnicities residing in each study area
SY2019/20 Demographic Report
8
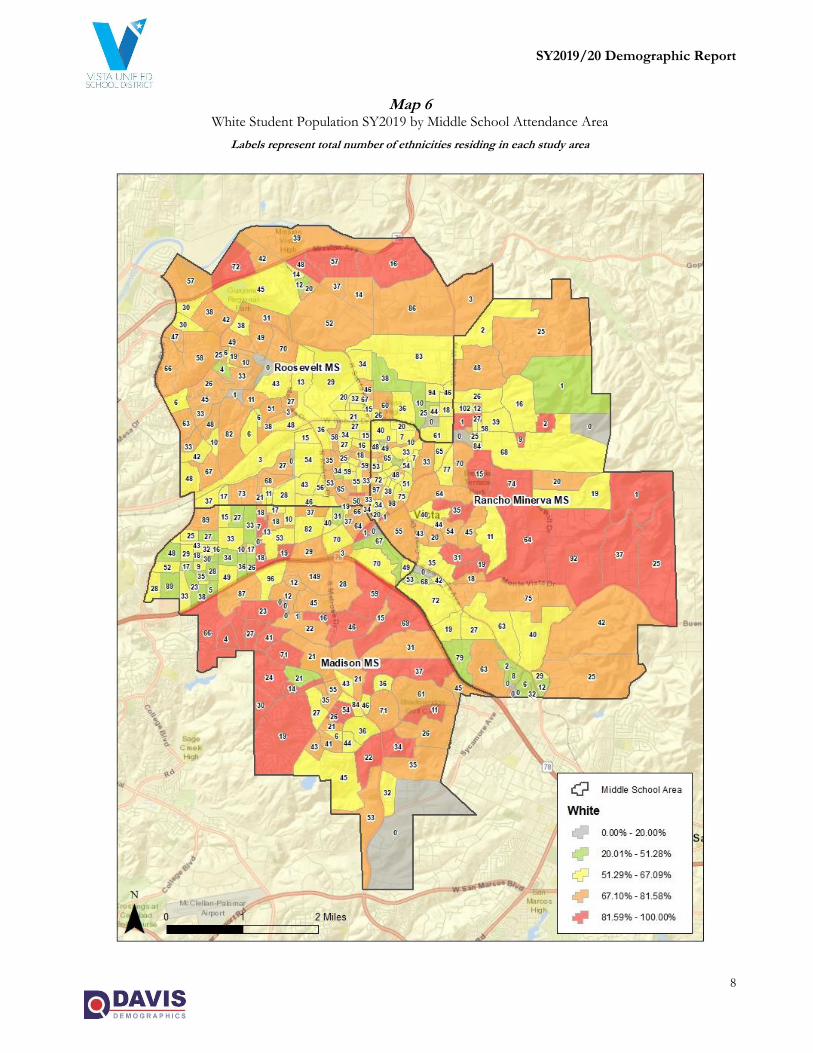
Map 6 White Student Population SY2019 by Middle School Attendance Area
Labels represent total number of ethnicities residing in each study area
SY2019/20 Demographic Report
9
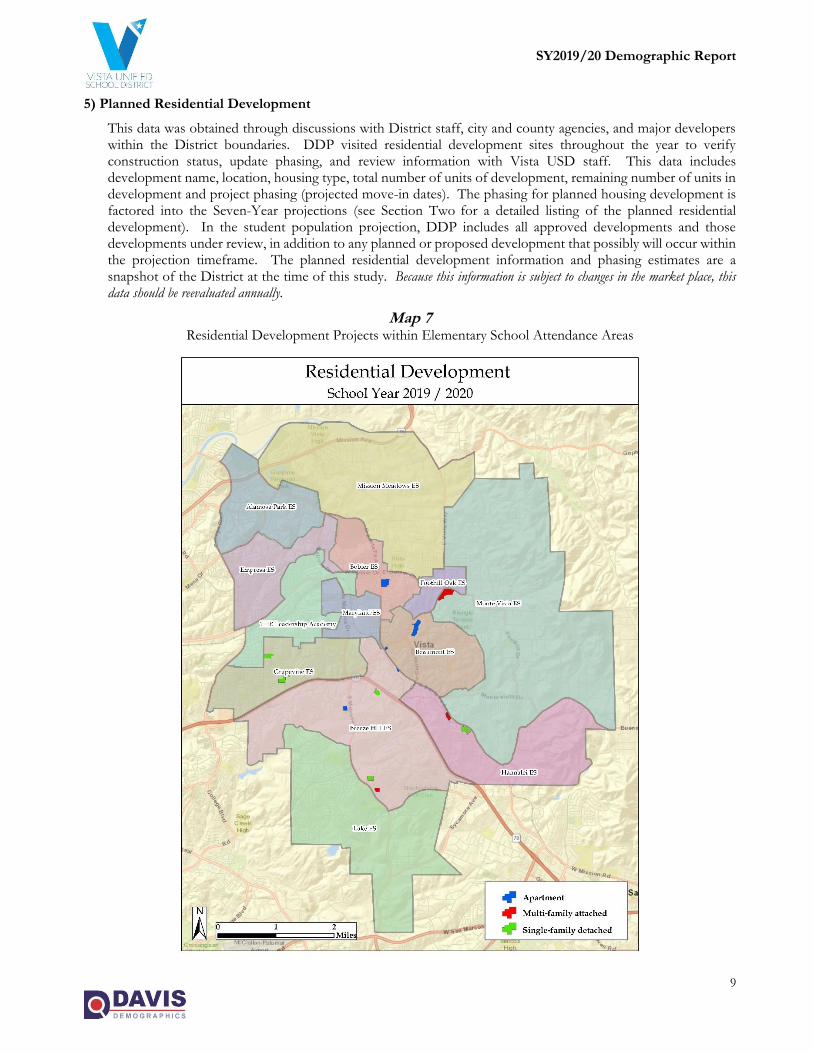
5) Planned Residential Development
This data was obtained through discussions with District staff, city and county agencies, and major developers within the District boundaries. DDP visited residential development sites throughout the year to verify construction status, update phasing, and review information with Vista USD staff. This data includes development name, location, housing type, total number of units of development, remaining number of units in development and project phasing (projected move-in dates). The phasing for planned housing development is factored into the Seven-Year projections (see Section Two for a detailed listing of the planned residential development). In the student population projection, DDP includes all approved developments and those developments under review, in addition to any planned or proposed development that possibly will occur within the projection timeframe. The planned residential development information and phasing estimates are a snapshot of the District at the time of this study. Because this information is subject to changes in the market place, this data should be reevaluated annually.
Map 7 Residential Development Projects within Elementary School Attendance Areas
SY2019/20 Demographic Report
10
SOURCES OF DATA (CONTINUED)
B. Data Used for Variables
Three sets of data were compiled and reviewed for use in the Seven-Year student population projections by residence:
1. Births by Zip Code 2. Mobility Factors 3. Student Yield Factors
1) Births by Zip Code
Birth data by postal zip code (roughly correlated to the Vista Unified School District boundaries) was obtained from the California Department of Public Health for the years 2000-2018. Past changes in historical birth rates are used to estimate future incoming kindergarten student population from existing housing. Birth rates were further analyzed at regional levels within the District and then applied to the planning areas.
2) Mobility Factors
Mobility refers to the increase or decrease in the movement of students within and out of the District boundary. Mobility, which is essentially a modified survival cohort, is applied as a percentage of increase/decrease among each grade for every year of the projections.
3) Student Yield Factors (SYFs)
Student Yield Factors were calculated from a housing count of existing residential units throughout the District. The student yield factors, combined with planned residential development units are used to determine the number of students potentially generated from new residential housing development projects. Student Yield Factor calculations will be discussed again in the Seven-Year Projection Methodology section.
SEVEN-YEAR PROJECTION METHODOLOGY
The projection methodology used in this study combines historic student population counts, past and present demographic characteristics, and planned residential development to forecast future student population at the Study Area level. District-wide projections are summarized from the individual Study Area projections. These projections are based on where students reside and where they are assigned to attend school. DDP uses the location of where the students reside, as opposed to their school of enrollment, in order to provide the most accurate estimate of where future school facilities may be needed. The best way to plan for future student population shifts is to know where the next group of students will be living. The following details the methodology used in preparing the student population projections by residence.
Seven-Year Projections
Projections are calculated out seven years from the date of projection for several reasons. The planning horizon for any type of facility is typically no less than five years, often longer. Seven years are usually sufficient to adequately plan for any new facility. Projections beyond seven years are based on speculation due to the lack of reliable information on birth rates, new home construction, and economic conditions.
Why Projections are Calculated by Residence
Typically, district generated projections are based on school enrollments and are projected for staffing and budgetary needs. However, this method is often inadequate for long-range planning needs, such as the location of future school facilities, because the location of the students is not taken into consideration. A school’s enrollment can fluctuate annually not only due to population trends but also due to variables in the curriculum, program changes, school administration, and open enrollment policies. These variables can skew the apparent need for new or additional facilities in an area.
SY2019/20 Demographic Report
11
The method used by DDP is unique because it modifies a standard cohort projection with demographic factors and student residential location. DDP bases its projections on the belief that school facility planning is more accurate when facilities are located where the greatest number of students reside.
The best way to plan for facility requirements is to know where the next group of students will be residing. The following details the methodology used in preparing the student population projections.
PROJECTION VARIABLES
For each year of the projections, 12th grade students graduate and continuing students progress through to the next grade level. This normal progression of students is modified by the following factors:
1) Incoming Kindergarten
Live birth data is reported to the California Department of Public Health by the resident postal zip code of the mother. DDP uses the birth data by zip code roughly correlating to the District boundary and applies the data accordingly.
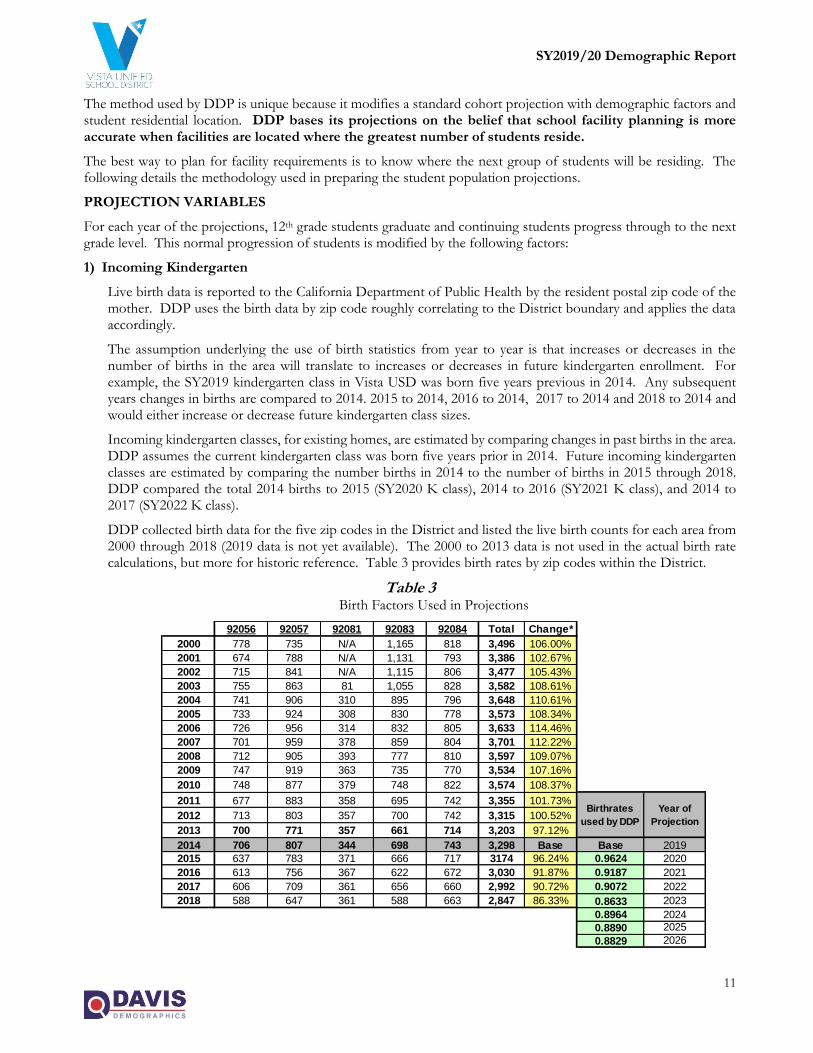
The assumption underlying the use of birth statistics from year to year is that increases or decreases in the number of births in the area will translate to increases or decreases in future kindergarten enrollment. For example, the SY2019 kindergarten class in Vista USD was born five years previous in 2014. Any subsequent years changes in births are compared to 2014. 2015 to 2014, 2016 to 2014, 2017 to 2014 and 2018 to 2014 and would either increase or decrease future kindergarten class sizes.
Incoming kindergarten classes, for existing homes, are estimated by comparing changes in past births in the area. DDP assumes the current kindergarten class was born five years prior in 2014. Future incoming kindergarten classes are estimated by comparing the number births in 2014 to the number of births in 2015 through 2018. DDP compared the total 2014 births to 2015 (SY2020 K class), 2014 to 2016 (SY2021 K class), and 2014 to 2017 (SY2022 K class).
DDP collected birth data for the five zip codes in the District and listed the live birth counts for each area from 2000 through 2018 (2019 data is not yet available). The 2000 to 2013 data is not used in the actual birth rate calculations, but more for historic reference. Table 3 provides birth rates by zip codes within the District.
Table 3 Birth Factors Used in Projections
92056 92057 92081 92083 92084 Total Change*
2000 778 735 N/A 1,165 818 3,496 106.00%
2001 674 788 N/A 1,131 793 3,386 102.67%
2002 715 841 N/A 1,115 806 3,477 105.43%
2003 755 863 81 1,055 828 3,582 108.61%
2004 741 906 310 895 796 3,648 110.61%
2005 733 924 308 830 778 3,573 108.34%
2006 726 956 314 832 805 3,633 114.46%
2007 701 959 378 859 804 3,701 112.22%
2008 712 905 393 777 810 3,597 109.07%
2009 747 919 363 735 770 3,534 107.16%
2010 748 877 379 748 822 3,574 108.37%
2011 677 883 358 695 742 3,355 101.73%
2012 713 803 357 700 742 3,315 100.52%
2013 700 771 357 661 714 3,203 97.12%
2014 706 807 344 698 743 3,298 Base Base 2019
2015 637 783 371 666 717 3174 96.24% 0.9624 2020
2016 613 756 367 622 672 3,030 91.87% 0.9187 2021
2017 606 709 361 656 660 2,992 90.72% 0.9072 2022
2018 588 647 361 588 663 2,847 86.33% 0.8633 2023
0.8964 2024
0.8890 2025
0.8829 2026
Year of
Projection
Birthrates
used by DDP
SY2019/20 Demographic Report
12
2) Student Mobility Factors
Student mobility factors further refine the Seven-Year student population projections. Mobility refers to the increase or decrease in the movement of students within and out of the District boundary (move-in/move-out of students from existing housing). Mobility Factors take into account movement of students residing in apartments within the District, housing re-sales, foreclosures, movement out of the District and high school dropout rates. Mobility, similar to a cohort, are applied to all elementary attendance area as a percentage of increase/decrease to each grade every year of the projections.
A net increase or decrease of zero students over time is represented by a factor of 1.000 or a 100% pass through rate. A net student loss is represented by a factor less than 1.000 (such as 0.97 or a 3% net loss) and a net gain by a factor greater than 1.000 (such as 1.01 or a 1% net increase).
The sampling used to calculate student mobility was taken over a four-year period using “address matched” (located by place of residence) student data from SY2016 through SY2019 for individual grade comparisons. For example, a comparison was made for the SY2016 Kindergarten student population to the SY2017 1st grade students; the same for SY2016 1st graders to SY2017 2nd graders, etc. This comparison was also conducted through 12th grade and for the following school years: comparing SY2016 students to SY2017 students, and comparing SY2017 student data to SY2018 students as well as SY2018 student data to SY2019.
There are a few main reasons for using the last four years of data and not using more or less years for the Mobility Study. If student data goes back too far (5+ years) is used, then specific trends that were occurring during that time that are not occurring now will be factored into the projections and therefore not reflect the most recent patterns. If only the last few years of student data (i.e. SY2018 and SY2019 only) are used, then isolated anomalies occurring in the District (sharp rise or decline in the student population) would then be overrepresented in the Seven-Year projections. DDP’s experience has shown that using the last four years of data and averaging the three years of change provides a more balanced and accurate mobility trend for Seven-Year student projections.
Having historical student data categorized by Study Area is extremely helpful in calculating accurate Student Mobility Factors. For this year's report, DDP used current elementary school attendance areas as the basis to calculate Mobility Factors. In other words, 14 sets of Mobility Factors were used to calculate student projections (listed in Table 4), using these, smaller geographic areas help to identify and focus on trends within the District. Focusing Mobility Factors at the Elementary Area instead of larger geography will help to refine those changes at the neighborhood level, identifying lower retention and better assist in forecasting projections.
The advantage to running the Mobility Factors at the attendance area level rather than looking only at a District-wide average is that you can focus on specific trends that are occurring in specific neighborhoods, which can lead to projections that are more accurate. Remember, the Mobility Factors are summaries of school attendance areas and those neighborhoods within the areas. This intensive study will allow the District to review forecasted figures at the elementary school level – the planning area.
It is important to remember that the mobility study is evaluating all grade levels within the elementary attendance area. Elementary attendance areas are the smallest geographic area that DDP can produce. These calculated mobility factors allow a granular focus to show local trends. This helps the District see the neighborhood level of information needed to project future shifts demographically and spatially.
SY2019/20 Demographic Report
13
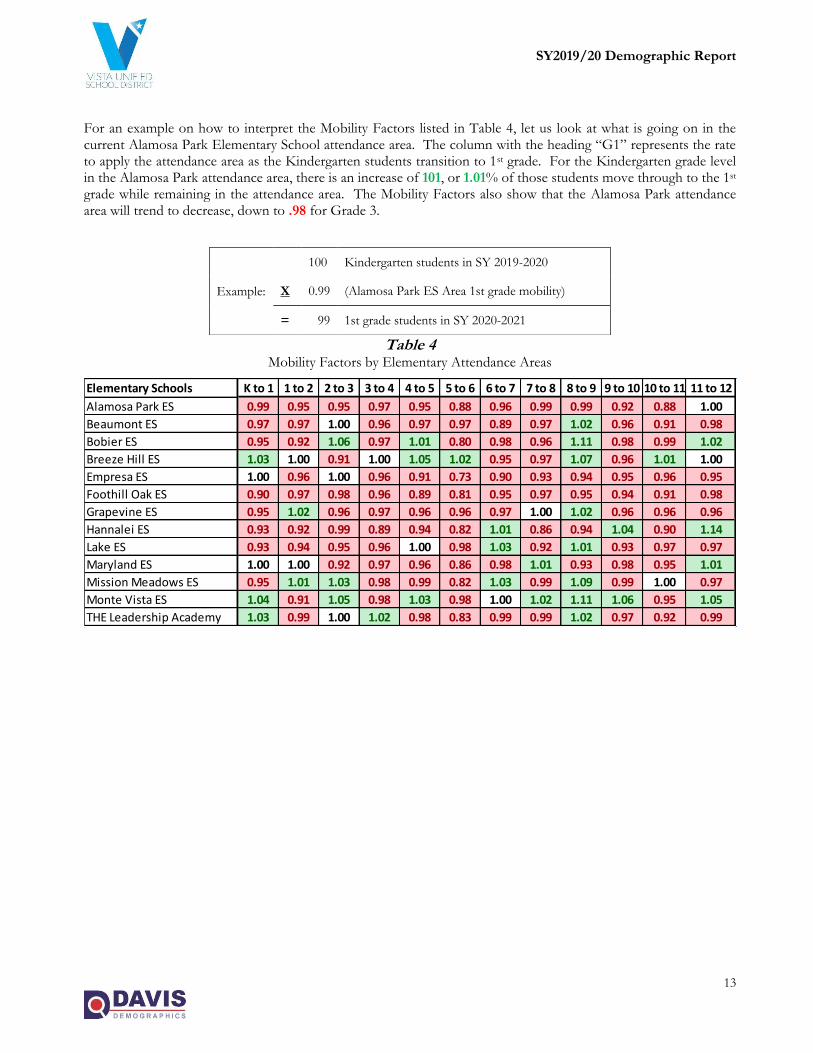
For an example on how to interpret the Mobility Factors listed in Table 4, let us look at what is going on in the current Alamosa Park Elementary School attendance area. The column with the heading “G1” represents the rate to apply the attendance area as the Kindergarten students transition to 1st grade. For the Kindergarten grade level in the Alamosa Park attendance area, there is an increase of 101, or 1.01% of those students move through to the 1st grade while remaining in the attendance area. The Mobility Factors also show that the Alamosa Park attendance area will trend to decrease, down to .98 for Grade 3.
Table 4 Mobility Factors by Elementary Attendance Areas
Elementary Schools K to 1 1 to 2 2 to 3 3 to 4 4 to 5 5 to 6 6 to 7 7 to 8 8 to 9 9 to 10 10 to 11 11 to 12
Alamosa Park ES 0.99 0.95 0.95 0.97 0.95 0.88 0.96 0.99 0.99 0.92 0.88 1.00
Beaumont ES 0.97 0.97 1.00 0.96 0.97 0.97 0.89 0.97 1.02 0.96 0.91 0.98
Bobier ES 0.95 0.92 1.06 0.97 1.01 0.80 0.98 0.96 1.11 0.98 0.99 1.02
Breeze Hill ES 1.03 1.00 0.91 1.00 1.05 1.02 0.95 0.97 1.07 0.96 1.01 1.00
Empresa ES 1.00 0.96 1.00 0.96 0.91 0.73 0.90 0.93 0.94 0.95 0.96 0.95
Foothill Oak ES 0.90 0.97 0.98 0.96 0.89 0.81 0.95 0.97 0.95 0.94 0.91 0.98
Grapevine ES 0.95 1.02 0.96 0.97 0.96 0.96 0.97 1.00 1.02 0.96 0.96 0.96
Hannalei ES 0.93 0.92 0.99 0.89 0.94 0.82 1.01 0.86 0.94 1.04 0.90 1.14
Lake ES 0.93 0.94 0.95 0.96 1.00 0.98 1.03 0.92 1.01 0.93 0.97 0.97
Maryland ES 1.00 1.00 0.92 0.97 0.96 0.86 0.98 1.01 0.93 0.98 0.95 1.01
Mission Meadows ES 0.95 1.01 1.03 0.98 0.99 0.82 1.03 0.99 1.09 0.99 1.00 0.97
Monte Vista ES 1.04 0.91 1.05 0.98 1.03 0.98 1.00 1.02 1.11 1.06 0.95 1.05
THE Leadership Academy 1.03 0.99 1.00 1.02 0.98 0.83 0.99 0.99 1.02 0.97 0.92 0.99
Example:
100 Kindergarten students in SY 2019-2020
X 0.99 (Alamosa Park ES Area 1st grade mobility)
= 99 1st grade students in SY 2020-2021
SY2019/20 Demographic Report
14
Student Yield Factors (SYF)
The Student Yield Factors, when applied to planned residential development units, estimate how many additional students will be generated from new construction within the District (see Section Two for details on planned residential development).
Two sets of data are required to calculate Student Yield Factors: a current student file (provided by the District) and current housing unit data (taken from information provided by the San Diego County). The two database sets, students and housing units, are then linked. This allows DDP to associate each student with a specific housing unit.
Before the SYFs can be calculated from the current housing stock, the year of construction for each housing type must be determined. In general, new housing attracts families with elementary school aged children. Over the following 12 to 15 years, the children grow older and pass through the grades. A portion of those families, now without school-aged children, will then relocate and the cycle is then repeated throughout the life of the home. Identifying the year of construction and number of current resident students in recently built housing units assists in estimating the number of new students generated from future residential development.
In addition, other elements apart from the year of construction can be assessed. These elements include, but are not limited to, housing type, number of bedrooms, geographic location (study area), value of home, etc. Once all determining elements are decided upon, simple calculations are performed to produce a Student Yield Factor. The total number of units for that housing type then divides the number of current students residing in each housing type.
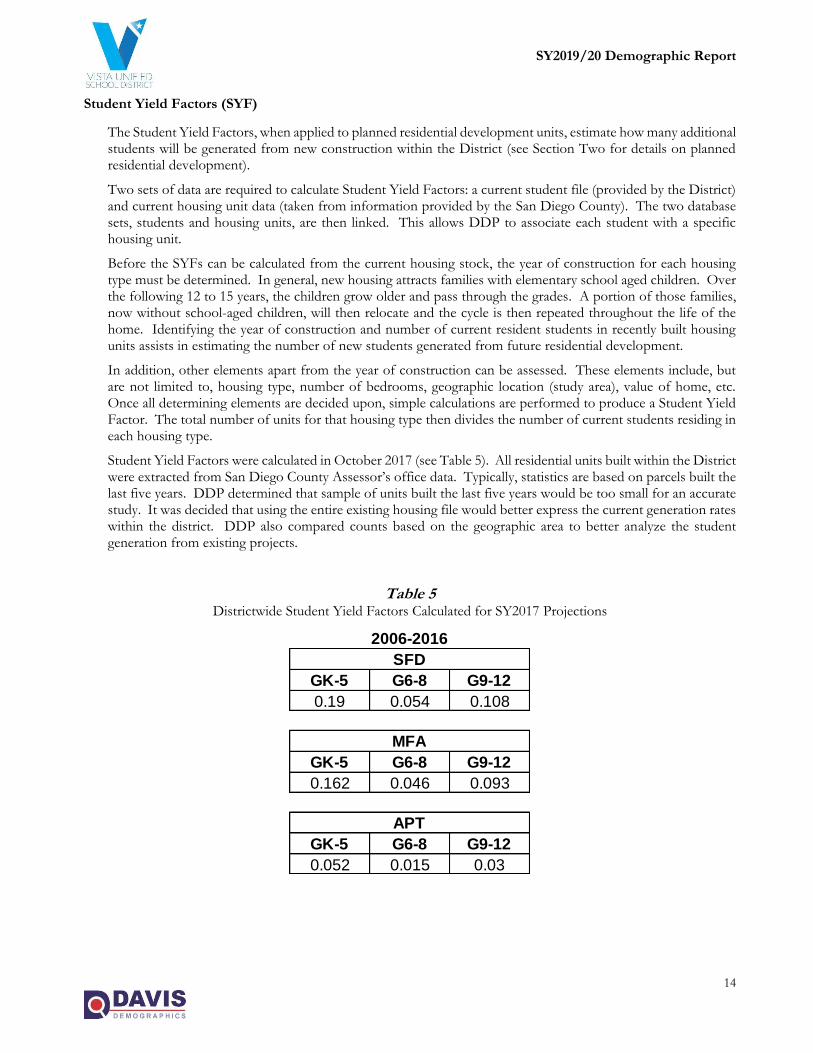
Student Yield Factors were calculated in October 2017 (see Table 5). All residential units built within the District were extracted from San Diego County Assessor’s office data. Typically, statistics are based on parcels built the last five years. DDP determined that sample of units built the last five years would be too small for an accurate study. It was decided that using the entire existing housing file would better express the current generation rates within the district. DDP also compared counts based on the geographic area to better analyze the student generation from existing projects.
Table 5 Districtwide Student Yield Factors Calculated for SY2017 Projections
GK-5 G6-8 G9-12
0.19 0.054 0.108
GK-5 G6-8 G9-12
0.162 0.046 0.093
GK-5 G6-8 G9-12
0.052 0.015 0.03
2006-2016
SFD
MFA
APT
SY2019/20 Demographic Report
15
3) Planned Residential Development
Closely related to the Student Yield Factors (SYF) are planned residential development units. Planned residential development data is collected to determine the number of new residential units that will be built over the period of the student population projections. The units built within the next seven years will have the appropriate SYF applied to them to determine the number of new students the planned residential development may yield.
The majority of development data was acquired from research by DDP and additional information obtained through discussions and meetings with District staff, and San Diego County planning departments, active sales offices, and major developers within the District boundaries. Data in Section Two includes development name, location, housing type, total number of units and projected move in dates (phasing). Phasing for planned housing is factored into the Seven-Year projections.
In the student population projection by residence, DDP includes all Approved and Proposed site plan maps in addition to any planned or proposed development that will possibly occur within the projection timeframe. The planned residential development information and phasing estimates are a snapshot of the District at the time of this study. DDP makes all attempts to have the most recent information used at the time of production. Because this information may change, it should be reevaluated and updated annually.
SY2019/20 Demographic Report
16
APPLYING THE VARIABLES TO GENERATE THE PROJECTIONS
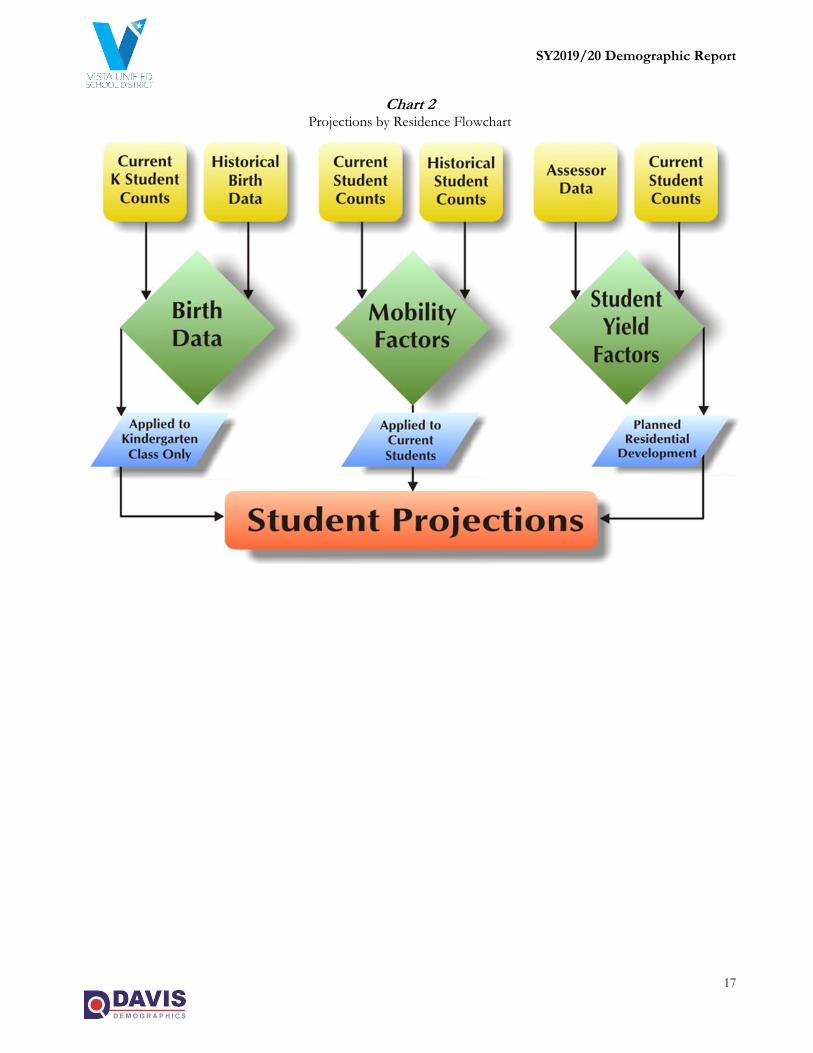
The following summarize how DDP uses the factors to determine the student population projections (see Chart 1). Remember that these projections are based on the residence of students and not school enrollment. Vista USD has been divided into 345 Study Areas. Every Study Area is coded with the school code of the elementary, and Middle Schools attendance area it falls. The residential projections are calculated at the Study Area level. This means that DDP conducts 345 individual projections that are based upon the number of students residing in each Study Area.
The first step in calculating the projections is to tally the number of students that live in each Study Area by grade level (Kindergarten through 12th grade). The current student base (SY2019) is then passed onto the next year's grade (SY2019 K become SY2020 1st graders, SY2019 1st graders become SY2020 2nd graders, and so on). After the natural progression of students through the grades is applied, then Birth Factors are multiplied to the current kindergarten class to generate a base for the following year's kindergarten class.
Next, a Mobility Factor is applied to all grades. Again, these factors take into account the natural in and out movement of students throughout the District. The mobility factor is calculated by student movement in every grade. Based on this, a unique mobility factor is applied to each elementary school attendance area determined by the mobility factor study.
The last essential layer applied to the projections is the additional students projected from planned residential development. This is a simple calculation, again conducted at the Study Area level, where the estimated number of new housing units for a particular year is multiplied by the appropriate Student Yield Factor. For example, if 100 Single-Family Detached (SFD) units are to be built in a specific Study Area in a given year, 100 units would be multiplied by the appropriate SFD Elementary student yield factor (.19) and the resulting number (19) would be divided evenly among elementary grade levels.
To finish generating the projections by residence, the same process is conducted for each of the 345 Study Areas. Once the projections have been run at the Study Area level, then it is simple addition to determine projections for each of the District's attendance areas or for a District-wide summary. For example, the residential projections for the Alamosa Park Elementary School attendance area is simply the summary of all of the Study Areas that make up this specific attendance area (see Section Five for the projections of each elementary, middle and high school attendance area). The District Summary for the projections is a total summary of all 345 Study Areas.
Current and historical students, geographic data, and non-geographic data are used to calculate the factors used in the student population projections by residence. These factors are applied using DDP’s SchoolSite software and projections are calculated for each Study Area for each grade.
SY2019/20 Demographic Report
17
Chart 2 Projections by Residence Flowchart
SY2019/20 Demographic Report
18
SECTION TWO: PLANNED RESIDENTIAL DEVELOPMENT
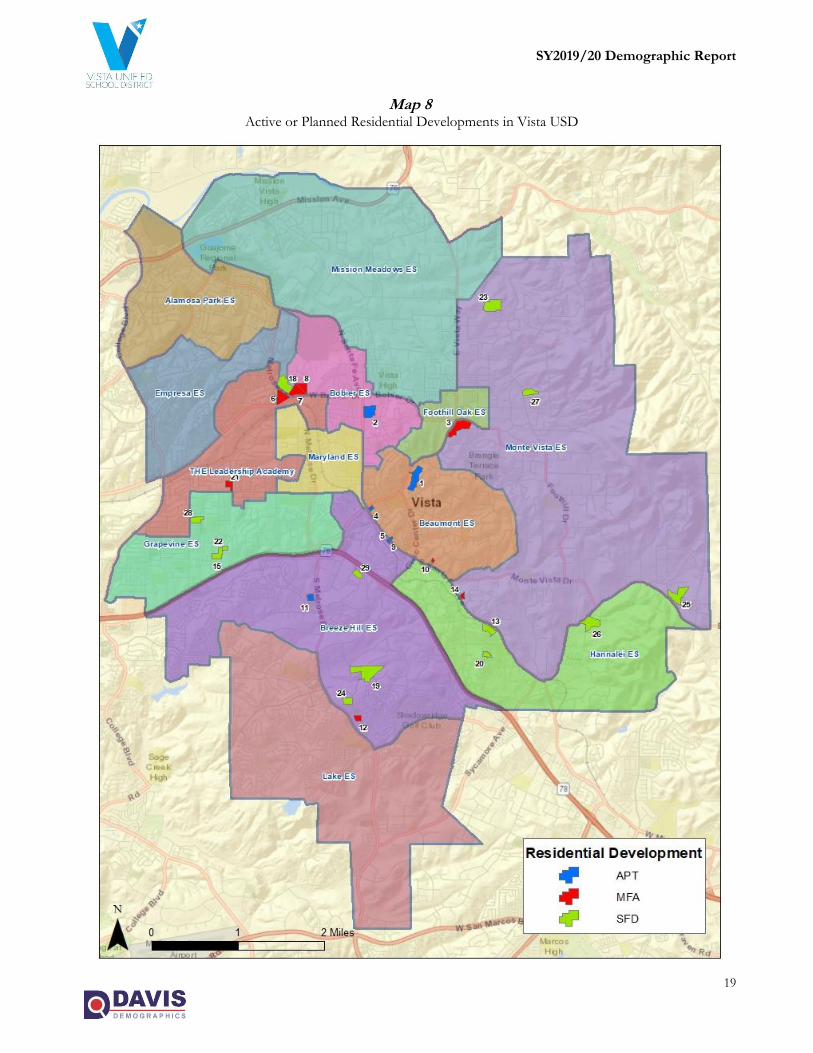
In the student population projection by residence, DDP includes all Approved and Tentative tract maps in addition to any planned or proposed development that may occur within the Seven-Year projection timeframe. The planned residential development information and phasing estimates is a snapshot of the District at the time of this study. As development plans are subject to change, all planned residential development data should be updated annually.
All of the residential development data used in this report was obtained by DDP, conversations with staff from Vista USD, officials at the Cities of Oceanside, San Marcos, Vista, and San Diego County, as well as direct contact with developers and sales offices with current and future housing projects within the District boundaries. A database and maps of planned residential developments have been created, including, when available, project name, location, housing type, total number of units and estimated move in dates (phasing schedule). DDP has also created an online tool to help District staff to view projects and updates during the research portion of this project. Development research is an unending activity and should be continually maintained.
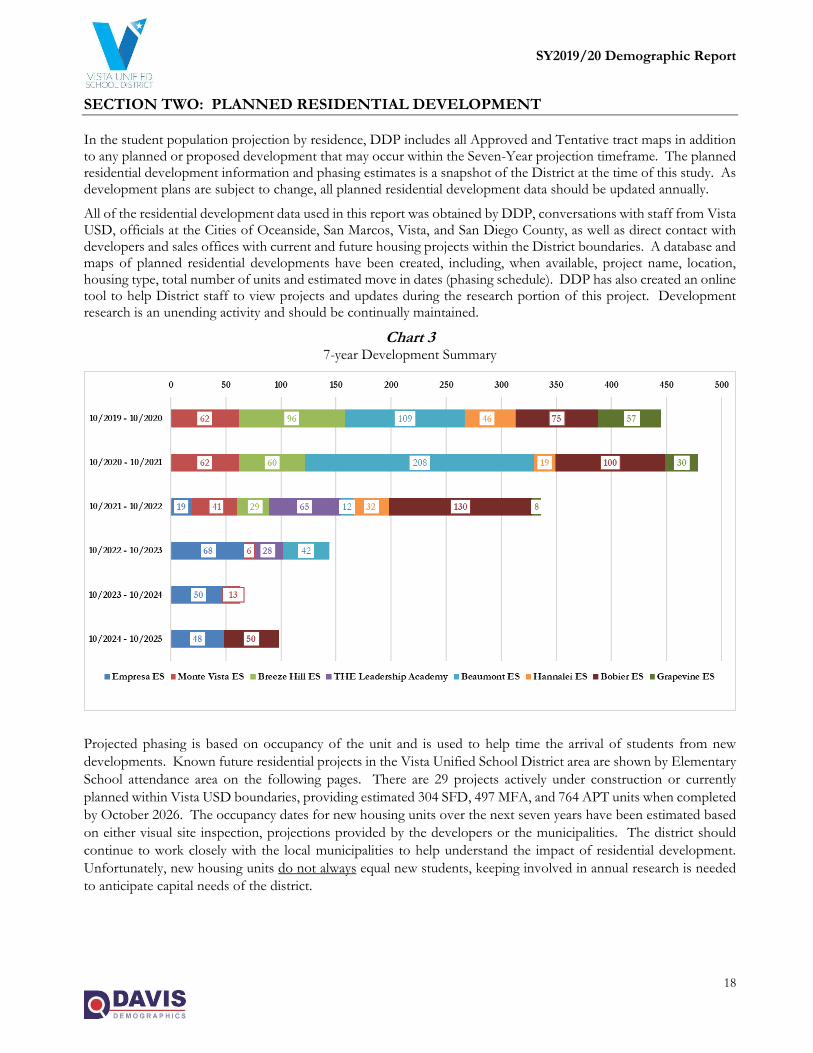
Chart 3 7-year Development Summary
Projected phasing is based on occupancy of the unit and is used to help time the arrival of students from new
developments. Known future residential projects in the Vista Unified School District area are shown by Elementary
School attendance area on the following pages. There are 29 projects actively under construction or currently
planned within Vista USD boundaries, providing estimated 304 SFD, 497 MFA, and 764 APT units when completed
by October 2026. The occupancy dates for new housing units over the next seven years have been estimated based
on either visual site inspection, projections provided by the developers or the municipalities. The district should
continue to work closely with the local municipalities to help understand the impact of residential development.
Unfortunately, new housing units do not always equal new students, keeping involved in annual research is needed
to anticipate capital needs of the district.
SY2019/20 Demographic Report
19
Map 8 Active or Planned Residential Developments in Vista USD
SY2019/20 Demographic Report
20
Table 6
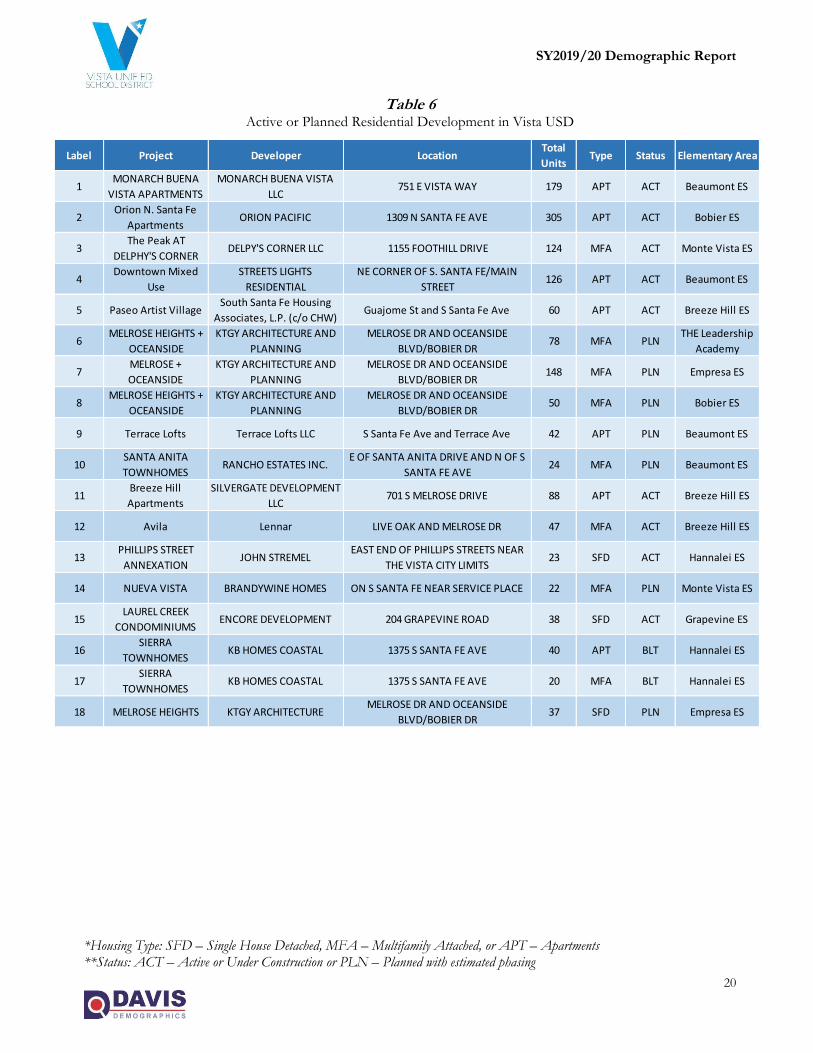
Active or Planned Residential Development in Vista USD
*Housing Type: SFD – Single House Detached, MFA – Multifamily Attached, or APT – Apartments **Status: ACT – Active or Under Construction or PLN – Planned with estimated phasing
Label Project Developer LocationTotal
UnitsType Status Elementary Area
1MONARCH BUENA
VISTA APARTMENTS
MONARCH BUENA VISTA
LLC751 E VISTA WAY 179 APT ACT Beaumont ES
2Orion N. Santa Fe
ApartmentsORION PACIFIC 1309 N SANTA FE AVE 305 APT ACT Bobier ES
3The Peak AT
DELPHY'S CORNERDELPY'S CORNER LLC 1155 FOOTHILL DRIVE 124 MFA ACT Monte Vista ES
4Downtown Mixed
Use
STREETS LIGHTS
RESIDENTIAL
NE CORNER OF S. SANTA FE/MAIN
STREET126 APT ACT Beaumont ES
5 Paseo Artist VillageSouth Santa Fe Housing
Associates, L.P. (c/o CHW)Guajome St and S Santa Fe Ave 60 APT ACT Breeze Hill ES
6MELROSE HEIGHTS +
OCEANSIDE
KTGY ARCHITECTURE AND
PLANNING
MELROSE DR AND OCEANSIDE
BLVD/BOBIER DR78 MFA PLN
THE Leadership
Academy
7MELROSE +
OCEANSIDE
KTGY ARCHITECTURE AND
PLANNING
MELROSE DR AND OCEANSIDE
BLVD/BOBIER DR148 MFA PLN Empresa ES
8MELROSE HEIGHTS +
OCEANSIDE
KTGY ARCHITECTURE AND
PLANNING
MELROSE DR AND OCEANSIDE
BLVD/BOBIER DR50 MFA PLN Bobier ES
9 Terrace Lofts Terrace Lofts LLC S Santa Fe Ave and Terrace Ave 42 APT PLN Beaumont ES
10SANTA ANITA
TOWNHOMESRANCHO ESTATES INC.
E OF SANTA ANITA DRIVE AND N OF S
SANTA FE AVE24 MFA PLN Beaumont ES
11Breeze Hill
Apartments
SILVERGATE DEVELOPMENT
LLC701 S MELROSE DRIVE 88 APT ACT Breeze Hill ES
12 Avila Lennar LIVE OAK AND MELROSE DR 47 MFA ACT Breeze Hill ES
13PHILLIPS STREET
ANNEXATIONJOHN STREMEL
EAST END OF PHILLIPS STREETS NEAR
THE VISTA CITY LIMITS23 SFD ACT Hannalei ES
14 NUEVA VISTA BRANDYWINE HOMES ON S SANTA FE NEAR SERVICE PLACE 22 MFA PLN Monte Vista ES
15LAUREL CREEK
CONDOMINIUMSENCORE DEVELOPMENT 204 GRAPEVINE ROAD 38 SFD ACT Grapevine ES
16SIERRA
TOWNHOMESKB HOMES COASTAL 1375 S SANTA FE AVE 40 APT BLT Hannalei ES
17SIERRA
TOWNHOMESKB HOMES COASTAL 1375 S SANTA FE AVE 20 MFA BLT Hannalei ES
18 MELROSE HEIGHTS KTGY ARCHITECTURE MELROSE DR AND OCEANSIDE
BLVD/BOBIER DR37 SFD PLN Empresa ES
SY2019/20 Demographic Report
21
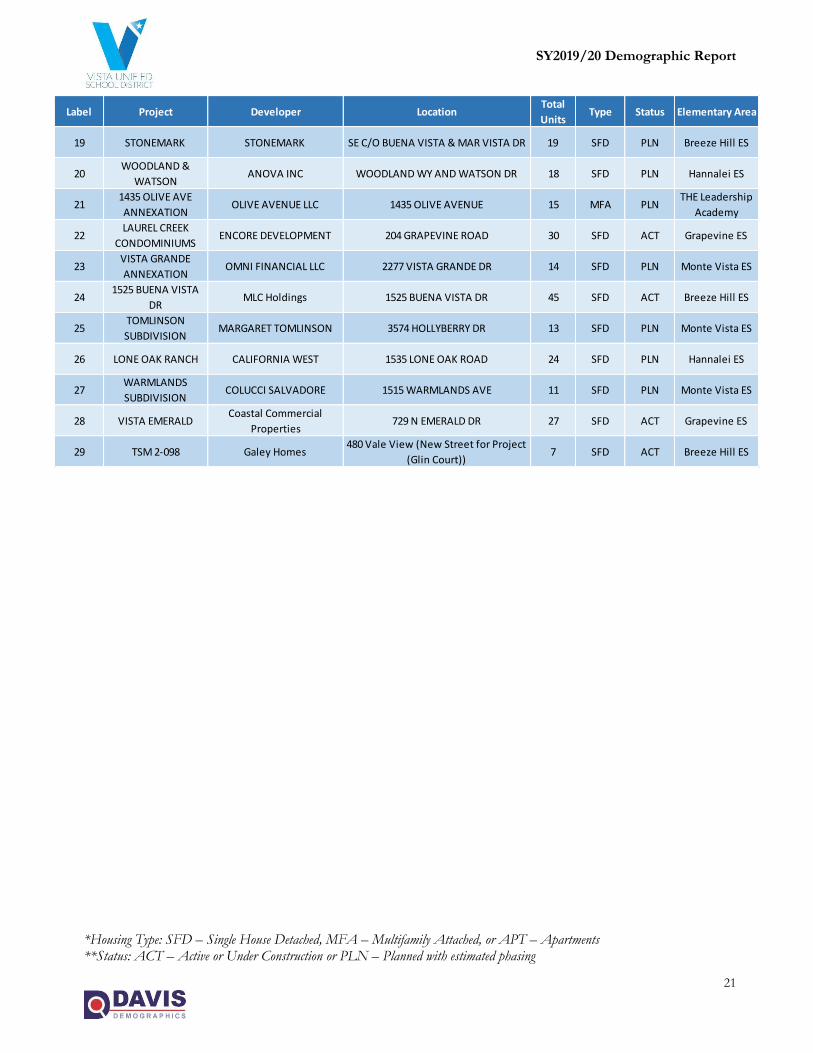
*Housing Type: SFD – Single House Detached, MFA – Multifamily Attached, or APT – Apartments **Status: ACT – Active or Under Construction or PLN – Planned with estimated phasing
Label Project Developer LocationTotal
UnitsType Status Elementary Area
19 STONEMARK STONEMARK SE C/O BUENA VISTA & MAR VISTA DR 19 SFD PLN Breeze Hill ES
20WOODLAND &
WATSON ANOVA INC WOODLAND WY AND WATSON DR 18 SFD PLN Hannalei ES
211435 OLIVE AVE
ANNEXATIONOLIVE AVENUE LLC 1435 OLIVE AVENUE 15 MFA PLN
THE Leadership
Academy
22LAUREL CREEK
CONDOMINIUMSENCORE DEVELOPMENT 204 GRAPEVINE ROAD 30 SFD ACT Grapevine ES
23VISTA GRANDE
ANNEXATIONOMNI FINANCIAL LLC 2277 VISTA GRANDE DR 14 SFD PLN Monte Vista ES
241525 BUENA VISTA
DRMLC Holdings 1525 BUENA VISTA DR 45 SFD ACT Breeze Hill ES
25TOMLINSON
SUBDIVISIONMARGARET TOMLINSON 3574 HOLLYBERRY DR 13 SFD PLN Monte Vista ES
26 LONE OAK RANCH CALIFORNIA WEST 1535 LONE OAK ROAD 24 SFD PLN Hannalei ES
27WARMLANDS
SUBDIVISIONCOLUCCI SALVADORE 1515 WARMLANDS AVE 11 SFD PLN Monte Vista ES
28 VISTA EMERALDCoastal Commercial
Properties729 N EMERALD DR 27 SFD ACT Grapevine ES
29 TSM 2-098 Galey Homes480 Vale View (New Street for Project
(Glin Court))7 SFD ACT Breeze Hill ES
SY2019/20 Demographic Report
22
SECTION THREE: ATTENDANCE MATRICES
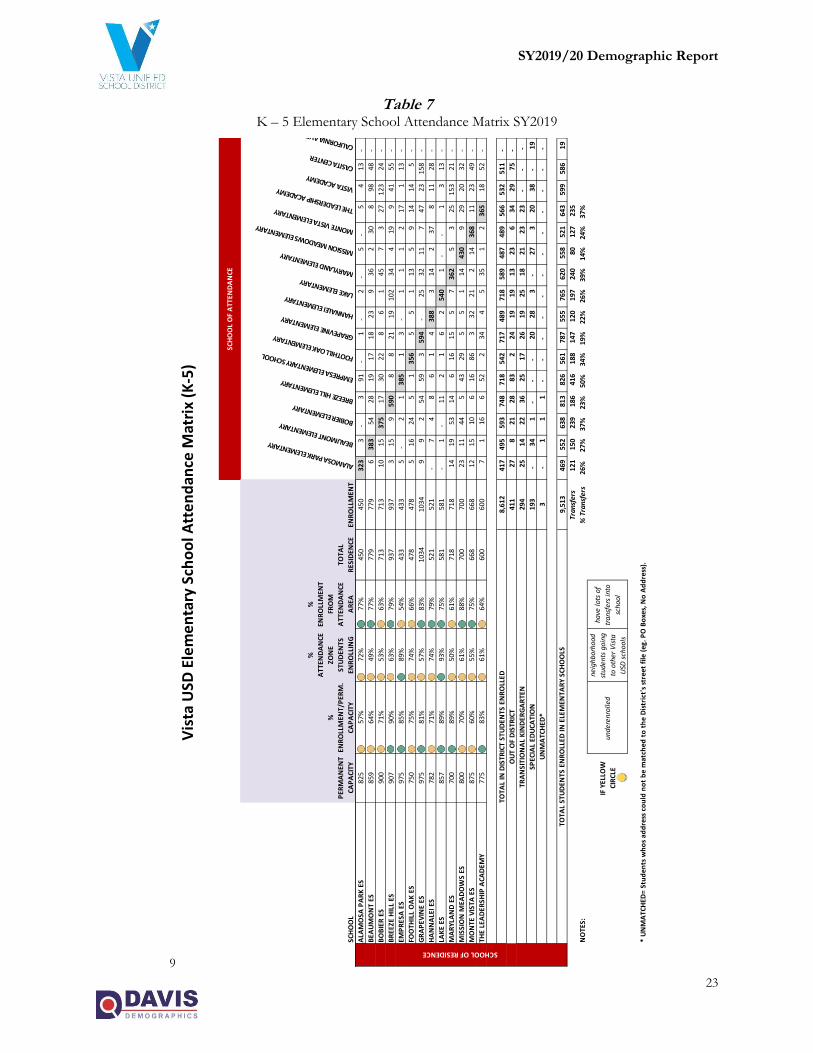
Three Attendance Matrices have been included to provide a better understanding of where students reside and where they attend school. Remember, DDP projections are based on where the students reside, not where the student is enrolled. This method allows DDP to provide the most accurate forecast of where shifts in student population may occur and changes to future facilities (if necessary) should be located. Because DDP projections are based on where the students reside, the figures we use as a base for each school’s resident projection may be slightly higher or lower than the actual reported enrollment for each school. The best way to plan for future facilities is to know where the next group of students will be coming from, not necessarily which school they are currently attending.
Attendance matrices act as a “check and balance” for student accounting, illustrating where the students reside (in what School of Residence) based upon their geocoded address and which school they attend (School of Attendance) based upon District provided student data. It is essential to show how the students used in the projections match up to the District’s records of enrollment for each school. Furthermore, intra-district transferring patterns can be determined by comparing School of Residence data to the School of Attendance data. The student counts used in all of the matrices represent the Vista USD’s enrollment as of October 2019.
READING THE MATRIX
Starting with the K-5 Elementary School Attendance Matrix, let's begin with Alamosa Park ES as an example. Following down the first column with the Alamosa Park heading, there are 323 K-5 grade students attending Alamosa Park ES and reside in the Alamosa Park attendance area. Continuing downward, 6 students attend Alamosa Park that reside in the Beaumont attendance area. Next, it shows that 10 students attend Alamosa Park and reside in the Bobier attendance area, and so on.
The row Out of District refers to students living completely outside of the Vista Union School District, but attending one of the District's schools. There are 27 Out of District students attending Alamosa Park ES. Transitional K Class refers to early Kindergarten enrolled students, there are 14 attending Alamosa Park this school year. Special Education refers to special education students attending, there are 0 Special Education students attending Alamosa Park campus. Unmatched refers to students who we were unable to geocode to a map but attend schools within the district, there are 0 unmatched students for Alamosa Park. Total Enrollment the total number of students attending a school regardless of where they reside and reflects the District’s enrollment counts for each school. There are 469 students attending Alamosa Park ES.
The next step is to read across the matrix, beginning with the Alamosa Park attendance area row. We know 323 represents the total number of K-5 grade students residing and attending Alamosa Park. The next column, Beaumont refers to the number of K-5 grade students residing in the Alamosa Park attendance area but attend Beaumont. There are 3 students residing in the Alamosa Park attendance area but attending Beaumont. The next column over is for Bobier ES, there are 0 students that reside within the Alamosa ES attendance area that are enrolled at Bobier ES. More impressive are the 91 students that reside within the Alamosa Attendance area but are enrolled at Empresa ES. All Resident schools can be read in the same manner.
The Total Residence column is the total number of students living in that particular attendance area. There are 450 K-5 students residing in the Alamosa Park attendance area.
The Middle School and High School Attendance Matrices are also read in the same manner.
SY2019/20 Demographic Report
23
Table 7 K – 5 Elementary School Attendance Matrix SY2019
9
SCH
OO
L O
F A
TTEN
DA
NCE
Vis
ta U
SD E
lem
en
tary
Sch
oo
l Att
en
dan
ce M
atri
x (K
-5)
SCH
OO
L
PER
MA
NEN
T
CAP
ACI
TY
%
ENR
OLL
MEN
T/P
ERM
.
CAP
ACI
TY
%
ATT
END
AN
CE
ZON
E
STU
DEN
TS
ENR
OLL
ING
%
ENR
OLL
MEN
T
FRO
M
ATT
END
AN
CE
AR
EA
TOTA
L
RES
IDEN
CE
ENR
OLL
MEN
T
ALAMOSA PARK ELEMENTARY BEAUMONT ELEMENTARY BOBIER ELEMENTARYBREEZE HILL ELEMENTARY EMPRESA ELEMENTARY SCHOOL FOOTHILL OAK ELEMENTARY GRAPEVINE ELEMENTARY HANNALEI ELEMENTARY LAKE ELEMENTARYMARYLAND ELEMENTARY MISSION MEADOWS ELEMENTARYMONTE VISTA ELEMENTARY THE LEADERSHIP ACADEMY VISTA ACADEMY
CASITA CENTER
CALIFORNIA AVENUE
ALA
MO
SA P
AR
K E
S82
557
%72
%77
%45
045
032
3
3
-
3
91
-
1
-
2
-
5
-
5
4
13
-
BEA
UM
ON
T ES
859
64%
49%
77%
779
779
6
383
54
28
19
17
18
23
9
36
2
30
8
98
48
-
BO
BIE
R E
S90
071
%53
%63
%71
371
310
15
37
5
17
30
22
8
6
1
45
7
3
27
123
24
-
BR
EEZE
HIL
L ES
907
90%
63%
79%
937
937
3
15
9
59
0
8
8
21
19
102
34
4
19
9
41
55
-
EMP
RES
A E
S97
585
%89
%54
%43
343
35
-
2
1
385
1
3
-
1
1
1
2
17
1
13
-
FOO
THIL
L O
AK
ES
750
75%
74%
66%
478
478
5
16
24
5
1
35
6
5
5
1
13
5
9
14
14
5
-
GR
AP
EVIN
E ES
975
81%
57%
83%
1034
1034
9
9
2
54
59
3
594
-
25
32
11
7
47
23
15
8
-
HA
NN
ALE
I ES
782
71%
74%
79%
521
521
-
7
4
8
6
1
4
38
8
3
14
2
37
8
11
28
-
LAK
E ES
857
89%
93%
75%
581
581
-
1
-
11
2
1
6
2
54
0
1
-
- 1
3
13
-
MA
RYL
AN
D E
S70
089
%50
%61
%71
871
814
19
53
14
6
16
15
5
7
36
2
5
3
25
153
21
-
MIS
SIO
N M
EAD
OW
S ES
800
70%
61%
88%
700
700
23
11
44
5
43
29
5
5
1
14
430
9
29
20
32
-
MO
NTE
VIS
TA E
S87
560
%55
%75
%66
866
812
15
10
6
16
86
3
32
21
2
14
36
8
11
23
49
-
THE
LEA
DER
SHIP
ACA
DEM
Y77
583
%61
%64
%60
060
07
1
16
6
52
2
34
4
5
35
1
2
36
5
18
52
-
8,61
241
7
495
59
3
748
71
8
542
71
7
489
71
8
589
48
7
489
56
6
532
51
1
-
411
27
8
21
28
83
2
24
19
19
13
23
6
34
29
75
-
294
25
14
22
36
25
17
26
19
25
18
21
23
23
-
--
193
-34
1
--
-20
28
3
-27
3
20
38
-19
3-
1
1
1
-
--
--
--
--
--
-
9,51
346
9
552
63
8
813
82
6
561
78
7
555
76
5
620
55
8
521
64
3
599
58
6
19
Tran
sfer
s12
1
150
23
9
186
41
6
188
14
7
120
19
7
240
80
127
23
5
NO
TES:
% T
rans
fers
26%
27%
37%
23%
50%
34%
19%
22%
26%
39%
14%
24%
37%
IF Y
ELLO
W
CIR
CLE
unde
renr
olle
d
neig
hbor
hood
stud
ents
goi
ng
to o
ther
Vis
ta
USD
sch
ools
have
lots
of
tran
sfer
s in
to
scho
ol
* U
NM
ATC
HED
= St
ud
ents
wh
os
add
ress
co
uld
no
t b
e m
atch
ed t
o t
he
Dis
tric
t's
stre
et f
ile (
eg. P
O B
oxe
s, N
o A
dd
ress
).
SCHOOL OF RESIDENCE
TOTA
L IN
DIS
TRIC
T ST
UD
ENTS
EN
RO
LLED
OU
T O
F D
ISTR
ICT
TRA
NSI
TIO
NA
L K
IND
ERG
AR
TEN
SPEC
IAL
EDU
CATI
ON
UN
MA
TCH
ED*
TOTA
L ST
UD
ENTS
EN
RO
LLED
IN E
LEM
ENTA
RY
SCH
OO
LS
SY2019/20 Demographic Report
24
Table 8 Middle School Attendance Matrix SY2019
Vis
ta U
SD M
idd
le S
cho
ol A
tte
nd
ance
Mat
rix
(6-8
)
SCH
OO
L O
F A
TTEN
DA
NCE
SCH
OO
L
PER
MA
NEN
T
CAP
ACI
TY
%
ENR
OLL
MEN
T/
PER
M.
CAP
ACI
TY
%
ATT
END
AN
CE
ZON
E
STU
DEN
TS
ENR
OLL
ING
%
ENR
OLL
MEN
T
FRO
M
ATT
END
AN
CE
AR
EA
TOTA
L
RES
IDEN
CE
ENR
OLL
MEN
T
MADISON MS
RANCHO MINERVA MSROOSEVELT MS
VISTA ADULT TRANSITION CENTER VISTA INNOVATION AND DESIGN AC VISTA MAGNET
VISTA VISIONS ACADEMYNON PUBLIC
MA
DIS
ON
MS
1396
75%
65%
85%
1,38
01,
380
891
13
39
-
233
201
1
2
RA
NCH
O M
INER
VA
MS
1092
60%
46%
93%
1,28
51,
285
98
595
94
-
19
2
30
1
4
1
RO
OSE
VEL
T M
S11
7081
%55
%85
%1,
361
1,36
154
31
748
-
26
9
25
0
2
7
4,02
610
4363
988
1-
694
752
710
284
38
8
51
-11
4
73
--
5010
7
18
7
1
6
-
1
30
01
00
20
0
4,36
310
9165
495
17
809
833
711
Tran
sfer
s19
0
52
184
NO
TES:
% T
rans
fers
17%
8%19
%
IF Y
ELLO
W
CIR
CLE
unde
renr
olle
d
neig
hbor
hood
stud
ents
goi
ng
to o
ther
Vis
ta
USD
sch
ools
have
lots
of
tran
sfer
s in
to
scho
ol
* U
NM
ATC
HED
= St
ud
ents
wh
os
add
ress
co
uld
no
t b
e m
atch
ed t
o t
he
Dis
tric
t's
stre
et f
ile (
eg. P
O B
oxe
s, N
o A
dd
ress
).
SCHOOL OF RESIDENCE
TOTA
L IN
DIS
TRIC
T ST
UD
ENTS
EN
RO
LLED
OU
T O
F D
ISTR
ICT
SPEC
IAL
EDU
CATI
ON
TOTA
L ST
UD
ENTS
EN
RO
LLED
IN M
IDD
LE S
CHO
OLS
UN
MA
TCH
ED*
SY2019/20 Demographic Report
25
Table 9 High School Attendance Matrix SY2019
Vis
ta U
SD H
igh
Sch
oo
l Att
en
dan
ce M
atri
x (9
-12
) SCH
OO
L O
F A
TTEN
DA
NCE
SCH
OO
L
PER
MA
NEN
T
CAP
ACI
TY
%
ENR
OLL
MEN
T
*/P
ERM
.
CAP
ACI
TY
%
ATT
END
AN
CE
ZON
E
STU
DEN
TS
ENR
OLL
ING
%
ENR
OLL
MEN
T
FRO
M
ATT
END
AN
CE
AR
EA
TOTA
L
RES
IDEN
CE
ENR
OLL
MEN
T
RANCHO BUENA VISTA HSVISTA HS
VISTA VISIONS ACADEMY
ALTA VISTA CONTINUATION
NON PUBLIC
MISSION VISTA HS
MURRAY HS CONTINUATION
VISTA ADULT TRANSITION CENTER
RA
NCH
O B
UEN
A V
ISTA
HS
3,24
0
61%
67%
90%
2,63
62,
636
1,77
7
332
3018
436
710
8-
VIS
TA H
S3,
260
65
%61
%84
%2,
928
2,92
820
2
1,
784
27
758
751
81-
5,56
41,
979
2,
116
57
93
12
1,11
8
18
9
-
721
77
91
3
4
-53
4
12
-
GR
AD
E 14
(O
T)11
5-
--
-5
--
110
6113
41
-
--
1
-
6
1-
-1
--
--
-
6,46
22,
069
2,
248
61
97
17
1,65
3
20
1
116
Tran
sfer
s27
9
42
3
% T
rans
fers
13%
19%
NO
TES:
IF Y
ELLO
W
CIR
CLE
unde
renr
olle
d
neig
hbor
hood
stud
ents
goin
g to
oth
er
Vis
ta U
SD
scho
ols
have
lots
of
tran
sfer
s in
to
scho
ol
* U
NM
ATC
HED
= St
ud
ents
wh
os
add
ress
co
uld
no
t b
e m
atch
ed t
o t
he
Dis
tric
t's
stre
et f
ile (
eg. P
O B
oxe
s, N
o A
dd
ress
).
SCHOOL OF RESIDENCE
OU
T O
F D
ISTR
ICT
TOTA
L IN
DIS
TRIC
T ST
UD
ENTS
EN
RO
LLED
SPEC
IAL
EDU
CATI
ON
TOTA
L ST
UD
ENTS
EN
RO
LLED
IN H
IGH
SCH
OO
LS
UN
MA
TCH
ED*
SY2019/20 Demographic Report
26
SECTION FOUR: DISTRICTWIDE STUDENT POPULATION PROJECTIONS
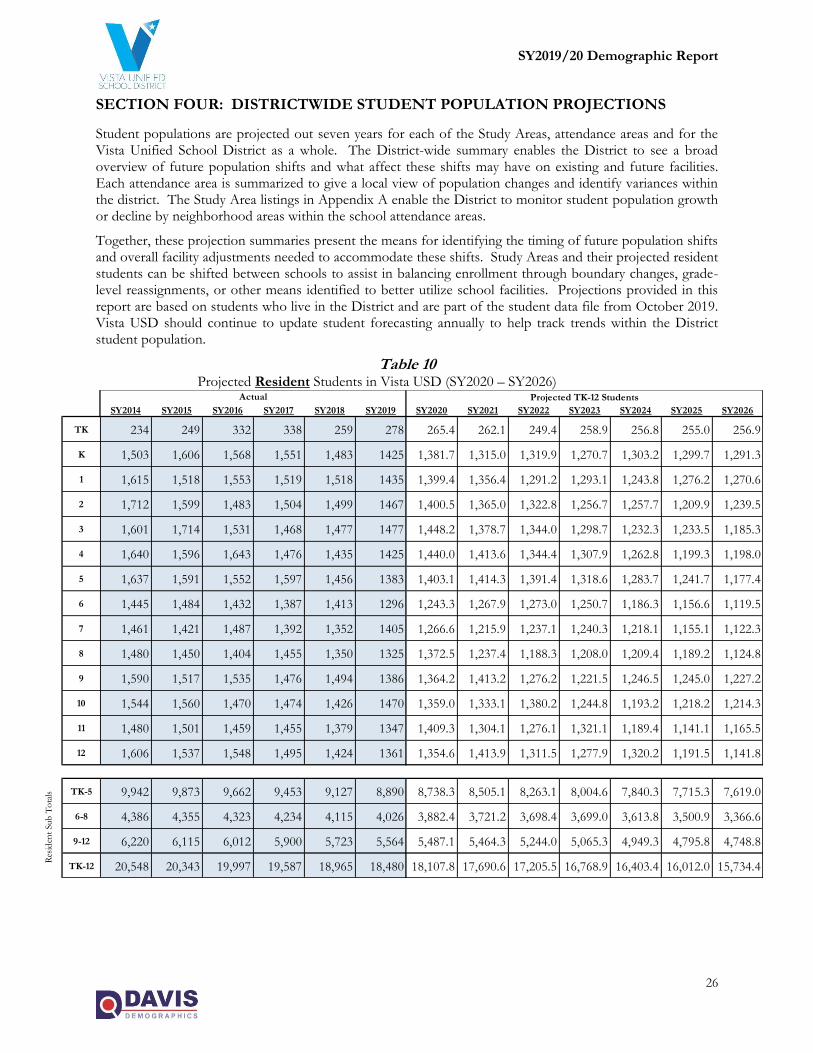
Student populations are projected out seven years for each of the Study Areas, attendance areas and for the Vista Unified School District as a whole. The District-wide summary enables the District to see a broad overview of future population shifts and what affect these shifts may have on existing and future facilities. Each attendance area is summarized to give a local view of population changes and identify variances within the district. The Study Area listings in Appendix A enable the District to monitor student population growth or decline by neighborhood areas within the school attendance areas.
Together, these projection summaries present the means for identifying the timing of future population shifts and overall facility adjustments needed to accommodate these shifts. Study Areas and their projected resident students can be shifted between schools to assist in balancing enrollment through boundary changes, grade-level reassignments, or other means identified to better utilize school facilities. Projections provided in this report are based on students who live in the District and are part of the student data file from October 2019. Vista USD should continue to update student forecasting annually to help track trends within the District student population.
Table 10 Projected Resident Students in Vista USD (SY2020 – SY2026)
SY2014 SY2015 SY2016 SY2017 SY2018 SY2019 SY2020 SY2021 SY2022 SY2023 SY2024 SY2025 SY2026
TK 234 249 332 338 259 278 265.4 262.1 249.4 258.9 256.8 255.0 256.9
K 1,503 1,606 1,568 1,551 1,483 1425 1,381.7 1,315.0 1,319.9 1,270.7 1,303.2 1,299.7 1,291.3
1 1,615 1,518 1,553 1,519 1,518 1435 1,399.4 1,356.4 1,291.2 1,293.1 1,243.8 1,276.2 1,270.6
2 1,712 1,599 1,483 1,504 1,499 1467 1,400.5 1,365.0 1,322.8 1,256.7 1,257.7 1,209.9 1,239.5
3 1,601 1,714 1,531 1,468 1,477 1477 1,448.2 1,378.7 1,344.0 1,298.7 1,232.3 1,233.5 1,185.3
4 1,640 1,596 1,643 1,476 1,435 1425 1,440.0 1,413.6 1,344.4 1,307.9 1,262.8 1,199.3 1,198.0
5 1,637 1,591 1,552 1,597 1,456 1383 1,403.1 1,414.3 1,391.4 1,318.6 1,283.7 1,241.7 1,177.4
6 1,445 1,484 1,432 1,387 1,413 1296 1,243.3 1,267.9 1,273.0 1,250.7 1,186.3 1,156.6 1,119.5
7 1,461 1,421 1,487 1,392 1,352 1405 1,266.6 1,215.9 1,237.1 1,240.3 1,218.1 1,155.1 1,122.3
8 1,480 1,450 1,404 1,455 1,350 1325 1,372.5 1,237.4 1,188.3 1,208.0 1,209.4 1,189.2 1,124.8
9 1,590 1,517 1,535 1,476 1,494 1386 1,364.2 1,413.2 1,276.2 1,221.5 1,246.5 1,245.0 1,227.2
10 1,544 1,560 1,470 1,474 1,426 1470 1,359.0 1,333.1 1,380.2 1,244.8 1,193.2 1,218.2 1,214.3
11 1,480 1,501 1,459 1,455 1,379 1347 1,409.3 1,304.1 1,276.1 1,321.1 1,189.4 1,141.1 1,165.5
12 1,606 1,537 1,548 1,495 1,424 1361 1,354.6 1,413.9 1,311.5 1,277.9 1,320.2 1,191.5 1,141.8
TK-5 9,942 9,873 9,662 9,453 9,127 8,890 8,738.3 8,505.1 8,263.1 8,004.6 7,840.3 7,715.3 7,619.0
6-8 4,386 4,355 4,323 4,234 4,115 4,026 3,882.4 3,721.2 3,698.4 3,699.0 3,613.8 3,500.9 3,366.6
9-12 6,220 6,115 6,012 5,900 5,723 5,564 5,487.1 5,464.3 5,244.0 5,065.3 4,949.3 4,795.8 4,748.8
TK-12 20,548 20,343 19,997 19,587 18,965 18,480 18,107.8 17,690.6 17,205.5 16,768.9 16,403.4 16,012.0 15,734.4
Projected TK-12 Students
Res
iden
t Sub
To
tals
Actual
SY2019/20 Demographic Report
27
DISTRICTWIDE STUDENT PROJECTION TRENDS
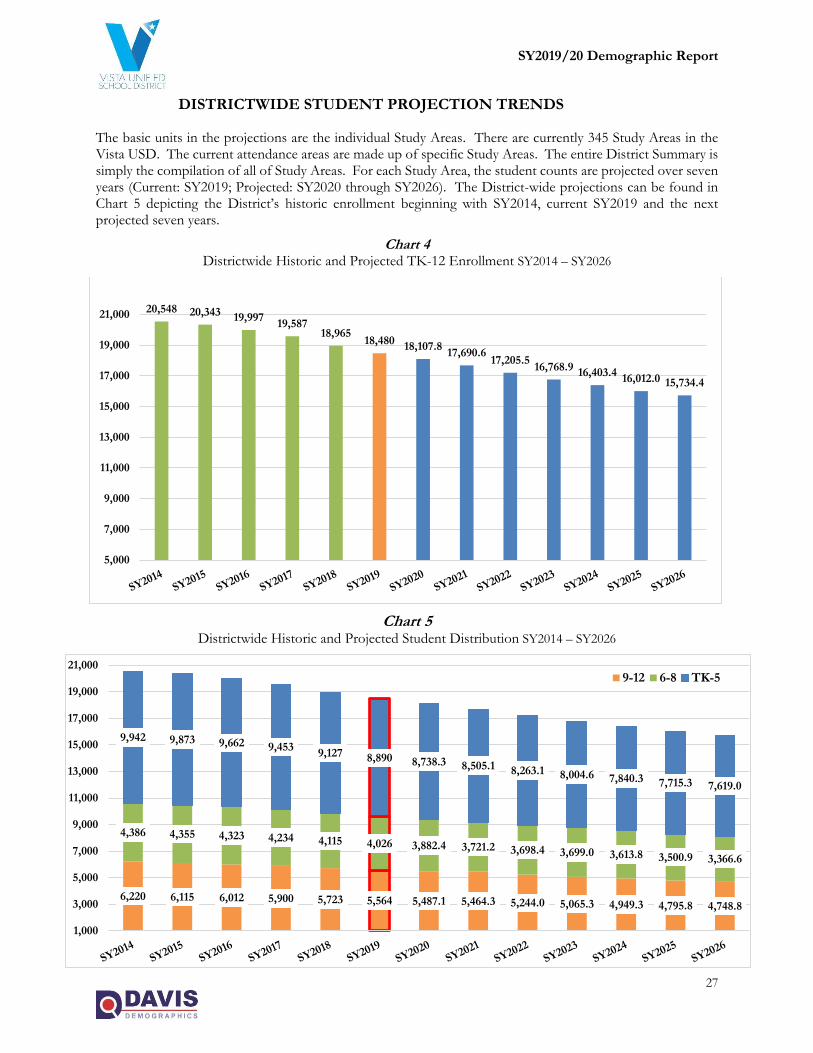
The basic units in the projections are the individual Study Areas. There are currently 345 Study Areas in the Vista USD. The current attendance areas are made up of specific Study Areas. The entire District Summary is simply the compilation of all of Study Areas. For each Study Area, the student counts are projected over seven years (Current: SY2019; Projected: SY2020 through SY2026). The District-wide projections can be found in Chart 5 depicting the District’s historic enrollment beginning with SY2014, current SY2019 and the next projected seven years.
Chart 4 Districtwide Historic and Projected TK-12 Enrollment SY2014 – SY2026
Chart 5 Districtwide Historic and Projected Student Distribution SY2014 – SY2026
20,548 20,343 19,99719,587
18,96518,480
18,107.817,690.6
17,205.516,768.9
16,403.416,012.0 15,734.4
5,000
7,000
9,000
11,000
13,000
15,000
17,000
19,000
21,000
6,220 6,115 6,012 5,900 5,723 5,564 5,487.1 5,464.3 5,244.0 5,065.3 4,949.3 4,795.8 4,748.8
4,386 4,355 4,323 4,234 4,115 4,026 3,882.4 3,721.2 3,698.4 3,699.0 3,613.8 3,500.9 3,366.6
9,942 9,873 9,662 9,4539,127 8,890 8,738.3 8,505.1 8,263.1 8,004.6 7,840.3 7,715.3 7,619.0
1,000
3,000
5,000
7,000
9,000
11,000
13,000
15,000
17,000
19,000
21,0009-12 6-8 TK-5
SY2019/20 Demographic Report
28
The Vista USD has a total of 13 elementary schools, 3 Middle Schools, and 2 high schools with attendance area boundaries. In October 2019, the District had 9,513 elementary students (TK included), 4,363 Middle School students, and 6,347 high school students. In total, 20,223 students enrolled in Vista USD schools this school year.
District enrollment has been in decline since 2014. On average historical annual decrease in enrollment has been near 364 students. The next seven years could see this trend continue. Current housing trends in apartments are not adding to the district population. The survival cohort in the elementary and middle school grades has been in the negative factor; creating an average annual loss of -5% at each grade level from the year. The district is located in the north county of San Diego with close proximity to lite rail and situated between two major interstates leading to San Diego in the south, Orange, and Riverside Counties to the north. Housing pressure and increase in costs are driving younger families to other communities.
The elementary population for Vista is expected to decrease as larger class sizes continue to matriculate and are being replaced by smaller class sizes. The effect may represent a single year decline of almost -162 elementary students between Fall 2019 and Fall 2020. Couple this projected loss with low mobility statistics over the next seven years and the district could expect the elementary enrollment population decrease to 8,152 by SY2026.
The middle school enrollment has seen slight decrease from year to year and an increasing decline of about -92 students from the year before. The district should expect to see a decline in the middle school enrollment averaging approximately -102 less students per projected school year. There is a projected loss of -16.4% in middle school enrollment over the forecasted timeline.
VUSD high school enrollment had been experiencing growth 2010 to 2014 with a historic mark of over 7,100 students in SY2014. The last five years have seen declines averaging -151 per year. Projected counts indicate declining enrollment to continue through SY2026 with SY2021 have the smallest possible decline of about -26 9-12 students. The high school level may experience an overall drop in the total high school enrollment of 14.9%.
SY2019/20 Demographic Report
29
SECTION FIVE: ATTENDANCE AREA PROJECTIONS BY RESIDENCE
ELEMENTARY STUDENT POPULATION PROJECTION TRENDS
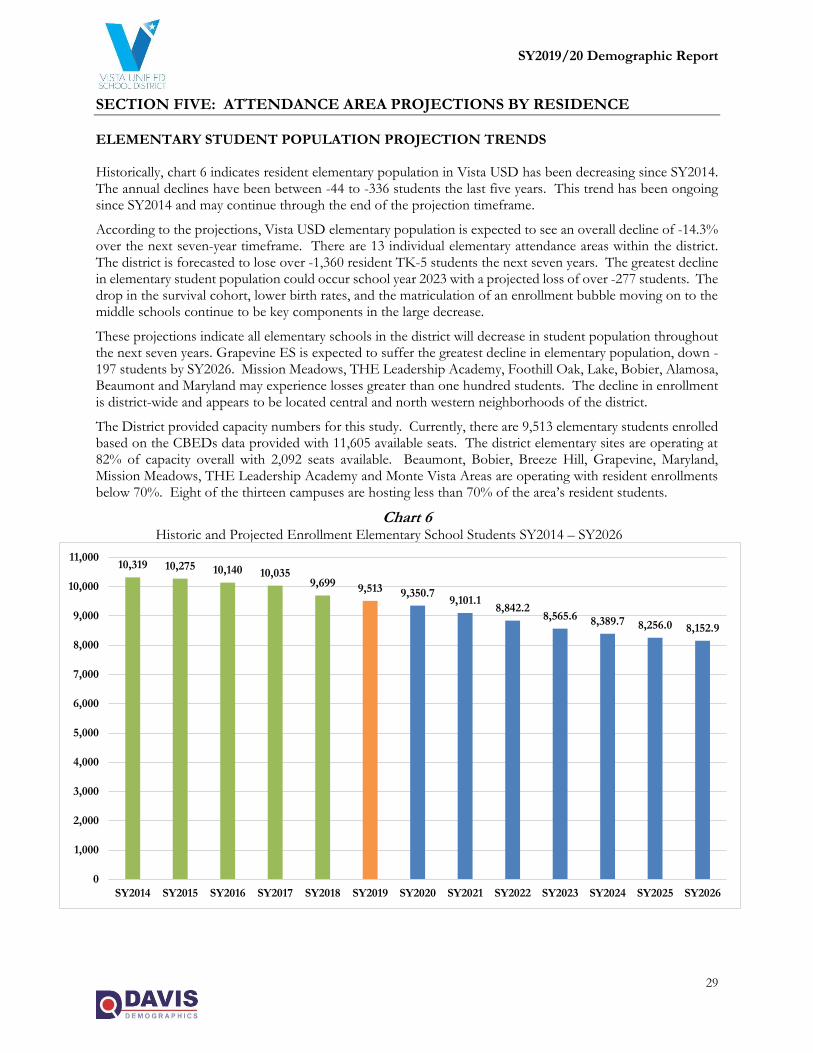
Historically, chart 6 indicates resident elementary population in Vista USD has been decreasing since SY2014. The annual declines have been between -44 to -336 students the last five years. This trend has been ongoing since SY2014 and may continue through the end of the projection timeframe.
According to the projections, Vista USD elementary population is expected to see an overall decline of -14.3% over the next seven-year timeframe. There are 13 individual elementary attendance areas within the district. The district is forecasted to lose over -1,360 resident TK-5 students the next seven years. The greatest decline in elementary student population could occur school year 2023 with a projected loss of over -277 students. The drop in the survival cohort, lower birth rates, and the matriculation of an enrollment bubble moving on to the middle schools continue to be key components in the large decrease.
These projections indicate all elementary schools in the district will decrease in student population throughout the next seven years. Grapevine ES is expected to suffer the greatest decline in elementary population, down -197 students by SY2026. Mission Meadows, THE Leadership Academy, Foothill Oak, Lake, Bobier, Alamosa, Beaumont and Maryland may experience losses greater than one hundred students. The decline in enrollment is district-wide and appears to be located central and north western neighborhoods of the district.
The District provided capacity numbers for this study. Currently, there are 9,513 elementary students enrolled based on the CBEDs data provided with 11,605 available seats. The district elementary sites are operating at 82% of capacity overall with 2,092 seats available. Beaumont, Bobier, Breeze Hill, Grapevine, Maryland, Mission Meadows, THE Leadership Academy and Monte Vista Areas are operating with resident enrollments below 70%. Eight of the thirteen campuses are hosting less than 70% of the area’s resident students.
Chart 6 Historic and Projected Enrollment Elementary School Students SY2014 – SY2026
10,319 10,275 10,140 10,0359,699 9,513 9,350.7
9,101.18,842.2
8,565.6 8,389.7 8,256.0 8,152.9
0
1,000
2,000
3,000
4,000
5,000
6,000
7,000
8,000
9,000
10,000
11,000
SY2014 SY2015 SY2016 SY2017 SY2018 SY2019 SY2020 SY2021 SY2022 SY2023 SY2024 SY2025 SY2026
SY2019/20 Demographic Report
30
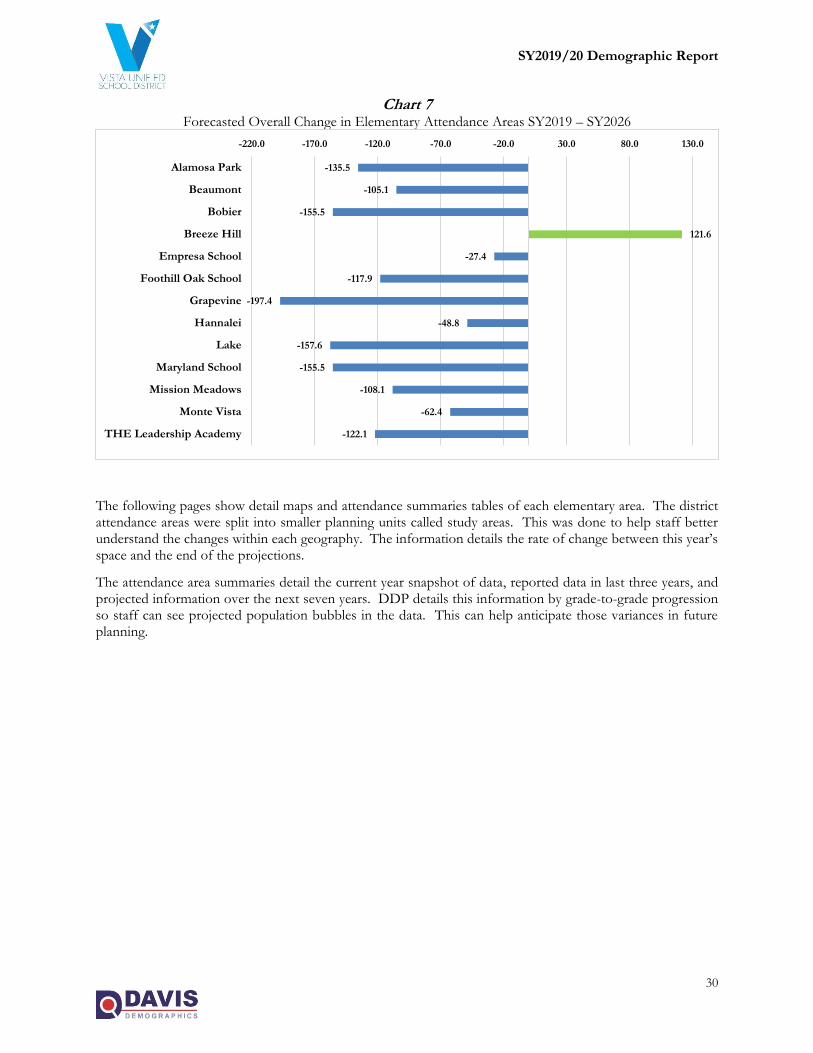
Chart 7 Forecasted Overall Change in Elementary Attendance Areas SY2019 – SY2026
The following pages show detail maps and attendance summaries tables of each elementary area. The district attendance areas were split into smaller planning units called study areas. This was done to help staff better understand the changes within each geography. The information details the rate of change between this year’s space and the end of the projections.
The attendance area summaries detail the current year snapshot of data, reported data in last three years, and projected information over the next seven years. DDP details this information by grade-to-grade progression so staff can see projected population bubbles in the data. This can help anticipate those variances in future planning.
-135.5
-105.1
-155.5
121.6
-27.4
-117.9
-197.4
-48.8
-157.6
-155.5
-108.1
-62.4
-122.1
-220.0 -170.0 -120.0 -70.0 -20.0 30.0 80.0 130.0
Alamosa Park
Beaumont
Bobier
Breeze Hill
Empresa School
Foothill Oak School
Grapevine
Hannalei
Lake
Maryland School
Mission Meadows
Monte Vista
THE Leadership Academy
SY2019/20 Demographic Report
31
IMPACT ON THE VISTA USD ELEMENTARY REGIONS
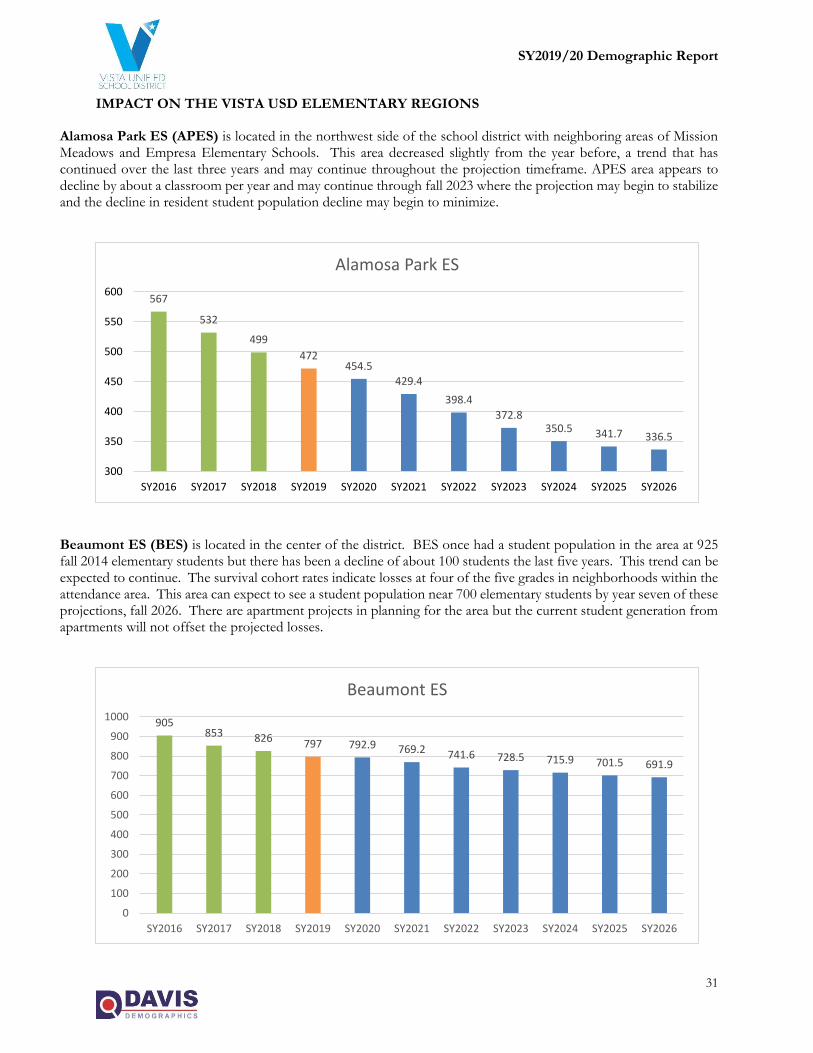
Alamosa Park ES (APES) is located in the northwest side of the school district with neighboring areas of Mission Meadows and Empresa Elementary Schools. This area decreased slightly from the year before, a trend that has continued over the last three years and may continue throughout the projection timeframe. APES area appears to decline by about a classroom per year and may continue through fall 2023 where the projection may begin to stabilize and the decline in resident student population decline may begin to minimize.
Beaumont ES (BES) is located in the center of the district. BES once had a student population in the area at 925 fall 2014 elementary students but there has been a decline of about 100 students the last five years. This trend can be expected to continue. The survival cohort rates indicate losses at four of the five grades in neighborhoods within the attendance area. This area can expect to see a student population near 700 elementary students by year seven of these projections, fall 2026. There are apartment projects in planning for the area but the current student generation from apartments will not offset the projected losses.
567
532
499
472454.5
429.4
398.4
372.8350.5 341.7 336.5
300
350
400
450
500
550
600
SY2016 SY2017 SY2018 SY2019 SY2020 SY2021 SY2022 SY2023 SY2024 SY2025 SY2026
Alamosa Park ES
905853 826 797 792.9 769.2 741.6 728.5 715.9 701.5 691.9
0
100
200
300
400
500
600
700
800
900
1000
SY2016 SY2017 SY2018 SY2019 SY2020 SY2021 SY2022 SY2023 SY2024 SY2025 SY2026
Beaumont ES
SY2019/20 Demographic Report
32
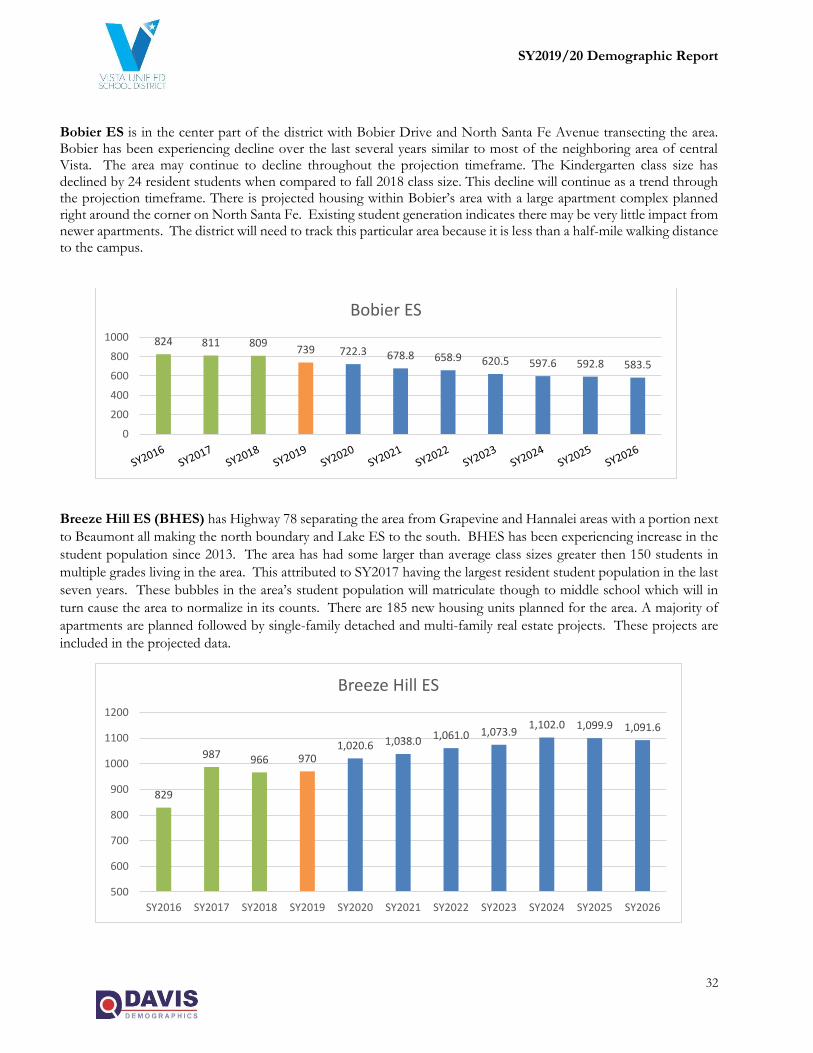
Bobier ES is in the center part of the district with Bobier Drive and North Santa Fe Avenue transecting the area. Bobier has been experiencing decline over the last several years similar to most of the neighboring area of central Vista. The area may continue to decline throughout the projection timeframe. The Kindergarten class size has declined by 24 resident students when compared to fall 2018 class size. This decline will continue as a trend through the projection timeframe. There is projected housing within Bobier’s area with a large apartment complex planned right around the corner on North Santa Fe. Existing student generation indicates there may be very little impact from newer apartments. The district will need to track this particular area because it is less than a half-mile walking distance to the campus.
Breeze Hill ES (BHES) has Highway 78 separating the area from Grapevine and Hannalei areas with a portion next
to Beaumont all making the north boundary and Lake ES to the south. BHES has been experiencing increase in the
student population since 2013. The area has had some larger than average class sizes greater then 150 students in
multiple grades living in the area. This attributed to SY2017 having the largest resident student population in the last
seven years. These bubbles in the area’s student population will matriculate though to middle school which will in
turn cause the area to normalize in its counts. There are 185 new housing units planned for the area. A majority of
apartments are planned followed by single-family detached and multi-family real estate projects. These projects are
included in the projected data.
824 811 809739 722.3 678.8 658.9 620.5 597.6 592.8 583.5
0
200
400
600
800
1000
Bobier ES
829
987 966 9701,020.6 1,038.0 1,061.0 1,073.9
1,102.0 1,099.9 1,091.6
500
600
700
800
900
1000
1100
1200
SY2016 SY2017 SY2018 SY2019 SY2020 SY2021 SY2022 SY2023 SY2024 SY2025 SY2026
Breeze Hill ES
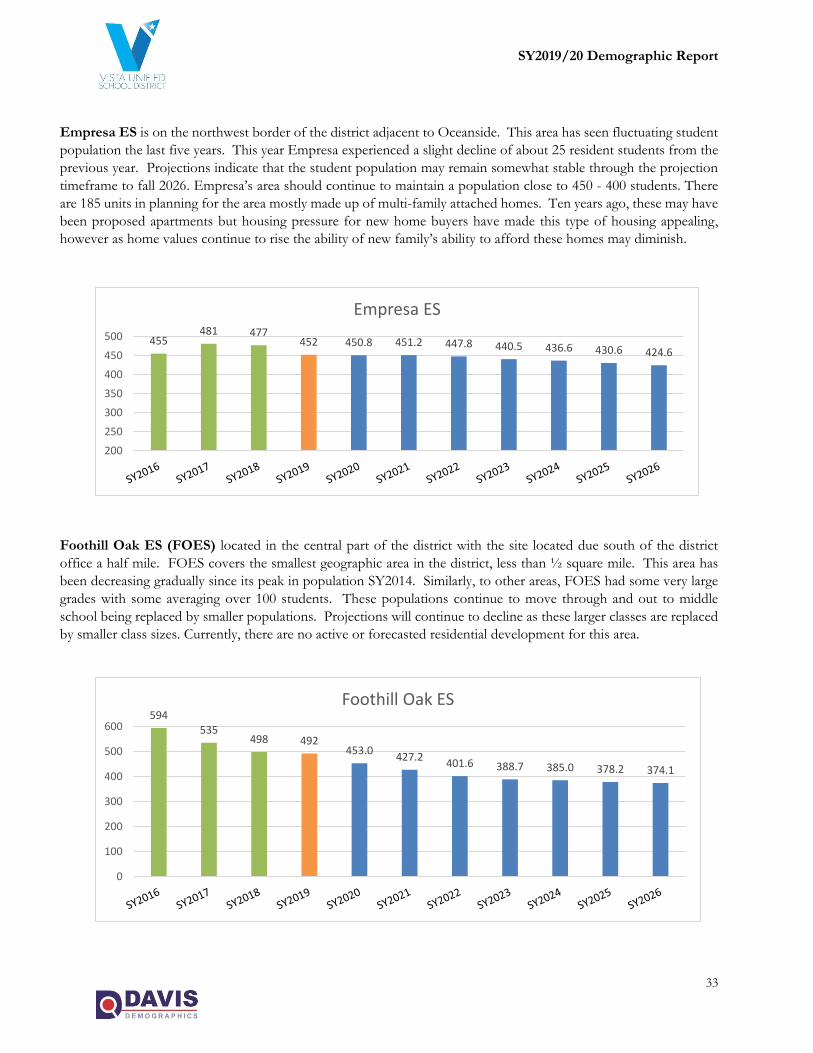
SY2019/20 Demographic Report
33
Empresa ES is on the northwest border of the district adjacent to Oceanside. This area has seen fluctuating student
population the last five years. This year Empresa experienced a slight decline of about 25 resident students from the
previous year. Projections indicate that the student population may remain somewhat stable through the projection
timeframe to fall 2026. Empresa’s area should continue to maintain a population close to 450 - 400 students. There
are 185 units in planning for the area mostly made up of multi-family attached homes. Ten years ago, these may have
been proposed apartments but housing pressure for new home buyers have made this type of housing appealing,
however as home values continue to rise the ability of new family’s ability to afford these homes may diminish.
Foothill Oak ES (FOES) located in the central part of the district with the site located due south of the district
office a half mile. FOES covers the smallest geographic area in the district, less than ½ square mile. This area has
been decreasing gradually since its peak in population SY2014. Similarly, to other areas, FOES had some very large
grades with some averaging over 100 students. These populations continue to move through and out to middle
school being replaced by smaller populations. Projections will continue to decline as these larger classes are replaced
by smaller class sizes. Currently, there are no active or forecasted residential development for this area.
455481 477
452 450.8 451.2 447.8 440.5 436.6 430.6 424.6
200
250
300
350
400
450
500
Empresa ES
594535
498 492453.0
427.2401.6 388.7 385.0 378.2 374.1
0
100
200
300
400
500
600
Foothill Oak ES
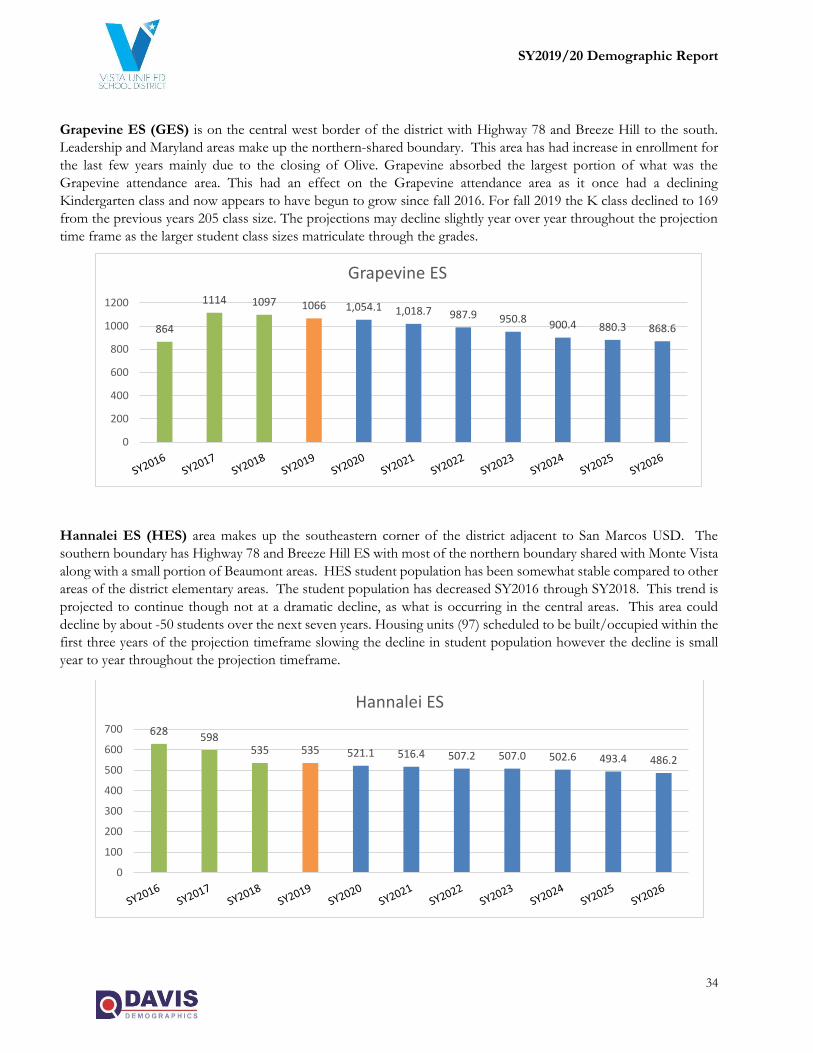
SY2019/20 Demographic Report
34
Grapevine ES (GES) is on the central west border of the district with Highway 78 and Breeze Hill to the south.
Leadership and Maryland areas make up the northern-shared boundary. This area has had increase in enrollment for
the last few years mainly due to the closing of Olive. Grapevine absorbed the largest portion of what was the
Grapevine attendance area. This had an effect on the Grapevine attendance area as it once had a declining
Kindergarten class and now appears to have begun to grow since fall 2016. For fall 2019 the K class declined to 169
from the previous years 205 class size. The projections may decline slightly year over year throughout the projection
time frame as the larger student class sizes matriculate through the grades.
Hannalei ES (HES) area makes up the southeastern corner of the district adjacent to San Marcos USD. The
southern boundary has Highway 78 and Breeze Hill ES with most of the northern boundary shared with Monte Vista
along with a small portion of Beaumont areas. HES student population has been somewhat stable compared to other
areas of the district elementary areas. The student population has decreased SY2016 through SY2018. This trend is
projected to continue though not at a dramatic decline, as what is occurring in the central areas. This area could
decline by about -50 students over the next seven years. Housing units (97) scheduled to be built/occupied within the
first three years of the projection timeframe slowing the decline in student population however the decline is small
year to year throughout the projection timeframe.
864
1114 1097 1066 1,054.1 1,018.7 987.9 950.8 900.4 880.3 868.6
0
200
400
600
800
1000
1200
Grapevine ES
628598
535 535 521.1 516.4 507.2 507.0 502.6 493.4 486.2
0
100
200
300
400
500
600
700
Hannalei ES
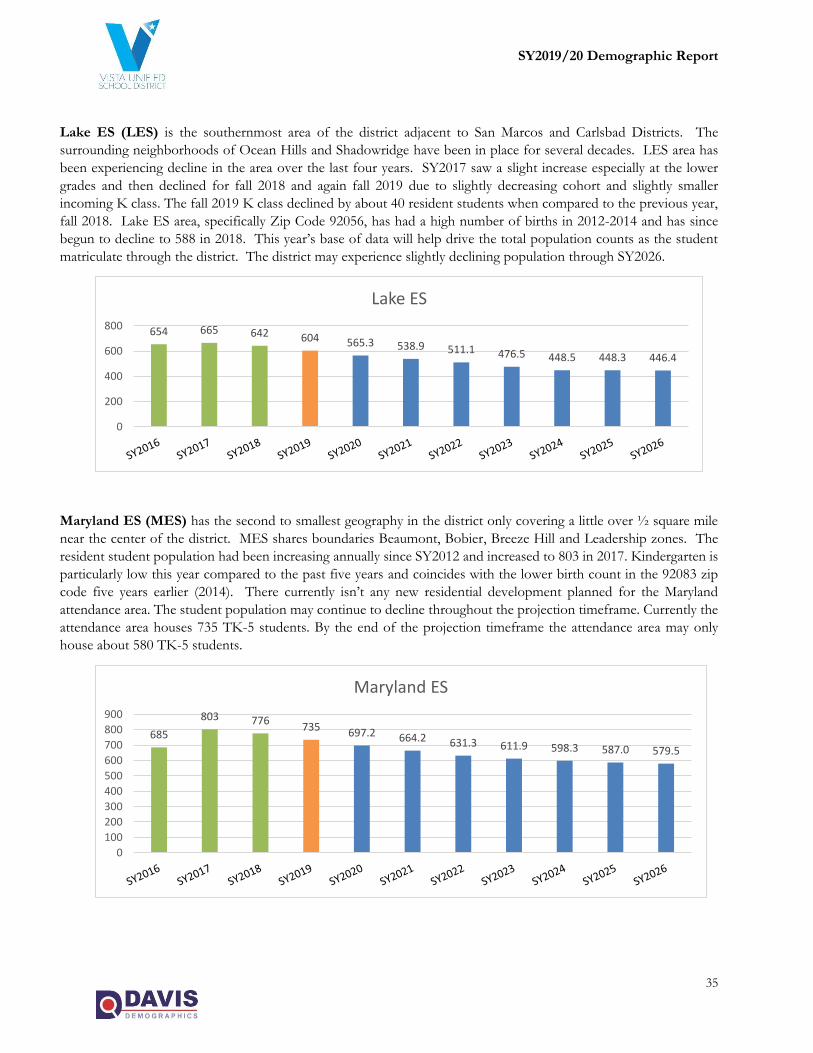
SY2019/20 Demographic Report
35
Lake ES (LES) is the southernmost area of the district adjacent to San Marcos and Carlsbad Districts. The
surrounding neighborhoods of Ocean Hills and Shadowridge have been in place for several decades. LES area has
been experiencing decline in the area over the last four years. SY2017 saw a slight increase especially at the lower
grades and then declined for fall 2018 and again fall 2019 due to slightly decreasing cohort and slightly smaller
incoming K class. The fall 2019 K class declined by about 40 resident students when compared to the previous year,
fall 2018. Lake ES area, specifically Zip Code 92056, has had a high number of births in 2012-2014 and has since
begun to decline to 588 in 2018. This year’s base of data will help drive the total population counts as the student
matriculate through the district. The district may experience slightly declining population through SY2026.
Maryland ES (MES) has the second to smallest geography in the district only covering a little over ½ square mile
near the center of the district. MES shares boundaries Beaumont, Bobier, Breeze Hill and Leadership zones. The
resident student population had been increasing annually since SY2012 and increased to 803 in 2017. Kindergarten is
particularly low this year compared to the past five years and coincides with the lower birth count in the 92083 zip
code five years earlier (2014). There currently isn’t any new residential development planned for the Maryland
attendance area. The student population may continue to decline throughout the projection timeframe. Currently the
attendance area houses 735 TK-5 students. By the end of the projection timeframe the attendance area may only
house about 580 TK-5 students.
654 665 642 604 565.3 538.9 511.1 476.5 448.5 448.3 446.4
0
200
400
600
800
Lake ES
685
803 776735 697.2 664.2 631.3 611.9 598.3 587.0 579.5
0
100
200
300
400
500
600
700
800
900
Maryland ES
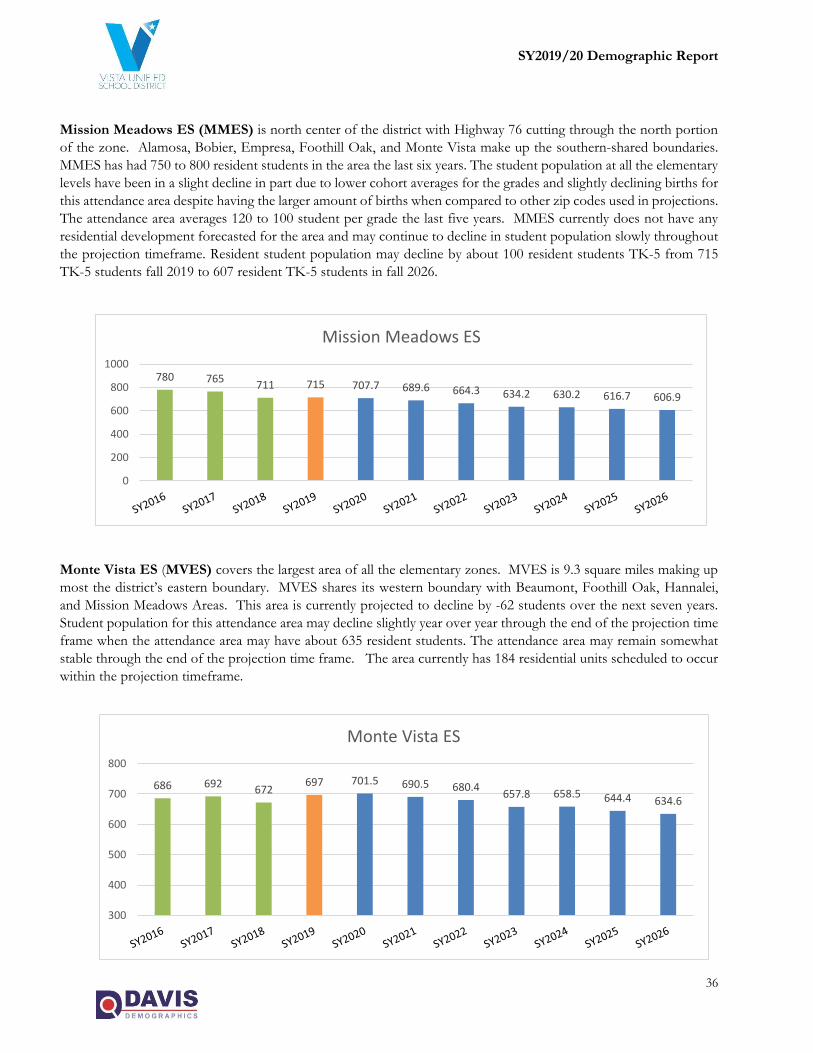
SY2019/20 Demographic Report
36
Mission Meadows ES (MMES) is north center of the district with Highway 76 cutting through the north portion
of the zone. Alamosa, Bobier, Empresa, Foothill Oak, and Monte Vista make up the southern-shared boundaries.
MMES has had 750 to 800 resident students in the area the last six years. The student population at all the elementary
levels have been in a slight decline in part due to lower cohort averages for the grades and slightly declining births for
this attendance area despite having the larger amount of births when compared to other zip codes used in projections.
The attendance area averages 120 to 100 student per grade the last five years. MMES currently does not have any
residential development forecasted for the area and may continue to decline in student population slowly throughout
the projection timeframe. Resident student population may decline by about 100 resident students TK-5 from 715
TK-5 students fall 2019 to 607 resident TK-5 students in fall 2026.
Monte Vista ES (MVES) covers the largest area of all the elementary zones. MVES is 9.3 square miles making up
most the district’s eastern boundary. MVES shares its western boundary with Beaumont, Foothill Oak, Hannalei,
and Mission Meadows Areas. This area is currently projected to decline by -62 students over the next seven years.
Student population for this attendance area may decline slightly year over year through the end of the projection time
frame when the attendance area may have about 635 resident students. The attendance area may remain somewhat
stable through the end of the projection time frame. The area currently has 184 residential units scheduled to occur
within the projection timeframe.
780 765711 715 707.7 689.6 664.3 634.2 630.2 616.7 606.9
0
200
400
600
800
1000
Mission Meadows ES
686 692672
697 701.5 690.5 680.4657.8 658.5 644.4 634.6
300
400
500
600
700
800
Monte Vista ES
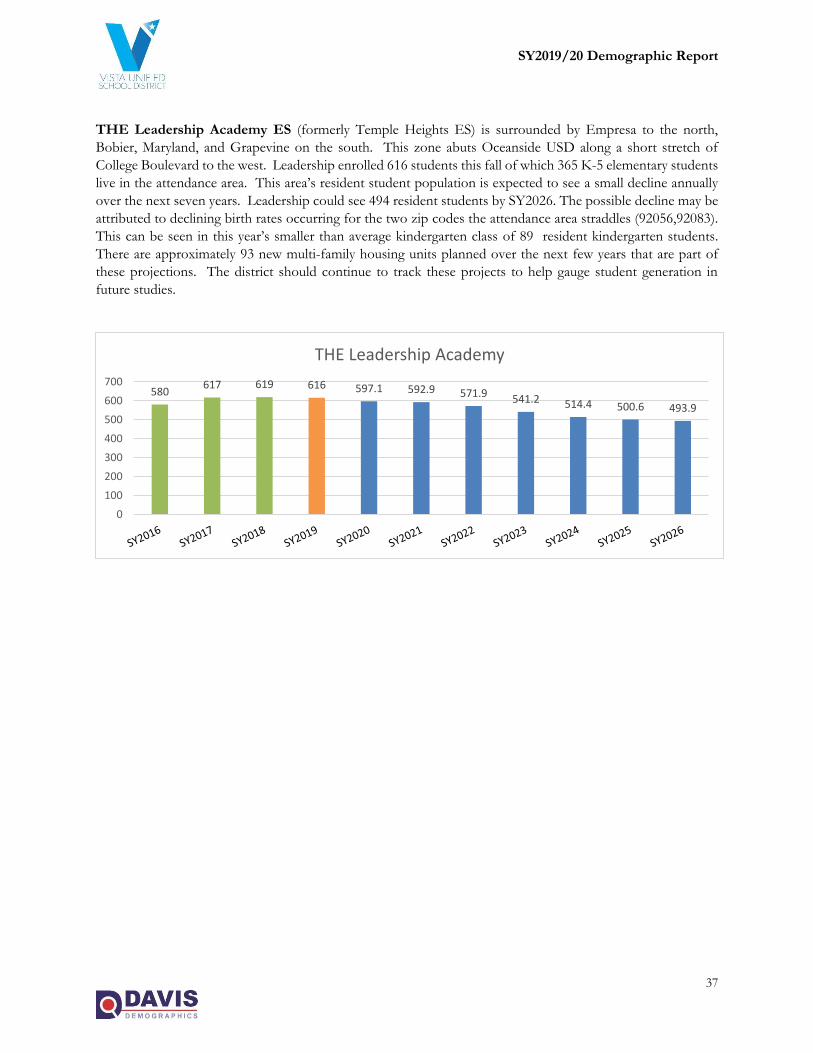
SY2019/20 Demographic Report
37
THE Leadership Academy ES (formerly Temple Heights ES) is surrounded by Empresa to the north,
Bobier, Maryland, and Grapevine on the south. This zone abuts Oceanside USD along a short stretch of
College Boulevard to the west. Leadership enrolled 616 students this fall of which 365 K-5 elementary students
live in the attendance area. This area’s resident student population is expected to see a small decline annually
over the next seven years. Leadership could see 494 resident students by SY2026. The possible decline may be
attributed to declining birth rates occurring for the two zip codes the attendance area straddles (92056,92083).
This can be seen in this year’s smaller than average kindergarten class of 89 resident kindergarten students.
There are approximately 93 new multi-family housing units planned over the next few years that are part of
these projections. The district should continue to track these projects to help gauge student generation in
future studies.
580617 619 616 597.1 592.9 571.9 541.2 514.4 500.6 493.9
0
100
200
300
400
500
600
700
THE Leadership Academy
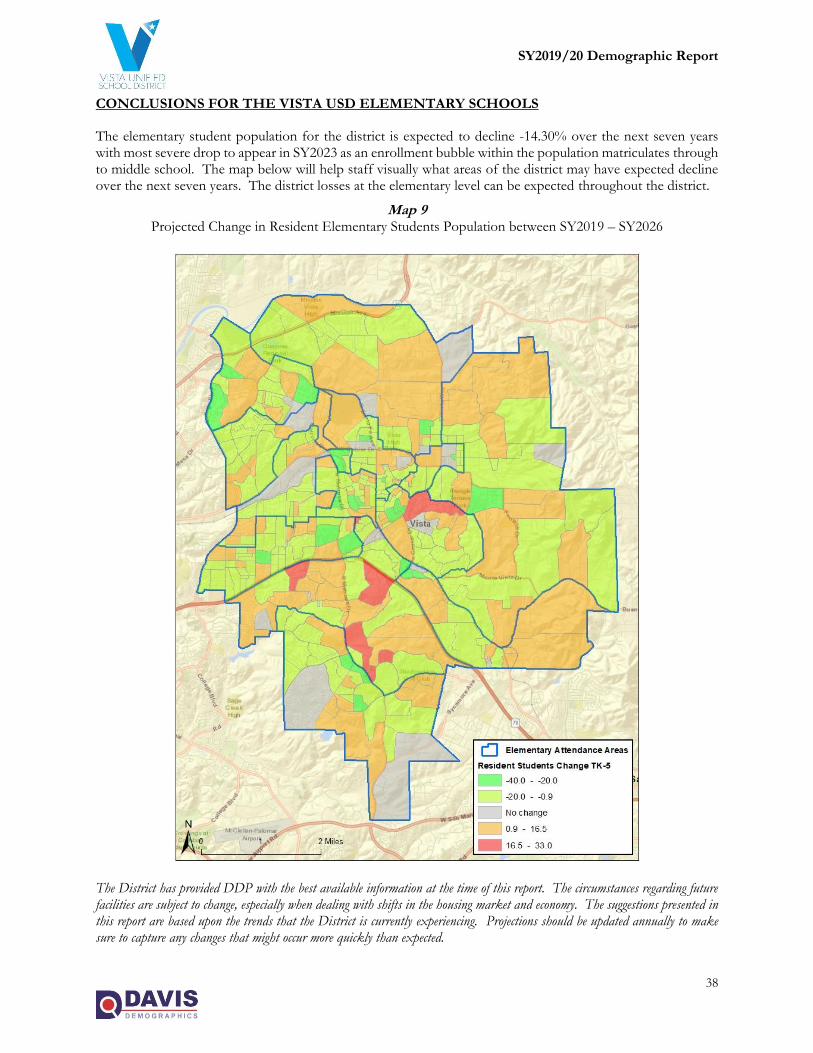
SY2019/20 Demographic Report
38
CONCLUSIONS FOR THE VISTA USD ELEMENTARY SCHOOLS
The elementary student population for the district is expected to decline -14.30% over the next seven years with most severe drop to appear in SY2023 as an enrollment bubble within the population matriculates through to middle school. The map below will help staff visually what areas of the district may have expected decline over the next seven years. The district losses at the elementary level can be expected throughout the district.
Map 9 Projected Change in Resident Elementary Students Population between SY2019 – SY2026
The District has provided DDP with the best available information at the time of this report. The circumstances regarding future facilities are subject to change, especially when dealing with shifts in the housing market and economy. The suggestions presented in this report are based upon the trends that the District is currently experiencing. Projections should be updated annually to make sure to capture any changes that might occur more quickly than expected.
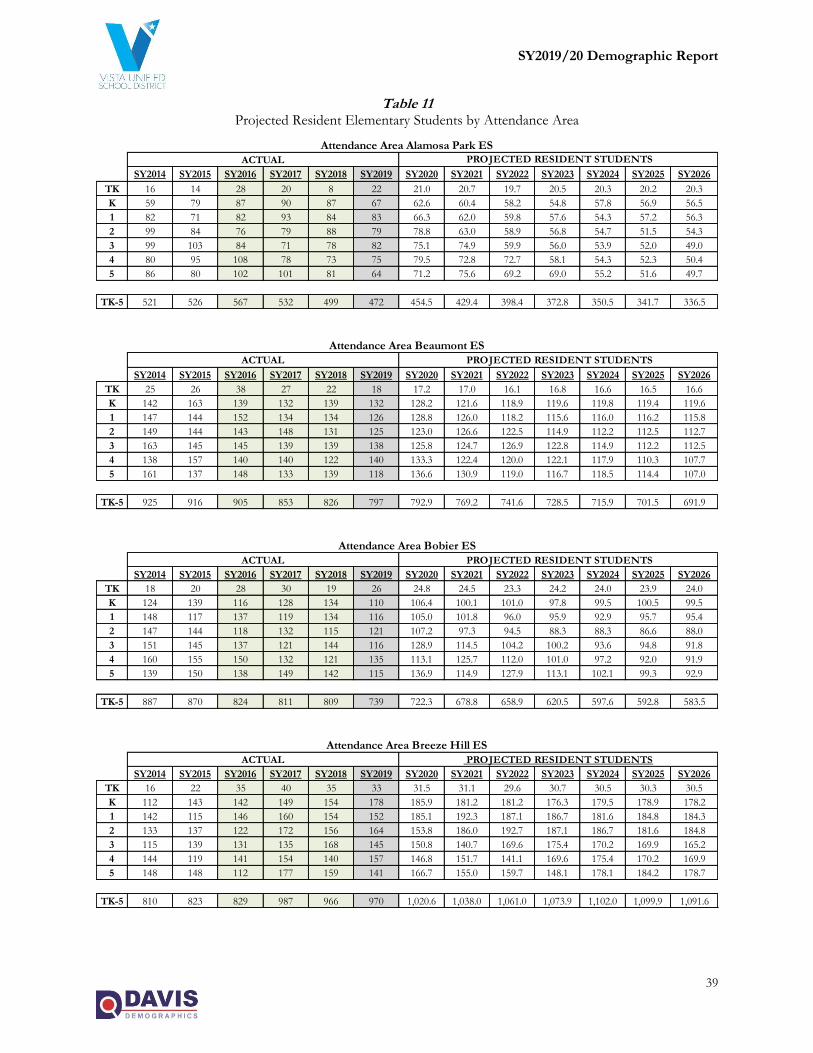
SY2019/20 Demographic Report
39
Table 11 Projected Resident Elementary Students by Attendance Area
SY2014 SY2015 SY2016 SY2017 SY2018 SY2019 SY2020 SY2021 SY2022 SY2023 SY2024 SY2025 SY2026
TK 16 14 28 20 8 22 21.0 20.7 19.7 20.5 20.3 20.2 20.3
K 59 79 87 90 87 67 62.6 60.4 58.2 54.8 57.8 56.9 56.5
1 82 71 82 93 84 83 66.3 62.0 59.8 57.6 54.3 57.2 56.3
2 99 84 76 79 88 79 78.8 63.0 58.9 56.8 54.7 51.5 54.3
3 99 103 84 71 78 82 75.1 74.9 59.9 56.0 53.9 52.0 49.0
4 80 95 108 78 73 75 79.5 72.8 72.7 58.1 54.3 52.3 50.4
5 86 80 102 101 81 64 71.2 75.6 69.2 69.0 55.2 51.6 49.7
TK-5 521 526 567 532 499 472 454.5 429.4 398.4 372.8 350.5 341.7 336.5
SY2014 SY2015 SY2016 SY2017 SY2018 SY2019 SY2020 SY2021 SY2022 SY2023 SY2024 SY2025 SY2026
TK 25 26 38 27 22 18 17.2 17.0 16.1 16.8 16.6 16.5 16.6
K 142 163 139 132 139 132 128.2 121.6 118.9 119.6 119.8 119.4 119.6
1 147 144 152 134 134 126 128.8 126.0 118.2 115.6 116.0 116.2 115.8
2 149 144 143 148 131 125 123.0 126.6 122.5 114.9 112.2 112.5 112.7
3 163 145 145 139 139 138 125.8 124.7 126.9 122.8 114.9 112.2 112.5
4 138 157 140 140 122 140 133.3 122.4 120.0 122.1 117.9 110.3 107.7
5 161 137 148 133 139 118 136.6 130.9 119.0 116.7 118.5 114.4 107.0
TK-5 925 916 905 853 826 797 792.9 769.2 741.6 728.5 715.9 701.5 691.9
SY2014 SY2015 SY2016 SY2017 SY2018 SY2019 SY2020 SY2021 SY2022 SY2023 SY2024 SY2025 SY2026
TK 18 20 28 30 19 26 24.8 24.5 23.3 24.2 24.0 23.9 24.0
K 124 139 116 128 134 110 106.4 100.1 101.0 97.8 99.5 100.5 99.5
1 148 117 137 119 134 116 105.0 101.8 96.0 95.9 92.9 95.7 95.4
2 147 144 118 132 115 121 107.2 97.3 94.5 88.3 88.3 86.6 88.0
3 151 145 137 121 144 116 128.9 114.5 104.2 100.2 93.6 94.8 91.8
4 160 155 150 132 121 135 113.1 125.7 112.0 101.0 97.2 92.0 91.9
5 139 150 138 149 142 115 136.9 114.9 127.9 113.1 102.1 99.3 92.9
TK-5 887 870 824 811 809 739 722.3 678.8 658.9 620.5 597.6 592.8 583.5
SY2014 SY2015 SY2016 SY2017 SY2018 SY2019 SY2020 SY2021 SY2022 SY2023 SY2024 SY2025 SY2026
TK 16 22 35 40 35 33 31.5 31.1 29.6 30.7 30.5 30.3 30.5
K 112 143 142 149 154 178 185.9 181.2 181.2 176.3 179.5 178.9 178.2
1 142 115 146 160 154 152 185.1 192.3 187.1 186.7 181.6 184.8 184.3
2 133 137 122 172 156 164 153.8 186.0 192.7 187.1 186.7 181.6 184.8
3 115 139 131 135 168 145 150.8 140.7 169.6 175.4 170.2 169.9 165.2
4 144 119 141 154 140 157 146.8 151.7 141.1 169.6 175.4 170.2 169.9
5 148 148 112 177 159 141 166.7 155.0 159.7 148.1 178.1 184.2 178.7
TK-5 810 823 829 987 966 970 1,020.6 1,038.0 1,061.0 1,073.9 1,102.0 1,099.9 1,091.6
PROJECTED RESIDENT STUDENTS
PROJECTED RESIDENT STUDENTS
ACTUAL
ACTUAL
Attendance Area Alamosa Park ES
Attendance Area Beaumont ES
PROJECTED RESIDENT STUDENTS
PROJECTED RESIDENT STUDENTS
ACTUAL
ACTUAL
Attendance Area Bobier ES
Attendance Area Breeze Hill ES
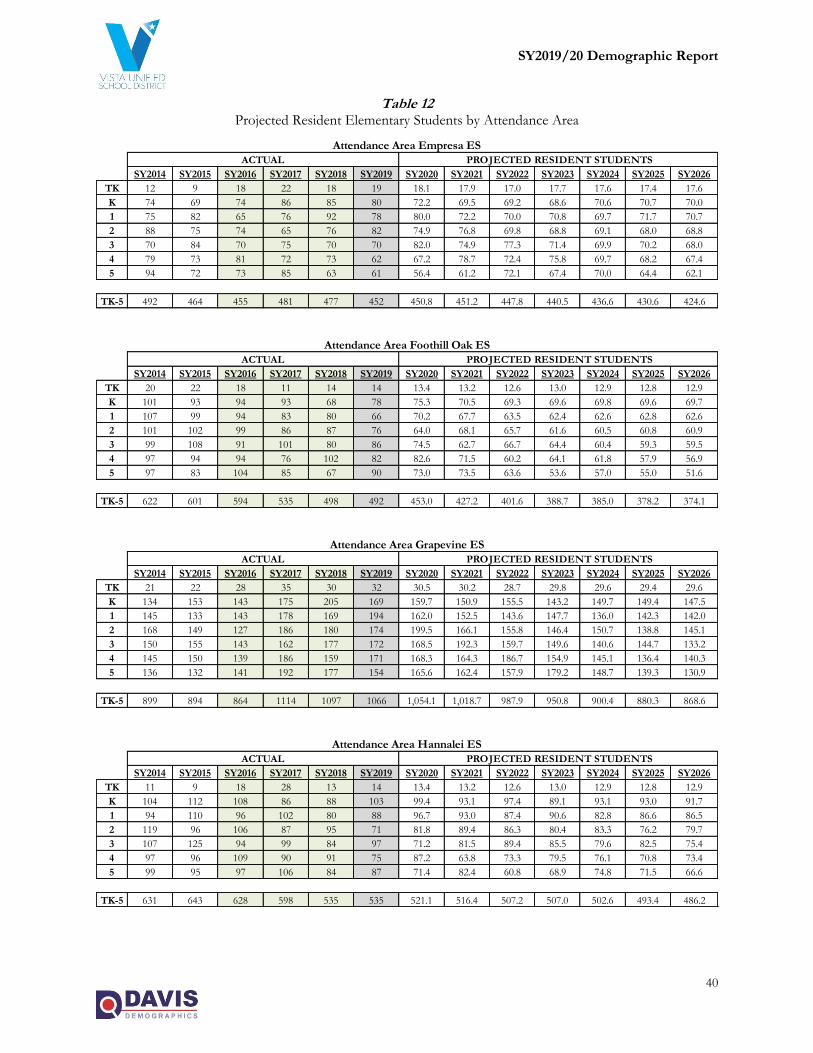
SY2019/20 Demographic Report
40
Table 12 Projected Resident Elementary Students by Attendance Area
SY2014 SY2015 SY2016 SY2017 SY2018 SY2019 SY2020 SY2021 SY2022 SY2023 SY2024 SY2025 SY2026
TK 12 9 18 22 18 19 18.1 17.9 17.0 17.7 17.6 17.4 17.6
K 74 69 74 86 85 80 72.2 69.5 69.2 68.6 70.6 70.7 70.0
1 75 82 65 76 92 78 80.0 72.2 70.0 70.8 69.7 71.7 70.7
2 88 75 74 65 76 82 74.9 76.8 69.8 68.8 69.1 68.0 68.8
3 70 84 70 75 70 70 82.0 74.9 77.3 71.4 69.9 70.2 68.0
4 79 73 81 72 73 62 67.2 78.7 72.4 75.8 69.7 68.2 67.4
5 94 72 73 85 63 61 56.4 61.2 72.1 67.4 70.0 64.4 62.1
TK-5 492 464 455 481 477 452 450.8 451.2 447.8 440.5 436.6 430.6 424.6
SY2014 SY2015 SY2016 SY2017 SY2018 SY2019 SY2020 SY2021 SY2022 SY2023 SY2024 SY2025 SY2026
TK 20 22 18 11 14 14 13.4 13.2 12.6 13.0 12.9 12.8 12.9
K 101 93 94 93 68 78 75.3 70.5 69.3 69.6 69.8 69.6 69.7
1 107 99 94 83 80 66 70.2 67.7 63.5 62.4 62.6 62.8 62.6
2 101 102 99 86 87 76 64.0 68.1 65.7 61.6 60.5 60.8 60.9
3 99 108 91 101 80 86 74.5 62.7 66.7 64.4 60.4 59.3 59.5
4 97 94 94 76 102 82 82.6 71.5 60.2 64.1 61.8 57.9 56.9
5 97 83 104 85 67 90 73.0 73.5 63.6 53.6 57.0 55.0 51.6
TK-5 622 601 594 535 498 492 453.0 427.2 401.6 388.7 385.0 378.2 374.1
SY2014 SY2015 SY2016 SY2017 SY2018 SY2019 SY2020 SY2021 SY2022 SY2023 SY2024 SY2025 SY2026
TK 21 22 28 35 30 32 30.5 30.2 28.7 29.8 29.6 29.4 29.6
K 134 153 143 175 205 169 159.7 150.9 155.5 143.2 149.7 149.4 147.5
1 145 133 143 178 169 194 162.0 152.5 143.6 147.7 136.0 142.3 142.0
2 168 149 127 186 180 174 199.5 166.1 155.8 146.4 150.7 138.8 145.1
3 150 155 143 162 177 172 168.5 192.3 159.7 149.6 140.6 144.7 133.2
4 145 150 139 186 159 171 168.3 164.3 186.7 154.9 145.1 136.4 140.3
5 136 132 141 192 177 154 165.6 162.4 157.9 179.2 148.7 139.3 130.9
TK-5 899 894 864 1114 1097 1066 1,054.1 1,018.7 987.9 950.8 900.4 880.3 868.6
SY2014 SY2015 SY2016 SY2017 SY2018 SY2019 SY2020 SY2021 SY2022 SY2023 SY2024 SY2025 SY2026
TK 11 9 18 28 13 14 13.4 13.2 12.6 13.0 12.9 12.8 12.9
K 104 112 108 86 88 103 99.4 93.1 97.4 89.1 93.1 93.0 91.7
1 94 110 96 102 80 88 96.7 93.0 87.4 90.6 82.8 86.6 86.5
2 119 96 106 87 95 71 81.8 89.4 86.3 80.4 83.3 76.2 79.7
3 107 125 94 99 84 97 71.2 81.5 89.4 85.5 79.6 82.5 75.4
4 97 96 109 90 91 75 87.2 63.8 73.3 79.5 76.1 70.8 73.4
5 99 95 97 106 84 87 71.4 82.4 60.8 68.9 74.8 71.5 66.6
TK-5 631 643 628 598 535 535 521.1 516.4 507.2 507.0 502.6 493.4 486.2
PROJECTED RESIDENT STUDENTS
PROJECTED RESIDENT STUDENTS
ACTUAL
ACTUAL
Attendance Area Empresa ES
Attendance Area Foothill Oak ES
PROJECTED RESIDENT STUDENTS
PROJECTED RESIDENT STUDENTS
ACTUAL
ACTUAL
Attendance Area Grapevine ES
Attendance Area Hannalei ES

SY2019/20 Demographic Report
41
Table 13 Projected Resident Elementary Students by Attendance Area
SY2014 SY2015 SY2016 SY2017 SY2018 SY2019 SY2020 SY2021 SY2022 SY2023 SY2024 SY2025 SY2026
TK 9 13 20 28 22 23 22.0 21.7 20.6 21.4 21.2 21.1 21.3
K 108 110 113 123 119 81 83.8 82.4 81.2 80.7 81.4 81.1 81.1
1 111 118 103 105 116 108 75.3 78.0 76.7 75.5 75.0 75.7 75.4
2 117 106 111 95 100 109 101.5 70.8 73.3 72.1 71.0 70.5 71.2
3 104 121 99 104 94 94 103.5 96.4 67.3 69.6 68.5 67.4 67.0
4 106 111 110 99 96 89 90.2 99.4 92.6 64.6 66.8 65.7 64.7
5 115 109 98 111 95 100 89.0 90.2 99.4 92.6 64.6 66.8 65.7
TK-5 670 688 654 665 642 604 565.3 538.9 511.1 476.5 448.5 448.3 446.4
SY2014 SY2015 SY2016 SY2017 SY2018 SY2019 SY2020 SY2021 SY2022 SY2023 SY2024 SY2025 SY2026
TK 14 24 14 24 18 17 16.2 16.0 15.2 15.8 15.7 15.6 15.7
K 124 113 118 120 114 112 106.9 99.8 105.3 94.3 99.8 99.8 98.0
1 108 123 111 141 122 115 112.0 106.9 99.8 105.3 94.3 99.8 99.8
2 131 103 110 139 144 115 115.0 112.0 106.9 99.8 105.3 94.3 99.8
3 117 130 104 122 132 130 105.8 105.8 103.0 98.3 91.8 96.8 86.8
4 112 118 118 124 126 120 126.1 102.6 102.6 99.9 95.4 89.1 93.9
5 102 105 110 133 120 126 115.2 121.1 98.5 98.5 96.0 91.6 85.5
TK-5 708 716 685 803 776 735 697.2 664.2 631.3 611.9 598.3 587.0 579.5
SY2014 SY2015 SY2016 SY2017 SY2018 SY2019 SY2020 SY2021 SY2022 SY2023 SY2024 SY2025 SY2026
TK 28 20 31 31 16 15 14.3 14.1 13.5 14.0 13.9 13.8 13.9
K 109 123 121 126 102 115 111.1 105.1 101.8 99.6 102.2 101.2 101.0
1 133 114 129 112 121 101 109.2 105.6 99.8 96.7 94.6 97.1 96.2
2 128 143 112 124 117 126 102.0 110.3 106.6 100.8 97.7 95.6 98.0
3 127 140 127 117 119 126 129.8 105.1 113.7 109.8 103.8 100.6 98.5
4 143 129 135 122 115 119 123.5 127.2 103.0 111.4 107.7 101.8 98.6
5 133 145 125 133 121 113 117.8 122.2 125.9 101.9 110.3 106.6 100.7
TK-5 801 814 780 765 711 715 707.7 689.6 664.3 634.2 630.2 616.7 606.9
SY2014 SY2015 SY2016 SY2017 SY2018 SY2019 SY2020 SY2021 SY2022 SY2023 SY2024 SY2025 SY2026
TK 13 18 22 20 23 29 27.7 27.3 26.0 27.0 26.8 26.6 26.8
K 123 98 113 124 93 111 108.5 102.6 101.2 101.3 101.9 101.4 101.5
1 107 117 111 112 122 103 116.9 114.4 107.8 105.4 105.7 106.0 105.4
2 110 105 118 103 104 115 95.0 107.7 105.0 98.2 96.2 96.2 96.4
3 96 108 106 123 106 112 122.3 101.3 114.2 110.4 103.5 101.0 101.0
4 119 105 108 102 115 115 111.2 121.2 100.3 112.1 108.6 101.4 99.0
5 111 118 108 108 109 112 119.9 116.0 125.9 103.4 115.8 111.8 104.5
TK-5 679 669 686 692 672 697 701.5 690.5 680.4 657.8 658.5 644.4 634.6
Attendance Area Mission Meadows ES
Attendance Area Monte Vista ES
PROJECTED RESIDENT STUDENTS
PROJECTED RESIDENT STUDENTS
ACTUAL
ACTUAL
Attendance Area Lake ES
Attendance Area Maryland ES
PROJECTED RESIDENT STUDENTS
PROJECTED RESIDENT STUDENTS
ACTUAL
ACTUAL
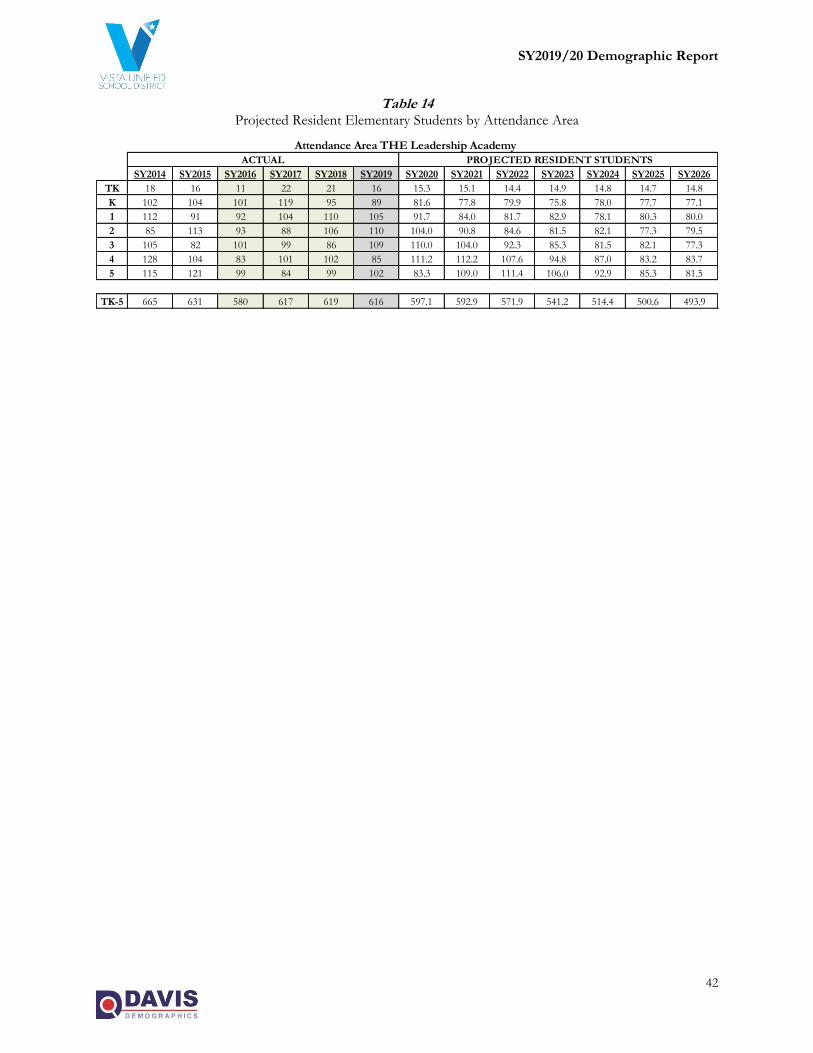
SY2019/20 Demographic Report
42
Table 14 Projected Resident Elementary Students by Attendance Area
SY2014 SY2015 SY2016 SY2017 SY2018 SY2019 SY2020 SY2021 SY2022 SY2023 SY2024 SY2025 SY2026
TK 18 16 11 22 21 16 15.3 15.1 14.4 14.9 14.8 14.7 14.8
K 102 104 101 119 95 89 81.6 77.8 79.9 75.8 78.0 77.7 77.1
1 112 91 92 104 110 105 91.7 84.0 81.7 82.9 78.1 80.3 80.0
2 85 113 93 88 106 110 104.0 90.8 84.6 81.5 82.1 77.3 79.5
3 105 82 101 99 86 109 110.0 104.0 92.3 85.3 81.5 82.1 77.3
4 128 104 83 101 102 85 111.2 112.2 107.6 94.8 87.0 83.2 83.7
5 115 121 99 84 99 102 83.3 109.0 111.4 106.0 92.9 85.3 81.5
TK-5 665 631 580 617 619 616 597.1 592.9 571.9 541.2 514.4 500.6 493.9
Attendance Area THE Leadership Academy
PROJECTED RESIDENT STUDENTSACTUAL
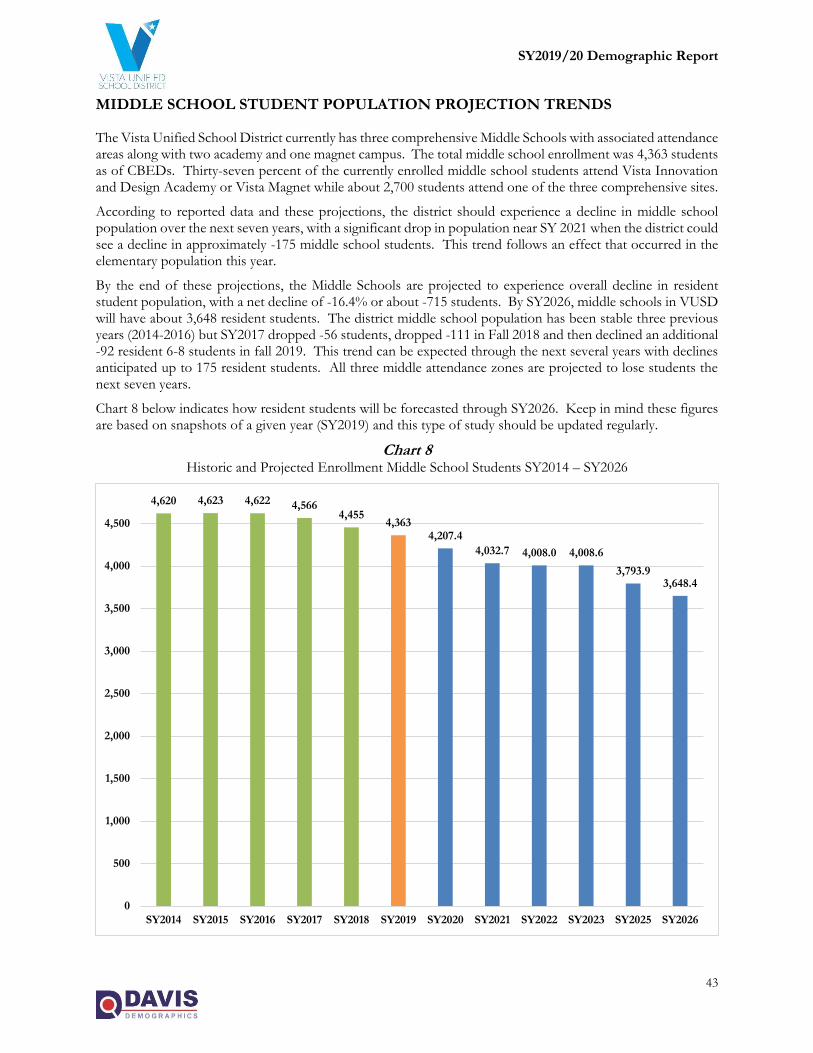
SY2019/20 Demographic Report
43
MIDDLE SCHOOL STUDENT POPULATION PROJECTION TRENDS
The Vista Unified School District currently has three comprehensive Middle Schools with associated attendance areas along with two academy and one magnet campus. The total middle school enrollment was 4,363 students as of CBEDs. Thirty-seven percent of the currently enrolled middle school students attend Vista Innovation and Design Academy or Vista Magnet while about 2,700 students attend one of the three comprehensive sites.
According to reported data and these projections, the district should experience a decline in middle school population over the next seven years, with a significant drop in population near SY 2021 when the district could see a decline in approximately -175 middle school students. This trend follows an effect that occurred in the elementary population this year.
By the end of these projections, the Middle Schools are projected to experience overall decline in resident student population, with a net decline of -16.4% or about -715 students. By SY2026, middle schools in VUSD will have about 3,648 resident students. The district middle school population has been stable three previous years (2014-2016) but SY2017 dropped -56 students, dropped -111 in Fall 2018 and then declined an additional -92 resident 6-8 students in fall 2019. This trend can be expected through the next several years with declines anticipated up to 175 resident students. All three middle attendance zones are projected to lose students the next seven years.
Chart 8 below indicates how resident students will be forecasted through SY2026. Keep in mind these figures are based on snapshots of a given year (SY2019) and this type of study should be updated regularly.
Chart 8 Historic and Projected Enrollment Middle School Students SY2014 – SY2026
4,620 4,623 4,622 4,5664,455
4,3634,207.4
4,032.7 4,008.0 4,008.6
3,793.93,648.4
0
500
1,000
1,500
2,000
2,500
3,000
3,500
4,000
4,500
SY2014 SY2015 SY2016 SY2017 SY2018 SY2019 SY2020 SY2021 SY2022 SY2023 SY2025 SY2026
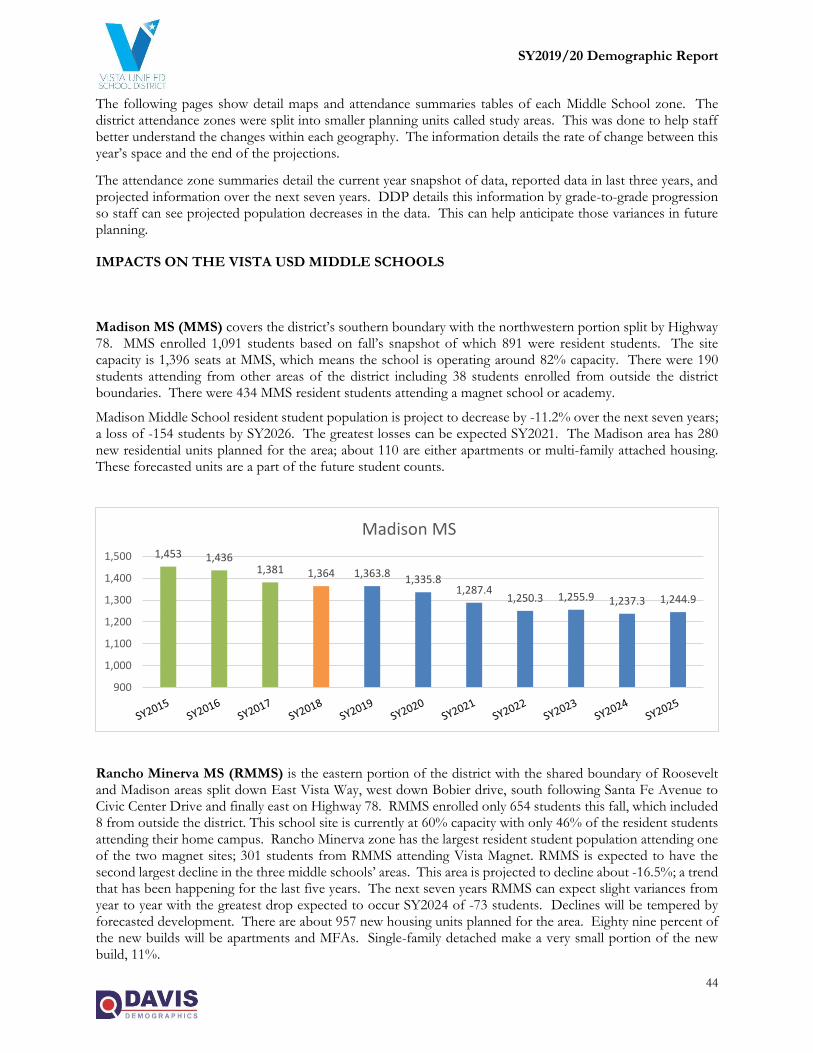
SY2019/20 Demographic Report
44
The following pages show detail maps and attendance summaries tables of each Middle School zone. The district attendance zones were split into smaller planning units called study areas. This was done to help staff better understand the changes within each geography. The information details the rate of change between this year’s space and the end of the projections.
The attendance zone summaries detail the current year snapshot of data, reported data in last three years, and projected information over the next seven years. DDP details this information by grade-to-grade progression so staff can see projected population decreases in the data. This can help anticipate those variances in future planning.
IMPACTS ON THE VISTA USD MIDDLE SCHOOLS
Madison MS (MMS) covers the district’s southern boundary with the northwestern portion split by Highway 78. MMS enrolled 1,091 students based on fall’s snapshot of which 891 were resident students. The site capacity is 1,396 seats at MMS, which means the school is operating around 82% capacity. There were 190 students attending from other areas of the district including 38 students enrolled from outside the district boundaries. There were 434 MMS resident students attending a magnet school or academy.
Madison Middle School resident student population is project to decrease by -11.2% over the next seven years; a loss of -154 students by SY2026. The greatest losses can be expected SY2021. The Madison area has 280 new residential units planned for the area; about 110 are either apartments or multi-family attached housing. These forecasted units are a part of the future student counts.
Rancho Minerva MS (RMMS) is the eastern portion of the district with the shared boundary of Roosevelt and Madison areas split down East Vista Way, west down Bobier drive, south following Santa Fe Avenue to Civic Center Drive and finally east on Highway 78. RMMS enrolled only 654 students this fall, which included 8 from outside the district. This school site is currently at 60% capacity with only 46% of the resident students attending their home campus. Rancho Minerva zone has the largest resident student population attending one of the two magnet sites; 301 students from RMMS attending Vista Magnet. RMMS is expected to have the second largest decline in the three middle schools’ areas. This area is projected to decline about -16.5%; a trend that has been happening for the last five years. The next seven years RMMS can expect slight variances from year to year with the greatest drop expected to occur SY2024 of -73 students. Declines will be tempered by forecasted development. There are about 957 new housing units planned for the area. Eighty nine percent of the new builds will be apartments and MFAs. Single-family detached make a very small portion of the new build, 11%.
1,453 1,4361,381 1,364 1,363.8
1,335.81,287.4
1,250.3 1,255.9 1,237.3 1,244.9
900
1,000
1,100
1,200
1,300
1,400
1,500
Madison MS
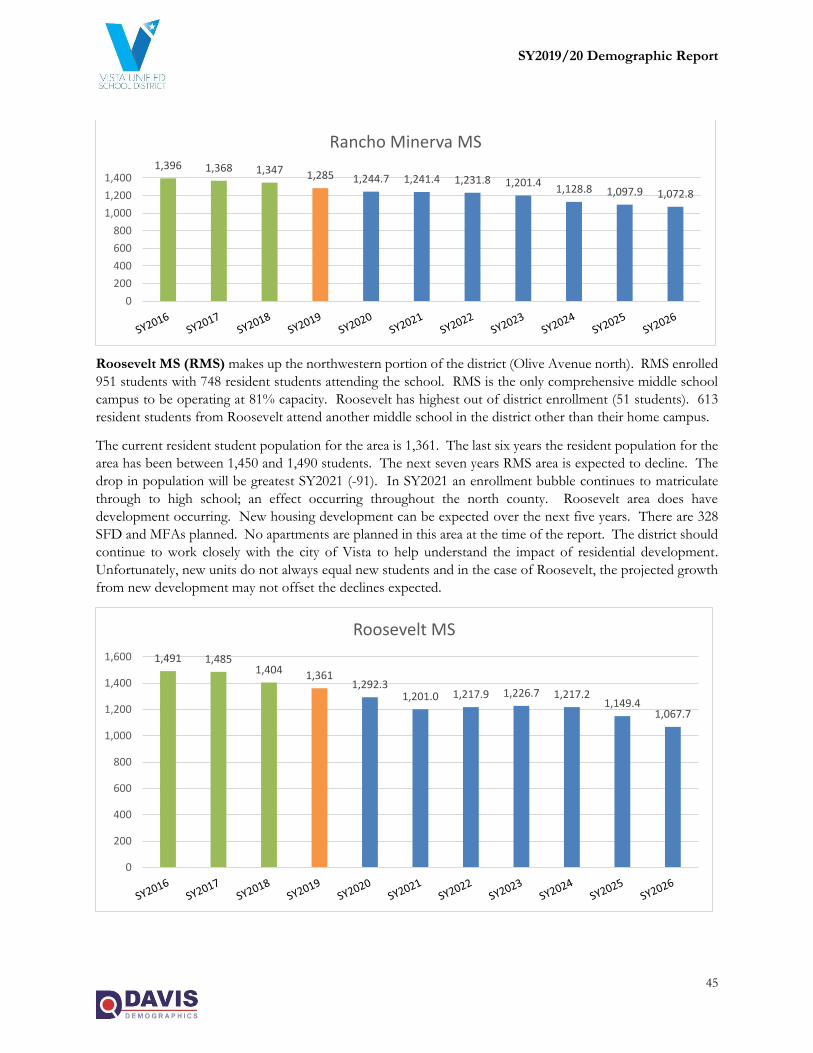
SY2019/20 Demographic Report
45
Roosevelt MS (RMS) makes up the northwestern portion of the district (Olive Avenue north). RMS enrolled
951 students with 748 resident students attending the school. RMS is the only comprehensive middle school
campus to be operating at 81% capacity. Roosevelt has highest out of district enrollment (51 students). 613
resident students from Roosevelt attend another middle school in the district other than their home campus.
The current resident student population for the area is 1,361. The last six years the resident population for the
area has been between 1,450 and 1,490 students. The next seven years RMS area is expected to decline. The
drop in population will be greatest SY2021 (-91). In SY2021 an enrollment bubble continues to matriculate
through to high school; an effect occurring throughout the north county. Roosevelt area does have
development occurring. New housing development can be expected over the next five years. There are 328
SFD and MFAs planned. No apartments are planned in this area at the time of the report. The district should
continue to work closely with the city of Vista to help understand the impact of residential development.
Unfortunately, new units do not always equal new students and in the case of Roosevelt, the projected growth
from new development may not offset the declines expected.
1,396 1,368 1,347 1,285 1,244.7 1,241.4 1,231.8 1,201.41,128.8 1,097.9 1,072.8
0
200
400
600
800
1,000
1,200
1,400
Rancho Minerva MS
1,491 1,4851,404 1,361
1,292.31,201.0 1,217.9 1,226.7 1,217.2
1,149.41,067.7
0
200
400
600
800
1,000
1,200
1,400
1,600
Roosevelt MS
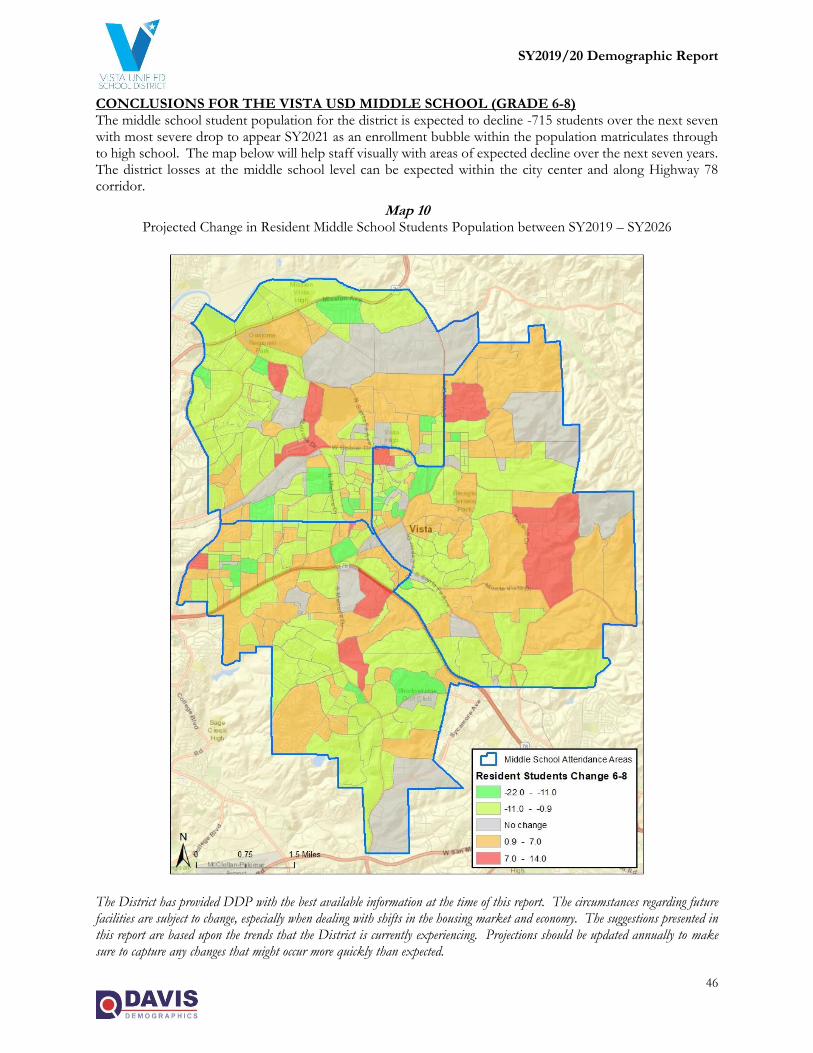
SY2019/20 Demographic Report
46
CONCLUSIONS FOR THE VISTA USD MIDDLE SCHOOL (GRADE 6-8) The middle school student population for the district is expected to decline -715 students over the next seven with most severe drop to appear SY2021 as an enrollment bubble within the population matriculates through to high school. The map below will help staff visually with areas of expected decline over the next seven years. The district losses at the middle school level can be expected within the city center and along Highway 78 corridor.
Map 10 Projected Change in Resident Middle School Students Population between SY2019 – SY2026
The District has provided DDP with the best available information at the time of this report. The circumstances regarding future facilities are subject to change, especially when dealing with shifts in the housing market and economy. The suggestions presented in this report are based upon the trends that the District is currently experiencing. Projections should be updated annually to make sure to capture any changes that might occur more quickly than expected.
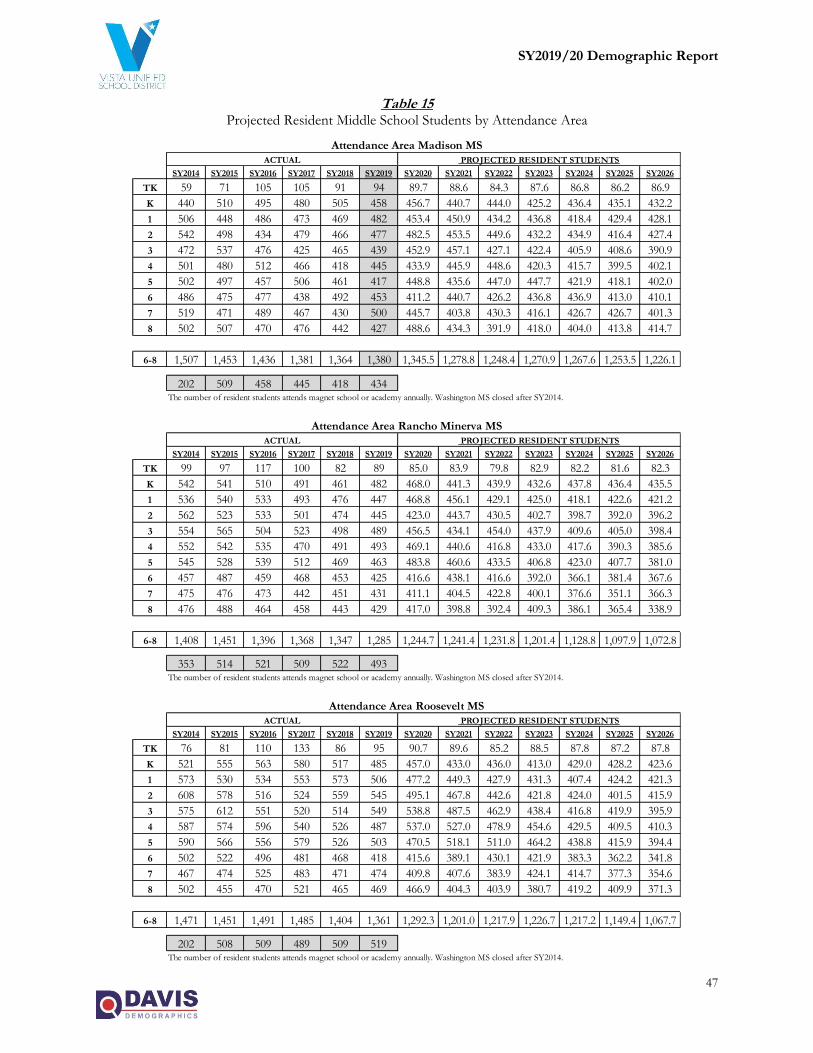
SY2019/20 Demographic Report
47
Table 15 Projected Resident Middle School Students by Attendance Area
SY2014 SY2015 SY2016 SY2017 SY2018 SY2019 SY2020 SY2021 SY2022 SY2023 SY2024 SY2025 SY2026
TK 59 71 105 105 91 94 89.7 88.6 84.3 87.6 86.8 86.2 86.9
K 440 510 495 480 505 458 456.7 440.7 444.0 425.2 436.4 435.1 432.2
1 506 448 486 473 469 482 453.4 450.9 434.2 436.8 418.4 429.4 428.1
2 542 498 434 479 466 477 482.5 453.5 449.6 432.2 434.9 416.4 427.4
3 472 537 476 425 465 439 452.9 457.1 427.1 422.4 405.9 408.6 390.9
4 501 480 512 466 418 445 433.9 445.9 448.6 420.3 415.7 399.5 402.1
5 502 497 457 506 461 417 448.8 435.6 447.0 447.7 421.9 418.1 402.0
6 486 475 477 438 492 453 411.2 440.7 426.2 436.8 436.9 413.0 410.1
7 519 471 489 467 430 500 445.7 403.8 430.3 416.1 426.7 426.7 401.3
8 502 507 470 476 442 427 488.6 434.3 391.9 418.0 404.0 413.8 414.7
6-8 1,507 1,453 1,436 1,381 1,364 1,380 1,345.5 1,278.8 1,248.4 1,270.9 1,267.6 1,253.5 1,226.1
202 509 458 445 418 434
SY2014 SY2015 SY2016 SY2017 SY2018 SY2019 SY2020 SY2021 SY2022 SY2023 SY2024 SY2025 SY2026
TK 99 97 117 100 82 89 85.0 83.9 79.8 82.9 82.2 81.6 82.3
K 542 541 510 491 461 482 468.0 441.3 439.9 432.6 437.8 436.4 435.5
1 536 540 533 493 476 447 468.8 456.1 429.1 425.0 418.1 422.6 421.2
2 562 523 533 501 474 445 423.0 443.7 430.5 402.7 398.7 392.0 396.2
3 554 565 504 523 498 489 456.5 434.1 454.0 437.9 409.6 405.0 398.4
4 552 542 535 470 491 493 469.1 440.6 416.8 433.0 417.6 390.3 385.6
5 545 528 539 512 469 463 483.8 460.6 433.5 406.8 423.0 407.7 381.0
6 457 487 459 468 453 425 416.6 438.1 416.6 392.0 366.1 381.4 367.6
7 475 476 473 442 451 431 411.1 404.5 422.8 400.1 376.6 351.1 366.3
8 476 488 464 458 443 429 417.0 398.8 392.4 409.3 386.1 365.4 338.9
6-8 1,408 1,451 1,396 1,368 1,347 1,285 1,244.7 1,241.4 1,231.8 1,201.4 1,128.8 1,097.9 1,072.8
353 514 521 509 522 493
SY2014 SY2015 SY2016 SY2017 SY2018 SY2019 SY2020 SY2021 SY2022 SY2023 SY2024 SY2025 SY2026
TK 76 81 110 133 86 95 90.7 89.6 85.2 88.5 87.8 87.2 87.8
K 521 555 563 580 517 485 457.0 433.0 436.0 413.0 429.0 428.2 423.6
1 573 530 534 553 573 506 477.2 449.3 427.9 431.3 407.4 424.2 421.3
2 608 578 516 524 559 545 495.1 467.8 442.6 421.8 424.0 401.5 415.9
3 575 612 551 520 514 549 538.8 487.5 462.9 438.4 416.8 419.9 395.9
4 587 574 596 540 526 487 537.0 527.0 478.9 454.6 429.5 409.5 410.3
5 590 566 556 579 526 503 470.5 518.1 511.0 464.2 438.8 415.9 394.4
6 502 522 496 481 468 418 415.6 389.1 430.1 421.9 383.3 362.2 341.8
7 467 474 525 483 471 474 409.8 407.6 383.9 424.1 414.7 377.3 354.6
8 502 455 470 521 465 469 466.9 404.3 403.9 380.7 419.2 409.9 371.3
6-8 1,471 1,451 1,491 1,485 1,404 1,361 1,292.3 1,201.0 1,217.9 1,226.7 1,217.2 1,149.4 1,067.7
202 508 509 489 509 519
Attendance Area Madison MS
PROJECTED RESIDENT STUDENTS
Attendance Area Rancho Minerva MS
PROJECTED RESIDENT STUDENTS
ACTUAL
ACTUAL
The number of resident students attends magnet school or academy annually. Washington MS closed after SY2014.
The number of resident students attends magnet school or academy annually. Washington MS closed after SY2014.
The number of resident students attends magnet school or academy annually. Washington MS closed after SY2014.
Attendance Area Roosevelt MS
PROJECTED RESIDENT STUDENTSACTUAL
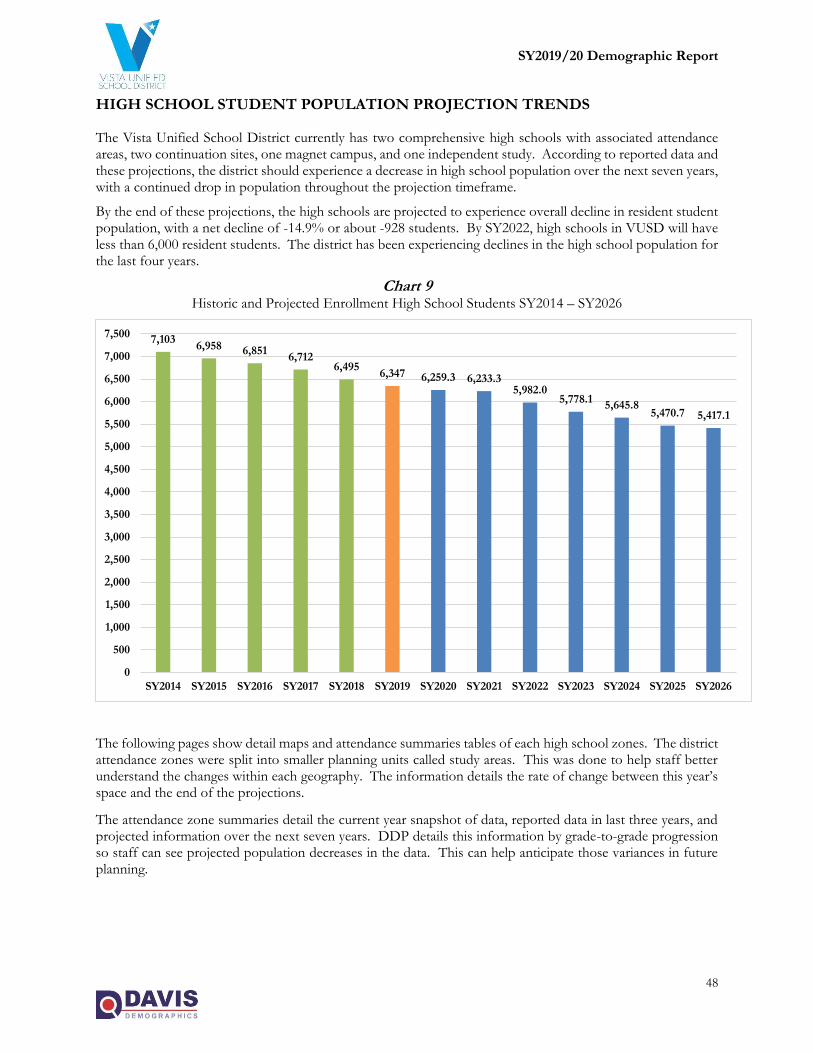
SY2019/20 Demographic Report
48
HIGH SCHOOL STUDENT POPULATION PROJECTION TRENDS
The Vista Unified School District currently has two comprehensive high schools with associated attendance areas, two continuation sites, one magnet campus, and one independent study. According to reported data and these projections, the district should experience a decrease in high school population over the next seven years, with a continued drop in population throughout the projection timeframe.
By the end of these projections, the high schools are projected to experience overall decline in resident student population, with a net decline of -14.9% or about -928 students. By SY2022, high schools in VUSD will have less than 6,000 resident students. The district has been experiencing declines in the high school population for the last four years.
Chart 9 Historic and Projected Enrollment High School Students SY2014 – SY2026
The following pages show detail maps and attendance summaries tables of each high school zones. The district attendance zones were split into smaller planning units called study areas. This was done to help staff better understand the changes within each geography. The information details the rate of change between this year’s space and the end of the projections.
The attendance zone summaries detail the current year snapshot of data, reported data in last three years, and projected information over the next seven years. DDP details this information by grade-to-grade progression so staff can see projected population decreases in the data. This can help anticipate those variances in future planning.
7,1036,958 6,851
6,7126,495
6,347 6,259.3 6,233.35,982.0
5,778.15,645.8
5,470.7 5,417.1
0
500
1,000
1,500
2,000
2,500
3,000
3,500
4,000
4,500
5,000
5,500
6,000
6,500
7,000
7,500
SY2014 SY2015 SY2016 SY2017 SY2018 SY2019 SY2020 SY2021 SY2022 SY2023 SY2024 SY2025 SY2026
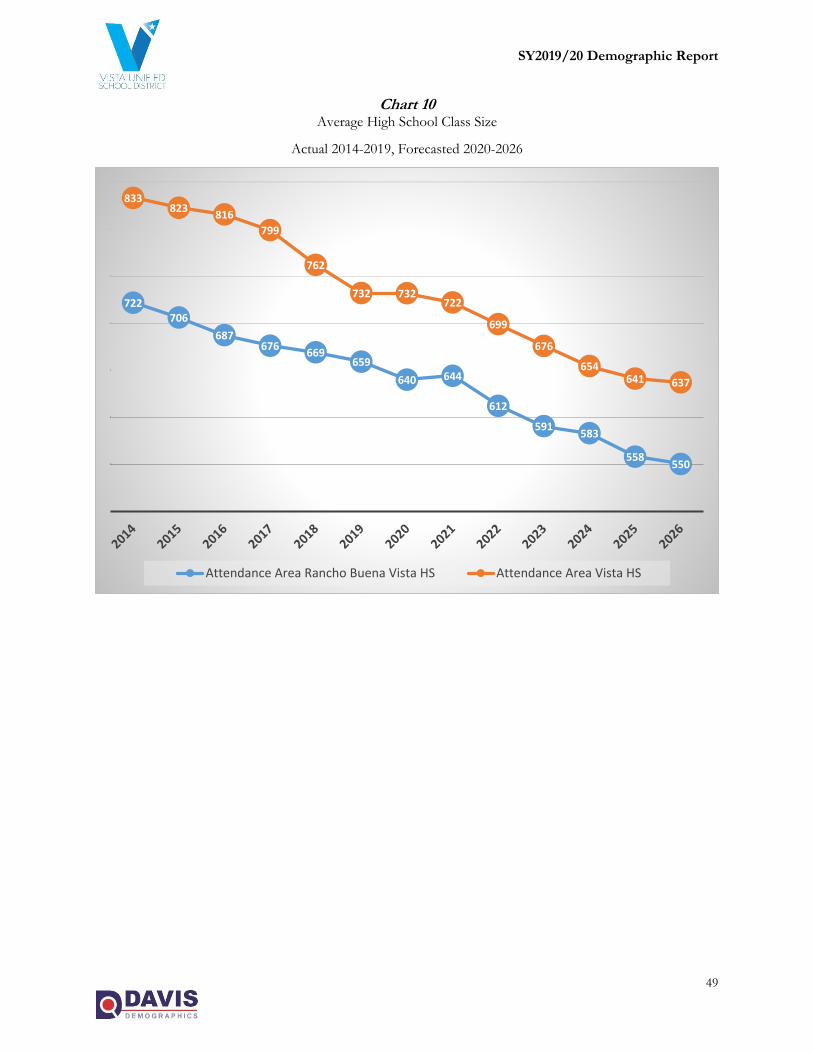
SY2019/20 Demographic Report
49
Chart 10 Average High School Class Size
Actual 2014-2019, Forecasted 2020-2026
722706
687676
669659
640 644
612
591583
558550
833823
816
799
762
732 732722
699
676
654641 637
Attendance Area Rancho Buena Vista HS Attendance Area Vista HS
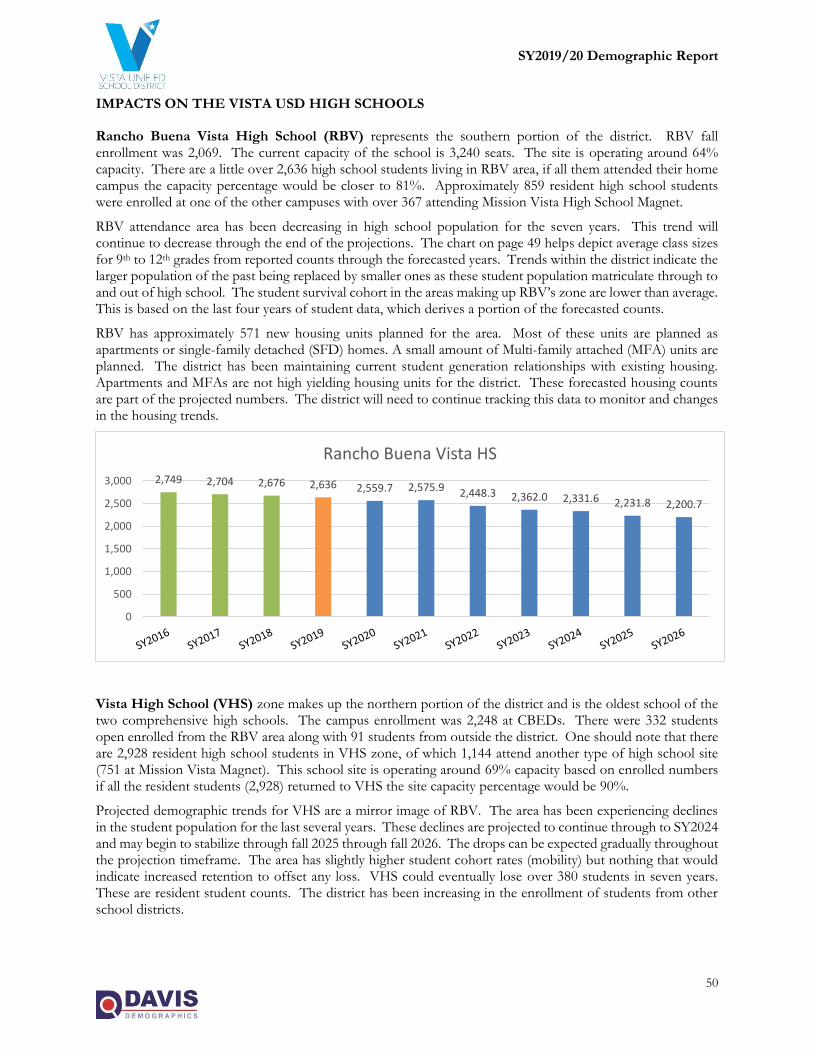
SY2019/20 Demographic Report
50
IMPACTS ON THE VISTA USD HIGH SCHOOLS
Rancho Buena Vista High School (RBV) represents the southern portion of the district. RBV fall enrollment was 2,069. The current capacity of the school is 3,240 seats. The site is operating around 64% capacity. There are a little over 2,636 high school students living in RBV area, if all them attended their home campus the capacity percentage would be closer to 81%. Approximately 859 resident high school students were enrolled at one of the other campuses with over 367 attending Mission Vista High School Magnet.
RBV attendance area has been decreasing in high school population for the seven years. This trend will continue to decrease through the end of the projections. The chart on page 49 helps depict average class sizes for 9th to 12th grades from reported counts through the forecasted years. Trends within the district indicate the larger population of the past being replaced by smaller ones as these student population matriculate through to and out of high school. The student survival cohort in the areas making up RBV’s zone are lower than average. This is based on the last four years of student data, which derives a portion of the forecasted counts.
RBV has approximately 571 new housing units planned for the area. Most of these units are planned as apartments or single-family detached (SFD) homes. A small amount of Multi-family attached (MFA) units are planned. The district has been maintaining current student generation relationships with existing housing. Apartments and MFAs are not high yielding housing units for the district. These forecasted housing counts are part of the projected numbers. The district will need to continue tracking this data to monitor and changes in the housing trends.
Vista High School (VHS) zone makes up the northern portion of the district and is the oldest school of the two comprehensive high schools. The campus enrollment was 2,248 at CBEDs. There were 332 students open enrolled from the RBV area along with 91 students from outside the district. One should note that there are 2,928 resident high school students in VHS zone, of which 1,144 attend another type of high school site (751 at Mission Vista Magnet). This school site is operating around 69% capacity based on enrolled numbers if all the resident students (2,928) returned to VHS the site capacity percentage would be 90%.
Projected demographic trends for VHS are a mirror image of RBV. The area has been experiencing declines in the student population for the last several years. These declines are projected to continue through to SY2024 and may begin to stabilize through fall 2025 through fall 2026. The drops can be expected gradually throughout the projection timeframe. The area has slightly higher student cohort rates (mobility) but nothing that would indicate increased retention to offset any loss. VHS could eventually lose over 380 students in seven years. These are resident student counts. The district has been increasing in the enrollment of students from other school districts.
2,749 2,704 2,676 2,636 2,559.7 2,575.9 2,448.3 2,362.0 2,331.6 2,231.8 2,200.7
0
500
1,000
1,500
2,000
2,500
3,000
Rancho Buena Vista HS
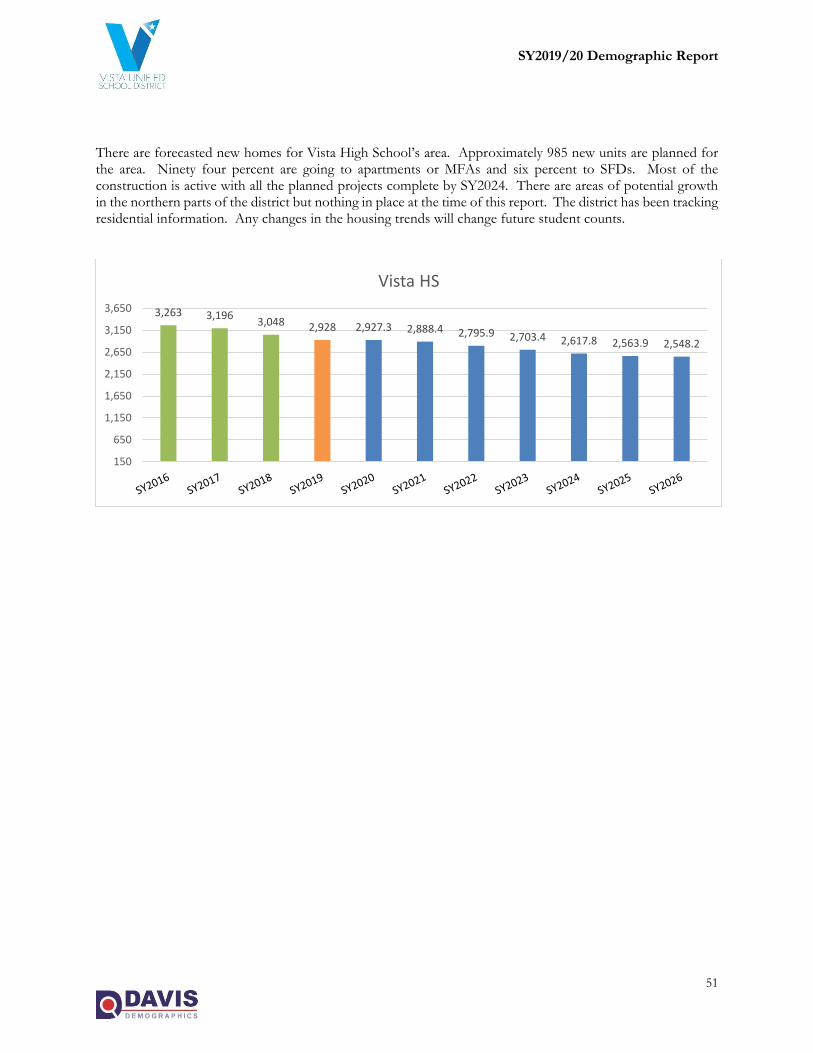
SY2019/20 Demographic Report
51
There are forecasted new homes for Vista High School’s area. Approximately 985 new units are planned for the area. Ninety four percent are going to apartments or MFAs and six percent to SFDs. Most of the construction is active with all the planned projects complete by SY2024. There are areas of potential growth in the northern parts of the district but nothing in place at the time of this report. The district has been tracking residential information. Any changes in the housing trends will change future student counts.
3,263 3,1963,048 2,928 2,927.3 2,888.4 2,795.9 2,703.4 2,617.8 2,563.9 2,548.2
150
650
1,150
1,650
2,150
2,650
3,150
3,650
Vista HS
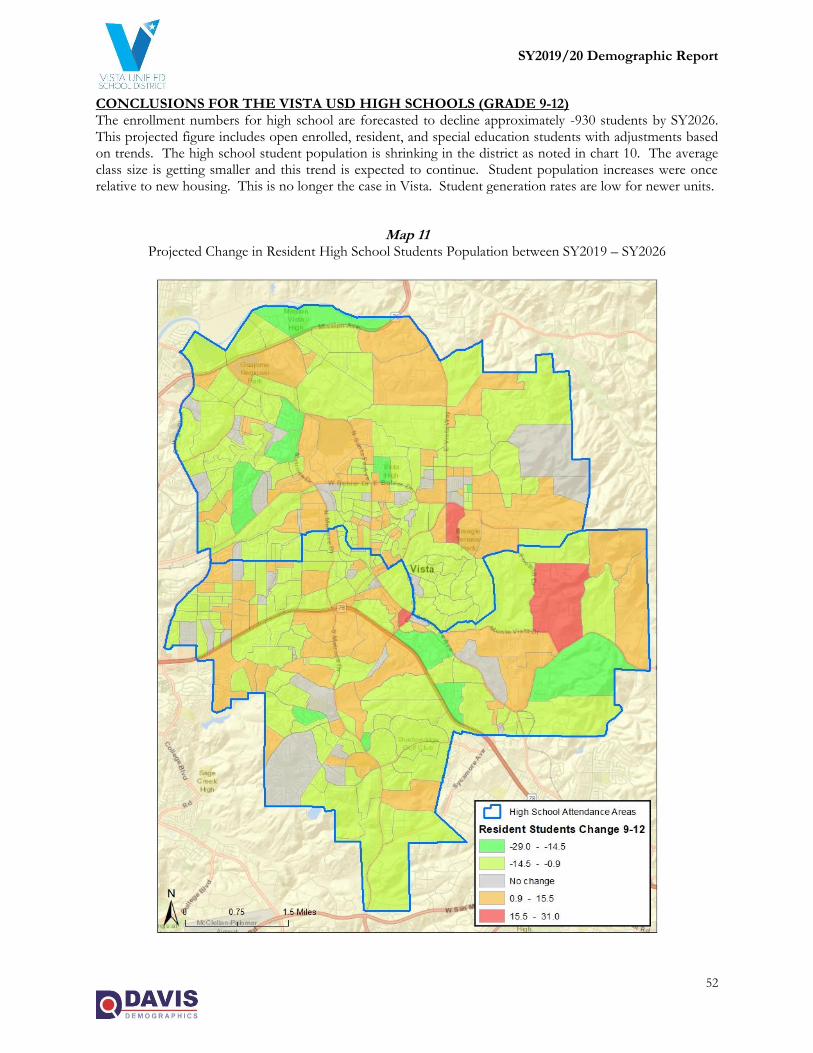
SY2019/20 Demographic Report
52
CONCLUSIONS FOR THE VISTA USD HIGH SCHOOLS (GRADE 9-12) The enrollment numbers for high school are forecasted to decline approximately -930 students by SY2026. This projected figure includes open enrolled, resident, and special education students with adjustments based on trends. The high school student population is shrinking in the district as noted in chart 10. The average class size is getting smaller and this trend is expected to continue. Student population increases were once relative to new housing. This is no longer the case in Vista. Student generation rates are low for newer units.
Map 11 Projected Change in Resident High School Students Population between SY2019 – SY2026
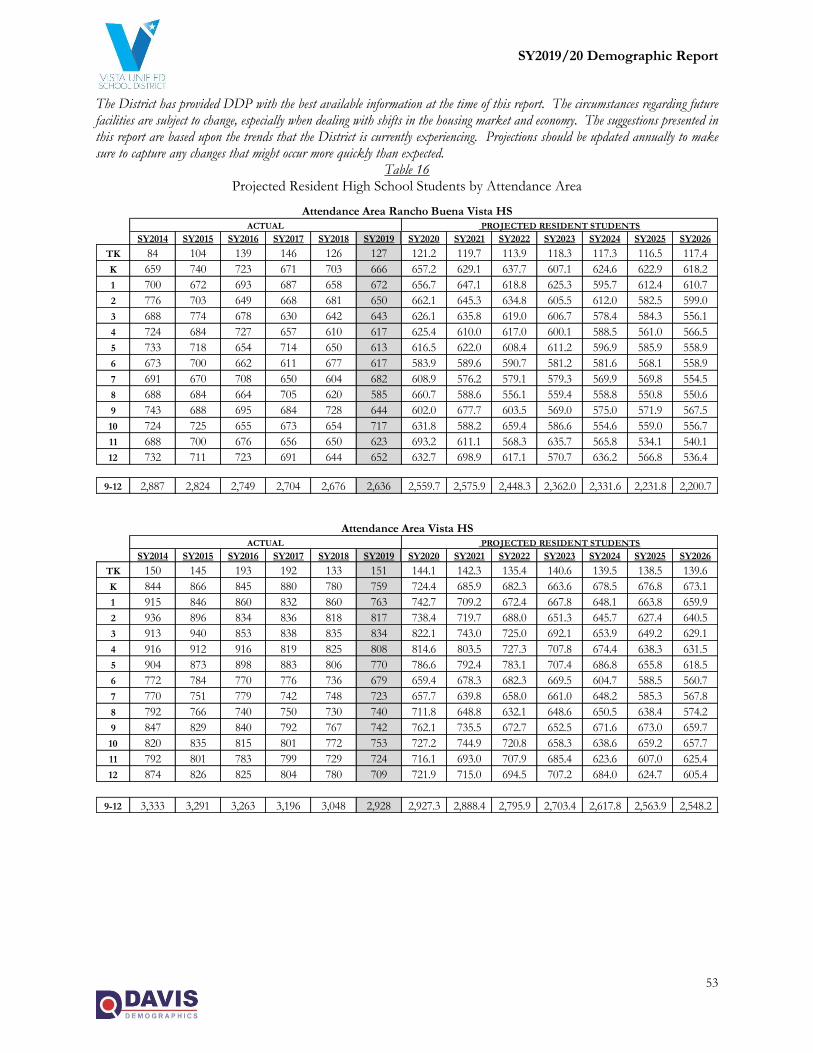
SY2019/20 Demographic Report
53
The District has provided DDP with the best available information at the time of this report. The circumstances regarding future facilities are subject to change, especially when dealing with shifts in the housing market and economy. The suggestions presented in this report are based upon the trends that the District is currently experiencing. Projections should be updated annually to make sure to capture any changes that might occur more quickly than expected.
Table 16 Projected Resident High School Students by Attendance Area
SY2014 SY2015 SY2016 SY2017 SY2018 SY2019 SY2020 SY2021 SY2022 SY2023 SY2024 SY2025 SY2026
TK 84 104 139 146 126 127 121.2 119.7 113.9 118.3 117.3 116.5 117.4
K 659 740 723 671 703 666 657.2 629.1 637.7 607.1 624.6 622.9 618.2
1 700 672 693 687 658 672 656.7 647.1 618.8 625.3 595.7 612.4 610.7
2 776 703 649 668 681 650 662.1 645.3 634.8 605.5 612.0 582.5 599.0
3 688 774 678 630 642 643 626.1 635.8 619.0 606.7 578.4 584.3 556.1
4 724 684 727 657 610 617 625.4 610.0 617.0 600.1 588.5 561.0 566.5
5 733 718 654 714 650 613 616.5 622.0 608.4 611.2 596.9 585.9 558.9
6 673 700 662 611 677 617 583.9 589.6 590.7 581.2 581.6 568.1 558.9
7 691 670 708 650 604 682 608.9 576.2 579.1 579.3 569.9 569.8 554.5
8 688 684 664 705 620 585 660.7 588.6 556.1 559.4 558.8 550.8 550.6
9 743 688 695 684 728 644 602.0 677.7 603.5 569.0 575.0 571.9 567.5
10 724 725 655 673 654 717 631.8 588.2 659.4 586.6 554.6 559.0 556.7
11 688 700 676 656 650 623 693.2 611.1 568.3 635.7 565.8 534.1 540.1
12 732 711 723 691 644 652 632.7 698.9 617.1 570.7 636.2 566.8 536.4
9-12 2,887 2,824 2,749 2,704 2,676 2,636 2,559.7 2,575.9 2,448.3 2,362.0 2,331.6 2,231.8 2,200.7
SY2014 SY2015 SY2016 SY2017 SY2018 SY2019 SY2020 SY2021 SY2022 SY2023 SY2024 SY2025 SY2026
TK 150 145 193 192 133 151 144.1 142.3 135.4 140.6 139.5 138.5 139.6
K 844 866 845 880 780 759 724.4 685.9 682.3 663.6 678.5 676.8 673.1
1 915 846 860 832 860 763 742.7 709.2 672.4 667.8 648.1 663.8 659.9
2 936 896 834 836 818 817 738.4 719.7 688.0 651.3 645.7 627.4 640.5
3 913 940 853 838 835 834 822.1 743.0 725.0 692.1 653.9 649.2 629.1
4 916 912 916 819 825 808 814.6 803.5 727.3 707.8 674.4 638.3 631.5
5 904 873 898 883 806 770 786.6 792.4 783.1 707.4 686.8 655.8 618.5
6 772 784 770 776 736 679 659.4 678.3 682.3 669.5 604.7 588.5 560.7
7 770 751 779 742 748 723 657.7 639.8 658.0 661.0 648.2 585.3 567.8
8 792 766 740 750 730 740 711.8 648.8 632.1 648.6 650.5 638.4 574.2
9 847 829 840 792 767 742 762.1 735.5 672.7 652.5 671.6 673.0 659.7
10 820 835 815 801 772 753 727.2 744.9 720.8 658.3 638.6 659.2 657.7
11 792 801 783 799 729 724 716.1 693.0 707.9 685.4 623.6 607.0 625.4
12 874 826 825 804 780 709 721.9 715.0 694.5 707.2 684.0 624.7 605.4
9-12 3,333 3,291 3,263 3,196 3,048 2,928 2,927.3 2,888.4 2,795.9 2,703.4 2,617.8 2,563.9 2,548.2
Attendance Area Rancho Buena Vista HS
ACTUAL PROJECTED RESIDENT STUDENTS
Attendance Area Vista HS
ACTUAL PROJECTED RESIDENT STUDENTS
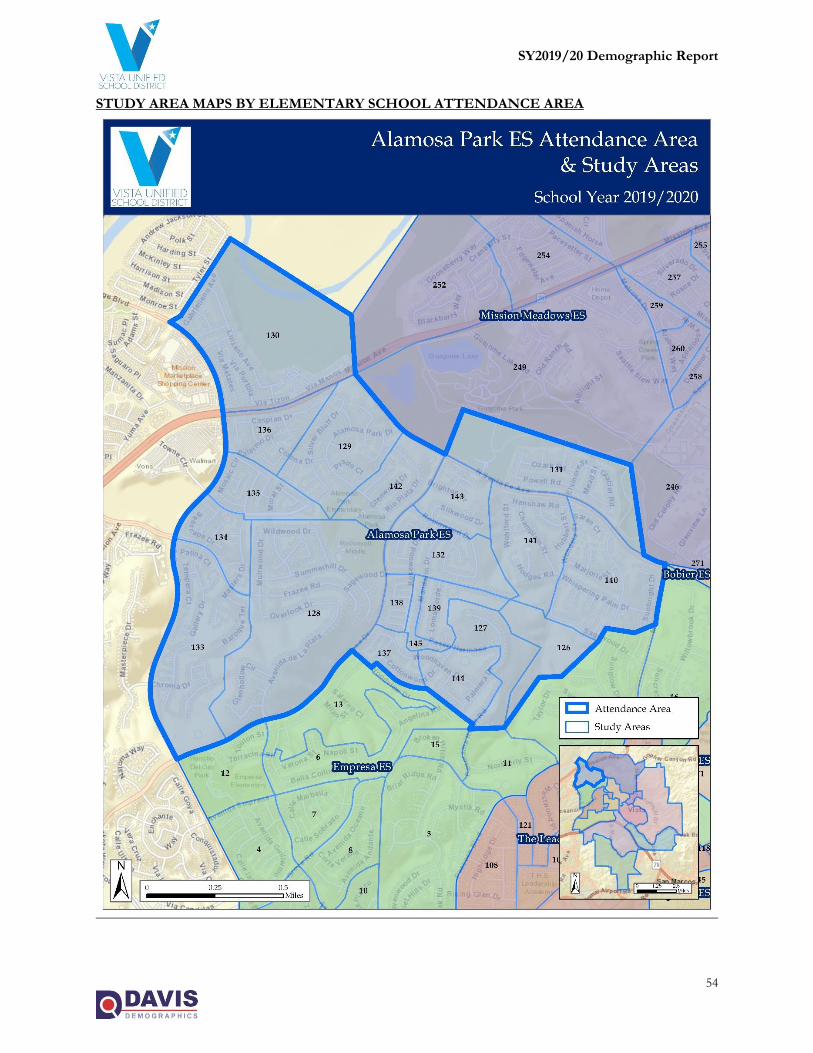
SY2019/20 Demographic Report
54
STUDY AREA MAPS BY ELEMENTARY SCHOOL ATTENDANCE AREA
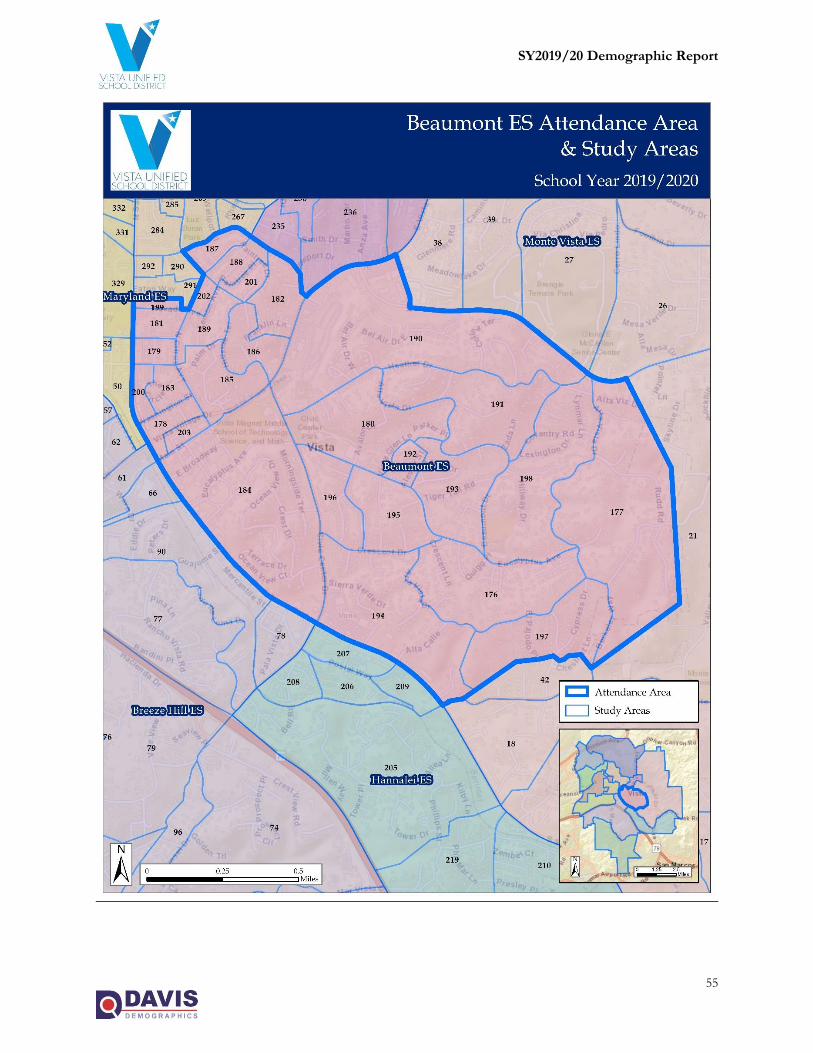
SY2019/20 Demographic Report
55
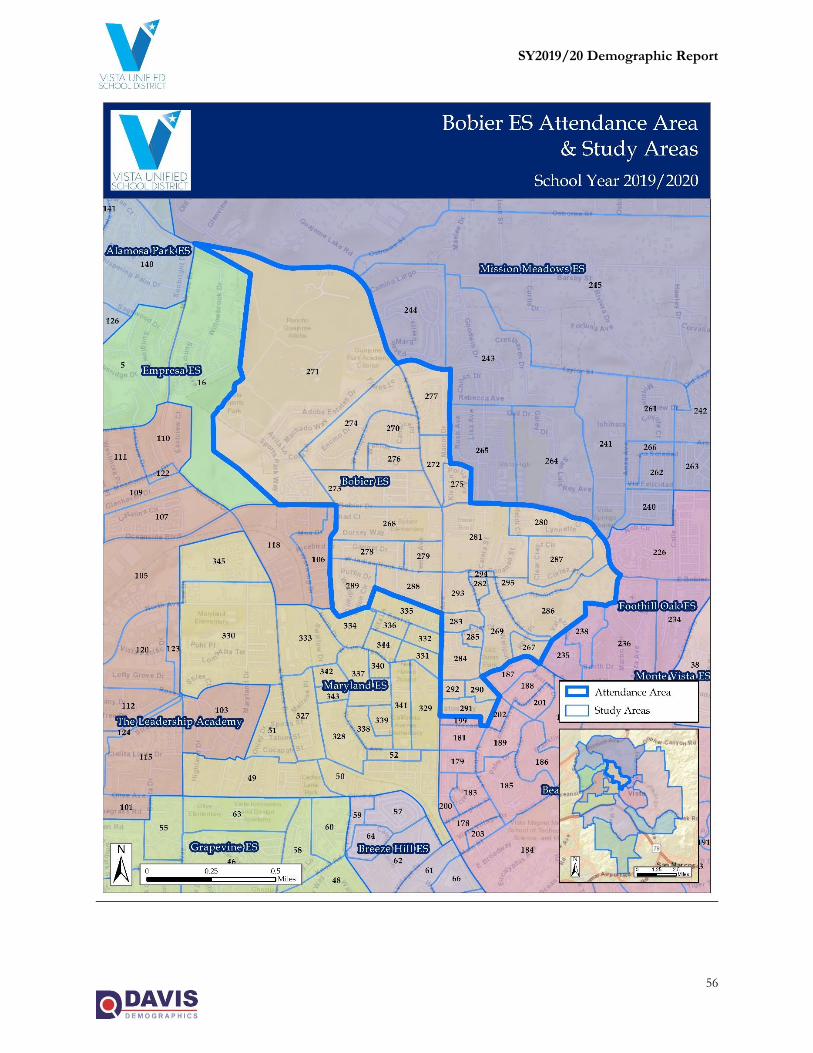
SY2019/20 Demographic Report
56
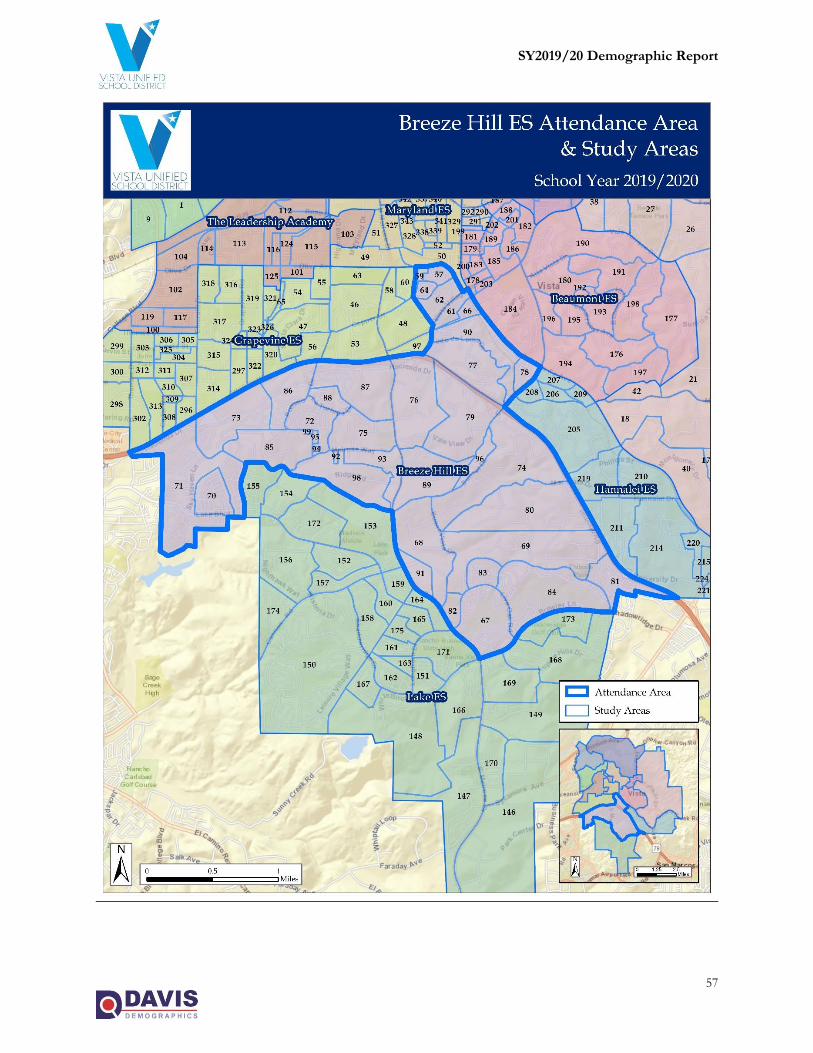
SY2019/20 Demographic Report
57
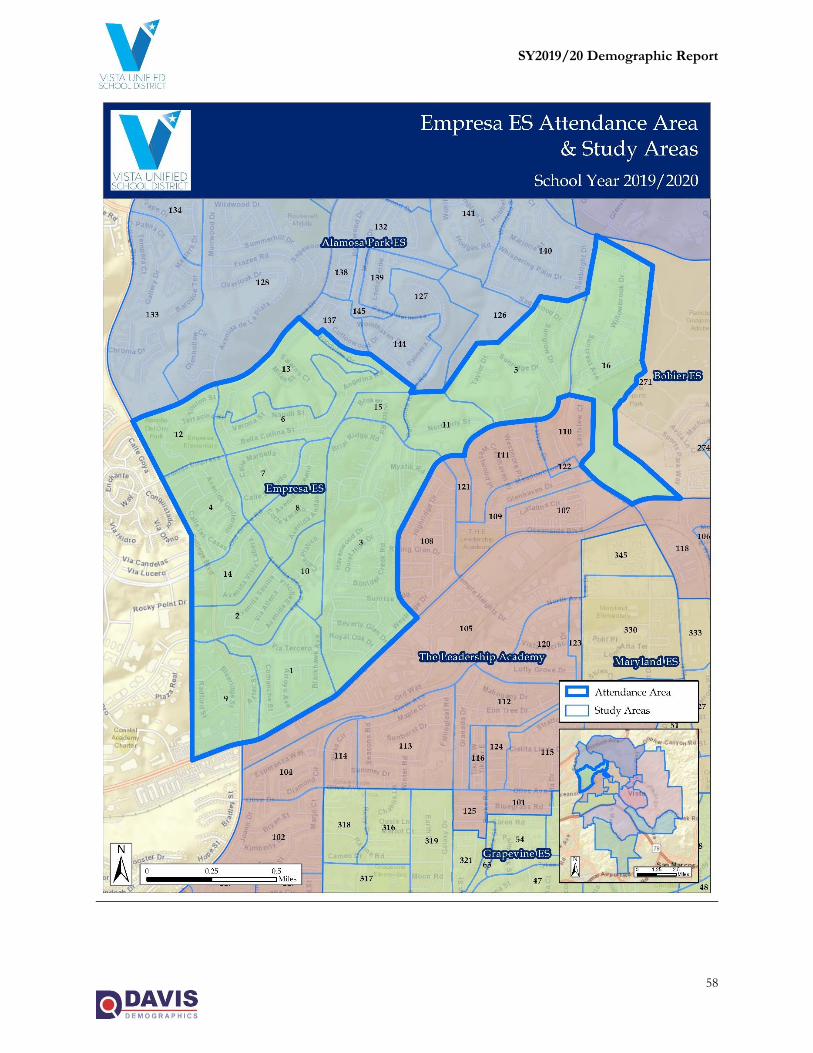
SY2019/20 Demographic Report
58
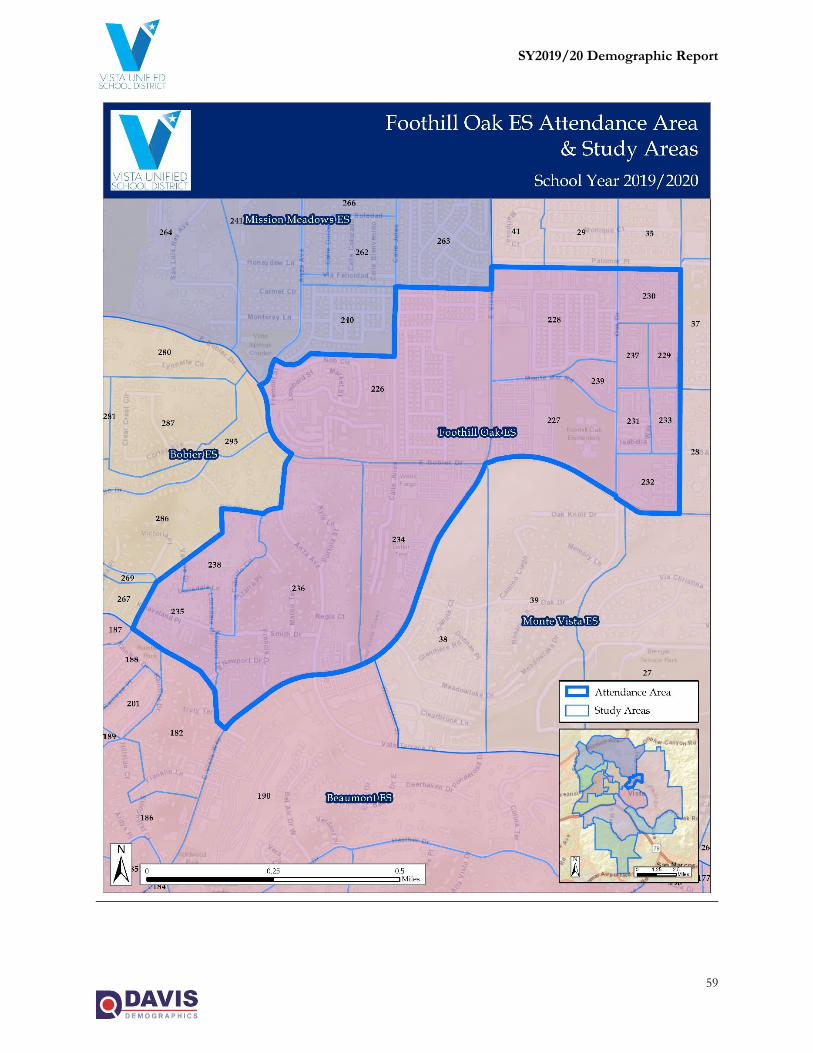
SY2019/20 Demographic Report
59
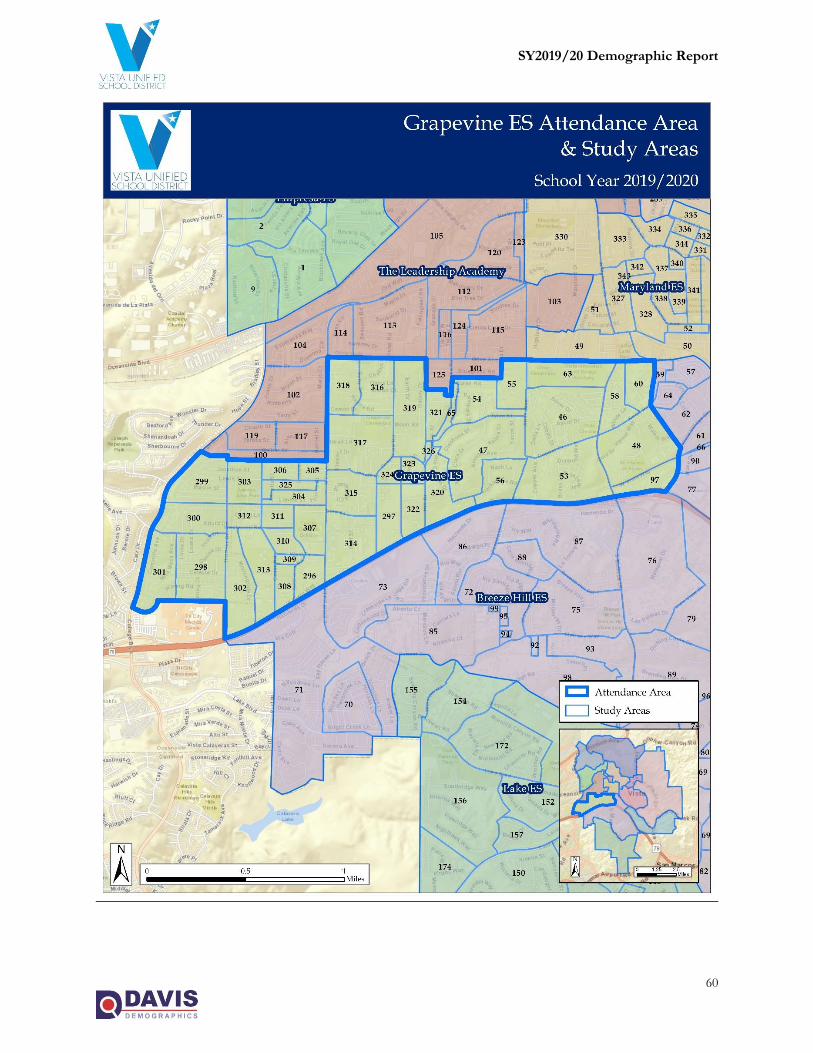
SY2019/20 Demographic Report
60
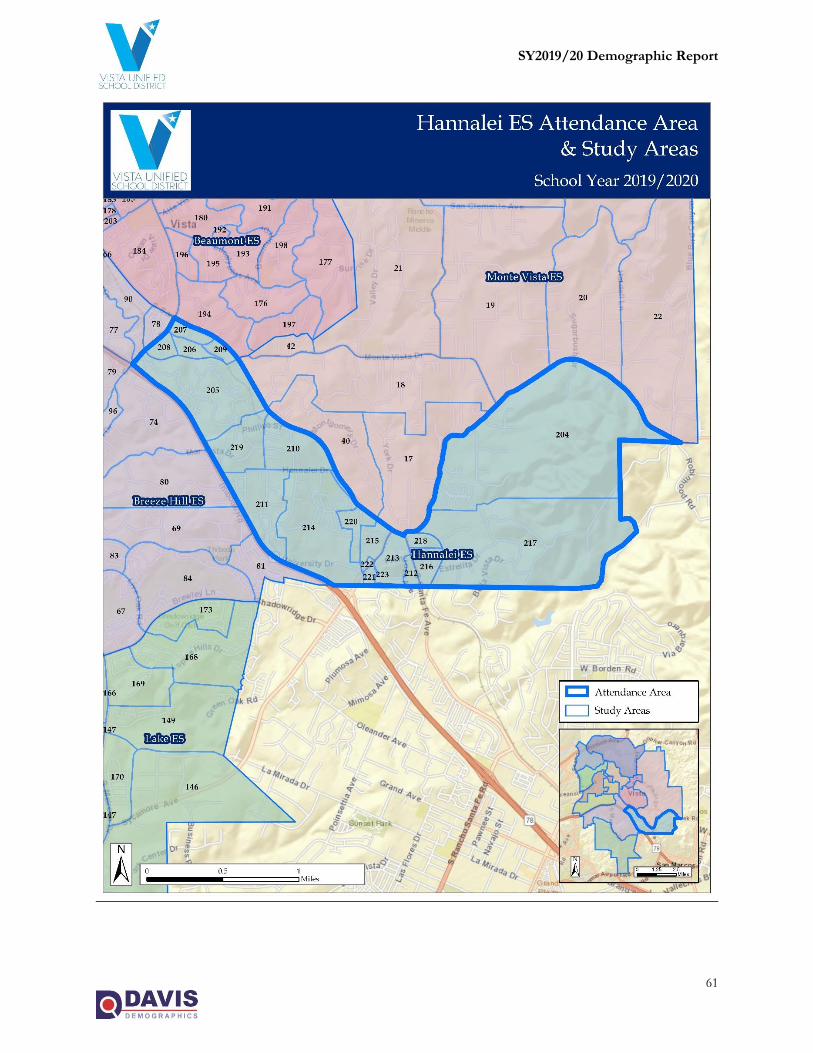
SY2019/20 Demographic Report
61
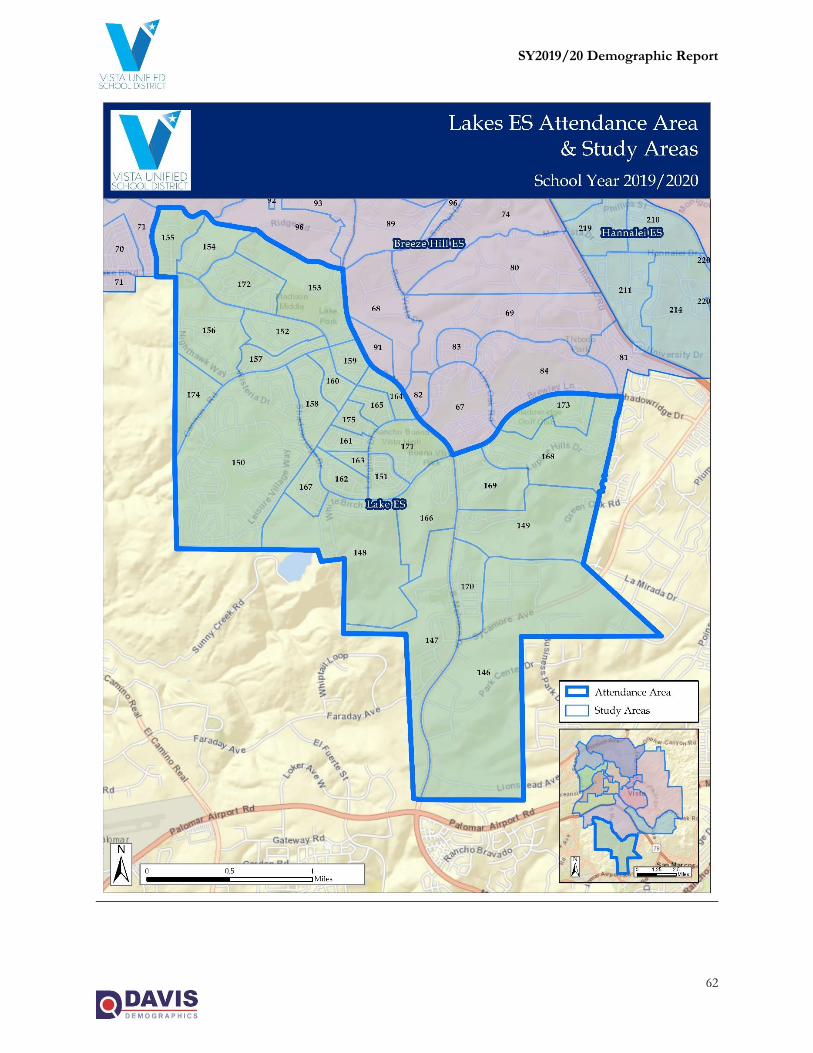
SY2019/20 Demographic Report
62
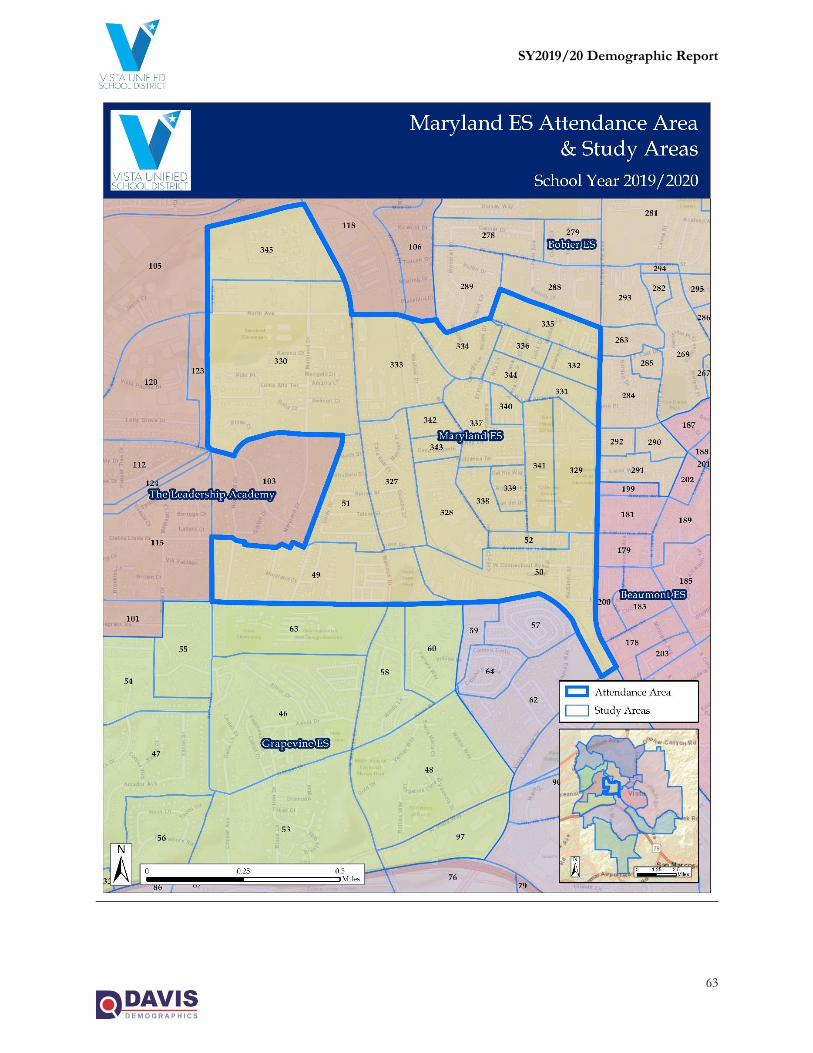
SY2019/20 Demographic Report
63
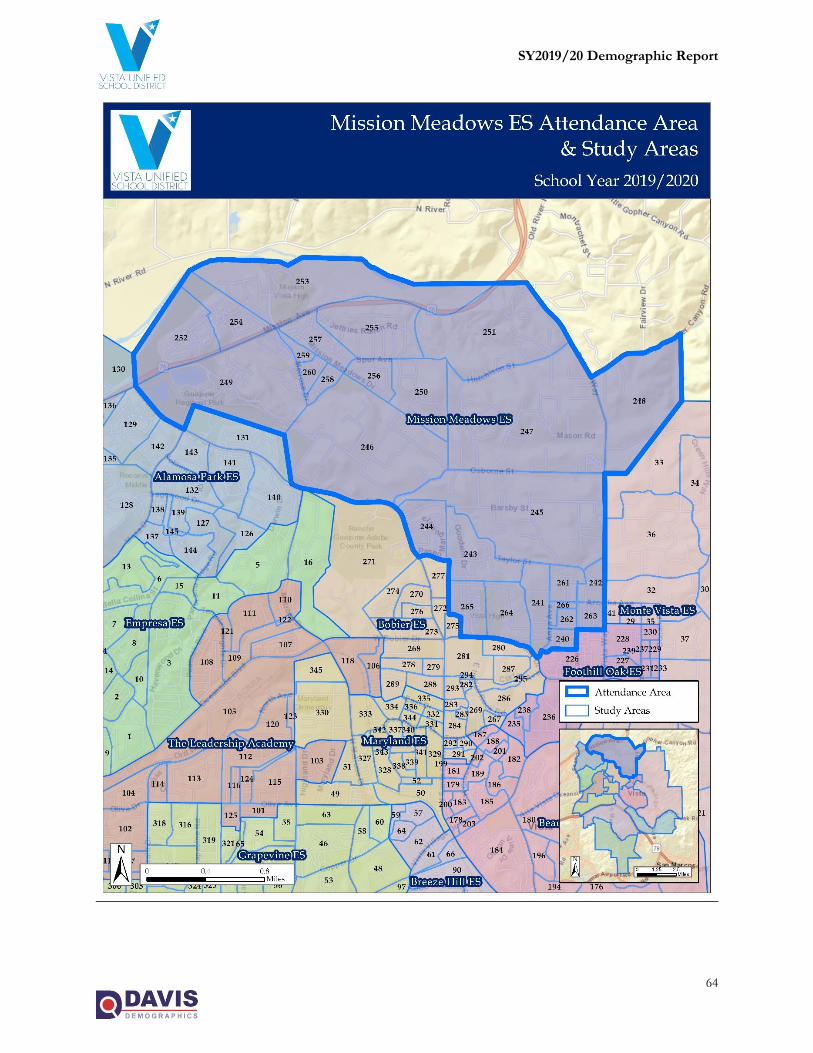
SY2019/20 Demographic Report
64
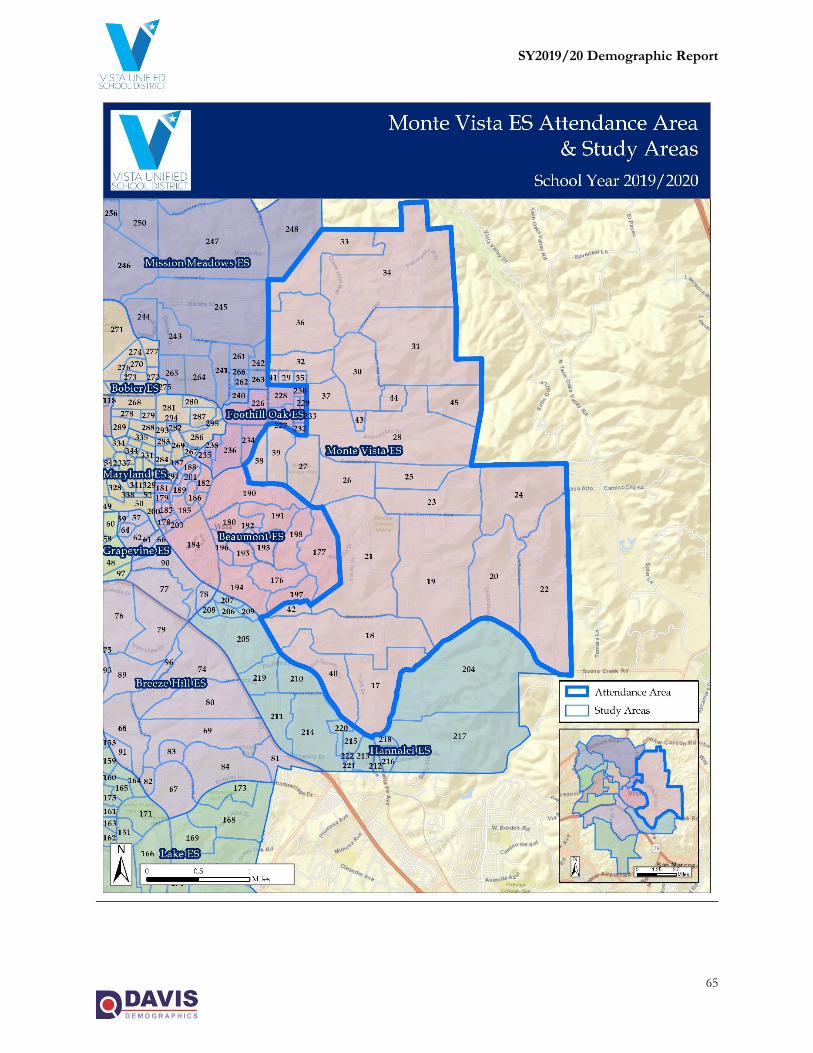
SY2019/20 Demographic Report
65
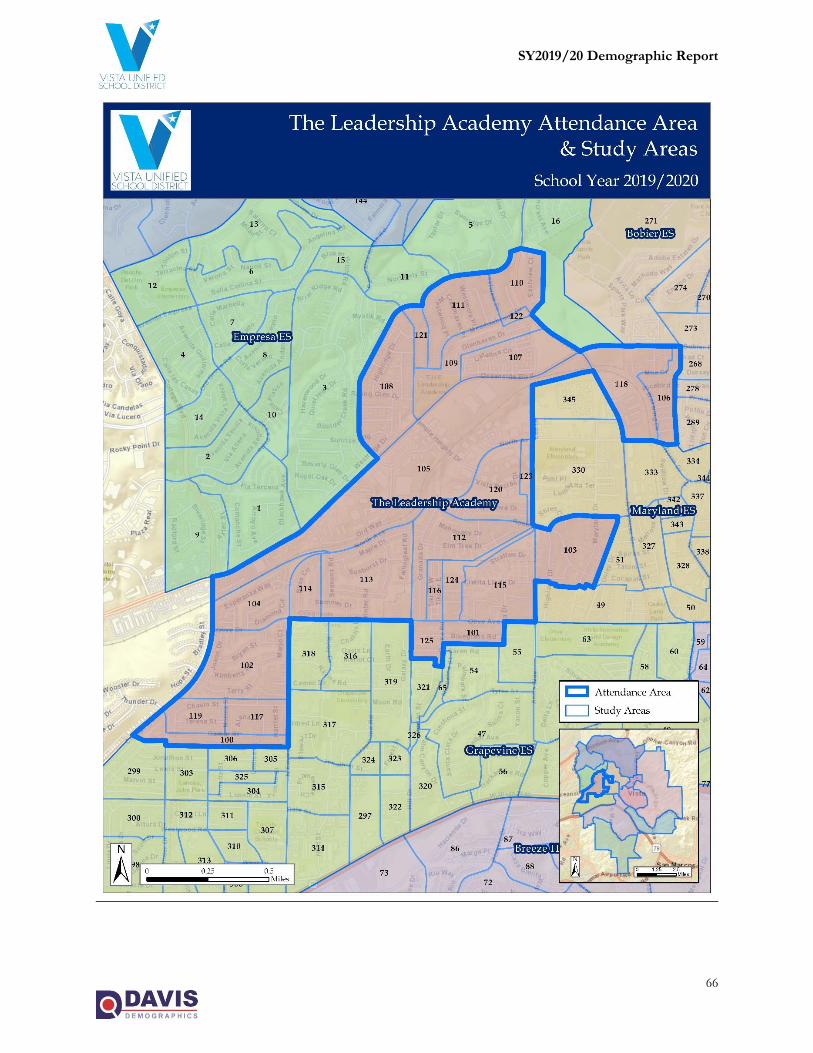
SY2019/20 Demographic Report
66
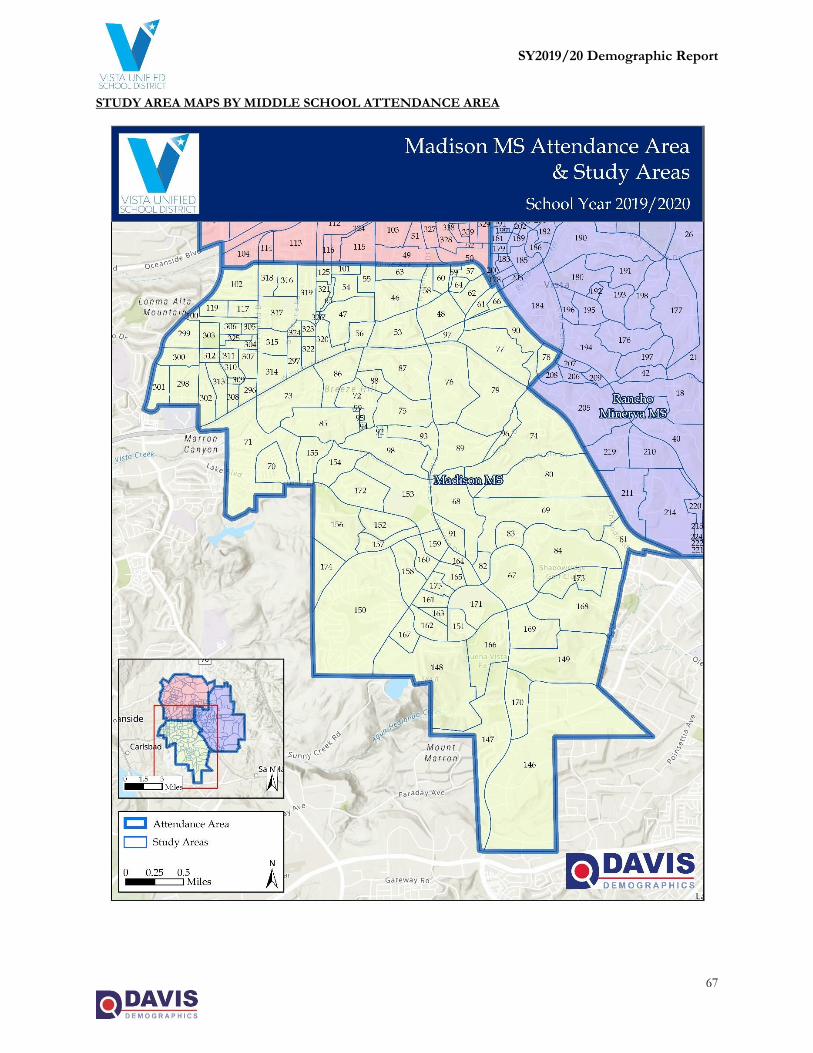
SY2019/20 Demographic Report
67
STUDY AREA MAPS BY MIDDLE SCHOOL ATTENDANCE AREA
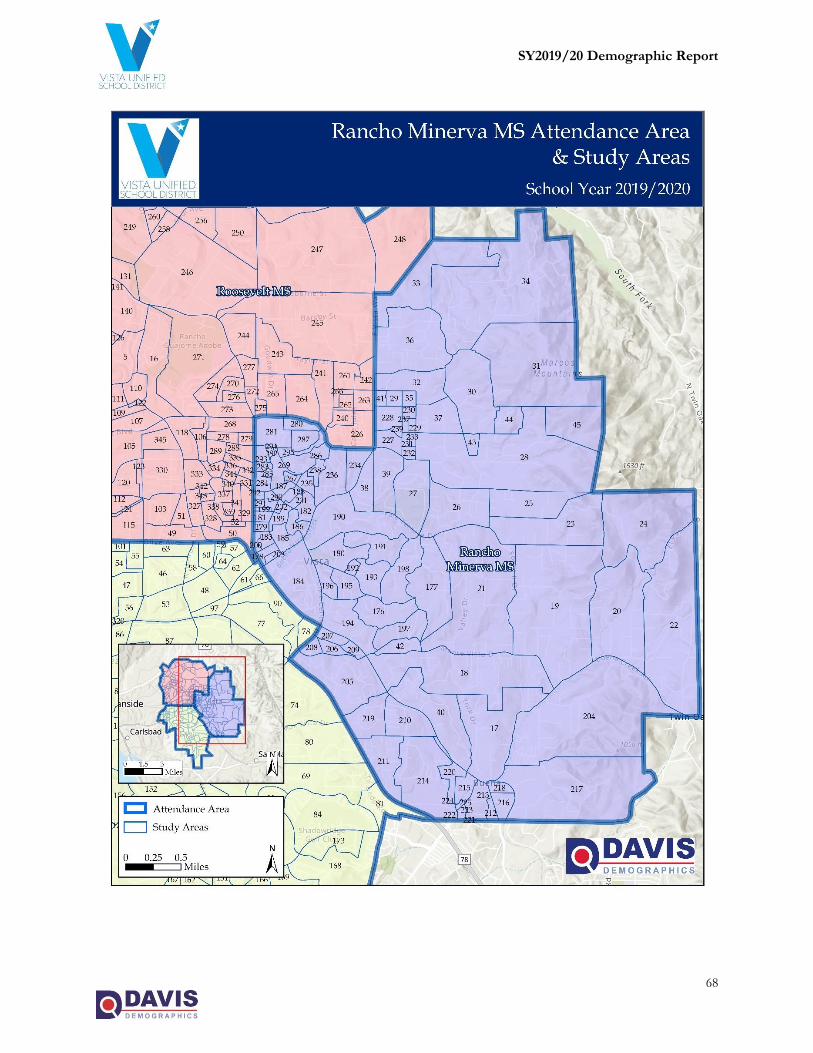
SY2019/20 Demographic Report
68
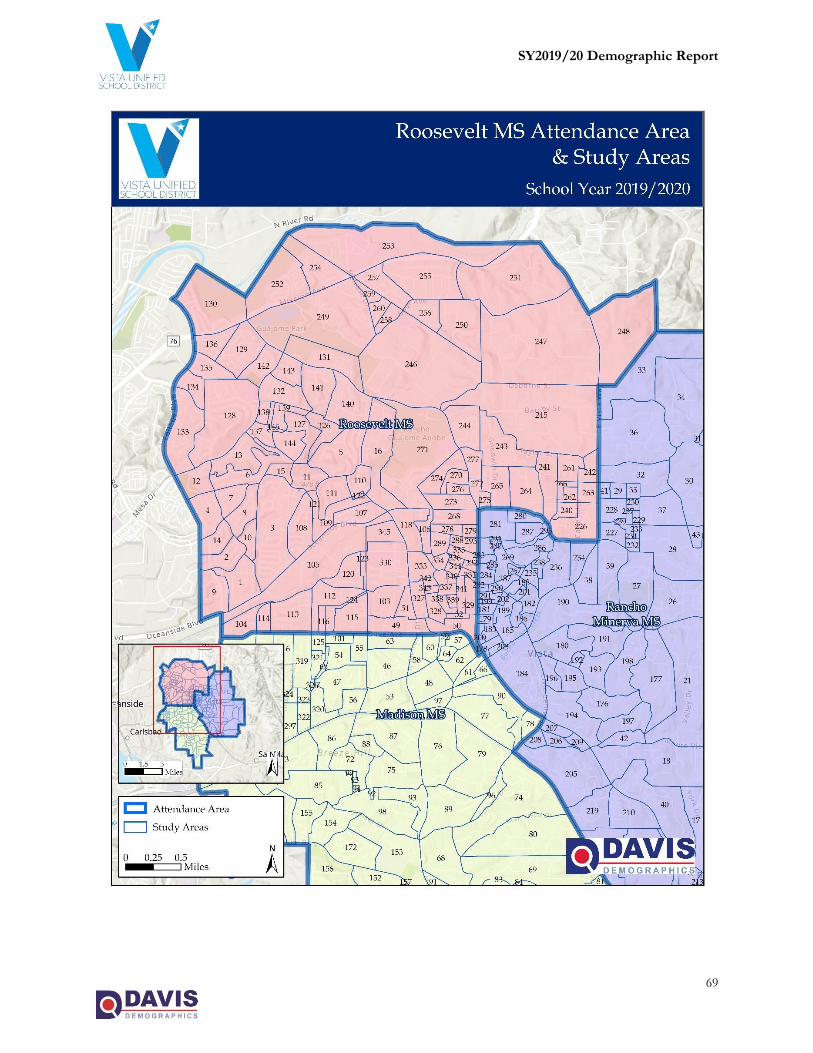
SY2019/20 Demographic Report
69
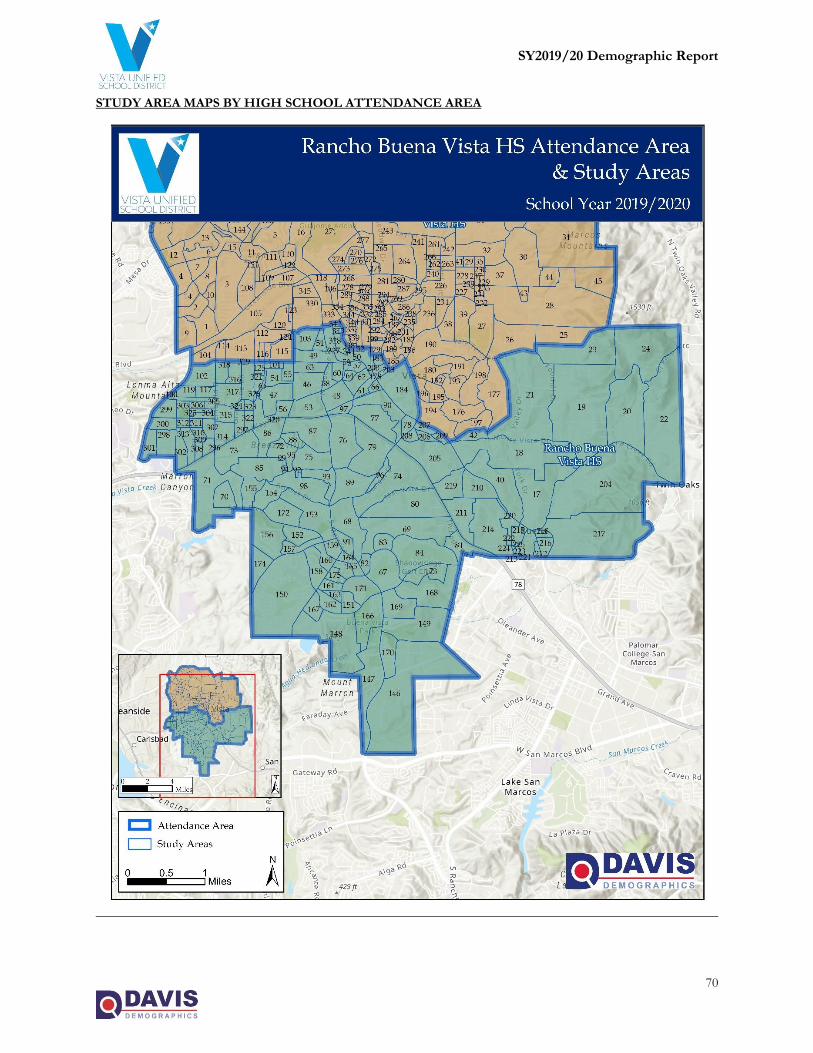
SY2019/20 Demographic Report
70
STUDY AREA MAPS BY HIGH SCHOOL ATTENDANCE AREA
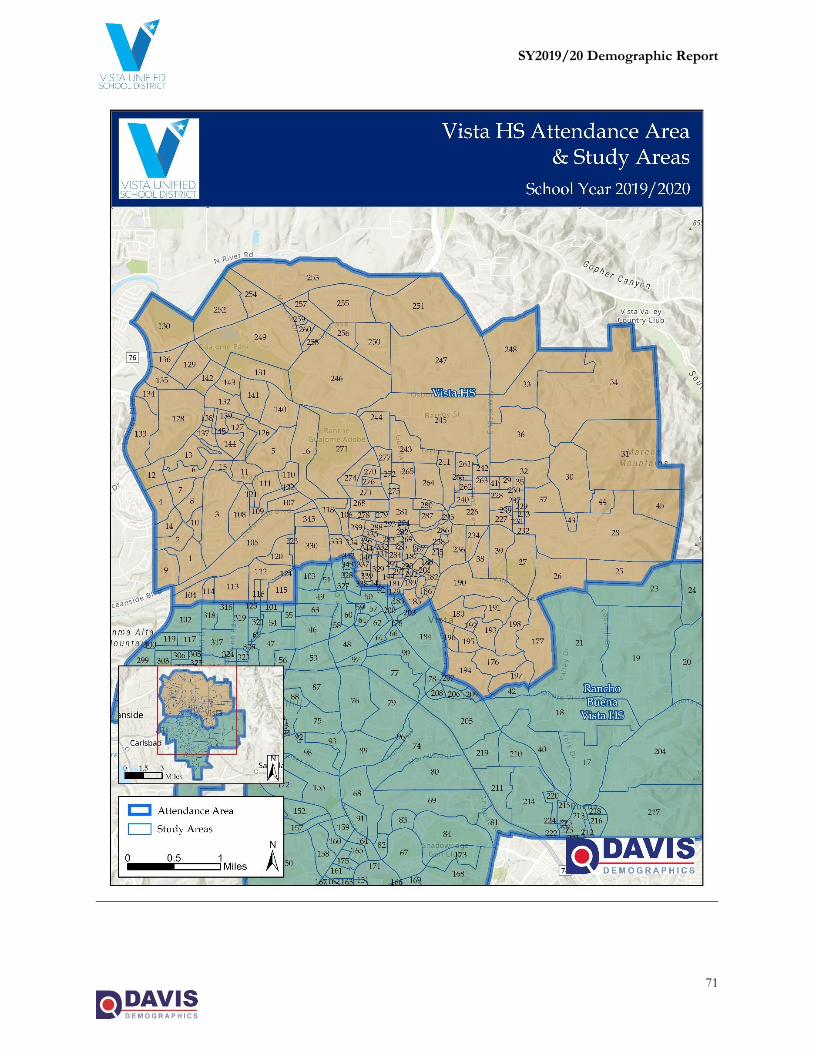
SY2019/20 Demographic Report
71
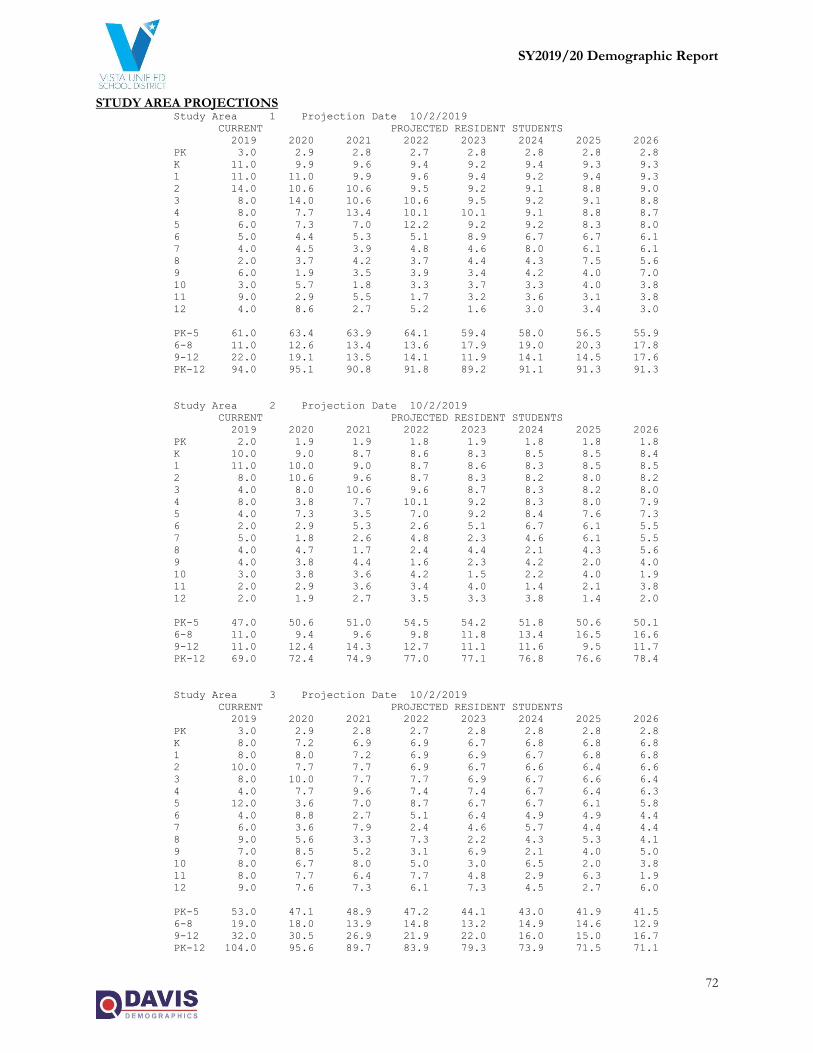
SY2019/20 Demographic Report
72
STUDY AREA PROJECTIONS Study Area 1 Projection Date 10/2/2019
CURRENT PROJECTED RESIDENT STUDENTS
2019 2020 2021 2022 2023 2024 2025 2026
PK 3.0 2.9 2.8 2.7 2.8 2.8 2.8 2.8
K 11.0 9.9 9.6 9.4 9.2 9.4 9.3 9.3
1 11.0 11.0 9.9 9.6 9.4 9.2 9.4 9.3
2 14.0 10.6 10.6 9.5 9.2 9.1 8.8 9.0
3 8.0 14.0 10.6 10.6 9.5 9.2 9.1 8.8
4 8.0 7.7 13.4 10.1 10.1 9.1 8.8 8.7
5 6.0 7.3 7.0 12.2 9.2 9.2 8.3 8.0
6 5.0 4.4 5.3 5.1 8.9 6.7 6.7 6.1
7 4.0 4.5 3.9 4.8 4.6 8.0 6.1 6.1
8 2.0 3.7 4.2 3.7 4.4 4.3 7.5 5.6
9 6.0 1.9 3.5 3.9 3.4 4.2 4.0 7.0
10 3.0 5.7 1.8 3.3 3.7 3.3 4.0 3.8
11 9.0 2.9 5.5 1.7 3.2 3.6 3.1 3.8
12 4.0 8.6 2.7 5.2 1.6 3.0 3.4 3.0
PK-5 61.0 63.4 63.9 64.1 59.4 58.0 56.5 55.9
6-8 11.0 12.6 13.4 13.6 17.9 19.0 20.3 17.8
9-12 22.0 19.1 13.5 14.1 11.9 14.1 14.5 17.6
PK-12 94.0 95.1 90.8 91.8 89.2 91.1 91.3 91.3
Study Area 2 Projection Date 10/2/2019
CURRENT PROJECTED RESIDENT STUDENTS
2019 2020 2021 2022 2023 2024 2025 2026
PK 2.0 1.9 1.9 1.8 1.9 1.8 1.8 1.8
K 10.0 9.0 8.7 8.6 8.3 8.5 8.5 8.4
1 11.0 10.0 9.0 8.7 8.6 8.3 8.5 8.5
2 8.0 10.6 9.6 8.7 8.3 8.2 8.0 8.2
3 4.0 8.0 10.6 9.6 8.7 8.3 8.2 8.0
4 8.0 3.8 7.7 10.1 9.2 8.3 8.0 7.9
5 4.0 7.3 3.5 7.0 9.2 8.4 7.6 7.3
6 2.0 2.9 5.3 2.6 5.1 6.7 6.1 5.5
7 5.0 1.8 2.6 4.8 2.3 4.6 6.1 5.5
8 4.0 4.7 1.7 2.4 4.4 2.1 4.3 5.6
9 4.0 3.8 4.4 1.6 2.3 4.2 2.0 4.0
10 3.0 3.8 3.6 4.2 1.5 2.2 4.0 1.9
11 2.0 2.9 3.6 3.4 4.0 1.4 2.1 3.8
12 2.0 1.9 2.7 3.5 3.3 3.8 1.4 2.0
PK-5 47.0 50.6 51.0 54.5 54.2 51.8 50.6 50.1
6-8 11.0 9.4 9.6 9.8 11.8 13.4 16.5 16.6
9-12 11.0 12.4 14.3 12.7 11.1 11.6 9.5 11.7
PK-12 69.0 72.4 74.9 77.0 77.1 76.8 76.6 78.4
Study Area 3 Projection Date 10/2/2019
CURRENT PROJECTED RESIDENT STUDENTS
2019 2020 2021 2022 2023 2024 2025 2026
PK 3.0 2.9 2.8 2.7 2.8 2.8 2.8 2.8
K 8.0 7.2 6.9 6.9 6.7 6.8 6.8 6.8
1 8.0 8.0 7.2 6.9 6.9 6.7 6.8 6.8
2 10.0 7.7 7.7 6.9 6.7 6.6 6.4 6.6
3 8.0 10.0 7.7 7.7 6.9 6.7 6.6 6.4
4 4.0 7.7 9.6 7.4 7.4 6.7 6.4 6.3
5 12.0 3.6 7.0 8.7 6.7 6.7 6.1 5.8
6 4.0 8.8 2.7 5.1 6.4 4.9 4.9 4.4
7 6.0 3.6 7.9 2.4 4.6 5.7 4.4 4.4
8 9.0 5.6 3.3 7.3 2.2 4.3 5.3 4.1
9 7.0 8.5 5.2 3.1 6.9 2.1 4.0 5.0
10 8.0 6.7 8.0 5.0 3.0 6.5 2.0 3.8
11 8.0 7.7 6.4 7.7 4.8 2.9 6.3 1.9
12 9.0 7.6 7.3 6.1 7.3 4.5 2.7 6.0
PK-5 53.0 47.1 48.9 47.2 44.1 43.0 41.9 41.5
6-8 19.0 18.0 13.9 14.8 13.2 14.9 14.6 12.9
9-12 32.0 30.5 26.9 21.9 22.0 16.0 15.0 16.7
PK-12 104.0 95.6 89.7 83.9 79.3 73.9 71.5 71.1

SY2019/20 Demographic Report
73
Study Area 4 Projection Date 10/2/2019
CURRENT PROJECTED RESIDENT STUDENTS
2019 2020 2021 2022 2023 2024 2025 2026
PK 2.0 1.9 1.9 1.8 1.9 1.8 1.8 1.8
K 9.0 8.1 7.8 7.7 7.5 7.7 7.6 7.6
1 10.0 9.0 8.1 7.8 7.7 7.5 7.7 7.6
2 11.0 9.6 8.6 7.8 7.5 7.4 7.2 7.4
3 9.0 11.0 9.6 8.6 7.8 7.5 7.4 7.2
4 9.0 8.6 10.6 9.2 8.3 7.5 7.2 7.1
5 4.0 8.2 7.9 9.6 8.4 7.5 6.8 6.6
6 5.0 2.9 6.0 5.7 7.0 6.1 5.5 5.0
7 7.0 4.5 2.6 5.4 5.2 6.3 5.5 5.0
8 4.0 6.5 4.2 2.4 5.0 4.8 5.9 5.1
9 4.0 3.8 6.1 3.9 2.3 4.7 4.5 5.5
10 3.0 3.8 3.6 5.8 3.7 2.2 4.5 4.3
11 4.0 2.9 3.6 3.4 5.6 3.6 2.1 4.3
12 5.0 3.8 2.7 3.5 3.3 5.3 3.4 2.0
PK-5 54.0 56.4 54.5 52.5 49.1 46.9 45.7 45.3
6-8 16.0 13.9 12.8 13.5 17.2 17.2 16.9 15.1
9-12 16.0 14.3 16.0 16.6 14.9 15.8 14.5 16.1
PK-12 86.0 84.6 83.3 82.6 81.2 79.9 77.1 76.5
Study Area 5 Projection Date 10/2/2019
CURRENT PROJECTED RESIDENT STUDENTS
2019 2020 2021 2022 2023 2024 2025 2026
PK 0.0 0.0 0.0 0.0 0.0 0.0 0.0 0.0
K 6.0 5.4 5.2 5.2 5.0 5.1 5.1 5.1
1 7.0 6.0 5.4 5.2 5.2 5.0 5.1 5.1
2 4.0 6.7 5.8 5.2 5.0 4.9 4.8 4.9
3 6.0 4.0 6.7 5.8 5.2 5.0 4.9 4.8
4 2.0 5.8 3.8 6.5 5.5 5.0 4.8 4.7
5 4.0 1.8 5.2 3.5 5.9 5.0 4.5 4.4
6 3.0 2.9 1.3 3.8 2.6 4.3 3.7 3.3
7 4.0 2.7 2.6 1.2 3.4 2.3 3.9 3.3
8 3.0 3.7 2.5 2.4 1.1 3.2 2.1 3.6
9 8.0 2.8 3.5 2.4 2.3 1.0 3.0 2.0
10 6.0 7.6 2.7 3.3 2.2 2.2 1.0 2.9
11 11.0 5.8 7.3 2.6 3.2 2.2 2.1 1.0
12 3.0 10.4 5.5 6.9 2.4 3.0 2.0 2.0
PK-5 29.0 29.7 32.1 31.4 31.8 30.0 29.2 29.0
6-8 10.0 9.3 6.4 7.4 7.1 9.8 9.7 10.2
9-12 28.0 26.6 19.0 15.2 10.1 8.4 8.1 7.9
PK-12 67.0 65.6 57.5 54.0 49.0 48.2 47.0 47.1
Study Area 6 Projection Date 10/2/2019
CURRENT PROJECTED RESIDENT STUDENTS
2019 2020 2021 2022 2023 2024 2025 2026
PK 2.0 1.9 1.9 1.8 1.9 1.8 1.8 1.8
K 3.0 2.7 2.6 2.6 2.5 2.6 2.5 2.5
1 1.0 3.0 2.7 2.6 2.6 2.5 2.6 2.5
2 4.0 1.0 2.9 2.6 2.5 2.5 2.4 2.5
3 7.0 4.0 1.0 2.9 2.6 2.5 2.5 2.4
4 2.0 6.7 3.8 0.9 2.8 2.5 2.4 2.4
5 4.0 1.8 6.1 3.5 0.8 2.5 2.3 2.2
6 1.0 2.9 1.3 4.5 2.6 0.6 1.8 1.7
7 6.0 0.9 2.6 1.2 4.0 2.3 0.6 1.7
8 6.0 5.6 0.8 2.4 1.1 3.7 2.1 0.5
9 4.0 5.6 5.2 0.8 2.3 1.0 3.5 2.0
10 6.0 3.8 5.4 5.0 0.7 2.2 1.0 3.3
11 2.0 5.8 3.6 5.1 4.8 0.7 2.1 1.0
12 8.0 1.9 5.5 3.5 4.9 4.5 0.7 2.0
PK-5 23.0 21.1 21.0 16.9 15.7 16.9 16.5 16.3
6-8 13.0 9.4 4.7 8.1 7.7 6.6 4.5 3.9
9-12 20.0 17.1 19.7 14.4 12.7 8.4 7.3 8.3
PK-12 56.0 47.6 45.4 39.4 36.1 31.9 28.3 28.5

SY2019/20 Demographic Report
74
Study Area 7 Projection Date 10/2/2019
CURRENT PROJECTED RESIDENT STUDENTS
2019 2020 2021 2022 2023 2024 2025 2026
PK 2.0 1.9 1.9 1.8 1.9 1.8 1.8 1.8
K 2.0 1.8 1.7 1.7 1.7 1.7 1.7 1.7
1 5.0 2.0 1.8 1.7 1.7 1.7 1.7 1.7
2 2.0 4.8 1.9 1.7 1.7 1.6 1.6 1.6
3 5.0 2.0 4.8 1.9 1.7 1.7 1.6 1.6
4 2.0 4.8 1.9 4.6 1.8 1.7 1.6 1.6
5 3.0 1.8 4.4 1.7 4.2 1.7 1.5 1.5
6 2.0 2.2 1.3 3.2 1.3 3.1 1.2 1.1
7 2.0 1.8 2.0 1.2 2.9 1.1 2.8 1.1
8 3.0 1.9 1.7 1.8 1.1 2.7 1.1 2.6
9 6.0 2.8 1.7 1.6 1.7 1.0 2.5 1.0
10 5.0 5.7 2.7 1.7 1.5 1.6 1.0 2.4
11 3.0 4.8 5.5 2.6 1.6 1.4 1.6 1.0
12 4.0 2.8 4.6 5.2 2.4 1.5 1.4 1.5
PK-5 21.0 19.1 18.4 15.1 14.7 11.9 11.5 11.5
6-8 7.0 5.9 5.0 6.2 5.3 6.9 5.1 4.8
9-12 18.0 16.1 14.5 11.1 7.2 5.5 6.5 5.9
PK-12 46.0 41.1 37.9 32.4 27.2 24.3 23.1 22.2
Study Area 8 Projection Date 10/2/2019
CURRENT PROJECTED RESIDENT STUDENTS
2019 2020 2021 2022 2023 2024 2025 2026
PK 2.0 1.9 1.9 1.8 1.9 1.8 1.8 1.8
K 4.0 3.6 3.5 3.4 3.3 3.4 3.4 3.4
1 9.0 4.0 3.6 3.5 3.4 3.3 3.4 3.4
2 6.0 8.6 3.8 3.5 3.3 3.3 3.2 3.3
3 4.0 6.0 8.6 3.8 3.5 3.3 3.3 3.2
4 5.0 3.8 5.8 8.3 3.7 3.3 3.2 3.2
5 4.0 4.6 3.5 5.2 7.5 3.4 3.0 2.9
6 6.0 2.9 3.3 2.6 3.8 5.5 2.4 2.2
7 3.0 5.4 2.6 3.0 2.3 3.4 5.0 2.2
8 3.0 2.8 5.0 2.4 2.8 2.1 3.2 4.6
9 3.0 2.8 2.6 4.7 2.3 2.6 2.0 3.0
10 2.0 2.8 2.7 2.5 4.5 2.2 2.5 1.9
11 7.0 1.9 2.7 2.6 2.4 4.3 2.1 2.4
12 8.0 6.7 1.8 2.6 2.4 2.3 4.1 2.0
PK-5 34.0 32.5 30.7 29.5 26.6 21.8 21.3 21.2
6-8 12.0 11.1 10.9 8.0 8.9 11.0 10.6 9.0
9-12 20.0 14.2 9.8 12.4 11.6 11.4 10.7 9.3
PK-12 66.0 57.8 51.4 49.9 47.1 44.2 42.6 39.5
Study Area 9 Projection Date 10/2/2019
CURRENT PROJECTED RESIDENT STUDENTS
2019 2020 2021 2022 2023 2024 2025 2026
PK 0.0 0.0 0.0 0.0 0.0 0.0 0.0 0.0
K 12.0 10.8 10.4 10.3 10.0 10.2 10.2 10.1
1 7.0 12.0 10.8 10.4 10.3 10.0 10.2 10.2
2 10.0 6.7 11.5 10.4 10.0 9.9 9.6 9.8
3 8.0 10.0 6.7 11.5 10.4 10.0 9.9 9.6
4 8.0 7.7 9.6 6.5 11.1 10.0 9.6 9.5
5 5.0 7.3 7.0 8.7 5.9 10.1 9.1 8.7
6 7.0 3.7 5.3 5.1 6.4 4.3 7.3 6.6
7 9.0 6.3 3.3 4.8 4.6 5.7 3.9 6.6
8 5.0 8.4 5.9 3.1 4.4 4.3 5.3 3.6
9 6.0 4.7 7.9 5.5 2.9 4.2 4.0 5.0
10 8.0 5.7 4.5 7.5 5.2 2.7 4.0 3.8
11 1.0 7.7 5.5 4.3 7.2 5.0 2.6 3.8
12 2.0 0.9 7.3 5.2 4.1 6.8 4.8 2.5
PK-5 50.0 54.5 56.0 57.8 57.7 60.2 58.6 57.9
6-8 21.0 18.4 14.5 13.0 15.4 14.3 16.5 16.8
9-12 17.0 19.0 25.2 22.5 19.4 18.7 15.4 15.1
PK-12 88.0 91.9 95.7 93.3 92.5 93.2 90.5 89.8
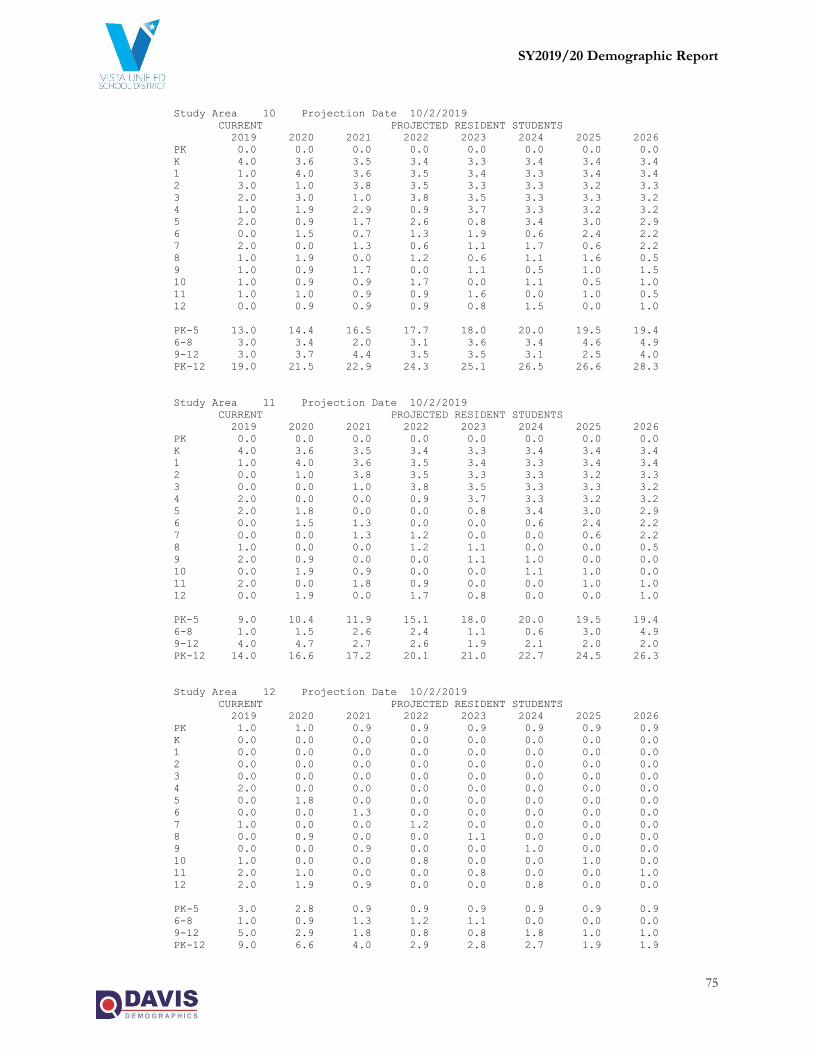
SY2019/20 Demographic Report
75
Study Area 10 Projection Date 10/2/2019
CURRENT PROJECTED RESIDENT STUDENTS
2019 2020 2021 2022 2023 2024 2025 2026
PK 0.0 0.0 0.0 0.0 0.0 0.0 0.0 0.0
K 4.0 3.6 3.5 3.4 3.3 3.4 3.4 3.4
1 1.0 4.0 3.6 3.5 3.4 3.3 3.4 3.4
2 3.0 1.0 3.8 3.5 3.3 3.3 3.2 3.3
3 2.0 3.0 1.0 3.8 3.5 3.3 3.3 3.2
4 1.0 1.9 2.9 0.9 3.7 3.3 3.2 3.2
5 2.0 0.9 1.7 2.6 0.8 3.4 3.0 2.9
6 0.0 1.5 0.7 1.3 1.9 0.6 2.4 2.2
7 2.0 0.0 1.3 0.6 1.1 1.7 0.6 2.2
8 1.0 1.9 0.0 1.2 0.6 1.1 1.6 0.5
9 1.0 0.9 1.7 0.0 1.1 0.5 1.0 1.5
10 1.0 0.9 0.9 1.7 0.0 1.1 0.5 1.0
11 1.0 1.0 0.9 0.9 1.6 0.0 1.0 0.5
12 0.0 0.9 0.9 0.9 0.8 1.5 0.0 1.0
PK-5 13.0 14.4 16.5 17.7 18.0 20.0 19.5 19.4
6-8 3.0 3.4 2.0 3.1 3.6 3.4 4.6 4.9
9-12 3.0 3.7 4.4 3.5 3.5 3.1 2.5 4.0
PK-12 19.0 21.5 22.9 24.3 25.1 26.5 26.6 28.3
Study Area 11 Projection Date 10/2/2019
CURRENT PROJECTED RESIDENT STUDENTS
2019 2020 2021 2022 2023 2024 2025 2026
PK 0.0 0.0 0.0 0.0 0.0 0.0 0.0 0.0
K 4.0 3.6 3.5 3.4 3.3 3.4 3.4 3.4
1 1.0 4.0 3.6 3.5 3.4 3.3 3.4 3.4
2 0.0 1.0 3.8 3.5 3.3 3.3 3.2 3.3
3 0.0 0.0 1.0 3.8 3.5 3.3 3.3 3.2
4 2.0 0.0 0.0 0.9 3.7 3.3 3.2 3.2
5 2.0 1.8 0.0 0.0 0.8 3.4 3.0 2.9
6 0.0 1.5 1.3 0.0 0.0 0.6 2.4 2.2
7 0.0 0.0 1.3 1.2 0.0 0.0 0.6 2.2
8 1.0 0.0 0.0 1.2 1.1 0.0 0.0 0.5
9 2.0 0.9 0.0 0.0 1.1 1.0 0.0 0.0
10 0.0 1.9 0.9 0.0 0.0 1.1 1.0 0.0
11 2.0 0.0 1.8 0.9 0.0 0.0 1.0 1.0
12 0.0 1.9 0.0 1.7 0.8 0.0 0.0 1.0
PK-5 9.0 10.4 11.9 15.1 18.0 20.0 19.5 19.4
6-8 1.0 1.5 2.6 2.4 1.1 0.6 3.0 4.9
9-12 4.0 4.7 2.7 2.6 1.9 2.1 2.0 2.0
PK-12 14.0 16.6 17.2 20.1 21.0 22.7 24.5 26.3
Study Area 12 Projection Date 10/2/2019
CURRENT PROJECTED RESIDENT STUDENTS
2019 2020 2021 2022 2023 2024 2025 2026
PK 1.0 1.0 0.9 0.9 0.9 0.9 0.9 0.9
K 0.0 0.0 0.0 0.0 0.0 0.0 0.0 0.0
1 0.0 0.0 0.0 0.0 0.0 0.0 0.0 0.0
2 0.0 0.0 0.0 0.0 0.0 0.0 0.0 0.0
3 0.0 0.0 0.0 0.0 0.0 0.0 0.0 0.0
4 2.0 0.0 0.0 0.0 0.0 0.0 0.0 0.0
5 0.0 1.8 0.0 0.0 0.0 0.0 0.0 0.0
6 0.0 0.0 1.3 0.0 0.0 0.0 0.0 0.0
7 1.0 0.0 0.0 1.2 0.0 0.0 0.0 0.0
8 0.0 0.9 0.0 0.0 1.1 0.0 0.0 0.0
9 0.0 0.0 0.9 0.0 0.0 1.0 0.0 0.0
10 1.0 0.0 0.0 0.8 0.0 0.0 1.0 0.0
11 2.0 1.0 0.0 0.0 0.8 0.0 0.0 1.0
12 2.0 1.9 0.9 0.0 0.0 0.8 0.0 0.0
PK-5 3.0 2.8 0.9 0.9 0.9 0.9 0.9 0.9
6-8 1.0 0.9 1.3 1.2 1.1 0.0 0.0 0.0
9-12 5.0 2.9 1.8 0.8 0.8 1.8 1.0 1.0
PK-12 9.0 6.6 4.0 2.9 2.8 2.7 1.9 1.9
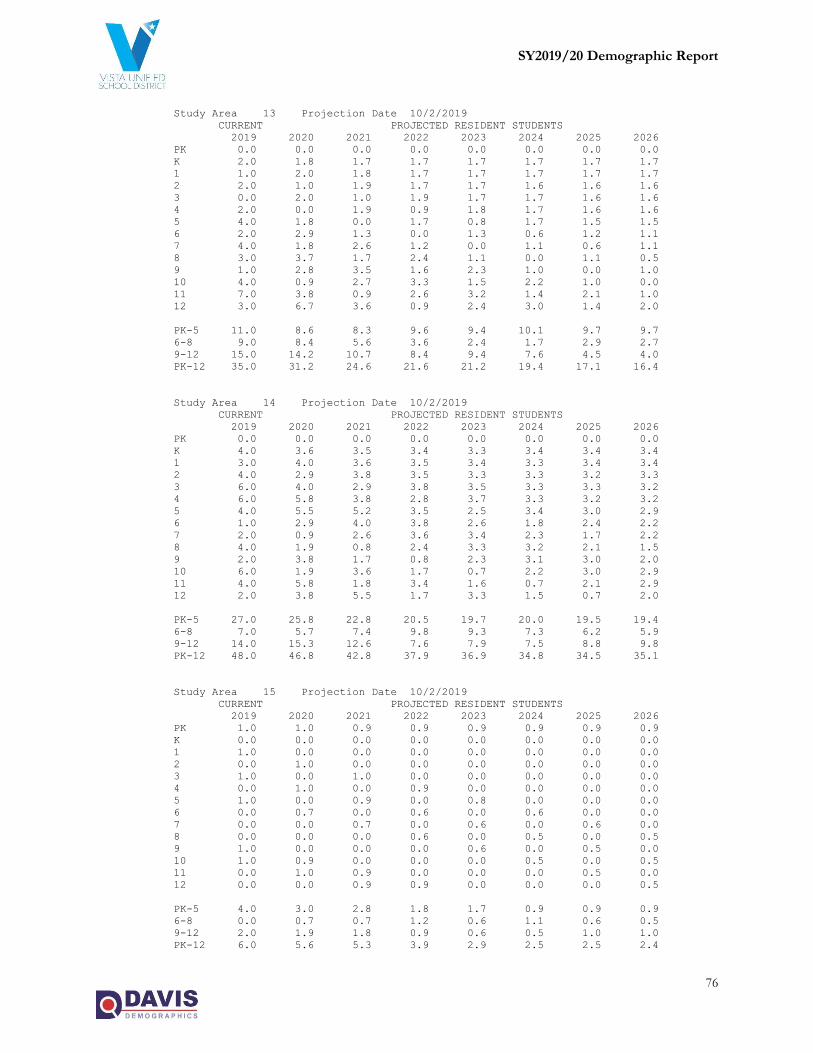
SY2019/20 Demographic Report
76
Study Area 13 Projection Date 10/2/2019
CURRENT PROJECTED RESIDENT STUDENTS
2019 2020 2021 2022 2023 2024 2025 2026
PK 0.0 0.0 0.0 0.0 0.0 0.0 0.0 0.0
K 2.0 1.8 1.7 1.7 1.7 1.7 1.7 1.7
1 1.0 2.0 1.8 1.7 1.7 1.7 1.7 1.7
2 2.0 1.0 1.9 1.7 1.7 1.6 1.6 1.6
3 0.0 2.0 1.0 1.9 1.7 1.7 1.6 1.6
4 2.0 0.0 1.9 0.9 1.8 1.7 1.6 1.6
5 4.0 1.8 0.0 1.7 0.8 1.7 1.5 1.5
6 2.0 2.9 1.3 0.0 1.3 0.6 1.2 1.1
7 4.0 1.8 2.6 1.2 0.0 1.1 0.6 1.1
8 3.0 3.7 1.7 2.4 1.1 0.0 1.1 0.5
9 1.0 2.8 3.5 1.6 2.3 1.0 0.0 1.0
10 4.0 0.9 2.7 3.3 1.5 2.2 1.0 0.0
11 7.0 3.8 0.9 2.6 3.2 1.4 2.1 1.0
12 3.0 6.7 3.6 0.9 2.4 3.0 1.4 2.0
PK-5 11.0 8.6 8.3 9.6 9.4 10.1 9.7 9.7
6-8 9.0 8.4 5.6 3.6 2.4 1.7 2.9 2.7
9-12 15.0 14.2 10.7 8.4 9.4 7.6 4.5 4.0
PK-12 35.0 31.2 24.6 21.6 21.2 19.4 17.1 16.4
Study Area 14 Projection Date 10/2/2019
CURRENT PROJECTED RESIDENT STUDENTS
2019 2020 2021 2022 2023 2024 2025 2026
PK 0.0 0.0 0.0 0.0 0.0 0.0 0.0 0.0
K 4.0 3.6 3.5 3.4 3.3 3.4 3.4 3.4
1 3.0 4.0 3.6 3.5 3.4 3.3 3.4 3.4
2 4.0 2.9 3.8 3.5 3.3 3.3 3.2 3.3
3 6.0 4.0 2.9 3.8 3.5 3.3 3.3 3.2
4 6.0 5.8 3.8 2.8 3.7 3.3 3.2 3.2
5 4.0 5.5 5.2 3.5 2.5 3.4 3.0 2.9
6 1.0 2.9 4.0 3.8 2.6 1.8 2.4 2.2
7 2.0 0.9 2.6 3.6 3.4 2.3 1.7 2.2
8 4.0 1.9 0.8 2.4 3.3 3.2 2.1 1.5
9 2.0 3.8 1.7 0.8 2.3 3.1 3.0 2.0
10 6.0 1.9 3.6 1.7 0.7 2.2 3.0 2.9
11 4.0 5.8 1.8 3.4 1.6 0.7 2.1 2.9
12 2.0 3.8 5.5 1.7 3.3 1.5 0.7 2.0
PK-5 27.0 25.8 22.8 20.5 19.7 20.0 19.5 19.4
6-8 7.0 5.7 7.4 9.8 9.3 7.3 6.2 5.9
9-12 14.0 15.3 12.6 7.6 7.9 7.5 8.8 9.8
PK-12 48.0 46.8 42.8 37.9 36.9 34.8 34.5 35.1
Study Area 15 Projection Date 10/2/2019
CURRENT PROJECTED RESIDENT STUDENTS
2019 2020 2021 2022 2023 2024 2025 2026
PK 1.0 1.0 0.9 0.9 0.9 0.9 0.9 0.9
K 0.0 0.0 0.0 0.0 0.0 0.0 0.0 0.0
1 1.0 0.0 0.0 0.0 0.0 0.0 0.0 0.0
2 0.0 1.0 0.0 0.0 0.0 0.0 0.0 0.0
3 1.0 0.0 1.0 0.0 0.0 0.0 0.0 0.0
4 0.0 1.0 0.0 0.9 0.0 0.0 0.0 0.0
5 1.0 0.0 0.9 0.0 0.8 0.0 0.0 0.0
6 0.0 0.7 0.0 0.6 0.0 0.6 0.0 0.0
7 0.0 0.0 0.7 0.0 0.6 0.0 0.6 0.0
8 0.0 0.0 0.0 0.6 0.0 0.5 0.0 0.5
9 1.0 0.0 0.0 0.0 0.6 0.0 0.5 0.0
10 1.0 0.9 0.0 0.0 0.0 0.5 0.0 0.5
11 0.0 1.0 0.9 0.0 0.0 0.0 0.5 0.0
12 0.0 0.0 0.9 0.9 0.0 0.0 0.0 0.5
PK-5 4.0 3.0 2.8 1.8 1.7 0.9 0.9 0.9
6-8 0.0 0.7 0.7 1.2 0.6 1.1 0.6 0.5
9-12 2.0 1.9 1.8 0.9 0.6 0.5 1.0 1.0
PK-12 6.0 5.6 5.3 3.9 2.9 2.5 2.5 2.4

SY2019/20 Demographic Report
77
Study Area 16 Projection Date 10/2/2019
CURRENT PROJECTED RESIDENT STUDENTS
2019 2020 2021 2022 2023 2024 2025 2026
PK 1.0 1.0 0.9 0.9 0.9 0.9 0.9 0.9
K 1.0 0.9 0.9 1.4 2.8 3.2 3.7 3.2
1 2.0 1.0 0.9 1.4 3.0 3.9 4.3 3.7
2 4.0 1.9 1.0 1.4 2.9 4.0 4.8 4.1
3 2.0 4.0 1.9 1.5 3.0 4.1 5.1 4.8
4 1.0 1.9 3.8 2.3 3.0 4.0 5.0 4.9
5 2.0 0.9 1.7 4.0 3.6 3.8 4.6 4.5
6 1.0 1.5 0.7 1.7 4.1 3.5 3.6 3.4
7 0.0 0.9 1.3 1.1 3.0 4.7 4.1 3.2
8 1.0 0.0 0.8 1.7 2.5 3.8 5.4 3.8
9 0.0 0.9 0.0 1.3 3.1 3.4 4.6 5.1
10 4.0 0.0 0.9 0.5 2.8 4.1 4.3 4.4
11 0.0 3.8 0.0 1.3 2.1 3.8 5.0 4.2
12 5.0 0.0 3.6 0.5 2.8 3.1 4.6 4.8
PK-5 13.0 11.6 11.1 12.9 19.2 23.9 28.4 26.1
6-8 2.0 2.4 2.8 4.5 9.6 12.0 13.1 10.4
9-12 9.0 4.7 4.5 3.6 10.8 14.4 18.5 18.5
PK-12 24.0 18.7 18.4 21.0 39.6 50.3 60.0 55.0
Study Area 17 Projection Date 10/2/2019
CURRENT PROJECTED RESIDENT STUDENTS
2019 2020 2021 2022 2023 2024 2025 2026
PK 1.0 1.0 0.9 0.9 0.9 0.9 0.9 0.9
K 6.0 5.8 5.4 5.3 5.4 5.4 5.4 5.4
1 3.0 6.2 6.0 5.6 5.5 5.6 5.6 5.6
2 3.0 2.7 5.7 5.5 5.1 5.0 5.1 5.1
3 6.0 3.2 2.9 6.0 5.8 5.4 5.3 5.3
4 8.0 5.9 3.1 2.8 5.8 5.6 5.3 5.2
5 5.0 8.2 6.1 3.2 2.9 6.0 5.8 5.4
6 6.0 4.9 8.1 5.9 3.1 2.8 5.9 5.7
7 6.0 6.0 4.9 8.1 5.9 3.1 2.8 5.9
8 4.0 6.1 6.1 5.0 8.2 6.1 3.2 2.9
9 6.0 4.4 6.8 6.8 5.5 9.1 6.7 3.5
10 9.0 6.4 4.7 7.2 7.2 5.9 9.7 7.1
11 6.0 8.6 6.0 4.5 6.8 6.8 5.6 9.2
12 4.0 6.3 9.0 6.3 4.7 7.2 7.2 5.9
PK-5 32.0 33.0 30.1 29.3 31.4 33.9 33.4 32.9
6-8 16.0 17.0 19.1 19.0 17.2 12.0 11.9 14.5
9-12 25.0 25.7 26.5 24.8 24.2 29.0 29.2 25.7
PK-12 73.0 75.7 75.7 73.1 72.8 74.9 74.5 73.1
Study Area 18 Projection Date 10/2/2019
CURRENT PROJECTED RESIDENT STUDENTS
2019 2020 2021 2022 2023 2024 2025 2026
PK 1.0 1.0 0.9 0.9 0.9 0.9 0.9 0.9
K 7.0 6.8 6.3 6.7 6.5 6.5 6.5 6.5
1 8.0 7.3 7.0 7.1 7.0 6.8 6.8 6.8
2 10.0 7.3 6.6 6.9 6.5 6.4 6.2 6.2
3 6.0 10.5 7.6 7.5 7.2 6.8 6.7 6.5
4 7.0 5.9 10.3 8.0 7.3 7.1 6.7 6.6
5 7.0 7.2 6.1 11.1 8.2 7.6 7.3 6.9
6 3.0 6.9 7.1 6.4 10.9 8.1 7.4 7.1
7 5.0 3.0 6.9 7.6 6.4 10.9 8.1 7.4
8 8.0 5.1 3.1 7.5 7.7 6.6 11.1 8.2
9 6.0 8.9 5.7 4.0 8.3 8.6 7.3 12.3
10 12.0 6.4 9.4 6.5 4.2 8.8 9.1 7.7
11 2.0 11.4 6.0 9.4 6.2 4.0 8.4 8.6
12 7.0 2.1 12.0 6.9 9.9 6.5 4.2 8.8
PK-5 46.0 46.0 44.8 48.2 43.6 42.1 41.1 40.4
6-8 16.0 15.0 17.1 21.5 25.0 25.6 26.6 22.7
9-12 27.0 28.8 33.1 26.8 28.6 27.9 29.0 37.4
PK-12 89.0 89.8 95.0 96.5 97.2 95.6 96.7 100.5

SY2019/20 Demographic Report
78
Study Area 19 Projection Date 10/2/2019
CURRENT PROJECTED RESIDENT STUDENTS
2019 2020 2021 2022 2023 2024 2025 2026
PK 2.0 1.9 1.9 1.8 1.9 1.8 1.8 1.8
K 9.0 8.7 8.1 8.0 8.0 8.1 8.0 8.0
1 5.0 9.4 9.0 8.5 8.3 8.4 8.4 8.3
2 14.0 4.6 8.5 8.2 7.7 7.6 7.6 7.6
3 15.0 14.7 4.8 8.9 8.6 8.1 7.9 8.0
4 10.0 14.7 14.4 4.7 8.8 8.5 7.9 7.8
5 9.0 10.3 15.1 14.8 4.8 9.0 8.7 8.2
6 6.0 8.8 10.1 14.8 14.5 4.7 8.8 8.5
7 5.0 6.0 8.8 10.1 14.8 14.5 4.7 8.8
8 3.0 5.1 6.1 9.0 10.3 15.1 14.8 4.8
9 9.0 3.3 5.7 6.8 10.0 11.4 16.8 16.5
10 6.0 9.5 3.5 6.0 7.2 10.6 12.1 17.8
11 4.0 5.7 9.1 3.4 5.7 6.8 10.1 11.5
12 6.0 4.2 6.0 9.5 3.5 6.0 7.2 10.6
PK-5 64.0 64.3 61.8 54.9 48.1 51.5 50.3 49.7
6-8 14.0 19.9 25.0 33.9 39.6 34.3 28.3 22.1
9-12 25.0 22.7 24.3 25.7 26.4 34.8 46.2 56.4
PK-12 103.0 106.9 111.1 114.5 114.1 120.6 124.8 128.2
Study Area 20 Projection Date 10/2/2019
CURRENT PROJECTED RESIDENT STUDENTS
2019 2020 2021 2022 2023 2024 2025 2026
PK 1.0 1.0 0.9 0.9 0.9 0.9 0.9 0.9
K 4.0 3.9 3.6 3.6 3.6 3.6 3.6 3.6
1 4.0 4.2 4.0 3.8 3.7 3.7 3.7 3.7
2 4.0 3.6 3.8 3.7 3.4 3.4 3.4 3.4
3 2.0 4.2 3.8 4.0 3.8 3.6 3.5 3.5
4 0.0 2.0 4.1 3.7 3.9 3.8 3.5 3.5
5 3.0 0.0 2.0 4.2 3.9 4.0 3.9 3.6
6 4.0 2.9 0.0 2.0 4.2 3.8 3.9 3.8
7 2.0 4.0 2.9 0.0 2.0 4.2 3.8 3.9
8 4.0 2.0 4.1 3.0 0.0 2.0 4.2 3.9
9 3.0 4.4 2.3 4.5 3.3 0.0 2.2 4.7
10 5.0 3.2 4.7 2.4 4.8 3.5 0.0 2.4
11 1.0 4.8 3.0 4.5 2.3 4.6 3.4 0.0
12 5.0 1.0 5.0 3.2 4.7 2.4 4.8 3.5
PK-5 18.0 18.9 22.2 23.9 23.2 23.0 22.5 22.2
6-8 10.0 8.9 7.0 5.0 6.2 10.0 11.9 11.6
9-12 14.0 13.4 15.0 14.6 15.1 10.5 10.4 10.6
PK-12 42.0 41.2 44.2 43.5 44.5 43.5 44.8 44.4
Study Area 21 Projection Date 10/2/2019
CURRENT PROJECTED RESIDENT STUDENTS
2019 2020 2021 2022 2023 2024 2025 2026
PK 0.0 0.0 0.0 0.0 0.0 0.0 0.0 0.0
K 6.0 5.8 5.4 5.3 5.4 5.4 5.4 5.4
1 7.0 6.2 6.0 5.6 5.5 5.6 5.6 5.6
2 7.0 6.4 5.7 5.5 5.1 5.0 5.1 5.1
3 3.0 7.3 6.7 6.0 5.8 5.4 5.3 5.3
4 4.0 2.9 7.2 6.6 5.8 5.6 5.3 5.2
5 3.0 4.1 3.0 7.4 6.8 6.0 5.8 5.4
6 4.0 2.9 4.0 3.0 7.3 6.6 5.9 5.7
7 5.0 4.0 2.9 4.0 3.0 7.3 6.6 5.9
8 3.0 5.1 4.1 3.0 4.1 3.0 7.4 6.7
9 8.0 3.3 5.7 4.5 3.3 4.6 3.4 8.2
10 6.0 8.5 3.5 6.0 4.8 3.5 4.8 3.6
11 7.0 5.7 8.1 3.4 5.7 4.6 3.4 4.6
12 8.0 7.3 6.0 8.5 3.5 6.0 4.8 3.5
PK-5 30.0 32.7 34.0 36.4 34.4 33.0 32.5 32.0
6-8 12.0 12.0 11.0 10.0 14.4 16.9 19.9 18.3
9-12 29.0 24.8 23.3 22.4 17.3 18.7 16.4 19.9
PK-12 71.0 69.5 68.3 68.8 66.1 68.6 68.8 70.2

SY2019/20 Demographic Report
79
Study Area 22 Projection Date 10/2/2019
CURRENT PROJECTED RESIDENT STUDENTS
2019 2020 2021 2022 2023 2024 2025 2026
PK 0.0 0.0 0.0 0.0 0.0 0.0 0.0 0.0
K 2.0 1.9 1.8 1.8 1.8 2.1 2.0 2.0
1 3.0 2.1 2.0 1.9 1.8 2.2 2.2 2.1
2 2.0 2.7 1.9 1.8 1.7 2.0 2.0 2.0
3 2.0 2.1 2.9 2.0 1.9 2.2 2.1 2.1
4 2.0 2.0 2.1 2.8 1.9 2.2 2.1 2.1
5 3.0 2.1 2.0 2.1 2.9 2.4 2.3 2.2
6 1.0 2.9 2.0 2.0 2.1 3.2 2.3 2.2
7 0.0 1.0 2.9 2.0 2.0 2.4 3.2 2.3
8 1.0 0.0 1.0 3.0 2.1 2.4 2.5 3.2
9 4.0 1.1 0.0 1.1 3.3 2.7 2.6 2.7
10 3.0 4.2 1.2 0.0 1.2 3.9 2.8 2.8
11 3.0 2.8 4.0 1.1 0.0 1.5 3.7 2.7
12 1.0 3.2 3.0 4.2 1.2 0.4 1.5 3.9
PK-5 14.0 12.9 12.7 12.4 12.0 13.1 12.7 12.5
6-8 2.0 3.9 5.9 7.0 6.2 8.0 8.0 7.7
9-12 11.0 11.3 8.2 6.4 5.7 8.5 10.6 12.1
PK-12 27.0 28.1 26.8 25.8 23.9 29.6 31.3 32.3
Study Area 23 Projection Date 10/2/2019
CURRENT PROJECTED RESIDENT STUDENTS
2019 2020 2021 2022 2023 2024 2025 2026
PK 0.0 0.0 0.0 0.0 0.0 0.0 0.0 0.0
K 5.0 4.8 4.5 4.4 4.5 4.5 4.5 4.5
1 2.0 5.2 5.0 4.7 4.6 4.6 4.7 4.6
2 1.0 1.8 4.7 4.6 4.3 4.2 4.2 4.2
3 3.0 1.0 1.9 5.0 4.8 4.5 4.4 4.4
4 3.0 2.9 1.0 1.9 4.9 4.7 4.4 4.3
5 1.0 3.1 3.0 1.1 1.9 5.0 4.8 4.5
6 0.0 1.0 3.0 3.0 1.0 1.9 4.9 4.7
7 2.0 0.0 1.0 3.0 3.0 1.0 1.9 4.9
8 1.0 2.0 0.0 1.0 3.1 3.0 1.1 1.9
9 2.0 1.1 2.3 0.0 1.1 3.4 3.4 1.2
10 2.0 2.1 1.2 2.4 0.0 1.2 3.6 3.6
11 7.0 1.9 2.0 1.1 2.3 0.0 1.1 3.5
12 5.0 7.3 2.0 2.1 1.2 2.4 0.0 1.2
PK-5 15.0 18.8 20.1 21.7 25.0 27.5 27.0 26.5
6-8 3.0 3.0 4.0 7.0 7.1 5.9 7.9 11.5
9-12 16.0 12.4 7.5 5.6 4.6 7.0 8.1 9.5
PK-12 34.0 34.2 31.6 34.3 36.7 40.4 43.0 47.5
Study Area 24 Projection Date 10/2/2019
CURRENT PROJECTED RESIDENT STUDENTS
2019 2020 2021 2022 2023 2024 2025 2026
PK 0.0 0.0 0.0 0.0 0.0 0.0 0.0 0.0
K 0.0 0.0 0.0 0.0 0.0 0.0 0.0 0.0
1 0.0 0.0 0.0 0.0 0.0 0.0 0.0 0.0
2 0.0 0.0 0.0 0.0 0.0 0.0 0.0 0.0
3 0.0 0.0 0.0 0.0 0.0 0.0 0.0 0.0
4 0.0 0.0 0.0 0.0 0.0 0.0 0.0 0.0
5 1.0 0.0 0.0 0.0 0.0 0.0 0.0 0.0
6 0.0 1.0 0.0 0.0 0.0 0.0 0.0 0.0
7 0.0 0.0 1.0 0.0 0.0 0.0 0.0 0.0
8 0.0 0.0 0.0 1.0 0.0 0.0 0.0 0.0
9 0.0 0.0 0.0 0.0 1.1 0.0 0.0 0.0
10 0.0 0.0 0.0 0.0 0.0 1.2 0.0 0.0
11 0.0 0.0 0.0 0.0 0.0 0.0 1.1 0.0
12 0.0 0.0 0.0 0.0 0.0 0.0 0.0 1.2
PK-5 1.0 0.0 0.0 0.0 0.0 0.0 0.0 0.0
6-8 0.0 1.0 1.0 1.0 0.0 0.0 0.0 0.0
9-12 0.0 0.0 0.0 0.0 1.1 1.2 1.1 1.2
PK-12 1.0 1.0 1.0 1.0 1.1 1.2 1.1 1.2

SY2019/20 Demographic Report
80
Study Area 25 Projection Date 10/2/2019
CURRENT PROJECTED RESIDENT STUDENTS
2019 2020 2021 2022 2023 2024 2025 2026
PK 0.0 0.0 0.0 0.0 0.0 0.0 0.0 0.0
K 2.0 1.9 1.8 1.8 1.8 1.8 1.8 1.8
1 2.0 2.1 2.0 1.9 1.8 1.9 1.9 1.9
2 0.0 1.8 1.9 1.8 1.7 1.7 1.7 1.7
3 1.0 0.0 1.9 2.0 1.9 1.8 1.8 1.8
4 1.0 1.0 0.0 1.9 1.9 1.9 1.8 1.7
5 2.0 1.0 1.0 0.0 1.9 2.0 1.9 1.8
6 2.0 2.0 1.0 1.0 0.0 1.9 2.0 1.9
7 0.0 2.0 2.0 1.0 1.0 0.0 1.9 2.0
8 3.0 0.0 2.0 2.0 1.0 1.0 0.0 1.9
9 2.0 3.3 0.0 2.3 2.2 1.1 1.1 0.0
10 5.0 2.1 3.5 0.0 2.4 2.4 1.2 1.2
11 2.0 4.8 2.0 3.4 0.0 2.3 2.2 1.2
12 2.0 2.1 5.0 2.1 3.5 0.0 2.4 2.3
PK-5 8.0 7.8 8.6 9.4 11.0 11.1 10.9 10.7
6-8 5.0 4.0 5.0 4.0 2.0 2.9 3.9 5.8
9-12 11.0 12.3 10.5 7.8 8.1 5.8 6.9 4.7
PK-12 24.0 24.1 24.1 21.2 21.1 19.8 21.7 21.2
Study Area 26 Projection Date 10/2/2019
CURRENT PROJECTED RESIDENT STUDENTS
2019 2020 2021 2022 2023 2024 2025 2026
PK 4.0 3.8 3.8 3.6 3.7 3.7 3.7 3.7
K 3.0 2.9 2.7 2.7 2.7 2.7 2.7 2.7
1 8.0 3.1 3.0 2.8 2.8 2.8 2.8 2.8
2 2.0 7.3 2.8 2.7 2.6 2.5 2.5 2.5
3 9.0 2.1 7.6 3.0 2.9 2.7 2.6 2.7
4 6.0 8.8 2.1 7.5 2.9 2.8 2.6 2.6
5 8.0 6.2 9.1 2.1 7.7 3.0 2.9 2.7
6 10.0 7.8 6.1 8.9 2.1 7.6 2.9 2.8
7 5.0 10.0 7.8 6.1 8.9 2.1 7.6 2.9
8 5.0 5.1 10.2 8.0 6.2 9.1 2.1 7.7
9 7.0 5.6 5.7 11.3 8.9 6.9 10.1 2.4
10 6.0 7.4 5.9 6.0 12.0 9.4 7.3 10.7
11 5.0 5.7 7.0 5.6 5.7 11.4 8.9 6.9
12 5.0 5.2 6.0 7.4 5.9 6.0 12.0 9.4
PK-5 40.0 34.2 31.1 24.4 25.3 20.2 19.8 19.7
6-8 20.0 22.9 24.1 23.0 17.2 18.8 12.6 13.4
9-12 23.0 23.9 24.6 30.3 32.5 33.7 38.3 29.4
PK-12 83.0 81.0 79.8 77.7 75.0 72.7 70.7 62.5
Study Area 27 Projection Date 10/2/2019
CURRENT PROJECTED RESIDENT STUDENTS
2019 2020 2021 2022 2023 2024 2025 2026
PK 0.0 0.0 0.0 0.0 0.0 0.0 0.0 0.0
K 4.0 3.9 3.6 3.6 3.6 3.6 3.6 3.6
1 0.0 4.2 4.0 3.8 3.7 3.7 3.7 3.7
2 2.0 0.0 3.8 3.7 3.4 3.4 3.4 3.4
3 1.0 2.1 0.0 4.0 3.8 3.6 3.5 3.5
4 3.0 1.0 2.1 0.0 3.9 3.8 3.5 3.5
5 0.0 3.1 1.0 2.1 0.0 4.0 3.9 3.6
6 2.0 0.0 3.0 1.0 2.1 0.0 3.9 3.8
7 0.0 2.0 0.0 3.0 1.0 2.1 0.0 3.9
8 1.0 0.0 2.0 0.0 3.1 1.0 2.1 0.0
9 1.0 1.1 0.0 2.3 0.0 3.4 1.1 2.4
10 0.0 1.1 1.2 0.0 2.4 0.0 3.6 1.2
11 3.0 0.0 1.0 1.1 0.0 2.3 0.0 3.5
12 1.0 3.2 0.0 1.1 1.2 0.0 2.4 0.0
PK-5 10.0 14.3 14.5 17.2 18.4 22.1 21.6 21.3
6-8 3.0 2.0 5.0 4.0 6.2 3.1 6.0 7.7
9-12 5.0 5.4 2.2 4.5 3.6 5.7 7.1 7.1
PK-12 18.0 21.7 21.7 25.7 28.2 30.9 34.7 36.1
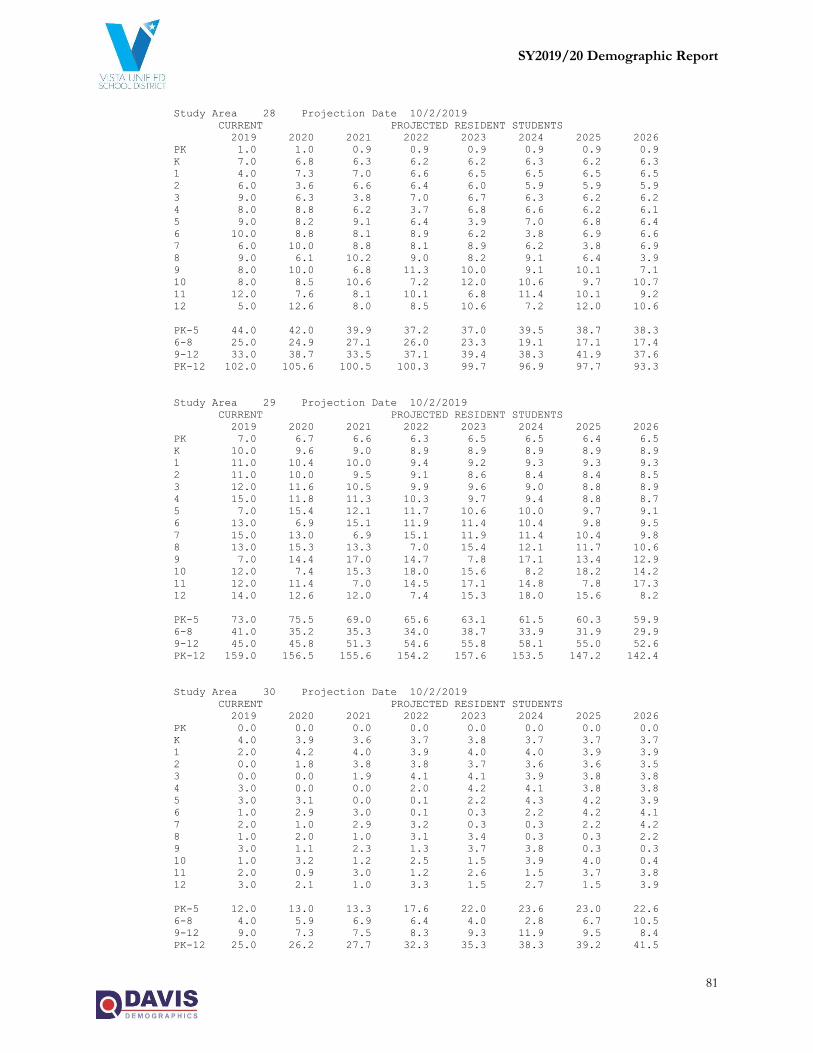
SY2019/20 Demographic Report
81
Study Area 28 Projection Date 10/2/2019
CURRENT PROJECTED RESIDENT STUDENTS
2019 2020 2021 2022 2023 2024 2025 2026
PK 1.0 1.0 0.9 0.9 0.9 0.9 0.9 0.9
K 7.0 6.8 6.3 6.2 6.2 6.3 6.2 6.3
1 4.0 7.3 7.0 6.6 6.5 6.5 6.5 6.5
2 6.0 3.6 6.6 6.4 6.0 5.9 5.9 5.9
3 9.0 6.3 3.8 7.0 6.7 6.3 6.2 6.2
4 8.0 8.8 6.2 3.7 6.8 6.6 6.2 6.1
5 9.0 8.2 9.1 6.4 3.9 7.0 6.8 6.4
6 10.0 8.8 8.1 8.9 6.2 3.8 6.9 6.6
7 6.0 10.0 8.8 8.1 8.9 6.2 3.8 6.9
8 9.0 6.1 10.2 9.0 8.2 9.1 6.4 3.9
9 8.0 10.0 6.8 11.3 10.0 9.1 10.1 7.1
10 8.0 8.5 10.6 7.2 12.0 10.6 9.7 10.7
11 12.0 7.6 8.1 10.1 6.8 11.4 10.1 9.2
12 5.0 12.6 8.0 8.5 10.6 7.2 12.0 10.6
PK-5 44.0 42.0 39.9 37.2 37.0 39.5 38.7 38.3
6-8 25.0 24.9 27.1 26.0 23.3 19.1 17.1 17.4
9-12 33.0 38.7 33.5 37.1 39.4 38.3 41.9 37.6
PK-12 102.0 105.6 100.5 100.3 99.7 96.9 97.7 93.3
Study Area 29 Projection Date 10/2/2019
CURRENT PROJECTED RESIDENT STUDENTS
2019 2020 2021 2022 2023 2024 2025 2026
PK 7.0 6.7 6.6 6.3 6.5 6.5 6.4 6.5
K 10.0 9.6 9.0 8.9 8.9 8.9 8.9 8.9
1 11.0 10.4 10.0 9.4 9.2 9.3 9.3 9.3
2 11.0 10.0 9.5 9.1 8.6 8.4 8.4 8.5
3 12.0 11.6 10.5 9.9 9.6 9.0 8.8 8.9
4 15.0 11.8 11.3 10.3 9.7 9.4 8.8 8.7
5 7.0 15.4 12.1 11.7 10.6 10.0 9.7 9.1
6 13.0 6.9 15.1 11.9 11.4 10.4 9.8 9.5
7 15.0 13.0 6.9 15.1 11.9 11.4 10.4 9.8
8 13.0 15.3 13.3 7.0 15.4 12.1 11.7 10.6
9 7.0 14.4 17.0 14.7 7.8 17.1 13.4 12.9
10 12.0 7.4 15.3 18.0 15.6 8.2 18.2 14.2
11 12.0 11.4 7.0 14.5 17.1 14.8 7.8 17.3
12 14.0 12.6 12.0 7.4 15.3 18.0 15.6 8.2
PK-5 73.0 75.5 69.0 65.6 63.1 61.5 60.3 59.9
6-8 41.0 35.2 35.3 34.0 38.7 33.9 31.9 29.9
9-12 45.0 45.8 51.3 54.6 55.8 58.1 55.0 52.6
PK-12 159.0 156.5 155.6 154.2 157.6 153.5 147.2 142.4
Study Area 30 Projection Date 10/2/2019
CURRENT PROJECTED RESIDENT STUDENTS
2019 2020 2021 2022 2023 2024 2025 2026
PK 0.0 0.0 0.0 0.0 0.0 0.0 0.0 0.0
K 4.0 3.9 3.6 3.7 3.8 3.7 3.7 3.7
1 2.0 4.2 4.0 3.9 4.0 4.0 3.9 3.9
2 0.0 1.8 3.8 3.8 3.7 3.6 3.6 3.5
3 0.0 0.0 1.9 4.1 4.1 3.9 3.8 3.8
4 3.0 0.0 0.0 2.0 4.2 4.1 3.8 3.8
5 3.0 3.1 0.0 0.1 2.2 4.3 4.2 3.9
6 1.0 2.9 3.0 0.1 0.3 2.2 4.2 4.1
7 2.0 1.0 2.9 3.2 0.3 0.3 2.2 4.2
8 1.0 2.0 1.0 3.1 3.4 0.3 0.3 2.2
9 3.0 1.1 2.3 1.3 3.7 3.8 0.3 0.3
10 1.0 3.2 1.2 2.5 1.5 3.9 4.0 0.4
11 2.0 0.9 3.0 1.2 2.6 1.5 3.7 3.8
12 3.0 2.1 1.0 3.3 1.5 2.7 1.5 3.9
PK-5 12.0 13.0 13.3 17.6 22.0 23.6 23.0 22.6
6-8 4.0 5.9 6.9 6.4 4.0 2.8 6.7 10.5
9-12 9.0 7.3 7.5 8.3 9.3 11.9 9.5 8.4
PK-12 25.0 26.2 27.7 32.3 35.3 38.3 39.2 41.5
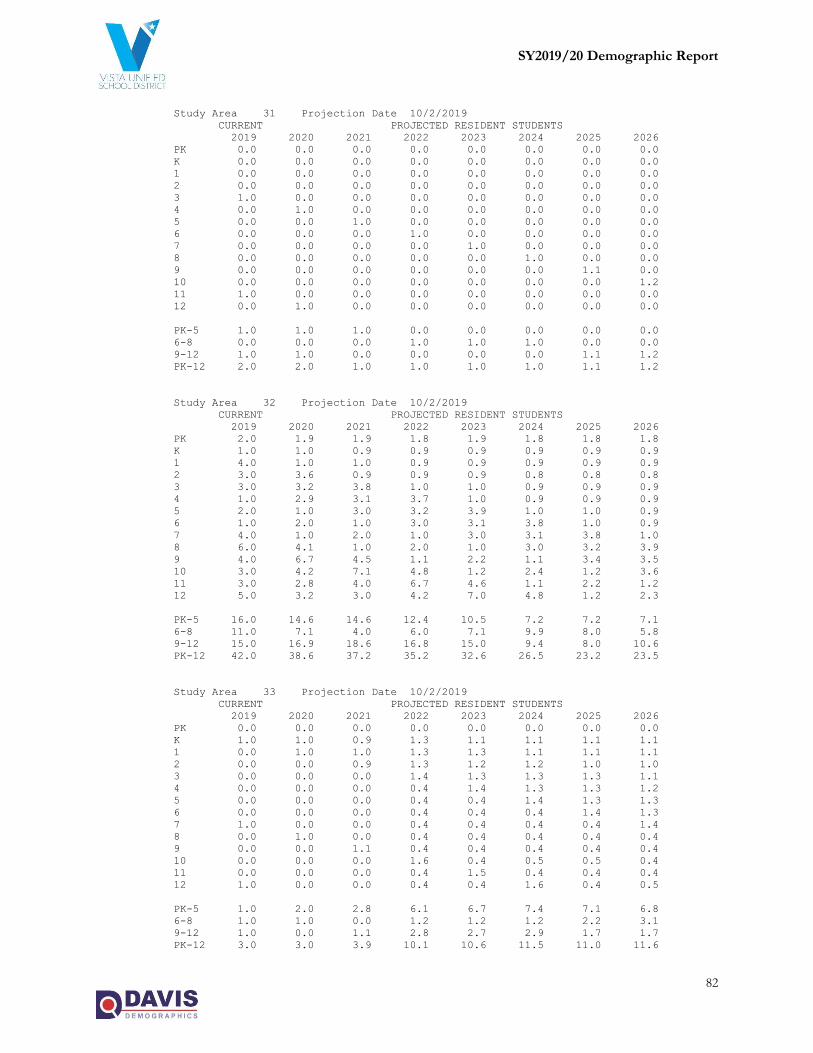
SY2019/20 Demographic Report
82
Study Area 31 Projection Date 10/2/2019
CURRENT PROJECTED RESIDENT STUDENTS
2019 2020 2021 2022 2023 2024 2025 2026
PK 0.0 0.0 0.0 0.0 0.0 0.0 0.0 0.0
K 0.0 0.0 0.0 0.0 0.0 0.0 0.0 0.0
1 0.0 0.0 0.0 0.0 0.0 0.0 0.0 0.0
2 0.0 0.0 0.0 0.0 0.0 0.0 0.0 0.0
3 1.0 0.0 0.0 0.0 0.0 0.0 0.0 0.0
4 0.0 1.0 0.0 0.0 0.0 0.0 0.0 0.0
5 0.0 0.0 1.0 0.0 0.0 0.0 0.0 0.0
6 0.0 0.0 0.0 1.0 0.0 0.0 0.0 0.0
7 0.0 0.0 0.0 0.0 1.0 0.0 0.0 0.0
8 0.0 0.0 0.0 0.0 0.0 1.0 0.0 0.0
9 0.0 0.0 0.0 0.0 0.0 0.0 1.1 0.0
10 0.0 0.0 0.0 0.0 0.0 0.0 0.0 1.2
11 1.0 0.0 0.0 0.0 0.0 0.0 0.0 0.0
12 0.0 1.0 0.0 0.0 0.0 0.0 0.0 0.0
PK-5 1.0 1.0 1.0 0.0 0.0 0.0 0.0 0.0
6-8 0.0 0.0 0.0 1.0 1.0 1.0 0.0 0.0
9-12 1.0 1.0 0.0 0.0 0.0 0.0 1.1 1.2
PK-12 2.0 2.0 1.0 1.0 1.0 1.0 1.1 1.2
Study Area 32 Projection Date 10/2/2019
CURRENT PROJECTED RESIDENT STUDENTS
2019 2020 2021 2022 2023 2024 2025 2026
PK 2.0 1.9 1.9 1.8 1.9 1.8 1.8 1.8
K 1.0 1.0 0.9 0.9 0.9 0.9 0.9 0.9
1 4.0 1.0 1.0 0.9 0.9 0.9 0.9 0.9
2 3.0 3.6 0.9 0.9 0.9 0.8 0.8 0.8
3 3.0 3.2 3.8 1.0 1.0 0.9 0.9 0.9
4 1.0 2.9 3.1 3.7 1.0 0.9 0.9 0.9
5 2.0 1.0 3.0 3.2 3.9 1.0 1.0 0.9
6 1.0 2.0 1.0 3.0 3.1 3.8 1.0 0.9
7 4.0 1.0 2.0 1.0 3.0 3.1 3.8 1.0
8 6.0 4.1 1.0 2.0 1.0 3.0 3.2 3.9
9 4.0 6.7 4.5 1.1 2.2 1.1 3.4 3.5
10 3.0 4.2 7.1 4.8 1.2 2.4 1.2 3.6
11 3.0 2.8 4.0 6.7 4.6 1.1 2.2 1.2
12 5.0 3.2 3.0 4.2 7.0 4.8 1.2 2.3
PK-5 16.0 14.6 14.6 12.4 10.5 7.2 7.2 7.1
6-8 11.0 7.1 4.0 6.0 7.1 9.9 8.0 5.8
9-12 15.0 16.9 18.6 16.8 15.0 9.4 8.0 10.6
PK-12 42.0 38.6 37.2 35.2 32.6 26.5 23.2 23.5
Study Area 33 Projection Date 10/2/2019
CURRENT PROJECTED RESIDENT STUDENTS
2019 2020 2021 2022 2023 2024 2025 2026
PK 0.0 0.0 0.0 0.0 0.0 0.0 0.0 0.0
K 1.0 1.0 0.9 1.3 1.1 1.1 1.1 1.1
1 0.0 1.0 1.0 1.3 1.3 1.1 1.1 1.1
2 0.0 0.0 0.9 1.3 1.2 1.2 1.0 1.0
3 0.0 0.0 0.0 1.4 1.3 1.3 1.3 1.1
4 0.0 0.0 0.0 0.4 1.4 1.3 1.3 1.2
5 0.0 0.0 0.0 0.4 0.4 1.4 1.3 1.3
6 0.0 0.0 0.0 0.4 0.4 0.4 1.4 1.3
7 1.0 0.0 0.0 0.4 0.4 0.4 0.4 1.4
8 0.0 1.0 0.0 0.4 0.4 0.4 0.4 0.4
9 0.0 0.0 1.1 0.4 0.4 0.4 0.4 0.4
10 0.0 0.0 0.0 1.6 0.4 0.5 0.5 0.4
11 0.0 0.0 0.0 0.4 1.5 0.4 0.4 0.4
12 1.0 0.0 0.0 0.4 0.4 1.6 0.4 0.5
PK-5 1.0 2.0 2.8 6.1 6.7 7.4 7.1 6.8
6-8 1.0 1.0 0.0 1.2 1.2 1.2 2.2 3.1
9-12 1.0 0.0 1.1 2.8 2.7 2.9 1.7 1.7
PK-12 3.0 3.0 3.9 10.1 10.6 11.5 11.0 11.6

SY2019/20 Demographic Report
83
Study Area 34 Projection Date 10/2/2019
CURRENT PROJECTED RESIDENT STUDENTS
2019 2020 2021 2022 2023 2024 2025 2026
PK 0.0 0.0 0.0 0.0 0.0 0.0 0.0 0.0
K 3.0 2.9 2.7 2.7 2.7 2.7 2.7 2.7
1 3.0 3.1 3.0 2.8 2.8 2.8 2.8 2.8
2 1.0 2.7 2.8 2.7 2.6 2.5 2.5 2.5
3 3.0 1.0 2.9 3.0 2.9 2.7 2.6 2.7
4 2.0 2.9 1.0 2.8 2.9 2.8 2.6 2.6
5 2.0 2.1 3.0 1.1 2.9 3.0 2.9 2.7
6 2.0 2.0 2.0 3.0 1.0 2.8 2.9 2.8
7 3.0 2.0 2.0 2.0 3.0 1.0 2.8 2.9
8 2.0 3.1 2.0 2.0 2.1 3.0 1.1 2.9
9 3.0 2.2 3.4 2.3 2.2 2.3 3.4 1.2
10 3.0 3.2 2.4 3.6 2.4 2.4 2.4 3.6
11 4.0 2.8 3.0 2.2 3.4 2.3 2.2 2.3
12 2.0 4.2 3.0 3.2 2.3 3.6 2.4 2.3
PK-5 14.0 14.7 15.4 15.1 16.8 16.5 16.1 16.0
6-8 7.0 7.1 6.0 7.0 6.1 6.8 6.8 8.6
9-12 12.0 12.4 11.8 11.3 10.3 10.6 10.4 9.4
PK-12 33.0 34.2 33.2 33.4 33.2 33.9 33.3 34.0
Study Area 35 Projection Date 10/2/2019
CURRENT PROJECTED RESIDENT STUDENTS
2019 2020 2021 2022 2023 2024 2025 2026
PK 0.0 0.0 0.0 0.0 0.0 0.0 0.0 0.0
K 1.0 1.0 0.9 0.9 0.9 0.9 0.9 0.9
1 0.0 1.0 1.0 0.9 0.9 0.9 0.9 0.9
2 0.0 0.0 0.9 0.9 0.9 0.8 0.8 0.8
3 4.0 0.0 0.0 1.0 1.0 0.9 0.9 0.9
4 1.0 3.9 0.0 0.0 1.0 0.9 0.9 0.9
5 2.0 1.0 4.0 0.0 0.0 1.0 1.0 0.9
6 1.0 2.0 1.0 4.0 0.0 0.0 1.0 0.9
7 1.0 1.0 2.0 1.0 4.0 0.0 0.0 1.0
8 1.0 1.0 1.0 2.0 1.0 4.0 0.0 0.0
9 3.0 1.1 1.1 1.1 2.2 1.1 4.5 0.0
10 3.0 3.2 1.2 1.2 1.2 2.4 1.2 4.7
11 0.0 2.8 3.0 1.1 1.1 1.1 2.2 1.2
12 0.0 0.0 3.0 3.2 1.2 1.2 1.2 2.3
PK-5 8.0 6.9 6.8 3.7 4.7 5.4 5.4 5.3
6-8 3.0 4.0 4.0 7.0 5.0 4.0 1.0 1.9
9-12 6.0 7.1 8.3 6.6 5.7 5.8 9.1 8.2
PK-12 17.0 18.0 19.1 17.3 15.4 15.2 15.5 15.4
Study Area 36 Projection Date 10/2/2019
CURRENT PROJECTED RESIDENT STUDENTS
2019 2020 2021 2022 2023 2024 2025 2026
PK 1.0 1.0 0.9 0.9 0.9 0.9 0.9 0.9
K 7.0 6.8 6.3 6.2 6.2 6.3 6.2 6.3
1 3.0 7.3 7.0 6.6 6.5 6.5 6.5 6.5
2 6.0 2.7 6.6 6.4 6.0 5.9 5.9 5.9
3 6.0 6.3 2.9 7.0 6.7 6.3 6.2 6.2
4 2.0 5.9 6.2 2.8 6.8 6.6 6.2 6.1
5 5.0 2.1 6.1 6.4 2.9 7.0 6.8 6.4
6 2.0 4.9 2.0 5.9 6.2 2.8 6.9 6.6
7 3.0 2.0 4.9 2.0 5.9 6.2 2.8 6.9
8 0.0 3.1 2.0 5.0 2.1 6.1 6.4 2.9
9 9.0 0.0 3.4 2.3 5.5 2.3 6.7 7.1
10 7.0 9.5 0.0 3.6 2.4 5.9 2.4 7.1
11 3.0 6.7 9.1 0.0 3.4 2.3 5.6 2.3
12 4.0 3.2 7.0 9.5 0.0 3.6 2.4 5.9
PK-5 30.0 32.1 36.0 36.3 36.0 39.5 38.7 38.3
6-8 5.0 10.0 8.9 12.9 14.2 15.1 16.1 16.4
9-12 23.0 19.4 19.5 15.4 11.3 14.1 17.1 22.4
PK-12 58.0 61.5 64.4 64.6 61.5 68.7 71.9 77.1
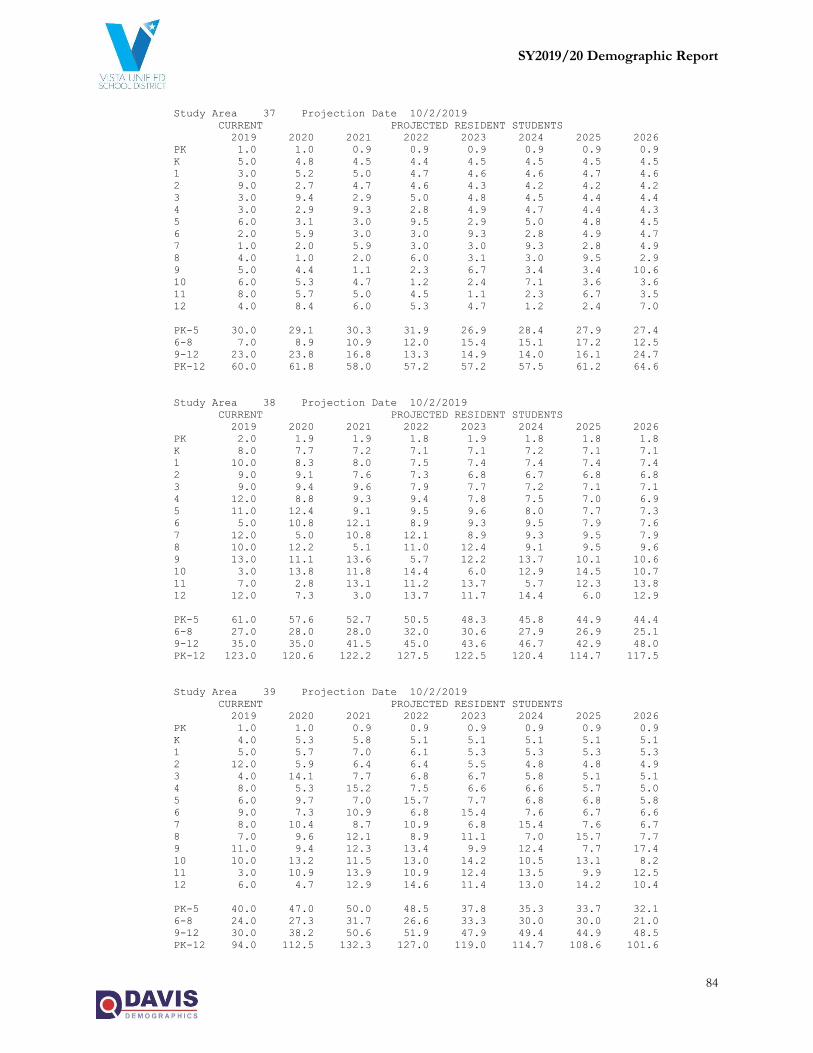
SY2019/20 Demographic Report
84
Study Area 37 Projection Date 10/2/2019
CURRENT PROJECTED RESIDENT STUDENTS
2019 2020 2021 2022 2023 2024 2025 2026
PK 1.0 1.0 0.9 0.9 0.9 0.9 0.9 0.9
K 5.0 4.8 4.5 4.4 4.5 4.5 4.5 4.5
1 3.0 5.2 5.0 4.7 4.6 4.6 4.7 4.6
2 9.0 2.7 4.7 4.6 4.3 4.2 4.2 4.2
3 3.0 9.4 2.9 5.0 4.8 4.5 4.4 4.4
4 3.0 2.9 9.3 2.8 4.9 4.7 4.4 4.3
5 6.0 3.1 3.0 9.5 2.9 5.0 4.8 4.5
6 2.0 5.9 3.0 3.0 9.3 2.8 4.9 4.7
7 1.0 2.0 5.9 3.0 3.0 9.3 2.8 4.9
8 4.0 1.0 2.0 6.0 3.1 3.0 9.5 2.9
9 5.0 4.4 1.1 2.3 6.7 3.4 3.4 10.6
10 6.0 5.3 4.7 1.2 2.4 7.1 3.6 3.6
11 8.0 5.7 5.0 4.5 1.1 2.3 6.7 3.5
12 4.0 8.4 6.0 5.3 4.7 1.2 2.4 7.0
PK-5 30.0 29.1 30.3 31.9 26.9 28.4 27.9 27.4
6-8 7.0 8.9 10.9 12.0 15.4 15.1 17.2 12.5
9-12 23.0 23.8 16.8 13.3 14.9 14.0 16.1 24.7
PK-12 60.0 61.8 58.0 57.2 57.2 57.5 61.2 64.6
Study Area 38 Projection Date 10/2/2019
CURRENT PROJECTED RESIDENT STUDENTS
2019 2020 2021 2022 2023 2024 2025 2026
PK 2.0 1.9 1.9 1.8 1.9 1.8 1.8 1.8
K 8.0 7.7 7.2 7.1 7.1 7.2 7.1 7.1
1 10.0 8.3 8.0 7.5 7.4 7.4 7.4 7.4
2 9.0 9.1 7.6 7.3 6.8 6.7 6.8 6.8
3 9.0 9.4 9.6 7.9 7.7 7.2 7.1 7.1
4 12.0 8.8 9.3 9.4 7.8 7.5 7.0 6.9
5 11.0 12.4 9.1 9.5 9.6 8.0 7.7 7.3
6 5.0 10.8 12.1 8.9 9.3 9.5 7.9 7.6
7 12.0 5.0 10.8 12.1 8.9 9.3 9.5 7.9
8 10.0 12.2 5.1 11.0 12.4 9.1 9.5 9.6
9 13.0 11.1 13.6 5.7 12.2 13.7 10.1 10.6
10 3.0 13.8 11.8 14.4 6.0 12.9 14.5 10.7
11 7.0 2.8 13.1 11.2 13.7 5.7 12.3 13.8
12 12.0 7.3 3.0 13.7 11.7 14.4 6.0 12.9
PK-5 61.0 57.6 52.7 50.5 48.3 45.8 44.9 44.4
6-8 27.0 28.0 28.0 32.0 30.6 27.9 26.9 25.1
9-12 35.0 35.0 41.5 45.0 43.6 46.7 42.9 48.0
PK-12 123.0 120.6 122.2 127.5 122.5 120.4 114.7 117.5
Study Area 39 Projection Date 10/2/2019
CURRENT PROJECTED RESIDENT STUDENTS
2019 2020 2021 2022 2023 2024 2025 2026
PK 1.0 1.0 0.9 0.9 0.9 0.9 0.9 0.9
K 4.0 5.3 5.8 5.1 5.1 5.1 5.1 5.1
1 5.0 5.7 7.0 6.1 5.3 5.3 5.3 5.3
2 12.0 5.9 6.4 6.4 5.5 4.8 4.8 4.9
3 4.0 14.1 7.7 6.8 6.7 5.8 5.1 5.1
4 8.0 5.3 15.2 7.5 6.6 6.6 5.7 5.0
5 6.0 9.7 7.0 15.7 7.7 6.8 6.8 5.8
6 9.0 7.3 10.9 6.8 15.4 7.6 6.7 6.6
7 8.0 10.4 8.7 10.9 6.8 15.4 7.6 6.7
8 7.0 9.6 12.1 8.9 11.1 7.0 15.7 7.7
9 11.0 9.4 12.3 13.4 9.9 12.4 7.7 17.4
10 10.0 13.2 11.5 13.0 14.2 10.5 13.1 8.2
11 3.0 10.9 13.9 10.9 12.4 13.5 9.9 12.5
12 6.0 4.7 12.9 14.6 11.4 13.0 14.2 10.4
PK-5 40.0 47.0 50.0 48.5 37.8 35.3 33.7 32.1
6-8 24.0 27.3 31.7 26.6 33.3 30.0 30.0 21.0
9-12 30.0 38.2 50.6 51.9 47.9 49.4 44.9 48.5
PK-12 94.0 112.5 132.3 127.0 119.0 114.7 108.6 101.6

SY2019/20 Demographic Report
85
Study Area 40 Projection Date 10/2/2019
CURRENT PROJECTED RESIDENT STUDENTS
2019 2020 2021 2022 2023 2024 2025 2026
PK 3.0 2.9 2.8 2.7 2.8 2.8 2.8 2.8
K 7.0 6.8 6.3 6.2 6.2 6.3 6.2 6.3
1 9.0 7.3 7.0 6.6 6.5 6.5 6.5 6.5
2 6.0 8.2 6.6 6.4 6.0 5.9 5.9 5.9
3 3.0 6.3 8.6 7.0 6.7 6.3 6.2 6.2
4 6.0 2.9 6.2 8.4 6.8 6.6 6.2 6.1
5 12.0 6.2 3.0 6.4 8.7 7.0 6.8 6.4
6 7.0 11.8 6.1 3.0 6.2 8.5 6.9 6.6
7 5.0 7.0 11.8 6.1 3.0 6.2 8.5 6.9
8 9.0 5.1 7.1 12.0 6.2 3.0 6.4 8.7
9 11.0 10.0 5.7 7.9 13.3 6.9 3.4 7.1
10 7.0 11.7 10.6 6.0 8.4 14.1 7.3 3.6
11 8.0 6.7 11.1 10.1 5.7 8.0 13.4 6.9
12 6.0 8.4 7.0 11.6 10.6 6.0 8.4 14.1
PK-5 46.0 40.6 40.5 43.7 43.7 41.4 40.6 40.2
6-8 21.0 23.9 25.0 21.1 15.4 17.7 21.8 22.2
9-12 32.0 36.8 34.4 35.6 38.0 35.0 32.5 31.7
PK-12 99.0 101.3 99.9 100.4 97.1 94.1 94.9 94.1
Study Area 41 Projection Date 10/2/2019
CURRENT PROJECTED RESIDENT STUDENTS
2019 2020 2021 2022 2023 2024 2025 2026
PK 0.0 0.0 0.0 0.0 0.0 0.0 0.0 0.0
K 4.0 3.9 3.6 3.6 3.6 3.6 3.6 3.6
1 3.0 4.2 4.0 3.8 3.7 3.7 3.7 3.7
2 5.0 2.7 3.8 3.7 3.4 3.4 3.4 3.4
3 5.0 5.2 2.9 4.0 3.8 3.6 3.5 3.5
4 9.0 4.9 5.1 2.8 3.9 3.8 3.5 3.5
5 4.0 9.3 5.0 5.3 2.9 4.0 3.9 3.6
6 2.0 3.9 9.1 4.9 5.2 2.8 3.9 3.8
7 3.0 2.0 3.9 9.1 4.9 5.2 2.8 3.9
8 4.0 3.1 2.0 4.0 9.3 5.0 5.3 2.9
9 5.0 4.4 3.4 2.3 4.4 10.3 5.6 5.9
10 2.0 5.3 4.7 3.6 2.4 4.7 10.9 5.9
11 4.0 1.9 5.0 4.5 3.4 2.3 4.5 10.4
12 3.0 4.2 2.0 5.3 4.7 3.6 2.4 4.7
PK-5 30.0 30.2 24.4 23.2 21.3 22.1 21.6 21.3
6-8 9.0 9.0 15.0 18.0 19.4 13.0 12.0 10.6
9-12 14.0 15.8 15.1 15.7 14.9 20.9 23.4 26.9
PK-12 53.0 55.0 54.5 56.9 55.6 56.0 57.0 58.8
Study Area 42 Projection Date 10/2/2019
CURRENT PROJECTED RESIDENT STUDENTS
2019 2020 2021 2022 2023 2024 2025 2026
PK 2.0 1.9 1.9 1.8 1.9 1.8 1.8 1.8
K 1.0 1.0 0.9 0.9 0.9 0.9 0.9 0.9
1 2.0 1.0 1.0 0.9 0.9 0.9 0.9 0.9
2 2.0 1.8 0.9 0.9 0.9 0.8 0.8 0.8
3 1.0 2.1 1.9 1.0 1.0 0.9 0.9 0.9
4 1.0 1.0 2.1 1.9 1.0 0.9 0.9 0.9
5 1.0 1.0 1.0 2.1 1.9 1.0 1.0 0.9
6 2.0 1.0 1.0 1.0 2.1 1.9 1.0 0.9
7 2.0 2.0 1.0 1.0 1.0 2.1 1.9 1.0
8 1.0 2.0 2.0 1.0 1.0 1.0 2.1 1.9
9 2.0 1.1 2.3 2.3 1.1 1.1 1.1 2.4
10 4.0 2.1 1.2 2.4 2.4 1.2 1.2 1.2
11 0.0 3.8 2.0 1.1 2.3 2.3 1.1 1.2
12 2.0 0.0 4.0 2.1 1.2 2.4 2.4 1.2
PK-5 10.0 9.8 9.7 9.5 8.5 7.2 7.2 7.1
6-8 5.0 5.0 4.0 3.0 4.1 5.0 5.0 3.8
9-12 8.0 7.0 9.5 7.9 7.0 7.0 5.8 6.0
PK-12 23.0 21.8 23.2 20.4 19.6 19.2 18.0 16.9

SY2019/20 Demographic Report
86
Study Area 43 Projection Date 10/2/2019
CURRENT PROJECTED RESIDENT STUDENTS
2019 2020 2021 2022 2023 2024 2025 2026
PK 0.0 0.0 0.0 0.0 0.0 0.0 0.0 0.0
K 0.0 0.0 0.0 0.0 0.0 0.0 0.0 0.0
1 1.0 0.0 0.0 0.0 0.0 0.0 0.0 0.0
2 0.0 0.9 0.0 0.0 0.0 0.0 0.0 0.0
3 1.0 0.0 1.0 0.0 0.0 0.0 0.0 0.0
4 0.0 1.0 0.0 0.9 0.0 0.0 0.0 0.0
5 0.0 0.0 1.0 0.0 1.0 0.0 0.0 0.0
6 0.0 0.0 0.0 1.0 0.0 0.9 0.0 0.0
7 1.0 0.0 0.0 0.0 1.0 0.0 0.9 0.0
8 0.0 1.0 0.0 0.0 0.0 1.0 0.0 1.0
9 2.0 0.0 1.1 0.0 0.0 0.0 1.1 0.0
10 1.0 2.1 0.0 1.2 0.0 0.0 0.0 1.2
11 0.0 0.9 2.0 0.0 1.1 0.0 0.0 0.0
12 3.0 0.0 1.0 2.1 0.0 1.2 0.0 0.0
PK-5 2.0 1.9 2.0 0.9 1.0 0.0 0.0 0.0
6-8 1.0 1.0 0.0 1.0 1.0 1.9 0.9 1.0
9-12 6.0 3.0 4.1 3.3 1.1 1.2 1.1 1.2
PK-12 9.0 5.9 6.1 5.2 3.1 3.1 2.0 2.2
Study Area 44 Projection Date 10/2/2019
CURRENT PROJECTED RESIDENT STUDENTS
2019 2020 2021 2022 2023 2024 2025 2026
PK 0.0 0.0 0.0 0.0 0.0 0.0 0.0 0.0
K 0.0 0.0 0.0 0.0 0.0 0.0 0.0 0.0
1 1.0 0.0 0.0 0.0 0.0 0.0 0.0 0.0
2 0.0 0.9 0.0 0.0 0.0 0.0 0.0 0.0
3 0.0 0.0 1.0 0.0 0.0 0.0 0.0 0.0
4 0.0 0.0 0.0 0.9 0.0 0.0 0.0 0.0
5 0.0 0.0 0.0 0.0 1.0 0.0 0.0 0.0
6 0.0 0.0 0.0 0.0 0.0 0.9 0.0 0.0
7 0.0 0.0 0.0 0.0 0.0 0.0 0.9 0.0
8 0.0 0.0 0.0 0.0 0.0 0.0 0.0 1.0
9 0.0 0.0 0.0 0.0 0.0 0.0 0.0 0.0
10 0.0 0.0 0.0 0.0 0.0 0.0 0.0 0.0
11 0.0 0.0 0.0 0.0 0.0 0.0 0.0 0.0
12 1.0 0.0 0.0 0.0 0.0 0.0 0.0 0.0
PK-5 1.0 0.9 1.0 0.9 1.0 0.0 0.0 0.0
6-8 0.0 0.0 0.0 0.0 0.0 0.9 0.9 1.0
9-12 1.0 0.0 0.0 0.0 0.0 0.0 0.0 0.0
PK-12 2.0 0.9 1.0 0.9 1.0 0.9 0.9 1.0
Study Area 45 Projection Date 10/2/2019
CURRENT PROJECTED RESIDENT STUDENTS
2019 2020 2021 2022 2023 2024 2025 2026
PK 0.0 0.0 0.0 0.0 0.0 0.0 0.0 0.0
K 0.0 0.0 0.0 0.0 0.0 0.0 0.0 0.0
1 0.0 0.0 0.0 0.0 0.0 0.0 0.0 0.0
2 0.0 0.0 0.0 0.0 0.0 0.0 0.0 0.0
3 0.0 0.0 0.0 0.0 0.0 0.0 0.0 0.0
4 0.0 0.0 0.0 0.0 0.0 0.0 0.0 0.0
5 0.0 0.0 0.0 0.0 0.0 0.0 0.0 0.0
6 0.0 0.0 0.0 0.0 0.0 0.0 0.0 0.0
7 0.0 0.0 0.0 0.0 0.0 0.0 0.0 0.0
8 0.0 0.0 0.0 0.0 0.0 0.0 0.0 0.0
9 0.0 0.0 0.0 0.0 0.0 0.0 0.0 0.0
10 0.0 0.0 0.0 0.0 0.0 0.0 0.0 0.0
11 0.0 0.0 0.0 0.0 0.0 0.0 0.0 0.0
12 0.0 0.0 0.0 0.0 0.0 0.0 0.0 0.0
PK-5 0.0 0.0 0.0 0.0 0.0 0.0 0.0 0.0
6-8 0.0 0.0 0.0 0.0 0.0 0.0 0.0 0.0
9-12 0.0 0.0 0.0 0.0 0.0 0.0 0.0 0.0
PK-12 0.0 0.0 0.0 0.0 0.0 0.0 0.0 0.0

SY2019/20 Demographic Report
87
Study Area 46 Projection Date 10/2/2019
CURRENT PROJECTED RESIDENT STUDENTS
2019 2020 2021 2022 2023 2024 2025 2026
PK 2.0 1.9 1.9 1.8 1.9 1.8 1.8 1.8
K 8.0 7.6 7.1 7.5 6.7 7.1 7.1 7.0
1 13.0 7.6 7.3 6.8 7.1 6.4 6.8 6.8
2 14.0 13.3 7.8 7.4 6.9 7.3 6.5 6.9
3 13.0 13.4 12.7 7.4 7.1 6.6 7.0 6.3
4 8.0 12.6 13.0 12.3 7.2 6.9 6.4 6.8
5 9.0 7.7 12.1 12.5 11.9 6.9 6.6 6.2
6 8.0 8.6 7.4 11.6 12.0 11.4 6.7 6.3
7 10.0 7.8 8.4 7.2 11.3 11.7 11.0 6.5
8 12.0 10.0 7.8 8.4 7.2 11.3 11.7 11.0
9 4.0 12.2 10.2 7.9 8.5 7.3 11.5 11.9
10 6.0 3.8 11.8 9.8 7.6 8.2 7.0 11.0
11 10.0 5.8 3.7 11.3 9.4 7.3 7.9 6.7
12 5.0 9.6 5.5 3.5 10.8 9.0 7.0 7.6
PK-5 67.0 64.1 61.9 55.7 48.8 43.0 42.2 41.8
6-8 30.0 26.4 23.6 27.2 30.5 34.4 29.4 23.8
9-12 25.0 31.4 31.2 32.5 36.3 31.8 33.4 37.2
PK-12 122.0 121.9 116.7 115.4 115.6 109.2 105.0 102.8
Study Area 47 Projection Date 10/2/2019
CURRENT PROJECTED RESIDENT STUDENTS
2019 2020 2021 2022 2023 2024 2025 2026
PK 1.0 1.0 0.9 0.9 0.9 0.9 0.9 0.9
K 5.0 4.8 4.5 4.7 4.2 4.5 4.5 4.4
1 4.0 4.8 4.5 4.2 4.5 4.0 4.2 4.2
2 8.0 4.1 4.8 4.6 4.3 4.6 4.1 4.3
3 6.0 7.7 3.9 4.7 4.4 4.1 4.4 3.9
4 7.0 5.8 7.4 3.8 4.5 4.3 4.0 4.2
5 8.0 6.7 5.6 7.2 3.6 4.3 4.1 3.9
6 7.0 7.7 6.5 5.4 6.9 3.5 4.2 4.0
7 3.0 6.8 7.4 6.3 5.2 6.7 3.4 4.0
8 9.0 3.0 6.8 7.4 6.3 5.2 6.7 3.4
9 6.0 9.2 3.1 6.9 7.6 6.4 5.3 6.8
10 5.0 5.8 8.8 2.9 6.6 7.3 6.1 5.1
11 4.0 4.8 5.5 8.5 2.8 6.4 7.0 5.9
12 11.0 3.8 4.6 5.3 8.1 2.7 6.1 6.7
PK-5 39.0 34.9 31.6 30.1 26.4 26.7 26.2 25.8
6-8 19.0 17.5 20.7 19.1 18.4 15.4 14.3 11.4
9-12 26.0 23.6 22.0 23.6 25.1 22.8 24.5 24.5
PK-12 84.0 76.0 74.3 72.8 69.9 64.9 65.0 61.7
Study Area 48 Projection Date 10/2/2019
CURRENT PROJECTED RESIDENT STUDENTS
2019 2020 2021 2022 2023 2024 2025 2026
PK 3.0 2.9 2.8 2.7 2.8 2.8 2.8 2.8
K 2.0 1.9 1.8 1.9 1.7 1.8 1.8 1.7
1 9.0 1.9 1.8 1.7 1.8 1.6 1.7 1.7
2 9.0 9.2 1.9 1.8 1.7 1.8 1.6 1.7
3 8.0 8.6 8.8 1.9 1.8 1.7 1.7 1.6
4 10.0 7.8 8.4 8.5 1.8 1.7 1.6 1.7
5 5.0 9.6 7.4 8.0 8.2 1.7 1.7 1.5
6 9.0 4.8 9.2 7.2 7.7 7.9 1.7 1.6
7 12.0 8.7 4.7 8.9 6.9 7.5 7.6 1.6
8 7.0 12.0 8.7 4.7 8.9 6.9 7.5 7.6
9 8.0 7.1 12.2 8.9 4.7 9.1 7.1 7.6
10 12.0 7.7 6.9 11.8 8.5 4.6 8.8 6.8
11 8.0 11.5 7.4 6.6 11.3 8.2 4.4 8.4
12 6.0 7.7 11.1 7.1 6.3 10.8 7.9 4.2
PK-5 46.0 41.9 32.9 26.5 19.8 13.1 12.9 12.7
6-8 28.0 25.5 22.6 20.8 23.5 22.3 16.8 10.8
9-12 34.0 34.0 37.6 34.4 30.8 32.7 28.2 27.0
PK-12 108.0 101.4 93.1 81.7 74.1 68.1 57.9 50.5

SY2019/20 Demographic Report
88
Study Area 49 Projection Date 10/2/2019
CURRENT PROJECTED RESIDENT STUDENTS
2019 2020 2021 2022 2023 2024 2025 2026
PK 5.0 4.8 4.7 4.5 4.7 4.6 4.6 4.6
K 4.0 3.8 3.6 3.8 3.4 3.6 3.6 3.5
1 1.0 4.0 3.8 3.6 3.8 3.4 3.6 3.6
2 4.0 1.0 4.0 3.8 3.6 3.8 3.4 3.6
3 6.0 3.7 0.9 3.7 3.5 3.3 3.5 3.1
4 9.0 5.8 3.6 0.9 3.6 3.4 3.2 3.4
5 6.0 8.6 5.6 3.4 0.9 3.4 3.3 3.1
6 5.0 5.2 7.4 4.8 2.9 0.7 2.9 2.8
7 6.0 4.9 5.1 7.3 4.7 2.9 0.7 2.9
8 3.0 6.1 4.9 5.1 7.4 4.8 2.9 0.7
9 6.0 2.8 5.6 4.6 4.7 6.8 4.4 2.7
10 8.0 5.9 2.7 5.5 4.5 4.7 6.7 4.3
11 9.0 7.6 5.6 2.6 5.2 4.3 4.4 6.4
12 7.0 9.1 7.7 5.6 2.6 5.3 4.3 4.5
PK-5 35.0 31.7 26.2 23.7 23.5 25.5 25.2 24.9
6-8 14.0 16.2 17.4 17.2 15.0 8.4 6.5 6.4
9-12 30.0 25.4 21.6 18.3 17.0 21.1 19.8 17.9
PK-12 79.0 73.3 65.2 59.2 55.5 55.0 51.5 49.2
Study Area 50 Projection Date 10/2/2019
CURRENT PROJECTED RESIDENT STUDENTS
2019 2020 2021 2022 2023 2024 2025 2026
PK 1.0 1.0 0.9 0.9 0.9 0.9 0.9 0.9
K 9.0 8.6 8.0 8.5 7.6 8.0 8.0 7.9
1 8.0 9.0 8.6 8.0 8.5 7.6 8.0 8.0
2 3.0 8.0 9.0 8.6 8.0 8.5 7.6 8.0
3 7.0 2.8 7.4 8.3 7.9 7.4 7.8 7.0
4 4.0 6.8 2.7 7.1 8.0 7.7 7.2 7.5
5 6.0 3.8 6.5 2.6 6.9 7.7 7.4 6.9
6 4.0 5.2 3.3 5.6 2.2 5.9 6.6 6.3
7 7.0 3.9 5.1 3.2 5.5 2.2 5.8 6.5
8 6.0 7.1 4.0 5.1 3.3 5.5 2.2 5.8
9 2.0 5.6 6.6 3.7 4.7 3.0 5.2 2.0
10 7.0 2.0 5.5 6.4 3.6 4.7 3.0 5.1
11 6.0 6.7 1.9 5.2 6.1 3.4 4.4 2.8
12 3.0 6.1 6.7 1.9 5.2 6.2 3.5 4.5
PK-5 38.0 40.0 43.1 44.0 47.8 47.8 46.9 46.2
6-8 17.0 16.2 12.4 13.9 11.0 13.6 14.6 18.6
9-12 18.0 20.4 20.7 17.2 19.6 17.3 16.1 14.4
PK-12 73.0 76.6 76.2 75.1 78.4 78.7 77.6 79.2
Study Area 51 Projection Date 10/2/2019
CURRENT PROJECTED RESIDENT STUDENTS
2019 2020 2021 2022 2023 2024 2025 2026
PK 0.0 0.0 0.0 0.0 0.0 0.0 0.0 0.0
K 4.0 3.8 3.6 3.8 3.4 3.6 3.6 3.5
1 7.0 4.0 3.8 3.6 3.8 3.4 3.6 3.6
2 9.0 7.0 4.0 3.8 3.6 3.8 3.4 3.6
3 9.0 8.3 6.4 3.7 3.5 3.3 3.5 3.1
4 6.0 8.7 8.0 6.2 3.6 3.4 3.2 3.4
5 5.0 5.8 8.4 7.7 6.0 3.4 3.3 3.1
6 7.0 4.3 5.0 7.2 6.6 5.2 2.9 2.8
7 8.0 6.9 4.2 4.9 7.1 6.5 5.1 2.9
8 5.0 8.1 6.9 4.3 4.9 7.1 6.6 5.1
9 6.0 4.7 7.5 6.4 4.0 4.6 6.6 6.1
10 8.0 5.9 4.6 7.4 6.3 3.9 4.5 6.5
11 6.0 7.6 5.6 4.3 7.0 6.0 3.7 4.2
12 4.0 6.1 7.7 5.6 4.4 7.1 6.1 3.7
PK-5 40.0 37.6 34.2 28.8 23.9 20.9 20.6 20.3
6-8 20.0 19.3 16.1 16.4 18.6 18.8 14.6 10.8
9-12 24.0 24.3 25.4 23.7 21.7 21.6 20.9 20.5
PK-12 84.0 81.2 75.7 68.9 64.2 61.3 56.1 51.6
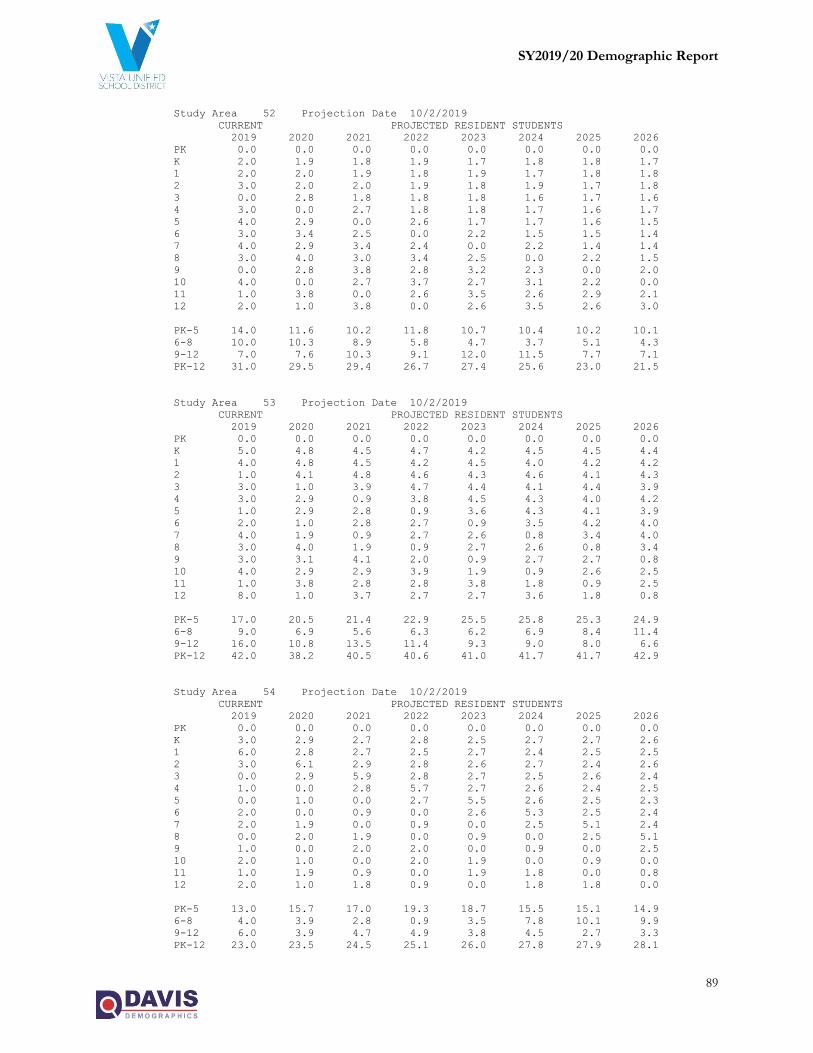
SY2019/20 Demographic Report
89
Study Area 52 Projection Date 10/2/2019
CURRENT PROJECTED RESIDENT STUDENTS
2019 2020 2021 2022 2023 2024 2025 2026
PK 0.0 0.0 0.0 0.0 0.0 0.0 0.0 0.0
K 2.0 1.9 1.8 1.9 1.7 1.8 1.8 1.7
1 2.0 2.0 1.9 1.8 1.9 1.7 1.8 1.8
2 3.0 2.0 2.0 1.9 1.8 1.9 1.7 1.8
3 0.0 2.8 1.8 1.8 1.8 1.6 1.7 1.6
4 3.0 0.0 2.7 1.8 1.8 1.7 1.6 1.7
5 4.0 2.9 0.0 2.6 1.7 1.7 1.6 1.5
6 3.0 3.4 2.5 0.0 2.2 1.5 1.5 1.4
7 4.0 2.9 3.4 2.4 0.0 2.2 1.4 1.4
8 3.0 4.0 3.0 3.4 2.5 0.0 2.2 1.5
9 0.0 2.8 3.8 2.8 3.2 2.3 0.0 2.0
10 4.0 0.0 2.7 3.7 2.7 3.1 2.2 0.0
11 1.0 3.8 0.0 2.6 3.5 2.6 2.9 2.1
12 2.0 1.0 3.8 0.0 2.6 3.5 2.6 3.0
PK-5 14.0 11.6 10.2 11.8 10.7 10.4 10.2 10.1
6-8 10.0 10.3 8.9 5.8 4.7 3.7 5.1 4.3
9-12 7.0 7.6 10.3 9.1 12.0 11.5 7.7 7.1
PK-12 31.0 29.5 29.4 26.7 27.4 25.6 23.0 21.5
Study Area 53 Projection Date 10/2/2019
CURRENT PROJECTED RESIDENT STUDENTS
2019 2020 2021 2022 2023 2024 2025 2026
PK 0.0 0.0 0.0 0.0 0.0 0.0 0.0 0.0
K 5.0 4.8 4.5 4.7 4.2 4.5 4.5 4.4
1 4.0 4.8 4.5 4.2 4.5 4.0 4.2 4.2
2 1.0 4.1 4.8 4.6 4.3 4.6 4.1 4.3
3 3.0 1.0 3.9 4.7 4.4 4.1 4.4 3.9
4 3.0 2.9 0.9 3.8 4.5 4.3 4.0 4.2
5 1.0 2.9 2.8 0.9 3.6 4.3 4.1 3.9
6 2.0 1.0 2.8 2.7 0.9 3.5 4.2 4.0
7 4.0 1.9 0.9 2.7 2.6 0.8 3.4 4.0
8 3.0 4.0 1.9 0.9 2.7 2.6 0.8 3.4
9 3.0 3.1 4.1 2.0 0.9 2.7 2.7 0.8
10 4.0 2.9 2.9 3.9 1.9 0.9 2.6 2.5
11 1.0 3.8 2.8 2.8 3.8 1.8 0.9 2.5
12 8.0 1.0 3.7 2.7 2.7 3.6 1.8 0.8
PK-5 17.0 20.5 21.4 22.9 25.5 25.8 25.3 24.9
6-8 9.0 6.9 5.6 6.3 6.2 6.9 8.4 11.4
9-12 16.0 10.8 13.5 11.4 9.3 9.0 8.0 6.6
PK-12 42.0 38.2 40.5 40.6 41.0 41.7 41.7 42.9
Study Area 54 Projection Date 10/2/2019
CURRENT PROJECTED RESIDENT STUDENTS
2019 2020 2021 2022 2023 2024 2025 2026
PK 0.0 0.0 0.0 0.0 0.0 0.0 0.0 0.0
K 3.0 2.9 2.7 2.8 2.5 2.7 2.7 2.6
1 6.0 2.8 2.7 2.5 2.7 2.4 2.5 2.5
2 3.0 6.1 2.9 2.8 2.6 2.7 2.4 2.6
3 0.0 2.9 5.9 2.8 2.7 2.5 2.6 2.4
4 1.0 0.0 2.8 5.7 2.7 2.6 2.4 2.5
5 0.0 1.0 0.0 2.7 5.5 2.6 2.5 2.3
6 2.0 0.0 0.9 0.0 2.6 5.3 2.5 2.4
7 2.0 1.9 0.0 0.9 0.0 2.5 5.1 2.4
8 0.0 2.0 1.9 0.0 0.9 0.0 2.5 5.1
9 1.0 0.0 2.0 2.0 0.0 0.9 0.0 2.5
10 2.0 1.0 0.0 2.0 1.9 0.0 0.9 0.0
11 1.0 1.9 0.9 0.0 1.9 1.8 0.0 0.8
12 2.0 1.0 1.8 0.9 0.0 1.8 1.8 0.0
PK-5 13.0 15.7 17.0 19.3 18.7 15.5 15.1 14.9
6-8 4.0 3.9 2.8 0.9 3.5 7.8 10.1 9.9
9-12 6.0 3.9 4.7 4.9 3.8 4.5 2.7 3.3
PK-12 23.0 23.5 24.5 25.1 26.0 27.8 27.9 28.1
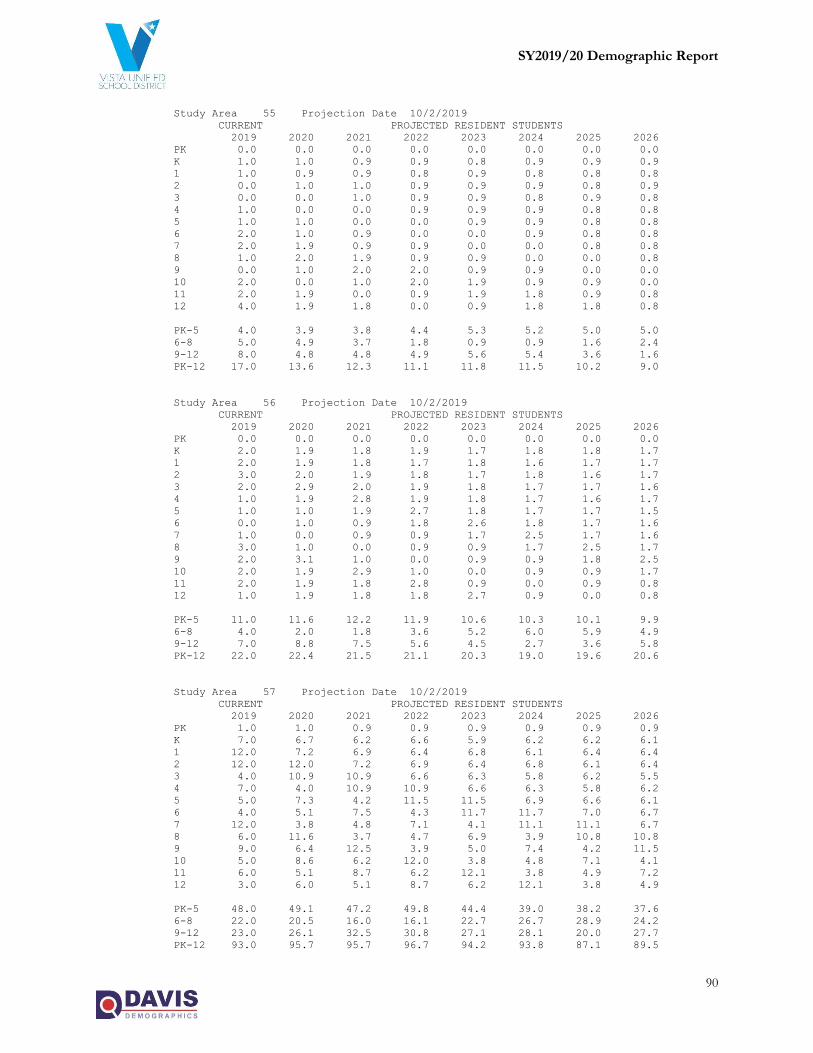
SY2019/20 Demographic Report
90
Study Area 55 Projection Date 10/2/2019
CURRENT PROJECTED RESIDENT STUDENTS
2019 2020 2021 2022 2023 2024 2025 2026
PK 0.0 0.0 0.0 0.0 0.0 0.0 0.0 0.0
K 1.0 1.0 0.9 0.9 0.8 0.9 0.9 0.9
1 1.0 0.9 0.9 0.8 0.9 0.8 0.8 0.8
2 0.0 1.0 1.0 0.9 0.9 0.9 0.8 0.9
3 0.0 0.0 1.0 0.9 0.9 0.8 0.9 0.8
4 1.0 0.0 0.0 0.9 0.9 0.9 0.8 0.8
5 1.0 1.0 0.0 0.0 0.9 0.9 0.8 0.8
6 2.0 1.0 0.9 0.0 0.0 0.9 0.8 0.8
7 2.0 1.9 0.9 0.9 0.0 0.0 0.8 0.8
8 1.0 2.0 1.9 0.9 0.9 0.0 0.0 0.8
9 0.0 1.0 2.0 2.0 0.9 0.9 0.0 0.0
10 2.0 0.0 1.0 2.0 1.9 0.9 0.9 0.0
11 2.0 1.9 0.0 0.9 1.9 1.8 0.9 0.8
12 4.0 1.9 1.8 0.0 0.9 1.8 1.8 0.8
PK-5 4.0 3.9 3.8 4.4 5.3 5.2 5.0 5.0
6-8 5.0 4.9 3.7 1.8 0.9 0.9 1.6 2.4
9-12 8.0 4.8 4.8 4.9 5.6 5.4 3.6 1.6
PK-12 17.0 13.6 12.3 11.1 11.8 11.5 10.2 9.0
Study Area 56 Projection Date 10/2/2019
CURRENT PROJECTED RESIDENT STUDENTS
2019 2020 2021 2022 2023 2024 2025 2026
PK 0.0 0.0 0.0 0.0 0.0 0.0 0.0 0.0
K 2.0 1.9 1.8 1.9 1.7 1.8 1.8 1.7
1 2.0 1.9 1.8 1.7 1.8 1.6 1.7 1.7
2 3.0 2.0 1.9 1.8 1.7 1.8 1.6 1.7
3 2.0 2.9 2.0 1.9 1.8 1.7 1.7 1.6
4 1.0 1.9 2.8 1.9 1.8 1.7 1.6 1.7
5 1.0 1.0 1.9 2.7 1.8 1.7 1.7 1.5
6 0.0 1.0 0.9 1.8 2.6 1.8 1.7 1.6
7 1.0 0.0 0.9 0.9 1.7 2.5 1.7 1.6
8 3.0 1.0 0.0 0.9 0.9 1.7 2.5 1.7
9 2.0 3.1 1.0 0.0 0.9 0.9 1.8 2.5
10 2.0 1.9 2.9 1.0 0.0 0.9 0.9 1.7
11 2.0 1.9 1.8 2.8 0.9 0.0 0.9 0.8
12 1.0 1.9 1.8 1.8 2.7 0.9 0.0 0.8
PK-5 11.0 11.6 12.2 11.9 10.6 10.3 10.1 9.9
6-8 4.0 2.0 1.8 3.6 5.2 6.0 5.9 4.9
9-12 7.0 8.8 7.5 5.6 4.5 2.7 3.6 5.8
PK-12 22.0 22.4 21.5 21.1 20.3 19.0 19.6 20.6
Study Area 57 Projection Date 10/2/2019
CURRENT PROJECTED RESIDENT STUDENTS
2019 2020 2021 2022 2023 2024 2025 2026
PK 1.0 1.0 0.9 0.9 0.9 0.9 0.9 0.9
K 7.0 6.7 6.2 6.6 5.9 6.2 6.2 6.1
1 12.0 7.2 6.9 6.4 6.8 6.1 6.4 6.4
2 12.0 12.0 7.2 6.9 6.4 6.8 6.1 6.4
3 4.0 10.9 10.9 6.6 6.3 5.8 6.2 5.5
4 7.0 4.0 10.9 10.9 6.6 6.3 5.8 6.2
5 5.0 7.3 4.2 11.5 11.5 6.9 6.6 6.1
6 4.0 5.1 7.5 4.3 11.7 11.7 7.0 6.7
7 12.0 3.8 4.8 7.1 4.1 11.1 11.1 6.7
8 6.0 11.6 3.7 4.7 6.9 3.9 10.8 10.8
9 9.0 6.4 12.5 3.9 5.0 7.4 4.2 11.5
10 5.0 8.6 6.2 12.0 3.8 4.8 7.1 4.1
11 6.0 5.1 8.7 6.2 12.1 3.8 4.9 7.2
12 3.0 6.0 5.1 8.7 6.2 12.1 3.8 4.9
PK-5 48.0 49.1 47.2 49.8 44.4 39.0 38.2 37.6
6-8 22.0 20.5 16.0 16.1 22.7 26.7 28.9 24.2
9-12 23.0 26.1 32.5 30.8 27.1 28.1 20.0 27.7
PK-12 93.0 95.7 95.7 96.7 94.2 93.8 87.1 89.5

SY2019/20 Demographic Report
91
Study Area 58 Projection Date 10/2/2019
CURRENT PROJECTED RESIDENT STUDENTS
2019 2020 2021 2022 2023 2024 2025 2026
PK 0.0 0.0 0.0 0.0 0.0 0.0 0.0 0.0
K 6.0 5.7 5.3 5.6 5.1 5.3 5.3 5.2
1 5.0 5.7 5.4 5.1 5.4 4.8 5.1 5.1
2 3.0 5.1 5.8 5.5 5.2 5.5 4.9 5.2
3 7.0 2.9 4.9 5.6 5.3 5.0 5.2 4.7
4 5.0 6.8 2.8 4.7 5.4 5.2 4.8 5.1
5 6.0 4.8 6.5 2.7 4.6 5.2 5.0 4.6
6 3.0 5.8 4.6 6.3 2.6 4.4 5.0 4.8
7 5.0 2.9 5.6 4.5 6.1 2.5 4.2 4.8
8 4.0 5.0 2.9 5.6 4.5 6.1 2.5 4.2
9 8.0 4.1 5.1 3.0 5.7 4.6 6.2 2.5
10 6.0 7.7 3.9 4.9 2.8 5.5 4.4 5.9
11 4.0 5.8 7.4 3.8 4.7 2.7 5.3 4.2
12 2.0 3.8 5.5 7.1 3.6 4.5 2.6 5.0
PK-5 32.0 31.0 30.7 29.2 31.0 31.0 30.3 29.9
6-8 12.0 13.7 13.1 16.4 13.2 13.0 11.7 13.8
9-12 20.0 21.4 21.9 18.8 16.8 17.3 18.5 17.6
PK-12 64.0 66.1 65.7 64.4 61.0 61.3 60.5 61.3
Study Area 59 Projection Date 10/2/2019
CURRENT PROJECTED RESIDENT STUDENTS
2019 2020 2021 2022 2023 2024 2025 2026
PK 0.0 0.0 0.0 0.0 0.0 0.0 0.0 0.0
K 8.0 7.6 7.1 7.5 6.7 7.1 7.1 7.0
1 2.0 8.2 7.9 7.3 7.7 6.9 7.3 7.3
2 1.0 2.0 8.2 7.9 7.3 7.7 6.9 7.3
3 1.0 0.9 1.8 7.5 7.2 6.7 7.0 6.3
4 4.0 1.0 0.9 1.8 7.5 7.2 6.7 7.0
5 1.0 4.2 1.0 1.0 1.9 7.9 7.5 7.0
6 1.0 1.0 4.3 1.1 1.0 1.9 8.0 7.7
7 2.0 0.9 1.0 4.1 1.0 0.9 1.9 7.6
8 6.0 1.9 0.9 0.9 3.9 1.0 0.9 1.8
9 0.0 6.4 2.1 1.0 1.0 4.2 1.1 1.0
10 1.0 0.0 6.2 2.0 0.9 1.0 4.1 1.0
11 2.0 1.0 0.0 6.2 2.0 1.0 1.0 4.1
12 5.0 2.0 1.0 0.0 6.2 2.0 1.0 1.0
PK-5 17.0 23.9 26.9 33.0 38.3 43.5 42.5 41.9
6-8 9.0 3.8 6.2 6.1 5.9 3.8 10.8 17.1
9-12 8.0 9.4 9.3 9.2 10.1 8.2 7.2 7.1
PK-12 34.0 37.1 42.4 48.3 54.3 55.5 60.5 66.1
Study Area 60 Projection Date 10/2/2019
CURRENT PROJECTED RESIDENT STUDENTS
2019 2020 2021 2022 2023 2024 2025 2026
PK 1.0 1.0 0.9 0.9 0.9 0.9 0.9 0.9
K 9.0 8.6 8.0 8.5 7.6 8.0 8.0 7.9
1 3.0 8.6 8.2 7.6 8.0 7.2 7.6 7.6
2 6.0 3.1 8.7 8.3 7.8 8.2 7.3 7.8
3 6.0 5.8 2.9 8.4 8.0 7.5 7.9 7.1
4 5.0 5.8 5.6 2.8 8.1 7.7 7.2 7.6
5 1.0 4.8 5.6 5.4 2.7 7.8 7.4 6.9
6 4.0 1.0 4.6 5.4 5.1 2.6 7.5 7.1
7 6.0 3.9 0.9 4.5 5.2 5.0 2.5 7.3
8 4.0 6.0 3.9 0.9 4.5 5.2 5.0 2.5
9 5.0 4.1 6.1 4.0 0.9 4.6 5.3 5.1
10 6.0 4.8 3.9 5.9 3.8 0.9 4.4 5.1
11 3.0 5.8 4.6 3.8 5.6 3.6 0.9 4.2
12 3.0 2.9 5.5 4.4 3.6 5.4 3.5 0.8
PK-5 31.0 37.7 39.9 41.9 43.1 47.3 46.3 45.8
6-8 14.0 10.9 9.4 10.8 14.8 12.8 15.0 16.9
9-12 17.0 17.6 20.1 18.1 13.9 14.5 14.1 15.2
PK-12 62.0 66.2 69.4 70.8 71.8 74.6 75.4 77.9

SY2019/20 Demographic Report
92
Study Area 61 Projection Date 10/2/2019
CURRENT PROJECTED RESIDENT STUDENTS
2019 2020 2021 2022 2023 2024 2025 2026
PK 0.0 0.0 0.0 0.0 0.0 0.0 0.0 0.0
K 0.0 0.0 0.0 0.0 0.0 0.0 0.0 0.0
1 0.0 0.0 0.0 0.0 0.0 0.0 0.0 0.0
2 0.0 0.0 0.0 0.0 0.0 0.0 0.0 0.0
3 0.0 0.0 0.0 0.0 0.0 0.0 0.0 0.0
4 0.0 0.0 0.0 0.0 0.0 0.0 0.0 0.0
5 0.0 0.0 0.0 0.0 0.0 0.0 0.0 0.0
6 0.0 0.0 0.0 0.0 0.0 0.0 0.0 0.0
7 0.0 0.0 0.0 0.0 0.0 0.0 0.0 0.0
8 0.0 0.0 0.0 0.0 0.0 0.0 0.0 0.0
9 0.0 0.0 0.0 0.0 0.0 0.0 0.0 0.0
10 0.0 0.0 0.0 0.0 0.0 0.0 0.0 0.0
11 0.0 0.0 0.0 0.0 0.0 0.0 0.0 0.0
12 1.0 0.0 0.0 0.0 0.0 0.0 0.0 0.0
PK-5 0.0 0.0 0.0 0.0 0.0 0.0 0.0 0.0
6-8 0.0 0.0 0.0 0.0 0.0 0.0 0.0 0.0
9-12 1.0 0.0 0.0 0.0 0.0 0.0 0.0 0.0
PK-12 1.0 0.0 0.0 0.0 0.0 0.0 0.0 0.0
Study Area 62 Projection Date 10/2/2019
CURRENT PROJECTED RESIDENT STUDENTS
2019 2020 2021 2022 2023 2024 2025 2026
PK 0.0 0.0 0.0 0.0 0.0 0.0 0.0 0.0
K 5.0 4.8 4.5 4.7 4.2 4.5 4.5 4.4
1 8.0 5.2 4.9 4.6 4.8 4.3 4.6 4.6
2 1.0 8.0 5.2 4.9 4.6 4.8 4.3 4.6
3 10.0 0.9 7.3 4.7 4.5 4.2 4.4 3.9
4 5.0 10.0 0.9 7.3 4.7 4.5 4.2 4.4
5 6.0 5.2 10.5 1.0 7.6 4.9 4.7 4.4
6 8.0 6.1 5.4 10.7 1.0 7.8 5.0 4.8
7 10.0 7.6 5.8 5.1 10.2 0.9 7.4 4.8
8 7.0 9.7 7.4 5.6 4.9 9.9 0.9 7.2
9 11.0 7.5 10.4 7.9 6.0 5.3 10.6 1.0
10 3.0 10.6 7.2 10.0 7.6 5.8 5.1 10.1
11 7.0 3.0 10.7 7.3 10.1 7.6 5.9 5.1
12 9.0 7.0 3.0 10.7 7.3 10.1 7.6 5.9
PK-5 35.0 34.1 33.3 27.2 30.4 27.2 26.7 26.3
6-8 25.0 23.4 18.6 21.4 16.1 18.6 13.3 16.8
9-12 30.0 28.1 31.3 35.9 31.0 28.8 29.2 22.1
PK-12 90.0 85.6 83.2 84.5 77.5 74.6 69.2 65.2
Study Area 63 Projection Date 10/2/2019
CURRENT PROJECTED RESIDENT STUDENTS
2019 2020 2021 2022 2023 2024 2025 2026
PK 0.0 0.0 0.0 0.0 0.0 0.0 0.0 0.0
K 2.0 1.9 1.8 1.9 1.7 1.8 1.8 1.7
1 3.0 1.9 1.8 1.7 1.8 1.6 1.7 1.7
2 2.0 3.1 1.9 1.8 1.7 1.8 1.6 1.7
3 4.0 1.9 2.9 1.9 1.8 1.7 1.7 1.6
4 2.0 3.9 1.9 2.8 1.8 1.7 1.6 1.7
5 3.0 1.9 3.7 1.8 2.7 1.7 1.7 1.5
6 5.0 2.9 1.8 3.6 1.7 2.6 1.7 1.6
7 10.0 4.8 2.8 1.8 3.5 1.7 2.5 1.6
8 0.0 10.0 4.8 2.8 1.8 3.5 1.7 2.5
9 6.0 0.0 10.2 4.9 2.8 1.8 3.5 1.7
10 5.0 5.8 0.0 9.8 4.7 2.7 1.8 3.4
11 4.0 4.8 5.5 0.0 9.4 4.6 2.6 1.7
12 6.0 3.8 4.6 5.3 0.0 9.0 4.4 2.5
PK-5 16.0 14.6 14.0 11.9 11.5 10.3 10.1 9.9
6-8 15.0 17.7 9.4 8.2 7.0 7.8 5.9 5.7
9-12 21.0 14.4 20.3 20.0 16.9 18.1 12.3 9.3
PK-12 52.0 46.7 43.7 40.1 35.4 36.2 28.3 24.9
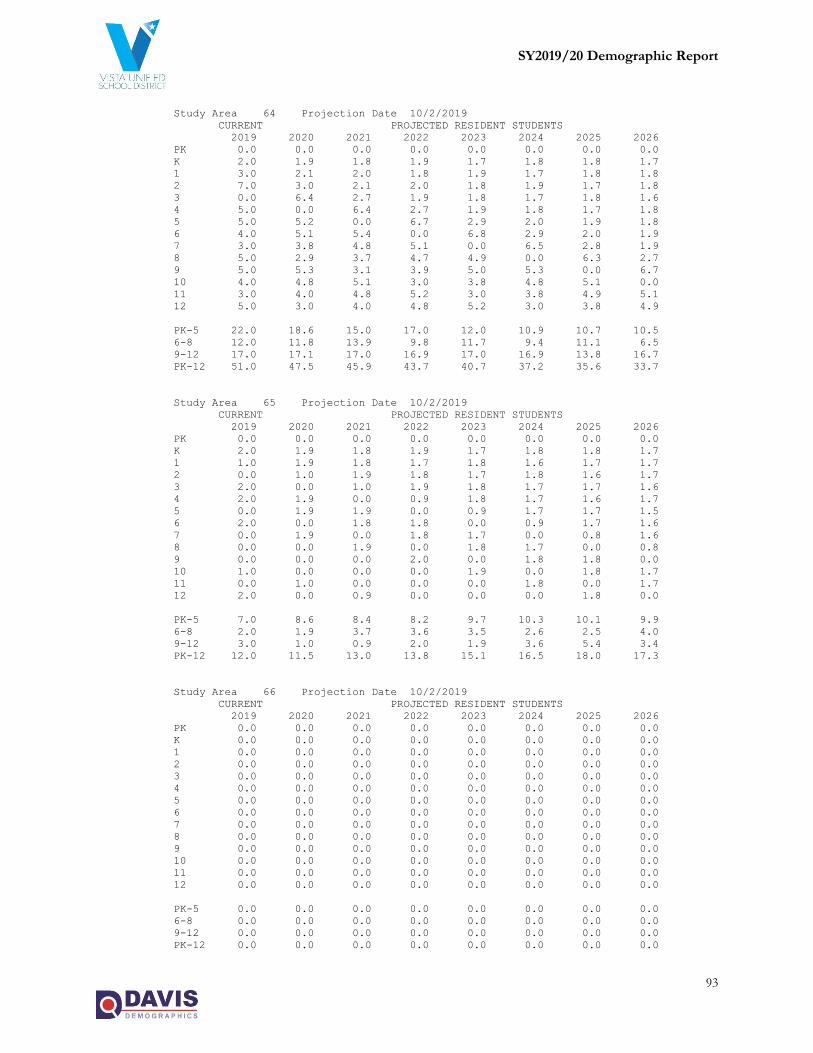
SY2019/20 Demographic Report
93
Study Area 64 Projection Date 10/2/2019
CURRENT PROJECTED RESIDENT STUDENTS
2019 2020 2021 2022 2023 2024 2025 2026
PK 0.0 0.0 0.0 0.0 0.0 0.0 0.0 0.0
K 2.0 1.9 1.8 1.9 1.7 1.8 1.8 1.7
1 3.0 2.1 2.0 1.8 1.9 1.7 1.8 1.8
2 7.0 3.0 2.1 2.0 1.8 1.9 1.7 1.8
3 0.0 6.4 2.7 1.9 1.8 1.7 1.8 1.6
4 5.0 0.0 6.4 2.7 1.9 1.8 1.7 1.8
5 5.0 5.2 0.0 6.7 2.9 2.0 1.9 1.8
6 4.0 5.1 5.4 0.0 6.8 2.9 2.0 1.9
7 3.0 3.8 4.8 5.1 0.0 6.5 2.8 1.9
8 5.0 2.9 3.7 4.7 4.9 0.0 6.3 2.7
9 5.0 5.3 3.1 3.9 5.0 5.3 0.0 6.7
10 4.0 4.8 5.1 3.0 3.8 4.8 5.1 0.0
11 3.0 4.0 4.8 5.2 3.0 3.8 4.9 5.1
12 5.0 3.0 4.0 4.8 5.2 3.0 3.8 4.9
PK-5 22.0 18.6 15.0 17.0 12.0 10.9 10.7 10.5
6-8 12.0 11.8 13.9 9.8 11.7 9.4 11.1 6.5
9-12 17.0 17.1 17.0 16.9 17.0 16.9 13.8 16.7
PK-12 51.0 47.5 45.9 43.7 40.7 37.2 35.6 33.7
Study Area 65 Projection Date 10/2/2019
CURRENT PROJECTED RESIDENT STUDENTS
2019 2020 2021 2022 2023 2024 2025 2026
PK 0.0 0.0 0.0 0.0 0.0 0.0 0.0 0.0
K 2.0 1.9 1.8 1.9 1.7 1.8 1.8 1.7
1 1.0 1.9 1.8 1.7 1.8 1.6 1.7 1.7
2 0.0 1.0 1.9 1.8 1.7 1.8 1.6 1.7
3 2.0 0.0 1.0 1.9 1.8 1.7 1.7 1.6
4 2.0 1.9 0.0 0.9 1.8 1.7 1.6 1.7
5 0.0 1.9 1.9 0.0 0.9 1.7 1.7 1.5
6 2.0 0.0 1.8 1.8 0.0 0.9 1.7 1.6
7 0.0 1.9 0.0 1.8 1.7 0.0 0.8 1.6
8 0.0 0.0 1.9 0.0 1.8 1.7 0.0 0.8
9 0.0 0.0 0.0 2.0 0.0 1.8 1.8 0.0
10 1.0 0.0 0.0 0.0 1.9 0.0 1.8 1.7
11 0.0 1.0 0.0 0.0 0.0 1.8 0.0 1.7
12 2.0 0.0 0.9 0.0 0.0 0.0 1.8 0.0
PK-5 7.0 8.6 8.4 8.2 9.7 10.3 10.1 9.9
6-8 2.0 1.9 3.7 3.6 3.5 2.6 2.5 4.0
9-12 3.0 1.0 0.9 2.0 1.9 3.6 5.4 3.4
PK-12 12.0 11.5 13.0 13.8 15.1 16.5 18.0 17.3
Study Area 66 Projection Date 10/2/2019
CURRENT PROJECTED RESIDENT STUDENTS
2019 2020 2021 2022 2023 2024 2025 2026
PK 0.0 0.0 0.0 0.0 0.0 0.0 0.0 0.0
K 0.0 0.0 0.0 0.0 0.0 0.0 0.0 0.0
1 0.0 0.0 0.0 0.0 0.0 0.0 0.0 0.0
2 0.0 0.0 0.0 0.0 0.0 0.0 0.0 0.0
3 0.0 0.0 0.0 0.0 0.0 0.0 0.0 0.0
4 0.0 0.0 0.0 0.0 0.0 0.0 0.0 0.0
5 0.0 0.0 0.0 0.0 0.0 0.0 0.0 0.0
6 0.0 0.0 0.0 0.0 0.0 0.0 0.0 0.0
7 0.0 0.0 0.0 0.0 0.0 0.0 0.0 0.0
8 0.0 0.0 0.0 0.0 0.0 0.0 0.0 0.0
9 0.0 0.0 0.0 0.0 0.0 0.0 0.0 0.0
10 0.0 0.0 0.0 0.0 0.0 0.0 0.0 0.0
11 0.0 0.0 0.0 0.0 0.0 0.0 0.0 0.0
12 0.0 0.0 0.0 0.0 0.0 0.0 0.0 0.0
PK-5 0.0 0.0 0.0 0.0 0.0 0.0 0.0 0.0
6-8 0.0 0.0 0.0 0.0 0.0 0.0 0.0 0.0
9-12 0.0 0.0 0.0 0.0 0.0 0.0 0.0 0.0
PK-12 0.0 0.0 0.0 0.0 0.0 0.0 0.0 0.0
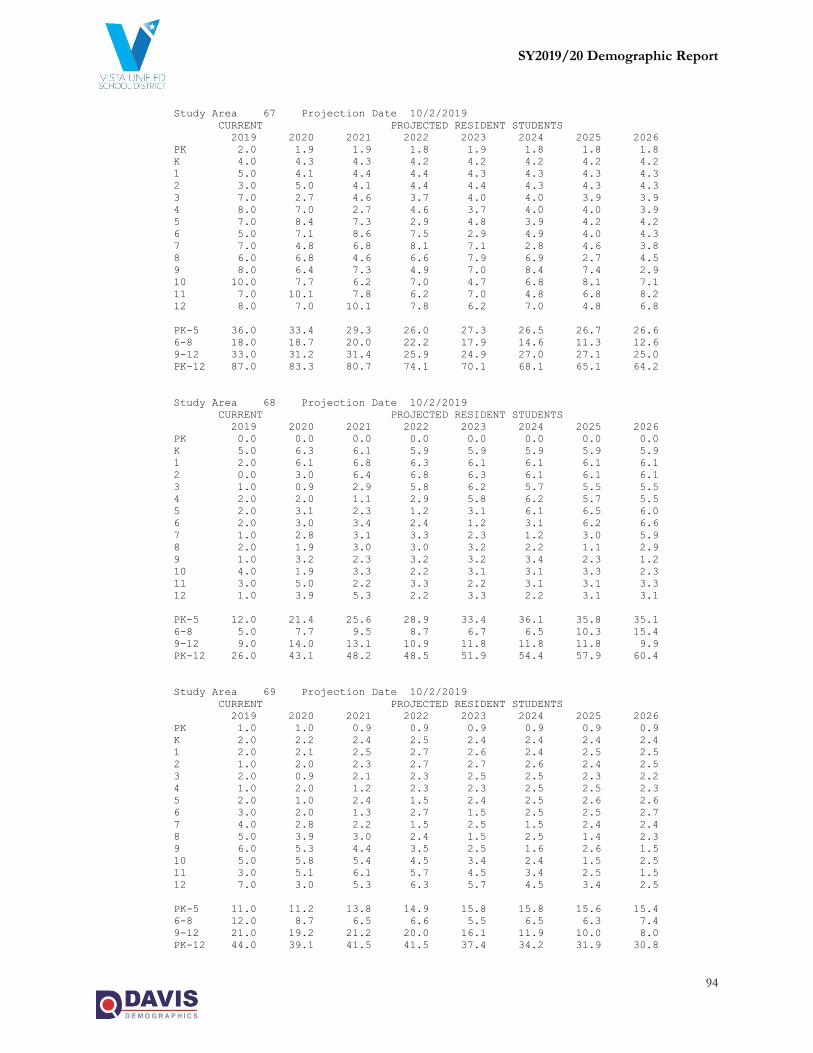
SY2019/20 Demographic Report
94
Study Area 67 Projection Date 10/2/2019
CURRENT PROJECTED RESIDENT STUDENTS
2019 2020 2021 2022 2023 2024 2025 2026
PK 2.0 1.9 1.9 1.8 1.9 1.8 1.8 1.8
K 4.0 4.3 4.3 4.2 4.2 4.2 4.2 4.2
1 5.0 4.1 4.4 4.4 4.3 4.3 4.3 4.3
2 3.0 5.0 4.1 4.4 4.4 4.3 4.3 4.3
3 7.0 2.7 4.6 3.7 4.0 4.0 3.9 3.9
4 8.0 7.0 2.7 4.6 3.7 4.0 4.0 3.9
5 7.0 8.4 7.3 2.9 4.8 3.9 4.2 4.2
6 5.0 7.1 8.6 7.5 2.9 4.9 4.0 4.3
7 7.0 4.8 6.8 8.1 7.1 2.8 4.6 3.8
8 6.0 6.8 4.6 6.6 7.9 6.9 2.7 4.5
9 8.0 6.4 7.3 4.9 7.0 8.4 7.4 2.9
10 10.0 7.7 6.2 7.0 4.7 6.8 8.1 7.1
11 7.0 10.1 7.8 6.2 7.0 4.8 6.8 8.2
12 8.0 7.0 10.1 7.8 6.2 7.0 4.8 6.8
PK-5 36.0 33.4 29.3 26.0 27.3 26.5 26.7 26.6
6-8 18.0 18.7 20.0 22.2 17.9 14.6 11.3 12.6
9-12 33.0 31.2 31.4 25.9 24.9 27.0 27.1 25.0
PK-12 87.0 83.3 80.7 74.1 70.1 68.1 65.1 64.2
Study Area 68 Projection Date 10/2/2019
CURRENT PROJECTED RESIDENT STUDENTS
2019 2020 2021 2022 2023 2024 2025 2026
PK 0.0 0.0 0.0 0.0 0.0 0.0 0.0 0.0
K 5.0 6.3 6.1 5.9 5.9 5.9 5.9 5.9
1 2.0 6.1 6.8 6.3 6.1 6.1 6.1 6.1
2 0.0 3.0 6.4 6.8 6.3 6.1 6.1 6.1
3 1.0 0.9 2.9 5.8 6.2 5.7 5.5 5.5
4 2.0 2.0 1.1 2.9 5.8 6.2 5.7 5.5
5 2.0 3.1 2.3 1.2 3.1 6.1 6.5 6.0
6 2.0 3.0 3.4 2.4 1.2 3.1 6.2 6.6
7 1.0 2.8 3.1 3.3 2.3 1.2 3.0 5.9
8 2.0 1.9 3.0 3.0 3.2 2.2 1.1 2.9
9 1.0 3.2 2.3 3.2 3.2 3.4 2.3 1.2
10 4.0 1.9 3.3 2.2 3.1 3.1 3.3 2.3
11 3.0 5.0 2.2 3.3 2.2 3.1 3.1 3.3
12 1.0 3.9 5.3 2.2 3.3 2.2 3.1 3.1
PK-5 12.0 21.4 25.6 28.9 33.4 36.1 35.8 35.1
6-8 5.0 7.7 9.5 8.7 6.7 6.5 10.3 15.4
9-12 9.0 14.0 13.1 10.9 11.8 11.8 11.8 9.9
PK-12 26.0 43.1 48.2 48.5 51.9 54.4 57.9 60.4
Study Area 69 Projection Date 10/2/2019
CURRENT PROJECTED RESIDENT STUDENTS
2019 2020 2021 2022 2023 2024 2025 2026
PK 1.0 1.0 0.9 0.9 0.9 0.9 0.9 0.9
K 2.0 2.2 2.4 2.5 2.4 2.4 2.4 2.4
1 2.0 2.1 2.5 2.7 2.6 2.4 2.5 2.5
2 1.0 2.0 2.3 2.7 2.7 2.6 2.4 2.5
3 2.0 0.9 2.1 2.3 2.5 2.5 2.3 2.2
4 1.0 2.0 1.2 2.3 2.3 2.5 2.5 2.3
5 2.0 1.0 2.4 1.5 2.4 2.5 2.6 2.6
6 3.0 2.0 1.3 2.7 1.5 2.5 2.5 2.7
7 4.0 2.8 2.2 1.5 2.5 1.5 2.4 2.4
8 5.0 3.9 3.0 2.4 1.5 2.5 1.4 2.3
9 6.0 5.3 4.4 3.5 2.5 1.6 2.6 1.5
10 5.0 5.8 5.4 4.5 3.4 2.4 1.5 2.5
11 3.0 5.1 6.1 5.7 4.5 3.4 2.5 1.5
12 7.0 3.0 5.3 6.3 5.7 4.5 3.4 2.5
PK-5 11.0 11.2 13.8 14.9 15.8 15.8 15.6 15.4
6-8 12.0 8.7 6.5 6.6 5.5 6.5 6.3 7.4
9-12 21.0 19.2 21.2 20.0 16.1 11.9 10.0 8.0
PK-12 44.0 39.1 41.5 41.5 37.4 34.2 31.9 30.8

SY2019/20 Demographic Report
95
Study Area 70 Projection Date 10/2/2019
CURRENT PROJECTED RESIDENT STUDENTS
2019 2020 2021 2022 2023 2024 2025 2026
PK 0.0 0.0 0.0 0.0 0.0 0.0 0.0 0.0
K 0.0 0.0 0.0 0.0 0.0 0.0 0.0 0.0
1 0.0 0.0 0.0 0.0 0.0 0.0 0.0 0.0
2 0.0 0.0 0.0 0.0 0.0 0.0 0.0 0.0
3 0.0 0.0 0.0 0.0 0.0 0.0 0.0 0.0
4 0.0 0.0 0.0 0.0 0.0 0.0 0.0 0.0
5 0.0 0.0 0.0 0.0 0.0 0.0 0.0 0.0
6 2.0 0.0 0.0 0.0 0.0 0.0 0.0 0.0
7 0.0 1.9 0.0 0.0 0.0 0.0 0.0 0.0
8 0.0 0.0 1.8 0.0 0.0 0.0 0.0 0.0
9 0.0 0.0 0.0 2.0 0.0 0.0 0.0 0.0
10 1.0 0.0 0.0 0.0 1.9 0.0 0.0 0.0
11 1.0 1.0 0.0 0.0 0.0 1.9 0.0 0.0
12 0.0 1.0 1.0 0.0 0.0 0.0 1.9 0.0
PK-5 0.0 0.0 0.0 0.0 0.0 0.0 0.0 0.0
6-8 2.0 1.9 1.8 0.0 0.0 0.0 0.0 0.0
9-12 2.0 2.0 1.0 2.0 1.9 1.9 1.9 0.0
PK-12 4.0 3.9 2.8 2.0 1.9 1.9 1.9 0.0
Study Area 71 Projection Date 10/2/2019
CURRENT PROJECTED RESIDENT STUDENTS
2019 2020 2021 2022 2023 2024 2025 2026
PK 1.0 1.0 0.9 0.9 0.9 0.9 0.9 0.9
K 8.0 7.2 6.9 6.9 6.7 6.8 6.8 6.8
1 7.0 8.2 7.4 7.2 7.1 6.9 7.0 7.0
2 7.0 7.0 8.2 7.4 7.2 7.1 6.9 7.0
3 6.0 6.4 6.4 7.5 6.8 6.5 6.4 6.2
4 5.0 6.0 6.4 6.4 7.5 6.8 6.5 6.4
5 6.0 5.2 6.3 6.7 6.7 7.9 7.1 6.8
6 3.0 6.1 5.4 6.4 6.8 6.8 8.0 7.2
7 7.0 2.8 5.8 5.1 6.1 6.5 6.5 7.6
8 6.0 6.8 2.8 5.6 4.9 5.9 6.3 6.3
9 6.0 6.4 7.3 3.0 6.0 5.3 6.3 6.7
10 6.0 5.8 6.2 7.0 2.8 5.8 5.1 6.1
11 1.0 6.1 5.8 6.2 7.0 2.9 5.9 5.1
12 5.0 1.0 6.1 5.8 6.2 7.0 2.9 5.9
PK-5 40.0 41.0 42.5 43.0 42.9 42.9 41.6 41.1
6-8 16.0 15.7 14.0 17.1 17.8 19.2 20.8 21.1
9-12 18.0 19.3 25.4 22.0 22.0 21.0 20.2 23.8
PK-12 74.0 76.0 81.9 82.1 82.7 83.1 82.6 86.0
Study Area 72 Projection Date 10/2/2019
CURRENT PROJECTED RESIDENT STUDENTS
2019 2020 2021 2022 2023 2024 2025 2026
PK 0.0 0.0 0.0 0.0 0.0 0.0 0.0 0.0
K 1.0 1.1 1.1 1.0 1.0 1.1 1.1 1.1
1 0.0 1.0 1.1 1.1 1.1 1.1 1.1 1.1
2 2.0 0.0 1.0 1.1 1.1 1.1 1.1 1.1
3 1.0 1.8 0.0 0.9 1.0 1.0 1.0 1.0
4 0.0 1.0 1.8 0.0 0.9 1.0 1.0 1.0
5 0.0 0.0 1.0 1.9 0.0 1.0 1.1 1.1
6 1.0 0.0 0.0 1.1 1.9 0.0 1.0 1.1
7 0.0 0.9 0.0 0.0 1.0 1.9 0.0 1.0
8 1.0 0.0 0.9 0.0 0.0 1.0 1.8 0.0
9 1.0 1.1 0.0 1.0 0.0 0.0 1.1 1.9
10 3.0 1.0 1.0 0.0 0.9 0.0 0.0 1.0
11 2.0 3.0 1.0 1.0 0.0 1.0 0.0 0.0
12 3.0 2.0 3.0 1.0 1.0 0.0 1.0 0.0
PK-5 4.0 4.9 6.0 6.0 5.1 6.3 6.4 6.4
6-8 2.0 0.9 0.9 1.1 2.9 2.9 2.8 2.1
9-12 9.0 7.1 5.0 3.0 1.9 1.0 2.1 2.9
PK-12 15.0 12.9 11.9 10.1 9.9 10.2 11.3 11.4

SY2019/20 Demographic Report
96
Study Area 73 Projection Date 10/2/2019
CURRENT PROJECTED RESIDENT STUDENTS
2019 2020 2021 2022 2023 2024 2025 2026
PK 3.0 2.9 2.8 2.7 2.8 2.8 2.8 2.8
K 7.0 7.5 7.5 7.3 7.3 7.4 7.4 7.4
1 7.0 7.2 7.8 7.7 7.6 7.6 7.6 7.6
2 6.0 7.0 7.2 7.8 7.7 7.6 7.6 7.6
3 10.0 5.5 6.4 6.6 7.1 7.0 6.9 6.9
4 8.0 10.0 5.5 6.4 6.6 7.1 7.0 6.9
5 8.0 8.4 10.5 5.7 6.7 6.9 7.4 7.4
6 10.0 8.2 8.6 10.7 5.8 6.8 7.0 7.6
7 10.0 9.5 7.8 8.1 10.2 5.6 6.5 6.7
8 5.0 9.7 9.2 7.5 7.9 9.9 5.4 6.3
9 7.0 5.3 10.4 9.9 8.0 8.4 10.6 5.8
10 8.0 6.7 5.1 10.0 9.5 7.7 8.1 10.1
11 7.0 8.1 6.8 5.2 10.1 9.6 7.8 8.2
12 12.0 7.0 8.1 6.8 5.2 10.1 9.6 7.8
PK-5 49.0 48.5 47.7 44.2 45.8 46.4 46.7 46.6
6-8 25.0 27.4 25.6 26.3 23.9 22.3 18.9 20.6
9-12 34.0 27.1 30.4 31.9 32.8 35.8 36.1 31.9
PK-12 108.0 103.0 103.7 102.4 102.5 104.5 101.7 99.1
Study Area 74 Projection Date 10/2/2019
CURRENT PROJECTED RESIDENT STUDENTS
2019 2020 2021 2022 2023 2024 2025 2026
PK 2.0 1.9 1.9 1.8 1.9 1.8 1.8 1.8
K 6.0 6.5 6.4 6.3 6.3 6.3 6.3 6.3
1 6.0 6.2 6.7 6.6 6.5 6.5 6.5 6.5
2 7.0 6.0 6.2 6.7 6.6 6.5 6.5 6.5
3 7.0 6.4 5.5 5.6 6.1 6.0 5.9 5.9
4 8.0 7.0 6.4 5.5 5.6 6.1 6.0 5.9
5 4.0 8.4 7.3 6.7 5.7 5.9 6.4 6.3
6 6.0 4.1 8.6 7.5 6.8 5.8 6.0 6.5
7 2.0 5.7 3.9 8.1 7.1 6.5 5.6 5.7
8 7.0 1.9 5.5 3.8 7.9 6.9 6.3 5.4
9 8.0 7.5 2.1 5.9 4.0 8.4 7.4 6.7
10 5.0 7.7 7.2 2.0 5.7 3.9 8.1 7.1
11 1.0 5.1 7.8 7.3 2.0 5.7 3.9 8.2
12 10.0 1.0 5.1 7.8 7.3 2.0 5.7 3.9
PK-5 40.0 42.4 40.4 39.2 38.7 39.1 39.4 39.2
6-8 15.0 11.7 18.0 19.4 21.8 19.2 17.9 17.6
9-12 24.0 21.3 22.2 23.0 19.0 20.0 25.1 25.9
PK-12 79.0 75.4 80.6 81.6 79.5 78.3 82.4 82.7
Study Area 75 Projection Date 10/2/2019
CURRENT PROJECTED RESIDENT STUDENTS
2019 2020 2021 2022 2023 2024 2025 2026
PK 1.0 1.0 0.9 0.9 0.9 0.9 0.9 0.9
K 6.0 6.8 6.6 6.5 6.5 6.5 6.5 6.5
1 3.0 6.5 7.0 6.8 6.7 6.7 6.7 6.7
2 6.0 3.3 6.5 7.0 6.8 6.7 6.7 6.7
3 8.0 5.7 3.0 5.9 6.3 6.2 6.1 6.1
4 5.0 8.3 5.7 3.0 5.9 6.3 6.2 6.1
5 3.0 5.6 8.7 6.0 3.2 6.2 6.7 6.5
6 3.0 3.4 5.7 8.9 6.1 3.2 6.3 6.8
7 1.0 3.1 3.2 5.4 8.4 5.8 3.1 6.0
8 5.0 1.3 3.0 3.1 5.2 8.2 5.7 3.0
9 6.0 5.7 1.3 3.3 3.3 5.6 8.8 6.1
10 4.0 6.0 5.4 1.3 3.1 3.2 5.4 8.4
11 5.0 4.3 6.1 5.5 1.3 3.2 3.2 5.4
12 5.0 5.3 4.3 6.1 5.5 1.3 3.2 3.2
PK-5 32.0 37.2 38.4 36.1 36.3 39.5 39.8 39.5
6-8 9.0 7.8 11.9 17.4 19.7 17.2 15.1 15.8
9-12 20.0 21.3 17.1 16.2 13.2 13.3 20.6 23.1
PK-12 61.0 66.3 67.4 69.7 69.2 70.0 75.5 78.4

SY2019/20 Demographic Report
97
Study Area 76 Projection Date 10/2/2019
CURRENT PROJECTED RESIDENT STUDENTS
2019 2020 2021 2022 2023 2024 2025 2026
PK 0.0 0.0 0.0 0.0 0.0 0.0 0.0 0.0
K 1.0 1.1 1.1 1.0 1.0 1.1 1.1 1.1
1 5.0 1.0 1.1 1.1 1.1 1.1 1.1 1.1
2 4.0 5.0 1.0 1.1 1.1 1.1 1.1 1.1
3 3.0 3.6 4.6 0.9 1.0 1.0 1.0 1.0
4 2.0 3.0 3.6 4.6 0.9 1.0 1.0 1.0
5 4.0 2.1 3.2 3.8 4.8 1.0 1.1 1.1
6 3.0 4.1 2.1 3.2 3.9 4.9 1.0 1.1
7 2.0 2.8 3.9 2.0 3.1 3.7 4.6 1.0
8 2.0 1.9 2.8 3.8 2.0 3.0 3.6 4.5
9 5.0 2.1 2.1 3.0 4.0 2.1 3.2 3.8
10 1.0 4.8 2.1 2.0 2.8 3.9 2.0 3.0
11 2.0 1.0 4.8 2.1 2.0 2.9 3.9 2.0
12 4.0 2.0 1.0 4.8 2.1 2.0 2.9 3.9
PK-5 19.0 15.8 14.6 12.5 9.9 6.3 6.4 6.4
6-8 7.0 8.8 8.8 9.0 9.0 11.6 9.2 6.6
9-12 12.0 9.9 10.0 11.9 10.9 10.9 12.0 12.7
PK-12 38.0 34.5 33.4 33.4 29.8 28.8 27.6 25.7
Study Area 77 Projection Date 10/2/2019
CURRENT PROJECTED RESIDENT STUDENTS
2019 2020 2021 2022 2023 2024 2025 2026
PK 5.0 4.8 4.7 4.5 4.7 4.6 4.6 4.6
K 9.0 8.6 8.0 8.5 7.6 8.0 8.0 7.9
1 9.0 9.3 8.8 8.3 8.7 7.8 8.3 8.3
2 9.0 9.0 9.3 8.8 8.3 8.7 7.8 8.3
3 5.0 8.2 8.2 8.4 8.0 7.5 7.9 7.1
4 8.0 5.0 8.2 8.2 8.4 8.0 7.5 7.9
5 9.0 8.4 5.2 8.6 8.6 8.9 8.5 7.9
6 13.0 9.2 8.6 5.4 8.8 8.8 9.0 8.6
7 9.0 12.4 8.7 8.1 5.1 8.3 8.3 8.6
8 8.0 8.7 12.0 8.5 7.9 4.9 8.1 8.1
9 10.0 8.6 9.3 12.8 9.1 8.4 5.3 8.6
10 6.0 9.6 8.2 9.0 12.3 8.7 8.1 5.1
11 10.0 6.1 9.7 8.3 9.1 12.4 8.8 8.2
12 6.0 10.0 6.1 9.7 8.3 9.1 12.4 8.8
PK-5 54.0 53.3 52.4 55.3 54.3 53.5 52.6 52.0
6-8 30.0 30.3 29.3 22.0 21.8 22.0 25.4 25.3
9-12 32.0 34.3 33.3 39.8 38.8 38.6 34.6 30.7
PK-12 116.0 117.9 115.0 117.1 114.9 114.1 112.6 108.0
Study Area 78 Projection Date 10/2/2019
CURRENT PROJECTED RESIDENT STUDENTS
2019 2020 2021 2022 2023 2024 2025 2026
PK 0.0 0.0 0.0 0.0 0.0 0.0 0.0 0.0
K 4.0 3.8 3.6 3.8 3.4 3.6 3.6 3.5
1 8.0 4.1 3.9 3.7 3.9 3.5 3.7 3.7
2 10.0 8.0 4.1 3.9 3.7 3.9 3.5 3.7
3 9.0 9.1 7.3 3.7 3.6 3.3 3.5 3.2
4 10.0 9.0 9.1 7.3 3.7 3.6 3.3 3.5
5 7.0 10.5 9.4 9.6 7.6 3.9 3.8 3.5
6 5.0 7.1 10.7 9.6 9.7 7.8 4.0 3.8
7 5.0 4.8 6.8 10.2 9.2 9.3 7.4 3.8
8 4.0 4.8 4.6 6.6 9.9 8.9 9.0 7.2
9 5.0 4.3 5.2 4.9 7.0 10.6 9.5 9.6
10 2.0 4.8 4.1 5.0 4.7 6.8 10.1 9.1
11 6.0 2.0 4.8 4.1 5.0 4.8 6.8 10.2
12 5.0 6.0 2.0 4.8 4.1 5.0 4.8 6.8
PK-5 48.0 44.5 37.4 32.0 25.9 21.8 21.4 21.1
6-8 14.0 16.7 22.1 26.4 28.8 26.0 20.4 14.8
9-12 18.0 17.1 16.1 18.8 20.8 27.2 31.2 35.7
PK-12 80.0 78.3 75.6 77.2 75.5 75.0 73.0 71.6

SY2019/20 Demographic Report
98
Study Area 79 Projection Date 10/2/2019
CURRENT PROJECTED RESIDENT STUDENTS
2019 2020 2021 2022 2023 2024 2025 2026
PK 1.0 1.0 0.9 0.9 0.9 0.9 0.9 0.9
K 9.0 9.8 9.7 9.5 9.5 9.6 9.5 9.5
1 5.0 9.4 10.1 10.0 9.8 9.8 9.9 9.8
2 3.0 5.1 9.4 10.1 10.0 9.8 9.8 9.9
3 4.0 2.9 4.7 8.6 9.2 9.1 8.9 8.9
4 10.0 4.1 2.9 4.7 8.6 9.2 9.1 8.9
5 4.0 10.6 4.3 3.0 4.9 9.0 9.7 9.5
6 3.0 4.2 10.9 4.4 3.1 5.0 9.2 9.9
7 8.0 3.0 4.0 10.3 4.2 2.9 4.8 8.7
8 2.0 7.9 2.9 3.9 10.0 4.1 2.8 4.6
9 5.0 2.3 8.4 3.1 4.2 10.7 4.4 3.0
10 2.0 4.9 2.2 8.1 3.0 4.0 10.3 4.2
11 3.0 2.2 5.0 2.2 8.2 3.0 4.0 10.4
12 3.0 3.1 2.2 5.0 2.2 8.2 3.0 4.0
PK-5 36.0 42.9 42.0 46.8 52.9 57.4 57.8 57.4
6-8 13.0 15.1 17.8 18.6 17.3 12.0 16.8 23.2
9-12 13.0 12.5 17.8 18.4 17.6 25.9 21.7 21.6
PK-12 62.0 70.5 77.6 83.8 87.8 95.3 96.3 102.2
Study Area 80 Projection Date 10/2/2019
CURRENT PROJECTED RESIDENT STUDENTS
2019 2020 2021 2022 2023 2024 2025 2026
PK 1.0 1.0 0.9 0.9 0.9 0.9 0.9 0.9
K 3.0 3.2 3.2 3.1 3.1 3.2 3.2 3.2
1 1.0 3.1 3.3 3.3 3.2 3.2 3.3 3.2
2 2.0 1.0 3.1 3.3 3.3 3.2 3.2 3.3
3 3.0 1.8 0.9 2.8 3.0 3.0 3.0 3.0
4 1.0 3.0 1.8 0.9 2.8 3.0 3.0 3.0
5 2.0 1.0 3.2 1.9 1.0 3.0 3.2 3.2
6 4.0 2.0 1.1 3.2 1.9 1.0 3.0 3.2
7 2.0 3.8 1.9 1.0 3.1 1.9 0.9 2.9
8 7.0 1.9 3.7 1.9 1.0 3.0 1.8 0.9
9 1.0 7.5 2.1 3.9 2.0 1.1 3.2 1.9
10 8.0 1.0 7.2 2.0 3.8 1.9 1.0 3.0
11 2.0 8.1 1.0 7.3 2.0 3.8 2.0 1.0
12 3.0 2.0 8.1 1.0 7.3 2.0 3.8 2.0
PK-5 13.0 14.1 16.4 16.2 17.3 19.5 19.8 19.8
6-8 13.0 7.7 6.7 6.1 6.0 5.9 5.7 7.0
9-12 14.0 18.6 18.4 14.2 15.1 8.8 10.0 7.9
PK-12 40.0 40.4 41.5 36.5 38.4 34.2 35.5 34.7
Study Area 81 Projection Date 10/2/2019
CURRENT PROJECTED RESIDENT STUDENTS
2019 2020 2021 2022 2023 2024 2025 2026
PK 0.0 0.0 0.0 0.0 0.0 0.0 0.0 0.0
K 7.0 7.5 7.5 7.3 7.3 7.4 7.4 7.4
1 8.0 7.2 7.8 7.7 7.6 7.6 7.6 7.6
2 4.0 8.0 7.2 7.8 7.7 7.6 7.6 7.6
3 2.0 3.6 7.3 6.6 7.1 7.0 6.9 6.9
4 2.0 2.0 3.6 7.3 6.6 7.1 7.0 6.9
5 5.0 2.1 2.1 3.8 7.6 6.9 7.4 7.4
6 7.0 5.1 2.1 2.1 3.9 7.8 7.0 7.6
7 7.0 6.7 4.8 2.0 2.0 3.7 7.4 6.7
8 3.0 6.8 6.5 4.7 2.0 2.0 3.6 7.2
9 6.0 3.2 7.3 6.9 5.0 2.1 2.1 3.8
10 5.0 5.8 3.1 7.0 6.6 4.8 2.0 2.0
11 3.0 5.1 5.8 3.1 7.0 6.7 4.9 2.0
12 3.0 3.0 5.1 5.8 3.1 7.0 6.7 4.9
PK-5 28.0 30.4 35.5 40.5 43.9 43.6 43.9 43.8
6-8 17.0 18.6 13.4 8.8 7.9 13.5 18.0 21.5
9-12 17.0 17.1 21.3 22.8 21.7 20.6 15.7 12.7
PK-12 62.0 66.1 70.2 72.1 73.5 77.7 77.6 78.0
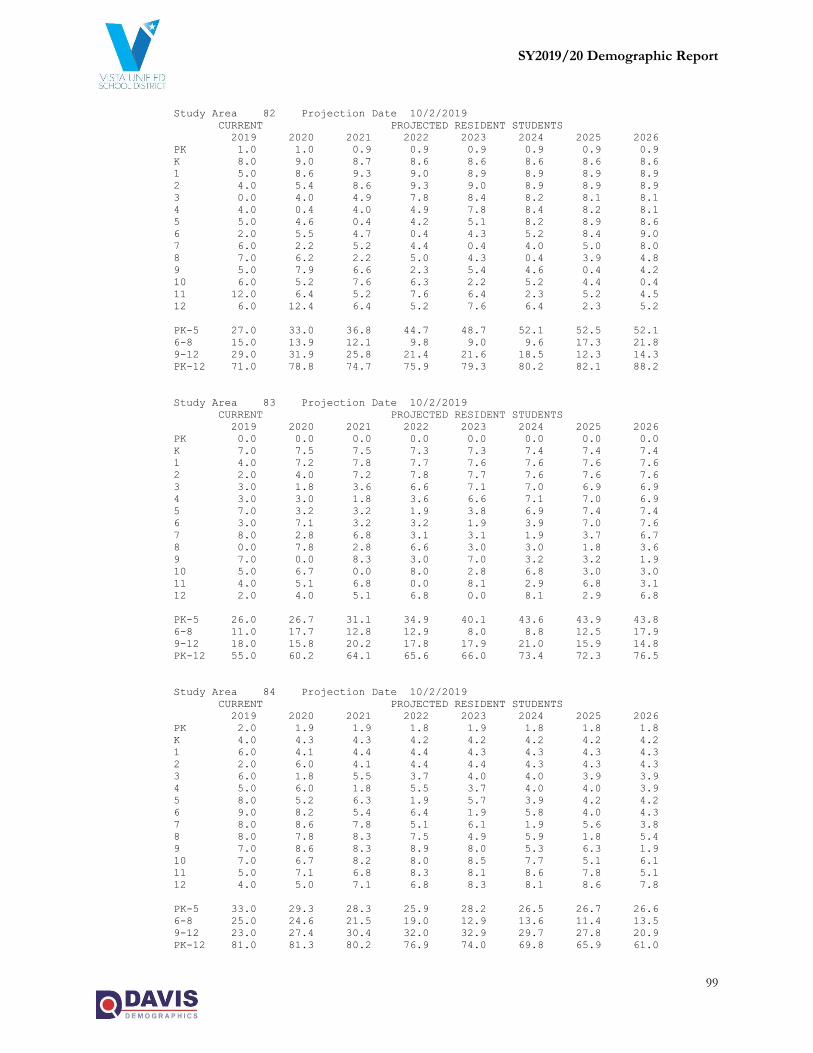
SY2019/20 Demographic Report
99
Study Area 82 Projection Date 10/2/2019
CURRENT PROJECTED RESIDENT STUDENTS
2019 2020 2021 2022 2023 2024 2025 2026
PK 1.0 1.0 0.9 0.9 0.9 0.9 0.9 0.9
K 8.0 9.0 8.7 8.6 8.6 8.6 8.6 8.6
1 5.0 8.6 9.3 9.0 8.9 8.9 8.9 8.9
2 4.0 5.4 8.6 9.3 9.0 8.9 8.9 8.9
3 0.0 4.0 4.9 7.8 8.4 8.2 8.1 8.1
4 4.0 0.4 4.0 4.9 7.8 8.4 8.2 8.1
5 5.0 4.6 0.4 4.2 5.1 8.2 8.9 8.6
6 2.0 5.5 4.7 0.4 4.3 5.2 8.4 9.0
7 6.0 2.2 5.2 4.4 0.4 4.0 5.0 8.0
8 7.0 6.2 2.2 5.0 4.3 0.4 3.9 4.8
9 5.0 7.9 6.6 2.3 5.4 4.6 0.4 4.2
10 6.0 5.2 7.6 6.3 2.2 5.2 4.4 0.4
11 12.0 6.4 5.2 7.6 6.4 2.3 5.2 4.5
12 6.0 12.4 6.4 5.2 7.6 6.4 2.3 5.2
PK-5 27.0 33.0 36.8 44.7 48.7 52.1 52.5 52.1
6-8 15.0 13.9 12.1 9.8 9.0 9.6 17.3 21.8
9-12 29.0 31.9 25.8 21.4 21.6 18.5 12.3 14.3
PK-12 71.0 78.8 74.7 75.9 79.3 80.2 82.1 88.2
Study Area 83 Projection Date 10/2/2019
CURRENT PROJECTED RESIDENT STUDENTS
2019 2020 2021 2022 2023 2024 2025 2026
PK 0.0 0.0 0.0 0.0 0.0 0.0 0.0 0.0
K 7.0 7.5 7.5 7.3 7.3 7.4 7.4 7.4
1 4.0 7.2 7.8 7.7 7.6 7.6 7.6 7.6
2 2.0 4.0 7.2 7.8 7.7 7.6 7.6 7.6
3 3.0 1.8 3.6 6.6 7.1 7.0 6.9 6.9
4 3.0 3.0 1.8 3.6 6.6 7.1 7.0 6.9
5 7.0 3.2 3.2 1.9 3.8 6.9 7.4 7.4
6 3.0 7.1 3.2 3.2 1.9 3.9 7.0 7.6
7 8.0 2.8 6.8 3.1 3.1 1.9 3.7 6.7
8 0.0 7.8 2.8 6.6 3.0 3.0 1.8 3.6
9 7.0 0.0 8.3 3.0 7.0 3.2 3.2 1.9
10 5.0 6.7 0.0 8.0 2.8 6.8 3.0 3.0
11 4.0 5.1 6.8 0.0 8.1 2.9 6.8 3.1
12 2.0 4.0 5.1 6.8 0.0 8.1 2.9 6.8
PK-5 26.0 26.7 31.1 34.9 40.1 43.6 43.9 43.8
6-8 11.0 17.7 12.8 12.9 8.0 8.8 12.5 17.9
9-12 18.0 15.8 20.2 17.8 17.9 21.0 15.9 14.8
PK-12 55.0 60.2 64.1 65.6 66.0 73.4 72.3 76.5
Study Area 84 Projection Date 10/2/2019
CURRENT PROJECTED RESIDENT STUDENTS
2019 2020 2021 2022 2023 2024 2025 2026
PK 2.0 1.9 1.9 1.8 1.9 1.8 1.8 1.8
K 4.0 4.3 4.3 4.2 4.2 4.2 4.2 4.2
1 6.0 4.1 4.4 4.4 4.3 4.3 4.3 4.3
2 2.0 6.0 4.1 4.4 4.4 4.3 4.3 4.3
3 6.0 1.8 5.5 3.7 4.0 4.0 3.9 3.9
4 5.0 6.0 1.8 5.5 3.7 4.0 4.0 3.9
5 8.0 5.2 6.3 1.9 5.7 3.9 4.2 4.2
6 9.0 8.2 5.4 6.4 1.9 5.8 4.0 4.3
7 8.0 8.6 7.8 5.1 6.1 1.9 5.6 3.8
8 8.0 7.8 8.3 7.5 4.9 5.9 1.8 5.4
9 7.0 8.6 8.3 8.9 8.0 5.3 6.3 1.9
10 7.0 6.7 8.2 8.0 8.5 7.7 5.1 6.1
11 5.0 7.1 6.8 8.3 8.1 8.6 7.8 5.1
12 4.0 5.0 7.1 6.8 8.3 8.1 8.6 7.8
PK-5 33.0 29.3 28.3 25.9 28.2 26.5 26.7 26.6
6-8 25.0 24.6 21.5 19.0 12.9 13.6 11.4 13.5
9-12 23.0 27.4 30.4 32.0 32.9 29.7 27.8 20.9
PK-12 81.0 81.3 80.2 76.9 74.0 69.8 65.9 61.0
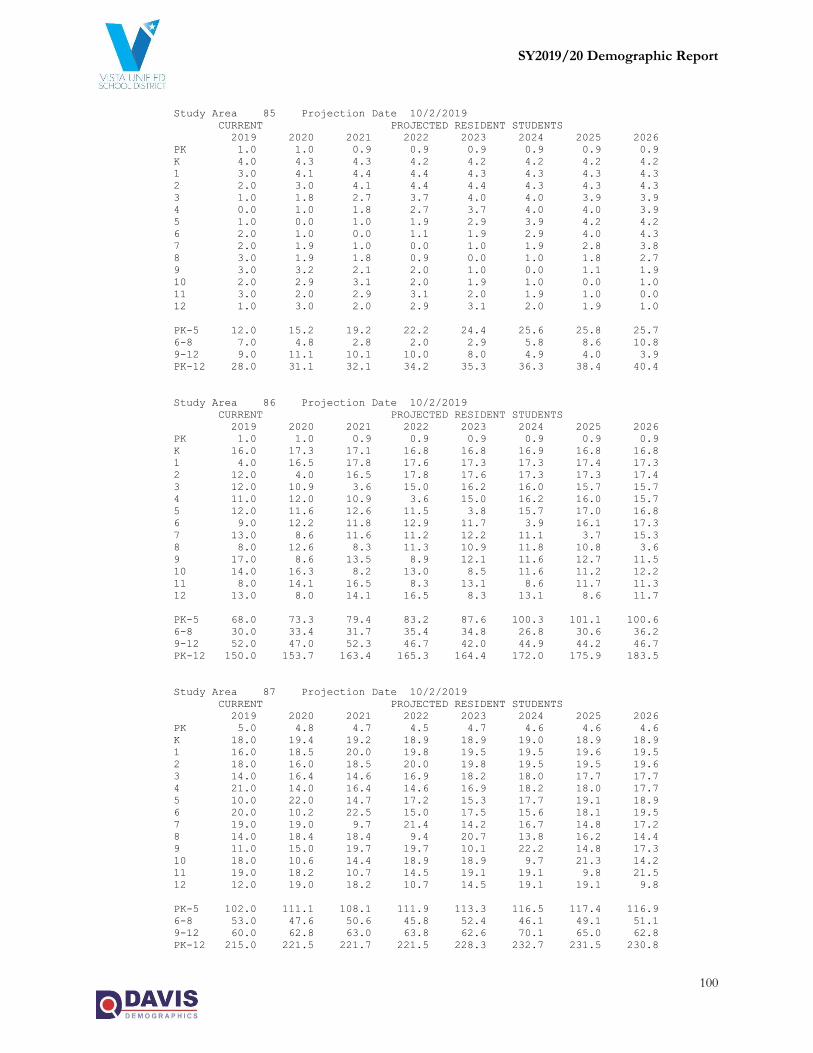
SY2019/20 Demographic Report
100
Study Area 85 Projection Date 10/2/2019
CURRENT PROJECTED RESIDENT STUDENTS
2019 2020 2021 2022 2023 2024 2025 2026
PK 1.0 1.0 0.9 0.9 0.9 0.9 0.9 0.9
K 4.0 4.3 4.3 4.2 4.2 4.2 4.2 4.2
1 3.0 4.1 4.4 4.4 4.3 4.3 4.3 4.3
2 2.0 3.0 4.1 4.4 4.4 4.3 4.3 4.3
3 1.0 1.8 2.7 3.7 4.0 4.0 3.9 3.9
4 0.0 1.0 1.8 2.7 3.7 4.0 4.0 3.9
5 1.0 0.0 1.0 1.9 2.9 3.9 4.2 4.2
6 2.0 1.0 0.0 1.1 1.9 2.9 4.0 4.3
7 2.0 1.9 1.0 0.0 1.0 1.9 2.8 3.8
8 3.0 1.9 1.8 0.9 0.0 1.0 1.8 2.7
9 3.0 3.2 2.1 2.0 1.0 0.0 1.1 1.9
10 2.0 2.9 3.1 2.0 1.9 1.0 0.0 1.0
11 3.0 2.0 2.9 3.1 2.0 1.9 1.0 0.0
12 1.0 3.0 2.0 2.9 3.1 2.0 1.9 1.0
PK-5 12.0 15.2 19.2 22.2 24.4 25.6 25.8 25.7
6-8 7.0 4.8 2.8 2.0 2.9 5.8 8.6 10.8
9-12 9.0 11.1 10.1 10.0 8.0 4.9 4.0 3.9
PK-12 28.0 31.1 32.1 34.2 35.3 36.3 38.4 40.4
Study Area 86 Projection Date 10/2/2019
CURRENT PROJECTED RESIDENT STUDENTS
2019 2020 2021 2022 2023 2024 2025 2026
PK 1.0 1.0 0.9 0.9 0.9 0.9 0.9 0.9
K 16.0 17.3 17.1 16.8 16.8 16.9 16.8 16.8
1 4.0 16.5 17.8 17.6 17.3 17.3 17.4 17.3
2 12.0 4.0 16.5 17.8 17.6 17.3 17.3 17.4
3 12.0 10.9 3.6 15.0 16.2 16.0 15.7 15.7
4 11.0 12.0 10.9 3.6 15.0 16.2 16.0 15.7
5 12.0 11.6 12.6 11.5 3.8 15.7 17.0 16.8
6 9.0 12.2 11.8 12.9 11.7 3.9 16.1 17.3
7 13.0 8.6 11.6 11.2 12.2 11.1 3.7 15.3
8 8.0 12.6 8.3 11.3 10.9 11.8 10.8 3.6
9 17.0 8.6 13.5 8.9 12.1 11.6 12.7 11.5
10 14.0 16.3 8.2 13.0 8.5 11.6 11.2 12.2
11 8.0 14.1 16.5 8.3 13.1 8.6 11.7 11.3
12 13.0 8.0 14.1 16.5 8.3 13.1 8.6 11.7
PK-5 68.0 73.3 79.4 83.2 87.6 100.3 101.1 100.6
6-8 30.0 33.4 31.7 35.4 34.8 26.8 30.6 36.2
9-12 52.0 47.0 52.3 46.7 42.0 44.9 44.2 46.7
PK-12 150.0 153.7 163.4 165.3 164.4 172.0 175.9 183.5
Study Area 87 Projection Date 10/2/2019
CURRENT PROJECTED RESIDENT STUDENTS
2019 2020 2021 2022 2023 2024 2025 2026
PK 5.0 4.8 4.7 4.5 4.7 4.6 4.6 4.6
K 18.0 19.4 19.2 18.9 18.9 19.0 18.9 18.9
1 16.0 18.5 20.0 19.8 19.5 19.5 19.6 19.5
2 18.0 16.0 18.5 20.0 19.8 19.5 19.5 19.6
3 14.0 16.4 14.6 16.9 18.2 18.0 17.7 17.7
4 21.0 14.0 16.4 14.6 16.9 18.2 18.0 17.7
5 10.0 22.0 14.7 17.2 15.3 17.7 19.1 18.9
6 20.0 10.2 22.5 15.0 17.5 15.6 18.1 19.5
7 19.0 19.0 9.7 21.4 14.2 16.7 14.8 17.2
8 14.0 18.4 18.4 9.4 20.7 13.8 16.2 14.4
9 11.0 15.0 19.7 19.7 10.1 22.2 14.8 17.3
10 18.0 10.6 14.4 18.9 18.9 9.7 21.3 14.2
11 19.0 18.2 10.7 14.5 19.1 19.1 9.8 21.5
12 12.0 19.0 18.2 10.7 14.5 19.1 19.1 9.8
PK-5 102.0 111.1 108.1 111.9 113.3 116.5 117.4 116.9
6-8 53.0 47.6 50.6 45.8 52.4 46.1 49.1 51.1
9-12 60.0 62.8 63.0 63.8 62.6 70.1 65.0 62.8
PK-12 215.0 221.5 221.7 221.5 228.3 232.7 231.5 230.8
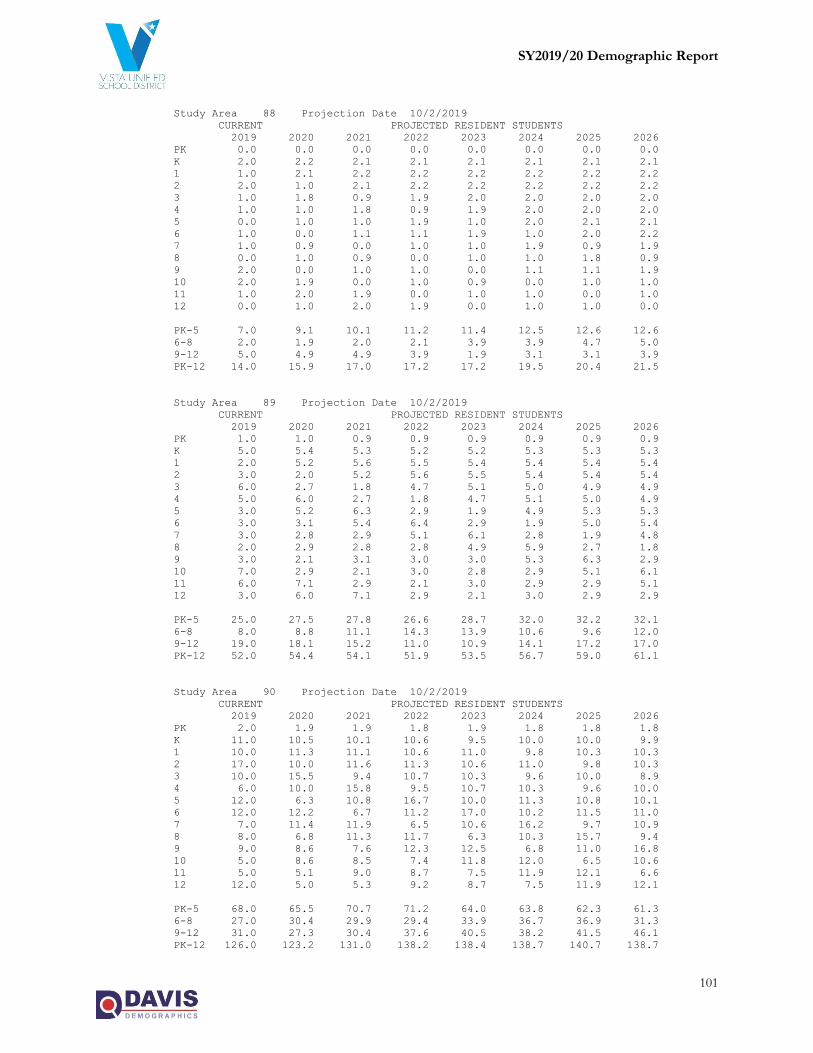
SY2019/20 Demographic Report
101
Study Area 88 Projection Date 10/2/2019
CURRENT PROJECTED RESIDENT STUDENTS
2019 2020 2021 2022 2023 2024 2025 2026
PK 0.0 0.0 0.0 0.0 0.0 0.0 0.0 0.0
K 2.0 2.2 2.1 2.1 2.1 2.1 2.1 2.1
1 1.0 2.1 2.2 2.2 2.2 2.2 2.2 2.2
2 2.0 1.0 2.1 2.2 2.2 2.2 2.2 2.2
3 1.0 1.8 0.9 1.9 2.0 2.0 2.0 2.0
4 1.0 1.0 1.8 0.9 1.9 2.0 2.0 2.0
5 0.0 1.0 1.0 1.9 1.0 2.0 2.1 2.1
6 1.0 0.0 1.1 1.1 1.9 1.0 2.0 2.2
7 1.0 0.9 0.0 1.0 1.0 1.9 0.9 1.9
8 0.0 1.0 0.9 0.0 1.0 1.0 1.8 0.9
9 2.0 0.0 1.0 1.0 0.0 1.1 1.1 1.9
10 2.0 1.9 0.0 1.0 0.9 0.0 1.0 1.0
11 1.0 2.0 1.9 0.0 1.0 1.0 0.0 1.0
12 0.0 1.0 2.0 1.9 0.0 1.0 1.0 0.0
PK-5 7.0 9.1 10.1 11.2 11.4 12.5 12.6 12.6
6-8 2.0 1.9 2.0 2.1 3.9 3.9 4.7 5.0
9-12 5.0 4.9 4.9 3.9 1.9 3.1 3.1 3.9
PK-12 14.0 15.9 17.0 17.2 17.2 19.5 20.4 21.5
Study Area 89 Projection Date 10/2/2019
CURRENT PROJECTED RESIDENT STUDENTS
2019 2020 2021 2022 2023 2024 2025 2026
PK 1.0 1.0 0.9 0.9 0.9 0.9 0.9 0.9
K 5.0 5.4 5.3 5.2 5.2 5.3 5.3 5.3
1 2.0 5.2 5.6 5.5 5.4 5.4 5.4 5.4
2 3.0 2.0 5.2 5.6 5.5 5.4 5.4 5.4
3 6.0 2.7 1.8 4.7 5.1 5.0 4.9 4.9
4 5.0 6.0 2.7 1.8 4.7 5.1 5.0 4.9
5 3.0 5.2 6.3 2.9 1.9 4.9 5.3 5.3
6 3.0 3.1 5.4 6.4 2.9 1.9 5.0 5.4
7 3.0 2.8 2.9 5.1 6.1 2.8 1.9 4.8
8 2.0 2.9 2.8 2.8 4.9 5.9 2.7 1.8
9 3.0 2.1 3.1 3.0 3.0 5.3 6.3 2.9
10 7.0 2.9 2.1 3.0 2.8 2.9 5.1 6.1
11 6.0 7.1 2.9 2.1 3.0 2.9 2.9 5.1
12 3.0 6.0 7.1 2.9 2.1 3.0 2.9 2.9
PK-5 25.0 27.5 27.8 26.6 28.7 32.0 32.2 32.1
6-8 8.0 8.8 11.1 14.3 13.9 10.6 9.6 12.0
9-12 19.0 18.1 15.2 11.0 10.9 14.1 17.2 17.0
PK-12 52.0 54.4 54.1 51.9 53.5 56.7 59.0 61.1
Study Area 90 Projection Date 10/2/2019
CURRENT PROJECTED RESIDENT STUDENTS
2019 2020 2021 2022 2023 2024 2025 2026
PK 2.0 1.9 1.9 1.8 1.9 1.8 1.8 1.8
K 11.0 10.5 10.1 10.6 9.5 10.0 10.0 9.9
1 10.0 11.3 11.1 10.6 11.0 9.8 10.3 10.3
2 17.0 10.0 11.6 11.3 10.6 11.0 9.8 10.3
3 10.0 15.5 9.4 10.7 10.3 9.6 10.0 8.9
4 6.0 10.0 15.8 9.5 10.7 10.3 9.6 10.0
5 12.0 6.3 10.8 16.7 10.0 11.3 10.8 10.1
6 12.0 12.2 6.7 11.2 17.0 10.2 11.5 11.0
7 7.0 11.4 11.9 6.5 10.6 16.2 9.7 10.9
8 8.0 6.8 11.3 11.7 6.3 10.3 15.7 9.4
9 9.0 8.6 7.6 12.3 12.5 6.8 11.0 16.8
10 5.0 8.6 8.5 7.4 11.8 12.0 6.5 10.6
11 5.0 5.1 9.0 8.7 7.5 11.9 12.1 6.6
12 12.0 5.0 5.3 9.2 8.7 7.5 11.9 12.1
PK-5 68.0 65.5 70.7 71.2 64.0 63.8 62.3 61.3
6-8 27.0 30.4 29.9 29.4 33.9 36.7 36.9 31.3
9-12 31.0 27.3 30.4 37.6 40.5 38.2 41.5 46.1
PK-12 126.0 123.2 131.0 138.2 138.4 138.7 140.7 138.7

SY2019/20 Demographic Report
102
Study Area 91 Projection Date 10/2/2019
CURRENT PROJECTED RESIDENT STUDENTS
2019 2020 2021 2022 2023 2024 2025 2026
PK 1.0 1.0 0.9 0.9 0.9 0.9 0.9 0.9
K 4.0 3.6 3.5 3.4 3.3 3.4 3.4 3.4
1 5.0 4.1 3.7 3.6 3.5 3.4 3.5 3.5
2 12.0 5.0 4.1 3.7 3.6 3.5 3.4 3.5
3 2.0 10.9 4.6 3.7 3.4 3.3 3.2 3.1
4 5.0 2.0 10.9 4.6 3.7 3.4 3.3 3.2
5 2.0 5.2 2.1 11.5 4.8 3.9 3.6 3.4
6 8.0 2.0 5.4 2.1 11.7 4.9 4.0 3.6
7 4.0 7.6 1.9 5.1 2.0 11.1 4.6 3.8
8 4.0 3.9 7.4 1.9 4.9 2.0 10.8 4.5
9 8.0 4.3 4.2 7.9 2.0 5.3 2.1 11.5
10 8.0 7.7 4.1 4.0 7.6 1.9 5.1 2.0
11 9.0 8.1 7.8 4.1 4.0 7.6 2.0 5.1
12 6.0 9.0 8.1 7.8 4.1 4.0 7.6 2.0
PK-5 31.0 31.8 29.8 31.4 23.2 21.8 21.3 21.0
6-8 16.0 13.5 14.7 9.1 18.6 18.0 19.4 11.9
9-12 31.0 29.1 24.2 23.8 17.7 18.8 16.8 20.6
PK-12 78.0 74.4 68.7 64.3 59.5 58.6 57.5 53.5
Study Area 92 Projection Date 10/2/2019
CURRENT PROJECTED RESIDENT STUDENTS
2019 2020 2021 2022 2023 2024 2025 2026
PK 0.0 0.0 0.0 0.0 0.0 0.0 0.0 0.0
K 0.0 0.0 0.0 0.0 0.0 0.0 0.0 0.0
1 0.0 0.0 0.0 0.0 0.0 0.0 0.0 0.0
2 0.0 0.0 0.0 0.0 0.0 0.0 0.0 0.0
3 0.0 0.0 0.0 0.0 0.0 0.0 0.0 0.0
4 0.0 0.0 0.0 0.0 0.0 0.0 0.0 0.0
5 0.0 0.0 0.0 0.0 0.0 0.0 0.0 0.0
6 0.0 0.0 0.0 0.0 0.0 0.0 0.0 0.0
7 0.0 0.0 0.0 0.0 0.0 0.0 0.0 0.0
8 0.0 0.0 0.0 0.0 0.0 0.0 0.0 0.0
9 0.0 0.0 0.0 0.0 0.0 0.0 0.0 0.0
10 1.0 0.0 0.0 0.0 0.0 0.0 0.0 0.0
11 0.0 1.0 0.0 0.0 0.0 0.0 0.0 0.0
12 0.0 0.0 1.0 0.0 0.0 0.0 0.0 0.0
PK-5 0.0 0.0 0.0 0.0 0.0 0.0 0.0 0.0
6-8 0.0 0.0 0.0 0.0 0.0 0.0 0.0 0.0
9-12 1.0 1.0 1.0 0.0 0.0 0.0 0.0 0.0
PK-12 1.0 1.0 1.0 0.0 0.0 0.0 0.0 0.0
Study Area 93 Projection Date 10/2/2019
CURRENT PROJECTED RESIDENT STUDENTS
2019 2020 2021 2022 2023 2024 2025 2026
PK 1.0 1.0 0.9 0.9 0.9 0.9 0.9 0.9
K 2.0 2.2 2.1 2.1 2.1 2.1 2.1 2.1
1 1.0 2.1 2.2 2.2 2.2 2.2 2.2 2.2
2 0.0 1.0 2.1 2.2 2.2 2.2 2.2 2.2
3 3.0 0.0 0.9 1.9 2.0 2.0 2.0 2.0
4 0.0 3.0 0.0 0.9 1.9 2.0 2.0 2.0
5 0.0 0.0 3.2 0.0 1.0 2.0 2.1 2.1
6 0.0 0.0 0.0 3.2 0.0 1.0 2.0 2.2
7 1.0 0.0 0.0 0.0 3.1 0.0 0.9 1.9
8 1.0 1.0 0.0 0.0 0.0 3.0 0.0 0.9
9 2.0 1.1 1.0 0.0 0.0 0.0 3.2 0.0
10 4.0 1.9 1.0 1.0 0.0 0.0 0.0 3.0
11 3.0 4.0 1.9 1.0 1.0 0.0 0.0 0.0
12 1.0 3.0 4.0 1.9 1.0 1.0 0.0 0.0
PK-5 7.0 9.3 11.4 10.2 12.3 13.4 13.5 13.5
6-8 2.0 1.0 0.0 3.2 3.1 4.0 2.9 5.0
9-12 10.0 10.0 7.9 3.9 2.0 1.0 3.2 3.0
PK-12 19.0 20.3 19.3 17.3 17.4 18.4 19.6 21.5

SY2019/20 Demographic Report
103
Study Area 94 Projection Date 10/2/2019
CURRENT PROJECTED RESIDENT STUDENTS
2019 2020 2021 2022 2023 2024 2025 2026
PK 0.0 0.0 0.0 0.0 0.0 0.0 0.0 0.0
K 0.0 0.0 0.0 0.0 0.0 0.0 0.0 0.0
1 0.0 0.0 0.0 0.0 0.0 0.0 0.0 0.0
2 0.0 0.0 0.0 0.0 0.0 0.0 0.0 0.0
3 0.0 0.0 0.0 0.0 0.0 0.0 0.0 0.0
4 0.0 0.0 0.0 0.0 0.0 0.0 0.0 0.0
5 0.0 0.0 0.0 0.0 0.0 0.0 0.0 0.0
6 0.0 0.0 0.0 0.0 0.0 0.0 0.0 0.0
7 0.0 0.0 0.0 0.0 0.0 0.0 0.0 0.0
8 0.0 0.0 0.0 0.0 0.0 0.0 0.0 0.0
9 0.0 0.0 0.0 0.0 0.0 0.0 0.0 0.0
10 0.0 0.0 0.0 0.0 0.0 0.0 0.0 0.0
11 0.0 0.0 0.0 0.0 0.0 0.0 0.0 0.0
12 0.0 0.0 0.0 0.0 0.0 0.0 0.0 0.0
PK-5 0.0 0.0 0.0 0.0 0.0 0.0 0.0 0.0
6-8 0.0 0.0 0.0 0.0 0.0 0.0 0.0 0.0
9-12 0.0 0.0 0.0 0.0 0.0 0.0 0.0 0.0
PK-12 0.0 0.0 0.0 0.0 0.0 0.0 0.0 0.0
Study Area 95 Projection Date 10/2/2019
CURRENT PROJECTED RESIDENT STUDENTS
2019 2020 2021 2022 2023 2024 2025 2026
PK 0.0 0.0 0.0 0.0 0.0 0.0 0.0 0.0
K 0.0 0.0 0.0 0.0 0.0 0.0 0.0 0.0
1 0.0 0.0 0.0 0.0 0.0 0.0 0.0 0.0
2 0.0 0.0 0.0 0.0 0.0 0.0 0.0 0.0
3 0.0 0.0 0.0 0.0 0.0 0.0 0.0 0.0
4 0.0 0.0 0.0 0.0 0.0 0.0 0.0 0.0
5 0.0 0.0 0.0 0.0 0.0 0.0 0.0 0.0
6 0.0 0.0 0.0 0.0 0.0 0.0 0.0 0.0
7 0.0 0.0 0.0 0.0 0.0 0.0 0.0 0.0
8 0.0 0.0 0.0 0.0 0.0 0.0 0.0 0.0
9 0.0 0.0 0.0 0.0 0.0 0.0 0.0 0.0
10 0.0 0.0 0.0 0.0 0.0 0.0 0.0 0.0
11 0.0 0.0 0.0 0.0 0.0 0.0 0.0 0.0
12 0.0 0.0 0.0 0.0 0.0 0.0 0.0 0.0
PK-5 0.0 0.0 0.0 0.0 0.0 0.0 0.0 0.0
6-8 0.0 0.0 0.0 0.0 0.0 0.0 0.0 0.0
9-12 0.0 0.0 0.0 0.0 0.0 0.0 0.0 0.0
PK-12 0.0 0.0 0.0 0.0 0.0 0.0 0.0 0.0
Study Area 96 Projection Date 10/2/2019
CURRENT PROJECTED RESIDENT STUDENTS
2019 2020 2021 2022 2023 2024 2025 2026
PK 0.0 0.0 0.0 0.0 0.0 0.0 0.0 0.0
K 2.0 2.2 2.1 2.1 2.1 2.1 2.1 2.1
1 1.0 2.1 2.2 2.2 2.2 2.2 2.2 2.2
2 2.0 1.0 2.1 2.2 2.2 2.2 2.2 2.2
3 2.0 1.8 0.9 1.9 2.0 2.0 2.0 2.0
4 0.0 2.0 1.8 0.9 1.9 2.0 2.0 2.0
5 0.0 0.0 2.1 1.9 1.0 2.0 2.1 2.1
6 4.0 0.0 0.0 2.1 1.9 1.0 2.0 2.2
7 1.0 3.8 0.0 0.0 2.0 1.9 0.9 1.9
8 4.0 1.0 3.7 0.0 0.0 2.0 1.8 0.9
9 0.0 4.3 1.0 3.9 0.0 0.0 2.1 1.9
10 2.0 0.0 4.1 1.0 3.8 0.0 0.0 2.0
11 1.0 2.0 0.0 4.1 1.0 3.8 0.0 0.0
12 1.0 1.0 2.0 0.0 4.1 1.0 3.8 0.0
PK-5 7.0 9.1 11.2 11.2 11.4 12.5 12.6 12.6
6-8 9.0 4.8 3.7 2.1 3.9 4.9 4.7 5.0
9-12 4.0 7.3 7.1 9.0 8.9 4.8 5.9 3.9
PK-12 20.0 21.2 22.0 22.3 24.2 22.2 23.2 21.5

SY2019/20 Demographic Report
104
Study Area 97 Projection Date 10/2/2019
CURRENT PROJECTED RESIDENT STUDENTS
2019 2020 2021 2022 2023 2024 2025 2026
PK 0.0 0.0 0.0 0.0 0.0 0.0 0.0 0.0
K 0.0 0.0 0.0 0.0 0.0 0.0 0.0 0.0
1 1.0 0.0 0.0 0.0 0.0 0.0 0.0 0.0
2 0.0 1.0 0.0 0.0 0.0 0.0 0.0 0.0
3 1.0 0.0 1.0 0.0 0.0 0.0 0.0 0.0
4 0.0 1.0 0.0 0.9 0.0 0.0 0.0 0.0
5 0.0 0.0 0.9 0.0 0.9 0.0 0.0 0.0
6 0.0 0.0 0.0 0.9 0.0 0.9 0.0 0.0
7 1.0 0.0 0.0 0.0 0.9 0.0 0.8 0.0
8 1.0 1.0 0.0 0.0 0.0 0.9 0.0 0.8
9 0.0 1.0 1.0 0.0 0.0 0.0 0.9 0.0
10 0.0 0.0 1.0 1.0 0.0 0.0 0.0 0.8
11 0.0 0.0 0.0 0.9 0.9 0.0 0.0 0.0
12 0.0 0.0 0.0 0.0 0.9 0.9 0.0 0.0
PK-5 2.0 2.0 1.9 0.9 0.9 0.0 0.0 0.0
6-8 2.0 1.0 0.0 0.9 0.9 1.8 0.8 0.8
9-12 0.0 1.0 2.0 1.9 1.8 0.9 0.9 0.8
PK-12 4.0 4.0 3.9 3.7 3.6 2.7 1.7 1.6
Study Area 98 Projection Date 10/2/2019
CURRENT PROJECTED RESIDENT STUDENTS
2019 2020 2021 2022 2023 2024 2025 2026
PK 0.0 0.0 0.0 0.0 0.0 0.0 0.0 0.0
K 1.0 1.1 1.1 1.0 1.0 1.1 1.1 1.1
1 1.0 1.0 1.1 1.1 1.1 1.1 1.1 1.1
2 3.0 1.0 1.0 1.1 1.1 1.1 1.1 1.1
3 2.0 2.7 0.9 0.9 1.0 1.0 1.0 1.0
4 5.0 2.0 2.7 0.9 0.9 1.0 1.0 1.0
5 1.0 5.2 2.1 2.9 1.0 1.0 1.1 1.1
6 2.0 1.0 5.4 2.1 2.9 1.0 1.0 1.1
7 5.0 1.9 1.0 5.1 2.0 2.8 0.9 1.0
8 3.0 4.8 1.8 0.9 4.9 2.0 2.7 0.9
9 2.0 3.2 5.2 2.0 1.0 5.3 2.1 2.9
10 2.0 1.9 3.1 5.0 1.9 1.0 5.1 2.0
11 0.0 2.0 1.9 3.1 5.0 1.9 1.0 5.1
12 2.0 0.0 2.0 1.9 3.1 5.0 1.9 1.0
PK-5 13.0 13.0 8.9 7.9 6.1 6.3 6.4 6.4
6-8 10.0 7.7 8.2 8.1 9.8 5.8 4.6 3.0
9-12 6.0 7.1 12.2 12.0 11.0 13.2 10.1 11.0
PK-12 29.0 27.8 29.3 28.0 26.9 25.3 21.1 20.4
Study Area 99 Projection Date 10/2/2019
CURRENT PROJECTED RESIDENT STUDENTS
2019 2020 2021 2022 2023 2024 2025 2026
PK 0.0 0.0 0.0 0.0 0.0 0.0 0.0 0.0
K 0.0 0.0 0.0 0.0 0.0 0.0 0.0 0.0
1 0.0 0.0 0.0 0.0 0.0 0.0 0.0 0.0
2 0.0 0.0 0.0 0.0 0.0 0.0 0.0 0.0
3 0.0 0.0 0.0 0.0 0.0 0.0 0.0 0.0
4 0.0 0.0 0.0 0.0 0.0 0.0 0.0 0.0
5 0.0 0.0 0.0 0.0 0.0 0.0 0.0 0.0
6 0.0 0.0 0.0 0.0 0.0 0.0 0.0 0.0
7 0.0 0.0 0.0 0.0 0.0 0.0 0.0 0.0
8 0.0 0.0 0.0 0.0 0.0 0.0 0.0 0.0
9 0.0 0.0 0.0 0.0 0.0 0.0 0.0 0.0
10 0.0 0.0 0.0 0.0 0.0 0.0 0.0 0.0
11 0.0 0.0 0.0 0.0 0.0 0.0 0.0 0.0
12 0.0 0.0 0.0 0.0 0.0 0.0 0.0 0.0
PK-5 0.0 0.0 0.0 0.0 0.0 0.0 0.0 0.0
6-8 0.0 0.0 0.0 0.0 0.0 0.0 0.0 0.0
9-12 0.0 0.0 0.0 0.0 0.0 0.0 0.0 0.0
PK-12 0.0 0.0 0.0 0.0 0.0 0.0 0.0 0.0

SY2019/20 Demographic Report
105
Study Area 100 Projection Date 10/2/2019
CURRENT PROJECTED RESIDENT STUDENTS
2019 2020 2021 2022 2023 2024 2025 2026
PK 0.0 0.0 0.0 0.0 0.0 0.0 0.0 0.0
K 4.0 3.6 3.5 3.4 3.3 3.4 3.4 3.4
1 7.0 4.1 3.7 3.6 3.5 3.4 3.5 3.5
2 1.0 6.9 4.1 3.7 3.5 3.5 3.4 3.5
3 8.0 1.0 6.9 4.1 3.7 3.5 3.5 3.4
4 3.0 8.2 1.0 7.1 4.2 3.8 3.6 3.6
5 6.0 2.9 8.0 1.0 6.9 4.1 3.7 3.5
6 7.0 5.0 2.4 6.6 0.8 5.7 3.4 3.1
7 5.0 6.9 4.9 2.4 6.6 0.8 5.7 3.4
8 2.0 4.9 6.9 4.9 2.4 6.5 0.8 5.6
9 5.0 2.0 5.0 7.0 5.0 2.4 6.6 0.8
10 6.0 4.8 2.0 4.9 6.8 4.8 2.4 6.4
11 2.0 5.5 4.5 1.8 4.5 6.2 4.4 2.2
12 8.0 2.0 5.5 4.4 1.8 4.5 6.2 4.4
PK-5 29.0 26.7 27.2 22.9 25.1 21.7 21.1 20.9
6-8 14.0 16.8 14.2 13.9 9.8 13.0 9.9 12.1
9-12 21.0 14.3 17.0 18.1 18.1 17.9 19.6 13.8
PK-12 64.0 57.8 58.4 54.9 53.0 52.6 50.6 46.8
Study Area 101 Projection Date 10/2/2019
CURRENT PROJECTED RESIDENT STUDENTS
2019 2020 2021 2022 2023 2024 2025 2026
PK 0.0 0.0 0.0 0.0 0.0 0.0 0.0 0.0
K 2.0 1.9 1.8 1.9 1.7 1.8 1.8 1.7
1 3.0 2.1 2.0 1.8 1.9 1.7 1.8 1.8
2 2.0 3.0 2.0 1.9 1.8 1.9 1.7 1.8
3 3.0 2.0 3.0 2.0 1.9 1.8 1.9 1.7
4 3.0 3.1 2.0 3.0 2.1 2.0 1.9 2.0
5 1.0 2.9 3.0 2.0 3.0 2.0 1.9 1.8
6 2.0 0.8 2.4 2.5 1.7 2.5 1.7 1.6
7 1.0 2.0 0.8 2.4 2.5 1.6 2.4 1.7
8 4.0 1.0 2.0 0.8 2.4 2.4 1.6 2.4
9 2.0 4.1 1.0 2.0 0.8 2.4 2.5 1.7
10 3.0 1.9 4.0 1.0 1.9 0.8 2.4 2.4
11 0.0 2.8 1.8 3.6 0.9 1.8 0.7 2.2
12 0.0 0.0 2.7 1.8 3.6 0.9 1.8 0.7
PK-5 14.0 15.0 13.8 12.6 12.4 11.2 11.0 10.8
6-8 7.0 3.8 5.2 5.7 6.6 6.5 5.7 5.7
9-12 5.0 8.8 9.5 8.4 7.2 5.9 7.4 7.0
PK-12 26.0 27.6 28.5 26.7 26.2 23.6 24.1 23.5
Study Area 102 Projection Date 10/2/2019
CURRENT PROJECTED RESIDENT STUDENTS
2019 2020 2021 2022 2023 2024 2025 2026
PK 2.0 1.9 1.9 1.8 1.9 1.8 1.8 1.8
K 13.0 11.7 11.3 11.2 10.8 11.1 11.0 11.0
1 9.0 13.4 12.1 11.6 11.5 11.2 11.4 11.4
2 10.0 8.9 13.3 12.0 11.5 11.4 11.0 11.3
3 13.0 10.0 8.9 13.3 12.0 11.5 11.4 11.0
4 14.0 13.3 10.2 9.1 13.5 12.2 11.7 11.6
5 6.0 13.7 13.0 10.0 8.9 13.3 12.0 11.5
6 7.0 5.0 11.4 10.8 8.3 7.4 11.0 9.9
7 7.0 6.9 4.9 11.3 10.7 8.2 7.3 10.9
8 7.0 6.9 6.9 4.9 11.2 10.6 8.1 7.2
9 6.0 7.1 7.1 7.0 5.0 11.4 10.8 8.3
10 10.0 5.8 6.9 6.9 6.8 4.8 11.0 10.5
11 7.0 9.2 5.4 6.4 6.3 6.2 4.4 10.2
12 5.0 6.9 9.1 5.3 6.3 6.2 6.2 4.4
PK-5 67.0 72.9 70.7 69.0 70.1 72.5 70.3 69.6
6-8 21.0 18.8 23.2 27.0 30.2 26.2 26.4 28.0
9-12 28.0 29.0 28.5 25.6 24.4 28.6 32.4 33.4
PK-12 116.0 120.7 122.4 121.6 124.7 127.3 129.1 131.0
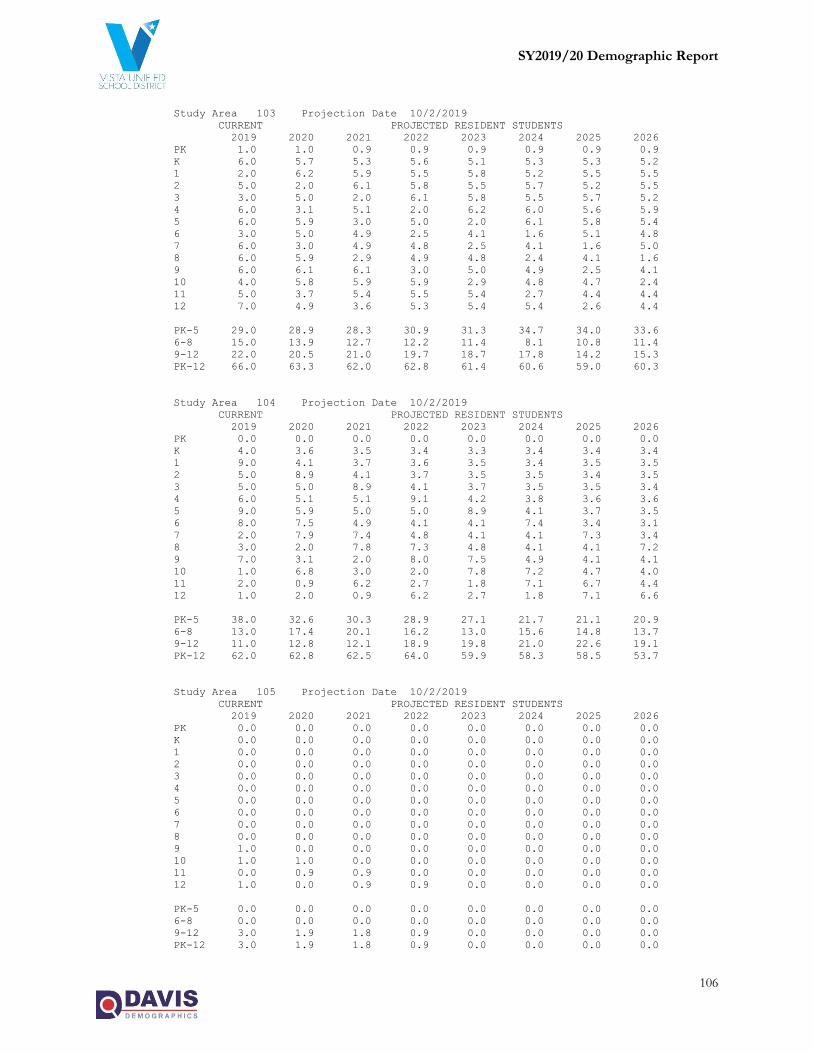
SY2019/20 Demographic Report
106
Study Area 103 Projection Date 10/2/2019
CURRENT PROJECTED RESIDENT STUDENTS
2019 2020 2021 2022 2023 2024 2025 2026
PK 1.0 1.0 0.9 0.9 0.9 0.9 0.9 0.9
K 6.0 5.7 5.3 5.6 5.1 5.3 5.3 5.2
1 2.0 6.2 5.9 5.5 5.8 5.2 5.5 5.5
2 5.0 2.0 6.1 5.8 5.5 5.7 5.2 5.5
3 3.0 5.0 2.0 6.1 5.8 5.5 5.7 5.2
4 6.0 3.1 5.1 2.0 6.2 6.0 5.6 5.9
5 6.0 5.9 3.0 5.0 2.0 6.1 5.8 5.4
6 3.0 5.0 4.9 2.5 4.1 1.6 5.1 4.8
7 6.0 3.0 4.9 4.8 2.5 4.1 1.6 5.0
8 6.0 5.9 2.9 4.9 4.8 2.4 4.1 1.6
9 6.0 6.1 6.1 3.0 5.0 4.9 2.5 4.1
10 4.0 5.8 5.9 5.9 2.9 4.8 4.7 2.4
11 5.0 3.7 5.4 5.5 5.4 2.7 4.4 4.4
12 7.0 4.9 3.6 5.3 5.4 5.4 2.6 4.4
PK-5 29.0 28.9 28.3 30.9 31.3 34.7 34.0 33.6
6-8 15.0 13.9 12.7 12.2 11.4 8.1 10.8 11.4
9-12 22.0 20.5 21.0 19.7 18.7 17.8 14.2 15.3
PK-12 66.0 63.3 62.0 62.8 61.4 60.6 59.0 60.3
Study Area 104 Projection Date 10/2/2019
CURRENT PROJECTED RESIDENT STUDENTS
2019 2020 2021 2022 2023 2024 2025 2026
PK 0.0 0.0 0.0 0.0 0.0 0.0 0.0 0.0
K 4.0 3.6 3.5 3.4 3.3 3.4 3.4 3.4
1 9.0 4.1 3.7 3.6 3.5 3.4 3.5 3.5
2 5.0 8.9 4.1 3.7 3.5 3.5 3.4 3.5
3 5.0 5.0 8.9 4.1 3.7 3.5 3.5 3.4
4 6.0 5.1 5.1 9.1 4.2 3.8 3.6 3.6
5 9.0 5.9 5.0 5.0 8.9 4.1 3.7 3.5
6 8.0 7.5 4.9 4.1 4.1 7.4 3.4 3.1
7 2.0 7.9 7.4 4.8 4.1 4.1 7.3 3.4
8 3.0 2.0 7.8 7.3 4.8 4.1 4.1 7.2
9 7.0 3.1 2.0 8.0 7.5 4.9 4.1 4.1
10 1.0 6.8 3.0 2.0 7.8 7.2 4.7 4.0
11 2.0 0.9 6.2 2.7 1.8 7.1 6.7 4.4
12 1.0 2.0 0.9 6.2 2.7 1.8 7.1 6.6
PK-5 38.0 32.6 30.3 28.9 27.1 21.7 21.1 20.9
6-8 13.0 17.4 20.1 16.2 13.0 15.6 14.8 13.7
9-12 11.0 12.8 12.1 18.9 19.8 21.0 22.6 19.1
PK-12 62.0 62.8 62.5 64.0 59.9 58.3 58.5 53.7
Study Area 105 Projection Date 10/2/2019
CURRENT PROJECTED RESIDENT STUDENTS
2019 2020 2021 2022 2023 2024 2025 2026
PK 0.0 0.0 0.0 0.0 0.0 0.0 0.0 0.0
K 0.0 0.0 0.0 0.0 0.0 0.0 0.0 0.0
1 0.0 0.0 0.0 0.0 0.0 0.0 0.0 0.0
2 0.0 0.0 0.0 0.0 0.0 0.0 0.0 0.0
3 0.0 0.0 0.0 0.0 0.0 0.0 0.0 0.0
4 0.0 0.0 0.0 0.0 0.0 0.0 0.0 0.0
5 0.0 0.0 0.0 0.0 0.0 0.0 0.0 0.0
6 0.0 0.0 0.0 0.0 0.0 0.0 0.0 0.0
7 0.0 0.0 0.0 0.0 0.0 0.0 0.0 0.0
8 0.0 0.0 0.0 0.0 0.0 0.0 0.0 0.0
9 1.0 0.0 0.0 0.0 0.0 0.0 0.0 0.0
10 1.0 1.0 0.0 0.0 0.0 0.0 0.0 0.0
11 0.0 0.9 0.9 0.0 0.0 0.0 0.0 0.0
12 1.0 0.0 0.9 0.9 0.0 0.0 0.0 0.0
PK-5 0.0 0.0 0.0 0.0 0.0 0.0 0.0 0.0
6-8 0.0 0.0 0.0 0.0 0.0 0.0 0.0 0.0
9-12 3.0 1.9 1.8 0.9 0.0 0.0 0.0 0.0
PK-12 3.0 1.9 1.8 0.9 0.0 0.0 0.0 0.0

SY2019/20 Demographic Report
107
Study Area 106 Projection Date 10/2/2019
CURRENT PROJECTED RESIDENT STUDENTS
2019 2020 2021 2022 2023 2024 2025 2026
PK 0.0 0.0 0.0 0.0 0.0 0.0 0.0 0.0
K 7.0 6.7 6.2 6.6 5.9 6.2 6.2 6.1
1 6.0 7.2 6.9 6.4 6.8 6.1 6.4 6.4
2 8.0 5.9 7.1 6.8 6.4 6.7 6.0 6.4
3 7.0 8.0 5.9 7.1 6.8 6.4 6.7 6.0
4 6.0 7.1 8.2 6.1 7.3 6.9 6.5 6.8
5 8.0 5.9 7.0 8.0 5.9 7.1 6.8 6.4
6 4.0 6.6 4.9 5.8 6.6 4.9 5.9 5.7
7 8.0 4.0 6.6 4.8 5.7 6.6 4.9 5.9
8 4.0 7.9 3.9 6.5 4.8 5.7 6.5 4.8
9 6.0 4.1 8.1 4.0 6.6 4.9 5.8 6.6
10 6.0 5.8 4.0 7.8 3.9 6.4 4.7 5.6
11 7.0 5.5 5.4 3.6 7.2 3.6 5.9 4.4
12 6.0 6.9 5.5 5.3 3.6 7.1 3.5 5.9
PK-5 42.0 40.8 41.3 41.0 39.1 39.4 38.6 38.1
6-8 16.0 18.5 15.4 17.1 17.1 17.2 17.3 16.4
9-12 25.0 22.3 23.0 20.7 21.3 22.0 19.9 22.5
PK-12 83.0 81.6 79.7 78.8 77.5 78.6 75.8 77.0
Study Area 107 Projection Date 10/2/2019
CURRENT PROJECTED RESIDENT STUDENTS
2019 2020 2021 2022 2023 2024 2025 2026
PK 1.0 1.0 0.9 0.9 0.9 0.9 0.9 0.9
K 8.0 7.2 6.9 8.0 7.9 7.8 7.8 7.7
1 10.0 8.2 7.4 8.3 8.9 8.2 8.0 8.0
2 6.0 9.9 8.2 8.5 8.9 8.8 8.1 8.0
3 15.0 6.0 9.9 9.3 9.2 8.9 8.8 8.1
4 3.0 15.3 6.1 11.3 10.2 9.3 9.1 9.0
5 5.0 2.9 15.0 7.1 11.7 10.0 9.2 8.9
6 8.0 4.2 2.4 13.4 6.5 9.7 8.3 7.6
7 7.0 7.9 4.1 3.6 13.9 6.4 9.6 8.2
8 0.0 6.9 7.8 5.2 4.2 13.8 6.3 9.5
9 8.0 0.0 7.1 9.2 6.0 4.2 14.0 6.5
10 3.0 7.8 0.0 8.0 9.5 5.8 4.1 13.6
11 1.0 2.8 7.1 1.1 7.9 8.8 5.3 3.8
12 2.0 1.0 2.7 8.2 1.7 7.9 8.7 5.3
PK-5 48.0 50.5 54.4 53.4 57.7 53.9 51.9 50.6
6-8 15.0 19.0 14.3 22.2 24.6 29.9 24.2 25.3
9-12 14.0 11.6 16.9 26.5 25.1 26.7 32.1 29.2
PK-12 77.0 81.1 85.6 102.1 107.4 110.5 108.2 105.1
Study Area 108 Projection Date 10/2/2019
CURRENT PROJECTED RESIDENT STUDENTS
2019 2020 2021 2022 2023 2024 2025 2026
PK 0.0 0.0 0.0 0.0 0.0 0.0 0.0 0.0
K 0.0 0.0 0.0 0.0 0.0 0.0 0.0 0.0
1 1.0 0.0 0.0 0.0 0.0 0.0 0.0 0.0
2 2.0 1.0 0.0 0.0 0.0 0.0 0.0 0.0
3 0.0 2.0 1.0 0.0 0.0 0.0 0.0 0.0
4 1.0 0.0 2.0 1.0 0.0 0.0 0.0 0.0
5 0.0 1.0 0.0 2.0 1.0 0.0 0.0 0.0
6 1.0 0.0 0.8 0.0 1.7 0.8 0.0 0.0
7 1.0 1.0 0.0 0.8 0.0 1.6 0.8 0.0
8 1.0 1.0 1.0 0.0 0.8 0.0 1.6 0.8
9 2.0 1.0 1.0 1.0 0.0 0.8 0.0 1.7
10 0.0 1.9 1.0 1.0 1.0 0.0 0.8 0.0
11 0.0 0.0 1.8 0.9 0.9 0.9 0.0 0.7
12 0.0 0.0 0.0 1.8 0.9 0.9 0.9 0.0
PK-5 4.0 4.0 3.0 3.0 1.0 0.0 0.0 0.0
6-8 3.0 2.0 1.8 0.8 2.5 2.4 2.4 0.8
9-12 2.0 2.9 3.8 4.7 2.8 2.6 1.7 2.4
PK-12 9.0 8.9 8.6 8.5 6.3 5.0 4.1 3.2

SY2019/20 Demographic Report
108
Study Area 109 Projection Date 10/2/2019
CURRENT PROJECTED RESIDENT STUDENTS
2019 2020 2021 2022 2023 2024 2025 2026
PK 1.0 1.0 0.9 0.9 0.9 0.9 0.9 0.9
K 9.0 8.1 7.8 7.7 7.5 7.7 7.6 7.6
1 4.0 9.3 8.4 8.0 8.0 7.7 7.9 7.9
2 6.0 4.0 9.2 8.3 8.0 7.9 7.6 7.8
3 3.0 6.0 4.0 9.2 8.3 8.0 7.9 7.6
4 4.0 3.1 6.1 4.0 9.4 8.4 8.1 8.0
5 7.0 3.9 3.0 6.0 4.0 9.2 8.3 8.0
6 1.0 5.8 3.3 2.5 5.0 3.3 7.6 6.9
7 2.0 1.0 5.8 3.2 2.5 4.9 3.3 7.5
8 5.0 2.0 1.0 5.7 3.2 2.4 4.9 3.2
9 3.0 5.1 2.0 1.0 5.8 3.3 2.5 5.0
10 2.0 2.9 4.9 2.0 1.0 5.6 3.2 2.4
11 2.0 1.8 2.7 4.6 1.8 0.9 5.2 2.9
12 0.0 2.0 1.8 2.7 4.5 1.8 0.9 5.1
PK-5 34.0 35.4 39.4 44.1 46.1 49.8 48.3 47.8
6-8 8.0 8.8 10.1 11.4 10.7 10.6 15.8 17.6
9-12 7.0 11.8 11.4 10.3 13.1 11.6 11.8 15.4
PK-12 49.0 56.0 60.9 65.8 69.9 72.0 75.9 80.8
Study Area 110 Projection Date 10/2/2019
CURRENT PROJECTED RESIDENT STUDENTS
2019 2020 2021 2022 2023 2024 2025 2026
PK 1.0 1.0 0.9 0.9 0.9 0.9 0.9 0.9
K 1.0 0.9 0.9 0.9 0.8 0.9 0.8 0.8
1 4.0 1.0 0.9 0.9 0.9 0.9 0.9 0.9
2 3.0 4.0 1.0 0.9 0.9 0.9 0.8 0.9
3 5.0 3.0 4.0 1.0 0.9 0.9 0.9 0.8
4 1.0 5.1 3.1 4.0 1.0 0.9 0.9 0.9
5 2.0 1.0 5.0 3.0 4.0 1.0 0.9 0.9
6 4.0 1.7 0.8 4.1 2.5 3.3 0.8 0.8
7 3.0 4.0 1.6 0.8 4.1 2.5 3.3 0.8
8 2.0 3.0 3.9 1.6 0.8 4.1 2.4 3.2
9 2.0 2.0 3.0 4.0 1.7 0.8 4.1 2.5
10 2.0 1.9 2.0 2.9 3.9 1.6 0.8 4.0
11 3.0 1.8 1.8 1.8 2.7 3.6 1.5 0.7
12 3.0 3.0 1.8 1.8 1.8 2.7 3.5 1.5
PK-5 17.0 16.0 15.8 11.6 9.4 6.4 6.1 6.1
6-8 9.0 8.7 6.3 6.5 7.4 9.9 6.5 4.8
9-12 10.0 8.7 8.6 10.5 10.1 8.7 9.9 8.7
PK-12 36.0 33.4 30.7 28.6 26.9 25.0 22.5 19.6
Study Area 111 Projection Date 10/2/2019
CURRENT PROJECTED RESIDENT STUDENTS
2019 2020 2021 2022 2023 2024 2025 2026
PK 1.0 1.0 0.9 0.9 0.9 0.9 0.9 0.9
K 5.0 4.5 4.3 4.3 4.2 4.3 4.2 4.2
1 4.0 5.2 4.6 4.5 4.4 4.3 4.4 4.4
2 7.0 4.0 5.1 4.6 4.4 4.4 4.2 4.4
3 5.0 7.0 4.0 5.1 4.6 4.4 4.4 4.2
4 6.0 5.1 7.1 4.0 5.2 4.7 4.5 4.5
5 7.0 5.9 5.0 7.0 4.0 5.1 4.6 4.4
6 3.0 5.8 4.9 4.1 5.8 3.3 4.2 3.8
7 6.0 3.0 5.8 4.8 4.1 5.7 3.3 4.2
8 5.0 5.9 2.9 5.7 4.8 4.1 5.7 3.2
9 3.0 5.1 6.1 3.0 5.8 4.9 4.1 5.8
10 8.0 2.9 4.9 5.9 2.9 5.6 4.7 4.0
11 4.0 7.4 2.7 4.6 5.4 2.7 5.2 4.4
12 7.0 4.0 7.3 2.7 4.5 5.4 2.6 5.1
PK-5 35.0 32.7 31.0 30.4 27.7 28.1 27.2 27.0
6-8 14.0 14.7 13.6 14.6 14.7 13.1 13.2 11.2
9-12 22.0 19.4 21.0 16.2 18.6 18.6 16.6 19.3
PK-12 71.0 66.8 65.6 61.2 61.0 59.8 57.0 57.5

SY2019/20 Demographic Report
109
Study Area 112 Projection Date 10/2/2019
CURRENT PROJECTED RESIDENT STUDENTS
2019 2020 2021 2022 2023 2024 2025 2026
PK 0.0 0.0 0.0 0.0 0.0 0.0 0.0 0.0
K 7.0 6.3 6.1 6.0 5.8 6.0 5.9 5.9
1 5.0 7.2 6.5 6.3 6.2 6.0 6.2 6.1
2 8.0 4.9 7.1 6.4 6.2 6.1 5.9 6.1
3 9.0 8.0 4.9 7.1 6.4 6.2 6.1 5.9
4 7.0 9.2 8.2 5.0 7.3 6.6 6.3 6.2
5 3.0 6.9 9.0 8.0 4.9 7.1 6.4 6.2
6 10.0 2.5 5.7 7.5 6.6 4.1 5.9 5.3
7 5.0 9.9 2.5 5.6 7.4 6.6 4.1 5.9
8 5.0 4.9 9.8 2.4 5.6 7.3 6.5 4.0
9 10.0 5.1 5.0 10.0 2.5 5.7 7.5 6.6
10 6.0 9.7 4.9 4.9 9.7 2.4 5.5 7.2
11 4.0 5.5 8.9 4.6 4.5 8.9 2.2 5.1
12 4.0 4.0 5.5 8.8 4.5 4.5 8.8 2.2
PK-5 39.0 42.5 41.8 38.8 36.8 38.0 36.8 36.4
6-8 20.0 17.3 18.0 15.5 19.6 18.0 16.5 15.2
9-12 24.0 24.3 24.3 28.3 21.2 21.5 24.0 21.1
PK-12 83.0 84.1 84.1 82.6 77.6 77.5 77.3 72.7
Study Area 113 Projection Date 10/2/2019
CURRENT PROJECTED RESIDENT STUDENTS
2019 2020 2021 2022 2023 2024 2025 2026
PK 0.0 0.0 0.0 0.0 0.0 0.0 0.0 0.0
K 3.0 2.7 2.6 2.9 2.7 2.7 2.7 2.7
1 6.0 3.1 2.8 3.0 3.0 2.8 2.8 2.8
2 6.0 5.9 3.1 3.1 3.0 3.0 2.7 2.8
3 11.0 6.0 5.9 3.4 3.1 3.0 3.0 2.7
4 3.0 11.2 6.1 6.4 3.5 3.2 3.1 3.0
5 7.0 2.9 11.0 6.3 6.3 3.4 3.1 3.0
6 12.0 5.8 2.4 9.4 5.3 5.2 2.8 2.6
7 10.0 11.9 5.8 2.8 9.3 5.2 5.2 2.8
8 10.0 9.9 11.8 6.0 2.7 9.2 5.2 5.1
9 6.0 10.2 10.1 12.4 6.2 2.8 9.4 5.3
10 12.0 5.8 9.9 10.1 12.0 6.0 2.7 9.1
11 7.0 11.0 5.4 9.4 9.3 11.0 5.5 2.5
12 8.0 6.9 10.9 5.6 9.3 9.2 10.9 5.4
PK-5 36.0 31.8 31.5 25.1 21.6 18.1 17.4 17.0
6-8 32.0 27.6 20.0 18.2 17.3 19.6 13.2 10.5
9-12 33.0 33.9 36.3 37.5 36.8 29.0 28.5 22.3
PK-12 101.0 93.3 87.8 80.8 75.7 66.7 59.1 49.8
Study Area 114 Projection Date 10/2/2019
CURRENT PROJECTED RESIDENT STUDENTS
2019 2020 2021 2022 2023 2024 2025 2026
PK 0.0 0.0 0.0 0.0 0.0 0.0 0.0 0.0
K 1.0 0.9 0.9 0.9 0.8 0.9 0.8 0.8
1 3.0 1.0 0.9 0.9 0.9 0.9 0.9 0.9
2 5.0 3.0 1.0 0.9 0.9 0.9 0.8 0.9
3 1.0 5.0 3.0 1.0 0.9 0.9 0.9 0.8
4 4.0 1.0 5.1 3.0 1.0 0.9 0.9 0.9
5 2.0 3.9 1.0 5.0 3.0 1.0 0.9 0.9
6 1.0 1.7 3.3 0.8 4.1 2.5 0.8 0.8
7 0.0 1.0 1.6 3.2 0.8 4.1 2.4 0.8
8 2.0 0.0 1.0 1.6 3.2 0.8 4.1 2.4
9 2.0 2.0 0.0 1.0 1.7 3.3 0.8 4.1
10 2.0 1.9 2.0 0.0 1.0 1.6 3.2 0.8
11 4.0 1.8 1.8 1.8 0.0 0.9 1.5 2.9
12 1.0 4.0 1.8 1.8 1.8 0.0 0.9 1.5
PK-5 16.0 14.8 11.9 11.7 7.5 5.5 5.2 5.2
6-8 3.0 2.7 5.9 5.6 8.1 7.4 7.3 4.0
9-12 9.0 9.7 5.6 4.6 4.5 5.8 6.4 9.3
PK-12 28.0 27.2 23.4 21.9 20.1 18.7 18.9 18.5

SY2019/20 Demographic Report
110
Study Area 115 Projection Date 10/2/2019
CURRENT PROJECTED RESIDENT STUDENTS
2019 2020 2021 2022 2023 2024 2025 2026
PK 0.0 0.0 0.0 0.0 0.0 0.0 0.0 0.0
K 2.0 1.9 1.8 1.9 1.7 1.8 1.8 1.7
1 6.0 2.1 2.0 1.8 1.9 1.7 1.8 1.8
2 6.0 5.9 2.0 1.9 1.8 1.9 1.7 1.8
3 3.0 6.0 5.9 2.0 1.9 1.8 1.9 1.7
4 0.0 3.1 6.1 6.1 2.1 2.0 1.9 2.0
5 5.0 0.0 3.0 6.0 5.9 2.0 1.9 1.8
6 2.0 4.2 0.0 2.5 5.0 4.9 1.7 1.6
7 5.0 2.0 4.1 0.0 2.5 4.9 4.9 1.7
8 3.0 4.9 2.0 4.1 0.0 2.4 4.9 4.8
9 3.0 3.1 5.0 2.0 4.1 0.0 2.5 5.0
10 9.0 2.9 3.0 4.9 1.9 4.0 0.0 2.4
11 0.0 8.3 2.7 2.7 4.5 1.8 3.7 0.0
12 1.0 0.0 8.2 2.7 2.7 4.5 1.8 3.7
PK-5 22.0 19.0 20.8 19.7 15.3 11.2 11.0 10.8
6-8 10.0 11.1 6.1 6.6 7.5 12.2 11.5 8.1
9-12 13.0 14.3 18.9 12.3 13.2 10.3 8.0 11.1
PK-12 45.0 44.4 45.8 38.6 36.0 33.7 30.5 30.0
Study Area 116 Projection Date 10/2/2019
CURRENT PROJECTED RESIDENT STUDENTS
2019 2020 2021 2022 2023 2024 2025 2026
PK 2.0 1.9 1.9 1.8 1.9 1.8 1.8 1.8
K 0.0 0.0 0.0 0.0 0.0 0.0 0.0 0.0
1 3.0 0.0 0.0 0.0 0.0 0.0 0.0 0.0
2 1.0 3.0 0.0 0.0 0.0 0.0 0.0 0.0
3 3.0 1.0 3.0 0.0 0.0 0.0 0.0 0.0
4 2.0 3.1 1.0 3.0 0.0 0.0 0.0 0.0
5 3.0 2.0 3.0 1.0 3.0 0.0 0.0 0.0
6 3.0 2.5 1.6 2.5 0.8 2.5 0.0 0.0
7 0.0 3.0 2.5 1.6 2.5 0.8 2.4 0.0
8 1.0 0.0 2.9 2.4 1.6 2.4 0.8 2.4
9 1.0 1.0 0.0 3.0 2.5 1.6 2.5 0.8
10 4.0 1.0 1.0 0.0 2.9 2.4 1.6 2.4
11 4.0 3.7 0.9 0.9 0.0 2.7 2.2 1.5
12 4.0 4.0 3.6 0.9 0.9 0.0 2.6 2.2
PK-5 14.0 11.0 8.9 5.8 4.9 1.8 1.8 1.8
6-8 4.0 5.5 7.0 6.5 4.9 5.7 3.2 2.4
9-12 13.0 9.7 5.5 4.8 6.3 6.7 8.9 6.9
PK-12 31.0 26.2 21.4 17.1 16.1 14.2 13.9 11.1
Study Area 117 Projection Date 10/2/2019
CURRENT PROJECTED RESIDENT STUDENTS
2019 2020 2021 2022 2023 2024 2025 2026
PK 3.0 2.9 2.8 2.7 2.8 2.8 2.8 2.8
K 3.0 2.7 2.6 2.6 2.5 2.6 2.5 2.5
1 3.0 3.1 2.8 2.7 2.7 2.6 2.6 2.6
2 7.0 3.0 3.1 2.8 2.7 2.6 2.5 2.6
3 2.0 7.0 3.0 3.1 2.8 2.7 2.6 2.5
4 2.0 2.0 7.1 3.0 3.1 2.8 2.7 2.7
5 3.0 2.0 2.0 7.0 3.0 3.1 2.8 2.7
6 4.0 2.5 1.6 1.7 5.8 2.5 2.5 2.3
7 4.0 4.0 2.5 1.6 1.6 5.7 2.4 2.5
8 6.0 4.0 3.9 2.4 1.6 1.6 5.7 2.4
9 3.0 6.1 4.0 4.0 2.5 1.6 1.7 5.8
10 9.0 2.9 5.9 3.9 3.9 2.4 1.6 1.6
11 2.0 8.3 2.7 5.5 3.6 3.6 2.2 1.5
12 4.0 2.0 8.2 2.7 5.4 3.6 3.5 2.2
PK-5 23.0 22.7 23.4 23.9 19.6 19.2 18.5 18.4
6-8 14.0 10.5 8.0 5.7 9.0 9.8 10.6 7.2
9-12 18.0 19.3 20.8 16.1 15.4 11.2 9.0 11.1
PK-12 55.0 52.5 52.2 45.7 44.0 40.2 38.1 36.7
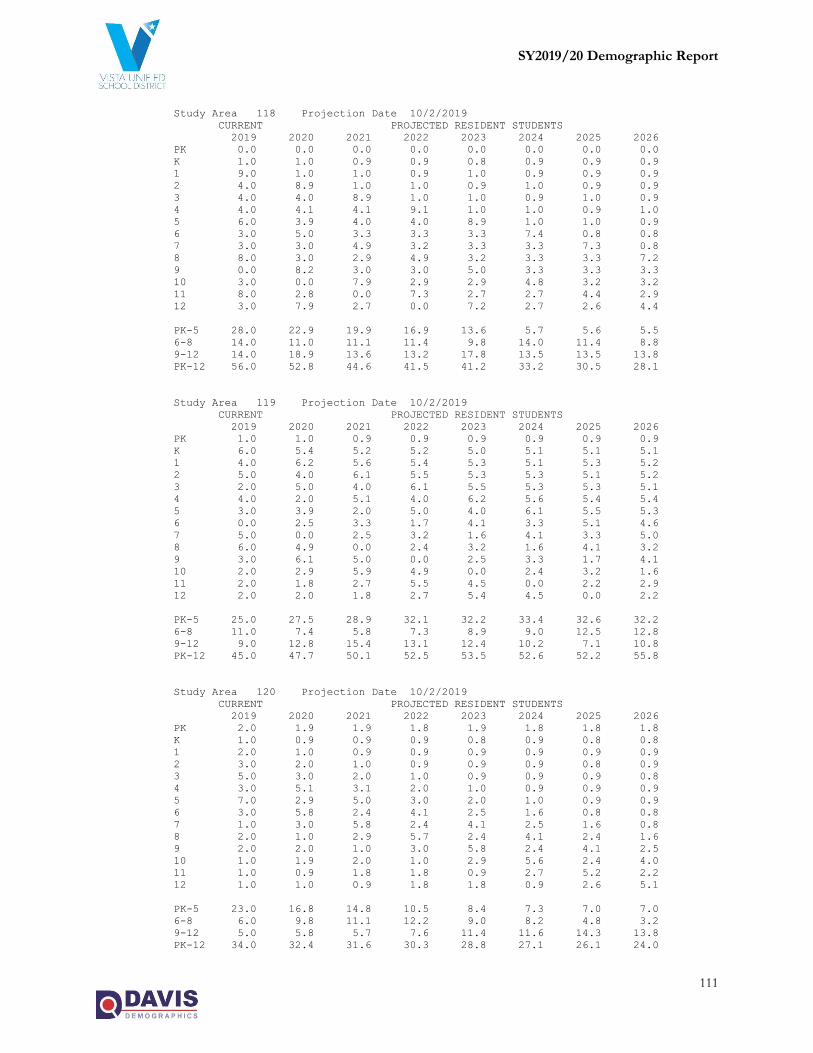
SY2019/20 Demographic Report
111
Study Area 118 Projection Date 10/2/2019
CURRENT PROJECTED RESIDENT STUDENTS
2019 2020 2021 2022 2023 2024 2025 2026
PK 0.0 0.0 0.0 0.0 0.0 0.0 0.0 0.0
K 1.0 1.0 0.9 0.9 0.8 0.9 0.9 0.9
1 9.0 1.0 1.0 0.9 1.0 0.9 0.9 0.9
2 4.0 8.9 1.0 1.0 0.9 1.0 0.9 0.9
3 4.0 4.0 8.9 1.0 1.0 0.9 1.0 0.9
4 4.0 4.1 4.1 9.1 1.0 1.0 0.9 1.0
5 6.0 3.9 4.0 4.0 8.9 1.0 1.0 0.9
6 3.0 5.0 3.3 3.3 3.3 7.4 0.8 0.8
7 3.0 3.0 4.9 3.2 3.3 3.3 7.3 0.8
8 8.0 3.0 2.9 4.9 3.2 3.3 3.3 7.2
9 0.0 8.2 3.0 3.0 5.0 3.3 3.3 3.3
10 3.0 0.0 7.9 2.9 2.9 4.8 3.2 3.2
11 8.0 2.8 0.0 7.3 2.7 2.7 4.4 2.9
12 3.0 7.9 2.7 0.0 7.2 2.7 2.6 4.4
PK-5 28.0 22.9 19.9 16.9 13.6 5.7 5.6 5.5
6-8 14.0 11.0 11.1 11.4 9.8 14.0 11.4 8.8
9-12 14.0 18.9 13.6 13.2 17.8 13.5 13.5 13.8
PK-12 56.0 52.8 44.6 41.5 41.2 33.2 30.5 28.1
Study Area 119 Projection Date 10/2/2019
CURRENT PROJECTED RESIDENT STUDENTS
2019 2020 2021 2022 2023 2024 2025 2026
PK 1.0 1.0 0.9 0.9 0.9 0.9 0.9 0.9
K 6.0 5.4 5.2 5.2 5.0 5.1 5.1 5.1
1 4.0 6.2 5.6 5.4 5.3 5.1 5.3 5.2
2 5.0 4.0 6.1 5.5 5.3 5.3 5.1 5.2
3 2.0 5.0 4.0 6.1 5.5 5.3 5.3 5.1
4 4.0 2.0 5.1 4.0 6.2 5.6 5.4 5.4
5 3.0 3.9 2.0 5.0 4.0 6.1 5.5 5.3
6 0.0 2.5 3.3 1.7 4.1 3.3 5.1 4.6
7 5.0 0.0 2.5 3.2 1.6 4.1 3.3 5.0
8 6.0 4.9 0.0 2.4 3.2 1.6 4.1 3.2
9 3.0 6.1 5.0 0.0 2.5 3.3 1.7 4.1
10 2.0 2.9 5.9 4.9 0.0 2.4 3.2 1.6
11 2.0 1.8 2.7 5.5 4.5 0.0 2.2 2.9
12 2.0 2.0 1.8 2.7 5.4 4.5 0.0 2.2
PK-5 25.0 27.5 28.9 32.1 32.2 33.4 32.6 32.2
6-8 11.0 7.4 5.8 7.3 8.9 9.0 12.5 12.8
9-12 9.0 12.8 15.4 13.1 12.4 10.2 7.1 10.8
PK-12 45.0 47.7 50.1 52.5 53.5 52.6 52.2 55.8
Study Area 120 Projection Date 10/2/2019
CURRENT PROJECTED RESIDENT STUDENTS
2019 2020 2021 2022 2023 2024 2025 2026
PK 2.0 1.9 1.9 1.8 1.9 1.8 1.8 1.8
K 1.0 0.9 0.9 0.9 0.8 0.9 0.8 0.8
1 2.0 1.0 0.9 0.9 0.9 0.9 0.9 0.9
2 3.0 2.0 1.0 0.9 0.9 0.9 0.8 0.9
3 5.0 3.0 2.0 1.0 0.9 0.9 0.9 0.8
4 3.0 5.1 3.1 2.0 1.0 0.9 0.9 0.9
5 7.0 2.9 5.0 3.0 2.0 1.0 0.9 0.9
6 3.0 5.8 2.4 4.1 2.5 1.6 0.8 0.8
7 1.0 3.0 5.8 2.4 4.1 2.5 1.6 0.8
8 2.0 1.0 2.9 5.7 2.4 4.1 2.4 1.6
9 2.0 2.0 1.0 3.0 5.8 2.4 4.1 2.5
10 1.0 1.9 2.0 1.0 2.9 5.6 2.4 4.0
11 1.0 0.9 1.8 1.8 0.9 2.7 5.2 2.2
12 1.0 1.0 0.9 1.8 1.8 0.9 2.6 5.1
PK-5 23.0 16.8 14.8 10.5 8.4 7.3 7.0 7.0
6-8 6.0 9.8 11.1 12.2 9.0 8.2 4.8 3.2
9-12 5.0 5.8 5.7 7.6 11.4 11.6 14.3 13.8
PK-12 34.0 32.4 31.6 30.3 28.8 27.1 26.1 24.0

SY2019/20 Demographic Report
112
Study Area 121 Projection Date 10/2/2019
CURRENT PROJECTED RESIDENT STUDENTS
2019 2020 2021 2022 2023 2024 2025 2026
PK 1.0 1.0 0.9 0.9 0.9 0.9 0.9 0.9
K 0.0 0.0 0.0 0.0 0.0 0.0 0.0 0.0
1 1.0 0.0 0.0 0.0 0.0 0.0 0.0 0.0
2 2.0 1.0 0.0 0.0 0.0 0.0 0.0 0.0
3 0.0 2.0 1.0 0.0 0.0 0.0 0.0 0.0
4 0.0 0.0 2.0 1.0 0.0 0.0 0.0 0.0
5 1.0 0.0 0.0 2.0 1.0 0.0 0.0 0.0
6 1.0 0.8 0.0 0.0 1.7 0.8 0.0 0.0
7 1.0 1.0 0.8 0.0 0.0 1.6 0.8 0.0
8 1.0 1.0 1.0 0.8 0.0 0.0 1.6 0.8
9 0.0 1.0 1.0 1.0 0.8 0.0 0.0 1.7
10 1.0 0.0 1.0 1.0 1.0 0.8 0.0 0.0
11 1.0 0.9 0.0 0.9 0.9 0.9 0.7 0.0
12 0.0 1.0 0.9 0.0 0.9 0.9 0.9 0.7
PK-5 5.0 4.0 3.9 3.9 1.9 0.9 0.9 0.9
6-8 3.0 2.8 1.8 0.8 1.7 2.4 2.4 0.8
9-12 2.0 2.9 2.9 2.9 3.6 2.6 1.6 2.4
PK-12 10.0 9.7 8.6 7.6 7.2 5.9 4.9 4.1
Study Area 122 Projection Date 10/2/2019
CURRENT PROJECTED RESIDENT STUDENTS
2019 2020 2021 2022 2023 2024 2025 2026
PK 0.0 0.0 0.0 0.0 0.0 0.0 0.0 0.0
K 0.0 0.0 0.0 0.0 0.0 0.0 0.0 0.0
1 1.0 0.0 0.0 0.0 0.0 0.0 0.0 0.0
2 1.0 1.0 0.0 0.0 0.0 0.0 0.0 0.0
3 1.0 1.0 1.0 0.0 0.0 0.0 0.0 0.0
4 0.0 1.0 1.0 1.0 0.0 0.0 0.0 0.0
5 0.0 0.0 1.0 1.0 1.0 0.0 0.0 0.0
6 0.0 0.0 0.0 0.8 0.8 0.8 0.0 0.0
7 0.0 0.0 0.0 0.0 0.8 0.8 0.8 0.0
8 0.0 0.0 0.0 0.0 0.0 0.8 0.8 0.8
9 0.0 0.0 0.0 0.0 0.0 0.0 0.8 0.8
10 0.0 0.0 0.0 0.0 0.0 0.0 0.0 0.8
11 0.0 0.0 0.0 0.0 0.0 0.0 0.0 0.0
12 0.0 0.0 0.0 0.0 0.0 0.0 0.0 0.0
PK-5 3.0 3.0 3.0 2.0 1.0 0.0 0.0 0.0
6-8 0.0 0.0 0.0 0.8 1.6 2.4 1.6 0.8
9-12 0.0 0.0 0.0 0.0 0.0 0.0 0.8 1.6
PK-12 3.0 3.0 3.0 2.8 2.6 2.4 2.4 2.4
Study Area 123 Projection Date 10/2/2019
CURRENT PROJECTED RESIDENT STUDENTS
2019 2020 2021 2022 2023 2024 2025 2026
PK 0.0 0.0 0.0 0.0 0.0 0.0 0.0 0.0
K 0.0 0.0 0.0 0.0 0.0 0.0 0.0 0.0
1 0.0 0.0 0.0 0.0 0.0 0.0 0.0 0.0
2 0.0 0.0 0.0 0.0 0.0 0.0 0.0 0.0
3 0.0 0.0 0.0 0.0 0.0 0.0 0.0 0.0
4 0.0 0.0 0.0 0.0 0.0 0.0 0.0 0.0
5 0.0 0.0 0.0 0.0 0.0 0.0 0.0 0.0
6 0.0 0.0 0.0 0.0 0.0 0.0 0.0 0.0
7 0.0 0.0 0.0 0.0 0.0 0.0 0.0 0.0
8 0.0 0.0 0.0 0.0 0.0 0.0 0.0 0.0
9 0.0 0.0 0.0 0.0 0.0 0.0 0.0 0.0
10 0.0 0.0 0.0 0.0 0.0 0.0 0.0 0.0
11 0.0 0.0 0.0 0.0 0.0 0.0 0.0 0.0
12 0.0 0.0 0.0 0.0 0.0 0.0 0.0 0.0
PK-5 0.0 0.0 0.0 0.0 0.0 0.0 0.0 0.0
6-8 0.0 0.0 0.0 0.0 0.0 0.0 0.0 0.0
9-12 0.0 0.0 0.0 0.0 0.0 0.0 0.0 0.0
PK-12 0.0 0.0 0.0 0.0 0.0 0.0 0.0 0.0
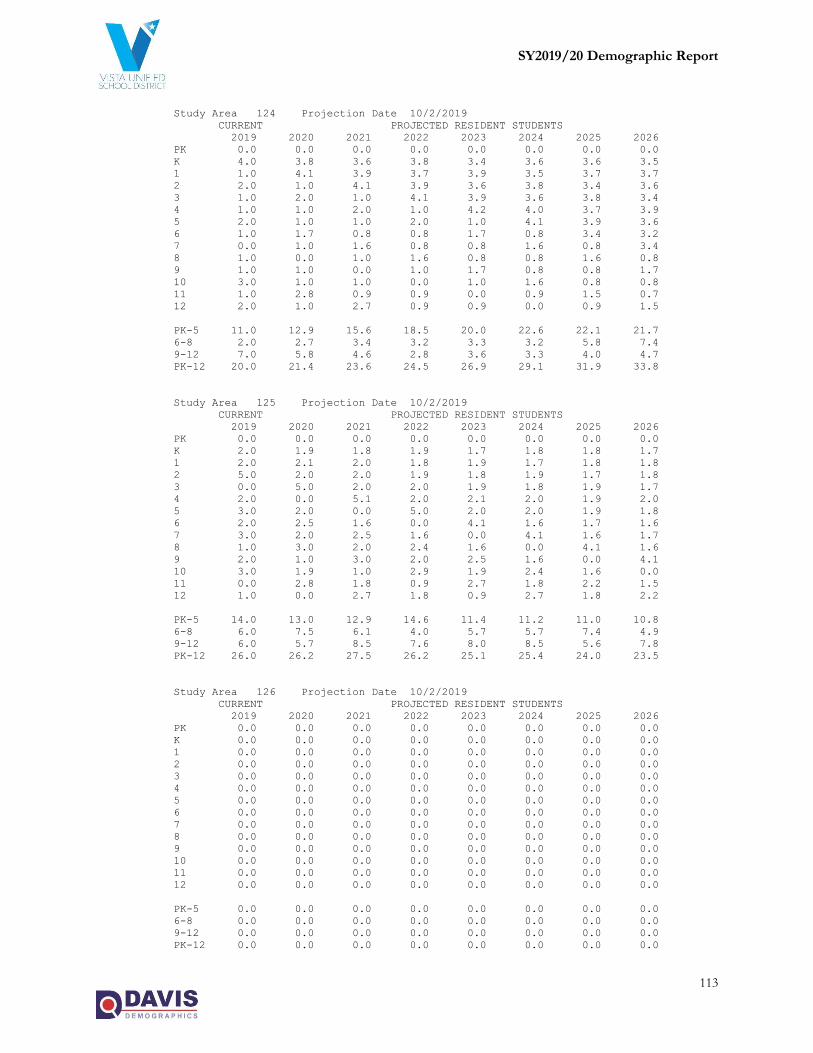
SY2019/20 Demographic Report
113
Study Area 124 Projection Date 10/2/2019
CURRENT PROJECTED RESIDENT STUDENTS
2019 2020 2021 2022 2023 2024 2025 2026
PK 0.0 0.0 0.0 0.0 0.0 0.0 0.0 0.0
K 4.0 3.8 3.6 3.8 3.4 3.6 3.6 3.5
1 1.0 4.1 3.9 3.7 3.9 3.5 3.7 3.7
2 2.0 1.0 4.1 3.9 3.6 3.8 3.4 3.6
3 1.0 2.0 1.0 4.1 3.9 3.6 3.8 3.4
4 1.0 1.0 2.0 1.0 4.2 4.0 3.7 3.9
5 2.0 1.0 1.0 2.0 1.0 4.1 3.9 3.6
6 1.0 1.7 0.8 0.8 1.7 0.8 3.4 3.2
7 0.0 1.0 1.6 0.8 0.8 1.6 0.8 3.4
8 1.0 0.0 1.0 1.6 0.8 0.8 1.6 0.8
9 1.0 1.0 0.0 1.0 1.7 0.8 0.8 1.7
10 3.0 1.0 1.0 0.0 1.0 1.6 0.8 0.8
11 1.0 2.8 0.9 0.9 0.0 0.9 1.5 0.7
12 2.0 1.0 2.7 0.9 0.9 0.0 0.9 1.5
PK-5 11.0 12.9 15.6 18.5 20.0 22.6 22.1 21.7
6-8 2.0 2.7 3.4 3.2 3.3 3.2 5.8 7.4
9-12 7.0 5.8 4.6 2.8 3.6 3.3 4.0 4.7
PK-12 20.0 21.4 23.6 24.5 26.9 29.1 31.9 33.8
Study Area 125 Projection Date 10/2/2019
CURRENT PROJECTED RESIDENT STUDENTS
2019 2020 2021 2022 2023 2024 2025 2026
PK 0.0 0.0 0.0 0.0 0.0 0.0 0.0 0.0
K 2.0 1.9 1.8 1.9 1.7 1.8 1.8 1.7
1 2.0 2.1 2.0 1.8 1.9 1.7 1.8 1.8
2 5.0 2.0 2.0 1.9 1.8 1.9 1.7 1.8
3 0.0 5.0 2.0 2.0 1.9 1.8 1.9 1.7
4 2.0 0.0 5.1 2.0 2.1 2.0 1.9 2.0
5 3.0 2.0 0.0 5.0 2.0 2.0 1.9 1.8
6 2.0 2.5 1.6 0.0 4.1 1.6 1.7 1.6
7 3.0 2.0 2.5 1.6 0.0 4.1 1.6 1.7
8 1.0 3.0 2.0 2.4 1.6 0.0 4.1 1.6
9 2.0 1.0 3.0 2.0 2.5 1.6 0.0 4.1
10 3.0 1.9 1.0 2.9 1.9 2.4 1.6 0.0
11 0.0 2.8 1.8 0.9 2.7 1.8 2.2 1.5
12 1.0 0.0 2.7 1.8 0.9 2.7 1.8 2.2
PK-5 14.0 13.0 12.9 14.6 11.4 11.2 11.0 10.8
6-8 6.0 7.5 6.1 4.0 5.7 5.7 7.4 4.9
9-12 6.0 5.7 8.5 7.6 8.0 8.5 5.6 7.8
PK-12 26.0 26.2 27.5 26.2 25.1 25.4 24.0 23.5
Study Area 126 Projection Date 10/2/2019
CURRENT PROJECTED RESIDENT STUDENTS
2019 2020 2021 2022 2023 2024 2025 2026
PK 0.0 0.0 0.0 0.0 0.0 0.0 0.0 0.0
K 0.0 0.0 0.0 0.0 0.0 0.0 0.0 0.0
1 0.0 0.0 0.0 0.0 0.0 0.0 0.0 0.0
2 0.0 0.0 0.0 0.0 0.0 0.0 0.0 0.0
3 0.0 0.0 0.0 0.0 0.0 0.0 0.0 0.0
4 0.0 0.0 0.0 0.0 0.0 0.0 0.0 0.0
5 0.0 0.0 0.0 0.0 0.0 0.0 0.0 0.0
6 0.0 0.0 0.0 0.0 0.0 0.0 0.0 0.0
7 0.0 0.0 0.0 0.0 0.0 0.0 0.0 0.0
8 0.0 0.0 0.0 0.0 0.0 0.0 0.0 0.0
9 0.0 0.0 0.0 0.0 0.0 0.0 0.0 0.0
10 0.0 0.0 0.0 0.0 0.0 0.0 0.0 0.0
11 0.0 0.0 0.0 0.0 0.0 0.0 0.0 0.0
12 0.0 0.0 0.0 0.0 0.0 0.0 0.0 0.0
PK-5 0.0 0.0 0.0 0.0 0.0 0.0 0.0 0.0
6-8 0.0 0.0 0.0 0.0 0.0 0.0 0.0 0.0
9-12 0.0 0.0 0.0 0.0 0.0 0.0 0.0 0.0
PK-12 0.0 0.0 0.0 0.0 0.0 0.0 0.0 0.0

SY2019/20 Demographic Report
114
Study Area 127 Projection Date 10/2/2019
CURRENT PROJECTED RESIDENT STUDENTS
2019 2020 2021 2022 2023 2024 2025 2026
PK 0.0 0.0 0.0 0.0 0.0 0.0 0.0 0.0
K 0.0 0.0 0.0 0.0 0.0 0.0 0.0 0.0
1 2.0 0.0 0.0 0.0 0.0 0.0 0.0 0.0
2 0.0 1.9 0.0 0.0 0.0 0.0 0.0 0.0
3 1.0 0.0 1.8 0.0 0.0 0.0 0.0 0.0
4 2.0 1.0 0.0 1.8 0.0 0.0 0.0 0.0
5 2.0 1.9 0.9 0.0 1.7 0.0 0.0 0.0
6 0.0 1.8 1.7 0.8 0.0 1.5 0.0 0.0
7 2.0 0.0 1.7 1.6 0.8 0.0 1.4 0.0
8 1.0 2.0 0.0 1.7 1.6 0.8 0.0 1.4
9 1.0 1.0 2.0 0.0 1.7 1.6 0.8 0.0
10 1.0 0.9 0.9 1.8 0.0 1.5 1.4 0.7
11 1.0 0.9 0.8 0.8 1.6 0.0 1.3 1.3
12 1.0 1.0 0.9 0.8 0.8 1.6 0.0 1.3
PK-5 7.0 4.8 2.7 1.8 1.7 0.0 0.0 0.0
6-8 3.0 3.8 3.4 4.1 2.4 2.3 1.4 1.4
9-12 4.0 3.8 4.6 3.4 4.1 4.7 3.5 3.3
PK-12 14.0 12.4 10.7 9.3 8.2 7.0 4.9 4.7
Study Area 128 Projection Date 10/2/2019
CURRENT PROJECTED RESIDENT STUDENTS
2019 2020 2021 2022 2023 2024 2025 2026
PK 1.0 1.0 0.9 0.9 0.9 0.9 0.9 0.9
K 8.0 7.8 7.5 7.0 6.4 7.0 6.8 6.7
1 5.0 7.9 7.7 7.4 7.0 6.3 6.9 6.7
2 7.0 4.8 7.5 7.3 7.0 6.6 6.0 6.6
3 5.0 6.7 4.5 7.1 6.9 6.7 6.3 5.7
4 4.0 4.8 6.5 4.4 6.9 6.7 6.5 6.1
5 2.0 3.8 4.6 6.1 4.2 6.6 6.4 6.2
6 8.0 1.8 3.3 4.1 5.4 3.7 5.8 5.6
7 8.0 7.7 1.7 3.2 3.9 5.2 3.5 5.6
8 4.0 7.9 7.6 1.7 3.2 3.9 5.1 3.5
9 6.0 4.0 7.8 7.5 1.7 3.1 3.8 5.1
10 2.0 5.5 3.6 7.2 6.9 1.5 2.9 3.5
11 6.0 1.8 4.9 3.2 6.3 6.1 1.3 2.5
12 7.0 6.0 1.8 4.9 3.2 6.3 6.1 1.3
PK-5 32.0 36.8 39.2 40.2 39.3 40.8 39.8 38.9
6-8 20.0 17.4 12.6 9.0 12.5 12.8 14.4 14.7
9-12 21.0 17.3 18.1 22.8 18.1 17.0 14.1 12.4
PK-12 73.0 71.5 69.9 72.0 69.9 70.6 68.3 66.0
Study Area 129 Projection Date 10/2/2019
CURRENT PROJECTED RESIDENT STUDENTS
2019 2020 2021 2022 2023 2024 2025 2026
PK 5.0 4.8 4.7 4.5 4.7 4.6 4.6 4.6
K 5.0 4.9 4.7 4.4 4.0 4.4 4.3 4.2
1 1.0 4.9 4.8 4.6 4.3 4.0 4.3 4.2
2 2.0 0.9 4.7 4.6 4.4 4.1 3.8 4.1
3 5.0 1.9 0.9 4.5 4.3 4.2 3.9 3.6
4 6.0 4.8 1.8 0.9 4.3 4.2 4.1 3.8
5 0.0 5.7 4.6 1.8 0.8 4.1 4.0 3.9
6 5.0 0.0 5.0 4.1 1.5 0.7 3.6 3.5
7 4.0 4.8 0.0 4.8 3.9 1.5 0.7 3.5
8 5.0 4.0 4.8 0.0 4.8 3.9 1.5 0.7
9 3.0 4.9 3.9 4.7 0.0 4.7 3.8 1.4
10 1.0 2.8 4.6 3.6 4.3 0.0 4.3 3.5
11 2.0 0.9 2.4 4.0 3.2 3.8 0.0 3.8
12 5.0 2.0 0.9 2.4 4.0 3.2 3.8 0.0
PK-5 24.0 27.9 26.2 25.3 26.8 29.6 29.0 28.4
6-8 14.0 8.8 9.8 8.9 10.2 6.1 5.8 7.7
9-12 11.0 10.6 11.8 14.7 11.5 11.7 11.9 8.7
PK-12 49.0 47.3 47.8 48.9 48.5 47.4 46.7 44.8
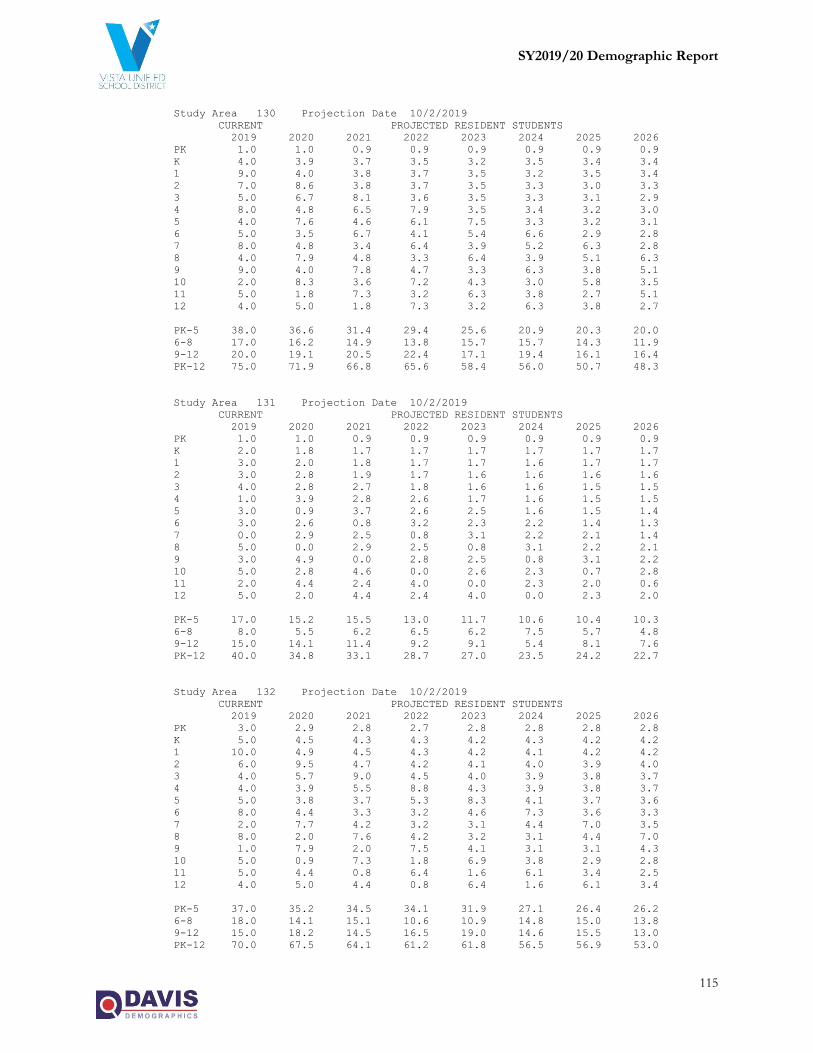
SY2019/20 Demographic Report
115
Study Area 130 Projection Date 10/2/2019
CURRENT PROJECTED RESIDENT STUDENTS
2019 2020 2021 2022 2023 2024 2025 2026
PK 1.0 1.0 0.9 0.9 0.9 0.9 0.9 0.9
K 4.0 3.9 3.7 3.5 3.2 3.5 3.4 3.4
1 9.0 4.0 3.8 3.7 3.5 3.2 3.5 3.4
2 7.0 8.6 3.8 3.7 3.5 3.3 3.0 3.3
3 5.0 6.7 8.1 3.6 3.5 3.3 3.1 2.9
4 8.0 4.8 6.5 7.9 3.5 3.4 3.2 3.0
5 4.0 7.6 4.6 6.1 7.5 3.3 3.2 3.1
6 5.0 3.5 6.7 4.1 5.4 6.6 2.9 2.8
7 8.0 4.8 3.4 6.4 3.9 5.2 6.3 2.8
8 4.0 7.9 4.8 3.3 6.4 3.9 5.1 6.3
9 9.0 4.0 7.8 4.7 3.3 6.3 3.8 5.1
10 2.0 8.3 3.6 7.2 4.3 3.0 5.8 3.5
11 5.0 1.8 7.3 3.2 6.3 3.8 2.7 5.1
12 4.0 5.0 1.8 7.3 3.2 6.3 3.8 2.7
PK-5 38.0 36.6 31.4 29.4 25.6 20.9 20.3 20.0
6-8 17.0 16.2 14.9 13.8 15.7 15.7 14.3 11.9
9-12 20.0 19.1 20.5 22.4 17.1 19.4 16.1 16.4
PK-12 75.0 71.9 66.8 65.6 58.4 56.0 50.7 48.3
Study Area 131 Projection Date 10/2/2019
CURRENT PROJECTED RESIDENT STUDENTS
2019 2020 2021 2022 2023 2024 2025 2026
PK 1.0 1.0 0.9 0.9 0.9 0.9 0.9 0.9
K 2.0 1.8 1.7 1.7 1.7 1.7 1.7 1.7
1 3.0 2.0 1.8 1.7 1.7 1.6 1.7 1.7
2 3.0 2.8 1.9 1.7 1.6 1.6 1.6 1.6
3 4.0 2.8 2.7 1.8 1.6 1.6 1.5 1.5
4 1.0 3.9 2.8 2.6 1.7 1.6 1.5 1.5
5 3.0 0.9 3.7 2.6 2.5 1.6 1.5 1.4
6 3.0 2.6 0.8 3.2 2.3 2.2 1.4 1.3
7 0.0 2.9 2.5 0.8 3.1 2.2 2.1 1.4
8 5.0 0.0 2.9 2.5 0.8 3.1 2.2 2.1
9 3.0 4.9 0.0 2.8 2.5 0.8 3.1 2.2
10 5.0 2.8 4.6 0.0 2.6 2.3 0.7 2.8
11 2.0 4.4 2.4 4.0 0.0 2.3 2.0 0.6
12 5.0 2.0 4.4 2.4 4.0 0.0 2.3 2.0
PK-5 17.0 15.2 15.5 13.0 11.7 10.6 10.4 10.3
6-8 8.0 5.5 6.2 6.5 6.2 7.5 5.7 4.8
9-12 15.0 14.1 11.4 9.2 9.1 5.4 8.1 7.6
PK-12 40.0 34.8 33.1 28.7 27.0 23.5 24.2 22.7
Study Area 132 Projection Date 10/2/2019
CURRENT PROJECTED RESIDENT STUDENTS
2019 2020 2021 2022 2023 2024 2025 2026
PK 3.0 2.9 2.8 2.7 2.8 2.8 2.8 2.8
K 5.0 4.5 4.3 4.3 4.2 4.3 4.2 4.2
1 10.0 4.9 4.5 4.3 4.2 4.1 4.2 4.2
2 6.0 9.5 4.7 4.2 4.1 4.0 3.9 4.0
3 4.0 5.7 9.0 4.5 4.0 3.9 3.8 3.7
4 4.0 3.9 5.5 8.8 4.3 3.9 3.8 3.7
5 5.0 3.8 3.7 5.3 8.3 4.1 3.7 3.6
6 8.0 4.4 3.3 3.2 4.6 7.3 3.6 3.3
7 2.0 7.7 4.2 3.2 3.1 4.4 7.0 3.5
8 8.0 2.0 7.6 4.2 3.2 3.1 4.4 7.0
9 1.0 7.9 2.0 7.5 4.1 3.1 3.1 4.3
10 5.0 0.9 7.3 1.8 6.9 3.8 2.9 2.8
11 5.0 4.4 0.8 6.4 1.6 6.1 3.4 2.5
12 4.0 5.0 4.4 0.8 6.4 1.6 6.1 3.4
PK-5 37.0 35.2 34.5 34.1 31.9 27.1 26.4 26.2
6-8 18.0 14.1 15.1 10.6 10.9 14.8 15.0 13.8
9-12 15.0 18.2 14.5 16.5 19.0 14.6 15.5 13.0
PK-12 70.0 67.5 64.1 61.2 61.8 56.5 56.9 53.0

SY2019/20 Demographic Report
116
Study Area 133 Projection Date 10/2/2019
CURRENT PROJECTED RESIDENT STUDENTS
2019 2020 2021 2022 2023 2024 2025 2026
PK 0.0 0.0 0.0 0.0 0.0 0.0 0.0 0.0
K 3.0 2.9 2.8 2.6 2.4 2.6 2.6 2.5
1 8.0 3.0 2.9 2.8 2.6 2.4 2.6 2.5
2 3.0 7.6 2.8 2.7 2.6 2.5 2.3 2.5
3 9.0 2.8 7.2 2.7 2.6 2.5 2.4 2.1
4 11.0 8.7 2.8 7.0 2.6 2.5 2.4 2.3
5 5.0 10.4 8.3 2.6 6.7 2.5 2.4 2.3
6 5.0 4.4 9.2 7.3 2.3 5.9 2.2 2.1
7 5.0 4.8 4.2 8.8 7.0 2.2 5.6 2.1
8 10.0 4.9 4.8 4.2 8.7 6.9 2.2 5.6
9 8.0 9.9 4.9 4.7 4.1 8.7 6.9 2.2
10 10.0 7.4 9.1 4.5 4.3 3.8 8.0 6.3
11 5.0 8.8 6.5 8.0 4.0 3.8 3.4 7.0
12 7.0 5.0 8.8 6.5 8.0 4.0 3.8 3.4
PK-5 39.0 35.4 26.8 20.4 19.5 15.0 14.7 14.2
6-8 20.0 14.1 18.2 20.3 18.0 15.0 10.0 9.8
9-12 30.0 31.1 29.3 23.7 20.4 20.3 22.1 18.9
PK-12 89.0 80.6 74.3 64.4 57.9 50.3 46.8 42.9
Study Area 134 Projection Date 10/2/2019
CURRENT PROJECTED RESIDENT STUDENTS
2019 2020 2021 2022 2023 2024 2025 2026
PK 1.0 1.0 0.9 0.9 0.9 0.9 0.9 0.9
K 4.0 3.9 3.7 3.5 3.2 3.5 3.4 3.4
1 5.0 4.0 3.8 3.7 3.5 3.2 3.5 3.4
2 8.0 4.8 3.8 3.7 3.5 3.3 3.0 3.3
3 3.0 7.6 4.5 3.6 3.5 3.3 3.1 2.9
4 7.0 2.9 7.4 4.4 3.5 3.4 3.2 3.0
5 3.0 6.7 2.8 7.0 4.2 3.3 3.2 3.1
6 8.0 2.6 5.9 2.4 6.2 3.7 2.9 2.8
7 7.0 7.7 2.5 5.6 2.3 5.9 3.5 2.8
8 9.0 6.9 7.6 2.5 5.6 2.3 5.9 3.5
9 2.0 8.9 6.9 7.5 2.5 5.5 2.3 5.8
10 8.0 1.8 8.2 6.3 6.9 2.3 5.1 2.1
11 3.0 7.0 1.6 7.2 5.6 6.1 2.0 4.5
12 1.0 3.0 7.0 1.6 7.2 5.6 6.1 2.0
PK-5 31.0 30.9 26.9 26.8 22.3 20.9 20.3 20.0
6-8 24.0 17.2 16.0 10.5 14.1 11.9 12.3 9.1
9-12 14.0 20.7 23.7 22.6 22.2 19.5 15.5 14.4
PK-12 69.0 68.8 66.6 59.9 58.6 52.3 48.1 43.5
Study Area 135 Projection Date 10/2/2019
CURRENT PROJECTED RESIDENT STUDENTS
2019 2020 2021 2022 2023 2024 2025 2026
PK 1.0 1.0 0.9 0.9 0.9 0.9 0.9 0.9
K 0.0 0.0 0.0 0.0 0.0 0.0 0.0 0.0
1 5.0 0.0 0.0 0.0 0.0 0.0 0.0 0.0
2 1.0 4.8 0.0 0.0 0.0 0.0 0.0 0.0
3 9.0 0.9 4.5 0.0 0.0 0.0 0.0 0.0
4 1.0 8.7 0.9 4.4 0.0 0.0 0.0 0.0
5 4.0 0.9 8.3 0.9 4.2 0.0 0.0 0.0
6 2.0 3.5 0.8 7.3 0.8 3.7 0.0 0.0
7 5.0 1.9 3.4 0.8 7.0 0.7 3.5 0.0
8 3.0 4.9 1.9 3.3 0.8 6.9 0.7 3.5
9 2.0 3.0 4.9 1.9 3.3 0.8 6.9 0.7
10 2.0 1.8 2.7 4.5 1.7 3.0 0.7 6.3
11 5.0 1.8 1.6 2.4 4.0 1.5 2.7 0.6
12 5.0 5.0 1.8 1.6 2.4 4.0 1.5 2.7
PK-5 21.0 16.3 14.6 6.2 5.1 0.9 0.9 0.9
6-8 10.0 10.3 6.1 11.4 8.6 11.3 4.2 3.5
9-12 14.0 11.6 11.0 10.4 11.4 9.3 11.8 10.3
PK-12 45.0 38.2 31.7 28.0 25.1 21.5 16.9 14.7
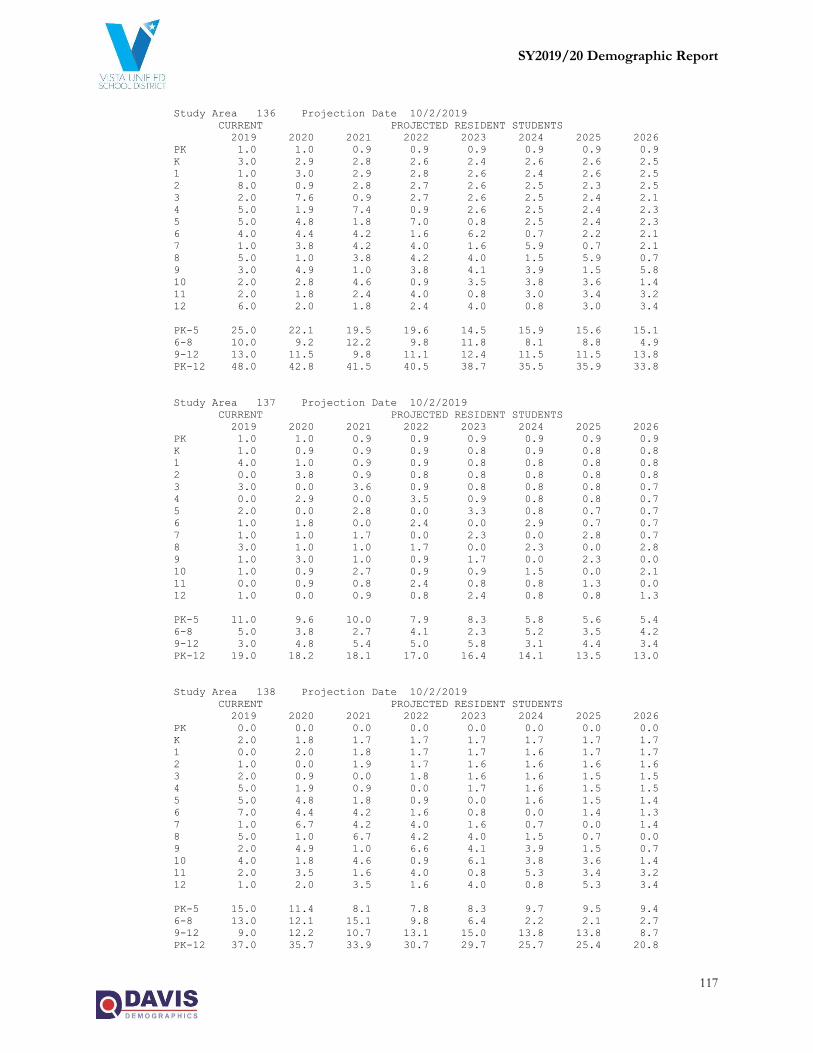
SY2019/20 Demographic Report
117
Study Area 136 Projection Date 10/2/2019
CURRENT PROJECTED RESIDENT STUDENTS
2019 2020 2021 2022 2023 2024 2025 2026
PK 1.0 1.0 0.9 0.9 0.9 0.9 0.9 0.9
K 3.0 2.9 2.8 2.6 2.4 2.6 2.6 2.5
1 1.0 3.0 2.9 2.8 2.6 2.4 2.6 2.5
2 8.0 0.9 2.8 2.7 2.6 2.5 2.3 2.5
3 2.0 7.6 0.9 2.7 2.6 2.5 2.4 2.1
4 5.0 1.9 7.4 0.9 2.6 2.5 2.4 2.3
5 5.0 4.8 1.8 7.0 0.8 2.5 2.4 2.3
6 4.0 4.4 4.2 1.6 6.2 0.7 2.2 2.1
7 1.0 3.8 4.2 4.0 1.6 5.9 0.7 2.1
8 5.0 1.0 3.8 4.2 4.0 1.5 5.9 0.7
9 3.0 4.9 1.0 3.8 4.1 3.9 1.5 5.8
10 2.0 2.8 4.6 0.9 3.5 3.8 3.6 1.4
11 2.0 1.8 2.4 4.0 0.8 3.0 3.4 3.2
12 6.0 2.0 1.8 2.4 4.0 0.8 3.0 3.4
PK-5 25.0 22.1 19.5 19.6 14.5 15.9 15.6 15.1
6-8 10.0 9.2 12.2 9.8 11.8 8.1 8.8 4.9
9-12 13.0 11.5 9.8 11.1 12.4 11.5 11.5 13.8
PK-12 48.0 42.8 41.5 40.5 38.7 35.5 35.9 33.8
Study Area 137 Projection Date 10/2/2019
CURRENT PROJECTED RESIDENT STUDENTS
2019 2020 2021 2022 2023 2024 2025 2026
PK 1.0 1.0 0.9 0.9 0.9 0.9 0.9 0.9
K 1.0 0.9 0.9 0.9 0.8 0.9 0.8 0.8
1 4.0 1.0 0.9 0.9 0.8 0.8 0.8 0.8
2 0.0 3.8 0.9 0.8 0.8 0.8 0.8 0.8
3 3.0 0.0 3.6 0.9 0.8 0.8 0.8 0.7
4 0.0 2.9 0.0 3.5 0.9 0.8 0.8 0.7
5 2.0 0.0 2.8 0.0 3.3 0.8 0.7 0.7
6 1.0 1.8 0.0 2.4 0.0 2.9 0.7 0.7
7 1.0 1.0 1.7 0.0 2.3 0.0 2.8 0.7
8 3.0 1.0 1.0 1.7 0.0 2.3 0.0 2.8
9 1.0 3.0 1.0 0.9 1.7 0.0 2.3 0.0
10 1.0 0.9 2.7 0.9 0.9 1.5 0.0 2.1
11 0.0 0.9 0.8 2.4 0.8 0.8 1.3 0.0
12 1.0 0.0 0.9 0.8 2.4 0.8 0.8 1.3
PK-5 11.0 9.6 10.0 7.9 8.3 5.8 5.6 5.4
6-8 5.0 3.8 2.7 4.1 2.3 5.2 3.5 4.2
9-12 3.0 4.8 5.4 5.0 5.8 3.1 4.4 3.4
PK-12 19.0 18.2 18.1 17.0 16.4 14.1 13.5 13.0
Study Area 138 Projection Date 10/2/2019
CURRENT PROJECTED RESIDENT STUDENTS
2019 2020 2021 2022 2023 2024 2025 2026
PK 0.0 0.0 0.0 0.0 0.0 0.0 0.0 0.0
K 2.0 1.8 1.7 1.7 1.7 1.7 1.7 1.7
1 0.0 2.0 1.8 1.7 1.7 1.6 1.7 1.7
2 1.0 0.0 1.9 1.7 1.6 1.6 1.6 1.6
3 2.0 0.9 0.0 1.8 1.6 1.6 1.5 1.5
4 5.0 1.9 0.9 0.0 1.7 1.6 1.5 1.5
5 5.0 4.8 1.8 0.9 0.0 1.6 1.5 1.4
6 7.0 4.4 4.2 1.6 0.8 0.0 1.4 1.3
7 1.0 6.7 4.2 4.0 1.6 0.7 0.0 1.4
8 5.0 1.0 6.7 4.2 4.0 1.5 0.7 0.0
9 2.0 4.9 1.0 6.6 4.1 3.9 1.5 0.7
10 4.0 1.8 4.6 0.9 6.1 3.8 3.6 1.4
11 2.0 3.5 1.6 4.0 0.8 5.3 3.4 3.2
12 1.0 2.0 3.5 1.6 4.0 0.8 5.3 3.4
PK-5 15.0 11.4 8.1 7.8 8.3 9.7 9.5 9.4
6-8 13.0 12.1 15.1 9.8 6.4 2.2 2.1 2.7
9-12 9.0 12.2 10.7 13.1 15.0 13.8 13.8 8.7
PK-12 37.0 35.7 33.9 30.7 29.7 25.7 25.4 20.8

SY2019/20 Demographic Report
118
Study Area 139 Projection Date 10/2/2019
CURRENT PROJECTED RESIDENT STUDENTS
2019 2020 2021 2022 2023 2024 2025 2026
PK 1.0 1.0 0.9 0.9 0.9 0.9 0.9 0.9
K 2.0 1.8 1.7 1.7 1.7 1.7 1.7 1.7
1 2.0 2.0 1.8 1.7 1.7 1.6 1.7 1.7
2 4.0 1.9 1.9 1.7 1.6 1.6 1.6 1.6
3 6.0 3.8 1.8 1.8 1.6 1.6 1.5 1.5
4 0.0 5.8 3.7 1.8 1.7 1.6 1.5 1.5
5 4.0 0.0 5.5 3.5 1.7 1.6 1.5 1.4
6 2.0 3.5 0.0 4.9 3.1 1.5 1.4 1.3
7 2.0 1.9 3.4 0.0 4.7 3.0 1.4 1.4
8 1.0 2.0 1.9 3.3 0.0 4.6 2.9 1.4
9 0.0 1.0 2.0 1.9 3.3 0.0 4.6 2.9
10 0.0 0.0 0.9 1.8 1.7 3.0 0.0 4.2
11 2.0 0.0 0.0 0.8 1.6 1.5 2.7 0.0
12 0.0 2.0 0.0 0.0 0.8 1.6 1.5 2.7
PK-5 19.0 16.3 17.3 13.1 10.9 10.6 10.4 10.3
6-8 5.0 7.4 5.3 8.2 7.8 9.1 5.7 4.1
9-12 2.0 3.0 2.9 4.5 7.4 6.1 8.8 9.8
PK-12 26.0 26.7 25.5 25.8 26.1 25.8 24.9 24.2
Study Area 140 Projection Date 10/2/2019
CURRENT PROJECTED RESIDENT STUDENTS
2019 2020 2021 2022 2023 2024 2025 2026
PK 4.0 3.8 3.8 3.6 3.7 3.7 3.7 3.7
K 3.0 2.7 2.6 2.6 2.5 2.6 2.5 2.5
1 7.0 3.0 2.7 2.6 2.5 2.5 2.5 2.5
2 6.0 6.7 2.8 2.5 2.4 2.4 2.4 2.4
3 9.0 5.7 6.3 2.7 2.4 2.3 2.3 2.2
4 3.0 8.7 5.5 6.1 2.6 2.3 2.3 2.2
5 10.0 2.8 8.3 5.3 5.8 2.5 2.2 2.1
6 1.0 8.8 2.5 7.3 4.6 5.1 2.2 2.0
7 10.0 1.0 8.4 2.4 7.0 4.4 4.9 2.1
8 6.0 9.9 1.0 8.4 2.4 6.9 4.4 4.9
9 16.0 5.9 9.8 0.9 8.3 2.4 6.9 4.3
10 8.0 14.7 5.5 9.0 0.9 7.6 2.2 6.3
11 8.0 7.0 13.0 4.8 7.9 0.8 6.7 1.9
12 6.0 8.0 7.0 13.0 4.8 7.9 0.8 6.7
PK-5 42.0 33.4 32.0 25.4 21.9 18.3 17.9 17.6
6-8 17.0 19.7 11.9 18.1 14.0 16.4 11.5 9.0
9-12 38.0 35.6 35.3 27.7 21.9 18.7 16.6 19.2
PK-12 97.0 88.7 79.2 71.2 57.8 53.4 46.0 45.8
Study Area 141 Projection Date 10/2/2019
CURRENT PROJECTED RESIDENT STUDENTS
2019 2020 2021 2022 2023 2024 2025 2026
PK 1.0 1.0 0.9 0.9 0.9 0.9 0.9 0.9
K 8.0 7.2 6.9 6.9 6.7 6.8 6.8 6.8
1 10.0 7.9 7.1 6.9 6.8 6.6 6.8 6.7
2 6.0 9.5 7.5 6.8 6.5 6.5 6.3 6.4
3 5.0 5.7 9.0 7.1 6.4 6.2 6.1 6.0
4 5.0 4.8 5.5 8.8 6.9 6.3 6.0 6.0
5 2.0 4.8 4.6 5.3 8.3 6.6 5.9 5.7
6 3.0 1.8 4.2 4.1 4.6 7.3 5.8 5.2
7 4.0 2.9 1.7 4.0 3.9 4.4 7.0 5.6
8 3.0 4.0 2.9 1.7 4.0 3.9 4.4 7.0
9 3.0 3.0 3.9 2.8 1.7 3.9 3.8 4.3
10 8.0 2.8 2.7 3.6 2.6 1.5 3.6 3.5
11 1.0 7.0 2.4 2.4 3.2 2.3 1.3 3.2
12 6.0 1.0 7.0 2.4 2.4 3.2 2.3 1.3
PK-5 37.0 40.9 41.5 42.7 42.5 39.9 38.8 38.5
6-8 10.0 8.7 8.8 9.8 12.5 15.6 17.2 17.8
9-12 18.0 13.8 16.0 11.2 9.9 10.9 11.0 12.3
PK-12 65.0 63.4 66.3 63.7 64.9 66.4 67.0 68.6

SY2019/20 Demographic Report
119
Study Area 142 Projection Date 10/2/2019
CURRENT PROJECTED RESIDENT STUDENTS
2019 2020 2021 2022 2023 2024 2025 2026
PK 1.0 1.0 0.9 0.9 0.9 0.9 0.9 0.9
K 5.0 4.9 4.7 4.4 4.0 4.4 4.3 4.2
1 5.0 4.9 4.8 4.6 4.3 4.0 4.3 4.2
2 3.0 4.8 4.7 4.6 4.4 4.1 3.8 4.1
3 4.0 2.8 4.5 4.5 4.3 4.2 3.9 3.6
4 4.0 3.9 2.8 4.4 4.3 4.2 4.1 3.8
5 2.0 3.8 3.7 2.6 4.2 4.1 4.0 3.9
6 6.0 1.8 3.3 3.2 2.3 3.7 3.6 3.5
7 6.0 5.8 1.7 3.2 3.1 2.2 3.5 3.5
8 5.0 5.9 5.7 1.7 3.2 3.1 2.2 3.5
9 3.0 4.9 5.9 5.6 1.7 3.1 3.1 2.2
10 7.0 2.8 4.6 5.4 5.2 1.5 2.9 2.8
11 3.0 6.2 2.4 4.0 4.8 4.6 1.3 2.5
12 3.0 3.0 6.2 2.4 4.0 4.8 4.6 1.3
PK-5 24.0 26.1 26.1 26.0 26.4 25.9 25.3 24.7
6-8 17.0 13.5 10.7 8.1 8.6 9.0 9.3 10.5
9-12 16.0 16.9 19.1 17.4 15.7 14.0 11.9 8.8
PK-12 57.0 56.5 55.9 51.5 50.7 48.9 46.5 44.0
Study Area 143 Projection Date 10/2/2019
CURRENT PROJECTED RESIDENT STUDENTS
2019 2020 2021 2022 2023 2024 2025 2026
PK 0.0 0.0 0.0 0.0 0.0 0.0 0.0 0.0
K 5.0 4.5 4.3 4.3 4.2 4.3 4.2 4.2
1 3.0 4.9 4.5 4.3 4.2 4.1 4.2 4.2
2 7.0 2.8 4.7 4.2 4.1 4.0 3.9 4.0
3 3.0 6.7 2.7 4.5 4.0 3.9 3.8 3.7
4 5.0 2.9 6.5 2.6 4.3 3.9 3.8 3.7
5 1.0 4.8 2.8 6.1 2.5 4.1 3.7 3.6
6 6.0 0.9 4.2 2.4 5.4 2.2 3.6 3.3
7 7.0 5.8 0.8 4.0 2.3 5.2 2.1 3.5
8 8.0 6.9 5.7 0.8 4.0 2.3 5.1 2.1
9 4.0 7.9 6.9 5.6 0.8 3.9 2.3 5.1
10 5.0 3.7 7.3 6.3 5.2 0.8 3.6 2.1
11 2.0 4.4 3.2 6.4 5.6 4.6 0.7 3.2
12 2.0 2.0 4.4 3.2 6.4 5.6 4.6 0.7
PK-5 24.0 26.6 25.5 26.0 23.3 24.3 23.6 23.4
6-8 21.0 13.6 10.7 7.2 11.7 9.7 10.8 8.9
9-12 13.0 18.0 21.8 21.5 18.0 14.9 11.2 11.1
PK-12 58.0 58.2 58.0 54.7 53.0 48.9 45.6 43.4
Study Area 144 Projection Date 10/2/2019
CURRENT PROJECTED RESIDENT STUDENTS
2019 2020 2021 2022 2023 2024 2025 2026
PK 0.0 0.0 0.0 0.0 0.0 0.0 0.0 0.0
K 5.0 4.5 4.3 4.3 4.2 4.3 4.2 4.2
1 3.0 4.9 4.5 4.3 4.2 4.1 4.2 4.2
2 5.0 2.8 4.7 4.2 4.1 4.0 3.9 4.0
3 3.0 4.8 2.7 4.5 4.0 3.9 3.8 3.7
4 2.0 2.9 4.6 2.6 4.3 3.9 3.8 3.7
5 4.0 1.9 2.8 4.4 2.5 4.1 3.7 3.6
6 1.0 3.5 1.7 2.4 3.9 2.2 3.6 3.3
7 4.0 1.0 3.4 1.6 2.3 3.7 2.1 3.5
8 5.0 4.0 1.0 3.3 1.6 2.3 3.7 2.1
9 3.0 4.9 3.9 0.9 3.3 1.6 2.3 3.6
10 2.0 2.8 4.6 3.6 0.9 3.0 1.4 2.1
11 4.0 1.8 2.4 4.0 3.2 0.8 2.7 1.3
12 6.0 4.0 1.8 2.4 4.0 3.2 0.8 2.7
PK-5 22.0 21.8 23.6 24.3 23.3 24.3 23.6 23.4
6-8 10.0 8.5 6.1 7.3 7.8 8.2 9.4 8.9
9-12 15.0 13.5 12.7 10.9 11.4 8.6 7.2 9.7
PK-12 47.0 43.8 42.4 42.5 42.5 41.1 40.2 42.0

SY2019/20 Demographic Report
120
Study Area 145 Projection Date 10/2/2019
CURRENT PROJECTED RESIDENT STUDENTS
2019 2020 2021 2022 2023 2024 2025 2026
PK 0.0 0.0 0.0 0.0 0.0 0.0 0.0 0.0
K 2.0 1.8 1.7 1.7 1.7 1.7 1.7 1.7
1 0.0 2.0 1.8 1.7 1.7 1.6 1.7 1.7
2 2.0 0.0 1.9 1.7 1.6 1.6 1.6 1.6
3 0.0 1.9 0.0 1.8 1.6 1.6 1.5 1.5
4 2.0 0.0 1.8 0.0 1.7 1.6 1.5 1.5
5 1.0 1.9 0.0 1.8 0.0 1.6 1.5 1.4
6 2.0 0.9 1.7 0.0 1.5 0.0 1.4 1.3
7 0.0 1.9 0.8 1.6 0.0 1.5 0.0 1.4
8 0.0 0.0 1.9 0.8 1.6 0.0 1.5 0.0
9 0.0 0.0 0.0 1.9 0.8 1.6 0.0 1.4
10 0.0 0.0 0.0 0.0 1.7 0.8 1.4 0.0
11 0.0 0.0 0.0 0.0 0.0 1.5 0.7 1.3
12 0.0 0.0 0.0 0.0 0.0 0.0 1.5 0.7
PK-5 7.0 7.6 7.2 8.7 8.3 9.7 9.5 9.4
6-8 2.0 2.8 4.4 2.4 3.1 1.5 2.9 2.7
9-12 0.0 0.0 0.0 1.9 2.5 3.9 3.6 3.4
PK-12 9.0 10.4 11.6 13.0 13.9 15.1 16.0 15.5
Study Area 146 Projection Date 10/2/2019
CURRENT PROJECTED RESIDENT STUDENTS
2019 2020 2021 2022 2023 2024 2025 2026
PK 0.0 0.0 0.0 0.0 0.0 0.0 0.0 0.0
K 0.0 0.0 0.0 0.0 0.0 0.0 0.0 0.0
1 0.0 0.0 0.0 0.0 0.0 0.0 0.0 0.0
2 0.0 0.0 0.0 0.0 0.0 0.0 0.0 0.0
3 0.0 0.0 0.0 0.0 0.0 0.0 0.0 0.0
4 0.0 0.0 0.0 0.0 0.0 0.0 0.0 0.0
5 0.0 0.0 0.0 0.0 0.0 0.0 0.0 0.0
6 0.0 0.0 0.0 0.0 0.0 0.0 0.0 0.0
7 0.0 0.0 0.0 0.0 0.0 0.0 0.0 0.0
8 0.0 0.0 0.0 0.0 0.0 0.0 0.0 0.0
9 0.0 0.0 0.0 0.0 0.0 0.0 0.0 0.0
10 0.0 0.0 0.0 0.0 0.0 0.0 0.0 0.0
11 1.0 0.0 0.0 0.0 0.0 0.0 0.0 0.0
12 0.0 1.0 0.0 0.0 0.0 0.0 0.0 0.0
PK-5 0.0 0.0 0.0 0.0 0.0 0.0 0.0 0.0
6-8 0.0 0.0 0.0 0.0 0.0 0.0 0.0 0.0
9-12 1.0 1.0 0.0 0.0 0.0 0.0 0.0 0.0
PK-12 1.0 1.0 0.0 0.0 0.0 0.0 0.0 0.0
Study Area 147 Projection Date 10/2/2019
CURRENT PROJECTED RESIDENT STUDENTS
2019 2020 2021 2022 2023 2024 2025 2026
PK 1.0 1.0 0.9 0.9 0.9 0.9 0.9 0.9
K 7.0 7.5 7.5 7.3 7.3 7.4 7.4 7.4
1 3.0 6.5 7.0 6.9 6.8 6.8 6.9 6.8
2 4.0 2.8 6.1 6.6 6.5 6.4 6.4 6.5
3 3.0 3.8 2.7 5.8 6.3 6.2 6.1 6.1
4 5.0 2.9 3.6 2.6 5.6 6.0 6.0 5.9
5 5.0 5.0 2.9 3.6 2.6 5.6 6.0 6.0
6 6.0 4.9 4.9 2.8 3.6 2.5 5.5 5.9
7 7.0 6.2 5.0 5.0 2.9 3.7 2.6 5.6
8 6.0 6.4 5.7 4.6 4.6 2.7 3.4 2.4
9 2.0 6.1 6.5 5.7 4.7 4.7 2.7 3.4
10 3.0 1.9 5.6 6.0 5.3 4.4 4.4 2.5
11 10.0 2.9 1.8 5.5 5.9 5.2 4.2 4.2
12 6.0 9.7 2.8 1.8 5.3 5.7 5.0 4.1
PK-5 28.0 29.5 30.7 33.7 36.0 39.3 39.7 39.6
6-8 19.0 17.5 15.6 12.4 11.1 8.9 11.5 13.9
9-12 21.0 20.6 16.7 19.0 21.2 20.0 16.3 14.2
PK-12 68.0 67.6 63.0 65.1 68.3 68.2 67.5 67.7
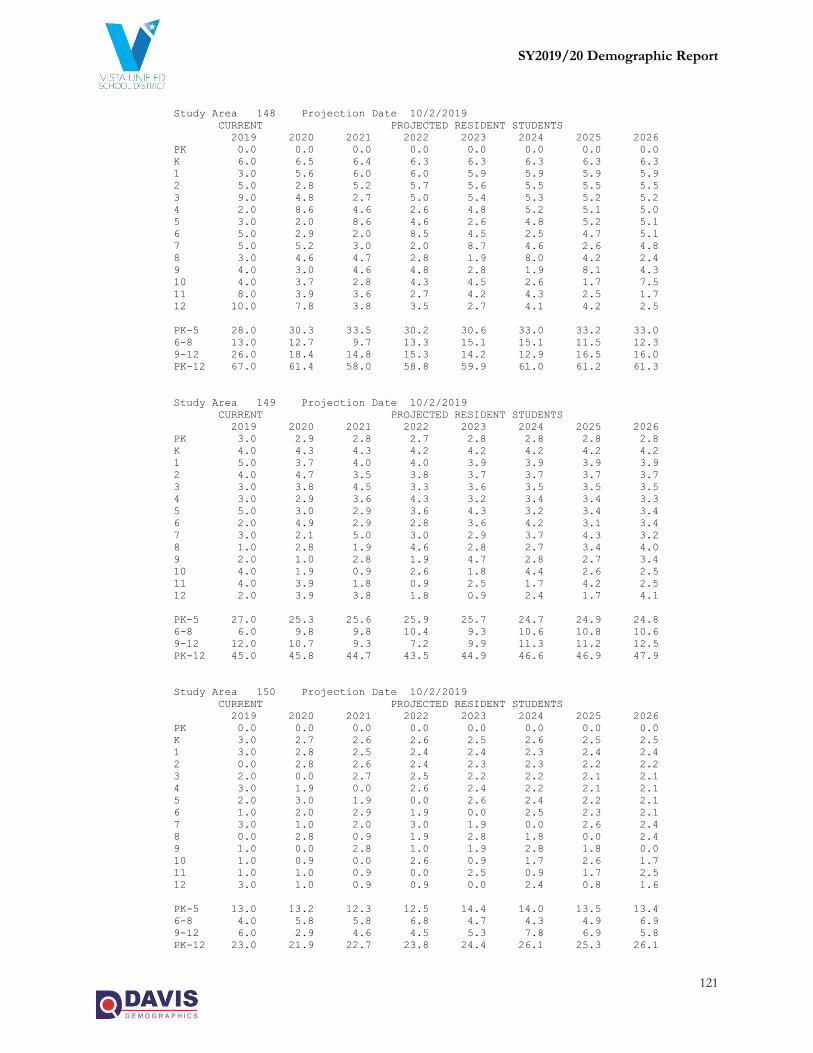
SY2019/20 Demographic Report
121
Study Area 148 Projection Date 10/2/2019
CURRENT PROJECTED RESIDENT STUDENTS
2019 2020 2021 2022 2023 2024 2025 2026
PK 0.0 0.0 0.0 0.0 0.0 0.0 0.0 0.0
K 6.0 6.5 6.4 6.3 6.3 6.3 6.3 6.3
1 3.0 5.6 6.0 6.0 5.9 5.9 5.9 5.9
2 5.0 2.8 5.2 5.7 5.6 5.5 5.5 5.5
3 9.0 4.8 2.7 5.0 5.4 5.3 5.2 5.2
4 2.0 8.6 4.6 2.6 4.8 5.2 5.1 5.0
5 3.0 2.0 8.6 4.6 2.6 4.8 5.2 5.1
6 5.0 2.9 2.0 8.5 4.5 2.5 4.7 5.1
7 5.0 5.2 3.0 2.0 8.7 4.6 2.6 4.8
8 3.0 4.6 4.7 2.8 1.9 8.0 4.2 2.4
9 4.0 3.0 4.6 4.8 2.8 1.9 8.1 4.3
10 4.0 3.7 2.8 4.3 4.5 2.6 1.7 7.5
11 8.0 3.9 3.6 2.7 4.2 4.3 2.5 1.7
12 10.0 7.8 3.8 3.5 2.7 4.1 4.2 2.5
PK-5 28.0 30.3 33.5 30.2 30.6 33.0 33.2 33.0
6-8 13.0 12.7 9.7 13.3 15.1 15.1 11.5 12.3
9-12 26.0 18.4 14.8 15.3 14.2 12.9 16.5 16.0
PK-12 67.0 61.4 58.0 58.8 59.9 61.0 61.2 61.3
Study Area 149 Projection Date 10/2/2019
CURRENT PROJECTED RESIDENT STUDENTS
2019 2020 2021 2022 2023 2024 2025 2026
PK 3.0 2.9 2.8 2.7 2.8 2.8 2.8 2.8
K 4.0 4.3 4.3 4.2 4.2 4.2 4.2 4.2
1 5.0 3.7 4.0 4.0 3.9 3.9 3.9 3.9
2 4.0 4.7 3.5 3.8 3.7 3.7 3.7 3.7
3 3.0 3.8 4.5 3.3 3.6 3.5 3.5 3.5
4 3.0 2.9 3.6 4.3 3.2 3.4 3.4 3.3
5 5.0 3.0 2.9 3.6 4.3 3.2 3.4 3.4
6 2.0 4.9 2.9 2.8 3.6 4.2 3.1 3.4
7 3.0 2.1 5.0 3.0 2.9 3.7 4.3 3.2
8 1.0 2.8 1.9 4.6 2.8 2.7 3.4 4.0
9 2.0 1.0 2.8 1.9 4.7 2.8 2.7 3.4
10 4.0 1.9 0.9 2.6 1.8 4.4 2.6 2.5
11 4.0 3.9 1.8 0.9 2.5 1.7 4.2 2.5
12 2.0 3.9 3.8 1.8 0.9 2.4 1.7 4.1
PK-5 27.0 25.3 25.6 25.9 25.7 24.7 24.9 24.8
6-8 6.0 9.8 9.8 10.4 9.3 10.6 10.8 10.6
9-12 12.0 10.7 9.3 7.2 9.9 11.3 11.2 12.5
PK-12 45.0 45.8 44.7 43.5 44.9 46.6 46.9 47.9
Study Area 150 Projection Date 10/2/2019
CURRENT PROJECTED RESIDENT STUDENTS
2019 2020 2021 2022 2023 2024 2025 2026
PK 0.0 0.0 0.0 0.0 0.0 0.0 0.0 0.0
K 3.0 2.7 2.6 2.6 2.5 2.6 2.5 2.5
1 3.0 2.8 2.5 2.4 2.4 2.3 2.4 2.4
2 0.0 2.8 2.6 2.4 2.3 2.3 2.2 2.2
3 2.0 0.0 2.7 2.5 2.2 2.2 2.1 2.1
4 3.0 1.9 0.0 2.6 2.4 2.2 2.1 2.1
5 2.0 3.0 1.9 0.0 2.6 2.4 2.2 2.1
6 1.0 2.0 2.9 1.9 0.0 2.5 2.3 2.1
7 3.0 1.0 2.0 3.0 1.9 0.0 2.6 2.4
8 0.0 2.8 0.9 1.9 2.8 1.8 0.0 2.4
9 1.0 0.0 2.8 1.0 1.9 2.8 1.8 0.0
10 1.0 0.9 0.0 2.6 0.9 1.7 2.6 1.7
11 1.0 1.0 0.9 0.0 2.5 0.9 1.7 2.5
12 3.0 1.0 0.9 0.9 0.0 2.4 0.8 1.6
PK-5 13.0 13.2 12.3 12.5 14.4 14.0 13.5 13.4
6-8 4.0 5.8 5.8 6.8 4.7 4.3 4.9 6.9
9-12 6.0 2.9 4.6 4.5 5.3 7.8 6.9 5.8
PK-12 23.0 21.9 22.7 23.8 24.4 26.1 25.3 26.1
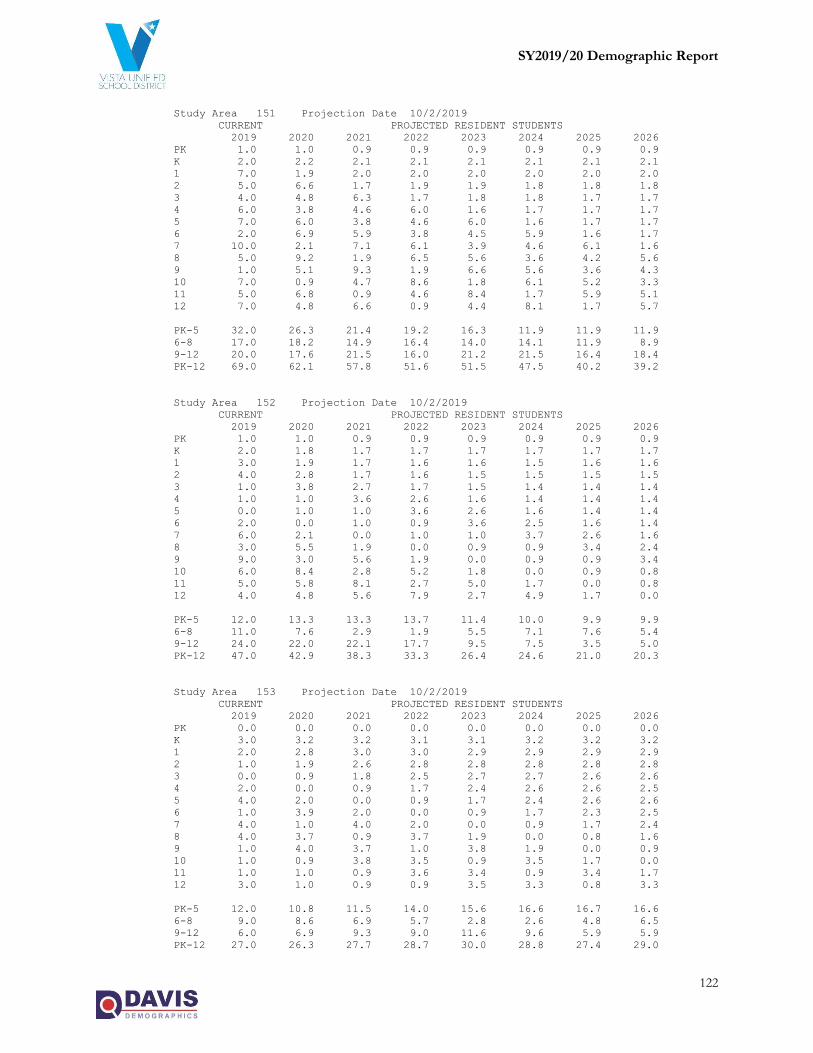
SY2019/20 Demographic Report
122
Study Area 151 Projection Date 10/2/2019
CURRENT PROJECTED RESIDENT STUDENTS
2019 2020 2021 2022 2023 2024 2025 2026
PK 1.0 1.0 0.9 0.9 0.9 0.9 0.9 0.9
K 2.0 2.2 2.1 2.1 2.1 2.1 2.1 2.1
1 7.0 1.9 2.0 2.0 2.0 2.0 2.0 2.0
2 5.0 6.6 1.7 1.9 1.9 1.8 1.8 1.8
3 4.0 4.8 6.3 1.7 1.8 1.8 1.7 1.7
4 6.0 3.8 4.6 6.0 1.6 1.7 1.7 1.7
5 7.0 6.0 3.8 4.6 6.0 1.6 1.7 1.7
6 2.0 6.9 5.9 3.8 4.5 5.9 1.6 1.7
7 10.0 2.1 7.1 6.1 3.9 4.6 6.1 1.6
8 5.0 9.2 1.9 6.5 5.6 3.6 4.2 5.6
9 1.0 5.1 9.3 1.9 6.6 5.6 3.6 4.3
10 7.0 0.9 4.7 8.6 1.8 6.1 5.2 3.3
11 5.0 6.8 0.9 4.6 8.4 1.7 5.9 5.1
12 7.0 4.8 6.6 0.9 4.4 8.1 1.7 5.7
PK-5 32.0 26.3 21.4 19.2 16.3 11.9 11.9 11.9
6-8 17.0 18.2 14.9 16.4 14.0 14.1 11.9 8.9
9-12 20.0 17.6 21.5 16.0 21.2 21.5 16.4 18.4
PK-12 69.0 62.1 57.8 51.6 51.5 47.5 40.2 39.2
Study Area 152 Projection Date 10/2/2019
CURRENT PROJECTED RESIDENT STUDENTS
2019 2020 2021 2022 2023 2024 2025 2026
PK 1.0 1.0 0.9 0.9 0.9 0.9 0.9 0.9
K 2.0 1.8 1.7 1.7 1.7 1.7 1.7 1.7
1 3.0 1.9 1.7 1.6 1.6 1.5 1.6 1.6
2 4.0 2.8 1.7 1.6 1.5 1.5 1.5 1.5
3 1.0 3.8 2.7 1.7 1.5 1.4 1.4 1.4
4 1.0 1.0 3.6 2.6 1.6 1.4 1.4 1.4
5 0.0 1.0 1.0 3.6 2.6 1.6 1.4 1.4
6 2.0 0.0 1.0 0.9 3.6 2.5 1.6 1.4
7 6.0 2.1 0.0 1.0 1.0 3.7 2.6 1.6
8 3.0 5.5 1.9 0.0 0.9 0.9 3.4 2.4
9 9.0 3.0 5.6 1.9 0.0 0.9 0.9 3.4
10 6.0 8.4 2.8 5.2 1.8 0.0 0.9 0.8
11 5.0 5.8 8.1 2.7 5.0 1.7 0.0 0.8
12 4.0 4.8 5.6 7.9 2.7 4.9 1.7 0.0
PK-5 12.0 13.3 13.3 13.7 11.4 10.0 9.9 9.9
6-8 11.0 7.6 2.9 1.9 5.5 7.1 7.6 5.4
9-12 24.0 22.0 22.1 17.7 9.5 7.5 3.5 5.0
PK-12 47.0 42.9 38.3 33.3 26.4 24.6 21.0 20.3
Study Area 153 Projection Date 10/2/2019
CURRENT PROJECTED RESIDENT STUDENTS
2019 2020 2021 2022 2023 2024 2025 2026
PK 0.0 0.0 0.0 0.0 0.0 0.0 0.0 0.0
K 3.0 3.2 3.2 3.1 3.1 3.2 3.2 3.2
1 2.0 2.8 3.0 3.0 2.9 2.9 2.9 2.9
2 1.0 1.9 2.6 2.8 2.8 2.8 2.8 2.8
3 0.0 0.9 1.8 2.5 2.7 2.7 2.6 2.6
4 2.0 0.0 0.9 1.7 2.4 2.6 2.6 2.5
5 4.0 2.0 0.0 0.9 1.7 2.4 2.6 2.6
6 1.0 3.9 2.0 0.0 0.9 1.7 2.3 2.5
7 4.0 1.0 4.0 2.0 0.0 0.9 1.7 2.4
8 4.0 3.7 0.9 3.7 1.9 0.0 0.8 1.6
9 1.0 4.0 3.7 1.0 3.8 1.9 0.0 0.9
10 1.0 0.9 3.8 3.5 0.9 3.5 1.7 0.0
11 1.0 1.0 0.9 3.6 3.4 0.9 3.4 1.7
12 3.0 1.0 0.9 0.9 3.5 3.3 0.8 3.3
PK-5 12.0 10.8 11.5 14.0 15.6 16.6 16.7 16.6
6-8 9.0 8.6 6.9 5.7 2.8 2.6 4.8 6.5
9-12 6.0 6.9 9.3 9.0 11.6 9.6 5.9 5.9
PK-12 27.0 26.3 27.7 28.7 30.0 28.8 27.4 29.0

SY2019/20 Demographic Report
123
Study Area 154 Projection Date 10/2/2019
CURRENT PROJECTED RESIDENT STUDENTS
2019 2020 2021 2022 2023 2024 2025 2026
PK 1.0 1.0 0.9 0.9 0.9 0.9 0.9 0.9
K 0.0 0.0 0.0 0.0 0.0 0.0 0.0 0.0
1 2.0 0.0 0.0 0.0 0.0 0.0 0.0 0.0
2 5.0 1.9 0.0 0.0 0.0 0.0 0.0 0.0
3 1.0 4.8 1.8 0.0 0.0 0.0 0.0 0.0
4 5.0 1.0 4.6 1.7 0.0 0.0 0.0 0.0
5 4.0 5.0 1.0 4.6 1.7 0.0 0.0 0.0
6 1.0 3.9 4.9 0.9 4.5 1.7 0.0 0.0
7 3.0 1.0 4.0 5.0 1.0 4.6 1.7 0.0
8 3.0 2.8 0.9 3.7 4.6 0.9 4.2 1.6
9 6.0 3.0 2.8 1.0 3.8 4.7 0.9 4.3
10 4.0 5.6 2.8 2.6 0.9 3.5 4.4 0.8
11 3.0 3.9 5.4 2.7 2.5 0.9 3.4 4.2
12 3.0 2.9 3.8 5.3 2.7 2.4 0.8 3.3
PK-5 18.0 13.7 8.3 7.2 2.6 0.9 0.9 0.9
6-8 7.0 7.7 9.8 9.6 10.1 7.2 5.9 1.6
9-12 16.0 15.4 14.8 11.6 9.9 11.5 9.5 12.6
PK-12 41.0 36.8 32.9 28.4 22.6 19.6 16.3 15.1
Study Area 155 Projection Date 10/2/2019
CURRENT PROJECTED RESIDENT STUDENTS
2019 2020 2021 2022 2023 2024 2025 2026
PK 0.0 0.0 0.0 0.0 0.0 0.0 0.0 0.0
K 2.0 1.8 1.7 1.7 1.7 1.7 1.7 1.7
1 5.0 1.9 1.7 1.6 1.6 1.5 1.6 1.6
2 2.0 4.7 1.7 1.6 1.5 1.5 1.5 1.5
3 1.0 1.9 4.5 1.7 1.5 1.4 1.4 1.4
4 3.0 1.0 1.8 4.3 1.6 1.4 1.4 1.4
5 6.0 3.0 1.0 1.8 4.3 1.6 1.4 1.4
6 2.0 5.9 2.9 0.9 1.8 4.2 1.6 1.4
7 1.0 2.1 6.1 3.0 1.0 1.8 4.3 1.6
8 3.0 0.9 1.9 5.6 2.8 0.9 1.7 4.0
9 3.0 3.0 0.9 1.9 5.6 2.8 0.9 1.7
10 2.0 2.8 2.8 0.9 1.8 5.2 2.6 0.8
11 1.0 1.9 2.7 2.7 0.8 1.7 5.1 2.5
12 1.0 1.0 1.9 2.6 2.7 0.8 1.7 4.9
PK-5 19.0 14.3 12.4 12.7 12.2 9.1 9.0 9.0
6-8 6.0 8.9 10.9 9.5 5.6 6.9 7.6 7.0
9-12 7.0 8.7 8.3 8.1 10.9 10.5 10.3 9.9
PK-12 32.0 31.9 31.6 30.3 28.7 26.5 26.9 25.9
Study Area 156 Projection Date 10/2/2019
CURRENT PROJECTED RESIDENT STUDENTS
2019 2020 2021 2022 2023 2024 2025 2026
PK 2.0 1.9 1.9 1.8 1.9 1.8 1.8 1.8
K 0.0 0.0 0.0 0.0 0.0 0.0 0.0 0.0
1 2.0 0.0 0.0 0.0 0.0 0.0 0.0 0.0
2 3.0 1.9 0.0 0.0 0.0 0.0 0.0 0.0
3 0.0 2.8 1.8 0.0 0.0 0.0 0.0 0.0
4 2.0 0.0 2.7 1.7 0.0 0.0 0.0 0.0
5 0.0 2.0 0.0 2.7 1.7 0.0 0.0 0.0
6 3.0 0.0 2.0 0.0 2.7 1.7 0.0 0.0
7 1.0 3.1 0.0 2.0 0.0 2.8 1.7 0.0
8 3.0 0.9 2.8 0.0 1.9 0.0 2.5 1.6
9 2.0 3.0 0.9 2.9 0.0 1.9 0.0 2.6
10 7.0 1.9 2.8 0.9 2.7 0.0 1.7 0.0
11 2.0 6.8 1.8 2.7 0.8 2.6 0.0 1.7
12 2.0 1.9 6.6 1.8 2.7 0.8 2.5 0.0
PK-5 9.0 8.6 6.4 6.2 3.6 1.8 1.8 1.8
6-8 7.0 4.0 4.8 2.0 4.6 4.5 4.2 1.6
9-12 13.0 13.6 12.1 8.3 6.2 5.3 4.2 4.3
PK-12 29.0 26.2 23.3 16.5 14.4 11.6 10.2 7.7

SY2019/20 Demographic Report
124
Study Area 157 Projection Date 10/2/2019
CURRENT PROJECTED RESIDENT STUDENTS
2019 2020 2021 2022 2023 2024 2025 2026
PK 0.0 0.0 0.0 0.0 0.0 0.0 0.0 0.0
K 0.0 0.0 0.0 0.0 0.0 0.0 0.0 0.0
1 0.0 0.0 0.0 0.0 0.0 0.0 0.0 0.0
2 1.0 0.0 0.0 0.0 0.0 0.0 0.0 0.0
3 0.0 0.9 0.0 0.0 0.0 0.0 0.0 0.0
4 1.0 0.0 0.9 0.0 0.0 0.0 0.0 0.0
5 1.0 1.0 0.0 0.9 0.0 0.0 0.0 0.0
6 1.0 1.0 1.0 0.0 0.9 0.0 0.0 0.0
7 3.0 1.0 1.0 1.0 0.0 0.9 0.0 0.0
8 2.0 2.8 0.9 0.9 0.9 0.0 0.8 0.0
9 1.0 2.0 2.8 1.0 0.9 0.9 0.0 0.9
10 3.0 0.9 1.9 2.6 0.9 0.9 0.9 0.0
11 0.0 2.9 0.9 1.8 2.5 0.9 0.8 0.8
12 4.0 0.0 2.8 0.9 1.8 2.4 0.8 0.8
PK-5 3.0 1.9 0.9 0.9 0.0 0.0 0.0 0.0
6-8 6.0 4.8 2.9 1.9 1.8 0.9 0.8 0.0
9-12 8.0 5.8 8.4 6.3 6.1 5.1 2.5 2.5
PK-12 17.0 12.5 12.2 9.1 7.9 6.0 3.3 2.5
Study Area 158 Projection Date 10/2/2019
CURRENT PROJECTED RESIDENT STUDENTS
2019 2020 2021 2022 2023 2024 2025 2026
PK 1.0 1.0 0.9 0.9 0.9 0.9 0.9 0.9
K 3.0 2.7 2.6 2.6 2.5 2.6 2.5 2.5
1 3.0 2.8 2.5 2.4 2.4 2.3 2.4 2.4
2 2.0 2.8 2.6 2.4 2.3 2.3 2.2 2.2
3 1.0 1.9 2.7 2.5 2.2 2.2 2.1 2.1
4 3.0 1.0 1.8 2.6 2.4 2.2 2.1 2.1
5 7.0 3.0 1.0 1.8 2.6 2.4 2.2 2.1
6 7.0 6.9 2.9 0.9 1.8 2.5 2.3 2.1
7 5.0 7.2 7.1 3.0 1.0 1.8 2.6 2.4
8 2.0 4.6 6.6 6.5 2.8 0.9 1.7 2.4
9 5.0 2.0 4.6 6.7 6.6 2.8 0.9 1.7
10 2.0 4.7 1.9 4.3 6.2 6.1 2.6 0.8
11 3.0 1.9 4.5 1.8 4.2 6.0 5.9 2.5
12 2.0 2.9 1.9 4.4 1.8 4.1 5.9 5.7
PK-5 20.0 15.2 14.1 15.2 15.3 14.9 14.4 14.3
6-8 14.0 18.7 16.6 10.4 5.6 5.2 6.6 6.9
9-12 12.0 11.5 12.9 17.2 18.8 19.0 15.3 10.7
PK-12 46.0 45.4 43.6 42.8 39.7 39.1 36.3 31.9
Study Area 159 Projection Date 10/2/2019
CURRENT PROJECTED RESIDENT STUDENTS
2019 2020 2021 2022 2023 2024 2025 2026
PK 1.0 1.0 0.9 0.9 0.9 0.9 0.9 0.9
K 2.0 1.8 1.7 1.7 1.7 1.7 1.7 1.7
1 8.0 1.9 1.7 1.6 1.6 1.5 1.6 1.6
2 5.0 7.5 1.7 1.6 1.5 1.5 1.5 1.5
3 7.0 4.8 7.1 1.7 1.5 1.4 1.4 1.4
4 9.0 6.7 4.6 6.9 1.6 1.4 1.4 1.4
5 5.0 9.0 6.7 4.6 6.9 1.6 1.4 1.4
6 7.0 4.9 8.8 6.6 4.5 6.7 1.6 1.4
7 7.0 7.2 5.0 9.1 6.8 4.6 6.9 1.6
8 4.0 6.4 6.6 4.6 8.4 6.2 4.2 6.4
9 7.0 4.0 6.5 6.7 4.7 8.4 6.3 4.3
10 6.0 6.5 3.8 6.0 6.2 4.4 7.9 5.9
11 6.0 5.8 6.3 3.6 5.9 6.0 4.2 7.6
12 2.0 5.8 5.6 6.1 3.5 5.7 5.9 4.1
PK-5 37.0 32.7 24.4 19.0 15.7 10.0 9.9 9.9
6-8 18.0 18.5 20.4 20.3 19.7 17.5 12.7 9.4
9-12 21.0 22.1 22.2 22.4 20.3 24.5 24.3 21.9
PK-12 76.0 73.3 67.0 61.7 55.7 52.0 46.9 41.2

SY2019/20 Demographic Report
125
Study Area 160 Projection Date 10/2/2019
CURRENT PROJECTED RESIDENT STUDENTS
2019 2020 2021 2022 2023 2024 2025 2026
PK 1.0 1.0 0.9 0.9 0.9 0.9 0.9 0.9
K 2.0 1.8 1.7 1.7 1.7 1.7 1.7 1.7
1 10.0 1.9 1.7 1.6 1.6 1.5 1.6 1.6
2 1.0 9.4 1.7 1.6 1.5 1.5 1.5 1.5
3 0.0 0.9 8.9 1.7 1.5 1.4 1.4 1.4
4 4.0 0.0 0.9 8.6 1.6 1.4 1.4 1.4
5 1.0 4.0 0.0 0.9 8.6 1.6 1.4 1.4
6 3.0 1.0 3.9 0.0 0.9 8.4 1.6 1.4
7 1.0 3.1 1.0 4.0 0.0 0.9 8.7 1.6
8 5.0 0.9 2.8 0.9 3.7 0.0 0.8 8.0
9 7.0 5.1 0.9 2.9 0.9 3.8 0.0 0.9
10 4.0 6.5 4.7 0.9 2.7 0.9 3.5 0.0
11 1.0 3.9 6.3 4.6 0.8 2.6 0.8 3.4
12 2.0 1.0 3.8 6.1 4.4 0.8 2.5 0.8
PK-5 19.0 19.0 15.8 17.0 17.4 10.0 9.9 9.9
6-8 9.0 5.0 7.7 4.9 4.6 9.3 11.1 11.0
9-12 14.0 16.5 15.7 14.5 8.8 8.1 6.8 5.1
PK-12 42.0 40.5 39.2 36.4 30.8 27.4 27.8 26.0
Study Area 161 Projection Date 10/2/2019
CURRENT PROJECTED RESIDENT STUDENTS
2019 2020 2021 2022 2023 2024 2025 2026
PK 1.0 1.0 0.9 0.9 0.9 0.9 0.9 0.9
K 1.0 1.1 1.1 1.0 1.0 1.1 1.1 1.1
1 0.0 0.9 1.0 1.0 1.0 1.0 1.0 1.0
2 4.0 0.0 0.9 0.9 0.9 0.9 0.9 0.9
3 6.0 3.8 0.0 0.8 0.9 0.9 0.9 0.9
4 2.0 5.8 3.6 0.0 0.8 0.9 0.9 0.8
5 1.0 2.0 5.8 3.6 0.0 0.8 0.9 0.9
6 4.0 1.0 2.0 5.6 3.6 0.0 0.8 0.8
7 1.0 4.1 1.0 2.0 5.8 3.7 0.0 0.8
8 0.0 0.9 3.8 0.9 1.9 5.3 3.4 0.0
9 2.0 0.0 0.9 3.8 0.9 1.9 5.4 3.4
10 1.0 1.9 0.0 0.9 3.6 0.9 1.7 5.0
11 3.0 1.0 1.8 0.0 0.8 3.5 0.8 1.7
12 0.0 2.9 0.9 1.8 0.0 0.8 3.3 0.8
PK-5 15.0 14.6 13.3 8.2 5.5 6.5 6.6 6.5
6-8 5.0 6.0 6.8 8.5 11.3 9.0 4.2 1.6
9-12 6.0 5.8 3.6 6.5 5.3 7.1 11.2 10.9
PK-12 26.0 26.4 23.7 23.2 22.1 22.6 22.0 19.0
Study Area 162 Projection Date 10/2/2019
CURRENT PROJECTED RESIDENT STUDENTS
2019 2020 2021 2022 2023 2024 2025 2026
PK 2.0 1.9 1.9 1.8 1.9 1.8 1.8 1.8
K 8.0 8.6 8.5 8.4 8.4 8.4 8.4 8.4
1 3.0 7.4 8.0 7.9 7.8 7.8 7.9 7.8
2 3.0 2.8 7.0 7.5 7.5 7.3 7.3 7.4
3 7.0 2.8 2.7 6.6 7.2 7.1 7.0 7.0
4 2.0 6.7 2.7 2.6 6.4 6.9 6.8 6.7
5 5.0 2.0 6.7 2.7 2.6 6.4 6.9 6.8
6 6.0 4.9 2.0 6.6 2.7 2.5 6.3 6.7
7 4.0 6.2 5.0 2.0 6.8 2.8 2.6 6.4
8 2.0 3.7 5.7 4.6 1.9 6.2 2.5 2.4
9 2.0 2.0 3.7 5.7 4.7 1.9 6.3 2.6
10 2.0 1.9 1.9 3.5 5.3 4.4 1.7 5.9
11 5.0 1.9 1.8 1.8 3.4 5.2 4.2 1.7
12 5.0 4.8 1.9 1.8 1.8 3.3 5.0 4.1
PK-5 30.0 32.2 37.5 37.5 41.8 45.7 46.1 45.9
6-8 12.0 14.8 12.7 13.2 11.4 11.5 11.4 15.5
9-12 14.0 10.6 9.3 12.8 15.2 14.8 17.2 14.3
PK-12 56.0 57.6 59.5 63.5 68.4 72.0 74.7 75.7
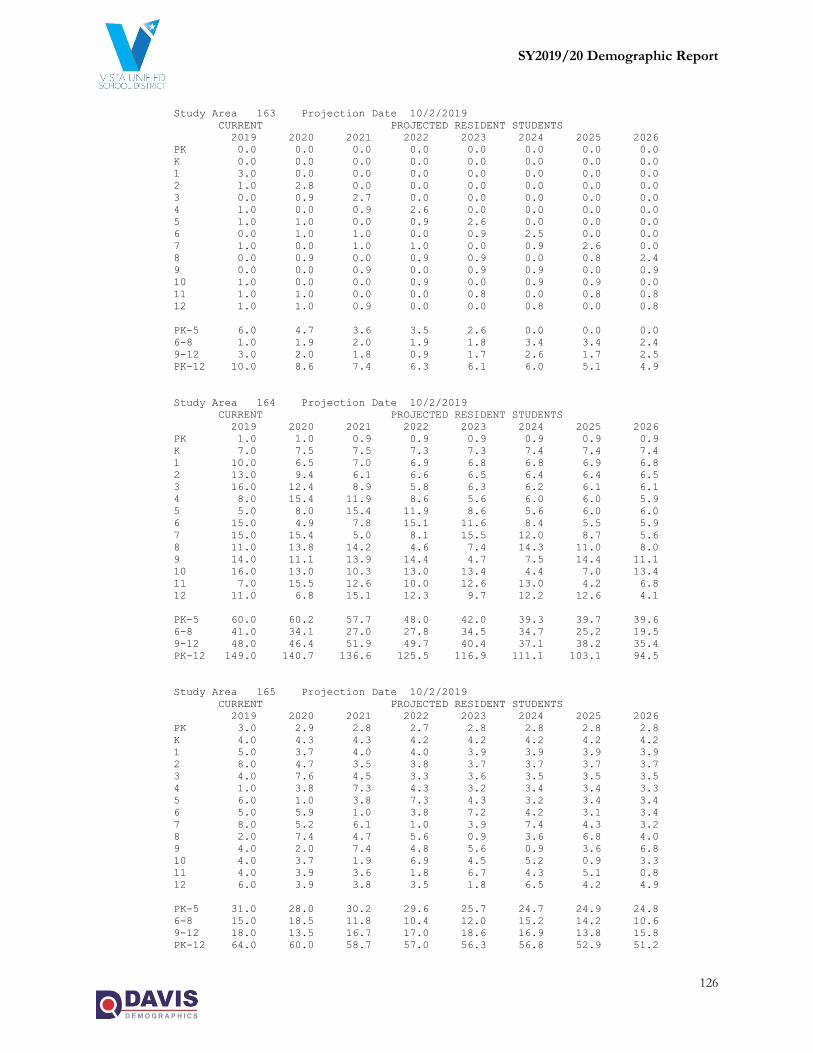
SY2019/20 Demographic Report
126
Study Area 163 Projection Date 10/2/2019
CURRENT PROJECTED RESIDENT STUDENTS
2019 2020 2021 2022 2023 2024 2025 2026
PK 0.0 0.0 0.0 0.0 0.0 0.0 0.0 0.0
K 0.0 0.0 0.0 0.0 0.0 0.0 0.0 0.0
1 3.0 0.0 0.0 0.0 0.0 0.0 0.0 0.0
2 1.0 2.8 0.0 0.0 0.0 0.0 0.0 0.0
3 0.0 0.9 2.7 0.0 0.0 0.0 0.0 0.0
4 1.0 0.0 0.9 2.6 0.0 0.0 0.0 0.0
5 1.0 1.0 0.0 0.9 2.6 0.0 0.0 0.0
6 0.0 1.0 1.0 0.0 0.9 2.5 0.0 0.0
7 1.0 0.0 1.0 1.0 0.0 0.9 2.6 0.0
8 0.0 0.9 0.0 0.9 0.9 0.0 0.8 2.4
9 0.0 0.0 0.9 0.0 0.9 0.9 0.0 0.9
10 1.0 0.0 0.0 0.9 0.0 0.9 0.9 0.0
11 1.0 1.0 0.0 0.0 0.8 0.0 0.8 0.8
12 1.0 1.0 0.9 0.0 0.0 0.8 0.0 0.8
PK-5 6.0 4.7 3.6 3.5 2.6 0.0 0.0 0.0
6-8 1.0 1.9 2.0 1.9 1.8 3.4 3.4 2.4
9-12 3.0 2.0 1.8 0.9 1.7 2.6 1.7 2.5
PK-12 10.0 8.6 7.4 6.3 6.1 6.0 5.1 4.9
Study Area 164 Projection Date 10/2/2019
CURRENT PROJECTED RESIDENT STUDENTS
2019 2020 2021 2022 2023 2024 2025 2026
PK 1.0 1.0 0.9 0.9 0.9 0.9 0.9 0.9
K 7.0 7.5 7.5 7.3 7.3 7.4 7.4 7.4
1 10.0 6.5 7.0 6.9 6.8 6.8 6.9 6.8
2 13.0 9.4 6.1 6.6 6.5 6.4 6.4 6.5
3 16.0 12.4 8.9 5.8 6.3 6.2 6.1 6.1
4 8.0 15.4 11.9 8.6 5.6 6.0 6.0 5.9
5 5.0 8.0 15.4 11.9 8.6 5.6 6.0 6.0
6 15.0 4.9 7.8 15.1 11.6 8.4 5.5 5.9
7 15.0 15.4 5.0 8.1 15.5 12.0 8.7 5.6
8 11.0 13.8 14.2 4.6 7.4 14.3 11.0 8.0
9 14.0 11.1 13.9 14.4 4.7 7.5 14.4 11.1
10 16.0 13.0 10.3 13.0 13.4 4.4 7.0 13.4
11 7.0 15.5 12.6 10.0 12.6 13.0 4.2 6.8
12 11.0 6.8 15.1 12.3 9.7 12.2 12.6 4.1
PK-5 60.0 60.2 57.7 48.0 42.0 39.3 39.7 39.6
6-8 41.0 34.1 27.0 27.8 34.5 34.7 25.2 19.5
9-12 48.0 46.4 51.9 49.7 40.4 37.1 38.2 35.4
PK-12 149.0 140.7 136.6 125.5 116.9 111.1 103.1 94.5
Study Area 165 Projection Date 10/2/2019
CURRENT PROJECTED RESIDENT STUDENTS
2019 2020 2021 2022 2023 2024 2025 2026
PK 3.0 2.9 2.8 2.7 2.8 2.8 2.8 2.8
K 4.0 4.3 4.3 4.2 4.2 4.2 4.2 4.2
1 5.0 3.7 4.0 4.0 3.9 3.9 3.9 3.9
2 8.0 4.7 3.5 3.8 3.7 3.7 3.7 3.7
3 4.0 7.6 4.5 3.3 3.6 3.5 3.5 3.5
4 1.0 3.8 7.3 4.3 3.2 3.4 3.4 3.3
5 6.0 1.0 3.8 7.3 4.3 3.2 3.4 3.4
6 5.0 5.9 1.0 3.8 7.2 4.2 3.1 3.4
7 8.0 5.2 6.1 1.0 3.9 7.4 4.3 3.2
8 2.0 7.4 4.7 5.6 0.9 3.6 6.8 4.0
9 4.0 2.0 7.4 4.8 5.6 0.9 3.6 6.8
10 4.0 3.7 1.9 6.9 4.5 5.2 0.9 3.3
11 4.0 3.9 3.6 1.8 6.7 4.3 5.1 0.8
12 6.0 3.9 3.8 3.5 1.8 6.5 4.2 4.9
PK-5 31.0 28.0 30.2 29.6 25.7 24.7 24.9 24.8
6-8 15.0 18.5 11.8 10.4 12.0 15.2 14.2 10.6
9-12 18.0 13.5 16.7 17.0 18.6 16.9 13.8 15.8
PK-12 64.0 60.0 58.7 57.0 56.3 56.8 52.9 51.2

SY2019/20 Demographic Report
127
Study Area 166 Projection Date 10/2/2019
CURRENT PROJECTED RESIDENT STUDENTS
2019 2020 2021 2022 2023 2024 2025 2026
PK 0.0 0.0 0.0 0.0 0.0 0.0 0.0 0.0
K 0.0 0.0 0.0 0.0 0.0 0.0 0.0 0.0
1 3.0 0.0 0.0 0.0 0.0 0.0 0.0 0.0
2 2.0 2.8 0.0 0.0 0.0 0.0 0.0 0.0
3 2.0 1.9 2.7 0.0 0.0 0.0 0.0 0.0
4 2.0 1.9 1.8 2.6 0.0 0.0 0.0 0.0
5 2.0 2.0 1.9 1.8 2.6 0.0 0.0 0.0
6 1.0 2.0 2.0 1.9 1.8 2.5 0.0 0.0
7 1.0 1.0 2.0 2.0 1.9 1.8 2.6 0.0
8 1.0 0.9 0.9 1.9 1.9 1.8 1.7 2.4
9 2.0 1.0 0.9 1.0 1.9 1.9 1.8 1.7
10 2.0 1.9 0.9 0.9 0.9 1.7 1.7 1.7
11 3.0 1.9 1.8 0.9 0.8 0.9 1.7 1.7
12 4.0 2.9 1.9 1.8 0.9 0.8 0.8 1.6
PK-5 11.0 8.6 6.4 4.4 2.6 0.0 0.0 0.0
6-8 3.0 3.9 4.9 5.8 5.6 6.1 4.3 2.4
9-12 11.0 7.7 5.5 4.6 4.5 5.3 6.0 6.7
PK-12 25.0 20.2 16.8 14.8 12.7 11.4 10.3 9.1
Study Area 167 Projection Date 10/2/2019
CURRENT PROJECTED RESIDENT STUDENTS
2019 2020 2021 2022 2023 2024 2025 2026
PK 0.0 0.0 0.0 0.0 0.0 0.0 0.0 0.0
K 5.0 5.4 5.3 5.2 5.2 5.3 5.3 5.3
1 1.0 4.7 5.0 5.0 4.9 4.9 4.9 4.9
2 6.0 0.9 4.4 4.7 4.7 4.6 4.6 4.6
3 2.0 5.7 0.9 4.2 4.5 4.4 4.4 4.4
4 7.0 1.9 5.5 0.9 4.0 4.3 4.3 4.2
5 3.0 7.0 1.9 5.5 0.9 4.0 4.3 4.3
6 0.0 2.9 6.9 1.9 5.4 0.8 3.9 4.2
7 2.0 0.0 3.0 7.1 1.9 5.5 0.9 4.0
8 4.0 1.8 0.0 2.8 6.5 1.8 5.1 0.8
9 3.0 4.0 1.9 0.0 2.8 6.6 1.8 5.1
10 8.0 2.8 3.8 1.7 0.0 2.6 6.1 1.7
11 7.0 7.8 2.7 3.6 1.7 0.0 2.5 5.9
12 7.0 6.8 7.5 2.6 3.5 1.6 0.0 2.5
PK-5 24.0 25.6 23.0 25.5 24.2 27.5 27.8 27.7
6-8 6.0 4.7 9.9 11.8 13.8 8.1 9.9 9.0
9-12 25.0 21.4 15.9 7.9 8.0 10.8 10.4 15.2
PK-12 55.0 51.7 48.8 45.2 46.0 46.4 48.1 51.9
Study Area 168 Projection Date 10/2/2019
CURRENT PROJECTED RESIDENT STUDENTS
2019 2020 2021 2022 2023 2024 2025 2026
PK 1.0 1.0 0.9 0.9 0.9 0.9 0.9 0.9
K 3.0 3.2 3.2 3.1 3.1 3.2 3.2 3.2
1 3.0 2.8 3.0 3.0 2.9 2.9 2.9 2.9
2 1.0 2.8 2.6 2.8 2.8 2.8 2.8 2.8
3 2.0 0.9 2.7 2.5 2.7 2.7 2.6 2.6
4 1.0 1.9 0.9 2.6 2.4 2.6 2.6 2.5
5 1.0 1.0 1.9 0.9 2.6 2.4 2.6 2.6
6 3.0 1.0 1.0 1.9 0.9 2.5 2.3 2.5
7 2.0 3.1 1.0 1.0 1.9 0.9 2.6 2.4
8 4.0 1.8 2.8 0.9 0.9 1.8 0.8 2.4
9 6.0 4.0 1.9 2.9 0.9 0.9 1.8 0.9
10 5.0 5.6 3.8 1.7 2.7 0.9 0.9 1.7
11 3.0 4.8 5.4 3.6 1.7 2.6 0.8 0.8
12 1.0 2.9 4.7 5.3 3.5 1.6 2.5 0.8
PK-5 12.0 13.6 15.2 15.8 17.4 17.5 17.6 17.5
6-8 9.0 5.9 4.8 3.8 3.7 5.2 5.7 7.3
9-12 15.0 17.3 15.8 13.5 8.8 6.0 6.0 4.2
PK-12 36.0 36.8 35.8 33.1 29.9 28.7 29.3 29.0
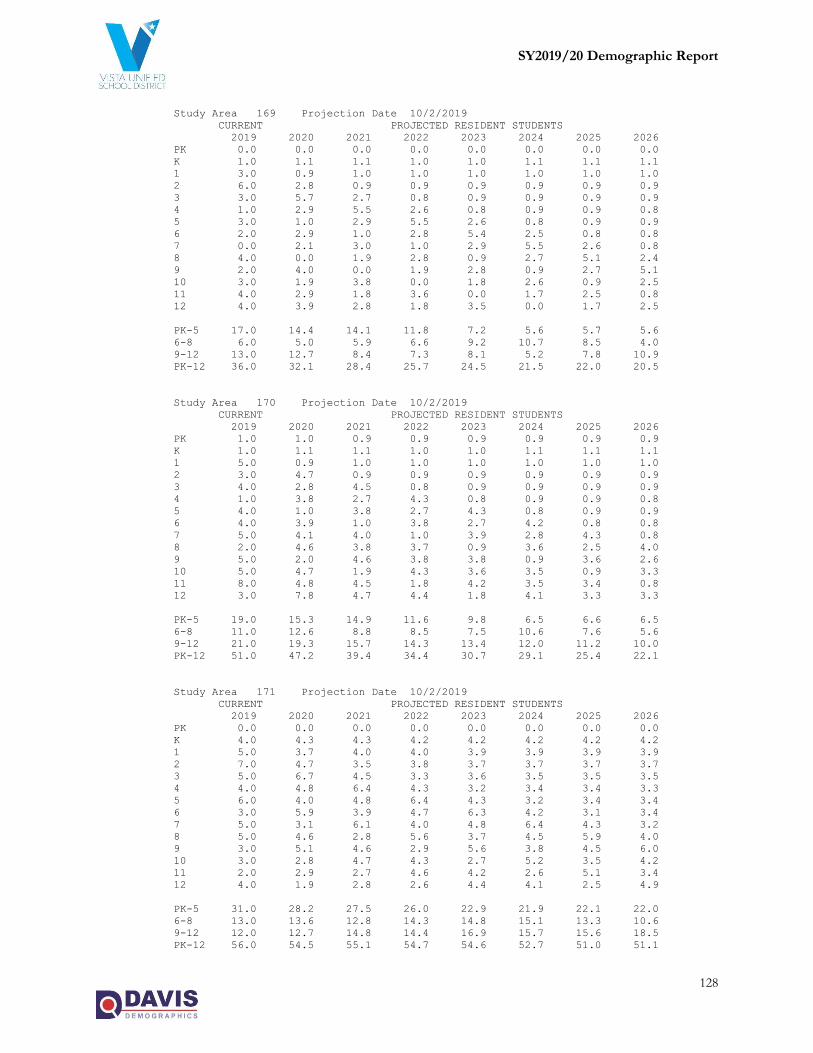
SY2019/20 Demographic Report
128
Study Area 169 Projection Date 10/2/2019
CURRENT PROJECTED RESIDENT STUDENTS
2019 2020 2021 2022 2023 2024 2025 2026
PK 0.0 0.0 0.0 0.0 0.0 0.0 0.0 0.0
K 1.0 1.1 1.1 1.0 1.0 1.1 1.1 1.1
1 3.0 0.9 1.0 1.0 1.0 1.0 1.0 1.0
2 6.0 2.8 0.9 0.9 0.9 0.9 0.9 0.9
3 3.0 5.7 2.7 0.8 0.9 0.9 0.9 0.9
4 1.0 2.9 5.5 2.6 0.8 0.9 0.9 0.8
5 3.0 1.0 2.9 5.5 2.6 0.8 0.9 0.9
6 2.0 2.9 1.0 2.8 5.4 2.5 0.8 0.8
7 0.0 2.1 3.0 1.0 2.9 5.5 2.6 0.8
8 4.0 0.0 1.9 2.8 0.9 2.7 5.1 2.4
9 2.0 4.0 0.0 1.9 2.8 0.9 2.7 5.1
10 3.0 1.9 3.8 0.0 1.8 2.6 0.9 2.5
11 4.0 2.9 1.8 3.6 0.0 1.7 2.5 0.8
12 4.0 3.9 2.8 1.8 3.5 0.0 1.7 2.5
PK-5 17.0 14.4 14.1 11.8 7.2 5.6 5.7 5.6
6-8 6.0 5.0 5.9 6.6 9.2 10.7 8.5 4.0
9-12 13.0 12.7 8.4 7.3 8.1 5.2 7.8 10.9
PK-12 36.0 32.1 28.4 25.7 24.5 21.5 22.0 20.5
Study Area 170 Projection Date 10/2/2019
CURRENT PROJECTED RESIDENT STUDENTS
2019 2020 2021 2022 2023 2024 2025 2026
PK 1.0 1.0 0.9 0.9 0.9 0.9 0.9 0.9
K 1.0 1.1 1.1 1.0 1.0 1.1 1.1 1.1
1 5.0 0.9 1.0 1.0 1.0 1.0 1.0 1.0
2 3.0 4.7 0.9 0.9 0.9 0.9 0.9 0.9
3 4.0 2.8 4.5 0.8 0.9 0.9 0.9 0.9
4 1.0 3.8 2.7 4.3 0.8 0.9 0.9 0.8
5 4.0 1.0 3.8 2.7 4.3 0.8 0.9 0.9
6 4.0 3.9 1.0 3.8 2.7 4.2 0.8 0.8
7 5.0 4.1 4.0 1.0 3.9 2.8 4.3 0.8
8 2.0 4.6 3.8 3.7 0.9 3.6 2.5 4.0
9 5.0 2.0 4.6 3.8 3.8 0.9 3.6 2.6
10 5.0 4.7 1.9 4.3 3.6 3.5 0.9 3.3
11 8.0 4.8 4.5 1.8 4.2 3.5 3.4 0.8
12 3.0 7.8 4.7 4.4 1.8 4.1 3.3 3.3
PK-5 19.0 15.3 14.9 11.6 9.8 6.5 6.6 6.5
6-8 11.0 12.6 8.8 8.5 7.5 10.6 7.6 5.6
9-12 21.0 19.3 15.7 14.3 13.4 12.0 11.2 10.0
PK-12 51.0 47.2 39.4 34.4 30.7 29.1 25.4 22.1
Study Area 171 Projection Date 10/2/2019
CURRENT PROJECTED RESIDENT STUDENTS
2019 2020 2021 2022 2023 2024 2025 2026
PK 0.0 0.0 0.0 0.0 0.0 0.0 0.0 0.0
K 4.0 4.3 4.3 4.2 4.2 4.2 4.2 4.2
1 5.0 3.7 4.0 4.0 3.9 3.9 3.9 3.9
2 7.0 4.7 3.5 3.8 3.7 3.7 3.7 3.7
3 5.0 6.7 4.5 3.3 3.6 3.5 3.5 3.5
4 4.0 4.8 6.4 4.3 3.2 3.4 3.4 3.3
5 6.0 4.0 4.8 6.4 4.3 3.2 3.4 3.4
6 3.0 5.9 3.9 4.7 6.3 4.2 3.1 3.4
7 5.0 3.1 6.1 4.0 4.8 6.4 4.3 3.2
8 5.0 4.6 2.8 5.6 3.7 4.5 5.9 4.0
9 3.0 5.1 4.6 2.9 5.6 3.8 4.5 6.0
10 3.0 2.8 4.7 4.3 2.7 5.2 3.5 4.2
11 2.0 2.9 2.7 4.6 4.2 2.6 5.1 3.4
12 4.0 1.9 2.8 2.6 4.4 4.1 2.5 4.9
PK-5 31.0 28.2 27.5 26.0 22.9 21.9 22.1 22.0
6-8 13.0 13.6 12.8 14.3 14.8 15.1 13.3 10.6
9-12 12.0 12.7 14.8 14.4 16.9 15.7 15.6 18.5
PK-12 56.0 54.5 55.1 54.7 54.6 52.7 51.0 51.1
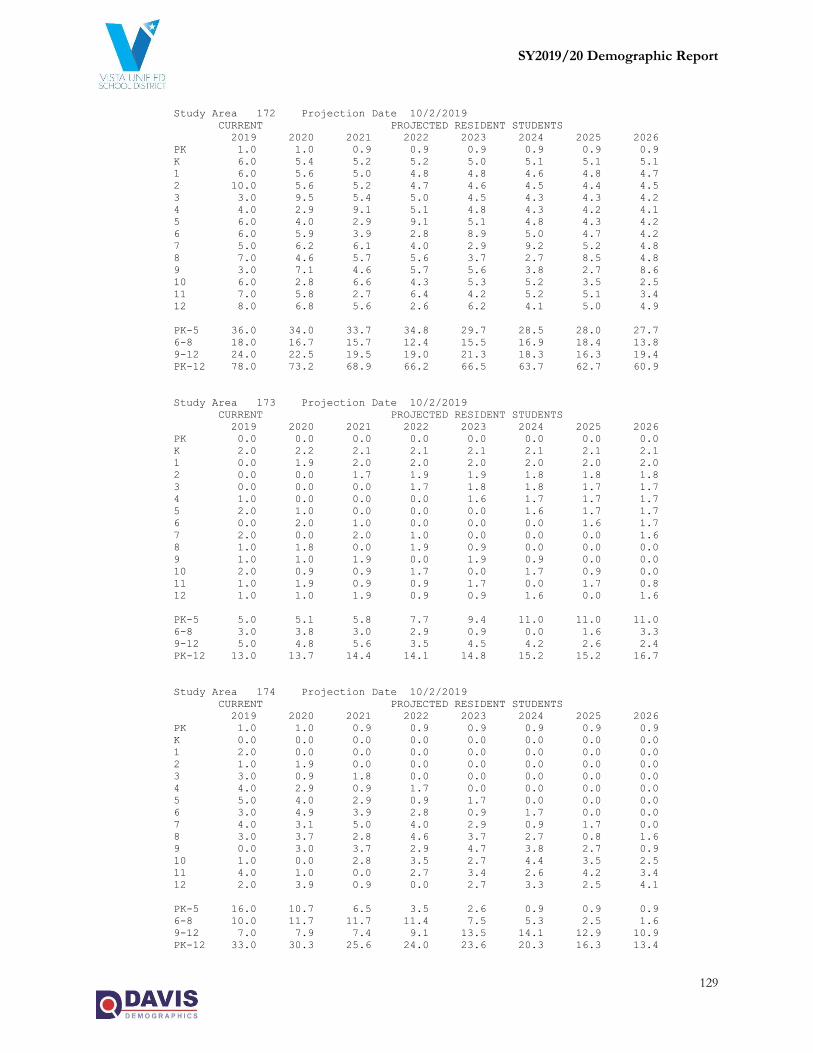
SY2019/20 Demographic Report
129
Study Area 172 Projection Date 10/2/2019
CURRENT PROJECTED RESIDENT STUDENTS
2019 2020 2021 2022 2023 2024 2025 2026
PK 1.0 1.0 0.9 0.9 0.9 0.9 0.9 0.9
K 6.0 5.4 5.2 5.2 5.0 5.1 5.1 5.1
1 6.0 5.6 5.0 4.8 4.8 4.6 4.8 4.7
2 10.0 5.6 5.2 4.7 4.6 4.5 4.4 4.5
3 3.0 9.5 5.4 5.0 4.5 4.3 4.3 4.2
4 4.0 2.9 9.1 5.1 4.8 4.3 4.2 4.1
5 6.0 4.0 2.9 9.1 5.1 4.8 4.3 4.2
6 6.0 5.9 3.9 2.8 8.9 5.0 4.7 4.2
7 5.0 6.2 6.1 4.0 2.9 9.2 5.2 4.8
8 7.0 4.6 5.7 5.6 3.7 2.7 8.5 4.8
9 3.0 7.1 4.6 5.7 5.6 3.8 2.7 8.6
10 6.0 2.8 6.6 4.3 5.3 5.2 3.5 2.5
11 7.0 5.8 2.7 6.4 4.2 5.2 5.1 3.4
12 8.0 6.8 5.6 2.6 6.2 4.1 5.0 4.9
PK-5 36.0 34.0 33.7 34.8 29.7 28.5 28.0 27.7
6-8 18.0 16.7 15.7 12.4 15.5 16.9 18.4 13.8
9-12 24.0 22.5 19.5 19.0 21.3 18.3 16.3 19.4
PK-12 78.0 73.2 68.9 66.2 66.5 63.7 62.7 60.9
Study Area 173 Projection Date 10/2/2019
CURRENT PROJECTED RESIDENT STUDENTS
2019 2020 2021 2022 2023 2024 2025 2026
PK 0.0 0.0 0.0 0.0 0.0 0.0 0.0 0.0
K 2.0 2.2 2.1 2.1 2.1 2.1 2.1 2.1
1 0.0 1.9 2.0 2.0 2.0 2.0 2.0 2.0
2 0.0 0.0 1.7 1.9 1.9 1.8 1.8 1.8
3 0.0 0.0 0.0 1.7 1.8 1.8 1.7 1.7
4 1.0 0.0 0.0 0.0 1.6 1.7 1.7 1.7
5 2.0 1.0 0.0 0.0 0.0 1.6 1.7 1.7
6 0.0 2.0 1.0 0.0 0.0 0.0 1.6 1.7
7 2.0 0.0 2.0 1.0 0.0 0.0 0.0 1.6
8 1.0 1.8 0.0 1.9 0.9 0.0 0.0 0.0
9 1.0 1.0 1.9 0.0 1.9 0.9 0.0 0.0
10 2.0 0.9 0.9 1.7 0.0 1.7 0.9 0.0
11 1.0 1.9 0.9 0.9 1.7 0.0 1.7 0.8
12 1.0 1.0 1.9 0.9 0.9 1.6 0.0 1.6
PK-5 5.0 5.1 5.8 7.7 9.4 11.0 11.0 11.0
6-8 3.0 3.8 3.0 2.9 0.9 0.0 1.6 3.3
9-12 5.0 4.8 5.6 3.5 4.5 4.2 2.6 2.4
PK-12 13.0 13.7 14.4 14.1 14.8 15.2 15.2 16.7
Study Area 174 Projection Date 10/2/2019
CURRENT PROJECTED RESIDENT STUDENTS
2019 2020 2021 2022 2023 2024 2025 2026
PK 1.0 1.0 0.9 0.9 0.9 0.9 0.9 0.9
K 0.0 0.0 0.0 0.0 0.0 0.0 0.0 0.0
1 2.0 0.0 0.0 0.0 0.0 0.0 0.0 0.0
2 1.0 1.9 0.0 0.0 0.0 0.0 0.0 0.0
3 3.0 0.9 1.8 0.0 0.0 0.0 0.0 0.0
4 4.0 2.9 0.9 1.7 0.0 0.0 0.0 0.0
5 5.0 4.0 2.9 0.9 1.7 0.0 0.0 0.0
6 3.0 4.9 3.9 2.8 0.9 1.7 0.0 0.0
7 4.0 3.1 5.0 4.0 2.9 0.9 1.7 0.0
8 3.0 3.7 2.8 4.6 3.7 2.7 0.8 1.6
9 0.0 3.0 3.7 2.9 4.7 3.8 2.7 0.9
10 1.0 0.0 2.8 3.5 2.7 4.4 3.5 2.5
11 4.0 1.0 0.0 2.7 3.4 2.6 4.2 3.4
12 2.0 3.9 0.9 0.0 2.7 3.3 2.5 4.1
PK-5 16.0 10.7 6.5 3.5 2.6 0.9 0.9 0.9
6-8 10.0 11.7 11.7 11.4 7.5 5.3 2.5 1.6
9-12 7.0 7.9 7.4 9.1 13.5 14.1 12.9 10.9
PK-12 33.0 30.3 25.6 24.0 23.6 20.3 16.3 13.4

SY2019/20 Demographic Report
130
Study Area 175 Projection Date 10/2/2019
CURRENT PROJECTED RESIDENT STUDENTS
2019 2020 2021 2022 2023 2024 2025 2026
PK 0.0 0.0 0.0 0.0 0.0 0.0 0.0 0.0
K 3.0 3.2 3.2 3.1 3.1 3.2 3.2 3.2
1 3.0 2.8 3.0 3.0 2.9 2.9 2.9 2.9
2 2.0 2.8 2.6 2.8 2.8 2.8 2.8 2.8
3 5.0 1.9 2.7 2.5 2.7 2.7 2.6 2.6
4 1.0 4.8 1.8 2.6 2.4 2.6 2.6 2.5
5 0.0 1.0 4.8 1.8 2.6 2.4 2.6 2.6
6 4.0 0.0 1.0 4.7 1.8 2.5 2.3 2.5
7 2.0 4.1 0.0 1.0 4.8 1.8 2.6 2.4
8 2.0 1.8 3.8 0.0 0.9 4.5 1.7 2.4
9 1.0 2.0 1.9 3.8 0.0 0.9 4.5 1.7
10 3.0 0.9 1.9 1.7 3.6 0.0 0.9 4.2
11 2.0 2.9 0.9 1.8 1.7 3.5 0.0 0.8
12 1.0 1.9 2.8 0.9 1.8 1.6 3.3 0.0
PK-5 14.0 16.5 18.1 15.8 16.5 16.6 16.7 16.6
6-8 8.0 5.9 4.8 5.7 7.5 8.8 6.6 7.3
9-12 7.0 7.7 7.5 8.2 7.1 6.0 8.7 6.7
PK-12 29.0 30.1 30.4 29.7 31.1 31.4 32.0 30.6
Study Area 176 Projection Date 10/2/2019
CURRENT PROJECTED RESIDENT STUDENTS
2019 2020 2021 2022 2023 2024 2025 2026
PK 0.0 0.0 0.0 0.0 0.0 0.0 0.0 0.0
K 2.0 1.9 1.8 1.8 1.8 1.8 1.8 1.8
1 2.0 1.9 1.9 1.8 1.7 1.7 1.7 1.7
2 1.0 1.9 1.9 1.8 1.7 1.7 1.7 1.7
3 1.0 1.0 1.9 1.9 1.8 1.7 1.7 1.7
4 5.0 1.0 1.0 1.9 1.8 1.7 1.6 1.6
5 3.0 4.8 0.9 0.9 1.8 1.8 1.7 1.6
6 4.0 2.9 4.7 0.9 0.9 1.8 1.7 1.6
7 3.0 3.6 2.6 4.2 0.8 0.8 1.6 1.5
8 2.0 2.9 3.5 2.5 4.1 0.8 0.8 1.5
9 3.0 2.0 3.0 3.5 2.6 4.1 0.8 0.8
10 2.0 2.9 2.0 2.8 3.4 2.5 4.0 0.8
11 0.0 1.8 2.6 1.8 2.6 3.1 2.2 3.6
12 7.0 0.0 1.8 2.6 1.7 2.5 3.0 2.2
PK-5 14.0 12.5 9.4 10.1 10.6 10.4 10.2 10.1
6-8 9.0 9.4 10.8 7.6 5.8 3.4 4.1 4.6
9-12 12.0 6.7 9.4 10.7 10.3 12.2 10.0 7.4
PK-12 35.0 28.6 29.6 28.4 26.7 26.0 24.3 22.1
Study Area 177 Projection Date 10/2/2019
CURRENT PROJECTED RESIDENT STUDENTS
2019 2020 2021 2022 2023 2024 2025 2026
PK 0.0 0.0 0.0 0.0 0.0 0.0 0.0 0.0
K 1.0 1.0 0.9 0.9 0.9 0.9 0.9 0.9
1 1.0 1.0 0.9 0.9 0.9 0.9 0.9 0.9
2 0.0 1.0 0.9 0.9 0.9 0.8 0.8 0.8
3 3.0 0.0 1.0 0.9 0.9 0.9 0.8 0.8
4 1.0 2.9 0.0 0.9 0.9 0.9 0.8 0.8
5 0.0 1.0 2.8 0.0 0.9 0.9 0.8 0.8
6 0.0 0.0 0.9 2.7 0.0 0.9 0.8 0.8
7 2.0 0.0 0.0 0.8 2.4 0.0 0.8 0.8
8 1.0 1.9 0.0 0.0 0.8 2.3 0.0 0.8
9 2.0 1.0 2.0 0.0 0.0 0.8 2.4 0.0
10 2.0 1.9 1.0 1.9 0.0 0.0 0.8 2.3
11 2.0 1.8 1.7 0.9 1.7 0.0 0.0 0.7
12 1.0 2.0 1.8 1.7 0.9 1.7 0.0 0.0
PK-5 6.0 6.9 6.5 4.5 5.4 5.3 5.0 5.0
6-8 3.0 1.9 0.9 3.5 3.2 3.2 1.6 2.4
9-12 7.0 6.7 6.5 4.5 2.6 2.5 3.2 3.0
PK-12 16.0 15.5 13.9 12.5 11.2 11.0 9.8 10.4

SY2019/20 Demographic Report
131
Study Area 178 Projection Date 10/2/2019
CURRENT PROJECTED RESIDENT STUDENTS
2019 2020 2021 2022 2023 2024 2025 2026
PK 0.0 0.0 0.0 0.0 0.0 0.0 0.0 0.0
K 5.0 5.0 5.4 4.9 5.0 5.0 5.0 5.0
1 1.0 5.0 5.6 5.2 4.8 4.8 4.8 4.8
2 4.0 1.1 5.6 5.4 5.1 4.7 4.7 4.7
3 0.0 4.1 1.9 5.6 5.4 5.1 4.7 4.7
4 3.0 0.1 4.7 1.8 5.4 5.2 4.9 4.5
5 4.0 3.1 0.9 4.6 1.8 5.2 5.0 4.7
6 1.0 4.0 3.7 0.9 4.5 1.7 5.1 4.9
7 4.0 1.0 4.3 3.3 0.8 4.0 1.5 4.5
8 2.0 4.0 1.8 4.2 3.2 0.8 3.8 1.5
9 2.0 2.2 4.9 1.8 4.2 3.3 0.8 3.9
10 1.0 2.1 2.9 4.7 1.7 4.1 3.2 0.7
11 1.0 1.0 2.6 2.6 4.3 1.6 3.7 2.9
12 3.0 1.1 1.8 2.5 2.6 4.2 1.5 3.6
PK-5 17.0 18.4 24.1 27.5 27.5 30.0 29.1 28.4
6-8 7.0 9.0 9.8 8.4 8.5 6.5 10.4 10.9
9-12 7.0 6.4 12.2 11.6 12.8 13.2 9.2 11.1
PK-12 31.0 33.8 46.1 47.5 48.8 49.7 48.7 50.4
Study Area 179 Projection Date 10/2/2019
CURRENT PROJECTED RESIDENT STUDENTS
2019 2020 2021 2022 2023 2024 2025 2026
PK 0.0 0.0 0.0 0.0 0.0 0.0 0.0 0.0
K 3.0 2.9 2.7 2.7 2.7 2.7 2.7 2.7
1 3.0 2.9 2.8 2.6 2.6 2.6 2.6 2.6
2 8.0 2.9 2.8 2.7 2.6 2.5 2.5 2.5
3 2.0 8.0 2.9 2.8 2.7 2.6 2.5 2.5
4 9.0 1.9 7.7 2.8 2.7 2.6 2.5 2.4
5 5.0 8.7 1.9 7.4 2.7 2.6 2.5 2.4
6 2.0 4.8 8.5 1.8 7.2 2.6 2.5 2.5
7 2.0 1.8 4.3 7.5 1.6 6.4 2.3 2.3
8 1.0 1.9 1.7 4.2 7.3 1.6 6.2 2.3
9 3.0 1.0 2.0 1.8 4.3 7.5 1.6 6.4
10 2.0 2.9 1.0 1.9 1.7 4.1 7.2 1.5
11 5.0 1.8 2.6 0.9 1.7 1.5 3.7 6.5
12 2.0 4.9 1.8 2.6 0.9 1.7 1.5 3.7
PK-5 30.0 27.3 20.8 21.0 16.0 15.6 15.3 15.1
6-8 5.0 8.5 14.5 13.5 16.1 10.6 11.0 7.1
9-12 12.0 10.6 7.4 7.2 8.6 14.8 14.0 18.1
PK-12 47.0 46.4 42.7 41.7 40.7 41.0 40.3 40.3
Study Area 180 Projection Date 10/2/2019
CURRENT PROJECTED RESIDENT STUDENTS
2019 2020 2021 2022 2023 2024 2025 2026
PK 1.0 1.0 0.9 0.9 0.9 0.9 0.9 0.9
K 7.0 6.8 6.3 6.2 6.2 6.3 6.2 6.3
1 7.0 6.8 6.6 6.1 6.0 6.1 6.1 6.1
2 4.0 6.8 6.6 6.4 6.0 5.9 5.9 5.9
3 6.0 4.0 6.8 6.6 6.4 6.0 5.9 5.9
4 5.0 5.8 3.8 6.5 6.3 6.1 5.7 5.6
5 6.0 4.8 5.6 3.7 6.3 6.1 5.9 5.5
6 4.0 5.8 4.7 5.4 3.6 6.1 5.9 5.7
7 3.0 3.6 5.2 4.2 4.8 3.2 5.5 5.3
8 5.0 2.9 3.5 5.0 4.1 4.7 3.1 5.3
9 5.0 5.1 3.0 3.5 5.1 4.1 4.8 3.2
10 8.0 4.8 4.9 2.8 3.4 4.9 4.0 4.6
11 6.0 7.3 4.4 4.5 2.6 3.1 4.5 3.6
12 6.0 5.9 7.1 4.3 4.4 2.5 3.0 4.4
PK-5 36.0 36.0 36.6 36.4 38.1 37.4 36.6 36.2
6-8 12.0 12.3 13.4 14.6 12.5 14.0 14.5 16.3
9-12 25.0 23.1 19.4 15.1 15.5 14.6 16.3 15.8
PK-12 73.0 71.4 69.4 66.1 66.1 66.0 67.4 68.3

SY2019/20 Demographic Report
132
Study Area 181 Projection Date 10/2/2019
CURRENT PROJECTED RESIDENT STUDENTS
2019 2020 2021 2022 2023 2024 2025 2026
PK 1.0 1.0 0.9 0.9 0.9 0.9 0.9 0.9
K 10.0 9.6 9.0 8.9 8.9 8.9 8.9 8.9
1 11.0 9.7 9.4 8.8 8.6 8.7 8.7 8.7
2 7.0 10.7 9.4 9.1 8.5 8.4 8.4 8.4
3 11.0 7.0 10.7 9.4 9.1 8.5 8.4 8.4
4 14.0 10.6 6.7 10.2 9.0 8.7 8.2 8.0
5 7.0 13.6 10.2 6.5 9.9 8.8 8.5 7.9
6 8.0 6.8 13.2 9.9 6.3 9.6 8.5 8.2
7 19.0 7.1 6.0 11.7 8.8 5.6 8.6 7.6
8 8.0 18.4 6.9 5.9 11.4 8.6 5.5 8.3
9 9.0 8.2 18.8 7.0 6.0 11.6 8.7 5.6
10 6.0 8.6 7.8 18.0 6.8 5.7 11.1 8.4
11 6.0 5.5 7.9 7.1 16.4 6.2 5.2 10.1
12 7.0 5.9 5.4 7.7 7.0 16.1 6.0 5.1
PK-5 61.0 62.2 56.3 53.8 54.9 52.9 52.0 51.2
6-8 35.0 32.3 26.1 27.5 26.5 23.8 22.6 24.1
9-12 28.0 28.2 39.9 39.8 36.2 39.6 31.0 29.2
PK-12 124.0 122.7 122.3 121.1 117.6 116.3 105.6 104.5
Study Area 182 Projection Date 10/2/2019
CURRENT PROJECTED RESIDENT STUDENTS
2019 2020 2021 2022 2023 2024 2025 2026
PK 2.0 1.9 1.9 1.8 1.9 1.8 1.8 1.8
K 9.0 8.7 8.1 8.0 8.0 8.1 8.0 8.0
1 3.0 8.7 8.4 7.9 7.8 7.8 7.8 7.8
2 4.0 2.9 8.5 8.2 7.7 7.5 7.6 7.6
3 5.0 4.0 2.9 8.5 8.2 7.7 7.5 7.6
4 10.0 4.8 3.8 2.8 8.1 7.8 7.4 7.2
5 6.0 9.7 4.7 3.7 2.7 7.9 7.6 7.1
6 3.0 5.8 9.4 4.5 3.6 2.6 7.6 7.4
7 7.0 2.7 5.2 8.4 4.0 3.2 2.3 6.8
8 7.0 6.8 2.6 5.0 8.1 3.9 3.1 2.3
9 7.0 7.1 6.9 2.6 5.1 8.3 4.0 3.2
10 5.0 6.7 6.9 6.6 2.5 4.9 8.0 3.8
11 8.0 4.6 6.1 6.2 6.1 2.3 4.5 7.2
12 5.0 7.8 4.5 6.0 6.1 5.9 2.3 4.4
PK-5 39.0 40.7 38.3 40.9 44.4 48.6 47.7 47.1
6-8 17.0 15.3 17.2 17.9 15.7 9.7 13.0 16.5
9-12 25.0 26.2 24.4 21.4 19.8 21.4 18.8 18.6
PK-12 81.0 82.2 79.9 80.2 79.9 79.7 79.5 82.2
Study Area 183 Projection Date 10/2/2019
CURRENT PROJECTED RESIDENT STUDENTS
2019 2020 2021 2022 2023 2024 2025 2026
PK 0.0 0.0 0.0 0.0 0.0 0.0 0.0 0.0
K 6.0 5.8 5.4 5.3 5.4 5.4 5.4 5.4
1 2.0 5.8 5.6 5.3 5.2 5.2 5.2 5.2
2 1.0 1.9 5.6 5.4 5.1 5.0 5.0 5.1
3 5.0 1.0 1.9 5.6 5.4 5.1 5.0 5.0
4 1.0 4.8 1.0 1.9 5.4 5.2 4.9 4.8
5 4.0 1.0 4.7 0.9 1.8 5.3 5.1 4.8
6 5.0 3.9 0.9 4.5 0.9 1.8 5.1 4.9
7 6.0 4.4 3.5 0.8 4.0 0.8 1.6 4.5
8 4.0 5.8 4.3 3.3 0.8 3.9 0.8 1.5
9 5.0 4.1 5.9 4.4 3.4 0.8 4.0 0.8
10 5.0 4.8 3.9 5.7 4.2 3.3 0.8 3.8
11 4.0 4.6 4.4 3.6 5.2 3.8 3.0 0.7
12 5.0 3.9 4.5 4.3 3.5 5.1 3.8 2.9
PK-5 19.0 20.3 24.2 24.4 28.3 31.2 30.6 30.3
6-8 15.0 14.1 8.7 8.6 5.7 6.5 7.5 10.9
9-12 19.0 17.4 18.7 18.0 16.3 13.0 11.6 8.2
PK-12 53.0 51.8 51.6 51.0 50.3 50.7 49.7 49.4

SY2019/20 Demographic Report
133
Study Area 184 Projection Date 10/2/2019
CURRENT PROJECTED RESIDENT STUDENTS
2019 2020 2021 2022 2023 2024 2025 2026
PK 0.0 0.0 0.0 0.0 0.0 0.0 0.0 0.0
K 7.0 6.8 6.3 6.2 6.6 6.4 6.4 6.4
1 5.0 6.8 6.6 6.1 6.3 6.4 6.2 6.2
2 7.0 4.8 6.6 6.4 6.3 6.1 6.2 6.1
3 4.0 7.0 4.8 6.6 6.7 6.3 6.1 6.2
4 6.0 3.8 6.7 4.7 6.6 6.4 6.0 5.9
5 3.0 5.8 3.7 6.5 4.8 6.4 6.2 5.8
6 6.0 2.9 5.6 3.6 6.6 4.7 6.2 6.0
7 5.0 5.3 2.6 5.0 3.5 5.9 4.2 5.5
8 5.0 4.8 5.2 2.5 5.2 3.4 5.7 4.0
9 6.0 5.1 4.9 5.3 2.9 5.3 3.5 5.8
10 11.0 5.8 4.9 4.7 5.4 2.8 5.1 3.3
11 8.0 10.0 5.2 4.5 4.6 4.9 2.5 4.6
12 3.0 7.8 9.8 5.1 4.7 4.5 4.8 2.5
PK-5 32.0 35.0 34.7 36.5 37.3 38.0 37.1 36.6
6-8 16.0 13.0 13.4 11.1 15.3 14.0 16.1 15.5
9-12 28.0 28.7 24.8 19.6 17.6 17.5 15.9 16.2
PK-12 76.0 76.7 72.9 67.2 70.2 69.5 69.1 68.3
Study Area 185 Projection Date 10/2/2019
CURRENT PROJECTED RESIDENT STUDENTS
2019 2020 2021 2022 2023 2024 2025 2026
PK 1.0 1.0 0.9 0.9 0.9 0.9 0.9 0.9
K 7.0 6.8 6.3 6.2 6.2 6.3 6.2 6.3
1 16.0 6.8 6.6 6.1 6.0 6.1 6.1 6.1
2 12.0 15.5 6.6 6.4 6.0 5.9 5.9 5.9
3 13.0 12.0 15.5 6.6 6.4 6.0 5.9 5.9
4 14.0 12.5 11.5 14.9 6.3 6.1 5.7 5.6
5 13.0 13.6 12.1 11.2 14.5 6.1 5.9 5.5
6 5.0 12.6 13.2 11.7 10.8 14.0 5.9 5.7
7 4.0 4.4 11.2 11.7 10.5 9.6 12.5 5.3
8 13.0 3.9 4.3 10.9 11.4 10.1 9.4 12.1
9 8.0 13.3 4.0 4.4 11.1 11.6 10.3 9.5
10 10.0 7.7 12.7 3.8 4.2 10.7 11.1 9.9
11 9.0 9.1 7.0 11.6 3.5 3.8 9.7 10.1
12 11.0 8.8 8.9 6.8 11.4 3.4 3.8 9.5
PK-5 76.0 68.2 59.5 52.3 46.3 37.4 36.6 36.2
6-8 22.0 20.9 28.7 34.3 32.7 33.7 27.8 23.1
9-12 38.0 38.9 32.6 26.6 30.2 29.5 34.9 39.0
PK-12 136.0 128.0 120.8 113.2 109.2 100.6 99.3 98.3
Study Area 186 Projection Date 10/2/2019
CURRENT PROJECTED RESIDENT STUDENTS
2019 2020 2021 2022 2023 2024 2025 2026
PK 3.0 2.9 2.8 2.7 2.8 2.8 2.8 2.8
K 3.0 2.9 2.7 2.7 2.7 2.7 2.7 2.7
1 7.0 2.9 2.8 2.6 2.6 2.6 2.6 2.6
2 13.0 6.8 2.8 2.7 2.6 2.5 2.5 2.5
3 12.0 13.0 6.8 2.8 2.7 2.6 2.5 2.5
4 6.0 11.5 12.5 6.5 2.7 2.6 2.5 2.4
5 6.0 5.8 11.2 12.1 6.3 2.6 2.5 2.4
6 8.0 5.8 5.6 10.8 11.7 6.1 2.5 2.5
7 10.0 7.1 5.2 5.0 9.6 10.5 5.5 2.3
8 6.0 9.7 6.9 5.0 4.9 9.4 10.1 5.3
9 9.0 6.1 9.9 7.0 5.1 5.0 9.5 10.3
10 9.0 8.6 5.9 9.5 6.8 4.9 4.8 9.2
11 11.0 8.2 7.9 5.3 8.6 6.2 4.5 4.3
12 7.0 10.8 8.0 7.7 5.2 8.5 6.0 4.4
PK-5 50.0 45.8 41.6 32.1 22.4 18.4 18.1 17.9
6-8 24.0 22.6 17.7 20.8 26.2 26.0 18.1 10.1
9-12 36.0 33.7 31.7 29.5 25.7 24.6 24.8 28.2
PK-12 110.0 102.1 91.0 82.4 74.3 69.0 61.0 56.2

SY2019/20 Demographic Report
134
Study Area 187 Projection Date 10/2/2019
CURRENT PROJECTED RESIDENT STUDENTS
2019 2020 2021 2022 2023 2024 2025 2026
PK 2.0 1.9 1.9 1.8 1.9 1.8 1.8 1.8
K 6.0 5.8 5.4 5.3 5.4 5.4 5.4 5.4
1 9.0 5.8 5.6 5.3 5.2 5.2 5.2 5.2
2 8.0 8.7 5.6 5.4 5.1 5.0 5.0 5.1
3 10.0 8.0 8.7 5.6 5.4 5.1 5.0 5.0
4 4.0 9.6 7.7 8.4 5.4 5.2 4.9 4.8
5 8.0 3.9 9.3 7.4 8.1 5.3 5.1 4.8
6 13.0 7.8 3.8 9.0 7.2 7.9 5.1 4.9
7 5.0 11.6 6.9 3.3 8.0 6.4 7.0 4.5
8 11.0 4.8 11.2 6.7 3.2 7.8 6.2 6.8
9 7.0 11.2 4.9 11.4 6.8 3.3 8.0 6.4
10 9.0 6.7 10.8 4.7 11.0 6.6 3.2 7.6
11 9.0 8.2 6.1 9.8 4.3 10.0 6.0 2.9
12 10.0 8.8 8.0 6.0 9.6 4.2 9.8 5.9
PK-5 47.0 43.7 44.2 39.2 36.5 33.0 32.4 32.1
6-8 29.0 24.2 21.9 19.0 18.4 22.1 18.3 16.2
9-12 35.0 34.9 29.8 31.9 31.7 24.1 27.0 22.8
PK-12 111.0 102.8 95.9 90.1 86.6 79.2 77.7 71.1
Study Area 188 Projection Date 10/2/2019
CURRENT PROJECTED RESIDENT STUDENTS
2019 2020 2021 2022 2023 2024 2025 2026
PK 2.0 1.9 1.9 1.8 1.9 1.8 1.8 1.8
K 8.0 7.7 7.2 7.1 7.1 7.2 7.1 7.1
1 5.0 7.8 7.5 7.0 6.9 6.9 6.9 6.9
2 3.0 4.8 7.5 7.3 6.8 6.7 6.7 6.7
3 4.0 3.0 4.8 7.5 7.3 6.8 6.7 6.7
4 11.0 3.8 2.9 4.7 7.2 7.0 6.5 6.4
5 3.0 10.7 3.7 2.8 4.5 7.0 6.8 6.3
6 7.0 2.9 10.3 3.6 2.7 4.4 6.8 6.6
7 4.0 6.2 2.6 9.2 3.2 2.4 3.9 6.1
8 5.0 3.9 6.0 2.5 8.9 3.1 2.3 3.8
9 3.0 5.1 4.0 6.2 2.6 9.1 3.2 2.4
10 2.0 2.9 4.9 3.8 5.9 2.5 8.7 3.1
11 3.0 1.8 2.6 4.5 3.5 5.4 2.2 8.0
12 0.0 2.9 1.8 2.6 4.4 3.4 5.3 2.2
PK-5 36.0 39.7 35.5 38.2 41.7 43.4 42.5 41.9
6-8 16.0 13.0 18.9 15.3 14.8 9.9 13.0 16.5
9-12 8.0 12.7 13.3 17.1 16.4 20.4 19.4 15.7
PK-12 60.0 65.4 67.7 70.6 72.9 73.7 74.9 74.1
Study Area 189 Projection Date 10/2/2019
CURRENT PROJECTED RESIDENT STUDENTS
2019 2020 2021 2022 2023 2024 2025 2026
PK 0.0 0.0 0.0 0.0 0.0 0.0 0.0 0.0
K 5.0 4.8 4.5 4.4 4.5 4.5 4.5 4.5
1 1.0 4.8 4.7 4.4 4.3 4.3 4.3 4.3
2 4.0 1.0 4.7 4.5 4.3 4.2 4.2 4.2
3 6.0 4.0 1.0 4.7 4.5 4.3 4.2 4.2
4 5.0 5.8 3.8 0.9 4.5 4.4 4.1 4.0
5 6.0 4.8 5.6 3.7 0.9 4.4 4.2 4.0
6 4.0 5.8 4.7 5.4 3.6 0.9 4.2 4.1
7 3.0 3.6 5.2 4.2 4.8 3.2 0.8 3.8
8 8.0 2.9 3.5 5.0 4.1 4.7 3.1 0.8
9 5.0 8.2 3.0 3.5 5.1 4.1 4.8 3.2
10 6.0 4.8 7.8 2.8 3.4 4.9 4.0 4.6
11 4.0 5.5 4.4 7.1 2.6 3.1 4.5 3.6
12 3.0 3.9 5.4 4.3 7.0 2.5 3.0 4.4
PK-5 27.0 25.2 24.3 22.6 23.0 26.1 25.5 25.2
6-8 15.0 12.3 13.4 14.6 12.5 8.8 8.1 8.7
9-12 18.0 22.4 20.6 17.7 18.1 14.6 16.3 15.8
PK-12 60.0 59.9 58.3 54.9 53.6 49.5 49.9 49.7

SY2019/20 Demographic Report
135
Study Area 190 Projection Date 10/2/2019
CURRENT PROJECTED RESIDENT STUDENTS
2019 2020 2021 2022 2023 2024 2025 2026
PK 0.0 0.0 0.0 0.0 0.0 0.0 0.0 0.0
K 11.0 11.3 11.0 10.5 10.5 10.6 10.5 10.5
1 4.0 11.3 11.6 10.6 10.2 10.2 10.2 10.2
2 6.0 4.5 11.6 11.2 10.3 9.9 9.9 9.9
3 6.0 6.7 5.2 11.6 11.2 10.3 9.9 9.9
4 7.0 6.4 7.0 5.0 11.2 10.8 9.9 9.5
5 4.0 7.4 6.9 6.8 4.8 10.8 10.5 9.6
6 4.0 4.5 7.9 6.6 6.6 4.7 10.5 10.2
7 7.0 4.2 4.6 7.0 5.9 5.9 4.2 9.3
8 6.0 7.4 4.7 4.5 6.8 5.7 5.7 4.0
9 9.0 6.8 8.3 4.8 4.6 6.9 5.9 5.8
10 6.0 9.3 7.2 7.9 4.6 4.4 6.6 5.6
11 9.0 6.1 9.1 6.5 7.2 4.2 4.0 6.0
12 3.0 9.5 6.6 8.9 6.4 7.1 4.1 3.9
PK-5 38.0 47.6 53.3 55.7 58.2 62.6 60.9 59.6
6-8 17.0 16.1 17.2 18.1 19.3 16.3 20.4 23.5
9-12 27.0 31.7 31.2 28.1 22.8 22.6 20.6 21.3
PK-12 82.0 95.4 101.7 101.9 100.3 101.5 101.9 104.4
Study Area 191 Projection Date 10/2/2019
CURRENT PROJECTED RESIDENT STUDENTS
2019 2020 2021 2022 2023 2024 2025 2026
PK 0.0 0.0 0.0 0.0 0.0 0.0 0.0 0.0
K 6.0 5.8 5.4 5.3 5.4 5.4 5.4 5.4
1 2.0 5.8 5.6 5.3 5.2 5.2 5.2 5.2
2 2.0 1.9 5.6 5.4 5.1 5.0 5.0 5.1
3 4.0 2.0 1.9 5.6 5.4 5.1 5.0 5.0
4 5.0 3.8 1.9 1.9 5.4 5.2 4.9 4.8
5 1.0 4.8 3.7 1.9 1.8 5.3 5.1 4.8
6 3.0 1.0 4.7 3.6 1.8 1.8 5.1 4.9
7 4.0 2.7 0.9 4.2 3.2 1.6 1.6 4.5
8 1.0 3.9 2.6 0.8 4.1 3.1 1.6 1.5
9 3.0 1.0 4.0 2.6 0.9 4.1 3.2 1.6
10 4.0 2.9 1.0 3.8 2.5 0.8 4.0 3.1
11 2.0 3.6 2.6 0.9 3.5 2.3 0.7 3.6
12 3.0 2.0 3.6 2.6 0.9 3.4 2.3 0.7
PK-5 20.0 24.1 24.1 25.4 28.3 31.2 30.6 30.3
6-8 8.0 7.6 8.2 8.6 9.1 6.5 8.3 10.9
9-12 12.0 9.5 11.2 9.9 7.8 10.6 10.2 9.0
PK-12 40.0 41.2 43.5 43.9 45.2 48.3 49.1 50.2
Study Area 192 Projection Date 10/2/2019
CURRENT PROJECTED RESIDENT STUDENTS
2019 2020 2021 2022 2023 2024 2025 2026
PK 0.0 0.0 0.0 0.0 0.0 0.0 0.0 0.0
K 6.0 5.8 5.4 5.3 5.4 5.4 5.4 5.4
1 8.0 5.8 5.6 5.3 5.2 5.2 5.2 5.2
2 6.0 7.8 5.6 5.4 5.1 5.0 5.0 5.1
3 7.0 6.0 7.8 5.6 5.4 5.1 5.0 5.0
4 2.0 6.7 5.8 7.4 5.4 5.2 4.9 4.8
5 1.0 1.9 6.5 5.6 7.2 5.3 5.1 4.8
6 9.0 1.0 1.9 6.3 5.4 7.0 5.1 4.9
7 4.0 8.0 0.9 1.7 5.6 4.8 6.2 4.5
8 8.0 3.9 7.8 0.8 1.6 5.5 4.7 6.1
9 2.0 8.2 4.0 7.9 0.9 1.7 5.6 4.8
10 8.0 1.9 7.8 3.8 7.6 0.8 1.6 5.3
11 6.0 7.3 1.7 7.1 3.5 6.9 0.7 1.4
12 6.0 5.9 7.1 1.7 7.0 3.4 6.8 0.7
PK-5 30.0 34.0 36.7 34.6 33.7 31.2 30.6 30.3
6-8 21.0 12.9 10.6 8.8 12.6 17.3 16.0 15.5
9-12 22.0 23.3 20.6 20.5 19.0 12.8 14.7 12.2
PK-12 73.0 70.2 67.9 63.9 65.3 61.3 61.3 58.0

SY2019/20 Demographic Report
136
Study Area 193 Projection Date 10/2/2019
CURRENT PROJECTED RESIDENT STUDENTS
2019 2020 2021 2022 2023 2024 2025 2026
PK 0.0 0.0 0.0 0.0 0.0 0.0 0.0 0.0
K 7.0 6.8 6.3 6.2 6.2 6.3 6.2 6.3
1 7.0 6.8 6.6 6.1 6.0 6.1 6.1 6.1
2 4.0 6.8 6.6 6.4 6.0 5.9 5.9 5.9
3 5.0 4.0 6.8 6.6 6.4 6.0 5.9 5.9
4 7.0 4.8 3.8 6.5 6.3 6.1 5.7 5.6
5 6.0 6.8 4.7 3.7 6.3 6.1 5.9 5.5
6 7.0 5.8 6.6 4.5 3.6 6.1 5.9 5.7
7 10.0 6.2 5.2 5.9 4.0 3.2 5.5 5.3
8 6.0 9.7 6.0 5.0 5.7 3.9 3.1 5.3
9 11.0 6.1 9.9 6.2 5.1 5.8 4.0 3.2
10 3.0 10.6 5.9 9.5 5.9 4.9 5.6 3.8
11 3.0 2.7 9.6 5.3 8.6 5.4 4.5 5.1
12 3.0 2.9 2.7 9.4 5.2 8.5 5.3 4.4
PK-5 36.0 36.0 34.8 35.5 37.2 36.5 35.7 35.3
6-8 23.0 21.7 17.8 15.4 13.3 13.2 14.5 16.3
9-12 20.0 22.3 28.1 30.4 24.8 24.6 19.4 16.5
PK-12 79.0 80.0 80.7 81.3 75.3 74.3 69.6 68.1
Study Area 194 Projection Date 10/2/2019
CURRENT PROJECTED RESIDENT STUDENTS
2019 2020 2021 2022 2023 2024 2025 2026
PK 0.0 0.0 0.0 0.0 0.0 0.0 0.0 0.0
K 3.0 2.9 3.0 3.1 3.0 3.0 3.0 3.0
1 2.0 2.9 3.1 3.2 3.0 2.9 2.9 2.9
2 0.0 1.9 3.1 3.3 3.1 2.9 2.8 2.8
3 5.0 0.0 2.2 3.4 3.3 3.1 2.9 2.8
4 4.0 4.8 0.3 2.4 3.2 3.1 3.0 2.8
5 6.0 3.9 4.9 0.5 2.3 3.1 3.0 2.9
6 5.0 5.8 4.0 5.0 0.5 2.3 3.0 2.9
7 6.0 4.4 5.4 3.8 4.5 0.5 2.0 2.7
8 7.0 5.8 4.6 5.5 3.7 4.4 0.4 1.9
9 2.0 7.1 6.2 5.0 5.6 3.8 4.4 0.5
10 9.0 1.9 7.1 6.2 4.8 5.4 3.6 4.3
11 4.0 8.2 2.0 6.7 5.7 4.3 4.9 3.3
12 9.0 3.9 8.3 2.2 6.6 5.6 4.2 4.8
PK-5 20.0 16.4 16.6 15.9 17.9 18.1 17.6 17.2
6-8 18.0 16.0 14.0 14.3 8.7 7.2 5.4 7.5
9-12 24.0 21.1 23.6 20.1 22.7 19.1 17.1 12.9
PK-12 62.0 53.5 54.2 50.3 49.3 44.4 40.1 37.6
Study Area 195 Projection Date 10/2/2019
CURRENT PROJECTED RESIDENT STUDENTS
2019 2020 2021 2022 2023 2024 2025 2026
PK 1.0 1.0 0.9 0.9 0.9 0.9 0.9 0.9
K 1.0 1.0 0.9 0.9 0.9 0.9 0.9 0.9
1 2.0 1.0 0.9 0.9 0.9 0.9 0.9 0.9
2 1.0 1.9 0.9 0.9 0.9 0.8 0.8 0.8
3 4.0 1.0 1.9 0.9 0.9 0.9 0.8 0.8
4 2.0 3.8 1.0 1.9 0.9 0.9 0.8 0.8
5 1.0 1.9 3.7 0.9 1.8 0.9 0.8 0.8
6 2.0 1.0 1.9 3.6 0.9 1.8 0.8 0.8
7 2.0 1.8 0.9 1.7 3.2 0.8 1.6 0.8
8 2.0 1.9 1.7 0.8 1.6 3.1 0.8 1.5
9 3.0 2.0 2.0 1.8 0.9 1.7 3.2 0.8
10 3.0 2.9 2.0 1.9 1.7 0.8 1.6 3.1
11 1.0 2.7 2.6 1.8 1.7 1.5 0.7 1.4
12 1.0 1.0 2.7 2.6 1.7 1.7 1.5 0.7
PK-5 12.0 11.6 10.2 7.3 7.2 6.2 5.9 5.9
6-8 6.0 4.7 4.5 6.1 5.7 5.7 3.2 3.1
9-12 8.0 8.6 9.3 8.1 6.0 5.7 7.0 6.0
PK-12 26.0 24.9 24.0 21.5 18.9 17.6 16.1 15.0

SY2019/20 Demographic Report
137
Study Area 196 Projection Date 10/2/2019
CURRENT PROJECTED RESIDENT STUDENTS
2019 2020 2021 2022 2023 2024 2025 2026
PK 0.0 0.0 0.0 0.0 0.0 0.0 0.0 0.0
K 4.0 3.9 3.6 3.6 3.6 3.6 3.6 3.6
1 3.0 3.9 3.7 3.5 3.4 3.5 3.5 3.5
2 7.0 2.9 3.8 3.6 3.4 3.3 3.4 3.4
3 7.0 7.0 2.9 3.8 3.6 3.4 3.3 3.4
4 6.0 6.7 6.7 2.8 3.6 3.5 3.3 3.2
5 4.0 5.8 6.5 6.5 2.7 3.5 3.4 3.2
6 5.0 3.9 5.6 6.3 6.3 2.6 3.4 3.3
7 4.0 4.4 3.5 5.0 5.6 5.6 2.3 3.0
8 4.0 3.9 4.3 3.3 4.9 5.5 5.5 2.3
9 4.0 4.1 4.0 4.4 3.4 5.0 5.6 5.6
10 3.0 3.8 3.9 3.8 4.2 3.3 4.8 5.3
11 4.0 2.7 3.5 3.6 3.5 3.8 3.0 4.3
12 7.0 3.9 2.7 3.4 3.5 3.4 3.8 2.9
PK-5 31.0 30.2 27.2 23.8 20.3 20.8 20.5 20.3
6-8 13.0 12.2 13.4 14.6 16.8 13.7 11.2 8.6
9-12 18.0 14.5 14.1 15.2 14.6 15.5 17.2 18.1
PK-12 62.0 56.9 54.7 53.6 51.7 50.0 48.9 47.0
Study Area 197 Projection Date 10/2/2019
CURRENT PROJECTED RESIDENT STUDENTS
2019 2020 2021 2022 2023 2024 2025 2026
PK 2.0 1.9 1.9 1.8 1.9 1.8 1.8 1.8
K 1.0 1.0 0.9 0.9 0.9 0.9 0.9 0.9
1 2.0 1.0 0.9 0.9 0.9 0.9 0.9 0.9
2 1.0 1.9 0.9 0.9 0.9 0.8 0.8 0.8
3 1.0 1.0 1.9 0.9 0.9 0.9 0.8 0.8
4 0.0 1.0 1.0 1.9 0.9 0.9 0.8 0.8
5 1.0 0.0 0.9 0.9 1.8 0.9 0.8 0.8
6 2.0 1.0 0.0 0.9 0.9 1.8 0.8 0.8
7 1.0 1.8 0.9 0.0 0.8 0.8 1.6 0.8
8 1.0 1.0 1.7 0.8 0.0 0.8 0.8 1.5
9 0.0 1.0 1.0 1.8 0.9 0.0 0.8 0.8
10 1.0 0.0 1.0 0.9 1.7 0.8 0.0 0.8
11 7.0 0.9 0.0 0.9 0.9 1.5 0.7 0.0
12 1.0 6.9 0.9 0.0 0.9 0.8 1.5 0.7
PK-5 8.0 7.8 8.4 8.2 8.2 7.1 6.8 6.8
6-8 4.0 3.8 2.6 1.7 1.7 3.4 3.2 3.1
9-12 9.0 8.8 2.9 3.6 4.4 3.1 3.0 2.3
PK-12 21.0 20.4 13.9 13.5 14.3 13.6 13.0 12.2
Study Area 198 Projection Date 10/2/2019
CURRENT PROJECTED RESIDENT STUDENTS
2019 2020 2021 2022 2023 2024 2025 2026
PK 2.0 1.9 1.9 1.8 1.9 1.8 1.8 1.8
K 6.0 5.8 5.4 5.3 5.4 5.4 5.4 5.4
1 5.0 5.8 5.6 5.3 5.2 5.2 5.2 5.2
2 7.0 4.8 5.6 5.4 5.1 5.0 5.0 5.1
3 3.0 7.0 4.8 5.6 5.4 5.1 5.0 5.0
4 1.0 2.9 6.7 4.7 5.4 5.2 4.9 4.8
5 5.0 1.0 2.8 6.5 4.5 5.3 5.1 4.8
6 4.0 4.8 0.9 2.7 6.3 4.4 5.1 4.9
7 4.0 3.6 4.3 0.8 2.4 5.6 3.9 4.5
8 3.0 3.9 3.5 4.2 0.8 2.3 5.5 3.8
9 3.0 3.1 4.0 3.5 4.3 0.8 2.4 5.6
10 3.0 2.9 2.9 3.8 3.4 4.1 0.8 2.3
11 5.0 2.7 2.6 2.7 3.5 3.1 3.7 0.7
12 5.0 4.9 2.7 2.6 2.6 3.4 3.0 3.7
PK-5 29.0 29.2 32.8 34.6 32.9 33.0 32.4 32.1
6-8 11.0 12.3 8.7 7.7 9.5 12.3 14.5 13.2
9-12 16.0 13.6 12.2 12.6 13.8 11.4 9.9 12.3
PK-12 56.0 55.1 53.7 54.9 56.2 56.7 56.8 57.6
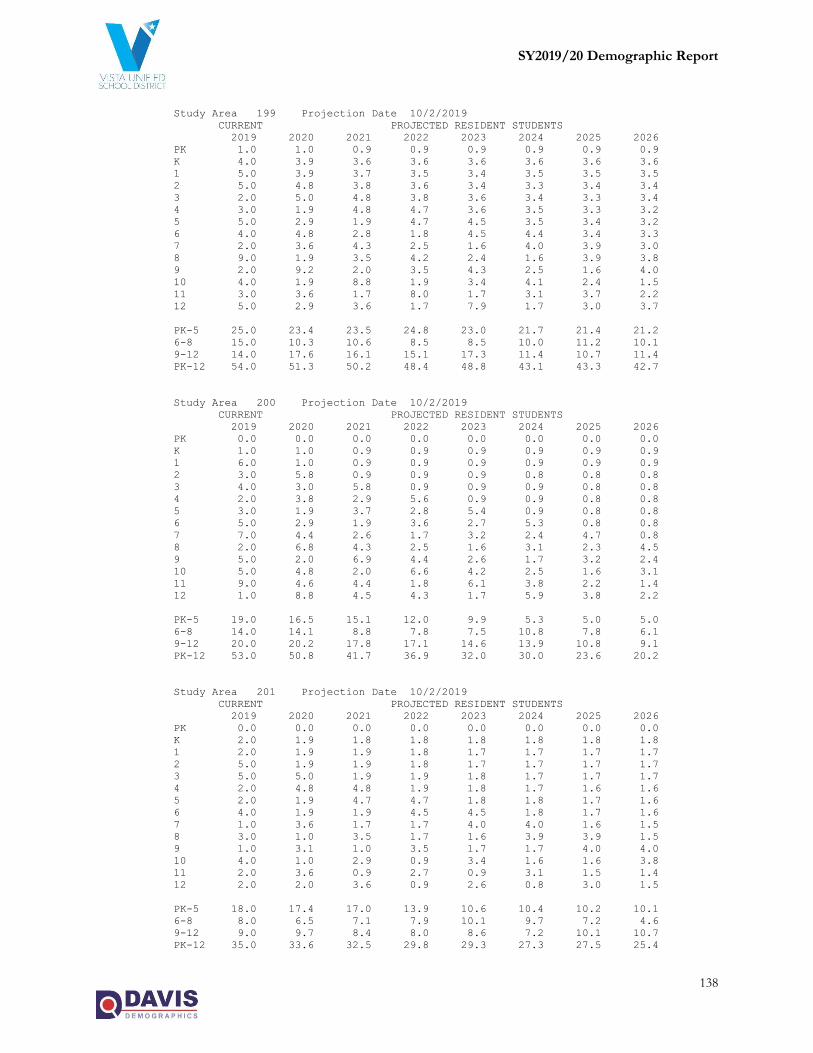
SY2019/20 Demographic Report
138
Study Area 199 Projection Date 10/2/2019
CURRENT PROJECTED RESIDENT STUDENTS
2019 2020 2021 2022 2023 2024 2025 2026
PK 1.0 1.0 0.9 0.9 0.9 0.9 0.9 0.9
K 4.0 3.9 3.6 3.6 3.6 3.6 3.6 3.6
1 5.0 3.9 3.7 3.5 3.4 3.5 3.5 3.5
2 5.0 4.8 3.8 3.6 3.4 3.3 3.4 3.4
3 2.0 5.0 4.8 3.8 3.6 3.4 3.3 3.4
4 3.0 1.9 4.8 4.7 3.6 3.5 3.3 3.2
5 5.0 2.9 1.9 4.7 4.5 3.5 3.4 3.2
6 4.0 4.8 2.8 1.8 4.5 4.4 3.4 3.3
7 2.0 3.6 4.3 2.5 1.6 4.0 3.9 3.0
8 9.0 1.9 3.5 4.2 2.4 1.6 3.9 3.8
9 2.0 9.2 2.0 3.5 4.3 2.5 1.6 4.0
10 4.0 1.9 8.8 1.9 3.4 4.1 2.4 1.5
11 3.0 3.6 1.7 8.0 1.7 3.1 3.7 2.2
12 5.0 2.9 3.6 1.7 7.9 1.7 3.0 3.7
PK-5 25.0 23.4 23.5 24.8 23.0 21.7 21.4 21.2
6-8 15.0 10.3 10.6 8.5 8.5 10.0 11.2 10.1
9-12 14.0 17.6 16.1 15.1 17.3 11.4 10.7 11.4
PK-12 54.0 51.3 50.2 48.4 48.8 43.1 43.3 42.7
Study Area 200 Projection Date 10/2/2019
CURRENT PROJECTED RESIDENT STUDENTS
2019 2020 2021 2022 2023 2024 2025 2026
PK 0.0 0.0 0.0 0.0 0.0 0.0 0.0 0.0
K 1.0 1.0 0.9 0.9 0.9 0.9 0.9 0.9
1 6.0 1.0 0.9 0.9 0.9 0.9 0.9 0.9
2 3.0 5.8 0.9 0.9 0.9 0.8 0.8 0.8
3 4.0 3.0 5.8 0.9 0.9 0.9 0.8 0.8
4 2.0 3.8 2.9 5.6 0.9 0.9 0.8 0.8
5 3.0 1.9 3.7 2.8 5.4 0.9 0.8 0.8
6 5.0 2.9 1.9 3.6 2.7 5.3 0.8 0.8
7 7.0 4.4 2.6 1.7 3.2 2.4 4.7 0.8
8 2.0 6.8 4.3 2.5 1.6 3.1 2.3 4.5
9 5.0 2.0 6.9 4.4 2.6 1.7 3.2 2.4
10 5.0 4.8 2.0 6.6 4.2 2.5 1.6 3.1
11 9.0 4.6 4.4 1.8 6.1 3.8 2.2 1.4
12 1.0 8.8 4.5 4.3 1.7 5.9 3.8 2.2
PK-5 19.0 16.5 15.1 12.0 9.9 5.3 5.0 5.0
6-8 14.0 14.1 8.8 7.8 7.5 10.8 7.8 6.1
9-12 20.0 20.2 17.8 17.1 14.6 13.9 10.8 9.1
PK-12 53.0 50.8 41.7 36.9 32.0 30.0 23.6 20.2
Study Area 201 Projection Date 10/2/2019
CURRENT PROJECTED RESIDENT STUDENTS
2019 2020 2021 2022 2023 2024 2025 2026
PK 0.0 0.0 0.0 0.0 0.0 0.0 0.0 0.0
K 2.0 1.9 1.8 1.8 1.8 1.8 1.8 1.8
1 2.0 1.9 1.9 1.8 1.7 1.7 1.7 1.7
2 5.0 1.9 1.9 1.8 1.7 1.7 1.7 1.7
3 5.0 5.0 1.9 1.9 1.8 1.7 1.7 1.7
4 2.0 4.8 4.8 1.9 1.8 1.7 1.6 1.6
5 2.0 1.9 4.7 4.7 1.8 1.8 1.7 1.6
6 4.0 1.9 1.9 4.5 4.5 1.8 1.7 1.6
7 1.0 3.6 1.7 1.7 4.0 4.0 1.6 1.5
8 3.0 1.0 3.5 1.7 1.6 3.9 3.9 1.5
9 1.0 3.1 1.0 3.5 1.7 1.7 4.0 4.0
10 4.0 1.0 2.9 0.9 3.4 1.6 1.6 3.8
11 2.0 3.6 0.9 2.7 0.9 3.1 1.5 1.4
12 2.0 2.0 3.6 0.9 2.6 0.8 3.0 1.5
PK-5 18.0 17.4 17.0 13.9 10.6 10.4 10.2 10.1
6-8 8.0 6.5 7.1 7.9 10.1 9.7 7.2 4.6
9-12 9.0 9.7 8.4 8.0 8.6 7.2 10.1 10.7
PK-12 35.0 33.6 32.5 29.8 29.3 27.3 27.5 25.4
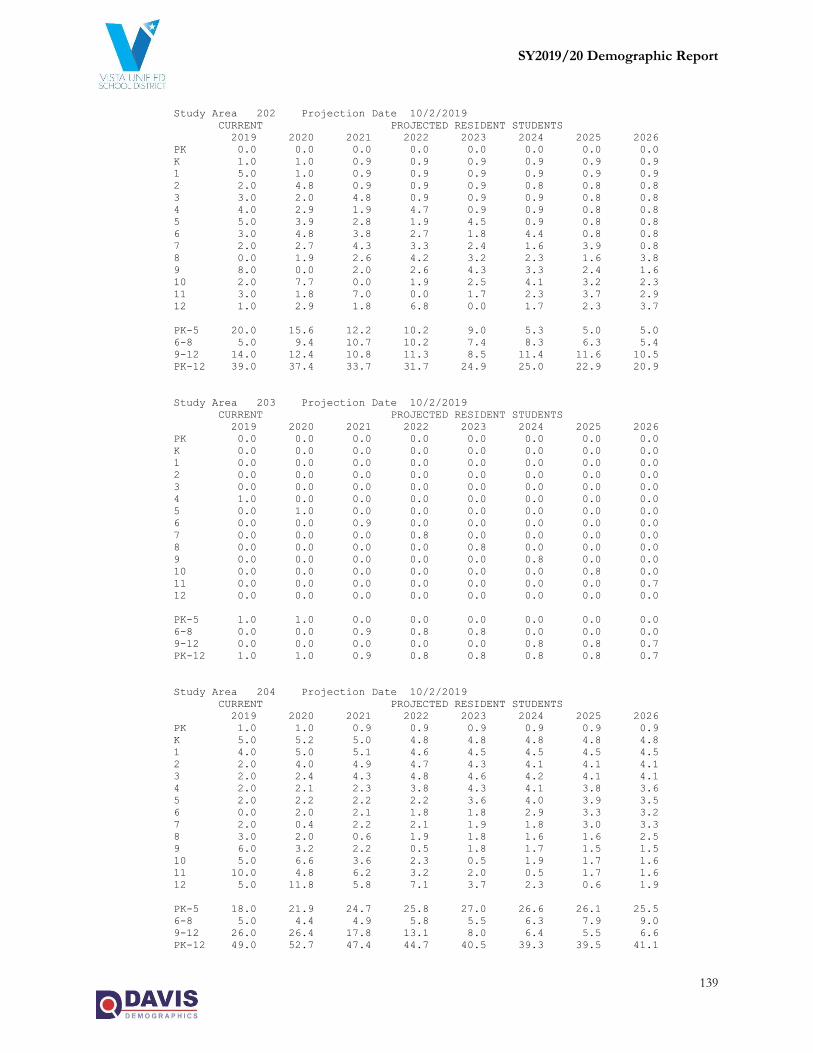
SY2019/20 Demographic Report
139
Study Area 202 Projection Date 10/2/2019
CURRENT PROJECTED RESIDENT STUDENTS
2019 2020 2021 2022 2023 2024 2025 2026
PK 0.0 0.0 0.0 0.0 0.0 0.0 0.0 0.0
K 1.0 1.0 0.9 0.9 0.9 0.9 0.9 0.9
1 5.0 1.0 0.9 0.9 0.9 0.9 0.9 0.9
2 2.0 4.8 0.9 0.9 0.9 0.8 0.8 0.8
3 3.0 2.0 4.8 0.9 0.9 0.9 0.8 0.8
4 4.0 2.9 1.9 4.7 0.9 0.9 0.8 0.8
5 5.0 3.9 2.8 1.9 4.5 0.9 0.8 0.8
6 3.0 4.8 3.8 2.7 1.8 4.4 0.8 0.8
7 2.0 2.7 4.3 3.3 2.4 1.6 3.9 0.8
8 0.0 1.9 2.6 4.2 3.2 2.3 1.6 3.8
9 8.0 0.0 2.0 2.6 4.3 3.3 2.4 1.6
10 2.0 7.7 0.0 1.9 2.5 4.1 3.2 2.3
11 3.0 1.8 7.0 0.0 1.7 2.3 3.7 2.9
12 1.0 2.9 1.8 6.8 0.0 1.7 2.3 3.7
PK-5 20.0 15.6 12.2 10.2 9.0 5.3 5.0 5.0
6-8 5.0 9.4 10.7 10.2 7.4 8.3 6.3 5.4
9-12 14.0 12.4 10.8 11.3 8.5 11.4 11.6 10.5
PK-12 39.0 37.4 33.7 31.7 24.9 25.0 22.9 20.9
Study Area 203 Projection Date 10/2/2019
CURRENT PROJECTED RESIDENT STUDENTS
2019 2020 2021 2022 2023 2024 2025 2026
PK 0.0 0.0 0.0 0.0 0.0 0.0 0.0 0.0
K 0.0 0.0 0.0 0.0 0.0 0.0 0.0 0.0
1 0.0 0.0 0.0 0.0 0.0 0.0 0.0 0.0
2 0.0 0.0 0.0 0.0 0.0 0.0 0.0 0.0
3 0.0 0.0 0.0 0.0 0.0 0.0 0.0 0.0
4 1.0 0.0 0.0 0.0 0.0 0.0 0.0 0.0
5 0.0 1.0 0.0 0.0 0.0 0.0 0.0 0.0
6 0.0 0.0 0.9 0.0 0.0 0.0 0.0 0.0
7 0.0 0.0 0.0 0.8 0.0 0.0 0.0 0.0
8 0.0 0.0 0.0 0.0 0.8 0.0 0.0 0.0
9 0.0 0.0 0.0 0.0 0.0 0.8 0.0 0.0
10 0.0 0.0 0.0 0.0 0.0 0.0 0.8 0.0
11 0.0 0.0 0.0 0.0 0.0 0.0 0.0 0.7
12 0.0 0.0 0.0 0.0 0.0 0.0 0.0 0.0
PK-5 1.0 1.0 0.0 0.0 0.0 0.0 0.0 0.0
6-8 0.0 0.0 0.9 0.8 0.8 0.0 0.0 0.0
9-12 0.0 0.0 0.0 0.0 0.0 0.8 0.8 0.7
PK-12 1.0 1.0 0.9 0.8 0.8 0.8 0.8 0.7
Study Area 204 Projection Date 10/2/2019
CURRENT PROJECTED RESIDENT STUDENTS
2019 2020 2021 2022 2023 2024 2025 2026
PK 1.0 1.0 0.9 0.9 0.9 0.9 0.9 0.9
K 5.0 5.2 5.0 4.8 4.8 4.8 4.8 4.8
1 4.0 5.0 5.1 4.6 4.5 4.5 4.5 4.5
2 2.0 4.0 4.9 4.7 4.3 4.1 4.1 4.1
3 2.0 2.4 4.3 4.8 4.6 4.2 4.1 4.1
4 2.0 2.1 2.3 3.8 4.3 4.1 3.8 3.6
5 2.0 2.2 2.2 2.2 3.6 4.0 3.9 3.5
6 0.0 2.0 2.1 1.8 1.8 2.9 3.3 3.2
7 2.0 0.4 2.2 2.1 1.9 1.8 3.0 3.3
8 3.0 2.0 0.6 1.9 1.8 1.6 1.6 2.5
9 6.0 3.2 2.2 0.5 1.8 1.7 1.5 1.5
10 5.0 6.6 3.6 2.3 0.5 1.9 1.7 1.6
11 10.0 4.8 6.2 3.2 2.0 0.5 1.7 1.6
12 5.0 11.8 5.8 7.1 3.7 2.3 0.6 1.9
PK-5 18.0 21.9 24.7 25.8 27.0 26.6 26.1 25.5
6-8 5.0 4.4 4.9 5.8 5.5 6.3 7.9 9.0
9-12 26.0 26.4 17.8 13.1 8.0 6.4 5.5 6.6
PK-12 49.0 52.7 47.4 44.7 40.5 39.3 39.5 41.1
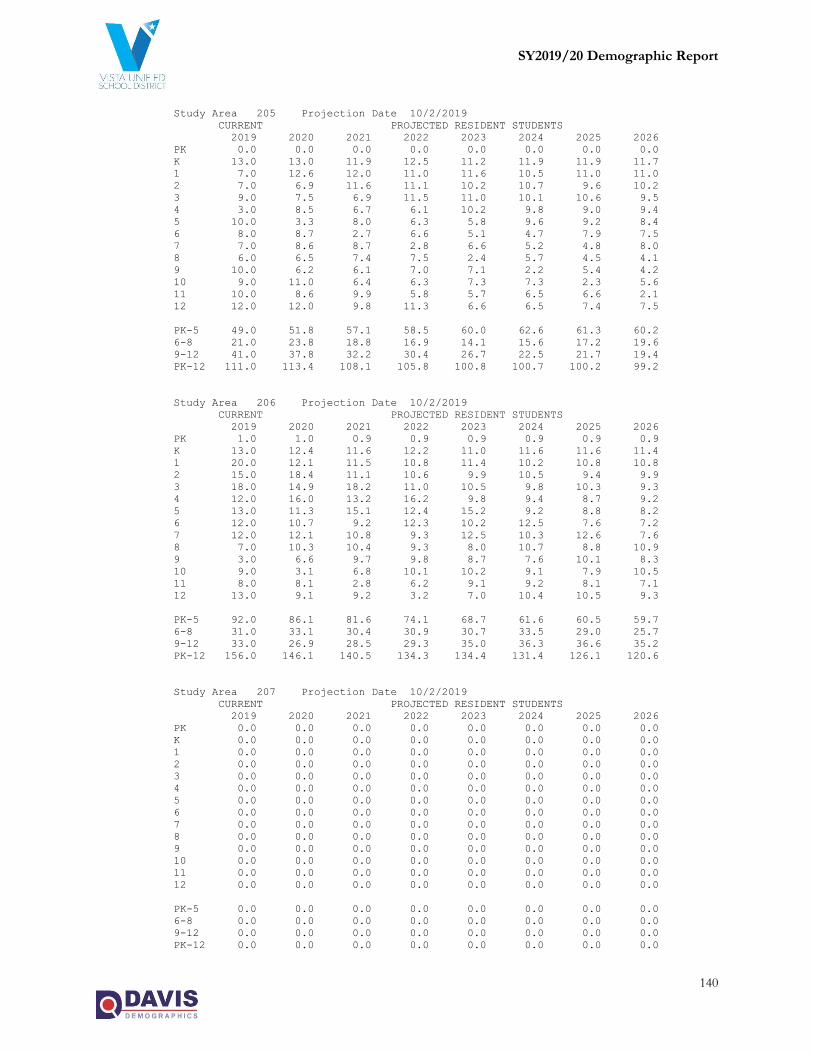
SY2019/20 Demographic Report
140
Study Area 205 Projection Date 10/2/2019
CURRENT PROJECTED RESIDENT STUDENTS
2019 2020 2021 2022 2023 2024 2025 2026
PK 0.0 0.0 0.0 0.0 0.0 0.0 0.0 0.0
K 13.0 13.0 11.9 12.5 11.2 11.9 11.9 11.7
1 7.0 12.6 12.0 11.0 11.6 10.5 11.0 11.0
2 7.0 6.9 11.6 11.1 10.2 10.7 9.6 10.2
3 9.0 7.5 6.9 11.5 11.0 10.1 10.6 9.5
4 3.0 8.5 6.7 6.1 10.2 9.8 9.0 9.4
5 10.0 3.3 8.0 6.3 5.8 9.6 9.2 8.4
6 8.0 8.7 2.7 6.6 5.1 4.7 7.9 7.5
7 7.0 8.6 8.7 2.8 6.6 5.2 4.8 8.0
8 6.0 6.5 7.4 7.5 2.4 5.7 4.5 4.1
9 10.0 6.2 6.1 7.0 7.1 2.2 5.4 4.2
10 9.0 11.0 6.4 6.3 7.3 7.3 2.3 5.6
11 10.0 8.6 9.9 5.8 5.7 6.5 6.6 2.1
12 12.0 12.0 9.8 11.3 6.6 6.5 7.4 7.5
PK-5 49.0 51.8 57.1 58.5 60.0 62.6 61.3 60.2
6-8 21.0 23.8 18.8 16.9 14.1 15.6 17.2 19.6
9-12 41.0 37.8 32.2 30.4 26.7 22.5 21.7 19.4
PK-12 111.0 113.4 108.1 105.8 100.8 100.7 100.2 99.2
Study Area 206 Projection Date 10/2/2019
CURRENT PROJECTED RESIDENT STUDENTS
2019 2020 2021 2022 2023 2024 2025 2026
PK 1.0 1.0 0.9 0.9 0.9 0.9 0.9 0.9
K 13.0 12.4 11.6 12.2 11.0 11.6 11.6 11.4
1 20.0 12.1 11.5 10.8 11.4 10.2 10.8 10.8
2 15.0 18.4 11.1 10.6 9.9 10.5 9.4 9.9
3 18.0 14.9 18.2 11.0 10.5 9.8 10.3 9.3
4 12.0 16.0 13.2 16.2 9.8 9.4 8.7 9.2
5 13.0 11.3 15.1 12.4 15.2 9.2 8.8 8.2
6 12.0 10.7 9.2 12.3 10.2 12.5 7.6 7.2
7 12.0 12.1 10.8 9.3 12.5 10.3 12.6 7.6
8 7.0 10.3 10.4 9.3 8.0 10.7 8.8 10.9
9 3.0 6.6 9.7 9.8 8.7 7.6 10.1 8.3
10 9.0 3.1 6.8 10.1 10.2 9.1 7.9 10.5
11 8.0 8.1 2.8 6.2 9.1 9.2 8.1 7.1
12 13.0 9.1 9.2 3.2 7.0 10.4 10.5 9.3
PK-5 92.0 86.1 81.6 74.1 68.7 61.6 60.5 59.7
6-8 31.0 33.1 30.4 30.9 30.7 33.5 29.0 25.7
9-12 33.0 26.9 28.5 29.3 35.0 36.3 36.6 35.2
PK-12 156.0 146.1 140.5 134.3 134.4 131.4 126.1 120.6
Study Area 207 Projection Date 10/2/2019
CURRENT PROJECTED RESIDENT STUDENTS
2019 2020 2021 2022 2023 2024 2025 2026
PK 0.0 0.0 0.0 0.0 0.0 0.0 0.0 0.0
K 0.0 0.0 0.0 0.0 0.0 0.0 0.0 0.0
1 0.0 0.0 0.0 0.0 0.0 0.0 0.0 0.0
2 0.0 0.0 0.0 0.0 0.0 0.0 0.0 0.0
3 0.0 0.0 0.0 0.0 0.0 0.0 0.0 0.0
4 0.0 0.0 0.0 0.0 0.0 0.0 0.0 0.0
5 0.0 0.0 0.0 0.0 0.0 0.0 0.0 0.0
6 0.0 0.0 0.0 0.0 0.0 0.0 0.0 0.0
7 0.0 0.0 0.0 0.0 0.0 0.0 0.0 0.0
8 0.0 0.0 0.0 0.0 0.0 0.0 0.0 0.0
9 0.0 0.0 0.0 0.0 0.0 0.0 0.0 0.0
10 0.0 0.0 0.0 0.0 0.0 0.0 0.0 0.0
11 0.0 0.0 0.0 0.0 0.0 0.0 0.0 0.0
12 0.0 0.0 0.0 0.0 0.0 0.0 0.0 0.0
PK-5 0.0 0.0 0.0 0.0 0.0 0.0 0.0 0.0
6-8 0.0 0.0 0.0 0.0 0.0 0.0 0.0 0.0
9-12 0.0 0.0 0.0 0.0 0.0 0.0 0.0 0.0
PK-12 0.0 0.0 0.0 0.0 0.0 0.0 0.0 0.0

SY2019/20 Demographic Report
141
Study Area 208 Projection Date 10/2/2019
CURRENT PROJECTED RESIDENT STUDENTS
2019 2020 2021 2022 2023 2024 2025 2026
PK 2.0 1.9 1.9 1.8 1.9 1.8 1.8 1.8
K 8.0 7.6 7.1 7.5 6.7 7.1 7.1 7.0
1 7.0 7.4 7.1 6.6 7.0 6.3 6.6 6.6
2 5.0 6.4 6.8 6.5 6.1 6.4 5.8 6.1
3 14.0 4.9 6.4 6.8 6.5 6.0 6.4 5.7
4 14.0 12.5 4.4 5.7 6.0 5.8 5.4 5.7
5 12.0 13.2 11.7 4.1 5.3 5.7 5.4 5.1
6 9.0 9.8 10.8 9.6 3.4 4.4 4.6 4.4
7 12.0 9.1 9.9 10.9 9.7 3.4 4.4 4.7
8 12.0 10.3 7.8 8.5 9.4 8.3 2.9 3.8
9 11.0 11.3 9.7 7.3 8.0 8.8 7.8 2.8
10 14.0 11.4 11.7 10.1 7.6 8.4 9.2 8.2
11 8.0 12.6 10.3 10.6 9.1 6.9 7.5 8.2
12 6.0 9.1 14.4 11.7 12.0 10.4 7.8 8.6
PK-5 62.0 53.9 45.4 39.0 39.5 39.1 38.5 38.0
6-8 33.0 29.2 28.5 29.0 22.5 16.1 11.9 12.9
9-12 39.0 44.4 46.1 39.7 36.7 34.5 32.3 27.8
PK-12 134.0 127.5 120.0 107.7 98.7 89.7 82.7 78.7
Study Area 209 Projection Date 10/2/2019
CURRENT PROJECTED RESIDENT STUDENTS
2019 2020 2021 2022 2023 2024 2025 2026
PK 1.0 1.0 0.9 0.9 0.9 0.9 0.9 0.9
K 3.0 2.9 2.7 2.8 2.5 2.7 2.7 2.6
1 5.0 2.8 2.7 2.5 2.6 2.4 2.5 2.5
2 6.0 4.6 2.6 2.4 2.3 2.4 2.2 2.3
3 6.0 5.9 4.6 2.5 2.4 2.3 2.4 2.1
4 4.0 5.3 5.3 4.1 2.3 2.2 2.0 2.1
5 5.0 3.8 5.0 5.0 3.8 2.1 2.0 1.9
6 5.0 4.1 3.1 4.1 4.1 3.1 1.7 1.7
7 3.0 5.1 4.1 3.1 4.2 4.1 3.2 1.8
8 4.0 2.6 4.3 3.6 2.7 3.6 3.5 2.7
9 7.0 3.8 2.4 4.1 3.3 2.5 3.4 3.3
10 4.0 7.3 3.9 2.5 4.2 3.5 2.6 3.5
11 6.0 3.6 6.6 3.5 2.3 3.8 3.1 2.4
12 1.0 6.8 4.1 7.5 4.0 2.6 4.4 3.6
PK-5 30.0 26.3 23.8 20.2 16.8 15.0 14.7 14.4
6-8 12.0 11.8 11.5 10.8 11.0 10.8 8.4 6.2
9-12 18.0 21.5 17.0 17.6 13.8 12.4 13.5 12.8
PK-12 60.0 59.6 52.3 48.6 41.6 38.2 36.6 33.4
Study Area 210 Projection Date 10/2/2019
CURRENT PROJECTED RESIDENT STUDENTS
2019 2020 2021 2022 2023 2024 2025 2026
PK 1.0 1.0 0.9 0.9 0.9 0.9 0.9 0.9
K 2.0 1.9 1.8 2.5 2.0 2.1 2.1 2.1
1 5.0 1.9 1.8 2.2 2.3 1.9 2.0 2.0
2 3.0 4.6 1.7 2.2 2.1 2.1 1.7 1.8
3 1.0 3.0 4.6 2.3 2.2 2.0 2.1 1.7
4 5.0 0.9 2.6 4.6 2.1 1.9 1.8 1.9
5 4.0 4.7 0.8 3.1 4.3 1.9 1.8 1.7
6 1.0 3.3 3.9 1.2 2.5 3.6 1.6 1.5
7 3.0 1.0 3.3 4.5 1.2 2.5 3.6 1.6
8 2.0 2.6 0.9 3.4 3.9 1.0 2.2 3.1
9 4.0 1.9 2.4 1.4 3.2 3.7 1.0 2.1
10 2.0 4.2 2.0 3.2 1.5 3.3 3.8 1.0
11 5.0 1.8 3.7 2.3 2.9 1.3 3.0 3.4
12 5.0 5.7 2.1 5.0 2.6 3.3 1.5 3.4
PK-5 21.0 18.0 14.2 17.8 15.9 12.8 12.4 12.1
6-8 6.0 6.9 8.1 9.1 7.6 7.1 7.4 6.2
9-12 16.0 13.6 10.2 11.9 10.2 11.6 9.3 9.9
PK-12 43.0 38.5 32.5 38.8 33.7 31.5 29.1 28.2

SY2019/20 Demographic Report
142
Study Area 211 Projection Date 10/2/2019
CURRENT PROJECTED RESIDENT STUDENTS
2019 2020 2021 2022 2023 2024 2025 2026
PK 4.0 3.8 3.8 3.6 3.7 3.7 3.7 3.7
K 13.0 12.4 11.6 12.2 11.0 11.6 11.6 11.4
1 7.0 12.1 11.5 10.8 11.4 10.2 10.8 10.8
2 10.0 6.4 11.1 10.6 9.9 10.5 9.4 9.9
3 13.0 9.9 6.4 11.0 10.5 9.8 10.3 9.3
4 10.0 11.6 8.8 5.7 9.8 9.4 8.7 9.2
5 12.0 9.4 10.9 8.3 5.3 9.2 8.8 8.2
6 9.0 9.8 7.7 8.9 6.8 4.4 7.6 7.2
7 12.0 9.1 9.9 7.8 9.0 6.9 4.4 7.6
8 5.0 10.3 7.8 8.5 6.7 7.7 5.9 3.8
9 14.0 4.7 9.7 7.3 8.0 6.3 7.3 5.5
10 12.0 14.6 4.9 10.1 7.6 8.4 6.5 7.6
11 16.0 10.8 13.1 4.4 9.1 6.9 7.5 5.9
12 15.0 18.2 12.3 14.9 5.0 10.4 7.8 8.6
PK-5 69.0 65.6 64.1 62.2 61.6 64.4 63.3 62.5
6-8 26.0 29.2 25.4 25.2 22.5 19.0 17.9 18.6
9-12 57.0 48.3 40.0 36.7 29.7 32.0 29.1 27.6
PK-12 152.0 143.1 129.5 124.1 113.8 115.4 110.3 108.7
Study Area 212 Projection Date 10/2/2019
CURRENT PROJECTED RESIDENT STUDENTS
2019 2020 2021 2022 2023 2024 2025 2026
PK 1.0 1.0 0.9 0.9 0.9 0.9 0.9 0.9
K 12.0 11.5 10.7 11.3 10.1 10.7 10.7 10.5
1 9.0 11.2 10.6 9.9 10.5 9.4 9.9 9.9
2 6.0 8.3 10.3 9.8 9.1 9.6 8.6 9.1
3 12.0 5.9 8.2 10.2 9.7 9.1 9.6 8.6
4 5.0 10.7 5.3 7.3 9.0 8.6 8.1 8.5
5 9.0 4.7 10.0 5.0 6.9 8.5 8.1 7.6
6 5.0 7.4 3.9 8.2 4.1 5.6 7.0 6.7
7 5.0 5.1 7.5 3.9 8.3 4.1 5.7 7.0
8 6.0 4.3 4.3 6.4 3.3 7.2 3.5 4.9
9 6.0 5.6 4.0 4.1 6.0 3.1 6.7 3.3
10 8.0 6.2 5.9 4.2 4.2 6.3 3.3 7.0
11 14.0 7.2 5.6 5.3 3.8 3.8 5.6 2.9
12 5.0 16.0 8.2 6.4 6.0 4.3 4.4 6.4
PK-5 54.0 53.3 56.0 54.4 56.2 56.8 55.9 55.1
6-8 16.0 16.8 15.7 18.5 15.7 16.9 16.2 18.6
9-12 33.0 35.0 23.7 20.0 20.0 17.5 20.0 19.6
PK-12 103.0 105.1 95.4 92.9 91.9 91.2 92.1 93.3
Study Area 213 Projection Date 10/2/2019
CURRENT PROJECTED RESIDENT STUDENTS
2019 2020 2021 2022 2023 2024 2025 2026
PK 0.0 0.0 0.0 0.0 0.0 0.0 0.0 0.0
K 1.0 1.0 0.9 0.9 0.8 0.9 0.9 0.9
1 3.0 0.9 0.9 0.8 0.9 0.8 0.8 0.8
2 0.0 2.8 0.9 0.8 0.8 0.8 0.7 0.8
3 2.0 0.0 2.7 0.8 0.8 0.8 0.8 0.7
4 1.0 1.8 0.0 2.4 0.8 0.7 0.7 0.7
5 1.0 0.9 1.7 0.0 2.3 0.7 0.7 0.6
6 3.0 0.8 0.8 1.4 0.0 1.9 0.6 0.6
7 1.0 3.0 0.8 0.8 1.4 0.0 1.9 0.6
8 0.0 0.9 2.6 0.7 0.7 1.2 0.0 1.6
9 2.0 0.0 0.8 2.4 0.7 0.6 1.1 0.0
10 0.0 2.1 0.0 0.8 2.5 0.7 0.7 1.2
11 2.0 0.0 1.9 0.0 0.8 2.3 0.6 0.6
12 2.0 2.3 0.0 2.1 0.0 0.9 2.6 0.7
PK-5 8.0 7.4 7.1 5.7 6.4 4.7 4.6 4.5
6-8 4.0 4.7 4.2 2.9 2.1 3.1 2.5 2.8
9-12 6.0 4.4 2.7 5.3 4.0 4.5 5.0 2.5
PK-12 18.0 16.5 14.0 13.9 12.5 12.3 12.1 9.8

SY2019/20 Demographic Report
143
Study Area 214 Projection Date 10/2/2019
CURRENT PROJECTED RESIDENT STUDENTS
2019 2020 2021 2022 2023 2024 2025 2026
PK 2.0 1.9 1.9 1.8 1.9 1.8 1.8 1.8
K 7.0 6.7 6.5 7.0 6.2 6.5 6.5 6.4
1 8.0 6.5 6.4 6.3 6.5 5.7 6.0 6.0
2 9.0 7.4 6.2 6.1 5.8 6.0 5.3 5.6
3 5.0 8.9 7.5 6.4 6.1 5.7 5.9 5.2
4 5.0 4.4 8.1 6.9 5.7 5.4 5.1 5.2
5 7.0 4.7 4.4 7.9 6.5 5.3 5.1 4.8
6 8.0 5.7 4.1 3.8 6.5 5.3 4.4 4.2
7 4.0 8.1 6.0 4.3 3.9 6.5 5.4 4.4
8 9.0 3.4 7.2 5.4 3.7 3.3 5.6 4.6
9 7.0 8.5 3.5 7.0 5.1 3.5 3.1 5.3
10 8.0 7.3 9.1 3.9 7.2 5.3 3.6 3.2
11 7.0 7.2 6.8 8.4 3.5 6.5 4.8 3.3
12 5.0 8.0 8.5 8.0 9.5 4.0 7.4 5.4
PK-5 43.0 40.5 41.0 42.4 38.7 36.4 35.7 35.0
6-8 21.0 17.2 17.3 13.5 14.1 15.1 15.4 13.2
9-12 27.0 31.0 27.9 27.3 25.3 19.3 18.9 17.2
PK-12 91.0 88.7 86.2 83.2 78.1 70.8 70.0 65.4
Study Area 215 Projection Date 10/2/2019
CURRENT PROJECTED RESIDENT STUDENTS
2019 2020 2021 2022 2023 2024 2025 2026
PK 0.0 0.0 0.0 0.0 0.0 0.0 0.0 0.0
K 5.0 4.8 4.5 4.7 4.2 4.5 4.5 4.4
1 0.0 4.7 4.4 4.1 4.4 3.9 4.1 4.1
2 0.0 0.0 4.3 4.1 3.8 4.0 3.6 3.8
3 2.0 0.0 0.0 4.2 4.0 3.8 4.0 3.6
4 2.0 1.8 0.0 0.0 3.8 3.6 3.4 3.5
5 1.0 1.9 1.7 0.0 0.0 3.5 3.4 3.2
6 3.0 0.8 1.5 1.4 0.0 0.0 2.9 2.8
7 2.0 3.0 0.8 1.6 1.4 0.0 0.0 2.9
8 2.0 1.7 2.6 0.7 1.3 1.2 0.0 0.0
9 3.0 1.9 1.6 2.4 0.7 1.3 1.1 0.0
10 1.0 3.1 2.0 1.7 2.5 0.7 1.3 1.2
11 1.0 0.9 2.8 1.8 1.5 2.3 0.6 1.2
12 3.0 1.1 1.0 3.2 2.0 1.7 2.6 0.7
PK-5 10.0 13.2 14.9 17.1 20.2 23.3 23.0 22.6
6-8 7.0 5.5 4.9 3.7 2.7 1.2 2.9 5.7
9-12 8.0 7.0 7.4 9.1 6.7 6.0 5.6 3.1
PK-12 25.0 25.7 27.2 29.9 29.6 30.5 31.5 31.4
Study Area 216 Projection Date 10/2/2019
CURRENT PROJECTED RESIDENT STUDENTS
2019 2020 2021 2022 2023 2024 2025 2026
PK 1.0 1.0 0.9 0.9 0.9 0.9 0.9 0.9
K 4.0 3.9 3.6 3.6 3.6 3.6 3.6 3.6
1 1.0 3.7 3.6 3.4 3.3 3.3 3.3 3.3
2 2.0 0.9 3.4 3.3 3.1 3.0 3.1 3.1
3 5.0 2.0 0.9 3.4 3.3 3.1 3.0 3.0
4 2.0 4.4 1.8 0.8 3.0 2.9 2.7 2.7
5 3.0 1.9 4.2 1.7 0.8 2.8 2.7 2.6
6 3.0 2.5 1.5 3.4 1.4 0.6 2.3 2.2
7 4.0 3.0 2.5 1.6 3.5 1.4 0.6 2.3
8 6.0 3.4 2.6 2.1 1.3 3.0 1.2 0.5
9 0.0 5.6 3.2 2.4 2.0 1.3 2.8 1.1
10 2.0 0.0 5.9 3.4 2.5 2.1 1.3 2.9
11 3.0 1.8 0.0 5.3 3.0 2.3 1.9 1.2
12 3.0 3.4 2.1 0.0 6.0 3.5 2.6 2.1
PK-5 18.0 17.8 18.4 17.1 18.0 19.6 19.3 19.2
6-8 13.0 8.9 6.6 7.1 6.2 5.0 4.1 5.0
9-12 8.0 10.8 11.2 11.1 13.5 9.2 8.6 7.3
PK-12 39.0 37.5 36.2 35.3 37.7 33.8 32.0 31.5

SY2019/20 Demographic Report
144
Study Area 217 Projection Date 10/2/2019
CURRENT PROJECTED RESIDENT STUDENTS
2019 2020 2021 2022 2023 2024 2025 2026
PK 0.0 0.0 0.0 0.0 0.0 0.0 0.0 0.0
K 4.0 3.9 3.6 3.6 3.6 3.6 3.6 3.6
1 3.0 3.7 3.6 3.4 3.3 3.3 3.3 3.3
2 2.0 2.8 3.4 3.3 3.1 3.0 3.1 3.1
3 0.0 2.0 2.7 3.4 3.3 3.1 3.0 3.0
4 5.0 0.0 1.8 2.4 3.0 2.9 2.7 2.7
5 0.0 4.7 0.0 1.7 2.3 2.8 2.7 2.6
6 5.0 0.0 3.9 0.0 1.4 1.9 2.3 2.2
7 3.0 5.1 0.0 3.9 0.0 1.4 1.9 2.3
8 4.0 2.6 4.3 0.0 3.3 0.0 1.2 1.6
9 1.0 3.8 2.4 4.1 0.0 3.1 0.0 1.1
10 5.0 1.0 3.9 2.5 4.2 0.0 3.3 0.0
11 1.0 4.5 0.9 3.5 2.3 3.8 0.0 2.9
12 3.0 1.1 5.1 1.1 4.0 2.6 4.4 0.0
PK-5 14.0 17.1 15.1 17.8 18.6 18.7 18.4 18.3
6-8 12.0 7.7 8.2 3.9 4.7 3.3 5.4 6.1
9-12 10.0 10.4 12.3 11.2 10.5 9.5 7.7 4.0
PK-12 36.0 35.2 35.6 32.9 33.8 31.5 31.5 28.4
Study Area 218 Projection Date 10/2/2019
CURRENT PROJECTED RESIDENT STUDENTS
2019 2020 2021 2022 2023 2024 2025 2026
PK 0.0 0.0 0.0 0.0 0.0 0.0 0.0 0.0
K 8.0 7.7 7.2 7.1 7.1 7.2 7.1 7.1
1 5.0 7.4 7.2 6.7 6.6 6.6 6.7 6.6
2 1.0 4.6 6.8 6.6 6.2 6.1 6.1 6.1
3 4.0 1.0 4.6 6.8 6.5 6.1 6.0 6.0
4 3.0 3.6 0.9 4.1 6.0 5.8 5.5 5.4
5 2.0 2.8 3.3 0.8 3.8 5.7 5.5 5.1
6 2.0 1.6 2.3 2.7 0.7 3.1 4.6 4.5
7 4.0 2.0 1.7 2.3 2.8 0.7 3.2 4.7
8 4.0 3.4 1.7 1.4 2.0 2.4 0.6 2.7
9 2.0 3.8 3.2 1.6 1.3 1.9 2.2 0.6
10 5.0 2.1 3.9 3.4 1.7 1.4 2.0 2.3
11 2.0 4.5 1.9 3.5 3.0 1.5 1.3 1.8
12 5.0 2.3 5.1 2.1 4.0 3.5 1.7 1.4
PK-5 23.0 27.1 30.0 32.1 36.2 37.5 36.9 36.3
6-8 10.0 7.0 5.7 6.4 5.5 6.2 8.4 11.9
9-12 14.0 12.7 14.1 10.6 10.0 8.3 7.2 6.1
PK-12 47.0 46.8 49.8 49.1 51.7 52.0 52.5 54.3
Study Area 219 Projection Date 10/2/2019
CURRENT PROJECTED RESIDENT STUDENTS
2019 2020 2021 2022 2023 2024 2025 2026
PK 0.0 0.0 0.0 0.0 0.0 0.0 0.0 0.0
K 5.0 4.8 4.5 4.7 4.2 4.5 4.5 4.4
1 4.0 4.7 4.4 4.1 4.4 3.9 4.1 4.1
2 2.0 3.7 4.3 4.1 3.8 4.0 3.6 3.8
3 4.0 2.0 3.6 4.2 4.0 3.8 4.0 3.6
4 0.0 3.6 1.8 3.2 3.8 3.6 3.4 3.5
5 5.0 0.0 3.3 1.7 3.0 3.5 3.4 3.2
6 1.0 4.1 0.0 2.7 1.4 2.5 2.9 2.8
7 4.0 1.0 4.1 0.0 2.8 1.4 2.5 2.9
8 1.0 3.4 0.9 3.6 0.0 2.4 1.2 2.2
9 2.0 0.9 3.2 0.8 3.3 0.0 2.2 1.1
10 3.0 2.1 1.0 3.4 0.8 3.5 0.0 2.3
11 2.0 2.7 1.9 0.9 3.0 0.8 3.1 0.0
12 1.0 2.3 3.1 2.1 1.0 3.5 0.9 3.6
PK-5 20.0 18.8 21.9 22.0 23.2 23.3 23.0 22.6
6-8 6.0 8.5 5.0 6.3 4.2 6.3 6.6 7.9
9-12 8.0 8.0 9.2 7.2 8.1 7.8 6.2 7.0
PK-12 34.0 35.3 36.1 35.5 35.5 37.4 35.8 37.5

SY2019/20 Demographic Report
145
Study Area 220 Projection Date 10/2/2019
CURRENT PROJECTED RESIDENT STUDENTS
2019 2020 2021 2022 2023 2024 2025 2026
PK 0.0 0.0 0.0 0.0 0.0 0.0 0.0 0.0
K 0.0 0.0 0.0 0.0 0.0 0.0 0.0 0.0
1 0.0 0.0 0.0 0.0 0.0 0.0 0.0 0.0
2 1.0 0.0 0.0 0.0 0.0 0.0 0.0 0.0
3 0.0 1.0 0.0 0.0 0.0 0.0 0.0 0.0
4 2.0 0.0 0.9 0.0 0.0 0.0 0.0 0.0
5 1.0 1.9 0.0 0.8 0.0 0.0 0.0 0.0
6 0.0 0.8 1.5 0.0 0.7 0.0 0.0 0.0
7 2.0 0.0 0.8 1.6 0.0 0.7 0.0 0.0
8 0.0 1.7 0.0 0.7 1.3 0.0 0.6 0.0
9 0.0 0.0 1.6 0.0 0.7 1.3 0.0 0.6
10 0.0 0.0 0.0 1.7 0.0 0.7 1.3 0.0
11 0.0 0.0 0.0 0.0 1.5 0.0 0.6 1.2
12 0.0 0.0 0.0 0.0 0.0 1.7 0.0 0.7
PK-5 4.0 2.9 0.9 0.8 0.0 0.0 0.0 0.0
6-8 2.0 2.5 2.3 2.3 2.0 0.7 0.6 0.0
9-12 0.0 0.0 1.6 1.7 2.2 3.7 1.9 2.5
PK-12 6.0 5.4 4.8 4.8 4.2 4.4 2.5 2.5
Study Area 221 Projection Date 10/2/2019
CURRENT PROJECTED RESIDENT STUDENTS
2019 2020 2021 2022 2023 2024 2025 2026
PK 0.0 0.0 0.0 0.0 0.0 0.0 0.0 0.0
K 0.0 0.0 0.0 0.0 0.0 0.0 0.0 0.0
1 0.0 0.0 0.0 0.0 0.0 0.0 0.0 0.0
2 0.0 0.0 0.0 0.0 0.0 0.0 0.0 0.0
3 0.0 0.0 0.0 0.0 0.0 0.0 0.0 0.0
4 0.0 0.0 0.0 0.0 0.0 0.0 0.0 0.0
5 0.0 0.0 0.0 0.0 0.0 0.0 0.0 0.0
6 0.0 0.0 0.0 0.0 0.0 0.0 0.0 0.0
7 0.0 0.0 0.0 0.0 0.0 0.0 0.0 0.0
8 0.0 0.0 0.0 0.0 0.0 0.0 0.0 0.0
9 0.0 0.0 0.0 0.0 0.0 0.0 0.0 0.0
10 0.0 0.0 0.0 0.0 0.0 0.0 0.0 0.0
11 0.0 0.0 0.0 0.0 0.0 0.0 0.0 0.0
12 0.0 0.0 0.0 0.0 0.0 0.0 0.0 0.0
PK-5 0.0 0.0 0.0 0.0 0.0 0.0 0.0 0.0
6-8 0.0 0.0 0.0 0.0 0.0 0.0 0.0 0.0
9-12 0.0 0.0 0.0 0.0 0.0 0.0 0.0 0.0
PK-12 0.0 0.0 0.0 0.0 0.0 0.0 0.0 0.0
Study Area 222 Projection Date 10/2/2019
CURRENT PROJECTED RESIDENT STUDENTS
2019 2020 2021 2022 2023 2024 2025 2026
PK 0.0 0.0 0.0 0.0 0.0 0.0 0.0 0.0
K 0.0 0.0 0.0 0.0 0.0 0.0 0.0 0.0
1 0.0 0.0 0.0 0.0 0.0 0.0 0.0 0.0
2 0.0 0.0 0.0 0.0 0.0 0.0 0.0 0.0
3 0.0 0.0 0.0 0.0 0.0 0.0 0.0 0.0
4 0.0 0.0 0.0 0.0 0.0 0.0 0.0 0.0
5 0.0 0.0 0.0 0.0 0.0 0.0 0.0 0.0
6 0.0 0.0 0.0 0.0 0.0 0.0 0.0 0.0
7 0.0 0.0 0.0 0.0 0.0 0.0 0.0 0.0
8 0.0 0.0 0.0 0.0 0.0 0.0 0.0 0.0
9 0.0 0.0 0.0 0.0 0.0 0.0 0.0 0.0
10 0.0 0.0 0.0 0.0 0.0 0.0 0.0 0.0
11 0.0 0.0 0.0 0.0 0.0 0.0 0.0 0.0
12 0.0 0.0 0.0 0.0 0.0 0.0 0.0 0.0
PK-5 0.0 0.0 0.0 0.0 0.0 0.0 0.0 0.0
6-8 0.0 0.0 0.0 0.0 0.0 0.0 0.0 0.0
9-12 0.0 0.0 0.0 0.0 0.0 0.0 0.0 0.0
PK-12 0.0 0.0 0.0 0.0 0.0 0.0 0.0 0.0

SY2019/20 Demographic Report
146
Study Area 223 Projection Date 10/2/2019
CURRENT PROJECTED RESIDENT STUDENTS
2019 2020 2021 2022 2023 2024 2025 2026
PK 0.0 0.0 0.0 0.0 0.0 0.0 0.0 0.0
K 0.0 0.0 0.0 0.0 0.0 0.0 0.0 0.0
1 0.0 0.0 0.0 0.0 0.0 0.0 0.0 0.0
2 0.0 0.0 0.0 0.0 0.0 0.0 0.0 0.0
3 0.0 0.0 0.0 0.0 0.0 0.0 0.0 0.0
4 0.0 0.0 0.0 0.0 0.0 0.0 0.0 0.0
5 0.0 0.0 0.0 0.0 0.0 0.0 0.0 0.0
6 0.0 0.0 0.0 0.0 0.0 0.0 0.0 0.0
7 0.0 0.0 0.0 0.0 0.0 0.0 0.0 0.0
8 0.0 0.0 0.0 0.0 0.0 0.0 0.0 0.0
9 0.0 0.0 0.0 0.0 0.0 0.0 0.0 0.0
10 0.0 0.0 0.0 0.0 0.0 0.0 0.0 0.0
11 0.0 0.0 0.0 0.0 0.0 0.0 0.0 0.0
12 0.0 0.0 0.0 0.0 0.0 0.0 0.0 0.0
PK-5 0.0 0.0 0.0 0.0 0.0 0.0 0.0 0.0
6-8 0.0 0.0 0.0 0.0 0.0 0.0 0.0 0.0
9-12 0.0 0.0 0.0 0.0 0.0 0.0 0.0 0.0
PK-12 0.0 0.0 0.0 0.0 0.0 0.0 0.0 0.0
Study Area 224 Projection Date 10/2/2019
CURRENT PROJECTED RESIDENT STUDENTS
2019 2020 2021 2022 2023 2024 2025 2026
PK 0.0 0.0 0.0 0.0 0.0 0.0 0.0 0.0
K 0.0 0.0 0.0 0.0 0.0 0.0 0.0 0.0
1 0.0 0.0 0.0 0.0 0.0 0.0 0.0 0.0
2 0.0 0.0 0.0 0.0 0.0 0.0 0.0 0.0
3 0.0 0.0 0.0 0.0 0.0 0.0 0.0 0.0
4 0.0 0.0 0.0 0.0 0.0 0.0 0.0 0.0
5 0.0 0.0 0.0 0.0 0.0 0.0 0.0 0.0
6 0.0 0.0 0.0 0.0 0.0 0.0 0.0 0.0
7 0.0 0.0 0.0 0.0 0.0 0.0 0.0 0.0
8 0.0 0.0 0.0 0.0 0.0 0.0 0.0 0.0
9 0.0 0.0 0.0 0.0 0.0 0.0 0.0 0.0
10 0.0 0.0 0.0 0.0 0.0 0.0 0.0 0.0
11 0.0 0.0 0.0 0.0 0.0 0.0 0.0 0.0
12 0.0 0.0 0.0 0.0 0.0 0.0 0.0 0.0
PK-5 0.0 0.0 0.0 0.0 0.0 0.0 0.0 0.0
6-8 0.0 0.0 0.0 0.0 0.0 0.0 0.0 0.0
9-12 0.0 0.0 0.0 0.0 0.0 0.0 0.0 0.0
PK-12 0.0 0.0 0.0 0.0 0.0 0.0 0.0 0.0
Study Area 225 Projection Date 10/2/2019
CURRENT PROJECTED RESIDENT STUDENTS
2019 2020 2021 2022 2023 2024 2025 2026
PK 0.0 0.0 0.0 0.0 0.0 0.0 0.0 0.0
K 0.0 0.0 0.0 0.0 0.0 0.0 0.0 0.0
1 0.0 0.0 0.0 0.0 0.0 0.0 0.0 0.0
2 0.0 0.0 0.0 0.0 0.0 0.0 0.0 0.0
3 0.0 0.0 0.0 0.0 0.0 0.0 0.0 0.0
4 0.0 0.0 0.0 0.0 0.0 0.0 0.0 0.0
5 0.0 0.0 0.0 0.0 0.0 0.0 0.0 0.0
6 0.0 0.0 0.0 0.0 0.0 0.0 0.0 0.0
7 0.0 0.0 0.0 0.0 0.0 0.0 0.0 0.0
8 0.0 0.0 0.0 0.0 0.0 0.0 0.0 0.0
9 0.0 0.0 0.0 0.0 0.0 0.0 0.0 0.0
10 0.0 0.0 0.0 0.0 0.0 0.0 0.0 0.0
11 0.0 0.0 0.0 0.0 0.0 0.0 0.0 0.0
12 0.0 0.0 0.0 0.0 0.0 0.0 0.0 0.0
PK-5 0.0 0.0 0.0 0.0 0.0 0.0 0.0 0.0
6-8 0.0 0.0 0.0 0.0 0.0 0.0 0.0 0.0
9-12 0.0 0.0 0.0 0.0 0.0 0.0 0.0 0.0
PK-12 0.0 0.0 0.0 0.0 0.0 0.0 0.0 0.0
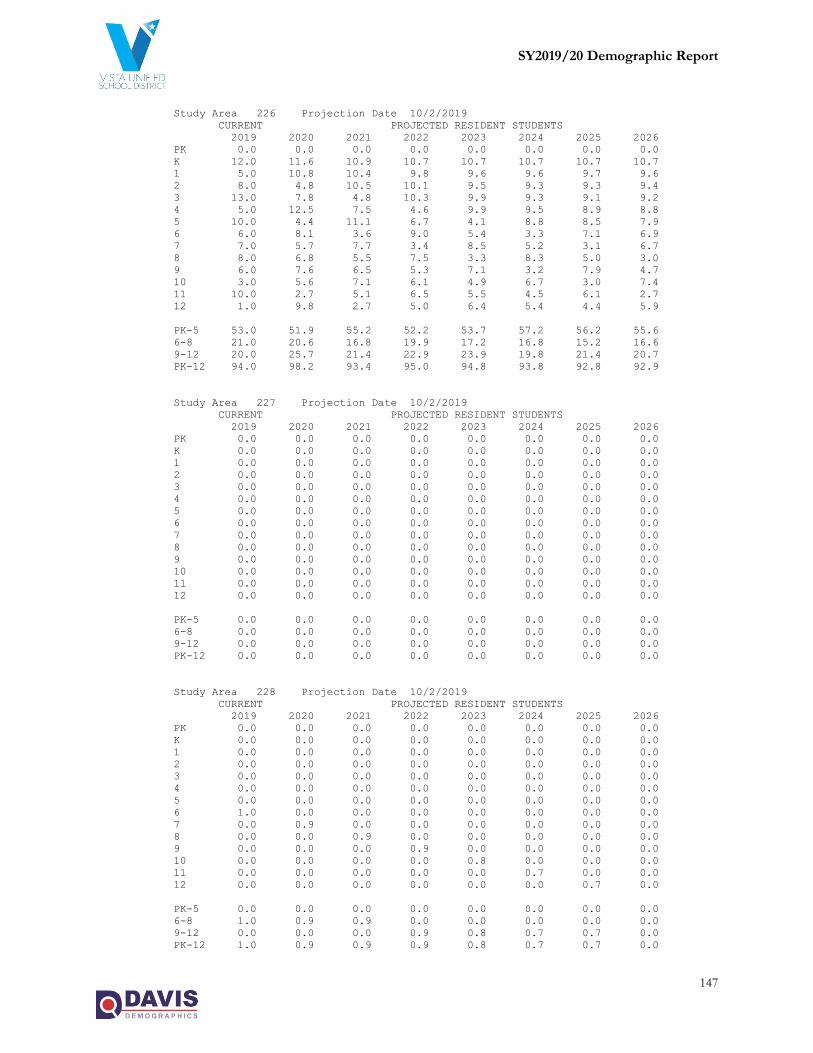
SY2019/20 Demographic Report
147
Study Area 226 Projection Date 10/2/2019
CURRENT PROJECTED RESIDENT STUDENTS
2019 2020 2021 2022 2023 2024 2025 2026
PK 0.0 0.0 0.0 0.0 0.0 0.0 0.0 0.0
K 12.0 11.6 10.9 10.7 10.7 10.7 10.7 10.7
1 5.0 10.8 10.4 9.8 9.6 9.6 9.7 9.6
2 8.0 4.8 10.5 10.1 9.5 9.3 9.3 9.4
3 13.0 7.8 4.8 10.3 9.9 9.3 9.1 9.2
4 5.0 12.5 7.5 4.6 9.9 9.5 8.9 8.8
5 10.0 4.4 11.1 6.7 4.1 8.8 8.5 7.9
6 6.0 8.1 3.6 9.0 5.4 3.3 7.1 6.9
7 7.0 5.7 7.7 3.4 8.5 5.2 3.1 6.7
8 8.0 6.8 5.5 7.5 3.3 8.3 5.0 3.0
9 6.0 7.6 6.5 5.3 7.1 3.2 7.9 4.7
10 3.0 5.6 7.1 6.1 4.9 6.7 3.0 7.4
11 10.0 2.7 5.1 6.5 5.5 4.5 6.1 2.7
12 1.0 9.8 2.7 5.0 6.4 5.4 4.4 5.9
PK-5 53.0 51.9 55.2 52.2 53.7 57.2 56.2 55.6
6-8 21.0 20.6 16.8 19.9 17.2 16.8 15.2 16.6
9-12 20.0 25.7 21.4 22.9 23.9 19.8 21.4 20.7
PK-12 94.0 98.2 93.4 95.0 94.8 93.8 92.8 92.9
Study Area 227 Projection Date 10/2/2019
CURRENT PROJECTED RESIDENT STUDENTS
2019 2020 2021 2022 2023 2024 2025 2026
PK 0.0 0.0 0.0 0.0 0.0 0.0 0.0 0.0
K 0.0 0.0 0.0 0.0 0.0 0.0 0.0 0.0
1 0.0 0.0 0.0 0.0 0.0 0.0 0.0 0.0
2 0.0 0.0 0.0 0.0 0.0 0.0 0.0 0.0
3 0.0 0.0 0.0 0.0 0.0 0.0 0.0 0.0
4 0.0 0.0 0.0 0.0 0.0 0.0 0.0 0.0
5 0.0 0.0 0.0 0.0 0.0 0.0 0.0 0.0
6 0.0 0.0 0.0 0.0 0.0 0.0 0.0 0.0
7 0.0 0.0 0.0 0.0 0.0 0.0 0.0 0.0
8 0.0 0.0 0.0 0.0 0.0 0.0 0.0 0.0
9 0.0 0.0 0.0 0.0 0.0 0.0 0.0 0.0
10 0.0 0.0 0.0 0.0 0.0 0.0 0.0 0.0
11 0.0 0.0 0.0 0.0 0.0 0.0 0.0 0.0
12 0.0 0.0 0.0 0.0 0.0 0.0 0.0 0.0
PK-5 0.0 0.0 0.0 0.0 0.0 0.0 0.0 0.0
6-8 0.0 0.0 0.0 0.0 0.0 0.0 0.0 0.0
9-12 0.0 0.0 0.0 0.0 0.0 0.0 0.0 0.0
PK-12 0.0 0.0 0.0 0.0 0.0 0.0 0.0 0.0
Study Area 228 Projection Date 10/2/2019
CURRENT PROJECTED RESIDENT STUDENTS
2019 2020 2021 2022 2023 2024 2025 2026
PK 0.0 0.0 0.0 0.0 0.0 0.0 0.0 0.0
K 0.0 0.0 0.0 0.0 0.0 0.0 0.0 0.0
1 0.0 0.0 0.0 0.0 0.0 0.0 0.0 0.0
2 0.0 0.0 0.0 0.0 0.0 0.0 0.0 0.0
3 0.0 0.0 0.0 0.0 0.0 0.0 0.0 0.0
4 0.0 0.0 0.0 0.0 0.0 0.0 0.0 0.0
5 0.0 0.0 0.0 0.0 0.0 0.0 0.0 0.0
6 1.0 0.0 0.0 0.0 0.0 0.0 0.0 0.0
7 0.0 0.9 0.0 0.0 0.0 0.0 0.0 0.0
8 0.0 0.0 0.9 0.0 0.0 0.0 0.0 0.0
9 0.0 0.0 0.0 0.9 0.0 0.0 0.0 0.0
10 0.0 0.0 0.0 0.0 0.8 0.0 0.0 0.0
11 0.0 0.0 0.0 0.0 0.0 0.7 0.0 0.0
12 0.0 0.0 0.0 0.0 0.0 0.0 0.7 0.0
PK-5 0.0 0.0 0.0 0.0 0.0 0.0 0.0 0.0
6-8 1.0 0.9 0.9 0.0 0.0 0.0 0.0 0.0
9-12 0.0 0.0 0.0 0.9 0.8 0.7 0.7 0.0
PK-12 1.0 0.9 0.9 0.9 0.8 0.7 0.7 0.0
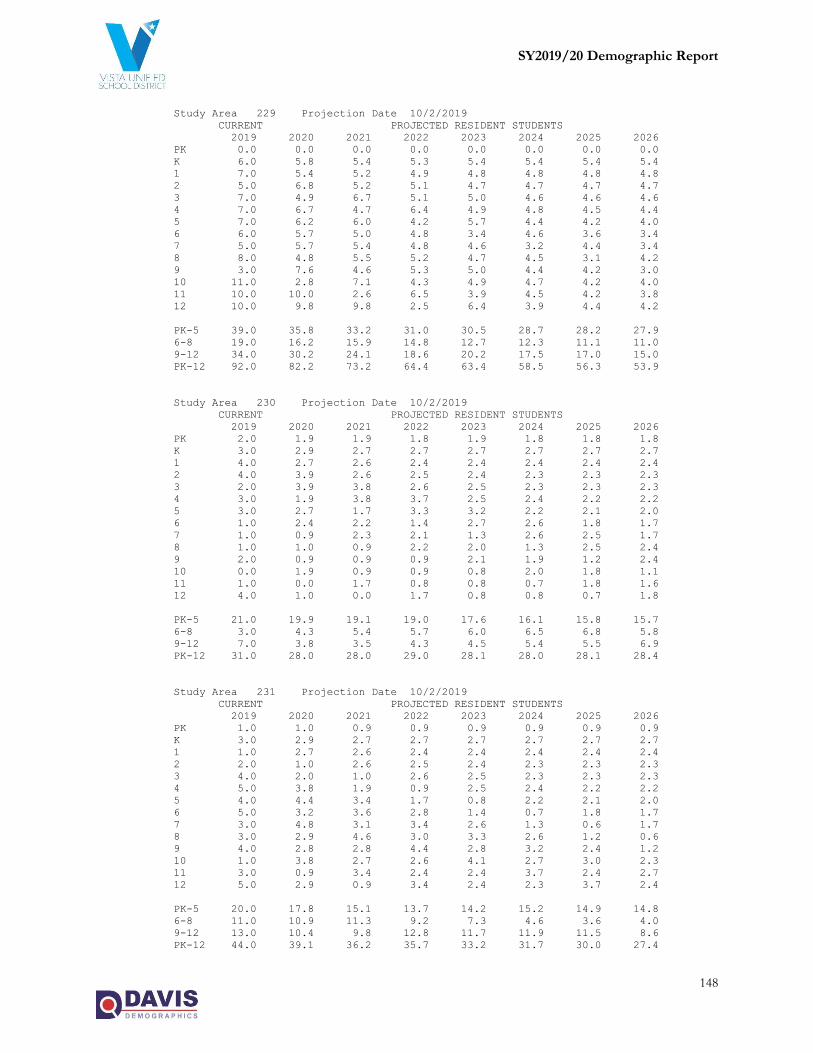
SY2019/20 Demographic Report
148
Study Area 229 Projection Date 10/2/2019
CURRENT PROJECTED RESIDENT STUDENTS
2019 2020 2021 2022 2023 2024 2025 2026
PK 0.0 0.0 0.0 0.0 0.0 0.0 0.0 0.0
K 6.0 5.8 5.4 5.3 5.4 5.4 5.4 5.4
1 7.0 5.4 5.2 4.9 4.8 4.8 4.8 4.8
2 5.0 6.8 5.2 5.1 4.7 4.7 4.7 4.7
3 7.0 4.9 6.7 5.1 5.0 4.6 4.6 4.6
4 7.0 6.7 4.7 6.4 4.9 4.8 4.5 4.4
5 7.0 6.2 6.0 4.2 5.7 4.4 4.2 4.0
6 6.0 5.7 5.0 4.8 3.4 4.6 3.6 3.4
7 5.0 5.7 5.4 4.8 4.6 3.2 4.4 3.4
8 8.0 4.8 5.5 5.2 4.7 4.5 3.1 4.2
9 3.0 7.6 4.6 5.3 5.0 4.4 4.2 3.0
10 11.0 2.8 7.1 4.3 4.9 4.7 4.2 4.0
11 10.0 10.0 2.6 6.5 3.9 4.5 4.2 3.8
12 10.0 9.8 9.8 2.5 6.4 3.9 4.4 4.2
PK-5 39.0 35.8 33.2 31.0 30.5 28.7 28.2 27.9
6-8 19.0 16.2 15.9 14.8 12.7 12.3 11.1 11.0
9-12 34.0 30.2 24.1 18.6 20.2 17.5 17.0 15.0
PK-12 92.0 82.2 73.2 64.4 63.4 58.5 56.3 53.9
Study Area 230 Projection Date 10/2/2019
CURRENT PROJECTED RESIDENT STUDENTS
2019 2020 2021 2022 2023 2024 2025 2026
PK 2.0 1.9 1.9 1.8 1.9 1.8 1.8 1.8
K 3.0 2.9 2.7 2.7 2.7 2.7 2.7 2.7
1 4.0 2.7 2.6 2.4 2.4 2.4 2.4 2.4
2 4.0 3.9 2.6 2.5 2.4 2.3 2.3 2.3
3 2.0 3.9 3.8 2.6 2.5 2.3 2.3 2.3
4 3.0 1.9 3.8 3.7 2.5 2.4 2.2 2.2
5 3.0 2.7 1.7 3.3 3.2 2.2 2.1 2.0
6 1.0 2.4 2.2 1.4 2.7 2.6 1.8 1.7
7 1.0 0.9 2.3 2.1 1.3 2.6 2.5 1.7
8 1.0 1.0 0.9 2.2 2.0 1.3 2.5 2.4
9 2.0 0.9 0.9 0.9 2.1 1.9 1.2 2.4
10 0.0 1.9 0.9 0.9 0.8 2.0 1.8 1.1
11 1.0 0.0 1.7 0.8 0.8 0.7 1.8 1.6
12 4.0 1.0 0.0 1.7 0.8 0.8 0.7 1.8
PK-5 21.0 19.9 19.1 19.0 17.6 16.1 15.8 15.7
6-8 3.0 4.3 5.4 5.7 6.0 6.5 6.8 5.8
9-12 7.0 3.8 3.5 4.3 4.5 5.4 5.5 6.9
PK-12 31.0 28.0 28.0 29.0 28.1 28.0 28.1 28.4
Study Area 231 Projection Date 10/2/2019
CURRENT PROJECTED RESIDENT STUDENTS
2019 2020 2021 2022 2023 2024 2025 2026
PK 1.0 1.0 0.9 0.9 0.9 0.9 0.9 0.9
K 3.0 2.9 2.7 2.7 2.7 2.7 2.7 2.7
1 1.0 2.7 2.6 2.4 2.4 2.4 2.4 2.4
2 2.0 1.0 2.6 2.5 2.4 2.3 2.3 2.3
3 4.0 2.0 1.0 2.6 2.5 2.3 2.3 2.3
4 5.0 3.8 1.9 0.9 2.5 2.4 2.2 2.2
5 4.0 4.4 3.4 1.7 0.8 2.2 2.1 2.0
6 5.0 3.2 3.6 2.8 1.4 0.7 1.8 1.7
7 3.0 4.8 3.1 3.4 2.6 1.3 0.6 1.7
8 3.0 2.9 4.6 3.0 3.3 2.6 1.2 0.6
9 4.0 2.8 2.8 4.4 2.8 3.2 2.4 1.2
10 1.0 3.8 2.7 2.6 4.1 2.7 3.0 2.3
11 3.0 0.9 3.4 2.4 2.4 3.7 2.4 2.7
12 5.0 2.9 0.9 3.4 2.4 2.3 3.7 2.4
PK-5 20.0 17.8 15.1 13.7 14.2 15.2 14.9 14.8
6-8 11.0 10.9 11.3 9.2 7.3 4.6 3.6 4.0
9-12 13.0 10.4 9.8 12.8 11.7 11.9 11.5 8.6
PK-12 44.0 39.1 36.2 35.7 33.2 31.7 30.0 27.4
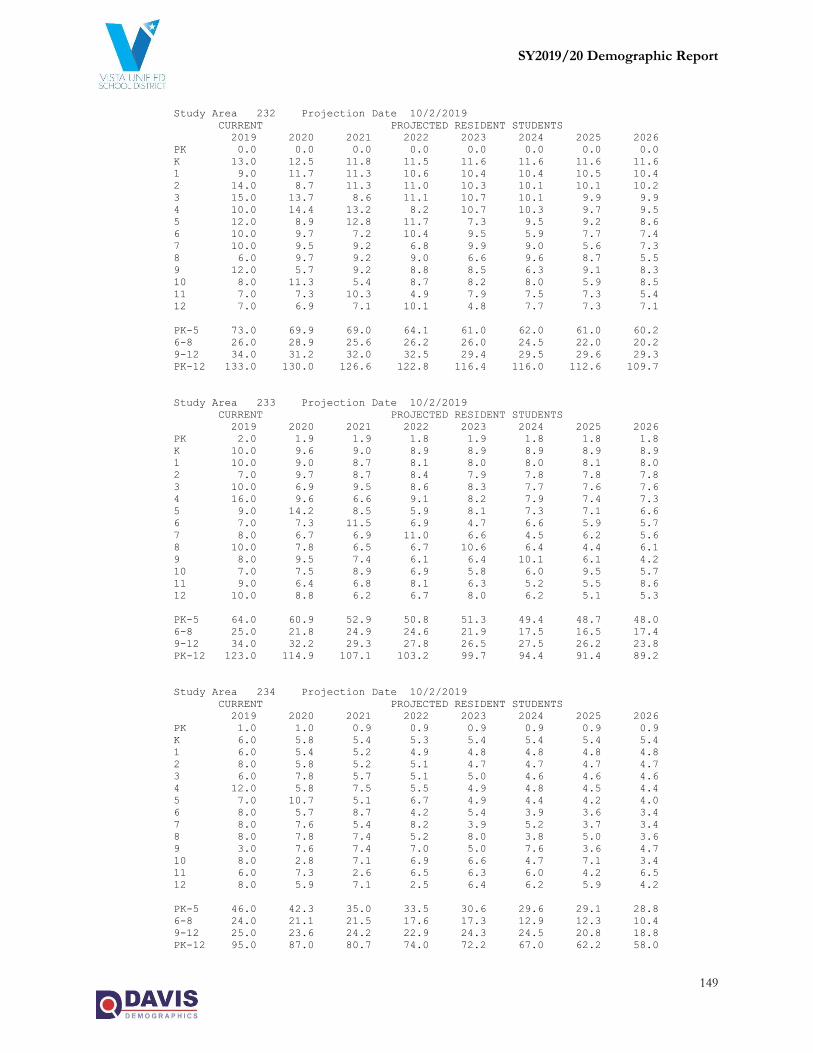
SY2019/20 Demographic Report
149
Study Area 232 Projection Date 10/2/2019
CURRENT PROJECTED RESIDENT STUDENTS
2019 2020 2021 2022 2023 2024 2025 2026
PK 0.0 0.0 0.0 0.0 0.0 0.0 0.0 0.0
K 13.0 12.5 11.8 11.5 11.6 11.6 11.6 11.6
1 9.0 11.7 11.3 10.6 10.4 10.4 10.5 10.4
2 14.0 8.7 11.3 11.0 10.3 10.1 10.1 10.2
3 15.0 13.7 8.6 11.1 10.7 10.1 9.9 9.9
4 10.0 14.4 13.2 8.2 10.7 10.3 9.7 9.5
5 12.0 8.9 12.8 11.7 7.3 9.5 9.2 8.6
6 10.0 9.7 7.2 10.4 9.5 5.9 7.7 7.4
7 10.0 9.5 9.2 6.8 9.9 9.0 5.6 7.3
8 6.0 9.7 9.2 9.0 6.6 9.6 8.7 5.5
9 12.0 5.7 9.2 8.8 8.5 6.3 9.1 8.3
10 8.0 11.3 5.4 8.7 8.2 8.0 5.9 8.5
11 7.0 7.3 10.3 4.9 7.9 7.5 7.3 5.4
12 7.0 6.9 7.1 10.1 4.8 7.7 7.3 7.1
PK-5 73.0 69.9 69.0 64.1 61.0 62.0 61.0 60.2
6-8 26.0 28.9 25.6 26.2 26.0 24.5 22.0 20.2
9-12 34.0 31.2 32.0 32.5 29.4 29.5 29.6 29.3
PK-12 133.0 130.0 126.6 122.8 116.4 116.0 112.6 109.7
Study Area 233 Projection Date 10/2/2019
CURRENT PROJECTED RESIDENT STUDENTS
2019 2020 2021 2022 2023 2024 2025 2026
PK 2.0 1.9 1.9 1.8 1.9 1.8 1.8 1.8
K 10.0 9.6 9.0 8.9 8.9 8.9 8.9 8.9
1 10.0 9.0 8.7 8.1 8.0 8.0 8.1 8.0
2 7.0 9.7 8.7 8.4 7.9 7.8 7.8 7.8
3 10.0 6.9 9.5 8.6 8.3 7.7 7.6 7.6
4 16.0 9.6 6.6 9.1 8.2 7.9 7.4 7.3
5 9.0 14.2 8.5 5.9 8.1 7.3 7.1 6.6
6 7.0 7.3 11.5 6.9 4.7 6.6 5.9 5.7
7 8.0 6.7 6.9 11.0 6.6 4.5 6.2 5.6
8 10.0 7.8 6.5 6.7 10.6 6.4 4.4 6.1
9 8.0 9.5 7.4 6.1 6.4 10.1 6.1 4.2
10 7.0 7.5 8.9 6.9 5.8 6.0 9.5 5.7
11 9.0 6.4 6.8 8.1 6.3 5.2 5.5 8.6
12 10.0 8.8 6.2 6.7 8.0 6.2 5.1 5.3
PK-5 64.0 60.9 52.9 50.8 51.3 49.4 48.7 48.0
6-8 25.0 21.8 24.9 24.6 21.9 17.5 16.5 17.4
9-12 34.0 32.2 29.3 27.8 26.5 27.5 26.2 23.8
PK-12 123.0 114.9 107.1 103.2 99.7 94.4 91.4 89.2
Study Area 234 Projection Date 10/2/2019
CURRENT PROJECTED RESIDENT STUDENTS
2019 2020 2021 2022 2023 2024 2025 2026
PK 1.0 1.0 0.9 0.9 0.9 0.9 0.9 0.9
K 6.0 5.8 5.4 5.3 5.4 5.4 5.4 5.4
1 6.0 5.4 5.2 4.9 4.8 4.8 4.8 4.8
2 8.0 5.8 5.2 5.1 4.7 4.7 4.7 4.7
3 6.0 7.8 5.7 5.1 5.0 4.6 4.6 4.6
4 12.0 5.8 7.5 5.5 4.9 4.8 4.5 4.4
5 7.0 10.7 5.1 6.7 4.9 4.4 4.2 4.0
6 8.0 5.7 8.7 4.2 5.4 3.9 3.6 3.4
7 8.0 7.6 5.4 8.2 3.9 5.2 3.7 3.4
8 8.0 7.8 7.4 5.2 8.0 3.8 5.0 3.6
9 3.0 7.6 7.4 7.0 5.0 7.6 3.6 4.7
10 8.0 2.8 7.1 6.9 6.6 4.7 7.1 3.4
11 6.0 7.3 2.6 6.5 6.3 6.0 4.2 6.5
12 8.0 5.9 7.1 2.5 6.4 6.2 5.9 4.2
PK-5 46.0 42.3 35.0 33.5 30.6 29.6 29.1 28.8
6-8 24.0 21.1 21.5 17.6 17.3 12.9 12.3 10.4
9-12 25.0 23.6 24.2 22.9 24.3 24.5 20.8 18.8
PK-12 95.0 87.0 80.7 74.0 72.2 67.0 62.2 58.0

SY2019/20 Demographic Report
150
Study Area 235 Projection Date 10/2/2019
CURRENT PROJECTED RESIDENT STUDENTS
2019 2020 2021 2022 2023 2024 2025 2026
PK 4.0 3.8 3.8 3.6 3.7 3.7 3.7 3.7
K 9.0 8.7 8.1 8.0 8.0 8.1 8.0 8.0
1 9.0 8.1 7.8 7.3 7.2 7.2 7.2 7.2
2 3.0 8.7 7.9 7.6 7.1 7.0 7.0 7.0
3 10.0 2.9 8.6 7.7 7.4 7.0 6.8 6.9
4 4.0 9.6 2.8 8.2 7.4 7.1 6.7 6.6
5 9.0 3.6 8.5 2.5 7.3 6.6 6.3 5.9
6 4.0 7.3 2.9 6.9 2.0 5.9 5.3 5.1
7 8.0 3.8 6.9 2.7 6.6 1.9 5.6 5.1
8 8.0 7.8 3.7 6.7 2.7 6.4 1.9 5.5
9 3.0 7.6 7.4 3.5 6.4 2.5 6.1 1.8
10 3.0 2.8 7.1 6.9 3.3 6.0 2.4 5.7
11 9.0 2.7 2.6 6.5 6.3 3.0 5.5 2.2
12 5.0 8.8 2.7 2.5 6.4 6.2 2.9 5.3
PK-5 48.0 45.4 47.5 44.9 48.1 46.7 45.7 45.3
6-8 20.0 18.9 13.5 16.3 11.3 14.2 12.8 15.7
9-12 20.0 21.9 19.8 19.4 22.4 17.7 16.9 15.0
PK-12 88.0 86.2 80.8 80.6 81.8 78.6 75.4 76.0
Study Area 236 Projection Date 10/2/2019
CURRENT PROJECTED RESIDENT STUDENTS
2019 2020 2021 2022 2023 2024 2025 2026
PK 1.0 1.0 0.9 0.9 0.9 0.9 0.9 0.9
K 3.0 2.9 2.7 2.7 2.7 2.7 2.7 2.7
1 4.0 2.7 2.6 2.4 2.4 2.4 2.4 2.4
2 3.0 3.9 2.6 2.5 2.4 2.3 2.3 2.3
3 4.0 2.9 3.8 2.6 2.5 2.3 2.3 2.3
4 3.0 3.8 2.8 3.7 2.5 2.4 2.2 2.2
5 3.0 2.7 3.4 2.5 3.2 2.2 2.1 2.0
6 7.0 2.4 2.2 2.8 2.0 2.6 1.8 1.7
7 4.0 6.7 2.3 2.1 2.6 1.9 2.5 1.7
8 6.0 3.9 6.5 2.2 2.0 2.6 1.9 2.4
9 2.0 5.7 3.7 6.1 2.1 1.9 2.4 1.8
10 3.0 1.9 5.4 3.5 5.8 2.0 1.8 2.3
11 1.0 2.7 1.7 4.9 3.2 5.2 1.8 1.6
12 4.0 1.0 2.7 1.7 4.8 3.1 5.1 1.8
PK-5 21.0 19.9 18.8 17.3 16.6 15.2 14.9 14.8
6-8 17.0 13.0 11.0 7.1 6.6 7.1 6.2 5.8
9-12 10.0 11.3 13.5 16.2 15.9 12.2 11.1 7.5
PK-12 48.0 44.2 43.3 40.6 39.1 34.5 32.2 28.1
Study Area 237 Projection Date 10/2/2019
CURRENT PROJECTED RESIDENT STUDENTS
2019 2020 2021 2022 2023 2024 2025 2026
PK 0.0 0.0 0.0 0.0 0.0 0.0 0.0 0.0
K 3.0 2.9 2.7 2.7 2.7 2.7 2.7 2.7
1 4.0 2.7 2.6 2.4 2.4 2.4 2.4 2.4
2 8.0 3.9 2.6 2.5 2.4 2.3 2.3 2.3
3 5.0 7.8 3.8 2.6 2.5 2.3 2.3 2.3
4 4.0 4.8 7.5 3.7 2.5 2.4 2.2 2.2
5 8.0 3.6 4.3 6.7 3.2 2.2 2.1 2.0
6 3.0 6.5 2.9 3.5 5.4 2.6 1.8 1.7
7 3.0 2.8 6.2 2.7 3.3 5.2 2.5 1.7
8 4.0 2.9 2.8 6.0 2.7 3.2 5.0 2.4
9 2.0 3.8 2.8 2.6 5.7 2.5 3.0 4.7
10 6.0 1.9 3.6 2.6 2.5 5.3 2.4 2.8
11 4.0 5.5 1.7 3.3 2.4 2.2 4.9 2.2
12 6.0 3.9 5.4 1.7 3.2 2.3 2.2 4.8
PK-5 32.0 25.7 23.5 20.6 15.7 14.3 14.0 13.9
6-8 10.0 12.2 11.9 12.2 11.4 11.0 9.3 5.8
9-12 18.0 15.1 13.5 10.2 13.8 12.3 12.5 14.5
PK-12 60.0 53.0 48.9 43.0 40.9 37.6 35.8 34.2
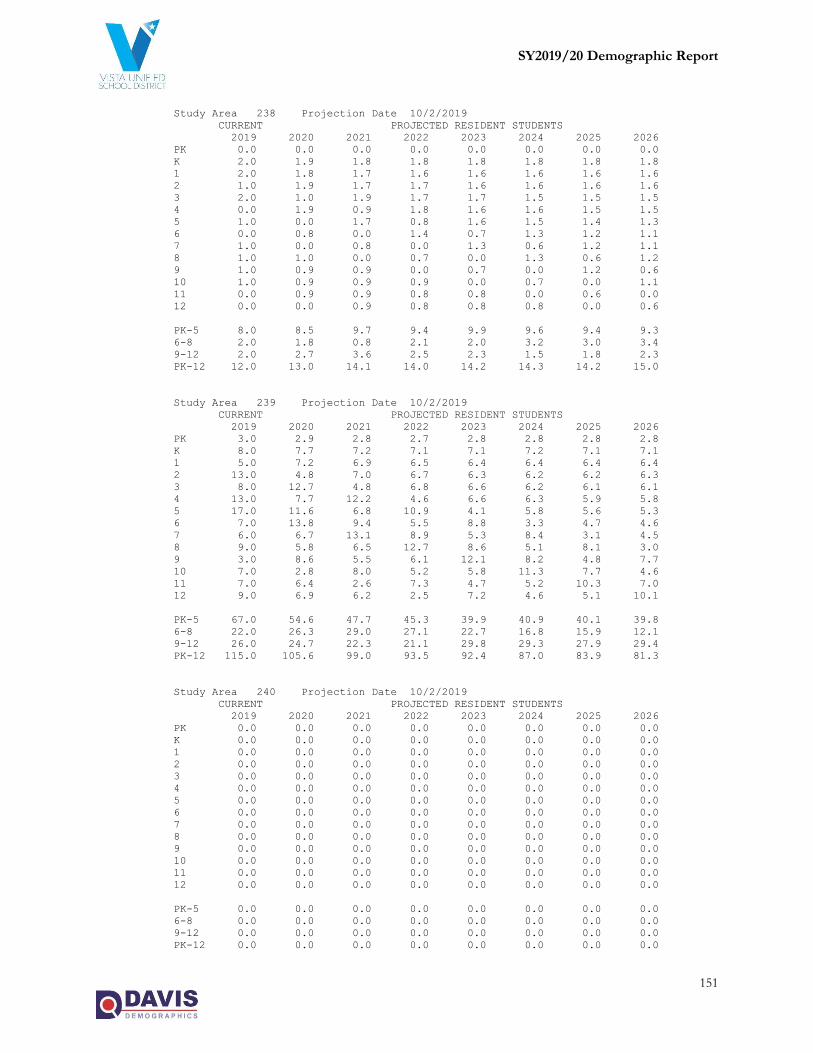
SY2019/20 Demographic Report
151
Study Area 238 Projection Date 10/2/2019
CURRENT PROJECTED RESIDENT STUDENTS
2019 2020 2021 2022 2023 2024 2025 2026
PK 0.0 0.0 0.0 0.0 0.0 0.0 0.0 0.0
K 2.0 1.9 1.8 1.8 1.8 1.8 1.8 1.8
1 2.0 1.8 1.7 1.6 1.6 1.6 1.6 1.6
2 1.0 1.9 1.7 1.7 1.6 1.6 1.6 1.6
3 2.0 1.0 1.9 1.7 1.7 1.5 1.5 1.5
4 0.0 1.9 0.9 1.8 1.6 1.6 1.5 1.5
5 1.0 0.0 1.7 0.8 1.6 1.5 1.4 1.3
6 0.0 0.8 0.0 1.4 0.7 1.3 1.2 1.1
7 1.0 0.0 0.8 0.0 1.3 0.6 1.2 1.1
8 1.0 1.0 0.0 0.7 0.0 1.3 0.6 1.2
9 1.0 0.9 0.9 0.0 0.7 0.0 1.2 0.6
10 1.0 0.9 0.9 0.9 0.0 0.7 0.0 1.1
11 0.0 0.9 0.9 0.8 0.8 0.0 0.6 0.0
12 0.0 0.0 0.9 0.8 0.8 0.8 0.0 0.6
PK-5 8.0 8.5 9.7 9.4 9.9 9.6 9.4 9.3
6-8 2.0 1.8 0.8 2.1 2.0 3.2 3.0 3.4
9-12 2.0 2.7 3.6 2.5 2.3 1.5 1.8 2.3
PK-12 12.0 13.0 14.1 14.0 14.2 14.3 14.2 15.0
Study Area 239 Projection Date 10/2/2019
CURRENT PROJECTED RESIDENT STUDENTS
2019 2020 2021 2022 2023 2024 2025 2026
PK 3.0 2.9 2.8 2.7 2.8 2.8 2.8 2.8
K 8.0 7.7 7.2 7.1 7.1 7.2 7.1 7.1
1 5.0 7.2 6.9 6.5 6.4 6.4 6.4 6.4
2 13.0 4.8 7.0 6.7 6.3 6.2 6.2 6.3
3 8.0 12.7 4.8 6.8 6.6 6.2 6.1 6.1
4 13.0 7.7 12.2 4.6 6.6 6.3 5.9 5.8
5 17.0 11.6 6.8 10.9 4.1 5.8 5.6 5.3
6 7.0 13.8 9.4 5.5 8.8 3.3 4.7 4.6
7 6.0 6.7 13.1 8.9 5.3 8.4 3.1 4.5
8 9.0 5.8 6.5 12.7 8.6 5.1 8.1 3.0
9 3.0 8.6 5.5 6.1 12.1 8.2 4.8 7.7
10 7.0 2.8 8.0 5.2 5.8 11.3 7.7 4.6
11 7.0 6.4 2.6 7.3 4.7 5.2 10.3 7.0
12 9.0 6.9 6.2 2.5 7.2 4.6 5.1 10.1
PK-5 67.0 54.6 47.7 45.3 39.9 40.9 40.1 39.8
6-8 22.0 26.3 29.0 27.1 22.7 16.8 15.9 12.1
9-12 26.0 24.7 22.3 21.1 29.8 29.3 27.9 29.4
PK-12 115.0 105.6 99.0 93.5 92.4 87.0 83.9 81.3
Study Area 240 Projection Date 10/2/2019
CURRENT PROJECTED RESIDENT STUDENTS
2019 2020 2021 2022 2023 2024 2025 2026
PK 0.0 0.0 0.0 0.0 0.0 0.0 0.0 0.0
K 0.0 0.0 0.0 0.0 0.0 0.0 0.0 0.0
1 0.0 0.0 0.0 0.0 0.0 0.0 0.0 0.0
2 0.0 0.0 0.0 0.0 0.0 0.0 0.0 0.0
3 0.0 0.0 0.0 0.0 0.0 0.0 0.0 0.0
4 0.0 0.0 0.0 0.0 0.0 0.0 0.0 0.0
5 0.0 0.0 0.0 0.0 0.0 0.0 0.0 0.0
6 0.0 0.0 0.0 0.0 0.0 0.0 0.0 0.0
7 0.0 0.0 0.0 0.0 0.0 0.0 0.0 0.0
8 0.0 0.0 0.0 0.0 0.0 0.0 0.0 0.0
9 0.0 0.0 0.0 0.0 0.0 0.0 0.0 0.0
10 0.0 0.0 0.0 0.0 0.0 0.0 0.0 0.0
11 0.0 0.0 0.0 0.0 0.0 0.0 0.0 0.0
12 0.0 0.0 0.0 0.0 0.0 0.0 0.0 0.0
PK-5 0.0 0.0 0.0 0.0 0.0 0.0 0.0 0.0
6-8 0.0 0.0 0.0 0.0 0.0 0.0 0.0 0.0
9-12 0.0 0.0 0.0 0.0 0.0 0.0 0.0 0.0
PK-12 0.0 0.0 0.0 0.0 0.0 0.0 0.0 0.0
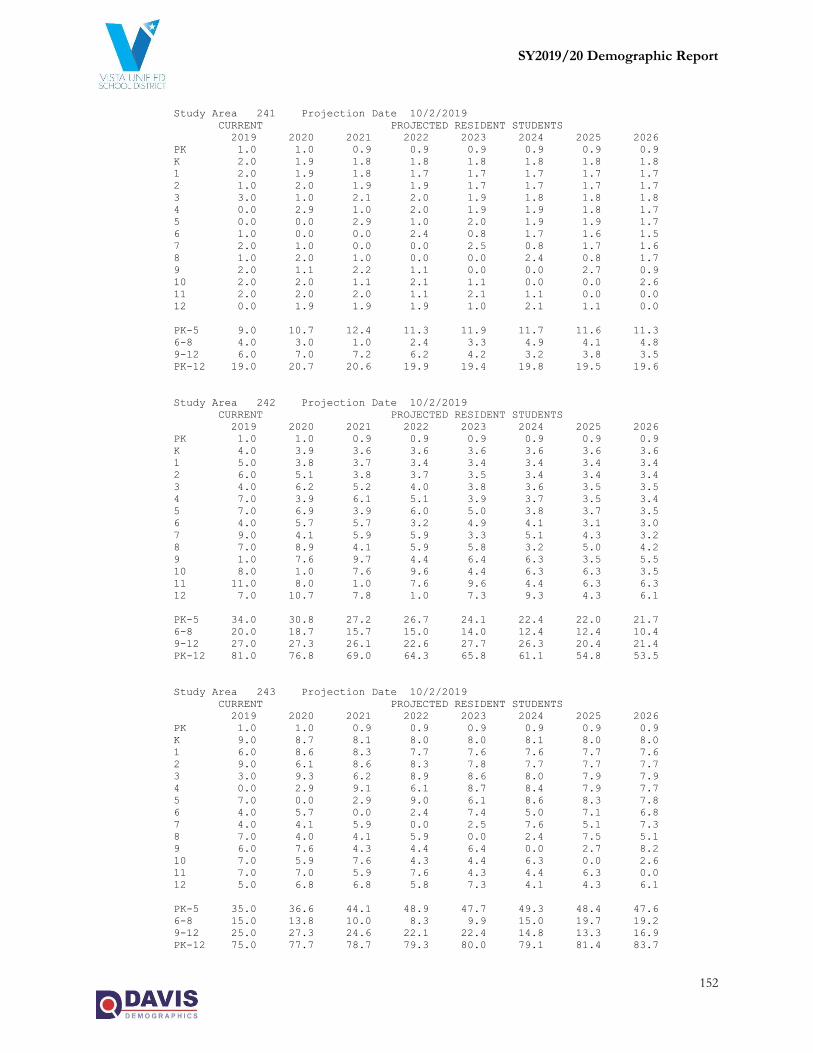
SY2019/20 Demographic Report
152
Study Area 241 Projection Date 10/2/2019
CURRENT PROJECTED RESIDENT STUDENTS
2019 2020 2021 2022 2023 2024 2025 2026
PK 1.0 1.0 0.9 0.9 0.9 0.9 0.9 0.9
K 2.0 1.9 1.8 1.8 1.8 1.8 1.8 1.8
1 2.0 1.9 1.8 1.7 1.7 1.7 1.7 1.7
2 1.0 2.0 1.9 1.9 1.7 1.7 1.7 1.7
3 3.0 1.0 2.1 2.0 1.9 1.8 1.8 1.8
4 0.0 2.9 1.0 2.0 1.9 1.9 1.8 1.7
5 0.0 0.0 2.9 1.0 2.0 1.9 1.9 1.7
6 1.0 0.0 0.0 2.4 0.8 1.7 1.6 1.5
7 2.0 1.0 0.0 0.0 2.5 0.8 1.7 1.6
8 1.0 2.0 1.0 0.0 0.0 2.4 0.8 1.7
9 2.0 1.1 2.2 1.1 0.0 0.0 2.7 0.9
10 2.0 2.0 1.1 2.1 1.1 0.0 0.0 2.6
11 2.0 2.0 2.0 1.1 2.1 1.1 0.0 0.0
12 0.0 1.9 1.9 1.9 1.0 2.1 1.1 0.0
PK-5 9.0 10.7 12.4 11.3 11.9 11.7 11.6 11.3
6-8 4.0 3.0 1.0 2.4 3.3 4.9 4.1 4.8
9-12 6.0 7.0 7.2 6.2 4.2 3.2 3.8 3.5
PK-12 19.0 20.7 20.6 19.9 19.4 19.8 19.5 19.6
Study Area 242 Projection Date 10/2/2019
CURRENT PROJECTED RESIDENT STUDENTS
2019 2020 2021 2022 2023 2024 2025 2026
PK 1.0 1.0 0.9 0.9 0.9 0.9 0.9 0.9
K 4.0 3.9 3.6 3.6 3.6 3.6 3.6 3.6
1 5.0 3.8 3.7 3.4 3.4 3.4 3.4 3.4
2 6.0 5.1 3.8 3.7 3.5 3.4 3.4 3.4
3 4.0 6.2 5.2 4.0 3.8 3.6 3.5 3.5
4 7.0 3.9 6.1 5.1 3.9 3.7 3.5 3.4
5 7.0 6.9 3.9 6.0 5.0 3.8 3.7 3.5
6 4.0 5.7 5.7 3.2 4.9 4.1 3.1 3.0
7 9.0 4.1 5.9 5.9 3.3 5.1 4.3 3.2
8 7.0 8.9 4.1 5.9 5.8 3.2 5.0 4.2
9 1.0 7.6 9.7 4.4 6.4 6.3 3.5 5.5
10 8.0 1.0 7.6 9.6 4.4 6.3 6.3 3.5
11 11.0 8.0 1.0 7.6 9.6 4.4 6.3 6.3
12 7.0 10.7 7.8 1.0 7.3 9.3 4.3 6.1
PK-5 34.0 30.8 27.2 26.7 24.1 22.4 22.0 21.7
6-8 20.0 18.7 15.7 15.0 14.0 12.4 12.4 10.4
9-12 27.0 27.3 26.1 22.6 27.7 26.3 20.4 21.4
PK-12 81.0 76.8 69.0 64.3 65.8 61.1 54.8 53.5
Study Area 243 Projection Date 10/2/2019
CURRENT PROJECTED RESIDENT STUDENTS
2019 2020 2021 2022 2023 2024 2025 2026
PK 1.0 1.0 0.9 0.9 0.9 0.9 0.9 0.9
K 9.0 8.7 8.1 8.0 8.0 8.1 8.0 8.0
1 6.0 8.6 8.3 7.7 7.6 7.6 7.7 7.6
2 9.0 6.1 8.6 8.3 7.8 7.7 7.7 7.7
3 3.0 9.3 6.2 8.9 8.6 8.0 7.9 7.9
4 0.0 2.9 9.1 6.1 8.7 8.4 7.9 7.7
5 7.0 0.0 2.9 9.0 6.1 8.6 8.3 7.8
6 4.0 5.7 0.0 2.4 7.4 5.0 7.1 6.8
7 4.0 4.1 5.9 0.0 2.5 7.6 5.1 7.3
8 7.0 4.0 4.1 5.9 0.0 2.4 7.5 5.1
9 6.0 7.6 4.3 4.4 6.4 0.0 2.7 8.2
10 7.0 5.9 7.6 4.3 4.4 6.3 0.0 2.6
11 7.0 7.0 5.9 7.6 4.3 4.4 6.3 0.0
12 5.0 6.8 6.8 5.8 7.3 4.1 4.3 6.1
PK-5 35.0 36.6 44.1 48.9 47.7 49.3 48.4 47.6
6-8 15.0 13.8 10.0 8.3 9.9 15.0 19.7 19.2
9-12 25.0 27.3 24.6 22.1 22.4 14.8 13.3 16.9
PK-12 75.0 77.7 78.7 79.3 80.0 79.1 81.4 83.7

SY2019/20 Demographic Report
153
Study Area 244 Projection Date 10/2/2019
CURRENT PROJECTED RESIDENT STUDENTS
2019 2020 2021 2022 2023 2024 2025 2026
PK 0.0 0.0 0.0 0.0 0.0 0.0 0.0 0.0
K 6.0 5.8 5.4 5.3 5.4 5.4 5.4 5.4
1 4.0 5.7 5.5 5.2 5.1 5.1 5.1 5.1
2 5.0 4.0 5.8 5.6 5.2 5.1 5.1 5.2
3 7.0 5.2 4.2 5.9 5.7 5.4 5.3 5.3
4 6.0 6.9 5.0 4.1 5.8 5.6 5.3 5.2
5 3.0 5.9 6.8 5.0 4.0 5.8 5.6 5.2
6 3.0 2.5 4.9 5.6 4.1 3.3 4.7 4.6
7 3.0 3.1 2.5 5.0 5.7 4.2 3.4 4.9
8 1.0 3.0 3.1 2.5 5.0 5.7 4.2 3.4
9 4.0 1.1 3.2 3.3 2.7 5.4 6.2 4.6
10 5.0 4.0 1.1 3.2 3.3 2.7 5.4 6.1
11 3.0 5.0 4.0 1.1 3.2 3.3 2.7 5.4
12 2.0 2.9 4.8 3.8 1.0 3.1 3.2 2.6
PK-5 31.0 33.5 32.7 31.1 31.2 32.4 31.8 31.4
6-8 7.0 8.6 10.5 13.1 14.8 13.2 12.3 12.9
9-12 14.0 13.0 13.1 11.4 10.2 14.5 17.5 18.7
PK-12 52.0 55.1 56.3 55.6 56.2 60.1 61.6 63.0
Study Area 245 Projection Date 10/2/2019
CURRENT PROJECTED RESIDENT STUDENTS
2019 2020 2021 2022 2023 2024 2025 2026
PK 2.0 1.9 1.9 1.8 1.9 1.8 1.8 1.8
K 13.0 12.5 11.8 11.5 11.6 11.6 11.6 11.6
1 9.0 12.4 11.9 11.2 11.0 11.0 11.1 11.0
2 10.0 9.1 12.5 12.0 11.3 11.1 11.1 11.2
3 10.0 10.3 9.4 12.8 12.4 11.6 11.4 11.5
4 7.0 9.8 10.1 9.2 12.6 12.2 11.4 11.2
5 11.0 6.9 9.7 10.0 9.1 12.5 12.0 11.3
6 4.0 9.0 5.7 8.0 8.2 7.4 10.2 9.9
7 13.0 4.1 9.3 5.9 8.2 8.4 7.7 10.5
8 9.0 12.9 4.1 9.2 5.8 8.1 8.4 7.6
9 9.0 9.8 14.0 4.4 10.0 6.3 8.8 9.1
10 12.0 8.9 9.7 13.9 4.4 9.9 6.3 8.8
11 9.0 12.0 8.9 9.7 13.9 4.4 9.9 6.3
12 10.0 8.7 11.6 8.6 9.4 13.5 4.3 9.6
PK-5 62.0 62.9 67.3 68.5 69.9 71.8 70.4 69.6
6-8 26.0 26.0 19.1 23.1 22.2 23.9 26.3 28.0
9-12 40.0 39.4 44.2 36.6 37.7 34.1 29.3 33.8
PK-12 128.0 128.3 130.6 128.2 129.8 129.8 126.0 131.4
Study Area 246 Projection Date 10/2/2019
CURRENT PROJECTED RESIDENT STUDENTS
2019 2020 2021 2022 2023 2024 2025 2026
PK 0.0 0.0 0.0 0.0 0.0 0.0 0.0 0.0
K 6.0 5.8 5.4 5.3 5.4 5.4 5.4 5.4
1 3.0 5.7 5.5 5.2 5.1 5.1 5.1 5.1
2 3.0 3.0 5.8 5.6 5.2 5.1 5.1 5.2
3 5.0 3.1 3.1 5.9 5.7 5.4 5.3 5.3
4 7.0 4.9 3.0 3.1 5.8 5.6 5.3 5.2
5 6.0 6.9 4.9 3.0 3.0 5.8 5.6 5.2
6 3.0 4.9 5.7 4.0 2.5 2.5 4.7 4.6
7 3.0 3.1 5.1 5.9 4.1 2.5 2.6 4.9
8 6.0 3.0 3.1 5.0 5.8 4.1 2.5 2.5
9 6.0 6.5 3.2 3.3 5.5 6.3 4.4 2.7
10 6.0 5.9 6.5 3.2 3.3 5.4 6.3 4.4
11 6.0 6.0 5.9 6.5 3.2 3.3 5.4 6.3
12 4.0 5.8 5.8 5.8 6.3 3.1 3.2 5.3
PK-5 30.0 29.4 27.7 28.1 30.2 32.4 31.8 31.4
6-8 12.0 11.0 13.9 14.9 12.4 9.1 9.8 12.0
9-12 22.0 24.2 21.4 18.8 18.3 18.1 19.3 18.7
PK-12 64.0 64.6 63.0 61.8 60.9 59.6 60.9 62.1
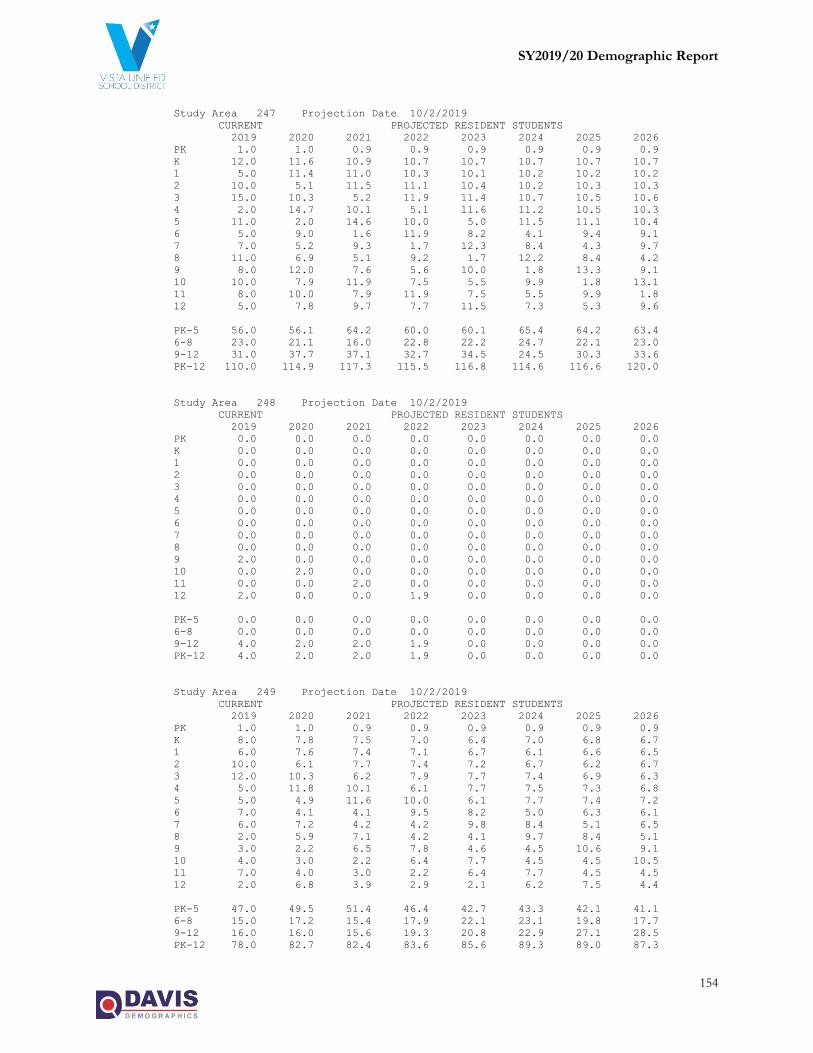
SY2019/20 Demographic Report
154
Study Area 247 Projection Date 10/2/2019
CURRENT PROJECTED RESIDENT STUDENTS
2019 2020 2021 2022 2023 2024 2025 2026
PK 1.0 1.0 0.9 0.9 0.9 0.9 0.9 0.9
K 12.0 11.6 10.9 10.7 10.7 10.7 10.7 10.7
1 5.0 11.4 11.0 10.3 10.1 10.2 10.2 10.2
2 10.0 5.1 11.5 11.1 10.4 10.2 10.3 10.3
3 15.0 10.3 5.2 11.9 11.4 10.7 10.5 10.6
4 2.0 14.7 10.1 5.1 11.6 11.2 10.5 10.3
5 11.0 2.0 14.6 10.0 5.0 11.5 11.1 10.4
6 5.0 9.0 1.6 11.9 8.2 4.1 9.4 9.1
7 7.0 5.2 9.3 1.7 12.3 8.4 4.3 9.7
8 11.0 6.9 5.1 9.2 1.7 12.2 8.4 4.2
9 8.0 12.0 7.6 5.6 10.0 1.8 13.3 9.1
10 10.0 7.9 11.9 7.5 5.5 9.9 1.8 13.1
11 8.0 10.0 7.9 11.9 7.5 5.5 9.9 1.8
12 5.0 7.8 9.7 7.7 11.5 7.3 5.3 9.6
PK-5 56.0 56.1 64.2 60.0 60.1 65.4 64.2 63.4
6-8 23.0 21.1 16.0 22.8 22.2 24.7 22.1 23.0
9-12 31.0 37.7 37.1 32.7 34.5 24.5 30.3 33.6
PK-12 110.0 114.9 117.3 115.5 116.8 114.6 116.6 120.0
Study Area 248 Projection Date 10/2/2019
CURRENT PROJECTED RESIDENT STUDENTS
2019 2020 2021 2022 2023 2024 2025 2026
PK 0.0 0.0 0.0 0.0 0.0 0.0 0.0 0.0
K 0.0 0.0 0.0 0.0 0.0 0.0 0.0 0.0
1 0.0 0.0 0.0 0.0 0.0 0.0 0.0 0.0
2 0.0 0.0 0.0 0.0 0.0 0.0 0.0 0.0
3 0.0 0.0 0.0 0.0 0.0 0.0 0.0 0.0
4 0.0 0.0 0.0 0.0 0.0 0.0 0.0 0.0
5 0.0 0.0 0.0 0.0 0.0 0.0 0.0 0.0
6 0.0 0.0 0.0 0.0 0.0 0.0 0.0 0.0
7 0.0 0.0 0.0 0.0 0.0 0.0 0.0 0.0
8 0.0 0.0 0.0 0.0 0.0 0.0 0.0 0.0
9 2.0 0.0 0.0 0.0 0.0 0.0 0.0 0.0
10 0.0 2.0 0.0 0.0 0.0 0.0 0.0 0.0
11 0.0 0.0 2.0 0.0 0.0 0.0 0.0 0.0
12 2.0 0.0 0.0 1.9 0.0 0.0 0.0 0.0
PK-5 0.0 0.0 0.0 0.0 0.0 0.0 0.0 0.0
6-8 0.0 0.0 0.0 0.0 0.0 0.0 0.0 0.0
9-12 4.0 2.0 2.0 1.9 0.0 0.0 0.0 0.0
PK-12 4.0 2.0 2.0 1.9 0.0 0.0 0.0 0.0
Study Area 249 Projection Date 10/2/2019
CURRENT PROJECTED RESIDENT STUDENTS
2019 2020 2021 2022 2023 2024 2025 2026
PK 1.0 1.0 0.9 0.9 0.9 0.9 0.9 0.9
K 8.0 7.8 7.5 7.0 6.4 7.0 6.8 6.7
1 6.0 7.6 7.4 7.1 6.7 6.1 6.6 6.5
2 10.0 6.1 7.7 7.4 7.2 6.7 6.2 6.7
3 12.0 10.3 6.2 7.9 7.7 7.4 6.9 6.3
4 5.0 11.8 10.1 6.1 7.7 7.5 7.3 6.8
5 5.0 4.9 11.6 10.0 6.1 7.7 7.4 7.2
6 7.0 4.1 4.1 9.5 8.2 5.0 6.3 6.1
7 6.0 7.2 4.2 4.2 9.8 8.4 5.1 6.5
8 2.0 5.9 7.1 4.2 4.1 9.7 8.4 5.1
9 3.0 2.2 6.5 7.8 4.6 4.5 10.6 9.1
10 4.0 3.0 2.2 6.4 7.7 4.5 4.5 10.5
11 7.0 4.0 3.0 2.2 6.4 7.7 4.5 4.5
12 2.0 6.8 3.9 2.9 2.1 6.2 7.5 4.4
PK-5 47.0 49.5 51.4 46.4 42.7 43.3 42.1 41.1
6-8 15.0 17.2 15.4 17.9 22.1 23.1 19.8 17.7
9-12 16.0 16.0 15.6 19.3 20.8 22.9 27.1 28.5
PK-12 78.0 82.7 82.4 83.6 85.6 89.3 89.0 87.3

SY2019/20 Demographic Report
155
Study Area 250 Projection Date 10/2/2019
CURRENT PROJECTED RESIDENT STUDENTS
2019 2020 2021 2022 2023 2024 2025 2026
PK 0.0 0.0 0.0 0.0 0.0 0.0 0.0 0.0
K 1.0 1.0 0.9 0.9 0.8 0.9 0.9 0.8
1 1.0 0.9 0.9 0.9 0.8 0.8 0.8 0.8
2 2.0 1.0 1.0 0.9 0.9 0.8 0.8 0.8
3 3.0 2.1 1.0 1.0 1.0 0.9 0.9 0.8
4 1.0 2.9 2.0 1.0 1.0 0.9 0.9 0.9
5 1.0 1.0 2.9 2.0 1.0 1.0 0.9 0.9
6 1.0 0.8 0.8 2.4 1.6 0.8 0.8 0.8
7 0.0 1.0 0.8 0.8 2.5 1.7 0.9 0.8
8 1.0 0.0 1.0 0.8 0.8 2.4 1.7 0.8
9 1.0 1.1 0.0 1.1 0.9 0.9 2.7 1.8
10 0.0 1.0 1.1 0.0 1.1 0.9 0.9 2.6
11 4.0 0.0 1.0 1.1 0.0 1.1 0.9 0.9
12 4.0 3.9 0.0 1.0 1.0 0.0 1.1 0.9
PK-5 9.0 8.9 8.7 6.7 5.5 5.3 5.2 5.0
6-8 2.0 1.8 2.6 4.0 4.9 4.9 3.4 2.4
9-12 9.0 6.0 2.1 3.2 3.0 2.9 5.6 6.2
PK-12 20.0 16.7 13.4 13.9 13.4 13.1 14.2 13.6
Study Area 251 Projection Date 10/2/2019
CURRENT PROJECTED RESIDENT STUDENTS
2019 2020 2021 2022 2023 2024 2025 2026
PK 1.0 1.0 0.9 0.9 0.9 0.9 0.9 0.9
K 0.0 0.0 0.0 0.0 0.0 0.0 0.0 0.0
1 1.0 0.0 0.0 0.0 0.0 0.0 0.0 0.0
2 4.0 1.0 0.0 0.0 0.0 0.0 0.0 0.0
3 0.0 4.1 1.0 0.0 0.0 0.0 0.0 0.0
4 3.0 0.0 4.0 1.0 0.0 0.0 0.0 0.0
5 1.0 3.0 0.0 4.0 1.0 0.0 0.0 0.0
6 0.0 0.8 2.4 0.0 3.3 0.8 0.0 0.0
7 1.0 0.0 0.8 2.5 0.0 3.4 0.9 0.0
8 3.0 1.0 0.0 0.8 2.5 0.0 3.3 0.8
9 2.0 3.3 1.1 0.0 0.9 2.7 0.0 3.6
10 2.0 2.0 3.2 1.1 0.0 0.9 2.7 0.0
11 1.0 2.0 2.0 3.2 1.1 0.0 0.9 2.7
12 0.0 1.0 1.9 1.9 3.1 1.0 0.0 0.9
PK-5 10.0 9.1 5.9 5.9 1.9 0.9 0.9 0.9
6-8 4.0 1.8 3.2 3.3 5.8 4.2 4.2 0.8
9-12 5.0 8.3 8.2 6.2 5.1 4.6 3.6 7.2
PK-12 19.0 19.2 17.3 15.4 12.8 9.7 8.7 8.9
Study Area 252 Projection Date 10/2/2019
CURRENT PROJECTED RESIDENT STUDENTS
2019 2020 2021 2022 2023 2024 2025 2026
PK 1.0 1.0 0.9 0.9 0.9 0.9 0.9 0.9
K 6.0 5.8 5.6 5.3 4.8 5.2 5.1 5.1
1 7.0 5.7 5.5 5.3 5.0 4.6 5.0 4.9
2 5.0 7.1 5.8 5.6 5.4 5.1 4.6 5.0
3 4.0 5.2 7.3 5.9 5.8 5.6 5.2 4.8
4 7.0 3.9 5.0 7.1 5.8 5.6 5.4 5.1
5 7.0 6.9 3.9 5.0 7.1 5.8 5.6 5.4
6 4.0 5.7 5.7 3.2 4.1 5.8 4.7 4.6
7 6.0 4.1 5.9 5.9 3.3 4.2 6.0 4.9
8 14.0 5.9 4.1 5.9 5.8 3.2 4.2 5.9
9 4.0 15.3 6.5 4.4 6.4 6.3 3.5 4.6
10 7.0 4.0 15.1 6.4 4.4 6.3 6.3 3.5
11 6.0 7.0 4.0 15.1 6.4 4.4 6.3 6.3
12 8.0 5.8 6.8 3.8 14.7 6.2 4.3 6.1
PK-5 37.0 35.6 34.0 35.1 34.8 32.8 31.8 31.2
6-8 24.0 15.7 15.7 15.0 13.2 13.2 14.9 15.4
9-12 25.0 32.1 32.4 29.7 31.9 23.2 20.4 20.5
PK-12 86.0 83.4 82.1 79.8 79.9 69.2 67.1 67.1

SY2019/20 Demographic Report
156
Study Area 253 Projection Date 10/2/2019
CURRENT PROJECTED RESIDENT STUDENTS
2019 2020 2021 2022 2023 2024 2025 2026
PK 0.0 0.0 0.0 0.0 0.0 0.0 0.0 0.0
K 3.0 2.9 2.8 2.6 2.4 2.6 2.6 2.5
1 1.0 2.8 2.8 2.7 2.5 2.3 2.5 2.4
2 3.0 1.0 2.9 2.8 2.7 2.5 2.3 2.5
3 4.0 3.1 1.0 3.0 2.9 2.8 2.6 2.4
4 2.0 3.9 3.0 1.0 2.9 2.8 2.7 2.6
5 1.0 2.0 3.9 3.0 1.0 2.9 2.8 2.7
6 3.0 0.8 1.6 3.2 2.5 0.8 2.4 2.3
7 3.0 3.1 0.8 1.7 3.3 2.5 0.9 2.4
8 5.0 3.0 3.1 0.8 1.7 3.2 2.5 0.8
9 11.0 5.4 3.2 3.3 0.9 1.8 3.5 2.7
10 3.0 10.9 5.4 3.2 3.3 0.9 1.8 3.5
11 8.0 3.0 10.9 5.4 3.2 3.3 0.9 1.8
12 2.0 7.8 2.9 10.6 5.2 3.1 3.2 0.9
PK-5 14.0 15.7 16.4 15.1 14.4 15.9 15.5 15.1
6-8 11.0 6.9 5.5 5.7 7.5 6.5 5.8 5.5
9-12 24.0 27.1 22.4 22.5 12.6 9.1 9.4 8.9
PK-12 49.0 49.7 44.3 43.3 34.5 31.5 30.7 29.5
Study Area 254 Projection Date 10/2/2019
CURRENT PROJECTED RESIDENT STUDENTS
2019 2020 2021 2022 2023 2024 2025 2026
PK 0.0 0.0 0.0 0.0 0.0 0.0 0.0 0.0
K 2.0 1.9 1.9 1.8 1.6 1.7 1.7 1.7
1 3.0 1.9 1.8 1.8 1.7 1.5 1.7 1.6
2 3.0 3.0 1.9 1.9 1.8 1.7 1.5 1.7
3 7.0 3.1 3.1 2.0 1.9 1.9 1.7 1.6
4 6.0 6.9 3.0 3.1 1.9 1.9 1.8 1.7
5 4.0 5.9 6.8 3.0 3.0 1.9 1.9 1.8
6 1.0 3.3 4.9 5.6 2.5 2.5 1.6 1.5
7 5.0 1.0 3.4 5.0 5.7 2.5 2.6 1.6
8 4.0 4.9 1.0 3.3 5.0 5.7 2.5 2.5
9 7.0 4.4 5.4 1.1 3.6 5.4 6.2 2.7
10 5.0 6.9 4.3 5.3 1.1 3.6 5.4 6.1
11 6.0 5.0 6.9 4.3 5.3 1.1 3.6 5.4
12 6.0 5.8 4.8 6.7 4.2 5.2 1.1 3.5
PK-5 25.0 22.7 18.5 13.6 11.9 10.6 10.3 10.1
6-8 10.0 9.2 9.3 13.9 13.2 10.7 6.7 5.6
9-12 24.0 22.1 21.4 17.4 14.2 15.3 16.3 17.7
PK-12 59.0 54.0 49.2 44.9 39.3 36.6 33.3 33.4
Study Area 255 Projection Date 10/2/2019
CURRENT PROJECTED RESIDENT STUDENTS
2019 2020 2021 2022 2023 2024 2025 2026
PK 0.0 0.0 0.0 0.0 0.0 0.0 0.0 0.0
K 3.0 2.9 2.8 2.6 2.4 2.6 2.6 2.5
1 1.0 2.8 2.8 2.7 2.5 2.3 2.5 2.4
2 9.0 1.0 2.9 2.8 2.7 2.5 2.3 2.5
3 5.0 9.3 1.0 3.0 2.9 2.8 2.6 2.4
4 2.0 4.9 9.1 1.0 2.9 2.8 2.7 2.6
5 4.0 2.0 4.9 9.0 1.0 2.9 2.8 2.7
6 1.0 3.3 1.6 4.0 7.4 0.8 2.4 2.3
7 8.0 1.0 3.4 1.7 4.1 7.6 0.9 2.4
8 8.0 7.9 1.0 3.3 1.7 4.1 7.5 0.8
9 8.0 8.7 8.6 1.1 3.6 1.8 4.4 8.2
10 8.0 7.9 8.6 8.5 1.1 3.6 1.8 4.4
11 2.0 8.0 7.9 8.6 8.5 1.1 3.6 1.8
12 5.0 1.9 7.8 7.7 8.4 8.3 1.1 3.5
PK-5 24.0 22.9 23.5 21.1 14.4 15.9 15.5 15.1
6-8 17.0 12.2 6.0 9.0 13.2 12.5 10.8 5.5
9-12 23.0 26.5 32.9 25.9 21.6 14.8 10.9 17.9
PK-12 64.0 61.6 62.4 56.0 49.2 43.2 37.2 38.5
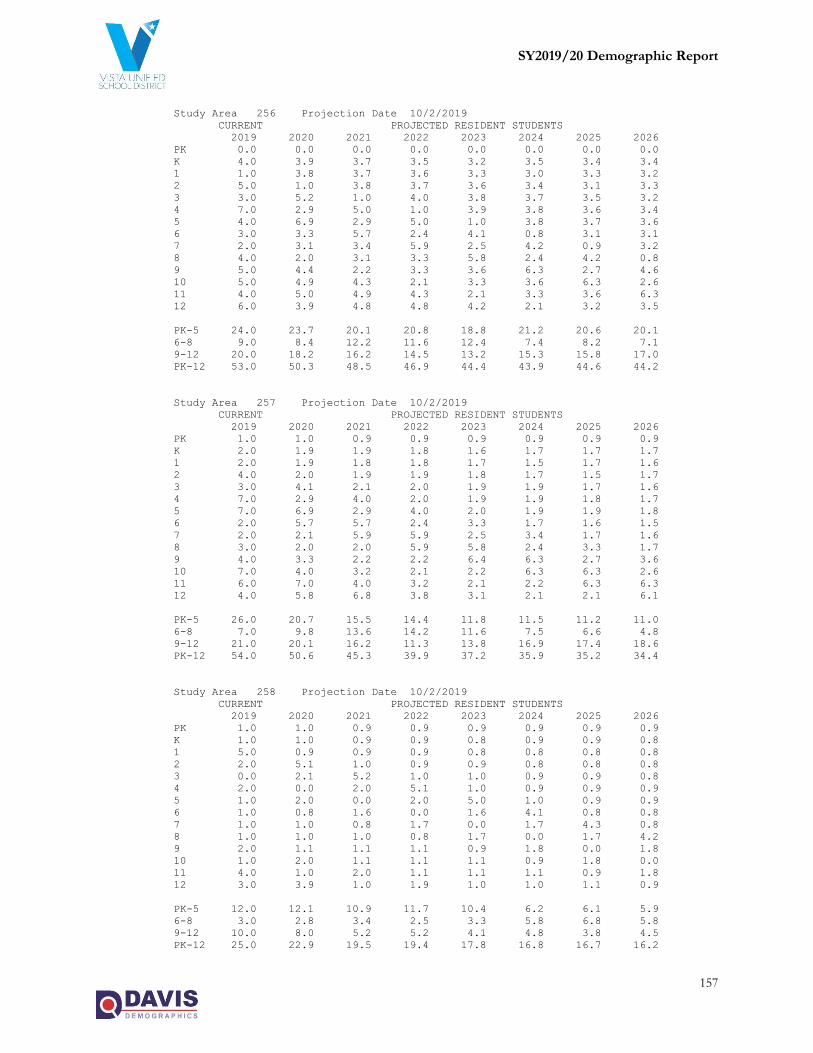
SY2019/20 Demographic Report
157
Study Area 256 Projection Date 10/2/2019
CURRENT PROJECTED RESIDENT STUDENTS
2019 2020 2021 2022 2023 2024 2025 2026
PK 0.0 0.0 0.0 0.0 0.0 0.0 0.0 0.0
K 4.0 3.9 3.7 3.5 3.2 3.5 3.4 3.4
1 1.0 3.8 3.7 3.6 3.3 3.0 3.3 3.2
2 5.0 1.0 3.8 3.7 3.6 3.4 3.1 3.3
3 3.0 5.2 1.0 4.0 3.8 3.7 3.5 3.2
4 7.0 2.9 5.0 1.0 3.9 3.8 3.6 3.4
5 4.0 6.9 2.9 5.0 1.0 3.8 3.7 3.6
6 3.0 3.3 5.7 2.4 4.1 0.8 3.1 3.1
7 2.0 3.1 3.4 5.9 2.5 4.2 0.9 3.2
8 4.0 2.0 3.1 3.3 5.8 2.4 4.2 0.8
9 5.0 4.4 2.2 3.3 3.6 6.3 2.7 4.6
10 5.0 4.9 4.3 2.1 3.3 3.6 6.3 2.6
11 4.0 5.0 4.9 4.3 2.1 3.3 3.6 6.3
12 6.0 3.9 4.8 4.8 4.2 2.1 3.2 3.5
PK-5 24.0 23.7 20.1 20.8 18.8 21.2 20.6 20.1
6-8 9.0 8.4 12.2 11.6 12.4 7.4 8.2 7.1
9-12 20.0 18.2 16.2 14.5 13.2 15.3 15.8 17.0
PK-12 53.0 50.3 48.5 46.9 44.4 43.9 44.6 44.2
Study Area 257 Projection Date 10/2/2019
CURRENT PROJECTED RESIDENT STUDENTS
2019 2020 2021 2022 2023 2024 2025 2026
PK 1.0 1.0 0.9 0.9 0.9 0.9 0.9 0.9
K 2.0 1.9 1.9 1.8 1.6 1.7 1.7 1.7
1 2.0 1.9 1.8 1.8 1.7 1.5 1.7 1.6
2 4.0 2.0 1.9 1.9 1.8 1.7 1.5 1.7
3 3.0 4.1 2.1 2.0 1.9 1.9 1.7 1.6
4 7.0 2.9 4.0 2.0 1.9 1.9 1.8 1.7
5 7.0 6.9 2.9 4.0 2.0 1.9 1.9 1.8
6 2.0 5.7 5.7 2.4 3.3 1.7 1.6 1.5
7 2.0 2.1 5.9 5.9 2.5 3.4 1.7 1.6
8 3.0 2.0 2.0 5.9 5.8 2.4 3.3 1.7
9 4.0 3.3 2.2 2.2 6.4 6.3 2.7 3.6
10 7.0 4.0 3.2 2.1 2.2 6.3 6.3 2.6
11 6.0 7.0 4.0 3.2 2.1 2.2 6.3 6.3
12 4.0 5.8 6.8 3.8 3.1 2.1 2.1 6.1
PK-5 26.0 20.7 15.5 14.4 11.8 11.5 11.2 11.0
6-8 7.0 9.8 13.6 14.2 11.6 7.5 6.6 4.8
9-12 21.0 20.1 16.2 11.3 13.8 16.9 17.4 18.6
PK-12 54.0 50.6 45.3 39.9 37.2 35.9 35.2 34.4
Study Area 258 Projection Date 10/2/2019
CURRENT PROJECTED RESIDENT STUDENTS
2019 2020 2021 2022 2023 2024 2025 2026
PK 1.0 1.0 0.9 0.9 0.9 0.9 0.9 0.9
K 1.0 1.0 0.9 0.9 0.8 0.9 0.9 0.8
1 5.0 0.9 0.9 0.9 0.8 0.8 0.8 0.8
2 2.0 5.1 1.0 0.9 0.9 0.8 0.8 0.8
3 0.0 2.1 5.2 1.0 1.0 0.9 0.9 0.8
4 2.0 0.0 2.0 5.1 1.0 0.9 0.9 0.9
5 1.0 2.0 0.0 2.0 5.0 1.0 0.9 0.9
6 1.0 0.8 1.6 0.0 1.6 4.1 0.8 0.8
7 1.0 1.0 0.8 1.7 0.0 1.7 4.3 0.8
8 1.0 1.0 1.0 0.8 1.7 0.0 1.7 4.2
9 2.0 1.1 1.1 1.1 0.9 1.8 0.0 1.8
10 1.0 2.0 1.1 1.1 1.1 0.9 1.8 0.0
11 4.0 1.0 2.0 1.1 1.1 1.1 0.9 1.8
12 3.0 3.9 1.0 1.9 1.0 1.0 1.1 0.9
PK-5 12.0 12.1 10.9 11.7 10.4 6.2 6.1 5.9
6-8 3.0 2.8 3.4 2.5 3.3 5.8 6.8 5.8
9-12 10.0 8.0 5.2 5.2 4.1 4.8 3.8 4.5
PK-12 25.0 22.9 19.5 19.4 17.8 16.8 16.7 16.2
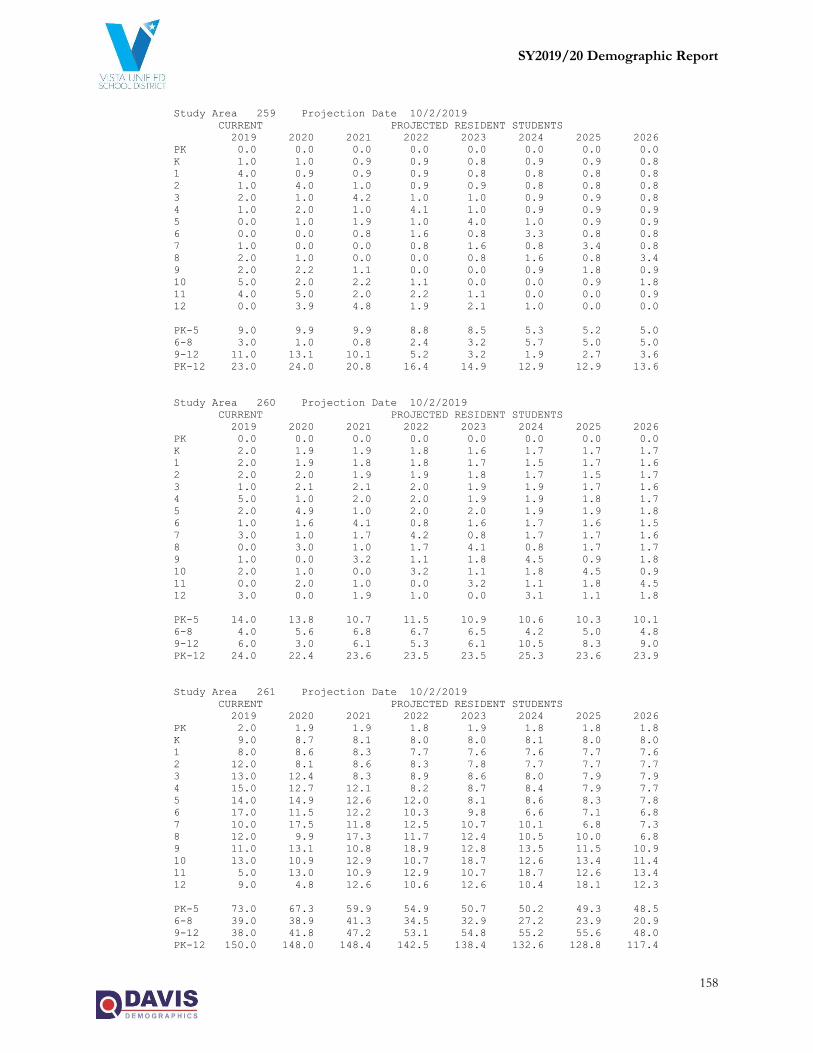
SY2019/20 Demographic Report
158
Study Area 259 Projection Date 10/2/2019
CURRENT PROJECTED RESIDENT STUDENTS
2019 2020 2021 2022 2023 2024 2025 2026
PK 0.0 0.0 0.0 0.0 0.0 0.0 0.0 0.0
K 1.0 1.0 0.9 0.9 0.8 0.9 0.9 0.8
1 4.0 0.9 0.9 0.9 0.8 0.8 0.8 0.8
2 1.0 4.0 1.0 0.9 0.9 0.8 0.8 0.8
3 2.0 1.0 4.2 1.0 1.0 0.9 0.9 0.8
4 1.0 2.0 1.0 4.1 1.0 0.9 0.9 0.9
5 0.0 1.0 1.9 1.0 4.0 1.0 0.9 0.9
6 0.0 0.0 0.8 1.6 0.8 3.3 0.8 0.8
7 1.0 0.0 0.0 0.8 1.6 0.8 3.4 0.8
8 2.0 1.0 0.0 0.0 0.8 1.6 0.8 3.4
9 2.0 2.2 1.1 0.0 0.0 0.9 1.8 0.9
10 5.0 2.0 2.2 1.1 0.0 0.0 0.9 1.8
11 4.0 5.0 2.0 2.2 1.1 0.0 0.0 0.9
12 0.0 3.9 4.8 1.9 2.1 1.0 0.0 0.0
PK-5 9.0 9.9 9.9 8.8 8.5 5.3 5.2 5.0
6-8 3.0 1.0 0.8 2.4 3.2 5.7 5.0 5.0
9-12 11.0 13.1 10.1 5.2 3.2 1.9 2.7 3.6
PK-12 23.0 24.0 20.8 16.4 14.9 12.9 12.9 13.6
Study Area 260 Projection Date 10/2/2019
CURRENT PROJECTED RESIDENT STUDENTS
2019 2020 2021 2022 2023 2024 2025 2026
PK 0.0 0.0 0.0 0.0 0.0 0.0 0.0 0.0
K 2.0 1.9 1.9 1.8 1.6 1.7 1.7 1.7
1 2.0 1.9 1.8 1.8 1.7 1.5 1.7 1.6
2 2.0 2.0 1.9 1.9 1.8 1.7 1.5 1.7
3 1.0 2.1 2.1 2.0 1.9 1.9 1.7 1.6
4 5.0 1.0 2.0 2.0 1.9 1.9 1.8 1.7
5 2.0 4.9 1.0 2.0 2.0 1.9 1.9 1.8
6 1.0 1.6 4.1 0.8 1.6 1.7 1.6 1.5
7 3.0 1.0 1.7 4.2 0.8 1.7 1.7 1.6
8 0.0 3.0 1.0 1.7 4.1 0.8 1.7 1.7
9 1.0 0.0 3.2 1.1 1.8 4.5 0.9 1.8
10 2.0 1.0 0.0 3.2 1.1 1.8 4.5 0.9
11 0.0 2.0 1.0 0.0 3.2 1.1 1.8 4.5
12 3.0 0.0 1.9 1.0 0.0 3.1 1.1 1.8
PK-5 14.0 13.8 10.7 11.5 10.9 10.6 10.3 10.1
6-8 4.0 5.6 6.8 6.7 6.5 4.2 5.0 4.8
9-12 6.0 3.0 6.1 5.3 6.1 10.5 8.3 9.0
PK-12 24.0 22.4 23.6 23.5 23.5 25.3 23.6 23.9
Study Area 261 Projection Date 10/2/2019
CURRENT PROJECTED RESIDENT STUDENTS
2019 2020 2021 2022 2023 2024 2025 2026
PK 2.0 1.9 1.9 1.8 1.9 1.8 1.8 1.8
K 9.0 8.7 8.1 8.0 8.0 8.1 8.0 8.0
1 8.0 8.6 8.3 7.7 7.6 7.6 7.7 7.6
2 12.0 8.1 8.6 8.3 7.8 7.7 7.7 7.7
3 13.0 12.4 8.3 8.9 8.6 8.0 7.9 7.9
4 15.0 12.7 12.1 8.2 8.7 8.4 7.9 7.7
5 14.0 14.9 12.6 12.0 8.1 8.6 8.3 7.8
6 17.0 11.5 12.2 10.3 9.8 6.6 7.1 6.8
7 10.0 17.5 11.8 12.5 10.7 10.1 6.8 7.3
8 12.0 9.9 17.3 11.7 12.4 10.5 10.0 6.8
9 11.0 13.1 10.8 18.9 12.8 13.5 11.5 10.9
10 13.0 10.9 12.9 10.7 18.7 12.6 13.4 11.4
11 5.0 13.0 10.9 12.9 10.7 18.7 12.6 13.4
12 9.0 4.8 12.6 10.6 12.6 10.4 18.1 12.3
PK-5 73.0 67.3 59.9 54.9 50.7 50.2 49.3 48.5
6-8 39.0 38.9 41.3 34.5 32.9 27.2 23.9 20.9
9-12 38.0 41.8 47.2 53.1 54.8 55.2 55.6 48.0
PK-12 150.0 148.0 148.4 142.5 138.4 132.6 128.8 117.4
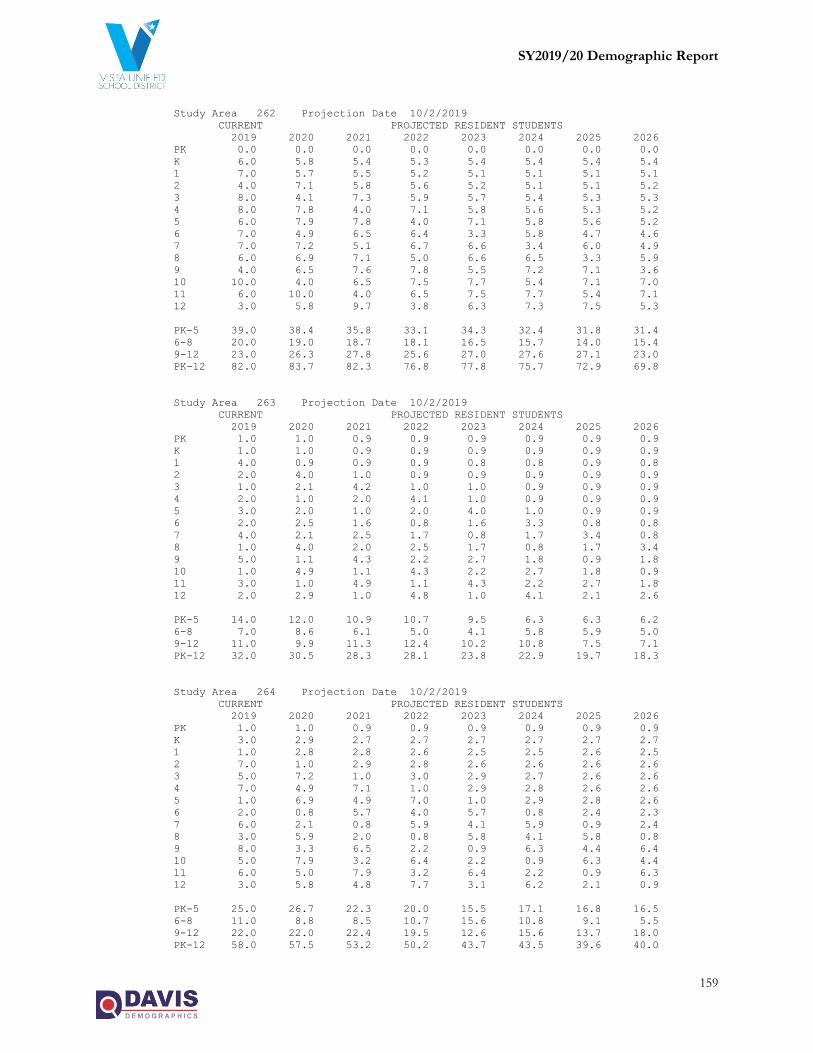
SY2019/20 Demographic Report
159
Study Area 262 Projection Date 10/2/2019
CURRENT PROJECTED RESIDENT STUDENTS
2019 2020 2021 2022 2023 2024 2025 2026
PK 0.0 0.0 0.0 0.0 0.0 0.0 0.0 0.0
K 6.0 5.8 5.4 5.3 5.4 5.4 5.4 5.4
1 7.0 5.7 5.5 5.2 5.1 5.1 5.1 5.1
2 4.0 7.1 5.8 5.6 5.2 5.1 5.1 5.2
3 8.0 4.1 7.3 5.9 5.7 5.4 5.3 5.3
4 8.0 7.8 4.0 7.1 5.8 5.6 5.3 5.2
5 6.0 7.9 7.8 4.0 7.1 5.8 5.6 5.2
6 7.0 4.9 6.5 6.4 3.3 5.8 4.7 4.6
7 7.0 7.2 5.1 6.7 6.6 3.4 6.0 4.9
8 6.0 6.9 7.1 5.0 6.6 6.5 3.3 5.9
9 4.0 6.5 7.6 7.8 5.5 7.2 7.1 3.6
10 10.0 4.0 6.5 7.5 7.7 5.4 7.1 7.0
11 6.0 10.0 4.0 6.5 7.5 7.7 5.4 7.1
12 3.0 5.8 9.7 3.8 6.3 7.3 7.5 5.3
PK-5 39.0 38.4 35.8 33.1 34.3 32.4 31.8 31.4
6-8 20.0 19.0 18.7 18.1 16.5 15.7 14.0 15.4
9-12 23.0 26.3 27.8 25.6 27.0 27.6 27.1 23.0
PK-12 82.0 83.7 82.3 76.8 77.8 75.7 72.9 69.8
Study Area 263 Projection Date 10/2/2019
CURRENT PROJECTED RESIDENT STUDENTS
2019 2020 2021 2022 2023 2024 2025 2026
PK 1.0 1.0 0.9 0.9 0.9 0.9 0.9 0.9
K 1.0 1.0 0.9 0.9 0.9 0.9 0.9 0.9
1 4.0 0.9 0.9 0.9 0.8 0.8 0.9 0.8
2 2.0 4.0 1.0 0.9 0.9 0.9 0.9 0.9
3 1.0 2.1 4.2 1.0 1.0 0.9 0.9 0.9
4 2.0 1.0 2.0 4.1 1.0 0.9 0.9 0.9
5 3.0 2.0 1.0 2.0 4.0 1.0 0.9 0.9
6 2.0 2.5 1.6 0.8 1.6 3.3 0.8 0.8
7 4.0 2.1 2.5 1.7 0.8 1.7 3.4 0.8
8 1.0 4.0 2.0 2.5 1.7 0.8 1.7 3.4
9 5.0 1.1 4.3 2.2 2.7 1.8 0.9 1.8
10 1.0 4.9 1.1 4.3 2.2 2.7 1.8 0.9
11 3.0 1.0 4.9 1.1 4.3 2.2 2.7 1.8
12 2.0 2.9 1.0 4.8 1.0 4.1 2.1 2.6
PK-5 14.0 12.0 10.9 10.7 9.5 6.3 6.3 6.2
6-8 7.0 8.6 6.1 5.0 4.1 5.8 5.9 5.0
9-12 11.0 9.9 11.3 12.4 10.2 10.8 7.5 7.1
PK-12 32.0 30.5 28.3 28.1 23.8 22.9 19.7 18.3
Study Area 264 Projection Date 10/2/2019
CURRENT PROJECTED RESIDENT STUDENTS
2019 2020 2021 2022 2023 2024 2025 2026
PK 1.0 1.0 0.9 0.9 0.9 0.9 0.9 0.9
K 3.0 2.9 2.7 2.7 2.7 2.7 2.7 2.7
1 1.0 2.8 2.8 2.6 2.5 2.5 2.6 2.5
2 7.0 1.0 2.9 2.8 2.6 2.6 2.6 2.6
3 5.0 7.2 1.0 3.0 2.9 2.7 2.6 2.6
4 7.0 4.9 7.1 1.0 2.9 2.8 2.6 2.6
5 1.0 6.9 4.9 7.0 1.0 2.9 2.8 2.6
6 2.0 0.8 5.7 4.0 5.7 0.8 2.4 2.3
7 6.0 2.1 0.8 5.9 4.1 5.9 0.9 2.4
8 3.0 5.9 2.0 0.8 5.8 4.1 5.8 0.8
9 8.0 3.3 6.5 2.2 0.9 6.3 4.4 6.4
10 5.0 7.9 3.2 6.4 2.2 0.9 6.3 4.4
11 6.0 5.0 7.9 3.2 6.4 2.2 0.9 6.3
12 3.0 5.8 4.8 7.7 3.1 6.2 2.1 0.9
PK-5 25.0 26.7 22.3 20.0 15.5 17.1 16.8 16.5
6-8 11.0 8.8 8.5 10.7 15.6 10.8 9.1 5.5
9-12 22.0 22.0 22.4 19.5 12.6 15.6 13.7 18.0
PK-12 58.0 57.5 53.2 50.2 43.7 43.5 39.6 40.0

SY2019/20 Demographic Report
160
Study Area 265 Projection Date 10/2/2019
CURRENT PROJECTED RESIDENT STUDENTS
2019 2020 2021 2022 2023 2024 2025 2026
PK 0.0 0.0 0.0 0.0 0.0 0.0 0.0 0.0
K 5.0 4.8 4.5 4.4 4.5 4.5 4.5 4.5
1 11.0 4.8 4.6 4.3 4.2 4.2 4.3 4.2
2 2.0 11.1 4.8 4.6 4.3 4.3 4.3 4.3
3 6.0 2.1 11.4 4.9 4.8 4.5 4.4 4.4
4 5.0 5.9 2.0 11.2 4.8 4.7 4.4 4.3
5 5.0 4.9 5.8 2.0 11.1 4.8 4.6 4.3
6 7.0 4.1 4.1 4.8 1.6 9.1 3.9 3.8
7 5.0 7.2 4.2 4.2 4.9 1.7 9.4 4.0
8 5.0 4.9 7.1 4.2 4.1 4.9 1.7 9.3
9 7.0 5.4 5.4 7.8 4.6 4.5 5.3 1.8
10 6.0 6.9 5.4 5.3 7.7 4.5 4.5 5.3
11 9.0 6.0 6.9 5.4 5.3 7.7 4.5 4.5
12 12.0 8.7 5.8 6.7 5.2 5.2 7.5 4.4
PK-5 34.0 33.6 33.1 31.4 33.7 27.0 26.5 26.0
6-8 17.0 16.2 15.4 13.2 10.6 15.7 15.0 17.1
9-12 34.0 27.0 23.5 25.2 22.8 21.9 21.8 16.0
PK-12 85.0 76.8 72.0 69.8 67.1 64.6 63.3 59.1
Study Area 266 Projection Date 10/2/2019
CURRENT PROJECTED RESIDENT STUDENTS
2019 2020 2021 2022 2023 2024 2025 2026
PK 0.0 0.0 0.0 0.0 0.0 0.0 0.0 0.0
K 6.0 5.8 5.4 5.3 5.4 5.4 5.4 5.4
1 2.0 5.7 5.5 5.2 5.1 5.1 5.1 5.1
2 5.0 2.0 5.8 5.6 5.2 5.1 5.1 5.2
3 2.0 5.2 2.1 5.9 5.7 5.4 5.3 5.3
4 5.0 2.0 5.0 2.0 5.8 5.6 5.3 5.2
5 2.0 4.9 1.9 5.0 2.0 5.8 5.6 5.2
6 4.0 1.6 4.1 1.6 4.1 1.7 4.7 4.6
7 4.0 4.1 1.7 4.2 1.6 4.2 1.7 4.9
8 2.0 4.0 4.1 1.7 4.1 1.6 4.2 1.7
9 5.0 2.2 4.3 4.4 1.8 4.5 1.8 4.6
10 2.0 4.9 2.2 4.3 4.4 1.8 4.5 1.8
11 5.0 2.0 4.9 2.2 4.3 4.4 1.8 4.5
12 3.0 4.8 1.9 4.8 2.1 4.1 4.3 1.8
PK-5 22.0 25.6 25.7 29.0 29.2 32.4 31.8 31.4
6-8 10.0 9.7 9.9 7.5 9.8 7.5 10.6 11.2
9-12 15.0 13.9 13.3 15.7 12.6 14.8 12.4 12.7
PK-12 47.0 49.2 48.9 52.2 51.6 54.7 54.8 55.3
Study Area 267 Projection Date 10/2/2019
CURRENT PROJECTED RESIDENT STUDENTS
2019 2020 2021 2022 2023 2024 2025 2026
PK 1.0 1.0 0.9 0.9 0.9 0.9 0.9 0.9
K 8.0 7.7 7.2 7.1 7.1 7.2 7.1 7.1
1 5.0 7.6 7.3 6.9 6.8 6.8 6.8 6.8
2 6.0 4.6 7.0 6.7 6.3 6.2 6.2 6.3
3 5.0 6.4 4.9 7.4 7.2 6.7 6.6 6.6
4 6.0 4.8 6.2 4.7 7.2 6.9 6.5 6.4
5 6.0 6.1 4.9 6.2 4.8 7.3 7.0 6.6
6 8.0 4.8 4.8 3.9 5.0 3.8 5.8 5.6
7 5.0 7.8 4.7 4.8 3.8 4.9 3.7 5.7
8 7.0 4.8 7.5 4.5 4.6 3.7 4.7 3.6
9 8.0 7.8 5.3 8.4 5.0 5.1 4.1 5.2
10 7.0 7.8 7.6 5.2 8.2 4.9 5.0 4.0
11 5.0 6.9 7.8 7.5 5.2 8.1 4.9 4.9
12 4.0 5.1 7.1 7.9 7.7 5.3 8.3 5.0
PK-5 37.0 38.2 38.4 39.9 40.3 42.0 41.1 40.7
6-8 20.0 17.4 17.0 13.2 13.4 12.4 14.2 14.9
9-12 24.0 27.6 27.8 29.0 26.1 23.4 22.3 19.1
PK-12 81.0 83.2 83.2 82.1 79.8 77.8 77.6 74.7

SY2019/20 Demographic Report
161
Study Area 268 Projection Date 10/2/2019
CURRENT PROJECTED RESIDENT STUDENTS
2019 2020 2021 2022 2023 2024 2025 2026
PK 2.0 1.9 1.9 1.8 1.9 1.8 1.8 1.8
K 2.0 1.9 1.8 1.9 1.7 1.8 1.8 1.7
1 1.0 1.9 1.8 1.7 1.8 1.6 1.7 1.7
2 3.0 0.9 1.7 1.7 1.6 1.6 1.5 1.6
3 4.0 3.2 1.0 1.9 1.8 1.7 1.7 1.6
4 1.0 3.9 3.1 0.9 1.8 1.7 1.6 1.7
5 1.0 1.0 3.9 3.1 1.0 1.8 1.7 1.6
6 2.0 0.8 0.8 3.1 2.5 0.8 1.5 1.4
7 6.0 2.0 0.8 0.8 3.1 2.4 0.7 1.4
8 4.0 5.8 1.9 0.8 0.8 2.9 2.3 0.7
9 3.0 4.4 6.4 2.1 0.8 0.8 3.3 2.6
10 3.0 2.9 4.4 6.3 2.0 0.8 0.8 3.2
11 6.0 3.0 2.9 4.3 6.2 2.0 0.8 0.8
12 4.0 6.1 3.0 3.0 4.4 6.3 2.1 0.8
PK-5 14.0 14.7 15.2 13.0 11.6 12.0 11.8 11.7
6-8 12.0 8.6 3.5 4.7 6.4 6.1 4.5 3.5
9-12 16.0 16.4 16.7 15.7 13.4 9.9 7.0 7.4
PK-12 42.0 39.7 35.4 33.4 31.4 28.0 23.3 22.6
Study Area 269 Projection Date 10/2/2019
CURRENT PROJECTED RESIDENT STUDENTS
2019 2020 2021 2022 2023 2024 2025 2026
PK 0.0 0.0 0.0 0.0 0.0 0.0 0.0 0.0
K 7.0 6.8 6.3 6.2 6.2 6.3 6.2 6.3
1 9.0 6.7 6.4 6.0 5.9 5.9 6.0 5.9
2 7.0 8.3 6.1 5.9 5.5 5.4 5.5 5.5
3 8.0 7.4 8.8 6.5 6.3 5.9 5.8 5.8
4 13.0 7.8 7.2 8.5 6.3 6.1 5.7 5.6
5 9.0 13.1 7.8 7.3 8.6 6.4 6.1 5.7
6 6.0 7.2 10.5 6.3 5.8 6.9 5.1 4.9
7 3.0 5.9 7.1 10.3 6.1 5.7 6.7 5.0
8 11.0 2.9 5.6 6.8 9.9 5.9 5.5 6.5
9 8.0 12.2 3.2 6.3 7.5 11.0 6.5 6.1
10 8.0 7.8 12.0 3.1 6.1 7.4 10.7 6.4
11 6.0 7.9 7.8 11.8 3.1 6.1 7.3 10.6
12 8.0 6.1 8.1 7.9 12.1 3.2 6.2 7.4
PK-5 53.0 50.1 42.6 40.4 38.8 36.0 35.3 34.8
6-8 20.0 16.0 23.2 23.4 21.8 18.5 17.3 16.4
9-12 30.0 34.0 31.1 29.1 28.8 27.7 30.7 30.5
PK-12 103.0 100.1 96.9 92.9 89.4 82.2 83.3 81.7
Study Area 270 Projection Date 10/2/2019
CURRENT PROJECTED RESIDENT STUDENTS
2019 2020 2021 2022 2023 2024 2025 2026
PK 1.0 1.0 0.9 0.9 0.9 0.9 0.9 0.9
K 4.0 3.8 3.6 3.8 3.4 3.6 3.6 3.5
1 6.0 3.8 3.6 3.4 3.6 3.2 3.4 3.4
2 2.0 5.5 3.5 3.3 3.1 3.3 2.9 3.1
3 5.0 2.1 5.9 3.7 3.5 3.3 3.5 3.1
4 3.0 4.8 2.1 5.7 3.6 3.4 3.2 3.4
5 6.0 3.0 4.9 2.1 5.7 3.6 3.5 3.2
6 3.0 4.8 2.4 3.9 1.7 4.6 2.9 2.8
7 4.0 2.9 4.7 2.4 3.8 1.6 4.5 2.8
8 3.0 3.8 2.8 4.5 2.3 3.7 1.6 4.3
9 5.0 3.3 4.3 3.1 5.0 2.5 4.1 1.7
10 2.0 4.9 3.3 4.2 3.1 4.9 2.5 4.0
11 4.0 2.0 4.9 3.2 4.1 3.0 4.9 2.5
12 6.0 4.1 2.0 4.9 3.3 4.2 3.1 5.0
PK-5 27.0 24.0 24.5 22.9 23.8 21.3 21.0 20.6
6-8 10.0 11.5 9.9 10.8 7.8 9.9 9.0 9.9
9-12 17.0 14.3 14.5 15.4 15.5 14.6 14.6 13.2
PK-12 54.0 49.8 48.9 49.1 47.1 45.8 44.6 43.7
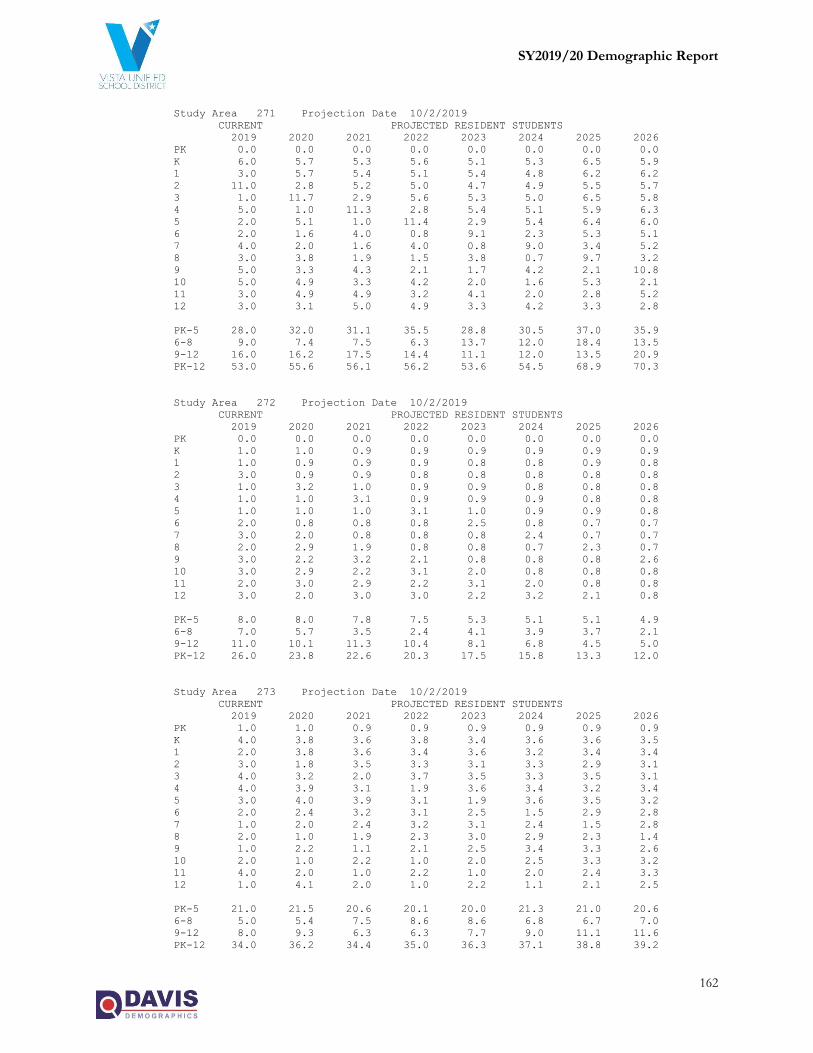
SY2019/20 Demographic Report
162
Study Area 271 Projection Date 10/2/2019
CURRENT PROJECTED RESIDENT STUDENTS
2019 2020 2021 2022 2023 2024 2025 2026
PK 0.0 0.0 0.0 0.0 0.0 0.0 0.0 0.0
K 6.0 5.7 5.3 5.6 5.1 5.3 6.5 5.9
1 3.0 5.7 5.4 5.1 5.4 4.8 6.2 6.2
2 11.0 2.8 5.2 5.0 4.7 4.9 5.5 5.7
3 1.0 11.7 2.9 5.6 5.3 5.0 6.5 5.8
4 5.0 1.0 11.3 2.8 5.4 5.1 5.9 6.3
5 2.0 5.1 1.0 11.4 2.9 5.4 6.4 6.0
6 2.0 1.6 4.0 0.8 9.1 2.3 5.3 5.1
7 4.0 2.0 1.6 4.0 0.8 9.0 3.4 5.2
8 3.0 3.8 1.9 1.5 3.8 0.7 9.7 3.2
9 5.0 3.3 4.3 2.1 1.7 4.2 2.1 10.8
10 5.0 4.9 3.3 4.2 2.0 1.6 5.3 2.1
11 3.0 4.9 4.9 3.2 4.1 2.0 2.8 5.2
12 3.0 3.1 5.0 4.9 3.3 4.2 3.3 2.8
PK-5 28.0 32.0 31.1 35.5 28.8 30.5 37.0 35.9
6-8 9.0 7.4 7.5 6.3 13.7 12.0 18.4 13.5
9-12 16.0 16.2 17.5 14.4 11.1 12.0 13.5 20.9
PK-12 53.0 55.6 56.1 56.2 53.6 54.5 68.9 70.3
Study Area 272 Projection Date 10/2/2019
CURRENT PROJECTED RESIDENT STUDENTS
2019 2020 2021 2022 2023 2024 2025 2026
PK 0.0 0.0 0.0 0.0 0.0 0.0 0.0 0.0
K 1.0 1.0 0.9 0.9 0.9 0.9 0.9 0.9
1 1.0 0.9 0.9 0.9 0.8 0.8 0.9 0.8
2 3.0 0.9 0.9 0.8 0.8 0.8 0.8 0.8
3 1.0 3.2 1.0 0.9 0.9 0.8 0.8 0.8
4 1.0 1.0 3.1 0.9 0.9 0.9 0.8 0.8
5 1.0 1.0 1.0 3.1 1.0 0.9 0.9 0.8
6 2.0 0.8 0.8 0.8 2.5 0.8 0.7 0.7
7 3.0 2.0 0.8 0.8 0.8 2.4 0.7 0.7
8 2.0 2.9 1.9 0.8 0.8 0.7 2.3 0.7
9 3.0 2.2 3.2 2.1 0.8 0.8 0.8 2.6
10 3.0 2.9 2.2 3.1 2.0 0.8 0.8 0.8
11 2.0 3.0 2.9 2.2 3.1 2.0 0.8 0.8
12 3.0 2.0 3.0 3.0 2.2 3.2 2.1 0.8
PK-5 8.0 8.0 7.8 7.5 5.3 5.1 5.1 4.9
6-8 7.0 5.7 3.5 2.4 4.1 3.9 3.7 2.1
9-12 11.0 10.1 11.3 10.4 8.1 6.8 4.5 5.0
PK-12 26.0 23.8 22.6 20.3 17.5 15.8 13.3 12.0
Study Area 273 Projection Date 10/2/2019
CURRENT PROJECTED RESIDENT STUDENTS
2019 2020 2021 2022 2023 2024 2025 2026
PK 1.0 1.0 0.9 0.9 0.9 0.9 0.9 0.9
K 4.0 3.8 3.6 3.8 3.4 3.6 3.6 3.5
1 2.0 3.8 3.6 3.4 3.6 3.2 3.4 3.4
2 3.0 1.8 3.5 3.3 3.1 3.3 2.9 3.1
3 4.0 3.2 2.0 3.7 3.5 3.3 3.5 3.1
4 4.0 3.9 3.1 1.9 3.6 3.4 3.2 3.4
5 3.0 4.0 3.9 3.1 1.9 3.6 3.5 3.2
6 2.0 2.4 3.2 3.1 2.5 1.5 2.9 2.8
7 1.0 2.0 2.4 3.2 3.1 2.4 1.5 2.8
8 2.0 1.0 1.9 2.3 3.0 2.9 2.3 1.4
9 1.0 2.2 1.1 2.1 2.5 3.4 3.3 2.6
10 2.0 1.0 2.2 1.0 2.0 2.5 3.3 3.2
11 4.0 2.0 1.0 2.2 1.0 2.0 2.4 3.3
12 1.0 4.1 2.0 1.0 2.2 1.1 2.1 2.5
PK-5 21.0 21.5 20.6 20.1 20.0 21.3 21.0 20.6
6-8 5.0 5.4 7.5 8.6 8.6 6.8 6.7 7.0
9-12 8.0 9.3 6.3 6.3 7.7 9.0 11.1 11.6
PK-12 34.0 36.2 34.4 35.0 36.3 37.1 38.8 39.2

SY2019/20 Demographic Report
163
Study Area 274 Projection Date 10/2/2019
CURRENT PROJECTED RESIDENT STUDENTS
2019 2020 2021 2022 2023 2024 2025 2026
PK 0.0 0.0 0.0 0.0 0.0 0.0 0.0 0.0
K 2.0 1.9 1.8 1.9 1.7 1.8 1.8 1.7
1 0.0 1.9 1.8 1.7 1.8 1.6 1.7 1.7
2 2.0 0.0 1.7 1.7 1.6 1.6 1.5 1.6
3 3.0 2.1 0.0 1.9 1.8 1.7 1.7 1.6
4 3.0 2.9 2.1 0.0 1.8 1.7 1.6 1.7
5 4.0 3.0 2.9 2.1 0.0 1.8 1.7 1.6
6 1.0 3.2 2.4 2.4 1.7 0.0 1.5 1.4
7 3.0 1.0 3.1 2.4 2.3 1.6 0.0 1.4
8 5.0 2.9 0.9 3.0 2.3 2.2 1.6 0.0
9 2.0 5.6 3.2 1.0 3.3 2.5 2.5 1.7
10 2.0 2.0 5.4 3.1 1.0 3.3 2.5 2.4
11 2.0 2.0 1.9 5.4 3.1 1.0 3.2 2.5
12 1.0 2.0 2.0 2.0 5.5 3.2 1.0 3.3
PK-5 14.0 11.8 10.3 9.3 8.7 10.2 10.0 9.9
6-8 9.0 7.1 6.4 7.8 6.3 3.8 3.1 2.8
9-12 7.0 11.6 12.5 11.5 12.9 10.0 9.2 9.9
PK-12 30.0 30.5 29.2 28.6 27.9 24.0 22.3 22.6
Study Area 275 Projection Date 10/2/2019
CURRENT PROJECTED RESIDENT STUDENTS
2019 2020 2021 2022 2023 2024 2025 2026
PK 1.0 1.0 0.9 0.9 0.9 0.9 0.9 0.9
K 3.0 2.9 2.7 2.7 2.7 2.7 2.7 2.7
1 1.0 2.8 2.8 2.6 2.5 2.5 2.6 2.5
2 3.0 0.9 2.6 2.5 2.4 2.3 2.3 2.3
3 2.0 3.2 1.0 2.8 2.7 2.5 2.5 2.5
4 7.0 1.9 3.1 0.9 2.7 2.6 2.4 2.4
5 5.0 7.1 2.0 3.1 1.0 2.7 2.6 2.5
6 4.0 4.0 5.7 1.6 2.5 0.8 2.2 2.1
7 0.0 3.9 3.9 5.5 1.5 2.4 0.7 2.1
8 1.0 0.0 3.8 3.8 5.3 1.5 2.3 0.7
9 3.0 1.1 0.0 4.2 4.2 5.9 1.6 2.6
10 1.0 2.9 1.1 0.0 4.1 4.1 5.8 1.6
11 5.0 1.0 2.9 1.1 0.0 4.1 4.1 5.7
12 2.0 5.1 1.0 3.0 1.1 0.0 4.1 4.1
PK-5 22.0 19.8 15.1 15.5 14.9 16.2 16.0 15.8
6-8 5.0 7.9 13.4 10.9 9.3 4.7 5.2 4.9
9-12 11.0 10.1 5.0 8.3 9.4 14.1 15.6 14.0
PK-12 38.0 37.8 33.5 34.7 33.6 35.0 36.8 34.7
Study Area 276 Projection Date 10/2/2019
CURRENT PROJECTED RESIDENT STUDENTS
2019 2020 2021 2022 2023 2024 2025 2026
PK 2.0 1.9 1.9 1.8 1.9 1.8 1.8 1.8
K 6.0 5.7 5.3 5.6 5.1 5.3 5.3 5.2
1 14.0 5.7 5.4 5.1 5.4 4.8 5.1 5.1
2 9.0 12.9 5.2 5.0 4.7 4.9 4.4 4.7
3 10.0 9.5 13.7 5.6 5.3 5.0 5.2 4.7
4 7.0 9.7 9.3 13.2 5.4 5.1 4.8 5.1
5 12.0 7.1 9.8 9.3 13.4 5.4 5.2 4.9
6 9.0 9.6 5.7 7.8 7.5 10.7 4.4 4.2
7 7.0 8.8 9.4 5.5 7.7 7.3 10.5 4.3
8 5.0 6.7 8.5 9.0 5.3 7.4 7.0 10.1
9 5.0 5.6 7.5 9.4 10.0 5.9 8.2 7.8
10 10.0 4.9 5.4 7.3 9.2 9.8 5.8 8.0
11 10.0 9.9 4.9 5.4 7.2 9.1 9.7 5.7
12 9.0 10.2 10.1 4.9 5.5 7.4 9.3 9.9
PK-5 60.0 52.5 50.6 45.6 41.2 32.3 31.8 31.5
6-8 21.0 25.1 23.6 22.3 20.5 25.4 21.9 18.6
9-12 34.0 30.6 27.9 27.0 31.9 32.2 33.0 31.4
PK-12 115.0 108.2 102.1 94.9 93.6 89.9 86.7 81.5

SY2019/20 Demographic Report
164
Study Area 277 Projection Date 10/2/2019
CURRENT PROJECTED RESIDENT STUDENTS
2019 2020 2021 2022 2023 2024 2025 2026
PK 0.0 0.0 0.0 0.0 0.0 0.0 0.0 0.0
K 5.0 4.8 4.5 4.4 4.5 4.5 4.5 4.5
1 7.0 4.8 4.6 4.3 4.2 4.2 4.3 4.2
2 8.0 6.4 4.4 4.2 4.0 3.9 3.9 3.9
3 7.0 8.5 6.8 4.6 4.5 4.2 4.1 4.1
4 9.0 6.8 8.2 6.6 4.5 4.3 4.1 4.0
5 3.0 9.1 6.9 8.3 6.7 4.5 4.4 4.1
6 2.0 2.4 7.3 5.5 6.6 5.4 3.6 3.5
7 4.0 2.0 2.4 7.1 5.4 6.5 5.2 3.6
8 3.0 3.8 1.9 2.3 6.8 5.2 6.3 5.0
9 5.0 3.3 4.3 2.1 2.5 7.6 5.7 6.9
10 6.0 4.9 3.3 4.2 2.0 2.5 7.4 5.6
11 1.0 5.9 4.9 3.2 4.1 2.0 2.4 7.4
12 5.0 1.0 6.1 4.9 3.3 4.2 2.1 2.5
PK-5 39.0 40.4 35.4 32.4 28.4 25.6 25.3 24.8
6-8 9.0 8.2 11.6 14.9 18.8 17.1 15.1 12.1
9-12 17.0 15.1 18.6 14.4 11.9 16.3 17.6 22.4
PK-12 65.0 63.7 65.6 61.7 59.1 59.0 58.0 59.3
Study Area 278 Projection Date 10/2/2019
CURRENT PROJECTED RESIDENT STUDENTS
2019 2020 2021 2022 2023 2024 2025 2026
PK 1.0 1.0 0.9 0.9 0.9 0.9 0.9 0.9
K 3.0 2.9 2.7 2.8 2.5 2.7 2.7 2.6
1 7.0 2.8 2.7 2.5 2.7 2.4 2.5 2.5
2 4.0 6.4 2.6 2.5 2.3 2.5 2.2 2.3
3 4.0 4.2 6.8 2.8 2.7 2.5 2.6 2.3
4 2.0 3.9 4.1 6.6 2.7 2.6 2.4 2.5
5 4.0 2.0 3.9 4.2 6.7 2.7 2.6 2.4
6 4.0 3.2 1.6 3.1 3.3 5.4 2.2 2.1
7 2.0 3.9 3.1 1.6 3.1 3.3 5.2 2.1
8 3.0 1.9 3.8 3.0 1.5 2.9 3.1 5.0
9 5.0 3.3 2.1 4.2 3.3 1.7 3.3 3.5
10 8.0 4.9 3.3 2.1 4.1 3.3 1.7 3.2
11 4.0 7.9 4.9 3.2 2.1 4.1 3.2 1.6
12 5.0 4.1 8.1 4.9 3.3 2.1 4.1 3.3
PK-5 25.0 23.2 23.7 22.3 20.5 16.3 15.9 15.5
6-8 9.0 9.0 8.5 7.7 7.9 11.6 10.5 9.2
9-12 22.0 20.2 18.4 14.4 12.8 11.2 12.3 11.6
PK-12 56.0 52.4 50.6 44.4 41.2 39.1 38.7 36.3
Study Area 279 Projection Date 10/2/2019
CURRENT PROJECTED RESIDENT STUDENTS
2019 2020 2021 2022 2023 2024 2025 2026
PK 1.0 1.0 0.9 0.9 0.9 0.9 0.9 0.9
K 1.0 1.0 0.9 0.9 0.8 0.9 0.9 0.9
1 2.0 0.9 0.9 0.8 0.9 0.8 0.8 0.8
2 4.0 1.8 0.9 0.8 0.8 0.8 0.7 0.8
3 0.0 4.2 2.0 0.9 0.9 0.8 0.9 0.8
4 3.0 0.0 4.1 1.9 0.9 0.9 0.8 0.8
5 3.0 3.0 0.0 4.2 1.9 0.9 0.9 0.8
6 1.0 2.4 2.4 0.0 3.3 1.5 0.7 0.7
7 2.0 1.0 2.4 2.4 0.0 3.3 1.5 0.7
8 1.0 1.9 0.9 2.3 2.3 0.0 3.1 1.4
9 3.0 1.1 2.1 1.0 2.5 2.5 0.0 3.5
10 3.0 2.9 1.1 2.1 1.0 2.5 2.5 0.0
11 2.0 3.0 2.9 1.1 2.1 1.0 2.4 2.5
12 0.0 2.0 3.0 3.0 1.1 2.1 1.0 2.5
PK-5 14.0 11.9 9.7 10.4 7.1 6.0 5.9 5.8
6-8 4.0 5.3 5.7 4.7 5.6 4.8 5.3 2.8
9-12 8.0 9.0 9.1 7.2 6.7 8.1 5.9 8.5
PK-12 26.0 26.2 24.5 22.3 19.4 18.9 17.1 17.1

SY2019/20 Demographic Report
165
Study Area 280 Projection Date 10/2/2019
CURRENT PROJECTED RESIDENT STUDENTS
2019 2020 2021 2022 2023 2024 2025 2026
PK 1.0 1.0 0.9 0.9 0.9 0.9 0.9 0.9
K 5.0 4.8 4.5 4.4 4.5 4.5 4.5 4.5
1 4.0 4.8 4.6 4.3 4.2 4.2 4.3 4.2
2 2.0 3.7 4.4 4.2 4.0 3.9 3.9 3.9
3 4.0 2.1 3.9 4.6 4.5 4.2 4.1 4.1
4 3.0 3.9 2.1 3.8 4.5 4.3 4.1 4.0
5 1.0 3.0 3.9 2.1 3.8 4.5 4.4 4.1
6 3.0 0.8 2.4 3.1 1.7 3.1 3.6 3.5
7 1.0 2.9 0.8 2.4 3.1 1.6 3.0 3.6
8 2.0 1.0 2.8 0.8 2.3 2.9 1.6 2.9
9 4.0 2.2 1.1 3.1 0.8 2.5 3.3 1.7
10 0.0 3.9 2.2 1.0 3.1 0.8 2.5 3.2
11 4.0 0.0 3.9 2.2 1.0 3.0 0.8 2.5
12 2.0 4.1 0.0 4.0 2.2 1.1 3.1 0.8
PK-5 20.0 23.3 24.3 24.3 26.4 26.5 26.2 25.7
6-8 6.0 4.7 6.0 6.3 7.1 7.6 8.2 10.0
9-12 10.0 10.2 7.2 10.3 7.1 7.4 9.7 8.2
PK-12 36.0 38.2 37.5 40.9 40.6 41.5 44.1 43.9
Study Area 281 Projection Date 10/2/2019
CURRENT PROJECTED RESIDENT STUDENTS
2019 2020 2021 2022 2023 2024 2025 2026
PK 2.0 1.9 1.9 1.8 1.9 1.8 1.8 1.8
K 8.0 8.3 8.3 8.8 8.4 8.4 8.4 8.4
1 6.0 8.1 8.6 8.8 8.3 7.9 8.0 7.9
2 4.0 6.0 8.2 8.8 8.1 7.7 7.3 7.3
3 6.0 4.8 7.2 9.7 9.3 8.6 8.1 7.7
4 4.0 6.4 5.4 7.9 9.4 9.0 8.3 7.9
5 4.0 4.6 7.2 6.4 8.0 9.5 9.1 8.4
6 3.0 3.6 4.3 6.5 5.1 6.4 7.6 7.3
7 2.0 3.5 4.3 5.1 6.4 5.0 6.3 7.4
8 2.0 2.5 4.1 5.1 4.9 6.1 4.8 6.0
9 6.0 2.8 3.6 5.6 5.6 5.5 6.8 5.4
10 7.0 6.4 3.5 4.4 5.5 5.5 5.4 6.7
11 4.0 7.5 7.1 4.5 4.4 5.4 5.5 5.3
12 3.0 4.7 8.4 8.2 4.5 4.5 5.5 5.6
PK-5 34.0 40.1 46.8 52.2 53.4 52.9 51.0 49.4
6-8 7.0 9.6 12.7 16.7 16.4 17.5 18.7 20.7
9-12 20.0 21.4 22.6 22.7 20.0 20.9 23.2 23.0
PK-12 61.0 71.1 82.1 91.6 89.8 91.3 92.9 93.1
Study Area 282 Projection Date 10/2/2019
CURRENT PROJECTED RESIDENT STUDENTS
2019 2020 2021 2022 2023 2024 2025 2026
PK 0.0 0.0 0.0 0.0 0.0 0.0 0.0 0.0
K 4.0 3.9 3.6 3.6 3.6 3.6 3.6 3.6
1 3.0 3.8 3.7 3.4 3.4 3.4 3.4 3.4
2 3.0 2.8 3.5 3.4 3.2 3.1 3.1 3.1
3 3.0 3.2 2.9 3.7 3.6 3.4 3.3 3.3
4 8.0 2.9 3.1 2.8 3.6 3.5 3.3 3.2
5 6.0 8.1 2.9 3.1 2.9 3.6 3.5 3.3
6 2.0 4.8 6.5 2.4 2.5 2.3 2.9 2.8
7 4.0 2.0 4.7 6.3 2.3 2.4 2.2 2.8
8 0.0 3.8 1.9 4.5 6.1 2.2 2.3 2.2
9 0.0 0.0 4.3 2.1 5.0 6.8 2.5 2.6
10 4.0 0.0 0.0 4.2 2.0 4.9 6.6 2.4
11 2.0 4.0 0.0 0.0 4.1 2.0 4.9 6.5
12 3.0 2.0 4.0 0.0 0.0 4.2 2.1 5.0
PK-5 27.0 24.7 19.7 20.0 20.3 20.6 20.2 19.9
6-8 6.0 10.6 13.1 13.2 10.9 6.9 7.4 7.8
9-12 9.0 6.0 8.3 6.3 11.1 17.9 16.1 16.5
PK-12 42.0 41.3 41.1 39.5 42.3 45.4 43.7 44.2

SY2019/20 Demographic Report
166
Study Area 283 Projection Date 10/2/2019
CURRENT PROJECTED RESIDENT STUDENTS
2019 2020 2021 2022 2023 2024 2025 2026
PK 0.0 0.0 0.0 0.0 0.0 0.0 0.0 0.0
K 6.0 5.8 5.4 5.3 5.4 5.4 5.4 5.4
1 4.0 5.7 5.5 5.2 5.1 5.1 5.1 5.1
2 6.0 3.7 5.2 5.1 4.7 4.7 4.7 4.7
3 4.0 6.4 3.9 5.6 5.4 5.0 4.9 5.0
4 8.0 3.9 6.2 3.8 5.4 5.2 4.9 4.8
5 3.0 8.1 3.9 6.2 3.8 5.4 5.3 4.9
6 5.0 2.4 6.5 3.1 5.0 3.1 4.4 4.2
7 8.0 4.9 2.4 6.3 3.1 4.9 3.0 4.3
8 4.0 7.7 4.7 2.3 6.1 2.9 4.7 2.9
9 7.0 4.4 8.5 5.2 2.5 6.8 3.3 5.2
10 1.0 6.9 4.4 8.4 5.1 2.5 6.6 3.2
11 10.0 1.0 6.8 4.3 8.3 5.1 2.4 6.5
12 5.0 10.2 1.0 6.9 4.4 8.4 5.2 2.5
PK-5 31.0 33.6 30.1 31.2 29.8 30.8 30.3 29.9
6-8 17.0 15.0 13.6 11.7 14.2 10.9 12.1 11.4
9-12 23.0 22.5 20.7 24.8 20.3 22.8 17.5 17.4
PK-12 71.0 71.1 64.4 67.7 64.3 64.5 59.9 58.7
Study Area 284 Projection Date 10/2/2019
CURRENT PROJECTED RESIDENT STUDENTS
2019 2020 2021 2022 2023 2024 2025 2026
PK 2.0 1.9 1.9 1.8 1.9 1.8 1.8 1.8
K 6.0 5.8 5.4 5.3 5.4 5.4 5.4 5.4
1 5.0 5.7 5.5 5.2 5.1 5.1 5.1 5.1
2 8.0 4.6 5.2 5.1 4.7 4.7 4.7 4.7
3 7.0 8.5 4.9 5.6 5.4 5.0 4.9 5.0
4 6.0 6.8 8.2 4.7 5.4 5.2 4.9 4.8
5 7.0 6.1 6.9 8.3 4.8 5.4 5.3 4.9
6 5.0 5.6 4.8 5.5 6.6 3.8 4.4 4.2
7 7.0 4.9 5.5 4.8 5.4 6.5 3.7 4.3
8 8.0 6.7 4.7 5.3 4.6 5.2 6.3 3.6
9 6.0 8.9 7.5 5.2 5.8 5.1 5.7 6.9
10 2.0 5.9 8.7 7.3 5.1 5.7 5.0 5.6
11 3.0 2.0 5.8 8.6 7.2 5.1 5.7 4.9
12 6.0 3.1 2.0 5.9 8.8 7.4 5.2 5.8
PK-5 41.0 39.4 38.0 36.0 32.7 32.6 32.1 31.7
6-8 20.0 17.2 15.0 15.6 16.6 15.5 14.4 12.1
9-12 17.0 19.9 24.0 27.0 26.9 23.3 21.6 23.2
PK-12 78.0 76.5 77.0 78.6 76.2 71.4 68.1 67.0
Study Area 285 Projection Date 10/2/2019
CURRENT PROJECTED RESIDENT STUDENTS
2019 2020 2021 2022 2023 2024 2025 2026
PK 1.0 1.0 0.9 0.9 0.9 0.9 0.9 0.9
K 0.0 0.0 0.0 0.0 0.0 0.0 0.0 0.0
1 3.0 0.0 0.0 0.0 0.0 0.0 0.0 0.0
2 6.0 2.8 0.0 0.0 0.0 0.0 0.0 0.0
3 2.0 6.4 2.9 0.0 0.0 0.0 0.0 0.0
4 6.0 1.9 6.2 2.8 0.0 0.0 0.0 0.0
5 5.0 6.1 2.0 6.2 2.9 0.0 0.0 0.0
6 2.0 4.0 4.8 1.6 5.0 2.3 0.0 0.0
7 3.0 2.0 3.9 4.8 1.5 4.9 2.2 0.0
8 3.0 2.9 1.9 3.8 4.6 1.5 4.7 2.2
9 4.0 3.3 3.2 2.1 4.2 5.1 1.6 5.2
10 4.0 3.9 3.3 3.1 2.0 4.1 5.0 1.6
11 0.0 4.0 3.9 3.2 3.1 2.0 4.1 4.9
12 5.0 0.0 4.0 4.0 3.3 3.2 2.1 4.1
PK-5 23.0 18.2 12.0 9.9 3.8 0.9 0.9 0.9
6-8 8.0 8.9 10.6 10.2 11.1 8.7 6.9 2.2
9-12 13.0 11.2 14.4 12.4 12.6 14.4 12.8 15.8
PK-12 44.0 38.3 37.0 32.5 27.5 24.0 20.6 18.9
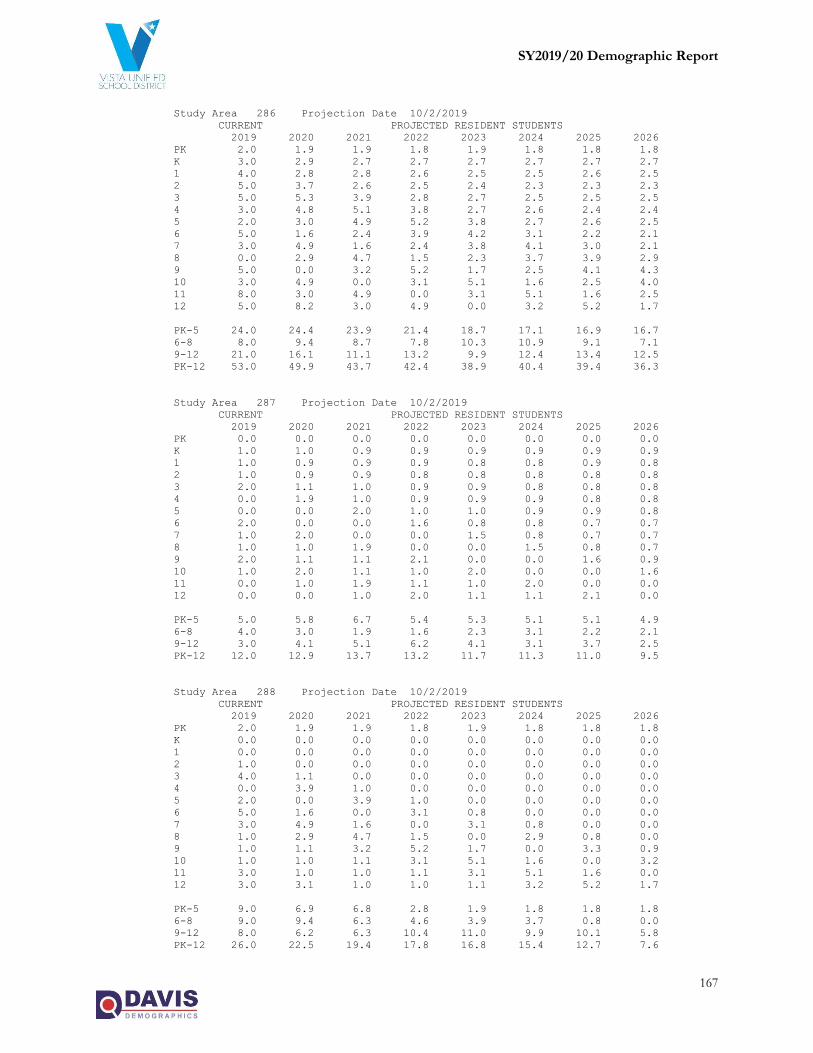
SY2019/20 Demographic Report
167
Study Area 286 Projection Date 10/2/2019
CURRENT PROJECTED RESIDENT STUDENTS
2019 2020 2021 2022 2023 2024 2025 2026
PK 2.0 1.9 1.9 1.8 1.9 1.8 1.8 1.8
K 3.0 2.9 2.7 2.7 2.7 2.7 2.7 2.7
1 4.0 2.8 2.8 2.6 2.5 2.5 2.6 2.5
2 5.0 3.7 2.6 2.5 2.4 2.3 2.3 2.3
3 5.0 5.3 3.9 2.8 2.7 2.5 2.5 2.5
4 3.0 4.8 5.1 3.8 2.7 2.6 2.4 2.4
5 2.0 3.0 4.9 5.2 3.8 2.7 2.6 2.5
6 5.0 1.6 2.4 3.9 4.2 3.1 2.2 2.1
7 3.0 4.9 1.6 2.4 3.8 4.1 3.0 2.1
8 0.0 2.9 4.7 1.5 2.3 3.7 3.9 2.9
9 5.0 0.0 3.2 5.2 1.7 2.5 4.1 4.3
10 3.0 4.9 0.0 3.1 5.1 1.6 2.5 4.0
11 8.0 3.0 4.9 0.0 3.1 5.1 1.6 2.5
12 5.0 8.2 3.0 4.9 0.0 3.2 5.2 1.7
PK-5 24.0 24.4 23.9 21.4 18.7 17.1 16.9 16.7
6-8 8.0 9.4 8.7 7.8 10.3 10.9 9.1 7.1
9-12 21.0 16.1 11.1 13.2 9.9 12.4 13.4 12.5
PK-12 53.0 49.9 43.7 42.4 38.9 40.4 39.4 36.3
Study Area 287 Projection Date 10/2/2019
CURRENT PROJECTED RESIDENT STUDENTS
2019 2020 2021 2022 2023 2024 2025 2026
PK 0.0 0.0 0.0 0.0 0.0 0.0 0.0 0.0
K 1.0 1.0 0.9 0.9 0.9 0.9 0.9 0.9
1 1.0 0.9 0.9 0.9 0.8 0.8 0.9 0.8
2 1.0 0.9 0.9 0.8 0.8 0.8 0.8 0.8
3 2.0 1.1 1.0 0.9 0.9 0.8 0.8 0.8
4 0.0 1.9 1.0 0.9 0.9 0.9 0.8 0.8
5 0.0 0.0 2.0 1.0 1.0 0.9 0.9 0.8
6 2.0 0.0 0.0 1.6 0.8 0.8 0.7 0.7
7 1.0 2.0 0.0 0.0 1.5 0.8 0.7 0.7
8 1.0 1.0 1.9 0.0 0.0 1.5 0.8 0.7
9 2.0 1.1 1.1 2.1 0.0 0.0 1.6 0.9
10 1.0 2.0 1.1 1.0 2.0 0.0 0.0 1.6
11 0.0 1.0 1.9 1.1 1.0 2.0 0.0 0.0
12 0.0 0.0 1.0 2.0 1.1 1.1 2.1 0.0
PK-5 5.0 5.8 6.7 5.4 5.3 5.1 5.1 4.9
6-8 4.0 3.0 1.9 1.6 2.3 3.1 2.2 2.1
9-12 3.0 4.1 5.1 6.2 4.1 3.1 3.7 2.5
PK-12 12.0 12.9 13.7 13.2 11.7 11.3 11.0 9.5
Study Area 288 Projection Date 10/2/2019
CURRENT PROJECTED RESIDENT STUDENTS
2019 2020 2021 2022 2023 2024 2025 2026
PK 2.0 1.9 1.9 1.8 1.9 1.8 1.8 1.8
K 0.0 0.0 0.0 0.0 0.0 0.0 0.0 0.0
1 0.0 0.0 0.0 0.0 0.0 0.0 0.0 0.0
2 1.0 0.0 0.0 0.0 0.0 0.0 0.0 0.0
3 4.0 1.1 0.0 0.0 0.0 0.0 0.0 0.0
4 0.0 3.9 1.0 0.0 0.0 0.0 0.0 0.0
5 2.0 0.0 3.9 1.0 0.0 0.0 0.0 0.0
6 5.0 1.6 0.0 3.1 0.8 0.0 0.0 0.0
7 3.0 4.9 1.6 0.0 3.1 0.8 0.0 0.0
8 1.0 2.9 4.7 1.5 0.0 2.9 0.8 0.0
9 1.0 1.1 3.2 5.2 1.7 0.0 3.3 0.9
10 1.0 1.0 1.1 3.1 5.1 1.6 0.0 3.2
11 3.0 1.0 1.0 1.1 3.1 5.1 1.6 0.0
12 3.0 3.1 1.0 1.0 1.1 3.2 5.2 1.7
PK-5 9.0 6.9 6.8 2.8 1.9 1.8 1.8 1.8
6-8 9.0 9.4 6.3 4.6 3.9 3.7 0.8 0.0
9-12 8.0 6.2 6.3 10.4 11.0 9.9 10.1 5.8
PK-12 26.0 22.5 19.4 17.8 16.8 15.4 12.7 7.6
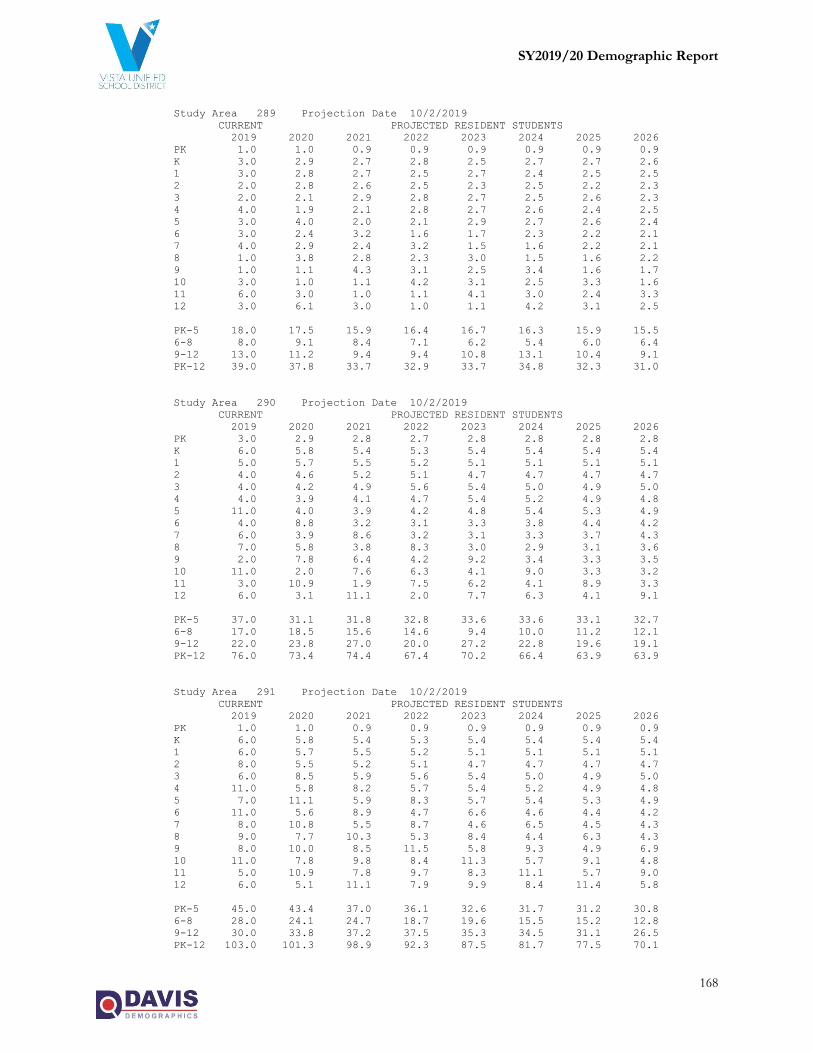
SY2019/20 Demographic Report
168
Study Area 289 Projection Date 10/2/2019
CURRENT PROJECTED RESIDENT STUDENTS
2019 2020 2021 2022 2023 2024 2025 2026
PK 1.0 1.0 0.9 0.9 0.9 0.9 0.9 0.9
K 3.0 2.9 2.7 2.8 2.5 2.7 2.7 2.6
1 3.0 2.8 2.7 2.5 2.7 2.4 2.5 2.5
2 2.0 2.8 2.6 2.5 2.3 2.5 2.2 2.3
3 2.0 2.1 2.9 2.8 2.7 2.5 2.6 2.3
4 4.0 1.9 2.1 2.8 2.7 2.6 2.4 2.5
5 3.0 4.0 2.0 2.1 2.9 2.7 2.6 2.4
6 3.0 2.4 3.2 1.6 1.7 2.3 2.2 2.1
7 4.0 2.9 2.4 3.2 1.5 1.6 2.2 2.1
8 1.0 3.8 2.8 2.3 3.0 1.5 1.6 2.2
9 1.0 1.1 4.3 3.1 2.5 3.4 1.6 1.7
10 3.0 1.0 1.1 4.2 3.1 2.5 3.3 1.6
11 6.0 3.0 1.0 1.1 4.1 3.0 2.4 3.3
12 3.0 6.1 3.0 1.0 1.1 4.2 3.1 2.5
PK-5 18.0 17.5 15.9 16.4 16.7 16.3 15.9 15.5
6-8 8.0 9.1 8.4 7.1 6.2 5.4 6.0 6.4
9-12 13.0 11.2 9.4 9.4 10.8 13.1 10.4 9.1
PK-12 39.0 37.8 33.7 32.9 33.7 34.8 32.3 31.0
Study Area 290 Projection Date 10/2/2019
CURRENT PROJECTED RESIDENT STUDENTS
2019 2020 2021 2022 2023 2024 2025 2026
PK 3.0 2.9 2.8 2.7 2.8 2.8 2.8 2.8
K 6.0 5.8 5.4 5.3 5.4 5.4 5.4 5.4
1 5.0 5.7 5.5 5.2 5.1 5.1 5.1 5.1
2 4.0 4.6 5.2 5.1 4.7 4.7 4.7 4.7
3 4.0 4.2 4.9 5.6 5.4 5.0 4.9 5.0
4 4.0 3.9 4.1 4.7 5.4 5.2 4.9 4.8
5 11.0 4.0 3.9 4.2 4.8 5.4 5.3 4.9
6 4.0 8.8 3.2 3.1 3.3 3.8 4.4 4.2
7 6.0 3.9 8.6 3.2 3.1 3.3 3.7 4.3
8 7.0 5.8 3.8 8.3 3.0 2.9 3.1 3.6
9 2.0 7.8 6.4 4.2 9.2 3.4 3.3 3.5
10 11.0 2.0 7.6 6.3 4.1 9.0 3.3 3.2
11 3.0 10.9 1.9 7.5 6.2 4.1 8.9 3.3
12 6.0 3.1 11.1 2.0 7.7 6.3 4.1 9.1
PK-5 37.0 31.1 31.8 32.8 33.6 33.6 33.1 32.7
6-8 17.0 18.5 15.6 14.6 9.4 10.0 11.2 12.1
9-12 22.0 23.8 27.0 20.0 27.2 22.8 19.6 19.1
PK-12 76.0 73.4 74.4 67.4 70.2 66.4 63.9 63.9
Study Area 291 Projection Date 10/2/2019
CURRENT PROJECTED RESIDENT STUDENTS
2019 2020 2021 2022 2023 2024 2025 2026
PK 1.0 1.0 0.9 0.9 0.9 0.9 0.9 0.9
K 6.0 5.8 5.4 5.3 5.4 5.4 5.4 5.4
1 6.0 5.7 5.5 5.2 5.1 5.1 5.1 5.1
2 8.0 5.5 5.2 5.1 4.7 4.7 4.7 4.7
3 6.0 8.5 5.9 5.6 5.4 5.0 4.9 5.0
4 11.0 5.8 8.2 5.7 5.4 5.2 4.9 4.8
5 7.0 11.1 5.9 8.3 5.7 5.4 5.3 4.9
6 11.0 5.6 8.9 4.7 6.6 4.6 4.4 4.2
7 8.0 10.8 5.5 8.7 4.6 6.5 4.5 4.3
8 9.0 7.7 10.3 5.3 8.4 4.4 6.3 4.3
9 8.0 10.0 8.5 11.5 5.8 9.3 4.9 6.9
10 11.0 7.8 9.8 8.4 11.3 5.7 9.1 4.8
11 5.0 10.9 7.8 9.7 8.3 11.1 5.7 9.0
12 6.0 5.1 11.1 7.9 9.9 8.4 11.4 5.8
PK-5 45.0 43.4 37.0 36.1 32.6 31.7 31.2 30.8
6-8 28.0 24.1 24.7 18.7 19.6 15.5 15.2 12.8
9-12 30.0 33.8 37.2 37.5 35.3 34.5 31.1 26.5
PK-12 103.0 101.3 98.9 92.3 87.5 81.7 77.5 70.1
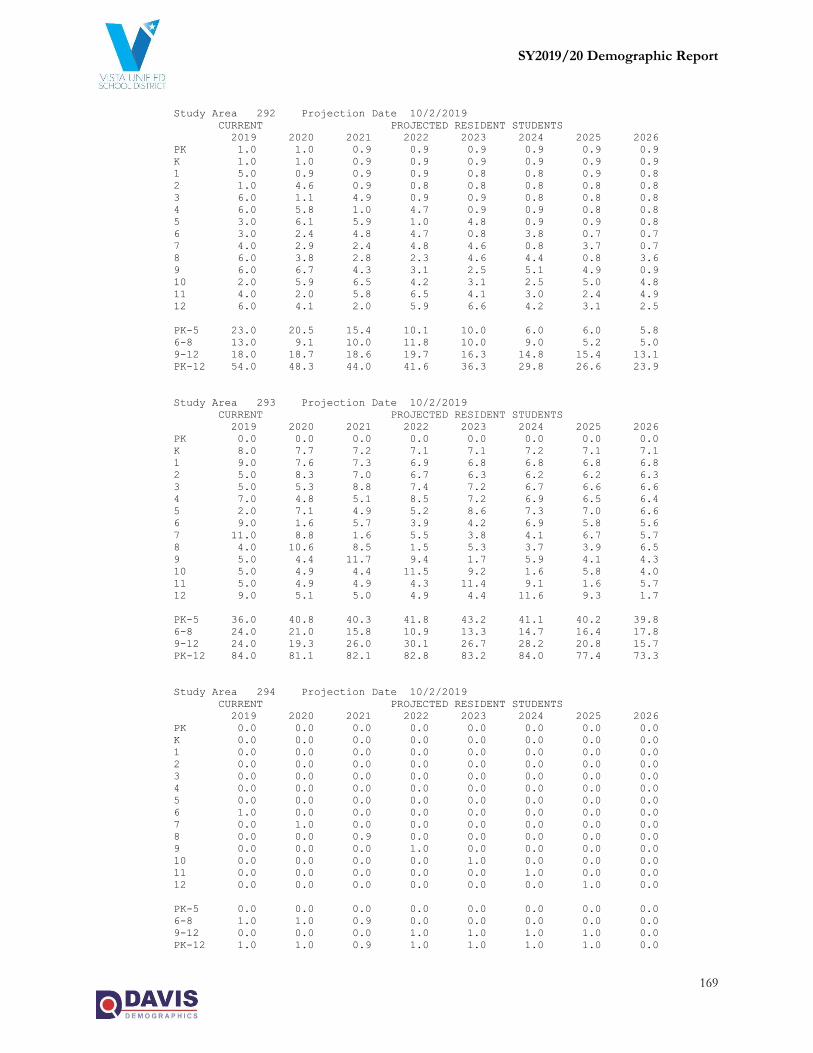
SY2019/20 Demographic Report
169
Study Area 292 Projection Date 10/2/2019
CURRENT PROJECTED RESIDENT STUDENTS
2019 2020 2021 2022 2023 2024 2025 2026
PK 1.0 1.0 0.9 0.9 0.9 0.9 0.9 0.9
K 1.0 1.0 0.9 0.9 0.9 0.9 0.9 0.9
1 5.0 0.9 0.9 0.9 0.8 0.8 0.9 0.8
2 1.0 4.6 0.9 0.8 0.8 0.8 0.8 0.8
3 6.0 1.1 4.9 0.9 0.9 0.8 0.8 0.8
4 6.0 5.8 1.0 4.7 0.9 0.9 0.8 0.8
5 3.0 6.1 5.9 1.0 4.8 0.9 0.9 0.8
6 3.0 2.4 4.8 4.7 0.8 3.8 0.7 0.7
7 4.0 2.9 2.4 4.8 4.6 0.8 3.7 0.7
8 6.0 3.8 2.8 2.3 4.6 4.4 0.8 3.6
9 6.0 6.7 4.3 3.1 2.5 5.1 4.9 0.9
10 2.0 5.9 6.5 4.2 3.1 2.5 5.0 4.8
11 4.0 2.0 5.8 6.5 4.1 3.0 2.4 4.9
12 6.0 4.1 2.0 5.9 6.6 4.2 3.1 2.5
PK-5 23.0 20.5 15.4 10.1 10.0 6.0 6.0 5.8
6-8 13.0 9.1 10.0 11.8 10.0 9.0 5.2 5.0
9-12 18.0 18.7 18.6 19.7 16.3 14.8 15.4 13.1
PK-12 54.0 48.3 44.0 41.6 36.3 29.8 26.6 23.9
Study Area 293 Projection Date 10/2/2019
CURRENT PROJECTED RESIDENT STUDENTS
2019 2020 2021 2022 2023 2024 2025 2026
PK 0.0 0.0 0.0 0.0 0.0 0.0 0.0 0.0
K 8.0 7.7 7.2 7.1 7.1 7.2 7.1 7.1
1 9.0 7.6 7.3 6.9 6.8 6.8 6.8 6.8
2 5.0 8.3 7.0 6.7 6.3 6.2 6.2 6.3
3 5.0 5.3 8.8 7.4 7.2 6.7 6.6 6.6
4 7.0 4.8 5.1 8.5 7.2 6.9 6.5 6.4
5 2.0 7.1 4.9 5.2 8.6 7.3 7.0 6.6
6 9.0 1.6 5.7 3.9 4.2 6.9 5.8 5.6
7 11.0 8.8 1.6 5.5 3.8 4.1 6.7 5.7
8 4.0 10.6 8.5 1.5 5.3 3.7 3.9 6.5
9 5.0 4.4 11.7 9.4 1.7 5.9 4.1 4.3
10 5.0 4.9 4.4 11.5 9.2 1.6 5.8 4.0
11 5.0 4.9 4.9 4.3 11.4 9.1 1.6 5.7
12 9.0 5.1 5.0 4.9 4.4 11.6 9.3 1.7
PK-5 36.0 40.8 40.3 41.8 43.2 41.1 40.2 39.8
6-8 24.0 21.0 15.8 10.9 13.3 14.7 16.4 17.8
9-12 24.0 19.3 26.0 30.1 26.7 28.2 20.8 15.7
PK-12 84.0 81.1 82.1 82.8 83.2 84.0 77.4 73.3
Study Area 294 Projection Date 10/2/2019
CURRENT PROJECTED RESIDENT STUDENTS
2019 2020 2021 2022 2023 2024 2025 2026
PK 0.0 0.0 0.0 0.0 0.0 0.0 0.0 0.0
K 0.0 0.0 0.0 0.0 0.0 0.0 0.0 0.0
1 0.0 0.0 0.0 0.0 0.0 0.0 0.0 0.0
2 0.0 0.0 0.0 0.0 0.0 0.0 0.0 0.0
3 0.0 0.0 0.0 0.0 0.0 0.0 0.0 0.0
4 0.0 0.0 0.0 0.0 0.0 0.0 0.0 0.0
5 0.0 0.0 0.0 0.0 0.0 0.0 0.0 0.0
6 1.0 0.0 0.0 0.0 0.0 0.0 0.0 0.0
7 0.0 1.0 0.0 0.0 0.0 0.0 0.0 0.0
8 0.0 0.0 0.9 0.0 0.0 0.0 0.0 0.0
9 0.0 0.0 0.0 1.0 0.0 0.0 0.0 0.0
10 0.0 0.0 0.0 0.0 1.0 0.0 0.0 0.0
11 0.0 0.0 0.0 0.0 0.0 1.0 0.0 0.0
12 0.0 0.0 0.0 0.0 0.0 0.0 1.0 0.0
PK-5 0.0 0.0 0.0 0.0 0.0 0.0 0.0 0.0
6-8 1.0 1.0 0.9 0.0 0.0 0.0 0.0 0.0
9-12 0.0 0.0 0.0 1.0 1.0 1.0 1.0 0.0
PK-12 1.0 1.0 0.9 1.0 1.0 1.0 1.0 0.0
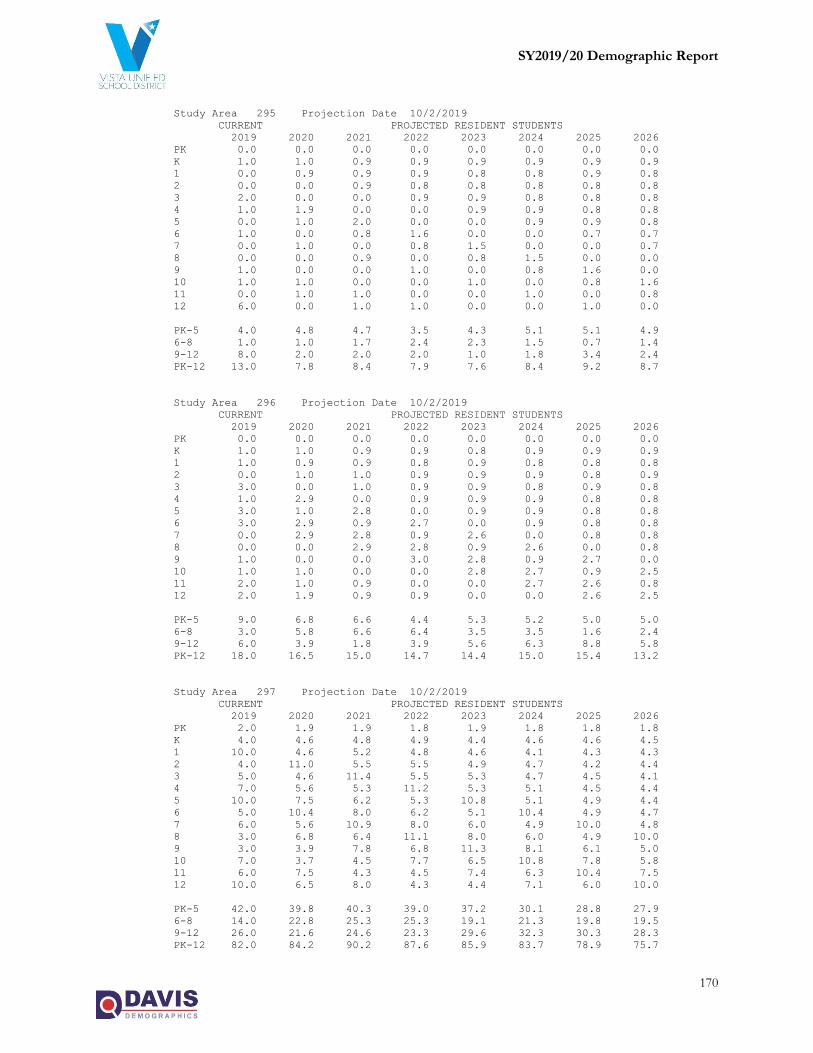
SY2019/20 Demographic Report
170
Study Area 295 Projection Date 10/2/2019
CURRENT PROJECTED RESIDENT STUDENTS
2019 2020 2021 2022 2023 2024 2025 2026
PK 0.0 0.0 0.0 0.0 0.0 0.0 0.0 0.0
K 1.0 1.0 0.9 0.9 0.9 0.9 0.9 0.9
1 0.0 0.9 0.9 0.9 0.8 0.8 0.9 0.8
2 0.0 0.0 0.9 0.8 0.8 0.8 0.8 0.8
3 2.0 0.0 0.0 0.9 0.9 0.8 0.8 0.8
4 1.0 1.9 0.0 0.0 0.9 0.9 0.8 0.8
5 0.0 1.0 2.0 0.0 0.0 0.9 0.9 0.8
6 1.0 0.0 0.8 1.6 0.0 0.0 0.7 0.7
7 0.0 1.0 0.0 0.8 1.5 0.0 0.0 0.7
8 0.0 0.0 0.9 0.0 0.8 1.5 0.0 0.0
9 1.0 0.0 0.0 1.0 0.0 0.8 1.6 0.0
10 1.0 1.0 0.0 0.0 1.0 0.0 0.8 1.6
11 0.0 1.0 1.0 0.0 0.0 1.0 0.0 0.8
12 6.0 0.0 1.0 1.0 0.0 0.0 1.0 0.0
PK-5 4.0 4.8 4.7 3.5 4.3 5.1 5.1 4.9
6-8 1.0 1.0 1.7 2.4 2.3 1.5 0.7 1.4
9-12 8.0 2.0 2.0 2.0 1.0 1.8 3.4 2.4
PK-12 13.0 7.8 8.4 7.9 7.6 8.4 9.2 8.7
Study Area 296 Projection Date 10/2/2019
CURRENT PROJECTED RESIDENT STUDENTS
2019 2020 2021 2022 2023 2024 2025 2026
PK 0.0 0.0 0.0 0.0 0.0 0.0 0.0 0.0
K 1.0 1.0 0.9 0.9 0.8 0.9 0.9 0.9
1 1.0 0.9 0.9 0.8 0.9 0.8 0.8 0.8
2 0.0 1.0 1.0 0.9 0.9 0.9 0.8 0.9
3 3.0 0.0 1.0 0.9 0.9 0.8 0.9 0.8
4 1.0 2.9 0.0 0.9 0.9 0.9 0.8 0.8
5 3.0 1.0 2.8 0.0 0.9 0.9 0.8 0.8
6 3.0 2.9 0.9 2.7 0.0 0.9 0.8 0.8
7 0.0 2.9 2.8 0.9 2.6 0.0 0.8 0.8
8 0.0 0.0 2.9 2.8 0.9 2.6 0.0 0.8
9 1.0 0.0 0.0 3.0 2.8 0.9 2.7 0.0
10 1.0 1.0 0.0 0.0 2.8 2.7 0.9 2.5
11 2.0 1.0 0.9 0.0 0.0 2.7 2.6 0.8
12 2.0 1.9 0.9 0.9 0.0 0.0 2.6 2.5
PK-5 9.0 6.8 6.6 4.4 5.3 5.2 5.0 5.0
6-8 3.0 5.8 6.6 6.4 3.5 3.5 1.6 2.4
9-12 6.0 3.9 1.8 3.9 5.6 6.3 8.8 5.8
PK-12 18.0 16.5 15.0 14.7 14.4 15.0 15.4 13.2
Study Area 297 Projection Date 10/2/2019
CURRENT PROJECTED RESIDENT STUDENTS
2019 2020 2021 2022 2023 2024 2025 2026
PK 2.0 1.9 1.9 1.8 1.9 1.8 1.8 1.8
K 4.0 4.6 4.8 4.9 4.4 4.6 4.6 4.5
1 10.0 4.6 5.2 4.8 4.6 4.1 4.3 4.3
2 4.0 11.0 5.5 5.5 4.9 4.7 4.2 4.4
3 5.0 4.6 11.4 5.5 5.3 4.7 4.5 4.1
4 7.0 5.6 5.3 11.2 5.3 5.1 4.5 4.4
5 10.0 7.5 6.2 5.3 10.8 5.1 4.9 4.4
6 5.0 10.4 8.0 6.2 5.1 10.4 4.9 4.7
7 6.0 5.6 10.9 8.0 6.0 4.9 10.0 4.8
8 3.0 6.8 6.4 11.1 8.0 6.0 4.9 10.0
9 3.0 3.9 7.8 6.8 11.3 8.1 6.1 5.0
10 7.0 3.7 4.5 7.7 6.5 10.8 7.8 5.8
11 6.0 7.5 4.3 4.5 7.4 6.3 10.4 7.5
12 10.0 6.5 8.0 4.3 4.4 7.1 6.0 10.0
PK-5 42.0 39.8 40.3 39.0 37.2 30.1 28.8 27.9
6-8 14.0 22.8 25.3 25.3 19.1 21.3 19.8 19.5
9-12 26.0 21.6 24.6 23.3 29.6 32.3 30.3 28.3
PK-12 82.0 84.2 90.2 87.6 85.9 83.7 78.9 75.7
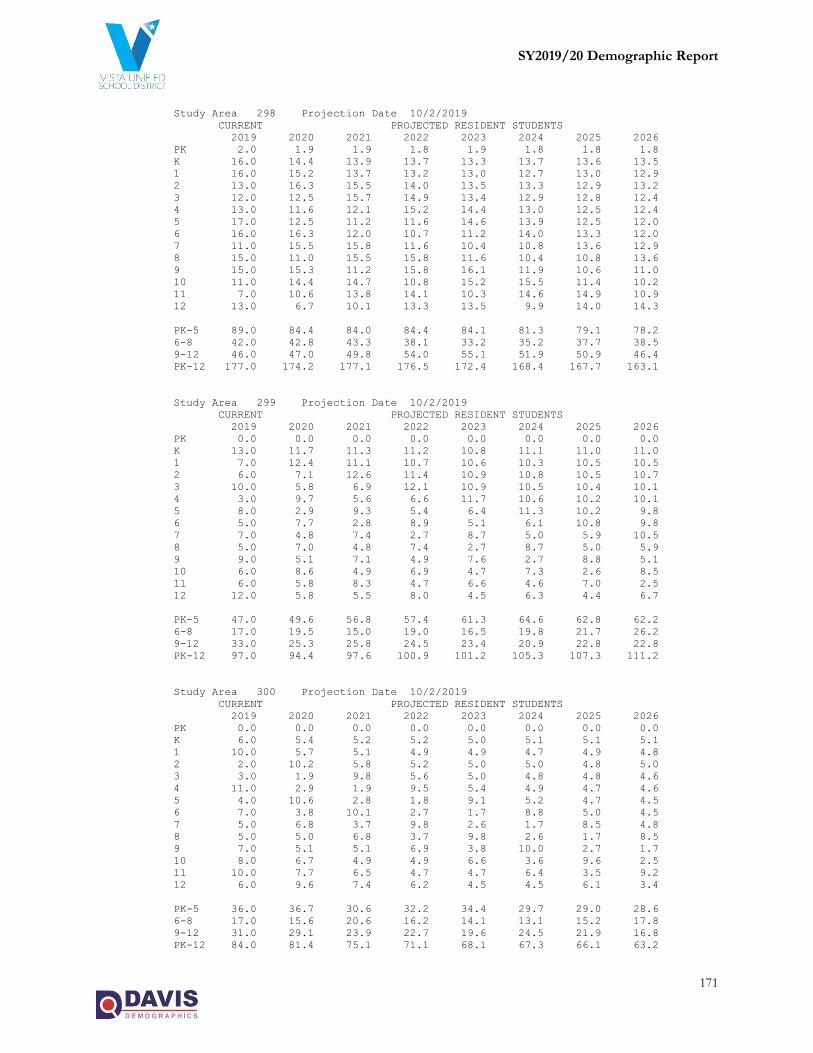
SY2019/20 Demographic Report
171
Study Area 298 Projection Date 10/2/2019
CURRENT PROJECTED RESIDENT STUDENTS
2019 2020 2021 2022 2023 2024 2025 2026
PK 2.0 1.9 1.9 1.8 1.9 1.8 1.8 1.8
K 16.0 14.4 13.9 13.7 13.3 13.7 13.6 13.5
1 16.0 15.2 13.7 13.2 13.0 12.7 13.0 12.9
2 13.0 16.3 15.5 14.0 13.5 13.3 12.9 13.2
3 12.0 12.5 15.7 14.9 13.4 12.9 12.8 12.4
4 13.0 11.6 12.1 15.2 14.4 13.0 12.5 12.4
5 17.0 12.5 11.2 11.6 14.6 13.9 12.5 12.0
6 16.0 16.3 12.0 10.7 11.2 14.0 13.3 12.0
7 11.0 15.5 15.8 11.6 10.4 10.8 13.6 12.9
8 15.0 11.0 15.5 15.8 11.6 10.4 10.8 13.6
9 15.0 15.3 11.2 15.8 16.1 11.9 10.6 11.0
10 11.0 14.4 14.7 10.8 15.2 15.5 11.4 10.2
11 7.0 10.6 13.8 14.1 10.3 14.6 14.9 10.9
12 13.0 6.7 10.1 13.3 13.5 9.9 14.0 14.3
PK-5 89.0 84.4 84.0 84.4 84.1 81.3 79.1 78.2
6-8 42.0 42.8 43.3 38.1 33.2 35.2 37.7 38.5
9-12 46.0 47.0 49.8 54.0 55.1 51.9 50.9 46.4
PK-12 177.0 174.2 177.1 176.5 172.4 168.4 167.7 163.1
Study Area 299 Projection Date 10/2/2019
CURRENT PROJECTED RESIDENT STUDENTS
2019 2020 2021 2022 2023 2024 2025 2026
PK 0.0 0.0 0.0 0.0 0.0 0.0 0.0 0.0
K 13.0 11.7 11.3 11.2 10.8 11.1 11.0 11.0
1 7.0 12.4 11.1 10.7 10.6 10.3 10.5 10.5
2 6.0 7.1 12.6 11.4 10.9 10.8 10.5 10.7
3 10.0 5.8 6.9 12.1 10.9 10.5 10.4 10.1
4 3.0 9.7 5.6 6.6 11.7 10.6 10.2 10.1
5 8.0 2.9 9.3 5.4 6.4 11.3 10.2 9.8
6 5.0 7.7 2.8 8.9 5.1 6.1 10.8 9.8
7 7.0 4.8 7.4 2.7 8.7 5.0 5.9 10.5
8 5.0 7.0 4.8 7.4 2.7 8.7 5.0 5.9
9 9.0 5.1 7.1 4.9 7.6 2.7 8.8 5.1
10 6.0 8.6 4.9 6.9 4.7 7.3 2.6 8.5
11 6.0 5.8 8.3 4.7 6.6 4.6 7.0 2.5
12 12.0 5.8 5.5 8.0 4.5 6.3 4.4 6.7
PK-5 47.0 49.6 56.8 57.4 61.3 64.6 62.8 62.2
6-8 17.0 19.5 15.0 19.0 16.5 19.8 21.7 26.2
9-12 33.0 25.3 25.8 24.5 23.4 20.9 22.8 22.8
PK-12 97.0 94.4 97.6 100.9 101.2 105.3 107.3 111.2
Study Area 300 Projection Date 10/2/2019
CURRENT PROJECTED RESIDENT STUDENTS
2019 2020 2021 2022 2023 2024 2025 2026
PK 0.0 0.0 0.0 0.0 0.0 0.0 0.0 0.0
K 6.0 5.4 5.2 5.2 5.0 5.1 5.1 5.1
1 10.0 5.7 5.1 4.9 4.9 4.7 4.9 4.8
2 2.0 10.2 5.8 5.2 5.0 5.0 4.8 5.0
3 3.0 1.9 9.8 5.6 5.0 4.8 4.8 4.6
4 11.0 2.9 1.9 9.5 5.4 4.9 4.7 4.6
5 4.0 10.6 2.8 1.8 9.1 5.2 4.7 4.5
6 7.0 3.8 10.1 2.7 1.7 8.8 5.0 4.5
7 5.0 6.8 3.7 9.8 2.6 1.7 8.5 4.8
8 5.0 5.0 6.8 3.7 9.8 2.6 1.7 8.5
9 7.0 5.1 5.1 6.9 3.8 10.0 2.7 1.7
10 8.0 6.7 4.9 4.9 6.6 3.6 9.6 2.5
11 10.0 7.7 6.5 4.7 4.7 6.4 3.5 9.2
12 6.0 9.6 7.4 6.2 4.5 4.5 6.1 3.4
PK-5 36.0 36.7 30.6 32.2 34.4 29.7 29.0 28.6
6-8 17.0 15.6 20.6 16.2 14.1 13.1 15.2 17.8
9-12 31.0 29.1 23.9 22.7 19.6 24.5 21.9 16.8
PK-12 84.0 81.4 75.1 71.1 68.1 67.3 66.1 63.2

SY2019/20 Demographic Report
172
Study Area 301 Projection Date 10/2/2019
CURRENT PROJECTED RESIDENT STUDENTS
2019 2020 2021 2022 2023 2024 2025 2026
PK 2.0 1.9 1.9 1.8 1.9 1.8 1.8 1.8
K 4.0 3.6 3.5 3.4 3.3 3.4 3.4 3.4
1 9.0 3.8 3.4 3.3 3.3 3.2 3.2 3.2
2 2.0 9.2 3.9 3.5 3.4 3.3 3.2 3.3
3 3.0 1.9 8.8 3.7 3.4 3.2 3.2 3.1
4 5.0 2.9 1.9 8.5 3.6 3.3 3.1 3.1
5 0.0 4.8 2.8 1.8 8.2 3.5 3.1 3.0
6 7.0 0.0 4.6 2.7 1.7 7.9 3.3 3.0
7 4.0 6.8 0.0 4.5 2.6 1.7 7.6 3.2
8 1.0 4.0 6.8 0.0 4.5 2.6 1.7 7.6
9 6.0 1.0 4.1 6.9 0.0 4.6 2.7 1.7
10 2.0 5.8 1.0 3.9 6.6 0.0 4.4 2.5
11 4.0 1.9 5.5 0.9 3.8 6.4 0.0 4.2
12 4.0 3.8 1.8 5.3 0.9 3.6 6.1 0.0
PK-5 25.0 28.1 26.2 26.0 27.1 21.7 21.0 20.9
6-8 12.0 10.8 11.4 7.2 8.8 12.2 12.6 13.8
9-12 16.0 12.5 12.4 17.0 11.3 14.6 13.2 8.4
PK-12 53.0 51.4 50.0 50.2 47.2 48.5 46.8 43.1
Study Area 302 Projection Date 10/2/2019
CURRENT PROJECTED RESIDENT STUDENTS
2019 2020 2021 2022 2023 2024 2025 2026
PK 0.0 0.0 0.0 0.0 0.0 0.0 0.0 0.0
K 3.0 2.7 2.6 2.6 2.5 2.6 2.5 2.5
1 6.0 2.8 2.6 2.5 2.4 2.4 2.4 2.4
2 5.0 6.1 2.9 2.6 2.5 2.5 2.4 2.5
3 2.0 4.8 5.9 2.8 2.5 2.4 2.4 2.3
4 5.0 1.9 4.7 5.7 2.7 2.4 2.4 2.3
5 5.0 4.8 1.9 4.5 5.5 2.6 2.3 2.3
6 4.0 4.8 4.6 1.8 4.3 5.3 2.5 2.3
7 6.0 3.9 4.7 4.5 1.7 4.2 5.1 2.4
8 6.0 6.0 3.9 4.7 4.5 1.7 4.2 5.1
9 5.0 6.1 6.1 4.0 4.7 4.6 1.8 4.2
10 8.0 4.8 5.9 5.9 3.8 4.6 4.4 1.7
11 4.0 7.7 4.6 5.6 5.6 3.6 4.4 4.2
12 4.0 3.8 7.4 4.4 5.4 5.4 3.5 4.2
PK-5 26.0 23.1 20.6 20.7 18.1 14.9 14.4 14.3
6-8 16.0 14.7 13.2 11.0 10.5 11.2 11.8 9.8
9-12 21.0 22.4 24.0 19.9 19.5 18.2 14.1 14.3
PK-12 63.0 60.2 57.8 51.6 48.1 44.3 40.3 38.4
Study Area 303 Projection Date 10/2/2019
CURRENT PROJECTED RESIDENT STUDENTS
2019 2020 2021 2022 2023 2024 2025 2026
PK 1.0 1.0 0.9 0.9 0.9 0.9 0.9 0.9
K 5.0 4.5 4.3 4.3 4.2 4.3 4.2 4.2
1 4.0 4.8 4.3 4.1 4.1 4.0 4.1 4.0
2 1.0 4.1 4.8 4.4 4.2 4.2 4.0 4.1
3 5.0 1.0 3.9 4.7 4.2 4.0 4.0 3.9
4 1.0 4.8 0.9 3.8 4.5 4.1 3.9 3.9
5 3.0 1.0 4.7 0.9 3.6 4.3 3.9 3.8
6 4.0 2.9 0.9 4.5 0.9 3.5 4.2 3.8
7 3.0 3.9 2.8 0.9 4.3 0.8 3.4 4.0
8 5.0 3.0 3.9 2.8 0.9 4.3 0.8 3.4
9 5.0 5.1 3.1 4.0 2.8 0.9 4.4 0.8
10 4.0 4.8 4.9 2.9 3.8 2.7 0.9 4.2
11 2.0 3.8 4.6 4.7 2.8 3.6 2.6 0.8
12 5.0 1.9 3.7 4.4 4.5 2.7 3.5 2.5
PK-5 20.0 21.2 23.8 23.1 25.7 25.8 25.0 24.8
6-8 12.0 9.8 7.6 8.2 6.1 8.6 8.4 11.2
9-12 16.0 15.6 16.3 16.0 13.9 9.9 11.4 8.3
PK-12 48.0 46.6 47.7 47.3 45.7 44.3 44.8 44.3

SY2019/20 Demographic Report
173
Study Area 304 Projection Date 10/2/2019
CURRENT PROJECTED RESIDENT STUDENTS
2019 2020 2021 2022 2023 2024 2025 2026
PK 0.0 0.0 0.0 0.0 0.0 0.0 0.0 0.0
K 4.0 3.6 3.5 3.4 3.3 3.4 3.4 3.4
1 2.0 3.8 3.4 3.3 3.3 3.2 3.2 3.2
2 9.0 2.0 3.9 3.5 3.4 3.3 3.2 3.3
3 4.0 8.6 2.0 3.7 3.4 3.2 3.2 3.1
4 5.0 3.9 8.4 1.9 3.6 3.3 3.1 3.1
5 8.0 4.8 3.7 8.0 1.8 3.5 3.1 3.0
6 6.0 7.7 4.6 3.6 7.7 1.8 3.3 3.0
7 7.0 5.8 7.4 4.5 3.5 7.5 1.7 3.2
8 8.0 7.0 5.8 7.4 4.5 3.5 7.5 1.7
9 3.0 8.2 7.1 5.9 7.6 4.6 3.5 7.6
10 2.0 2.9 7.8 6.9 5.7 7.3 4.4 3.4
11 6.0 1.9 2.8 7.5 6.6 5.5 7.0 4.2
12 5.0 5.8 1.8 2.7 7.2 6.3 5.3 6.7
PK-5 32.0 26.7 24.9 23.8 18.8 19.9 19.2 19.1
6-8 21.0 20.5 17.8 15.5 15.7 12.8 12.5 7.9
9-12 16.0 18.8 19.5 23.0 27.1 23.7 20.2 21.9
PK-12 69.0 66.0 62.2 62.3 61.6 56.4 51.9 48.9
Study Area 305 Projection Date 10/2/2019
CURRENT PROJECTED RESIDENT STUDENTS
2019 2020 2021 2022 2023 2024 2025 2026
PK 0.0 0.0 0.0 0.0 0.0 0.0 0.0 0.0
K 3.0 2.7 2.6 2.6 2.5 2.6 2.5 2.5
1 2.0 2.8 2.6 2.5 2.4 2.4 2.4 2.4
2 2.0 2.0 2.9 2.6 2.5 2.5 2.4 2.5
3 3.0 1.9 2.0 2.8 2.5 2.4 2.4 2.3
4 2.0 2.9 1.9 1.9 2.7 2.4 2.4 2.3
5 1.0 1.9 2.8 1.8 1.8 2.6 2.3 2.3
6 3.0 1.0 1.8 2.7 1.7 1.8 2.5 2.3
7 0.0 2.9 0.9 1.8 2.6 1.7 1.7 2.4
8 0.0 0.0 2.9 0.9 1.8 2.6 1.7 1.7
9 1.0 0.0 0.0 3.0 0.9 1.8 2.7 1.7
10 1.0 1.0 0.0 0.0 2.8 0.9 1.8 2.5
11 5.0 1.0 0.9 0.0 0.0 2.7 0.9 1.7
12 1.0 4.8 0.9 0.9 0.0 0.0 2.6 0.8
PK-5 13.0 14.2 14.8 14.2 14.4 14.9 14.4 14.3
6-8 3.0 3.9 5.6 5.4 6.1 6.1 5.9 6.4
9-12 8.0 6.8 1.8 3.9 3.7 5.4 8.0 6.7
PK-12 24.0 24.9 22.2 23.5 24.2 26.4 28.3 27.4
Study Area 306 Projection Date 10/2/2019
CURRENT PROJECTED RESIDENT STUDENTS
2019 2020 2021 2022 2023 2024 2025 2026
PK 0.0 0.0 0.0 0.0 0.0 0.0 0.0 0.0
K 3.0 2.7 2.6 2.6 2.5 2.6 2.5 2.5
1 3.0 2.8 2.6 2.5 2.4 2.4 2.4 2.4
2 3.0 3.1 2.9 2.6 2.5 2.5 2.4 2.5
3 2.0 2.9 2.9 2.8 2.5 2.4 2.4 2.3
4 4.0 1.9 2.8 2.8 2.7 2.4 2.4 2.3
5 1.0 3.8 1.9 2.7 2.7 2.6 2.3 2.3
6 5.0 1.0 3.7 1.8 2.6 2.6 2.5 2.3
7 10.0 4.8 0.9 3.6 1.7 2.5 2.5 2.4
8 4.0 10.0 4.8 0.9 3.6 1.7 2.5 2.5
9 4.0 4.1 10.2 4.9 0.9 3.6 1.8 2.5
10 7.0 3.8 3.9 9.8 4.7 0.9 3.5 1.7
11 4.0 6.7 3.7 3.8 9.4 4.6 0.9 3.4
12 4.0 3.8 6.5 3.5 3.6 9.0 4.4 0.8
PK-5 16.0 17.2 15.7 16.0 15.3 14.9 14.4 14.3
6-8 19.0 15.8 9.4 6.3 7.9 6.8 7.5 7.2
9-12 19.0 18.4 24.3 22.0 18.6 18.1 10.6 8.4
PK-12 54.0 51.4 49.4 44.3 41.8 39.8 32.5 29.9
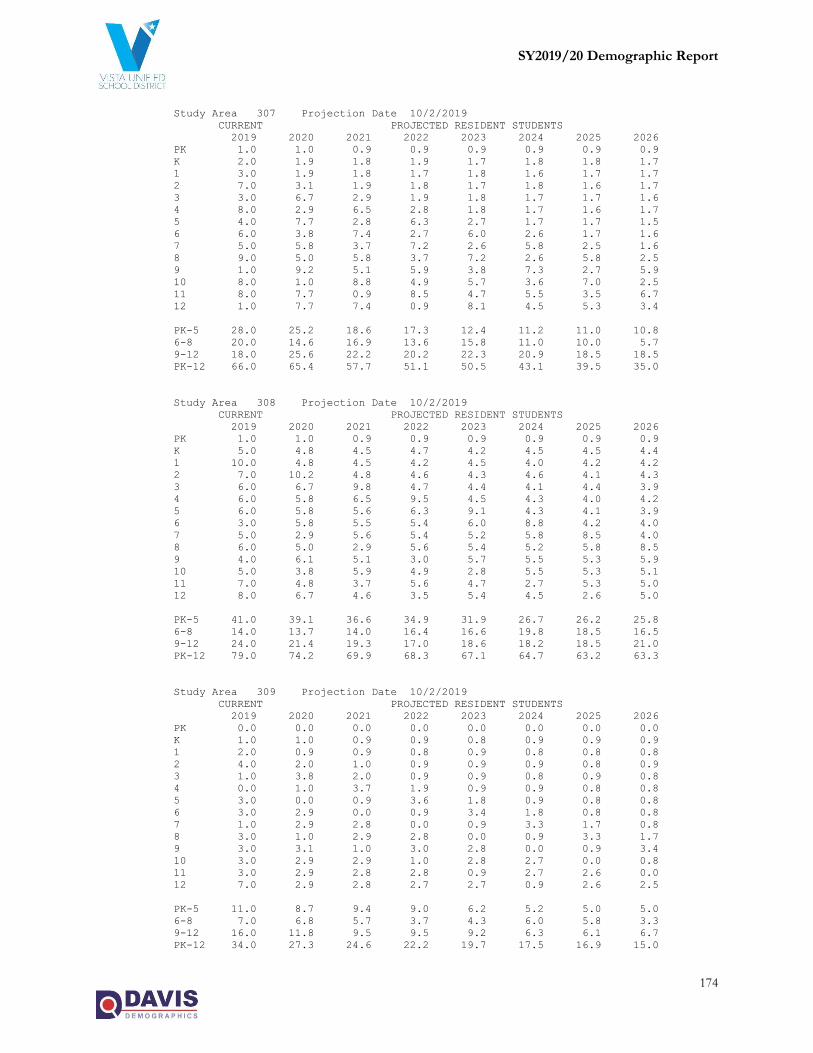
SY2019/20 Demographic Report
174
Study Area 307 Projection Date 10/2/2019
CURRENT PROJECTED RESIDENT STUDENTS
2019 2020 2021 2022 2023 2024 2025 2026
PK 1.0 1.0 0.9 0.9 0.9 0.9 0.9 0.9
K 2.0 1.9 1.8 1.9 1.7 1.8 1.8 1.7
1 3.0 1.9 1.8 1.7 1.8 1.6 1.7 1.7
2 7.0 3.1 1.9 1.8 1.7 1.8 1.6 1.7
3 3.0 6.7 2.9 1.9 1.8 1.7 1.7 1.6
4 8.0 2.9 6.5 2.8 1.8 1.7 1.6 1.7
5 4.0 7.7 2.8 6.3 2.7 1.7 1.7 1.5
6 6.0 3.8 7.4 2.7 6.0 2.6 1.7 1.6
7 5.0 5.8 3.7 7.2 2.6 5.8 2.5 1.6
8 9.0 5.0 5.8 3.7 7.2 2.6 5.8 2.5
9 1.0 9.2 5.1 5.9 3.8 7.3 2.7 5.9
10 8.0 1.0 8.8 4.9 5.7 3.6 7.0 2.5
11 8.0 7.7 0.9 8.5 4.7 5.5 3.5 6.7
12 1.0 7.7 7.4 0.9 8.1 4.5 5.3 3.4
PK-5 28.0 25.2 18.6 17.3 12.4 11.2 11.0 10.8
6-8 20.0 14.6 16.9 13.6 15.8 11.0 10.0 5.7
9-12 18.0 25.6 22.2 20.2 22.3 20.9 18.5 18.5
PK-12 66.0 65.4 57.7 51.1 50.5 43.1 39.5 35.0
Study Area 308 Projection Date 10/2/2019
CURRENT PROJECTED RESIDENT STUDENTS
2019 2020 2021 2022 2023 2024 2025 2026
PK 1.0 1.0 0.9 0.9 0.9 0.9 0.9 0.9
K 5.0 4.8 4.5 4.7 4.2 4.5 4.5 4.4
1 10.0 4.8 4.5 4.2 4.5 4.0 4.2 4.2
2 7.0 10.2 4.8 4.6 4.3 4.6 4.1 4.3
3 6.0 6.7 9.8 4.7 4.4 4.1 4.4 3.9
4 6.0 5.8 6.5 9.5 4.5 4.3 4.0 4.2
5 6.0 5.8 5.6 6.3 9.1 4.3 4.1 3.9
6 3.0 5.8 5.5 5.4 6.0 8.8 4.2 4.0
7 5.0 2.9 5.6 5.4 5.2 5.8 8.5 4.0
8 6.0 5.0 2.9 5.6 5.4 5.2 5.8 8.5
9 4.0 6.1 5.1 3.0 5.7 5.5 5.3 5.9
10 5.0 3.8 5.9 4.9 2.8 5.5 5.3 5.1
11 7.0 4.8 3.7 5.6 4.7 2.7 5.3 5.0
12 8.0 6.7 4.6 3.5 5.4 4.5 2.6 5.0
PK-5 41.0 39.1 36.6 34.9 31.9 26.7 26.2 25.8
6-8 14.0 13.7 14.0 16.4 16.6 19.8 18.5 16.5
9-12 24.0 21.4 19.3 17.0 18.6 18.2 18.5 21.0
PK-12 79.0 74.2 69.9 68.3 67.1 64.7 63.2 63.3
Study Area 309 Projection Date 10/2/2019
CURRENT PROJECTED RESIDENT STUDENTS
2019 2020 2021 2022 2023 2024 2025 2026
PK 0.0 0.0 0.0 0.0 0.0 0.0 0.0 0.0
K 1.0 1.0 0.9 0.9 0.8 0.9 0.9 0.9
1 2.0 0.9 0.9 0.8 0.9 0.8 0.8 0.8
2 4.0 2.0 1.0 0.9 0.9 0.9 0.8 0.9
3 1.0 3.8 2.0 0.9 0.9 0.8 0.9 0.8
4 0.0 1.0 3.7 1.9 0.9 0.9 0.8 0.8
5 3.0 0.0 0.9 3.6 1.8 0.9 0.8 0.8
6 3.0 2.9 0.0 0.9 3.4 1.8 0.8 0.8
7 1.0 2.9 2.8 0.0 0.9 3.3 1.7 0.8
8 3.0 1.0 2.9 2.8 0.0 0.9 3.3 1.7
9 3.0 3.1 1.0 3.0 2.8 0.0 0.9 3.4
10 3.0 2.9 2.9 1.0 2.8 2.7 0.0 0.8
11 3.0 2.9 2.8 2.8 0.9 2.7 2.6 0.0
12 7.0 2.9 2.8 2.7 2.7 0.9 2.6 2.5
PK-5 11.0 8.7 9.4 9.0 6.2 5.2 5.0 5.0
6-8 7.0 6.8 5.7 3.7 4.3 6.0 5.8 3.3
9-12 16.0 11.8 9.5 9.5 9.2 6.3 6.1 6.7
PK-12 34.0 27.3 24.6 22.2 19.7 17.5 16.9 15.0
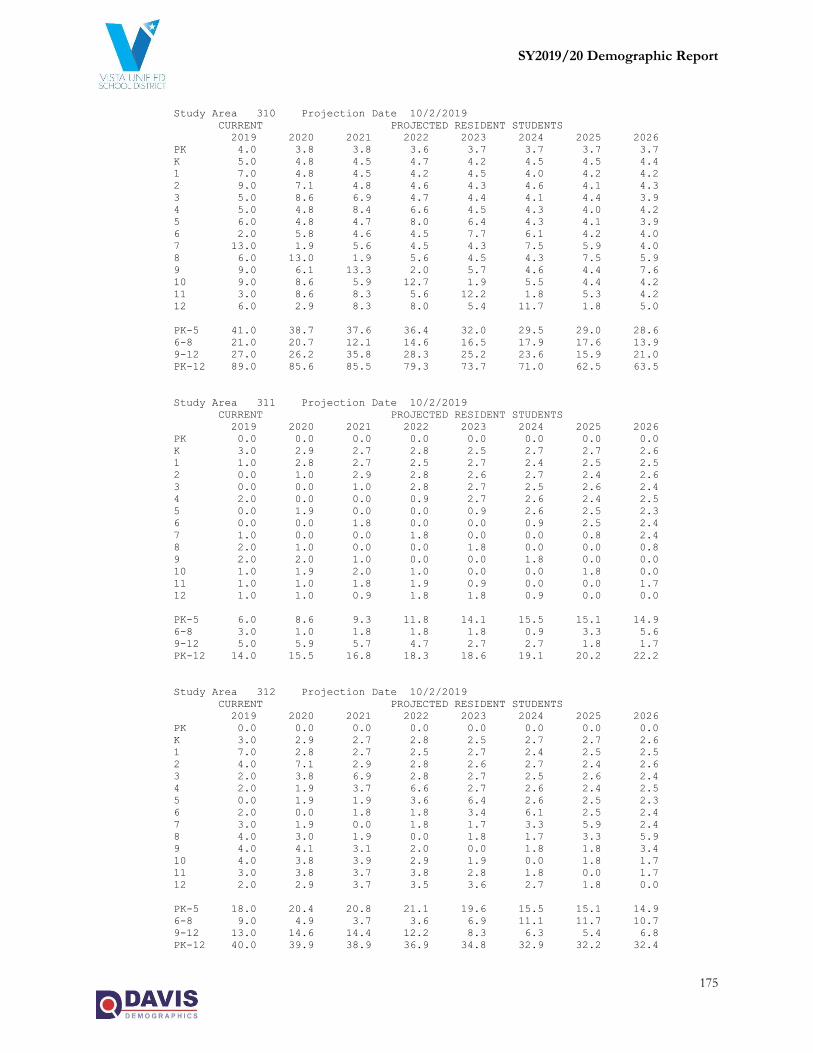
SY2019/20 Demographic Report
175
Study Area 310 Projection Date 10/2/2019
CURRENT PROJECTED RESIDENT STUDENTS
2019 2020 2021 2022 2023 2024 2025 2026
PK 4.0 3.8 3.8 3.6 3.7 3.7 3.7 3.7
K 5.0 4.8 4.5 4.7 4.2 4.5 4.5 4.4
1 7.0 4.8 4.5 4.2 4.5 4.0 4.2 4.2
2 9.0 7.1 4.8 4.6 4.3 4.6 4.1 4.3
3 5.0 8.6 6.9 4.7 4.4 4.1 4.4 3.9
4 5.0 4.8 8.4 6.6 4.5 4.3 4.0 4.2
5 6.0 4.8 4.7 8.0 6.4 4.3 4.1 3.9
6 2.0 5.8 4.6 4.5 7.7 6.1 4.2 4.0
7 13.0 1.9 5.6 4.5 4.3 7.5 5.9 4.0
8 6.0 13.0 1.9 5.6 4.5 4.3 7.5 5.9
9 9.0 6.1 13.3 2.0 5.7 4.6 4.4 7.6
10 9.0 8.6 5.9 12.7 1.9 5.5 4.4 4.2
11 3.0 8.6 8.3 5.6 12.2 1.8 5.3 4.2
12 6.0 2.9 8.3 8.0 5.4 11.7 1.8 5.0
PK-5 41.0 38.7 37.6 36.4 32.0 29.5 29.0 28.6
6-8 21.0 20.7 12.1 14.6 16.5 17.9 17.6 13.9
9-12 27.0 26.2 35.8 28.3 25.2 23.6 15.9 21.0
PK-12 89.0 85.6 85.5 79.3 73.7 71.0 62.5 63.5
Study Area 311 Projection Date 10/2/2019
CURRENT PROJECTED RESIDENT STUDENTS
2019 2020 2021 2022 2023 2024 2025 2026
PK 0.0 0.0 0.0 0.0 0.0 0.0 0.0 0.0
K 3.0 2.9 2.7 2.8 2.5 2.7 2.7 2.6
1 1.0 2.8 2.7 2.5 2.7 2.4 2.5 2.5
2 0.0 1.0 2.9 2.8 2.6 2.7 2.4 2.6
3 0.0 0.0 1.0 2.8 2.7 2.5 2.6 2.4
4 2.0 0.0 0.0 0.9 2.7 2.6 2.4 2.5
5 0.0 1.9 0.0 0.0 0.9 2.6 2.5 2.3
6 0.0 0.0 1.8 0.0 0.0 0.9 2.5 2.4
7 1.0 0.0 0.0 1.8 0.0 0.0 0.8 2.4
8 2.0 1.0 0.0 0.0 1.8 0.0 0.0 0.8
9 2.0 2.0 1.0 0.0 0.0 1.8 0.0 0.0
10 1.0 1.9 2.0 1.0 0.0 0.0 1.8 0.0
11 1.0 1.0 1.8 1.9 0.9 0.0 0.0 1.7
12 1.0 1.0 0.9 1.8 1.8 0.9 0.0 0.0
PK-5 6.0 8.6 9.3 11.8 14.1 15.5 15.1 14.9
6-8 3.0 1.0 1.8 1.8 1.8 0.9 3.3 5.6
9-12 5.0 5.9 5.7 4.7 2.7 2.7 1.8 1.7
PK-12 14.0 15.5 16.8 18.3 18.6 19.1 20.2 22.2
Study Area 312 Projection Date 10/2/2019
CURRENT PROJECTED RESIDENT STUDENTS
2019 2020 2021 2022 2023 2024 2025 2026
PK 0.0 0.0 0.0 0.0 0.0 0.0 0.0 0.0
K 3.0 2.9 2.7 2.8 2.5 2.7 2.7 2.6
1 7.0 2.8 2.7 2.5 2.7 2.4 2.5 2.5
2 4.0 7.1 2.9 2.8 2.6 2.7 2.4 2.6
3 2.0 3.8 6.9 2.8 2.7 2.5 2.6 2.4
4 2.0 1.9 3.7 6.6 2.7 2.6 2.4 2.5
5 0.0 1.9 1.9 3.6 6.4 2.6 2.5 2.3
6 2.0 0.0 1.8 1.8 3.4 6.1 2.5 2.4
7 3.0 1.9 0.0 1.8 1.7 3.3 5.9 2.4
8 4.0 3.0 1.9 0.0 1.8 1.7 3.3 5.9
9 4.0 4.1 3.1 2.0 0.0 1.8 1.8 3.4
10 4.0 3.8 3.9 2.9 1.9 0.0 1.8 1.7
11 3.0 3.8 3.7 3.8 2.8 1.8 0.0 1.7
12 2.0 2.9 3.7 3.5 3.6 2.7 1.8 0.0
PK-5 18.0 20.4 20.8 21.1 19.6 15.5 15.1 14.9
6-8 9.0 4.9 3.7 3.6 6.9 11.1 11.7 10.7
9-12 13.0 14.6 14.4 12.2 8.3 6.3 5.4 6.8
PK-12 40.0 39.9 38.9 36.9 34.8 32.9 32.2 32.4
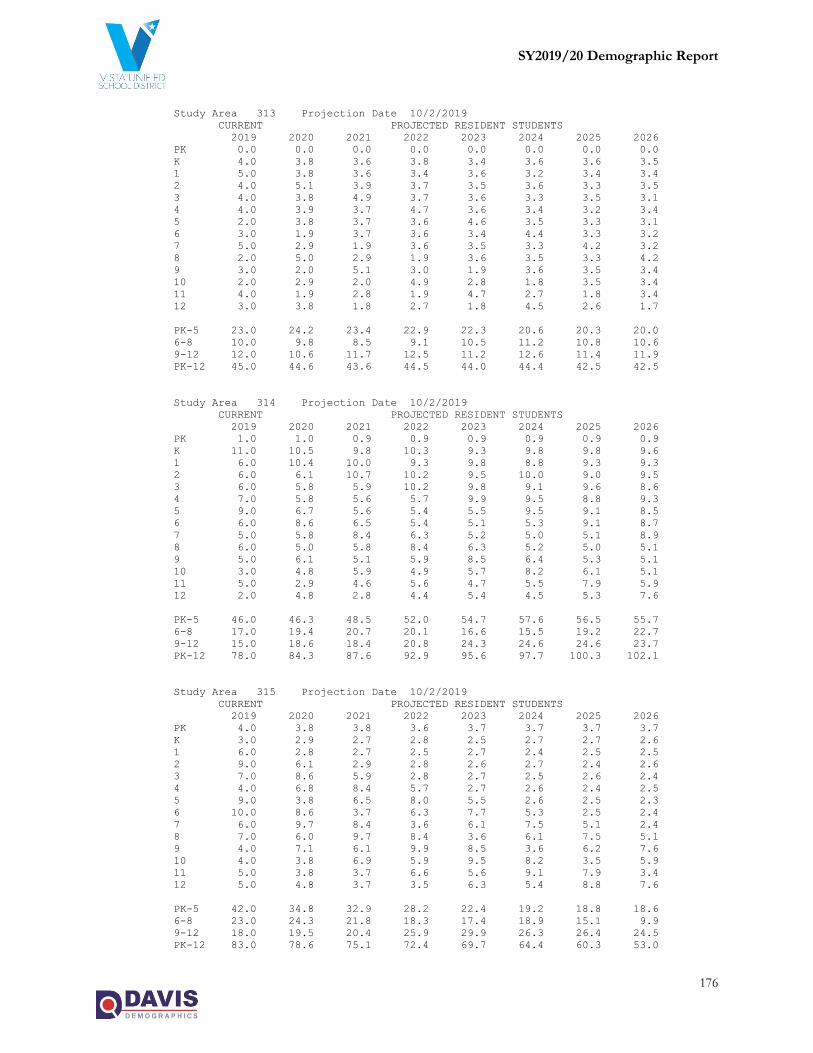
SY2019/20 Demographic Report
176
Study Area 313 Projection Date 10/2/2019
CURRENT PROJECTED RESIDENT STUDENTS
2019 2020 2021 2022 2023 2024 2025 2026
PK 0.0 0.0 0.0 0.0 0.0 0.0 0.0 0.0
K 4.0 3.8 3.6 3.8 3.4 3.6 3.6 3.5
1 5.0 3.8 3.6 3.4 3.6 3.2 3.4 3.4
2 4.0 5.1 3.9 3.7 3.5 3.6 3.3 3.5
3 4.0 3.8 4.9 3.7 3.6 3.3 3.5 3.1
4 4.0 3.9 3.7 4.7 3.6 3.4 3.2 3.4
5 2.0 3.8 3.7 3.6 4.6 3.5 3.3 3.1
6 3.0 1.9 3.7 3.6 3.4 4.4 3.3 3.2
7 5.0 2.9 1.9 3.6 3.5 3.3 4.2 3.2
8 2.0 5.0 2.9 1.9 3.6 3.5 3.3 4.2
9 3.0 2.0 5.1 3.0 1.9 3.6 3.5 3.4
10 2.0 2.9 2.0 4.9 2.8 1.8 3.5 3.4
11 4.0 1.9 2.8 1.9 4.7 2.7 1.8 3.4
12 3.0 3.8 1.8 2.7 1.8 4.5 2.6 1.7
PK-5 23.0 24.2 23.4 22.9 22.3 20.6 20.3 20.0
6-8 10.0 9.8 8.5 9.1 10.5 11.2 10.8 10.6
9-12 12.0 10.6 11.7 12.5 11.2 12.6 11.4 11.9
PK-12 45.0 44.6 43.6 44.5 44.0 44.4 42.5 42.5
Study Area 314 Projection Date 10/2/2019
CURRENT PROJECTED RESIDENT STUDENTS
2019 2020 2021 2022 2023 2024 2025 2026
PK 1.0 1.0 0.9 0.9 0.9 0.9 0.9 0.9
K 11.0 10.5 9.8 10.3 9.3 9.8 9.8 9.6
1 6.0 10.4 10.0 9.3 9.8 8.8 9.3 9.3
2 6.0 6.1 10.7 10.2 9.5 10.0 9.0 9.5
3 6.0 5.8 5.9 10.2 9.8 9.1 9.6 8.6
4 7.0 5.8 5.6 5.7 9.9 9.5 8.8 9.3
5 9.0 6.7 5.6 5.4 5.5 9.5 9.1 8.5
6 6.0 8.6 6.5 5.4 5.1 5.3 9.1 8.7
7 5.0 5.8 8.4 6.3 5.2 5.0 5.1 8.9
8 6.0 5.0 5.8 8.4 6.3 5.2 5.0 5.1
9 5.0 6.1 5.1 5.9 8.5 6.4 5.3 5.1
10 3.0 4.8 5.9 4.9 5.7 8.2 6.1 5.1
11 5.0 2.9 4.6 5.6 4.7 5.5 7.9 5.9
12 2.0 4.8 2.8 4.4 5.4 4.5 5.3 7.6
PK-5 46.0 46.3 48.5 52.0 54.7 57.6 56.5 55.7
6-8 17.0 19.4 20.7 20.1 16.6 15.5 19.2 22.7
9-12 15.0 18.6 18.4 20.8 24.3 24.6 24.6 23.7
PK-12 78.0 84.3 87.6 92.9 95.6 97.7 100.3 102.1
Study Area 315 Projection Date 10/2/2019
CURRENT PROJECTED RESIDENT STUDENTS
2019 2020 2021 2022 2023 2024 2025 2026
PK 4.0 3.8 3.8 3.6 3.7 3.7 3.7 3.7
K 3.0 2.9 2.7 2.8 2.5 2.7 2.7 2.6
1 6.0 2.8 2.7 2.5 2.7 2.4 2.5 2.5
2 9.0 6.1 2.9 2.8 2.6 2.7 2.4 2.6
3 7.0 8.6 5.9 2.8 2.7 2.5 2.6 2.4
4 4.0 6.8 8.4 5.7 2.7 2.6 2.4 2.5
5 9.0 3.8 6.5 8.0 5.5 2.6 2.5 2.3
6 10.0 8.6 3.7 6.3 7.7 5.3 2.5 2.4
7 6.0 9.7 8.4 3.6 6.1 7.5 5.1 2.4
8 7.0 6.0 9.7 8.4 3.6 6.1 7.5 5.1
9 4.0 7.1 6.1 9.9 8.5 3.6 6.2 7.6
10 4.0 3.8 6.9 5.9 9.5 8.2 3.5 5.9
11 5.0 3.8 3.7 6.6 5.6 9.1 7.9 3.4
12 5.0 4.8 3.7 3.5 6.3 5.4 8.8 7.6
PK-5 42.0 34.8 32.9 28.2 22.4 19.2 18.8 18.6
6-8 23.0 24.3 21.8 18.3 17.4 18.9 15.1 9.9
9-12 18.0 19.5 20.4 25.9 29.9 26.3 26.4 24.5
PK-12 83.0 78.6 75.1 72.4 69.7 64.4 60.3 53.0

SY2019/20 Demographic Report
177
Study Area 316 Projection Date 10/2/2019
CURRENT PROJECTED RESIDENT STUDENTS
2019 2020 2021 2022 2023 2024 2025 2026
PK 2.0 1.9 1.9 1.8 1.9 1.8 1.8 1.8
K 3.0 2.9 2.7 2.8 2.5 2.7 2.7 2.6
1 4.0 2.8 2.7 2.5 2.7 2.4 2.5 2.5
2 8.0 4.1 2.9 2.8 2.6 2.7 2.4 2.6
3 7.0 7.7 3.9 2.8 2.7 2.5 2.6 2.4
4 3.0 6.8 7.4 3.8 2.7 2.6 2.4 2.5
5 3.0 2.9 6.5 7.2 3.6 2.6 2.5 2.3
6 5.0 2.9 2.8 6.3 6.9 3.5 2.5 2.4
7 3.0 4.8 2.8 2.7 6.1 6.7 3.4 2.4
8 2.0 3.0 4.8 2.8 2.7 6.1 6.7 3.4
9 5.0 2.0 3.1 4.9 2.8 2.7 6.2 6.8
10 6.0 4.8 2.0 2.9 4.7 2.7 2.6 5.9
11 4.0 5.8 4.6 1.9 2.8 4.6 2.6 2.5
12 4.0 3.8 5.5 4.4 1.8 2.7 4.4 2.5
PK-5 30.0 29.1 28.0 23.7 18.7 17.3 16.9 16.7
6-8 10.0 10.7 10.4 11.8 15.7 16.3 12.6 8.2
9-12 19.0 16.4 15.2 14.1 12.1 12.7 15.8 17.7
PK-12 59.0 56.2 53.6 49.6 46.5 46.3 45.3 42.6
Study Area 317 Projection Date 10/2/2019
CURRENT PROJECTED RESIDENT STUDENTS
2019 2020 2021 2022 2023 2024 2025 2026
PK 0.0 0.0 0.0 0.0 0.0 0.0 0.0 0.0
K 4.0 4.5 4.0 4.2 3.8 4.0 4.0 3.9
1 4.0 4.5 4.3 3.8 3.9 3.6 3.8 3.8
2 1.0 4.8 4.6 4.4 3.8 4.0 3.6 3.8
3 8.0 1.7 4.6 4.4 4.2 3.7 3.9 3.5
4 7.0 8.5 1.6 4.5 4.3 4.1 3.6 3.7
5 3.0 7.4 8.1 1.5 4.3 4.1 3.9 3.4
6 4.0 3.6 7.1 7.8 1.5 4.1 3.9 3.8
7 4.0 4.6 3.5 6.9 7.6 1.4 4.0 3.8
8 6.0 4.7 4.6 3.5 6.9 7.6 1.4 4.0
9 3.0 6.9 4.8 4.7 3.5 7.1 7.7 1.5
10 5.0 3.6 6.6 4.6 4.5 3.4 6.8 7.4
11 3.0 5.5 3.4 6.3 4.4 4.3 3.3 6.5
12 3.0 3.6 5.3 3.3 6.1 4.3 4.1 3.1
PK-5 27.0 31.4 27.2 22.8 24.3 23.5 22.8 22.1
6-8 14.0 12.9 15.2 18.2 16.0 13.1 9.3 11.6
9-12 14.0 19.6 20.1 18.9 18.5 19.1 21.9 18.5
PK-12 55.0 63.9 62.5 59.9 58.8 55.7 54.0 52.2
Study Area 318 Projection Date 10/2/2019
CURRENT PROJECTED RESIDENT STUDENTS
2019 2020 2021 2022 2023 2024 2025 2026
PK 0.0 0.0 0.0 0.0 0.0 0.0 0.0 0.0
K 4.0 3.8 3.6 3.8 3.4 3.6 3.6 3.5
1 1.0 3.8 3.6 3.4 3.6 3.2 3.4 3.4
2 2.0 1.0 3.9 3.7 3.5 3.6 3.3 3.5
3 4.0 1.9 1.0 3.7 3.6 3.3 3.5 3.1
4 1.0 3.9 1.9 0.9 3.6 3.4 3.2 3.4
5 2.0 1.0 3.7 1.8 0.9 3.5 3.3 3.1
6 2.0 1.9 0.9 3.6 1.7 0.9 3.3 3.2
7 3.0 1.9 1.9 0.9 3.5 1.7 0.8 3.2
8 1.0 3.0 1.9 1.9 0.9 3.5 1.7 0.8
9 4.0 1.0 3.1 2.0 1.9 0.9 3.5 1.7
10 1.0 3.8 1.0 2.9 1.9 1.8 0.9 3.4
11 1.0 1.0 3.7 0.9 2.8 1.8 1.8 0.8
12 2.0 1.0 0.9 3.5 0.9 2.7 1.8 1.7
PK-5 14.0 15.4 17.7 17.3 18.6 20.6 20.3 20.0
6-8 6.0 6.8 4.7 6.4 6.1 6.1 5.8 7.2
9-12 8.0 6.8 8.7 9.3 7.5 7.2 8.0 7.6
PK-12 28.0 29.0 31.1 33.0 32.2 33.9 34.1 34.8

SY2019/20 Demographic Report
178
Study Area 319 Projection Date 10/2/2019
CURRENT PROJECTED RESIDENT STUDENTS
2019 2020 2021 2022 2023 2024 2025 2026
PK 1.0 1.0 0.9 0.9 0.9 0.9 0.9 0.9
K 5.0 4.8 4.5 4.7 4.2 4.5 4.5 4.4
1 4.0 4.8 4.5 4.2 4.5 4.0 4.2 4.2
2 7.0 4.1 4.8 4.6 4.3 4.6 4.1 4.3
3 6.0 6.7 3.9 4.7 4.4 4.1 4.4 3.9
4 7.0 5.8 6.5 3.8 4.5 4.3 4.0 4.2
5 2.0 6.7 5.6 6.3 3.6 4.3 4.1 3.9
6 4.0 1.9 6.5 5.4 6.0 3.5 4.2 4.0
7 5.0 3.9 1.9 6.3 5.2 5.8 3.4 4.0
8 5.0 5.0 3.9 1.9 6.3 5.2 5.8 3.4
9 3.0 5.1 5.1 4.0 1.9 6.4 5.3 5.9
10 10.0 2.9 4.9 4.9 3.8 1.8 6.1 5.1
11 4.0 9.6 2.8 4.7 4.7 3.6 1.8 5.9
12 9.0 3.8 9.2 2.7 4.5 4.5 3.5 1.7
PK-5 32.0 33.9 30.7 29.2 26.4 26.7 26.2 25.8
6-8 14.0 10.8 12.3 13.6 17.5 14.5 13.4 11.4
9-12 26.0 21.4 22.0 16.3 14.9 16.3 16.7 18.6
PK-12 72.0 66.1 65.0 59.1 58.8 57.5 56.3 55.8
Study Area 320 Projection Date 10/2/2019
CURRENT PROJECTED RESIDENT STUDENTS
2019 2020 2021 2022 2023 2024 2025 2026
PK 1.0 1.0 0.9 0.9 0.9 0.9 0.9 0.9
K 0.0 0.0 0.0 0.0 0.0 0.0 0.0 0.0
1 2.0 0.0 0.0 0.0 0.0 0.0 0.0 0.0
2 0.0 2.0 0.0 0.0 0.0 0.0 0.0 0.0
3 0.0 0.0 2.0 0.0 0.0 0.0 0.0 0.0
4 1.0 0.0 0.0 1.9 0.0 0.0 0.0 0.0
5 3.0 1.0 0.0 0.0 1.8 0.0 0.0 0.0
6 0.0 2.9 0.9 0.0 0.0 1.8 0.0 0.0
7 3.0 0.0 2.8 0.9 0.0 0.0 1.7 0.0
8 1.0 3.0 0.0 2.8 0.9 0.0 0.0 1.7
9 3.0 1.0 3.1 0.0 2.8 0.9 0.0 0.0
10 2.0 2.9 1.0 2.9 0.0 2.7 0.9 0.0
11 2.0 1.9 2.8 0.9 2.8 0.0 2.6 0.8
12 1.0 1.9 1.8 2.7 0.9 2.7 0.0 2.5
PK-5 7.0 4.0 2.9 2.8 2.7 0.9 0.9 0.9
6-8 4.0 5.9 3.7 3.7 0.9 1.8 1.7 1.7
9-12 8.0 7.7 8.7 6.5 6.5 6.3 3.5 3.3
PK-12 19.0 17.6 15.3 13.0 10.1 9.0 6.1 5.9
Study Area 321 Projection Date 10/2/2019
CURRENT PROJECTED RESIDENT STUDENTS
2019 2020 2021 2022 2023 2024 2025 2026
PK 0.0 0.0 0.0 0.0 0.0 0.0 0.0 0.0
K 1.0 1.0 0.9 0.9 0.8 0.9 0.9 0.9
1 1.0 0.9 0.9 0.8 0.9 0.8 0.8 0.8
2 0.0 1.0 1.0 0.9 0.9 0.9 0.8 0.9
3 1.0 0.0 1.0 0.9 0.9 0.8 0.9 0.8
4 1.0 1.0 0.0 0.9 0.9 0.9 0.8 0.8
5 0.0 1.0 0.9 0.0 0.9 0.9 0.8 0.8
6 0.0 0.0 0.9 0.9 0.0 0.9 0.8 0.8
7 1.0 0.0 0.0 0.9 0.9 0.0 0.8 0.8
8 0.0 1.0 0.0 0.0 0.9 0.9 0.0 0.8
9 0.0 0.0 1.0 0.0 0.0 0.9 0.9 0.0
10 1.0 0.0 0.0 1.0 0.0 0.0 0.9 0.8
11 1.0 1.0 0.0 0.0 0.9 0.0 0.0 0.8
12 0.0 1.0 0.9 0.0 0.0 0.9 0.0 0.0
PK-5 4.0 4.9 4.7 4.4 5.3 5.2 5.0 5.0
6-8 1.0 1.0 0.9 1.8 1.8 1.8 1.6 2.4
9-12 2.0 2.0 1.9 1.0 0.9 1.8 1.8 1.6
PK-12 7.0 7.9 7.5 7.2 8.0 8.8 8.4 9.0

SY2019/20 Demographic Report
179
Study Area 322 Projection Date 10/2/2019
CURRENT PROJECTED RESIDENT STUDENTS
2019 2020 2021 2022 2023 2024 2025 2026
PK 1.0 1.0 0.9 0.9 0.9 0.9 0.9 0.9
K 4.0 3.8 3.6 3.8 3.4 3.6 3.6 3.5
1 1.0 3.8 3.6 3.4 3.6 3.2 3.4 3.4
2 7.0 1.0 3.9 3.7 3.5 3.6 3.3 3.5
3 3.0 6.7 1.0 3.7 3.6 3.3 3.5 3.1
4 7.0 2.9 6.5 0.9 3.6 3.4 3.2 3.4
5 2.0 6.7 2.8 6.3 0.9 3.5 3.3 3.1
6 4.0 1.9 6.5 2.7 6.0 0.9 3.3 3.2
7 6.0 3.9 1.9 6.3 2.6 5.8 0.8 3.2
8 3.0 6.0 3.9 1.9 6.3 2.6 5.8 0.8
9 6.0 3.1 6.1 4.0 1.9 6.4 2.7 5.9
10 4.0 5.8 2.9 5.9 3.8 1.8 6.1 2.5
11 4.0 3.8 5.5 2.8 5.6 3.6 1.8 5.9
12 6.0 3.8 3.7 5.3 2.7 5.4 3.5 1.7
PK-5 25.0 25.9 22.3 22.7 19.5 21.5 21.2 20.9
6-8 13.0 11.8 12.3 10.9 14.9 9.3 9.9 7.2
9-12 20.0 16.5 18.2 18.0 14.0 17.2 14.1 16.0
PK-12 58.0 54.2 52.8 51.6 48.4 48.0 45.2 44.1
Study Area 323 Projection Date 10/2/2019
CURRENT PROJECTED RESIDENT STUDENTS
2019 2020 2021 2022 2023 2024 2025 2026
PK 1.0 1.0 0.9 0.9 0.9 0.9 0.9 0.9
K 2.0 1.9 1.8 1.9 1.7 1.8 1.8 1.7
1 3.0 1.9 1.8 1.7 1.8 1.6 1.7 1.7
2 2.0 3.1 1.9 1.8 1.7 1.8 1.6 1.7
3 2.0 1.9 2.9 1.9 1.8 1.7 1.7 1.6
4 2.0 1.9 1.9 2.8 1.8 1.7 1.6 1.7
5 3.0 1.9 1.9 1.8 2.7 1.7 1.7 1.5
6 1.0 2.9 1.8 1.8 1.7 2.6 1.7 1.6
7 3.0 1.0 2.8 1.8 1.7 1.7 2.5 1.6
8 0.0 3.0 1.0 2.8 1.8 1.7 1.7 2.5
9 2.0 0.0 3.1 1.0 2.8 1.8 1.8 1.7
10 3.0 1.9 0.0 2.9 0.9 2.7 1.8 1.7
11 1.0 2.9 1.8 0.0 2.8 0.9 2.6 1.7
12 2.0 1.0 2.8 1.8 0.0 2.7 0.9 2.5
PK-5 15.0 13.6 13.1 12.8 12.4 11.2 11.0 10.8
6-8 4.0 6.9 5.6 6.4 5.2 6.0 5.9 5.7
9-12 8.0 5.8 7.7 5.7 6.5 8.1 7.1 7.6
PK-12 27.0 26.3 26.4 24.9 24.1 25.3 24.0 24.1
Study Area 324 Projection Date 10/2/2019
CURRENT PROJECTED RESIDENT STUDENTS
2019 2020 2021 2022 2023 2024 2025 2026
PK 0.0 0.0 0.0 0.0 0.0 0.0 0.0 0.0
K 0.0 0.0 0.0 0.0 0.0 0.0 0.0 0.0
1 1.0 0.0 0.0 0.0 0.0 0.0 0.0 0.0
2 0.0 1.0 0.0 0.0 0.0 0.0 0.0 0.0
3 0.0 0.0 1.0 0.0 0.0 0.0 0.0 0.0
4 1.0 0.0 0.0 0.9 0.0 0.0 0.0 0.0
5 0.0 1.0 0.0 0.0 0.9 0.0 0.0 0.0
6 2.0 0.0 0.9 0.0 0.0 0.9 0.0 0.0
7 0.0 1.9 0.0 0.9 0.0 0.0 0.8 0.0
8 1.0 0.0 1.9 0.0 0.9 0.0 0.0 0.8
9 1.0 1.0 0.0 2.0 0.0 0.9 0.0 0.0
10 3.0 1.0 1.0 0.0 1.9 0.0 0.9 0.0
11 1.0 2.9 0.9 0.9 0.0 1.8 0.0 0.8
12 3.0 1.0 2.8 0.9 0.9 0.0 1.8 0.0
PK-5 2.0 2.0 1.0 0.9 0.9 0.0 0.0 0.0
6-8 3.0 1.9 2.8 0.9 0.9 0.9 0.8 0.8
9-12 8.0 5.9 4.7 3.8 2.8 2.7 2.7 0.8
PK-12 13.0 9.8 8.5 5.6 4.6 3.6 3.5 1.6
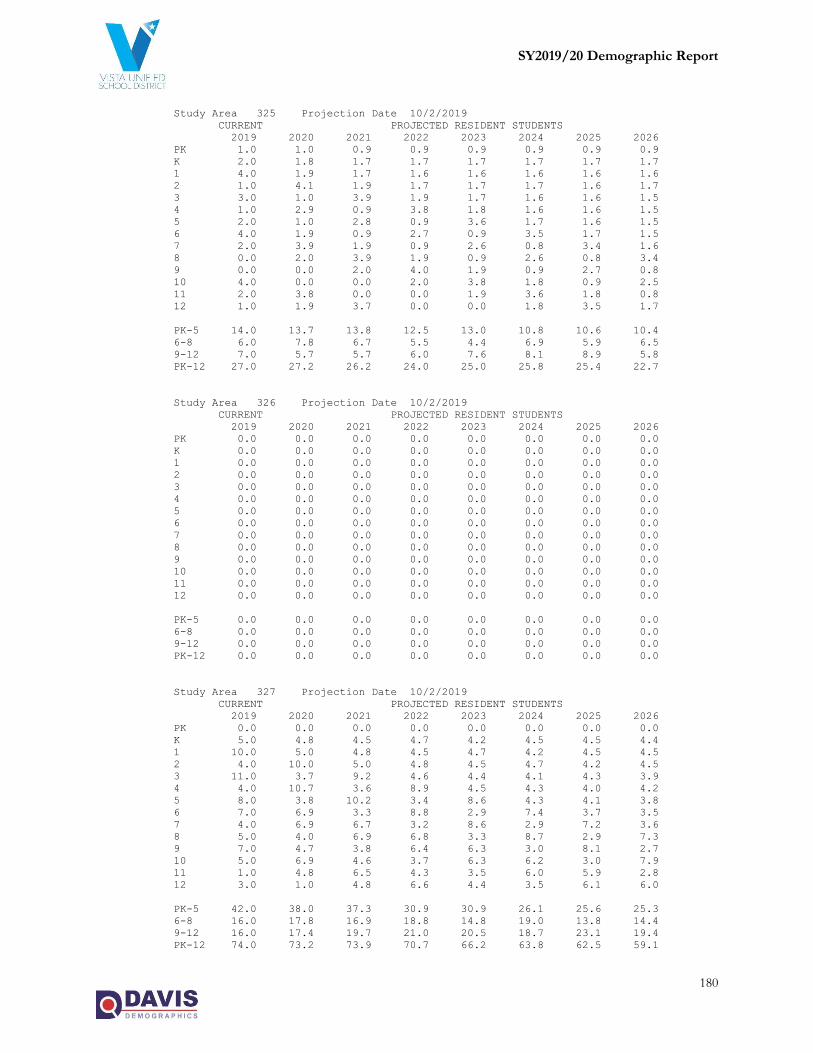
SY2019/20 Demographic Report
180
Study Area 325 Projection Date 10/2/2019
CURRENT PROJECTED RESIDENT STUDENTS
2019 2020 2021 2022 2023 2024 2025 2026
PK 1.0 1.0 0.9 0.9 0.9 0.9 0.9 0.9
K 2.0 1.8 1.7 1.7 1.7 1.7 1.7 1.7
1 4.0 1.9 1.7 1.6 1.6 1.6 1.6 1.6
2 1.0 4.1 1.9 1.7 1.7 1.7 1.6 1.7
3 3.0 1.0 3.9 1.9 1.7 1.6 1.6 1.5
4 1.0 2.9 0.9 3.8 1.8 1.6 1.6 1.5
5 2.0 1.0 2.8 0.9 3.6 1.7 1.6 1.5
6 4.0 1.9 0.9 2.7 0.9 3.5 1.7 1.5
7 2.0 3.9 1.9 0.9 2.6 0.8 3.4 1.6
8 0.0 2.0 3.9 1.9 0.9 2.6 0.8 3.4
9 0.0 0.0 2.0 4.0 1.9 0.9 2.7 0.8
10 4.0 0.0 0.0 2.0 3.8 1.8 0.9 2.5
11 2.0 3.8 0.0 0.0 1.9 3.6 1.8 0.8
12 1.0 1.9 3.7 0.0 0.0 1.8 3.5 1.7
PK-5 14.0 13.7 13.8 12.5 13.0 10.8 10.6 10.4
6-8 6.0 7.8 6.7 5.5 4.4 6.9 5.9 6.5
9-12 7.0 5.7 5.7 6.0 7.6 8.1 8.9 5.8
PK-12 27.0 27.2 26.2 24.0 25.0 25.8 25.4 22.7
Study Area 326 Projection Date 10/2/2019
CURRENT PROJECTED RESIDENT STUDENTS
2019 2020 2021 2022 2023 2024 2025 2026
PK 0.0 0.0 0.0 0.0 0.0 0.0 0.0 0.0
K 0.0 0.0 0.0 0.0 0.0 0.0 0.0 0.0
1 0.0 0.0 0.0 0.0 0.0 0.0 0.0 0.0
2 0.0 0.0 0.0 0.0 0.0 0.0 0.0 0.0
3 0.0 0.0 0.0 0.0 0.0 0.0 0.0 0.0
4 0.0 0.0 0.0 0.0 0.0 0.0 0.0 0.0
5 0.0 0.0 0.0 0.0 0.0 0.0 0.0 0.0
6 0.0 0.0 0.0 0.0 0.0 0.0 0.0 0.0
7 0.0 0.0 0.0 0.0 0.0 0.0 0.0 0.0
8 0.0 0.0 0.0 0.0 0.0 0.0 0.0 0.0
9 0.0 0.0 0.0 0.0 0.0 0.0 0.0 0.0
10 0.0 0.0 0.0 0.0 0.0 0.0 0.0 0.0
11 0.0 0.0 0.0 0.0 0.0 0.0 0.0 0.0
12 0.0 0.0 0.0 0.0 0.0 0.0 0.0 0.0
PK-5 0.0 0.0 0.0 0.0 0.0 0.0 0.0 0.0
6-8 0.0 0.0 0.0 0.0 0.0 0.0 0.0 0.0
9-12 0.0 0.0 0.0 0.0 0.0 0.0 0.0 0.0
PK-12 0.0 0.0 0.0 0.0 0.0 0.0 0.0 0.0
Study Area 327 Projection Date 10/2/2019
CURRENT PROJECTED RESIDENT STUDENTS
2019 2020 2021 2022 2023 2024 2025 2026
PK 0.0 0.0 0.0 0.0 0.0 0.0 0.0 0.0
K 5.0 4.8 4.5 4.7 4.2 4.5 4.5 4.4
1 10.0 5.0 4.8 4.5 4.7 4.2 4.5 4.5
2 4.0 10.0 5.0 4.8 4.5 4.7 4.2 4.5
3 11.0 3.7 9.2 4.6 4.4 4.1 4.3 3.9
4 4.0 10.7 3.6 8.9 4.5 4.3 4.0 4.2
5 8.0 3.8 10.2 3.4 8.6 4.3 4.1 3.8
6 7.0 6.9 3.3 8.8 2.9 7.4 3.7 3.5
7 4.0 6.9 6.7 3.2 8.6 2.9 7.2 3.6
8 5.0 4.0 6.9 6.8 3.3 8.7 2.9 7.3
9 7.0 4.7 3.8 6.4 6.3 3.0 8.1 2.7
10 5.0 6.9 4.6 3.7 6.3 6.2 3.0 7.9
11 1.0 4.8 6.5 4.3 3.5 6.0 5.9 2.8
12 3.0 1.0 4.8 6.6 4.4 3.5 6.1 6.0
PK-5 42.0 38.0 37.3 30.9 30.9 26.1 25.6 25.3
6-8 16.0 17.8 16.9 18.8 14.8 19.0 13.8 14.4
9-12 16.0 17.4 19.7 21.0 20.5 18.7 23.1 19.4
PK-12 74.0 73.2 73.9 70.7 66.2 63.8 62.5 59.1

SY2019/20 Demographic Report
181
Study Area 328 Projection Date 10/2/2019
CURRENT PROJECTED RESIDENT STUDENTS
2019 2020 2021 2022 2023 2024 2025 2026
PK 2.0 1.9 1.9 1.8 1.9 1.8 1.8 1.8
K 2.0 1.9 1.8 1.9 1.7 1.8 1.8 1.7
1 6.0 2.0 1.9 1.8 1.9 1.7 1.8 1.8
2 6.0 6.0 2.0 1.9 1.8 1.9 1.7 1.8
3 11.0 5.5 5.5 1.8 1.8 1.6 1.7 1.6
4 6.0 10.7 5.4 5.4 1.8 1.7 1.6 1.7
5 9.0 5.8 10.2 5.1 5.1 1.7 1.6 1.5
6 8.0 7.7 5.0 8.8 4.4 4.4 1.5 1.4
7 10.0 7.8 7.6 4.9 8.6 4.3 4.3 1.4
8 7.0 10.1 7.9 7.7 4.9 8.7 4.4 4.4
9 3.0 6.5 9.4 7.4 7.1 4.6 8.1 4.1
10 9.0 2.9 6.4 9.2 7.2 7.0 4.5 7.9
11 5.0 8.6 2.8 6.1 8.7 6.9 6.6 4.2
12 7.0 5.1 8.6 2.8 6.1 8.8 6.9 6.7
PK-5 42.0 33.8 28.7 19.7 16.0 12.2 12.0 11.9
6-8 25.0 25.6 20.5 21.4 17.9 17.4 10.2 7.2
9-12 24.0 23.1 27.2 25.5 29.1 27.3 26.1 22.9
PK-12 91.0 82.5 76.4 66.6 63.0 56.9 48.3 42.0
Study Area 329 Projection Date 10/2/2019
CURRENT PROJECTED RESIDENT STUDENTS
2019 2020 2021 2022 2023 2024 2025 2026
PK 0.0 0.0 0.0 0.0 0.0 0.0 0.0 0.0
K 3.0 2.9 2.7 2.8 2.5 2.7 2.7 2.6
1 3.0 3.0 2.9 2.7 2.8 2.5 2.7 2.7
2 4.0 3.0 3.0 2.9 2.7 2.8 2.5 2.7
3 3.0 3.7 2.8 2.8 2.6 2.5 2.6 2.3
4 3.0 2.9 3.6 2.7 2.7 2.6 2.4 2.5
5 6.0 2.9 2.8 3.4 2.6 2.6 2.5 2.3
6 2.0 5.2 2.5 2.4 2.9 2.2 2.2 2.1
7 1.0 2.0 5.1 2.4 2.4 2.9 2.2 2.2
8 6.0 1.0 2.0 5.1 2.5 2.4 2.9 2.2
9 5.0 5.6 0.9 1.8 4.7 2.3 2.2 2.7
10 3.0 4.9 5.5 0.9 1.8 4.7 2.2 2.2
11 2.0 2.8 4.7 5.2 0.9 1.7 4.4 2.1
12 5.0 2.0 2.9 4.7 5.2 0.9 1.7 4.5
PK-5 22.0 18.4 17.8 17.3 15.9 15.7 15.4 15.1
6-8 9.0 8.2 9.6 9.9 7.8 7.5 7.3 6.5
9-12 15.0 15.3 14.0 12.6 12.6 9.6 10.5 11.5
PK-12 46.0 41.9 41.4 39.8 36.3 32.8 33.2 33.1
Study Area 330 Projection Date 10/2/2019
CURRENT PROJECTED RESIDENT STUDENTS
2019 2020 2021 2022 2023 2024 2025 2026
PK 3.0 2.9 2.8 2.7 2.8 2.8 2.8 2.8
K 5.0 4.8 4.5 4.7 4.2 4.5 4.5 4.4
1 5.0 5.0 4.8 4.5 4.7 4.2 4.5 4.5
2 8.0 5.0 5.0 4.8 4.5 4.7 4.2 4.5
3 7.0 7.4 4.6 4.6 4.4 4.1 4.3 3.9
4 8.0 6.8 7.1 4.5 4.5 4.3 4.0 4.2
5 10.0 7.7 6.5 6.9 4.3 4.3 4.1 3.8
6 5.0 8.6 6.6 5.6 5.9 3.7 3.7 3.5
7 13.0 4.9 8.4 6.5 5.5 5.8 3.6 3.6
8 10.0 13.1 4.9 8.5 6.5 5.5 5.8 3.6
9 5.0 9.3 12.2 4.6 7.9 6.1 5.2 5.4
10 6.0 4.9 9.1 12.0 4.5 7.8 6.0 5.1
11 4.0 5.7 4.7 8.7 11.4 4.3 7.4 5.7
12 8.0 4.0 5.8 4.7 8.7 11.5 4.3 7.4
PK-5 46.0 39.6 35.3 32.7 29.4 28.9 28.4 28.1
6-8 28.0 26.6 19.9 20.6 17.9 15.0 13.1 10.7
9-12 23.0 23.9 31.8 30.0 32.5 29.7 22.9 23.6
PK-12 97.0 90.1 87.0 83.3 79.8 73.6 64.4 62.4

SY2019/20 Demographic Report
182
Study Area 331 Projection Date 10/2/2019
CURRENT PROJECTED RESIDENT STUDENTS
2019 2020 2021 2022 2023 2024 2025 2026
PK 0.0 0.0 0.0 0.0 0.0 0.0 0.0 0.0
K 8.0 7.6 7.1 7.5 6.7 7.1 7.1 7.0
1 7.0 8.0 7.6 7.1 7.5 6.7 7.1 7.1
2 11.0 7.0 8.0 7.6 7.1 7.5 6.7 7.1
3 8.0 10.1 6.4 7.4 7.0 6.6 6.9 6.2
4 5.0 7.8 9.8 6.2 7.1 6.8 6.4 6.7
5 8.0 4.8 7.4 9.4 6.0 6.9 6.5 6.1
6 5.0 6.9 4.1 6.4 8.1 5.2 5.9 5.6
7 7.0 4.9 6.7 4.0 6.3 7.9 5.1 5.8
8 6.0 7.1 4.9 6.8 4.1 6.3 8.0 5.1
9 2.0 5.6 6.6 4.6 6.3 3.8 5.9 7.5
10 7.0 2.0 5.5 6.4 4.5 6.2 3.7 5.8
11 4.0 6.7 1.9 5.2 6.1 4.3 5.9 3.5
12 1.0 4.0 6.7 1.9 5.2 6.2 4.3 6.0
PK-5 47.0 45.3 46.3 45.2 41.4 41.6 40.7 40.2
6-8 18.0 18.9 15.7 17.2 18.5 19.4 19.0 16.5
9-12 14.0 18.3 20.7 18.1 22.1 20.5 19.8 22.8
PK-12 79.0 82.5 82.7 80.5 82.0 81.5 79.5 79.5
Study Area 332 Projection Date 10/2/2019
CURRENT PROJECTED RESIDENT STUDENTS
2019 2020 2021 2022 2023 2024 2025 2026
PK 0.0 0.0 0.0 0.0 0.0 0.0 0.0 0.0
K 4.0 3.8 3.6 3.8 3.4 3.6 3.6 3.5
1 3.0 4.0 3.8 3.6 3.8 3.4 3.6 3.6
2 3.0 3.0 4.0 3.8 3.6 3.8 3.4 3.6
3 1.0 2.8 2.8 3.7 3.5 3.3 3.5 3.1
4 3.0 1.0 2.7 2.7 3.6 3.4 3.2 3.4
5 3.0 2.9 0.9 2.6 2.6 3.4 3.3 3.1
6 1.0 2.6 2.5 0.8 2.2 2.2 2.9 2.8
7 1.0 1.0 2.5 2.4 0.8 2.2 2.2 2.9
8 3.0 1.0 1.0 2.6 2.5 0.8 2.2 2.2
9 2.0 2.8 0.9 0.9 2.4 2.3 0.7 2.0
10 0.0 2.0 2.7 0.9 0.9 2.3 2.2 0.7
11 2.0 0.0 1.9 2.6 0.9 0.9 2.2 2.1
12 3.0 2.0 0.0 1.9 2.6 0.9 0.9 2.2
PK-5 17.0 17.5 17.8 20.2 20.5 20.9 20.6 20.3
6-8 5.0 4.6 6.0 5.8 5.5 5.2 7.3 7.9
9-12 7.0 6.8 5.5 6.3 6.8 6.4 6.0 7.0
PK-12 29.0 28.9 29.3 32.3 32.8 32.5 33.9 35.2
Study Area 333 Projection Date 10/2/2019
CURRENT PROJECTED RESIDENT STUDENTS
2019 2020 2021 2022 2023 2024 2025 2026
PK 0.0 0.0 0.0 0.0 0.0 0.0 0.0 0.0
K 4.0 3.8 3.6 3.8 3.4 3.6 3.6 3.5
1 5.0 4.0 3.8 3.6 3.8 3.4 3.6 3.6
2 4.0 5.0 4.0 3.8 3.6 3.8 3.4 3.6
3 2.0 3.7 4.6 3.7 3.5 3.3 3.5 3.1
4 7.0 1.9 3.6 4.5 3.6 3.4 3.2 3.4
5 1.0 6.7 1.9 3.4 4.3 3.4 3.3 3.1
6 2.0 0.9 5.8 1.6 2.9 3.7 2.9 2.8
7 3.0 2.0 0.8 5.7 1.6 2.9 3.6 2.9
8 5.0 3.0 2.0 0.9 5.7 1.6 2.9 3.6
9 8.0 4.7 2.8 1.8 0.8 5.3 1.5 2.7
10 1.0 7.8 4.6 2.8 1.8 0.8 5.2 1.4
11 3.0 0.9 7.4 4.3 2.6 1.7 0.7 5.0
12 7.0 3.0 1.0 7.5 4.4 2.6 1.7 0.7
PK-5 23.0 25.1 21.5 22.8 22.2 20.9 20.6 20.3
6-8 10.0 5.9 8.6 8.2 10.2 8.2 9.4 9.3
9-12 19.0 16.4 15.8 16.4 9.6 10.4 9.1 9.8
PK-12 52.0 47.4 45.9 47.4 42.0 39.5 39.1 39.4
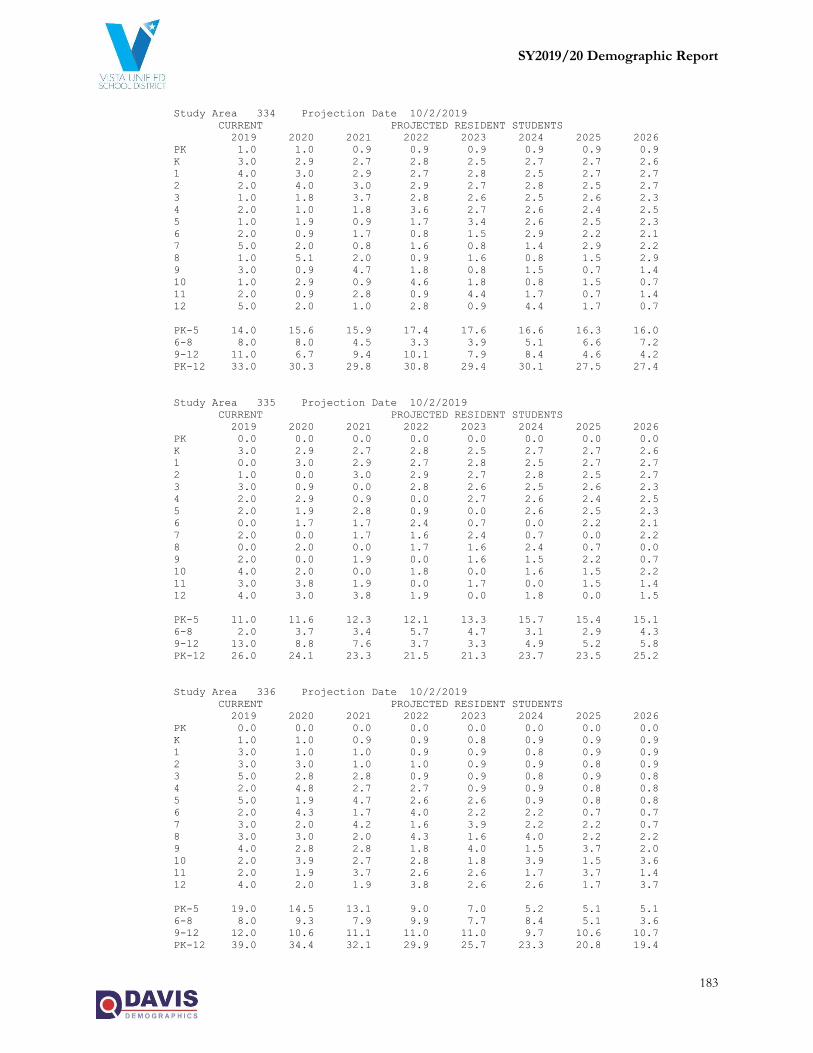
SY2019/20 Demographic Report
183
Study Area 334 Projection Date 10/2/2019
CURRENT PROJECTED RESIDENT STUDENTS
2019 2020 2021 2022 2023 2024 2025 2026
PK 1.0 1.0 0.9 0.9 0.9 0.9 0.9 0.9
K 3.0 2.9 2.7 2.8 2.5 2.7 2.7 2.6
1 4.0 3.0 2.9 2.7 2.8 2.5 2.7 2.7
2 2.0 4.0 3.0 2.9 2.7 2.8 2.5 2.7
3 1.0 1.8 3.7 2.8 2.6 2.5 2.6 2.3
4 2.0 1.0 1.8 3.6 2.7 2.6 2.4 2.5
5 1.0 1.9 0.9 1.7 3.4 2.6 2.5 2.3
6 2.0 0.9 1.7 0.8 1.5 2.9 2.2 2.1
7 5.0 2.0 0.8 1.6 0.8 1.4 2.9 2.2
8 1.0 5.1 2.0 0.9 1.6 0.8 1.5 2.9
9 3.0 0.9 4.7 1.8 0.8 1.5 0.7 1.4
10 1.0 2.9 0.9 4.6 1.8 0.8 1.5 0.7
11 2.0 0.9 2.8 0.9 4.4 1.7 0.7 1.4
12 5.0 2.0 1.0 2.8 0.9 4.4 1.7 0.7
PK-5 14.0 15.6 15.9 17.4 17.6 16.6 16.3 16.0
6-8 8.0 8.0 4.5 3.3 3.9 5.1 6.6 7.2
9-12 11.0 6.7 9.4 10.1 7.9 8.4 4.6 4.2
PK-12 33.0 30.3 29.8 30.8 29.4 30.1 27.5 27.4
Study Area 335 Projection Date 10/2/2019
CURRENT PROJECTED RESIDENT STUDENTS
2019 2020 2021 2022 2023 2024 2025 2026
PK 0.0 0.0 0.0 0.0 0.0 0.0 0.0 0.0
K 3.0 2.9 2.7 2.8 2.5 2.7 2.7 2.6
1 0.0 3.0 2.9 2.7 2.8 2.5 2.7 2.7
2 1.0 0.0 3.0 2.9 2.7 2.8 2.5 2.7
3 3.0 0.9 0.0 2.8 2.6 2.5 2.6 2.3
4 2.0 2.9 0.9 0.0 2.7 2.6 2.4 2.5
5 2.0 1.9 2.8 0.9 0.0 2.6 2.5 2.3
6 0.0 1.7 1.7 2.4 0.7 0.0 2.2 2.1
7 2.0 0.0 1.7 1.6 2.4 0.7 0.0 2.2
8 0.0 2.0 0.0 1.7 1.6 2.4 0.7 0.0
9 2.0 0.0 1.9 0.0 1.6 1.5 2.2 0.7
10 4.0 2.0 0.0 1.8 0.0 1.6 1.5 2.2
11 3.0 3.8 1.9 0.0 1.7 0.0 1.5 1.4
12 4.0 3.0 3.8 1.9 0.0 1.8 0.0 1.5
PK-5 11.0 11.6 12.3 12.1 13.3 15.7 15.4 15.1
6-8 2.0 3.7 3.4 5.7 4.7 3.1 2.9 4.3
9-12 13.0 8.8 7.6 3.7 3.3 4.9 5.2 5.8
PK-12 26.0 24.1 23.3 21.5 21.3 23.7 23.5 25.2
Study Area 336 Projection Date 10/2/2019
CURRENT PROJECTED RESIDENT STUDENTS
2019 2020 2021 2022 2023 2024 2025 2026
PK 0.0 0.0 0.0 0.0 0.0 0.0 0.0 0.0
K 1.0 1.0 0.9 0.9 0.8 0.9 0.9 0.9
1 3.0 1.0 1.0 0.9 0.9 0.8 0.9 0.9
2 3.0 3.0 1.0 1.0 0.9 0.9 0.8 0.9
3 5.0 2.8 2.8 0.9 0.9 0.8 0.9 0.8
4 2.0 4.8 2.7 2.7 0.9 0.9 0.8 0.8
5 5.0 1.9 4.7 2.6 2.6 0.9 0.8 0.8
6 2.0 4.3 1.7 4.0 2.2 2.2 0.7 0.7
7 3.0 2.0 4.2 1.6 3.9 2.2 2.2 0.7
8 3.0 3.0 2.0 4.3 1.6 4.0 2.2 2.2
9 4.0 2.8 2.8 1.8 4.0 1.5 3.7 2.0
10 2.0 3.9 2.7 2.8 1.8 3.9 1.5 3.6
11 2.0 1.9 3.7 2.6 2.6 1.7 3.7 1.4
12 4.0 2.0 1.9 3.8 2.6 2.6 1.7 3.7
PK-5 19.0 14.5 13.1 9.0 7.0 5.2 5.1 5.1
6-8 8.0 9.3 7.9 9.9 7.7 8.4 5.1 3.6
9-12 12.0 10.6 11.1 11.0 11.0 9.7 10.6 10.7
PK-12 39.0 34.4 32.1 29.9 25.7 23.3 20.8 19.4

SY2019/20 Demographic Report
184
Study Area 337 Projection Date 10/2/2019
CURRENT PROJECTED RESIDENT STUDENTS
2019 2020 2021 2022 2023 2024 2025 2026
PK 0.0 0.0 0.0 0.0 0.0 0.0 0.0 0.0
K 6.0 5.7 5.3 5.6 5.1 5.3 5.3 5.2
1 8.0 6.0 5.7 5.3 5.6 5.1 5.3 5.3
2 7.0 8.0 6.0 5.7 5.3 5.6 5.1 5.3
3 4.0 6.4 7.4 5.5 5.3 4.9 5.2 4.7
4 9.0 3.9 6.2 7.1 5.4 5.1 4.8 5.0
5 7.0 8.6 3.7 6.0 6.9 5.1 4.9 4.6
6 3.0 6.0 7.4 3.2 5.2 5.9 4.4 4.2
7 6.0 2.9 5.9 7.3 3.1 5.1 5.8 4.3
8 6.0 6.1 3.0 6.0 7.4 3.2 5.1 5.8
9 11.0 5.6 5.6 2.8 5.5 6.8 2.9 4.7
10 9.0 10.8 5.5 5.5 2.7 5.4 6.7 2.9
11 6.0 8.6 10.2 5.2 5.2 2.6 5.2 6.4
12 6.0 6.1 8.6 10.3 5.2 5.3 2.6 5.2
PK-5 41.0 38.6 34.3 35.2 33.6 31.1 30.6 30.1
6-8 15.0 15.0 16.3 16.5 15.7 14.2 15.3 14.3
9-12 32.0 31.1 29.9 23.8 18.6 20.1 17.4 19.2
PK-12 88.0 84.7 80.5 75.5 67.9 65.4 63.3 63.6
Study Area 338 Projection Date 10/2/2019
CURRENT PROJECTED RESIDENT STUDENTS
2019 2020 2021 2022 2023 2024 2025 2026
PK 0.0 0.0 0.0 0.0 0.0 0.0 0.0 0.0
K 3.0 2.9 2.7 2.8 2.5 2.7 2.7 2.6
1 6.0 3.0 2.9 2.7 2.8 2.5 2.7 2.7
2 8.0 6.0 3.0 2.9 2.7 2.8 2.5 2.7
3 9.0 7.4 5.5 2.8 2.6 2.5 2.6 2.3
4 8.0 8.7 7.1 5.4 2.7 2.6 2.4 2.5
5 5.0 7.7 8.4 6.9 5.1 2.6 2.5 2.3
6 8.0 4.3 6.6 7.2 5.9 4.4 2.2 2.1
7 6.0 7.8 4.2 6.5 7.1 5.8 4.3 2.2
8 9.0 6.1 7.9 4.3 6.5 7.1 5.8 4.4
9 10.0 8.4 5.6 7.4 4.0 6.1 6.6 5.4
10 8.0 9.8 8.2 5.5 7.2 3.9 6.0 6.5
11 7.0 7.6 9.3 7.8 5.2 6.9 3.7 5.7
12 5.0 7.1 7.7 9.4 7.9 5.3 6.9 3.7
PK-5 39.0 35.7 29.6 23.5 18.4 15.7 15.4 15.1
6-8 23.0 18.2 18.7 18.0 19.5 17.3 12.3 8.7
9-12 30.0 32.9 30.8 30.1 24.3 22.2 23.2 21.3
PK-12 92.0 86.8 79.1 71.6 62.2 55.2 50.9 45.1
Study Area 339 Projection Date 10/2/2019
CURRENT PROJECTED RESIDENT STUDENTS
2019 2020 2021 2022 2023 2024 2025 2026
PK 1.0 1.0 0.9 0.9 0.9 0.9 0.9 0.9
K 4.0 3.8 3.6 3.8 3.4 3.6 3.6 3.5
1 3.0 4.0 3.8 3.6 3.8 3.4 3.6 3.6
2 5.0 3.0 4.0 3.8 3.6 3.8 3.4 3.6
3 4.0 4.6 2.8 3.7 3.5 3.3 3.5 3.1
4 4.0 3.9 4.5 2.7 3.6 3.4 3.2 3.4
5 9.0 3.8 3.7 4.3 2.6 3.4 3.3 3.1
6 8.0 7.7 3.3 3.2 3.7 2.2 2.9 2.8
7 6.0 7.8 7.6 3.2 3.1 3.6 2.2 2.9
8 7.0 6.1 7.9 7.7 3.3 3.2 3.6 2.2
9 5.0 6.5 5.6 7.4 7.1 3.0 2.9 3.4
10 4.0 4.9 6.4 5.5 7.2 7.0 3.0 2.9
11 8.0 3.8 4.7 6.1 5.2 6.9 6.6 2.8
12 3.0 8.1 3.8 4.7 6.1 5.3 6.9 6.7
PK-5 30.0 24.1 23.3 22.8 21.4 21.8 21.5 21.2
6-8 21.0 21.6 18.8 14.1 10.1 9.0 8.7 7.9
9-12 20.0 23.3 20.5 23.7 25.6 22.2 19.4 15.8
PK-12 71.0 69.0 62.6 60.6 57.1 53.0 49.6 44.9
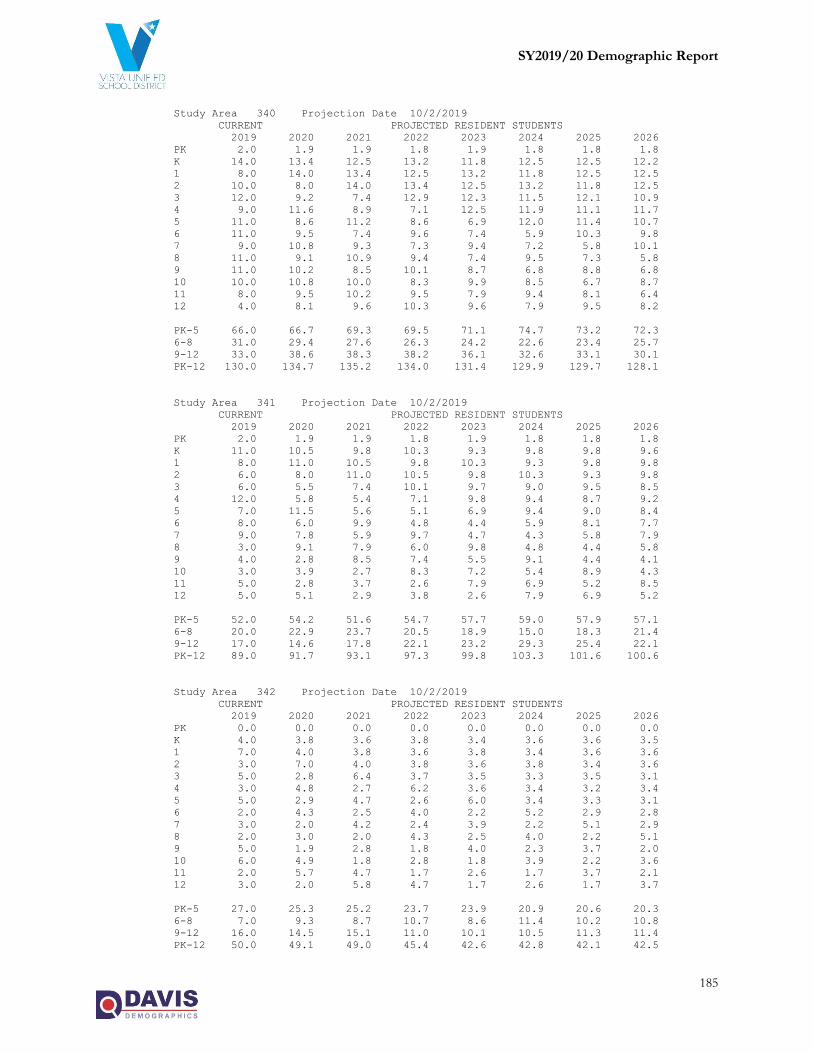
SY2019/20 Demographic Report
185
Study Area 340 Projection Date 10/2/2019
CURRENT PROJECTED RESIDENT STUDENTS
2019 2020 2021 2022 2023 2024 2025 2026
PK 2.0 1.9 1.9 1.8 1.9 1.8 1.8 1.8
K 14.0 13.4 12.5 13.2 11.8 12.5 12.5 12.2
1 8.0 14.0 13.4 12.5 13.2 11.8 12.5 12.5
2 10.0 8.0 14.0 13.4 12.5 13.2 11.8 12.5
3 12.0 9.2 7.4 12.9 12.3 11.5 12.1 10.9
4 9.0 11.6 8.9 7.1 12.5 11.9 11.1 11.7
5 11.0 8.6 11.2 8.6 6.9 12.0 11.4 10.7
6 11.0 9.5 7.4 9.6 7.4 5.9 10.3 9.8
7 9.0 10.8 9.3 7.3 9.4 7.2 5.8 10.1
8 11.0 9.1 10.9 9.4 7.4 9.5 7.3 5.8
9 11.0 10.2 8.5 10.1 8.7 6.8 8.8 6.8
10 10.0 10.8 10.0 8.3 9.9 8.5 6.7 8.7
11 8.0 9.5 10.2 9.5 7.9 9.4 8.1 6.4
12 4.0 8.1 9.6 10.3 9.6 7.9 9.5 8.2
PK-5 66.0 66.7 69.3 69.5 71.1 74.7 73.2 72.3
6-8 31.0 29.4 27.6 26.3 24.2 22.6 23.4 25.7
9-12 33.0 38.6 38.3 38.2 36.1 32.6 33.1 30.1
PK-12 130.0 134.7 135.2 134.0 131.4 129.9 129.7 128.1
Study Area 341 Projection Date 10/2/2019
CURRENT PROJECTED RESIDENT STUDENTS
2019 2020 2021 2022 2023 2024 2025 2026
PK 2.0 1.9 1.9 1.8 1.9 1.8 1.8 1.8
K 11.0 10.5 9.8 10.3 9.3 9.8 9.8 9.6
1 8.0 11.0 10.5 9.8 10.3 9.3 9.8 9.8
2 6.0 8.0 11.0 10.5 9.8 10.3 9.3 9.8
3 6.0 5.5 7.4 10.1 9.7 9.0 9.5 8.5
4 12.0 5.8 5.4 7.1 9.8 9.4 8.7 9.2
5 7.0 11.5 5.6 5.1 6.9 9.4 9.0 8.4
6 8.0 6.0 9.9 4.8 4.4 5.9 8.1 7.7
7 9.0 7.8 5.9 9.7 4.7 4.3 5.8 7.9
8 3.0 9.1 7.9 6.0 9.8 4.8 4.4 5.8
9 4.0 2.8 8.5 7.4 5.5 9.1 4.4 4.1
10 3.0 3.9 2.7 8.3 7.2 5.4 8.9 4.3
11 5.0 2.8 3.7 2.6 7.9 6.9 5.2 8.5
12 5.0 5.1 2.9 3.8 2.6 7.9 6.9 5.2
PK-5 52.0 54.2 51.6 54.7 57.7 59.0 57.9 57.1
6-8 20.0 22.9 23.7 20.5 18.9 15.0 18.3 21.4
9-12 17.0 14.6 17.8 22.1 23.2 29.3 25.4 22.1
PK-12 89.0 91.7 93.1 97.3 99.8 103.3 101.6 100.6
Study Area 342 Projection Date 10/2/2019
CURRENT PROJECTED RESIDENT STUDENTS
2019 2020 2021 2022 2023 2024 2025 2026
PK 0.0 0.0 0.0 0.0 0.0 0.0 0.0 0.0
K 4.0 3.8 3.6 3.8 3.4 3.6 3.6 3.5
1 7.0 4.0 3.8 3.6 3.8 3.4 3.6 3.6
2 3.0 7.0 4.0 3.8 3.6 3.8 3.4 3.6
3 5.0 2.8 6.4 3.7 3.5 3.3 3.5 3.1
4 3.0 4.8 2.7 6.2 3.6 3.4 3.2 3.4
5 5.0 2.9 4.7 2.6 6.0 3.4 3.3 3.1
6 2.0 4.3 2.5 4.0 2.2 5.2 2.9 2.8
7 3.0 2.0 4.2 2.4 3.9 2.2 5.1 2.9
8 2.0 3.0 2.0 4.3 2.5 4.0 2.2 5.1
9 5.0 1.9 2.8 1.8 4.0 2.3 3.7 2.0
10 6.0 4.9 1.8 2.8 1.8 3.9 2.2 3.6
11 2.0 5.7 4.7 1.7 2.6 1.7 3.7 2.1
12 3.0 2.0 5.8 4.7 1.7 2.6 1.7 3.7
PK-5 27.0 25.3 25.2 23.7 23.9 20.9 20.6 20.3
6-8 7.0 9.3 8.7 10.7 8.6 11.4 10.2 10.8
9-12 16.0 14.5 15.1 11.0 10.1 10.5 11.3 11.4
PK-12 50.0 49.1 49.0 45.4 42.6 42.8 42.1 42.5

SY2019/20 Demographic Report
186
Study Area 343 Projection Date 10/2/2019
CURRENT PROJECTED RESIDENT STUDENTS
2019 2020 2021 2022 2023 2024 2025 2026
PK 0.0 0.0 0.0 0.0 0.0 0.0 0.0 0.0
K 3.0 2.9 2.7 2.8 2.5 2.7 2.7 2.6
1 2.0 3.0 2.9 2.7 2.8 2.5 2.7 2.7
2 1.0 2.0 3.0 2.9 2.7 2.8 2.5 2.7
3 1.0 0.9 1.8 2.8 2.6 2.5 2.6 2.3
4 2.0 1.0 0.9 1.8 2.7 2.6 2.4 2.5
5 1.0 1.9 0.9 0.9 1.7 2.6 2.5 2.3
6 1.0 0.9 1.7 0.8 0.7 1.5 2.2 2.1
7 0.0 1.0 0.8 1.6 0.8 0.7 1.4 2.2
8 3.0 0.0 1.0 0.9 1.6 0.8 0.7 1.5
9 2.0 2.8 0.0 0.9 0.8 1.5 0.7 0.7
10 2.0 2.0 2.7 0.0 0.9 0.8 1.5 0.7
11 1.0 1.9 1.9 2.6 0.0 0.9 0.7 1.4
12 4.0 1.0 1.9 1.9 2.6 0.0 0.9 0.7
PK-5 10.0 11.7 12.2 13.9 15.0 15.7 15.4 15.1
6-8 4.0 1.9 3.5 3.3 3.1 3.0 4.3 5.8
9-12 9.0 7.7 6.5 5.4 4.3 3.2 3.8 3.5
PK-12 23.0 21.3 22.2 22.6 22.4 21.9 23.5 24.4
Study Area 344 Projection Date 10/2/2019
CURRENT PROJECTED RESIDENT STUDENTS
2019 2020 2021 2022 2023 2024 2025 2026
PK 0.0 0.0 0.0 0.0 0.0 0.0 0.0 0.0
K 6.0 5.7 5.3 5.6 5.1 5.3 5.3 5.2
1 6.0 6.0 5.7 5.3 5.6 5.1 5.3 5.3
2 7.0 6.0 6.0 5.7 5.3 5.6 5.1 5.3
3 13.0 6.4 5.5 5.5 5.3 4.9 5.2 4.7
4 6.0 12.6 6.2 5.4 5.4 5.1 4.8 5.0
5 6.0 5.8 12.1 6.0 5.1 5.1 4.9 4.6
6 5.0 5.2 5.0 10.4 5.2 4.4 4.4 4.2
7 4.0 4.9 5.1 4.9 10.2 5.1 4.3 4.3
8 6.0 4.0 4.9 5.1 4.9 10.3 5.1 4.4
9 5.0 5.6 3.8 4.6 4.7 4.6 9.6 4.7
10 6.0 4.9 5.5 3.7 4.5 4.7 4.5 9.4
11 6.0 5.7 4.7 5.2 3.5 4.3 4.4 4.2
12 2.0 6.1 5.8 4.7 5.2 3.5 4.3 4.5
PK-5 44.0 42.5 40.8 33.5 31.8 31.1 30.6 30.1
6-8 15.0 14.1 15.0 20.4 20.3 19.8 13.8 12.9
9-12 19.0 22.3 19.8 18.2 17.9 17.1 22.8 22.8
PK-12 78.0 78.9 75.6 72.1 70.0 68.0 67.2 65.8
Study Area 345 Projection Date 10/2/2019
CURRENT PROJECTED RESIDENT STUDENTS
2019 2020 2021 2022 2023 2024 2025 2026
PK 0.0 0.0 0.0 0.0 0.0 0.0 0.0 0.0
K 4.0 3.8 3.6 3.8 3.4 3.6 3.6 3.5
1 3.0 4.0 3.8 3.6 3.8 3.4 3.6 3.6
2 3.0 3.0 4.0 3.8 3.6 3.8 3.4 3.6
3 2.0 2.8 2.8 3.7 3.5 3.3 3.5 3.1
4 3.0 1.9 2.7 2.7 3.6 3.4 3.2 3.4
5 1.0 2.9 1.9 2.6 2.6 3.4 3.3 3.1
6 2.0 0.9 2.5 1.6 2.2 2.2 2.9 2.8
7 0.0 2.0 0.8 2.4 1.6 2.2 2.2 2.9
8 1.0 0.0 2.0 0.9 2.5 1.6 2.2 2.2
9 0.0 0.9 0.0 1.8 0.8 2.3 1.5 2.0
10 0.0 0.0 0.9 0.0 1.8 0.8 2.2 1.4
11 1.0 0.0 0.0 0.9 0.0 1.7 0.7 2.1
12 2.0 1.0 0.0 0.0 0.9 0.0 1.7 0.7
PK-5 16.0 18.4 18.8 20.2 20.5 20.9 20.6 20.3
6-8 3.0 2.9 5.3 4.9 6.3 6.0 7.3 7.9
9-12 3.0 1.9 0.9 2.7 3.5 4.8 6.1 6.2
PK-12 22.0 23.2 25.0 27.8 30.3 31.7 34.0 34.4
Recommended


