
Agriculture 2014, 4, 1-x manuscripts; doi:10.3390/agriculture40x000x
agricultureISSN 2077-0472
www.mdpi.com/journal/agriculture
Article
Small Ruminants Production Systems Efficiency underAbu-Dhabi, United Arab Emirates Arid Land Conditions
Eihab Fathelrahman 1,*, Sherin Sherif 2 and Dana L. K. Hoag 3
1 Department of Agribusiness and Consumer Sciences, College of Food and Agriculture,
United Arab Emirates University, P.O. Box 15551, Al Ain, United Arab Emirates2 Economics and Agribusiness Department, Faculty of Agriculture, Alexandria University,
El-Shatby, P.O. Box 21545, Alexandria, Egypt; E-Mail: [email protected] Department of Agriculture and Natural Resource Economics, College of Agriculture, Colorado
State University, B330 Clark Bldg. Fort Collins, CO postcode, USA;
E-Mail: [email protected]
* Author to whom correspondence should be addressed; E-Mail: [email protected];
Tel.: .
External Editor: Milan Shipka
Received: 21 August 2014; in revised form: 12 November 2014 / Accepted: 20 November 2014 /
Published:
Abstract: Sheep and goat production systems in the United Arab Emirates (UAE) operate
under scarce natural resource constraints. A cross-sectional survey that covered 661 mixed
farms, including major sheep and goat production, was conducted in the three regions of
Abu Dhabi Emirate (Al-Ain, Western Region, and Abu Dhabi city) during 2012. A
Cobb–-Douglas, double-logarithmic stochastic frontier production function and maximum
likelihood estimation were applied to estimate important economic derivatives and the
associated risk of small ruminant production in this arid area. The highest impact of an input
on the output level was found to be labor for raising sheep and alfalfa grass for raising goats.
Both labor and alfalfa variables were found to be over-utilized for sheep and goat production,
respectively. Overall, the results indicate that average technical efficiency is 0.62 for raising
sheep and only 0.34 for raising goats in the study area. Technical efficiency analysis included
measuring the frequency of farms at each level of estimated technical efficiency in the range
between zero and one. Zero for the technical efficiency coefficient indicates a lack of
technical efficiency in resource use. Results The results of this study indicated that only 1%
of the sheep farms show a technically efficiency coefficient of 0.25 or less; the same can be
OPEN ACCESS
Style Definition: M_deck_4_text
Formatted: English (United States)
Formatted: Check spelling and grammar
Formatted: English (United States)

Agriculture 2014, 4 2
said for 41% for of goat producers. However, these technical efficiencies were found to be
more than
0.75 for 12% and 5% of the sheep and goat farms, respectively. Overall, goat farming in the
UAE was found to be less efficient than sheep production. Results The results also indicated
that flock size and type of breed were the most influential factors relative to other factors,
and both show a positive relationship with technical efficiency. Other than flock size, factors,
such as owners’ years of experience and management practices, were found to be more
influential on goat farming system efficiency relative to sheep farming.
Keywords: sheep and goats; arid land; technical efficiency; uncertainty; technical
efficiency; allocative efficiency; stochastic frontier; maximum likelihood; farm system
intensity; food security
1. Introduction
The Food and Agriculture Organization [1] estimates that sheep and goat stocks in the United Arab
Emirates increased from 52 thousand in 1960 to 1.5 million in 2010 for sheep and from 125 thousand in
1960 to 2 two million in 2010 for goats - (Figure 1). Meanwhile, the United Arab Emirates (hereafter
UAE) imports more than 82% of its overall meat needs. Imports of mutton and goat meat represents
44% of the total supply in the country, leaving 56% of consumption satisfied from local production in
2009. Red-meat production, consumption, prices and trade in the UAE are currently issues of high
importance to the food security policy makers in the UAE government. The UAE imports red meat from
Australia,
New Zealand, India, Pakistan, and other countries to fill an increasing demand gap due to increasing
per-capita national income, that which has led, in turn, to increasing consumption and demand for red
meat.
Figure 1. Number of sheep and goats stock in the United Arab Emirates 1960–2010.
0.0
0.5
1.0
1.5
2.0
2.5
1960 1970 1980 1990 2000 2010
Mill
ion
Head
Goats Sheep
Commented [mm1]: Two same keywords, please check
Formatted: Check spelling and grammar

Agriculture 2014, 4 3
Source: Food and Agriculture Organization (FAO), 2013 [1].

Agriculture 2014, 4 4
Furthermore, similar to many other countries, the UAE has witnesses witnessed an increasing global
and domestic emphasis on some important meat production and consumption attributes, such as meat
products’ quality and safety, in addition to environmental concerns. The UAE possesses relatively
limited agricultural resources due to being in a typical arid region. With such limited agricultural
resources, agricultural policies ought to address such issues as food security along with issues relevant
to resource conservation. The current use of such scarce resources may lead to either economic
overutilization or underutilization with possibilities of irreversible consequences. The UAE policy
makers are working towards initiating and acquiring an accurate and comprehensive information system
and building technical, economic, and risk indicators to help producers of the red- meat subsector. The
UAE’s Ministry of Environmentand Water (MOEW) [2] are is in the process of building a database for inputs use in the country’slivestock sector.
The Arab Organization for Agricultural Development (AOAD) [3] showed that the United Arab
Emirates self- sufficiency ratio (SSR) of red meat declined in the last four decades from 83.25% in 1982
to less than 2% in 2011. Increased mMutton and goat meat increased production and productivity (meat
produced per head) in the UAE play a vital role in reducing the self-sufficiency gap and stabilizing
output prices.
2. Previous Studies
The following section includes a review of studies that have addressed the technical, allocative, and/or
stochastic efficiency of sheep and goats. This section also summarizes studies that address policy
options in response to reduced inefficiency, such as sheep and goat production system intensification.
Zaibet et al. [4] investigated goat production impacts on socio-economic performance and development
in Oman. The study considered a goat production system in a hill-country farming community located
in the interior region. The area included forty villages with an average of ten families in each village
where goats are raised for rural households. The authors used a data envelopment analysis (DEA)
approach. DEA is a mathematical programming methodology that provides a non-parametric measure
of relative efficiency. Then, the authors used two-stage ordinary least squares (OLS) to determine the
components of the technical efficiency. Their research found that non-farm income and feeding costs
are influential variables. Meanwhile, variables, such as farm size, flock size, and family labor, were
found to be non-influential variables in predicting changes in technical efficiency.
Hadley [5] studied the patterns of technical efficiency and technical change at the farm level in
England and Wales. The objective of this study was predicting the relative technical efficiency of
individual farms and explaining the differences in efficiency levels between these farms. Data for this
research were obtained from the Farm Business Survey published by Defra and the National Assembly
for Wales for the period 1982–2002. Farm products included in the survey were cereal, dairy, sheep,
beef, poultry, pigs, as well as mixed- farm products. Hadley’s study applied the stochastic frontier andinefficiency effects models. The analysis showed that farms of all types are efficient and largely operate
close to the production frontier.

Agriculture 2014, 4 5
Pérez et al. [6] offered a technical note on the technical efficiency of meat sheep production in Spain.
The authors surveyed 49 farms in Aragon, Spain, where 3.5 million lambs are fattened per year on about
8,000 sheep farms. The authors estimated Cobb–-Douglas frontier production functions to estimate
technical efficiency. In this study, the authors considered feed costs, capital depreciation, and labor costs
as the explanatory variables. One would notice the sample in this study to be very small relative to the
total farms in the country (49 farms out of 8,000 farms, or 0.6%). However, the study highlighted
the importance of sheep production costs, including inputs cost, as well as the sheep’s products
market seasonality.
Villano et al. [7] measured regional productivity differences in the Australian wool industry using a
metafrontier approach. Explanatory variables, such as feed/pasture, health, marketing, and labor, were
considered to explore the technical efficiency in each of the four selected regions using stochastic frontier
functions. The study found that technical efficiency differences between the four regions are due to
environment and agricultural extension services that were provided to sheep and goat farm owners.
Suresh et al. [8] studied the returns and economic efficiency of sheep farming in the semi-arid region
of Rajasthan, India, based on the collection of field data relying on a survey questionnaire from 107
sheep farmers who reside within 20 villages during March, 2005. The authors used a stochastic frontier
model to analyze such economic efficiency. The authors found that overall average economic efficiency
to be 75 percent. Furthermore, the authors noticed that more than two thirds of the farmers are witnessing
economic efficiency in the range of 70–85 percent.
Shomo et al. [9] analyzed the sources of technical efficiency of sheep production systems in dry areas
in Syria using the results of a survey carried out in 2002. They applied stochastic frontier and maximum
likelihood estimation to find that technical efficiency in the sheep production in Syria ranges from 0.67
to 0.97. The authors concluded that flock size is a key factor in determining technical efficiency. The
authors also recommended that producers should be encouraged to shift from traditional systems to
intensive systems to increase technical efficiency.
Furesi, et al. [10] analyzed the technical efficiency in the sheep industry for producing sheep milk in
Sardinia (Italy) sector. This study collected panel data from 36 sheep firms that produce sheep milk
during 2004 to 2009. A stochastic frontier approach was used by Furesi et al. to assess the possibility of
technical improvements in productivity. Technical efficiency was found to be 0.933 in these farms. The
study included both private and cooperative farms and found significant differences between the two
groups (0.93 for private firms and 0.88 for cooperative firms).
Economides [11] defined the sheep and goat intensive system to be the system that involves
confinement of the flock with only limited grazing, for the goal of producing heavier lambs and kids.
Such a system requires rationing of feed that utilizes available forage effectively, heavier use of
appropriate (to the species and age of the animal) concentrates, a high level of veterinary care, better
sheltering and feeding facilities, and use of an automated system for handling inputs, animals, and
animals’ products. However, such a system requires trained labor and increased management skills.
Otherwise, investment may lead to low returns and probably high economic losses. Furthermore,
Economides’ [11] study indicated that if an intensive system for sheep and goats is successful, several
advantages would be gained. Efficient use of inputs, including feed, labor and veterinary medicine, a

Agriculture 2014, 4 6
steady supply of meat production, and higher quality of final products justifies the initial investment in
such intensive or semi-intensive systems.
Kumar [12], Sultana et al. [13], ] and Abdelqader et al. [14] studied the potential impacts of adapting
sheep and goats in semi- intensive and intensive systems in similar arid regions to the UAE arid- land.
Kumar [12] concludes that goat rearing in India is rewarding in both semi- intensive and intensive
systems. Sultana et al. [13] found that semi-intensive feeding systems were found to be more efficient,
testing native sheep species in Bangladesh. However, the authors found that the intensive system is more
efficient using lamb survivability criteria. Meanwhile, Abdelgader [14], investigating the length of
productive life (LPL) of Awassi and Najdi ewes species in intensive production systems in the Northern
northern part of the Arabian Peninsula, found that variation in such LPL are is due to differences in
breed, management practices, and flock effects. Furthermore, the authors found that the Awassi ewes
breed fits the intensive system more than the Najdi breed and can survive longer. These studies’ findings
showed the positive potential for increased technical efficiency of the intensive sheep and goat farmings
under an arid land environment.
Previous studies covered in this research all agreed about using the stochastic frontier production
functions in order to enable discovering sources of technical and allocative inefficiency. The sSelection
of variables to analyze sources of technical efficiency widely differs from one study to another, which
indicates that no single set of variable fits all research problems. Our study selected a larger number of
variables to analyze sources of technical inefficiency relative to the previous studies (i.e., flock size,
owner’s years of experience, animal breed, total operational cost, land size, and costs of concentrates).
The objectives of this research are: (1) to obtain the baseline information on the existing mixed-animal
farms; (2) to determine the production efficiency of inputs use and the corresponding price efficiency;
(3) to estimate stochastic analysis parameters, including out of control random unknown parameters that
account for technical inefficiency in the production functions; (4) to understand the sources of such
technical inefficiency; and (5) to use research results to find and propose possible alternatives for
decision makers to address technical inefficiency in the UAE sheep and goats sub-sector.
3. Data and Methods
Data was collected during 2012 through a comprehensive cross-sectional survey of the sheep and
goat farms located in three regions in the UAE. These regions are Al-Ain, Abu-Dhabi, and the
Western Region of the Abu-Dhabi Emirate. These areas are the main sheep and goat producing areas in
the country.
3.1. Data
A summary of the survey descriptive statistics for the 661 mixed farms is illustrated in Table 1. The
average number of animals in farms was found to be 122 heads per farm for sheep and 106 heads per
farm for goats. Sheep farms were using about 8 tons of tons of Rhodes grass compared to about 14
Tonnes tons for goats annually. Farms use 47 and 44 tons of Alfalfa alfalfa for sheep and goats,
respectively, on an annual basis. Sheep and goat farms use wheat bran, barely, corn, wheat, and protein
concentrates to complete sheep and goat diets. No large differences in using labor or water were found

Agriculture 2014, 4 7
between sheep and goats in the Abu-Dhabi Emirate. Table 1 in the results section also shows that almost
all coefficients of variation (standard deviation/mean %) for output and input variables exceeded 100%,
which indicates a large variability between the various farms included in the sample. Such variability
may indicate the presence of a wide range of practices and methods when it comes to sheep and goat
feeding and other resource management practices applied by farmers in the Abu-Dhabi Emirate.

Agriculture 2014, 4 8
Table 1. Descriptive statistics of output and input variables for sheep and goats production
in Abu-Dhabi Emirate.
Sheep Goats
Unit Average RangeStandard
Deviation
Coefficient of
VariationAverage Range
Standard
Deviation
Coefficient of
Variation
Number Animal 122 2,000 139 113% 106 1,000 106 100%
Feed
Rhodes Grass TonneTon 8 219 26 306% 14 3,504 139 978%
Alfalfa TonneTon 47 1,095 61 130% 44 1,095 60 136%
Wheat Bran KG 12 132 19 158% 9 121 14 153%
Barely KG 3 100 8 224% 3 72 6 216%
Corn KG 0 45 2 1,086% 0 23 1 1,197%
Wheat KG 5 142 14 299% 3 89 9 282%
Protein
ConcentratesKG 8 189 18 227% 6 83 12 198%
Labor
Thousand
Arab Emirates
Dirham (AED)
9 66 8 94% 8 149 10 122%
Water
Thousand
Arab Emirates
Dirham (AED)
4 144 9 235% 4 72 7 192%
3.2. Methods
A production functions methodology is used in this research to assess the economic efficiency of
input- use; namely, technical (production) and price (allocative) efficiency. The production function
exhibits an engineering (physical) relationship between variable inputs, on the one hand, and the outputs
that these inputs affect. Technical (production) efficiency is inherent in the definition of the production
function. This function indicates the maximum amount of output obtainable from the utilization of a
specific quantity of inputs given the existing technology level governing the input-output relationship.
Alternatively, a specified set of inputs cannot be recombined to produce a larger output, or that a specific
level of output cannot be produced with fewer inputs. The said input-output relationship is assumed to
be known with certainty; i.e., the producers know the eventual outcome of the production process at the
beginning of the production period. Since these relationships are neither fully known nor controllable, a
distribution of yields would be associated with each input- use level. This range of expected yields
depends on the estimated variability of the predicted yield corresponding to the specified input- use
level. Moreover, inputs included in the production function are assumed to be homogeneous and that
prices of both inputs and outputs are presumably known with certainty (Chambers [15]) and Fuss and
Mundlak [16]). Allocative efficiency, on the other hand, refers to the combinations of inputs that
maximize individual or social objectives. It is defined in terms of two conditions: necessary and
sufficient. The first is met in the production process when estimating the production function. The second
varies with the objectives of the individual producer. Like most of the economic literature under perfect
knowledge, the individual producer’s objective is assumed to be profit maximization. It is defined as

Agriculture 2014, 4 9
profit maximization through equating the value of the marginal product of the variable input to its unit
price (Griffin [17]).
The log-log Cobb– Douglas deterministic production function used in this paper takes the following
mathematical form: = (11
)
where Y is the level of output, the X’s are the inputs, and α and β are the function’s coefficients. The
assumptions embodied in the function’s estimation are: xi ≥ 0 and finite (nonnegative, real inputs); thefunction is finite, nonnegative, real and single- valued for all possible combinations of X1 and X2; is
everywhere continuous and everywhere twice continuously differentiable; and is subject to the law of
diminishing returns.
This production function can be converted for the purpose of linear regression by taking the log
as follows:
= β + ( - ) ii = 1,…………N(22
)
where:
= is the logarithm of the production/output of the i-th farmβ = vector of unknown coefficients
= random variables, which are assumed to be N(0,σ 2), that is all s are independently and
identically distributed normal random variables with zero mean and variance σ 2.
= non-negative random variables, which are assumed to account for technical inefficiency
in production.
These random variables are assumed to be │N(0,σ 2)│; that is, s are independently and identically
distributed half-normal (i.e., its PDF pdf is a truncated version on the normal distribution) random
variables with zero mean and variance σ (based on Collei [18] and Aigner [19]).
The estimation of technical efficiency coefficients for sheep and goats requires that this function be
estimated using a maximum likelihood process. Maximum likelihood estimates (MLEs), as proposed by
Coelli et al. [19], and parameterized (based on Jondrow et al. [20]) by a log-likelihood function for the
half-normal model, are as follow:
ln L ( │β, σ,λ) = − ln { } +∑ ln { − Ԑ } − ∑ ɛ (33
)
where:
= vector of the log-output;
= σ 2 + σ 2;
λ2 = σ 2/ σ 2 ≥ 0;ɛi = - = ln qi - β, the composite error term; and
( ) = cumulative distribution function (cdf) of the standard normal random variable
evaluated at .
Therefore, Coelli et al. [18] suggested that technical efficiency be calculated as follows:
Formatted: Left
Formatted: English (United States)
Formatted: Not Superscript/ Subscript
Formatted: English (United States)
Formatted: English (United States)
Formatted: English (United States)
Formatted: English (United States)
Formatted: English (United States)
Formatted: Left
Formatted: English (United States)
Formatted: English (United States)
Formatted: English (United States)
Formatted: English (United States)
Formatted: Highlight
Commented [MF2]: hyphen or minus sign?
Formatted: Highlight
Formatted: English (United States)
Agriculture 2014, 4 10
TEi= ( ) =( )( ) = exp(− ) (4)
where = observed output.
The following section summarizes the results obtained from applying technical efficiency (TE),
described above.
4. Results and Discussion
Survey results also revealed that sheep and goat farms are 86% and 14% of all sheep and goat farms,
respectively, in the Al-Ain Region, Abu-Dhabi area, and the Western Region of the Abu Dhabi Emirate.
The majority of sheep and goat farms (428 farms out of 661 sample farms) were in operation for 10
years or less. The typical sheep flock structure was dominated by ewes; whereas doe’s dominated thegoat flocks. The average value products (market price) for sheep and goats were AED 116 and AED 93
per head, respectively (USD 1 = AED 3.675). Almost all farmers (99%) claimed that the farm is carrying
the right capacity. Fifty seven percent of the farmers claimed they supply adult animals with
concentrates. Fifty one percent of the water needs for both of sheep and goats were supplied through
tanks, followed by the Al-Ain Distribution Company (29%), and groundwater (20%). Meanwhile, 70%
of the sheep and goat farmers reported that they seek veterinary services when animals get sick. The
main three health control measures adopted in sheep/goat farms are vaccination (76%), dipping (68%),
and dew arming (68%). W. Whereas, 94% of farmers reported that they don’t do not do animal
identification. , The the 6% who reported that they used identification claimed using the ear-tagging
method. Fifty six percent of sheep/goat farmers reported culling of sheep and goats from flocks for health
reasons. Seventy nine percent of farmers reported having shades for each group of animals, with more
emphasis on the newly born (61%). Sources of price information were 9%, 8%, and 9% from other
farms, the government, and negotiations with buyers, respectively. The reported annual total production
of sheep and goats by number were 7,661 and 5,845 animals, respectively, with coefficients of variation
of 135% for sheep and 120% for goats. Ten percent of sheep/goat farmers reported meeting market
demands, whereas 38% claimed they do not, whereas and 52% did not respond to that question (Sherif
et al. [21]).
The results section of this study proceed to include descriptive statistics of the research variables,
technical efficiency results, allocative efficiency results, and the stochastic analysis results to explore
and analyze factors that influence technical, allocative (price) and uncertainty in sheep and goats
production in Abu-Dhabi Emirate, U.A.E.
This research paper expanded expands on the Sherif [21] conference proceeding paper to include
stochastic frontier analysis utilizing the approach proposed by Coelli et al. [18]. Using the stochastic
frontier methodology has an advantage over the deterministic approach in that it enables estimation of
the technical efficiency distribution, as well as the inclusion of technical inefficiency sources. The
deterministic approach uses the average of estimated technical efficiency and allocative efficiency for
the overall sample without revealing information about technical efficiency at the specific farm in the
study’s sample. However, the stochastic frontier approach estimates technical efficiency at each farm
and further shows the distribution of technical efficiency across all of the sample farms. Another
advantage of the frontier approach is that it enables the analysis to further analyze the sources (e.g.,
Formatted: English (United States)
Formatted: Left
Formatted: English (United States)
Formatted: English (United States)
Formatted: English (United States)
Formatted: English (United States)
Formatted: English (United States)
Formatted: English (United States)
Formatted: English (United States)
Formatted: English (United States)
Formatted: Font: Not Italic, Complex Script Font: Not Italic

Agriculture 2014, 4 11
species, feed, or labor) of inefficiency. Stochastic efficiency analysis considers the analysis of both
known uncertainty due to technical inefficiency and unknown sources of uncertainty. The stochastic
component of this research was carried out using FRONTIER, version 4.1, software prepared by Coelli,
T. J. [22], for the Center for Efficiency and Productivity Analysis (CEPA).
4.1. Sheep Deterministic Model –: Technical Efficiency
The following is the production function specification for sheep in Abu-Dhabi Eemirate:
= −0.060 + 0.053 Rhodes + 0.289 Alfalfa + 0.122 Wheat Bran + 0.039 Barley –0.086 Corn + 0.066 Wheat + 0.121 Protein Concentrate + 0.056 Minerals + 0.075
Vitamins + 0.388 Labor + 0.128 Water + 0.6616829
(2)
Equation (2) displays the estimated log-log production function for sheep, where Y is the number of
sheep (head produced/day), Rhodes and Alfalfa alfalfa are measured in Tonnestons/day, and wheat bran,
barley, corn, wheat, wheat concentrate, minerals, and vitamins are all measured in kilograms/day; labor
is measured in thousand hours/year, and Water water is measured as cost in AED/year. The model’s F-
ratio was 287.557 (model statistically significant), adjusted R-squared = 0.827 (all of the estimated
variables explain 82.7% of the variations in the level of output); and the significant variables in the above
estimated equation at less than the 1% level are Rhodes, alfalfa, wheat bran, wheat, protein concentrate,
labor, and water. The Standardized beta coefficients showed that the most prominent variables in
affecting the level of output are, respectively labor, alfalfa, protein concentrate, wheat bran, water,
wheat, and Rhodes
(Sherif, et al. [21].
4.2. Sheep Deterministic Model :- Allocative (Price) Efficiency
The ratio of the marginal value product of input X (MVPx) and input price of x (Px) was calculated
for each significant input to test the null hypothesis that it is equal to one. Table 2 shows the results
obtained for all of the significant inputs in the estimated log-log function where: MVPx = marginal value
product of the variable input X, Px is the average unit price of the variable input X, and MVPx is equal
to
[EX* Py * (Y/X)]; where: EX is elasticity of production of the variable input X, PY is the average output
price in AED, Y is the average level of output ,and X is the average level of the variable input X.
According to the marginal economic production theory; if MVPx/Px < 1, input is overutilized; if
MVPx/Px= 1, input is optimally utilized; and If MVPx/Px > 1, input is underutilized (Hall [23]).
Table 2 summarizes the allocative efficiency results of the variable inputs used in the production of
sheep. Water was not included, because it was calculated as a monetary value per year and not as a
physical amount, due to lack of data on the physical amounts. The table shows that all of the prominent
variable inputs are overutilized as their MVPx compared to their corresponding prices, Px ,Px, are less
than one. Moreover, an elasticity of production of Rhodes, for instance, of 0.053 means that if the input
level increases by 100%, output would increase by 5.3%, and so on, for the remainder of the regression
coefficients (Sherif et al., [21]).
Formatted: Highlight
Commented [mm3]: Please check equation numbers
Formatted: Highlight
Formatted: Font: Italic, Complex Script Font: Italic
Formatted: Font: Italic, Complex Script Font: Italic
Formatted: Not Superscript/ Subscript
Formatted: Not Superscript/ Subscript
Formatted: Highlight
Formatted: Highlight

Agriculture 2014, 4 12

Agriculture 2014, 4 13
Table 2. Allocative efficiency of the significant inputs used in the production of sheep.
Input Unit Coefficient
Output Price Average Average Marginal Input
MVPx/Px(PY) (Y) (X) Value
Market Price
(Px) (AED)
Product
(MVP)
Rhodes TonneTon 0.053 116 122 8 93.8 400.9 0.23
Alfalfa TonneTon 0.289 116 122 47 87 322.6 0.27
Wheat Bran Kgkg 0.122 116 122 4,380 0.4 0.8 0.53
Wheat Kgkg 0.066 116 122 1,825 0.5 1 0.51
Protein
ConcentrateKgkg 0.121 116 122 2,920 0.6 0.8 0.78
Labor 1,000 h 0.388 116 122 2.9 1,919.9 3,400.0 0.56
4.3. Goat Deterministic Model:- Technical efficiencyEfficiency
The following is the production function specification for goats in Abu-Dhabi Eemirate:
= 4.702 + 0.052 Rhodes + 0.395 Alfalfa + 0.280 Wheat Bran – 0.012 Barley – 0.223
Corn + 0.196 Wheat + 0.296 Protein Concentrate + 0.021 Minerals + 0.007 Vitamins –0.366 Labor – 0.193 Water + 1.3333559
(3)
Equation (3) displays the estimated log-log production function for goats, where Y is the number of
goats (head produced/day), and all of the variable inputs are defined and measured in the same units
used in the estimation of the sheep production function. The model’s F-ratio is 26.346, adjusted
R-squared = 0.297; and the significant variables in the above estimated equation at less than the 1% level
are alfalfa, wheat bran, wheat, and protein concentrate. Labor and Waterwater, however, were highly
significant at less than the 1% level, but with unexpected negative signs. This could be due to
overutilization of these two inputs due to recruiting cheap expatriate labor. The standardized Beta beta
coefficients showed that the most prominent variables in affecting the level of goat output are,
respectively, alfalfa, wheat bran, protein concentrate, and wheat (Sherif et al., [21]).
4.4. Goat Deterministic Model :– Allocative (Price) Efficiency
Table 3 summarizes the allocative efficiency results of the variable inputs used in the production of
goats. MVPx/Px shows that Alfalfa alfalfa is over-utilized. However, all other inputs (wheat bran, wheat,
and protein concentrates) are underutilized.
Deterministic models for sheep and goats in the UAE –, Abu-Dhabi, were used primarily to estimate
overall technical efficiency and allocative efficiency, and to serve in step to include the stochastic
component analysis. The stochastic component includes both the random variable due to the unknown
and the technical efficiency component, that which is further investigated in the stochastic analysis
section later. Deterministic models are the first step to narrow down the explanatory variables. Only
significant variables from deterministic models are considered for the stochastic frontier.
Commented [mm4]: Please check equation numbers
Formatted: Highlight
Formatted: Font: Italic, Complex Script Font: Italic
Formatted: Font: Italic, Complex Script Font: Italic

Agriculture 2014, 4 14
Table 3. Allocative efficiency of inputs for goats.
Input Unit Coefficient
Output
Price
(PY)
Average
(Y)
Average
(X)
Marginal
Value Product
(MVPx)
Input
Market
Price (Px)
MVPx/Px
Alfalfa TonneTon 0.395 93 106 45 86.5 322.6 0.27
Wheat Bran Kgkg 0.280 93 106 3,285 0.8 0.8 1.12
Wheat Kgkg 0.196 93 106 1,095 1.8 1 1.76
Protein
ConcentrateKgkg 0.296 93 106 2,190 1.3 0.8 1.78
4.5. Sheep Stochastic Frontier: – Maximum Likelihood Estimates (MLEs)
Table 4 summarizes the sheep stochastic frontier production function using maximum likelihood
estimates. These results show the expected positive signs for all of the selected explanatory variables
and that all of these variables are significant. These estimates indicate that all coefficients on explanatory
variables are smaller than those of the deterministic model results. This is due to the fact that technical
efficiency is now accounted for as its own variable, and the stochastic model also considers variability
due to out of control conditions: – stochastic variability (e.g., due to changes in climate). For example,
MLEs show that increasing Rhodes by 1% causes the sheep number produced in the flock to increase
by 0.02%. The Gamma gamma coefficient indicates that variation in the composite error term that is due
to the inefficiency component = 0.56. In other words, for sheep in the UAE, 56% of the variation in the
error term is due to inefficiency.
Table 4. Sheep maximum likelihood estimates: - stochastic production frontier.
VariableOverall Model
FitnessCoefficient Standard- Error T-Ratio
Constant 0.16 0.16 9.48Rhodes (Tonneton) 0.02 0.02 3.43Alfalfa (Tonneton) 0.03 0.03 17.55Wheat Bran (Kgkg) 0.02 0.02 4.67
Wheat (Kgkg) 0.03 0.03 2.74Protein Concentrates (KGkg) 0.02 0.02 4.16
Labor (1,000 h) 0.04 0.04 19.14Sigma-squared 0.13 0.13 6.93
Gamma 0.56 0.13 0.13 4.45
4.6. Goats Stochastic Frontier: – Maximum Likelihood Estimates (MLEs)
Table 5 shows the results for the goats’ stochastic frontier production function using the maximum
likelihood estimates. Different from the sheep model’s results, using wheat to feed the goats is found to
be insignificant (T T-value = 1.5). The goats’ stochastic model results indicate that increasing alfalfa by
1% causes the number of goats produced in the flock to increase by 0.16%. The Gamma gamma
Formatted: English (United States)
Formatted: English (United States)
Formatted: English (United States)
Formatted: English (United States)
Formatted: English (United States)
Formatted: English (United States)
Formatted: English (United States)
Formatted: English (United States)
Formatted: English (United States)
Formatted: English (United States)
Formatted: English (United States)
Formatted: English (United States)
Formatted: English (United States)
Formatted: English (United States)
Formatted: English (United States)
Formatted: English (United States)
Formatted: English (United States)
Formatted: Font: Not Italic, Complex Script Font: Italic

Agriculture 2014, 4 15
coefficient indicates that variation in the composite error term that is due to inefficiency component =
0.97. In other words, for goats in the UAE, 97% of the variation in the error term is due to inefficiency.
Table 5. Goats maximum likelihood estimates: - stochastic frontier production frontier.
Variable Coefficient Standard-error T-Ratio
Constant 5.06 0.09 54.39Alfalfa 0.16 0.03 5.62
Wheat Bran 0.07 0.03 2.04Wheat 0.07 0.04 1.50
Protein Concentrates 0.09 0.03 2.65Gamma 0.97
4.7. Comparison of Sheep and Goats Technical Efficiencies
Table 6 below summarizes the sheep and goat technical efficiencies and descriptive statistics.
Figure 1 below compares the histograms for the sheep and goat technical efficiencies. Overall, average
technical efficiency was found to be 0.62 for sheep and only 0.34 for goats. These descriptive statistics
show that sheep technical efficiency compared to goats’ technical efficiency is double on average.
Furthermore, the distribution of goats’ technical efficiency is skewed to the left (low) compared to the
sheep technical efficiency distribution, which is slightly skewed to the right (high) -(Figure 2a and
Figure 2b). These results show that sheep’s production technical efficiency is higher than goats’production technical efficiency overall.
Table 6. Descriptive statistics of technical efficiencies parameters for sheep and goats.
Indicator Sheep Goats
Mean 0.62 0.34Median 0.64 0.32Mode 0.45 0.01
Standard Deviation 0.12 0.23Minimum 0.15 0.00Maximum 0.86 0.91
Range (Maximum – Minimum) 0.71 0.91Coefficient of Variation 20% 69%
The technical efficiency distribution for the three sizes (large, more more than 200 heads;, medium,
100 to 200 heads, ; and small, less than 100 heads) of sheep is depicted in Figure 2.a , which shows that
sheep technical efficiency is distributed, as expected, with higher technical efficiency for the larger
sizeds flocks. However, the distribution of goats’ technical efficiency does not show similar results to
the sheep distribution. For example, medium sized flocks (100–200 heads) of goats showed a higher
technical efficiency level relative to the large sized flocks. This indicates that other than the flocks size,
such as the feeding system, owner years of experience, and management practices may play have more
influence on goats production efficiency.
Formatted: English (United States)
Formatted: English (United States)
Formatted: English (United States)
Formatted: English (United States)
Formatted: English (United States)
Formatted: English (United States)
Formatted: English (United States)
Formatted: English (United States)
Formatted: English (United States)
Formatted: English (United States)
Formatted: English (United States)
Formatted: English (United States)
Formatted: English (United States)
Formatted: English (United States)
Formatted: English (United States)
Formatted: English (United States)
Formatted: Space Before: 0 pt

Agriculture 2014, 4 16
Figure 2.a. Sheep technical efficiency distribution.
All Farms Large: More than 200 heads
Medium: 100–200 heads Small: Less than 100 heads
0 0 0 1 012
52
83 77
130
020406080
100120
0.0 0.1 0.2 0.3 0.4 0.5 0.6 0.7 0.8 0.9 1.0
Freq
uenc
y
Technical Efficiency
98
75 74
52
146 4 4 0 0 0
0
20
40
60
80
100
120
0.0 0.1 0.2 0.3 0.4 0.5 0.6 0.7 0.8 0.9 1.0
Freq
uenc
y
Technical Efficiency
Commented [mm5]: Please check figure 2a and figure 2b,combine to one Figure 2? Please check
Formatted: Check spelling and grammar
Formatted: Check spelling and grammar
Formatted: Check spelling and grammar
Formatted: Check spelling and grammar

Agriculture 2014, 4 17
Figure 2.b. Goats technical efficiency distribution histograms.
All Farms Large: More than 200 heads
Medium: 100 to 200 heads Small: Less than 100 heads
Formatted: Check spelling and grammar
Formatted: Check spelling and grammar
Formatted: Check spelling and grammar
Formatted: Check spelling and grammar

Agriculture 2014, 4 18
Descriptive statistics on goats showed that technical efficiency had a larger range (0.91) compared to
(0.71) for sheep.
Table 7 further indicates that only 9 nine of the sheep farms have a technical efficiency coefficient of
0.25 or less compared to 270 goats farms. On the other end, 80 sheep farms and only 33 goat farms
showed more than a 0.75 technical efficiency coefficient. There is also a large difference between the
number of sheep and goats farms within the other ranges of technical efficiency coefficients, with sheep
farms showing a higher number of farms on both the range of 0.26 to 0.5 and 0.51 to 0.75. In brief, sheep
farms that achieve over a 50% technical efficiency coefficient or higher are 82% of the sample compared
to only 27% of the goat farms.
Table 7. Number of sheep and goats farms at different levels of technical efficiency.
Number of FarmsLevel of Technical
EfficiencySheep % Goats %
0.25 or Less 9 1% 270 41%0.26–0.5 106 16% 221 33%
0.51–0.75 466 70% 137 21%More than 0.75 80 12% 33 5%
Total 661 100% 661 100%
4.8. Distribution of Technical Efficiency by Herd Size
Each of the sheep and goat farms in the sample are is classified into three groups, large sized (more
than 200 heads), medium (100–200 heads) and small (less than 100 heads). Technical efficiency
distributions form from the sheep histograms in Ffigure 2.a. are showing a pattern of increasing
efficiency as the flock size increases. The relationship between flock size and technical efficiency does
not follow a specific pattern of increased efficiency when the size of the flock increases. For example,
small and medium sized flocks shows relatively higher technical efficiency compared to the same sizes
of sheep flocks. These results indicate that flock size is one of the influential factors relative to other
factors and has a positive relationship with technical efficiency in sheep production systems. Other than
flock size, factors, such as owners’ years of experience and management practices, are more influential
on goats’ productionsystem efficiency.
4.9. Sources of Technical Inefficiency in Sheep and Goats
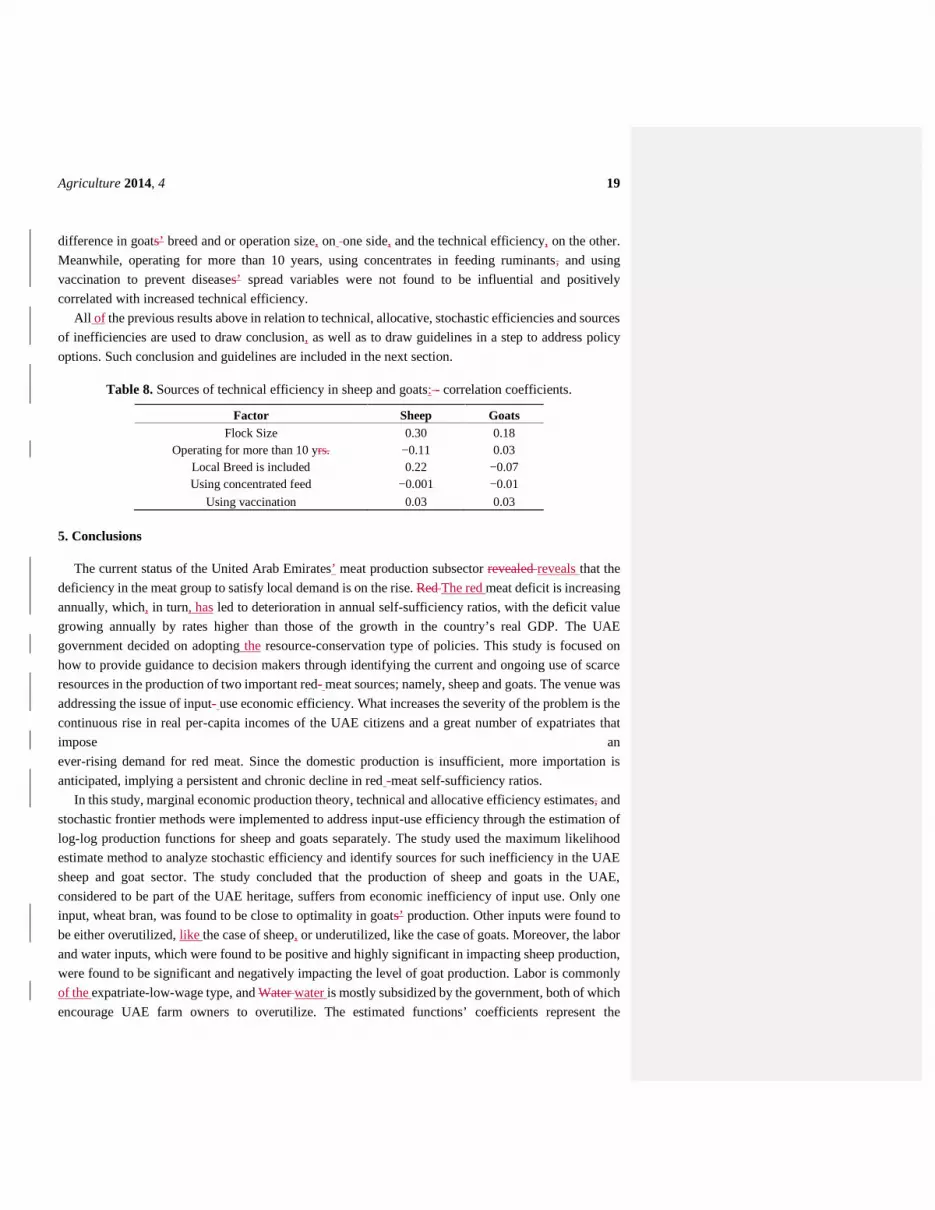
Table 8 shows information on the investigation of the possible source of technical efficiency in sheep
and goats in the Abu-Dhabi Emirate. These results indicate that flock size is the most influential factor
relative to other factors and positively affecting technical efficiency. This is consistent with the concept
of economies of size. Larger sized of sheep and goat operations leads to economic benefits, as fixed
costs are spread over a larger number of animals and increase thes overall efficiency of the inputs used.
Including the local breed in sheep was also found to be positively related to technical efficiency.
However, this was not the case for goats, because no strong correlations were found between the
Agriculture 2014, 4 19
difference in goats’ breed and or operation size, on one side, and the technical efficiency, on the other.
Meanwhile, operating for more than 10 years, using concentrates in feeding ruminants, and using
vaccination to prevent diseases’ spread variables were not found to be influential and positively
correlated with increased technical efficiency.
All of the previous results above in relation to technical, allocative, stochastic efficiencies and sources
of inefficiencies are used to draw conclusion, as well as to draw guidelines in a step to address policy
options. Such conclusion and guidelines are included in the next section.
Table 8. Sources of technical efficiency in sheep and goats: - correlation coefficients.
Factor Sheep GoatsFlock Size 0.30 0.18
Operating for more than 10 yrs. −0.11 0.03Local Breed is included 0.22 −0.07Using concentrated feed −0.001 −0.01
Using vaccination 0.03 0.03
5. Conclusions
The current status of the United Arab Emirates’ meat production subsector revealed reveals that the
deficiency in the meat group to satisfy local demand is on the rise. Red The red meat deficit is increasing
annually, which, in turn, has led to deterioration in annual self-sufficiency ratios, with the deficit value
growing annually by rates higher than those of the growth in the country’s real GDP. The UAE
government decided on adopting the resource-conservation type of policies. This study is focused on
how to provide guidance to decision makers through identifying the current and ongoing use of scarce
resources in the production of two important red- meat sources; namely, sheep and goats. The venue was
addressing the issue of input- use economic efficiency. What increases the severity of the problem is the
continuous rise in real per-capita incomes of the UAE citizens and a great number of expatriates that
impose an
ever-rising demand for red meat. Since the domestic production is insufficient, more importation is
anticipated, implying a persistent and chronic decline in red -meat self-sufficiency ratios.
In this study, marginal economic production theory, technical and allocative efficiency estimates, and
stochastic frontier methods were implemented to address input-use efficiency through the estimation of
log-log production functions for sheep and goats separately. The study used the maximum likelihood
estimate method to analyze stochastic efficiency and identify sources for such inefficiency in the UAE
sheep and goat sector. The study concluded that the production of sheep and goats in the UAE,
considered to be part of the UAE heritage, suffers from economic inefficiency of input use. Only one
input, wheat bran, was found to be close to optimality in goats’ production. Other inputs were found to
be either overutilized, like the case of sheep, or underutilized, like the case of goats. Moreover, the labor
and water inputs, which were found to be positive and highly significant in impacting sheep production,
were found to be significant and negatively impacting the level of goat production. Labor is commonly
of the expatriate-low-wage type, and Water water is mostly subsidized by the government, both of which
encourage UAE farm owners to overutilize. The estimated functions’ coefficients represent the

Agriculture 2014, 4 20
elasticities of the production of the said inputs. Through these coefficients, the responsiveness of outputs
to percentage changes in input levels was assessed. The highest impact of an input on output level was
labor in the case of sheep and alfalfa in the case of goats. , Both both of which were found to be
overutilized. Results indicated the inefficiency of the inputs utilized for sheep and goats; where all of
the inputs used in sheep production were overutilized; whereas those used in goat production were
underutilized in two cases and overutilized in one case, with only one input being close to economic-use
optimality.
This study’s results showed that, overall, average technical efficiency was found to be 0.62 for sheep
and only 0.34 for goats. Technical efficiency coefficients distribution results indicate that about 82% of
the sheep farms are achieving a 0.5 or more technical efficiency coefficient compared to only 27% of
the goat farms. Results showed that 56% of the risk is due to technical inefficiencies’ in sheepproduction. However, 97% of the risk can be attributed to technical inefficiencies in the goat production.
Furthermore, flock size is found to be the most influential factor relative to other factors and positively
affecting technical efficiency. Sources of inefficiency are attributed to flock size and breed in sheep and
only flock size in goats.
Policy makers in the UAE should consider revising the forage subsidy in response to alarming signs
of the increasing rate of water scarcity. Such water scarcity is worsening due to past direct subsides
distributed to small and large ruminant producers in the country. With the ongoing trend of the UAE
government on subsidy reduction for inputs for sheep and goat producers, it is expected that farmers will
further reduce the inputs used for animals’ production in response to such expected policy changes. This
research identified the overall low levels of technical efficiency, especially on the goat production
sub-sector, and concluded that flock size and breed of sheep are the most influential factors affecting
technical efficiency.
In response to the low technical, allocative efficiencies, lack of water for pasture, and high level of
uncertainty livestock, the sector’s policy makers in the UAE may consider several actions, including
redirection of subsidies to the support of semi-intensive or intensive sheep and goat production
programs, one in the one hand. For pProducers, in on the other hand , are it is recommended to consider
semi- intensive and intensive systems for small ruminant feeding, housing, health care, and flock
management in the UAE as a management option to address sheep and goats production systems’ low
technical efficiency, low allocative efficiency, and high uncertainty. Such intensive sheep and goat
systems are necessary to optimize resource use and guarantee sustainable future production.
Acknowledgements
This paper was part of the Research Project No. is 1440-06-02-10. The authors are indebted to the
UAE University’s Research Affairs Department and the Abu Dhabi Food Control Authority (ADFCA)for
co-funding this project. Gratitude is extended to ADFCA for providing all of the needed logistics for
field surveying of the farms. Acknowledgement is extended to Salih Al-Shorepy for his contribution on
reviewing earlier versions of this manuscript and providing useful insights on the characteristics of small
ruminant’s intensive systems.

Agriculture 2014, 4 21
Author Contributions
Conflicts of Interest
The authors declare no conflict of interest.
References
1. Food and Agriculture Organization (FAO) – FOA Stats. Available online: http://faostat.fao.org
(accessed on day September 2013).
2. Ministry of Environment and Water (MOEW); United Arab Emirates. Available online:
http://www.moew.gov.ae/Portal/en/home.aspx (accessed on day March 2013).
3. Arab Organization Agricultural Development (AOAD). 2013. Arab Agricultural Statistics
Yearbook. Volumes 26–32. Available online: http://www.aoad.org/AASYXX.htm (accessed on
day month year).
4. Zaibet, L.; Dharmapala, P.; Boughanmi, H.; Mahgoub, O.; Al-Marshudi, A., Social changes,
economic performance and development: the case of goat production in Oman. Small Rumin. Res.
2004, 54, 131–140.5. Hadley, D. Patterns in Technical Efficiency and Technical Change at the Farm‐level in England
and Wales, 1982–2002. J. Agric. Econ. 2006, 57, 81–100.
6. Pérez, J.; Gil, J.; Sierra, I. Technical efficiency of meat sheep production systems in Spain. Small
Rumin. Res. 2007, 69, 237–241.
7. Villano, R.A.; Fleming, E.M.; Fleming, P. In Measuring Regional Productivity Differences in the
Australian Wool Industry: A Metafrontier Approach. In Proceedings of the AARES 52nd Annual
Conference, location, date of conference 2008.
8. Suresh, A.; Gupta, D.; Mann, J. Returns and economic efficiency of sheep farming in semi-arid
regions: A study in Rajasthan. Agric. Econ. Res. Rev. 2008, 21, 227–234.
9. Shomo, F.; Ahmed, M.; Shideed, K.; Aw-Hassan, A.; Erkan, O. Sources of technical efficiency of
sheep production systems in dry areas in Syria. Small Rumin. Res. 2010, 91, 160–169.
10. Furesi, R.; Madau, F. A.; Pulina, P. Technical efficiency in the sheep dairy industry: an application
on the Sardinian (Italy) sector. Agric. Food Econ. 2013, 1, 1–11.
11. Economides, S. Intensive Sheep Production in the Near East; FAO Animal Production and Health
Paper No. 40; Food & Agriculture Organization: City, Country, 1983
12. Kumar, S. Commercial goat farming in India: an emerging agri-business opportunity. Agric. Econ.
Res. Rev. 2007, 20, 503–520.
13. Sultana, N.; Hasan, N.; Iqbai, A.; Erhaduzzaman, M.; Talukdar, M.A.I.; Dey. Effect of Intensive
and Semi-intensive Feeding System on Production and Reproductive Performance of Native Sheep.
J. Sci. Res. 2011, 3, 693–698.
14. Abdelqader, A.; Yacoub, A. A.; Gauly, M. Factors influencing productive longevity of Awassi and
Najdi ewes in intensive production systems at arid regions. Small Rumin. Res. 2012, 104, 37–44.
Commented [mm6]: Please add this section
Commented [mm7]: Please confirm this section
Formatted: Do not check spelling or grammar
Formatted: Do not check spelling or grammar
Formatted: Do not check spelling or grammar
Formatted: Do not check spelling or grammar
Formatted: Do not check spelling or grammar
Formatted: Do not check spelling or grammar

Agriculture 2014, 4 22
15. Chambers, R.G. Applied Production Analysis: A Dual Approach; Cambridge University Press: City,
Country, 1988.
16. Fuss, M.; McFadden, D.; Mundlak, Y. A survey of functional forms in the economic analysis of
production. History of Economic Thought Chapters 1978, 1.
17. Griffin, R.C.; Montgomery, J.M.; Rister, M.E. Selecting functional form in production function
analysis. West. J. Agric. Econ. 1987, 12, 216–227.
18. Coelli, T.J.; Rao, D.S.P.; O’Donnell, C.J.; Battese, G.E. An Introduction to Efficiency and
Productivity Analysis; Springer: City, Country, 2005.
19. Aigner, D.; Lovell, C.A.; Schmidt, P. Formulation and estimation of stochastic frontier production
function models. J. Econom. 1977, 6, 21–37.
20. Jondrow, J.; Knox Lovell, C.; Materov, I.S.; Schmidt, P. On the estimation of technical inefficiency
in the stochastic frontier production function model. J. Econom. 1982, 19, 233–238.
21. Sherif, S.; Al-Shorepy, S.; Al-Juboori, A.; Fathelrahman, E. Sustainability of Sheep and Goat
Production Systems under United Arab Emirates Aridland Constraints. APCBEE Procedia Livest.
Prod. 2013, Volume, pages.
22. Coelli, T.J. A Guide to FRONTIER Version 4.1: A Computer Program for Stochastic Frontier
Production and Cost Function Estimation; CEPA Working papers: City, Country, 1996.
23. Hall, H. Choosing an Empirical Production Function: Theory, Non-Nested Hypotheses, Costs of
Specifications; Agricultural Economics Research Report No. 59; University of Kentucky,
Department of Agricultural Economics: Lexington, KY, USA, August 1998.
© 2014 by the authors; licensee MDPI, Basel, Switzerland. This article is an open access article
distributed under the terms and conditions of the Creative Commons Attribution license
(http://creativecommons.org/licenses/by/4.0/).
Commented [mm8]: Please check what type reference it is
Formatted: Do not check spelling or grammar
Formatted: Do not check spelling or grammar
Recommended


