Statistical Parametric Mapping of Brain Morphology: Sensitivity isDramatically Increased by Using Brain-Extracted Images as Inputs
George Fein1,*, Bennett Landman1, Hoang Tran1, Jerome Barakos2, Kirk Moon2, Victoria DiSclafani1, and Robert Shumway31 Neurobehavioral Research, Inc., Corte Madera, California
2 Department of Radiology, California Pacific Medical Center, San Francisco, California
3 Department of Statistics, University of California, Davis
AbstractA major attraction of voxel-based morphometry (VBM) is that it allows researchers to explore largedatasets with minimal human intervention. However, the validity and sensitivity of the StatisticalParametric Mapping (SPM2) approach to VBM is the subject of considerable debate. We visuallyinspected the SPM2 gray matter segmentations for 101 research participants and found a grossinclusion of non-brain tissue surrounding the entire brain as gray matter in five subjects, and focalareas bordering the brain in which non-brain tissue was classified as gray matter in many othersubjects. We also found many areas in which the cortical grey matter was incorrectly excluded fromthe segmentation of the brain. The major source of these errors was the misregistration of individualbrain images with the reference T1-weighted brain template. These errors could be eliminated ifSPM2 operated on images from which non-brain tissues (scalp, skull, and meninges) are removed(brain-extracted images). We developed a modified SPM2 processing pipeline that used brain-extracted images as inputs to test this hypothesis. We describe the modifications to the SPM2 pipelinethat allow analysis of brain-extracted inputs. Using brain-extracted inputs eliminated the non-brainmatter inclusions and the cortical gray matter exclusions noted above, reducing the residual meansquare errors (RMSEs, the error term of the SPM2 statistical analyses) by over thirty percent. Weshow how this reduction in the RMSEs profoundly affects power analyses. SPM2 analyses of brain-extracted images may require sample sizes only half as great as analyses of non-brain extractedimages.
Keywordsbrain segmentation; voxel-based morphometry (VBM); statistical probability mapping; SPM2
IntroductionVoxel-based morphometry (VBM) using Statistical Parametric Mapping (SPM2) is a fullyautomated approach to the statistical assessment of differences (usually atrophic) betweengroups of subjects in their magnetic resonance images (MRI) of the brain. SPM2 uses T1-weighted brain images that include the non-brain tissues of scalp, skull, and meninges as input.The goal of VBM is to separate relevant differences in brain tissue from normal anatomicvariation, artifact, and noise (Ashburner and Friston, 2000;Good et al., 2001;Wright et al.,1995).
*Corresponding author George Fein, Ph.D., President and Senior Scientist, Neurobehavioral Research, Inc. 201 Tamal Vista Blvd, CorteMadera, CA 94925 Ph: (415) 927-7676 FAX: (415) 924-2903 e-mail: [email protected]
NIH Public AccessAuthor ManuscriptNeuroimage. Author manuscript; available in PMC 2007 September 20.
Published in final edited form as:Neuroimage. 2006 May 1; 30(4): 1187–1195.
NIH
-PA Author Manuscript
NIH
-PA Author Manuscript
NIH
-PA Author Manuscript
The power of SPM2 lies in its assumption that model error terms are normally distributed andthat the set of residuals is spatially distributed as a Gaussian field. This enables hypothesistesting on individual voxels with correction for multiple comparisons (Salmond et al., 2002).The important advantages over whole brain or region-of-interest structural image analysismethods are 1) the ability to localize structural differences with weak, or no, a prioriassumptions, 2) the computation of confidence intervals on results, and 3) the incorporation ofan automated tissue classification algorithm.
A major attraction of VBM is that it allows researchers to explore large datasets with minimalhuman intervention; however, its validity and sensitivity are the subject of considerable debate.Although its source code is openly available, the source code is highly complex and requiresa large investment of time to understand, examine, and modify its component parts. This hasslowed progress in assessing SPM2’s validity and sensitivity. Many investigators use SPM2as a ‘black box’, influencing its output by the choice of input images and system options,followed by a non-quantitative visual inspection of its results. Some assert that competentidentification of errors by visual inspection is a hopeful assumption at best, given the ad hocnature of these visual approaches (Bookstein, 2001;Crum et al., 2003).
Practical testing of the performance of SPM2 under various conditions has proven to be adaunting task. Wilke et al. (2003) screened numerous variations in SPM2 system options forthe ability to detect malformations of cortical development in epilepsy patients (usingneuroradiological readings of cortical dysplasias as the gold standard), and found that thespecific choice of preprocessing settings (smoothing, modulation, normalization) resulted in avariety of detection sensitivities. Mehta et al. (2003) evaluated the ability of SPM2 to detectfocal lesions compared to expert classification and found that SPM2 was unable to reliablyidentify lesions “due to the adverse influence of lesions on preprocessing steps, and toinsufficient statistical power”. Tisserand et al. (2002) evaluated SPM2 using manualidentification and voluming of pre-defined regions as the gold standard and concluded thatalthough voxel-based methods can provide a reasonable estimate of regional brain volume,they cannot serve as a substitute for manual volumetry. In contrast, Testa et al. (2004) reportedthat SPM2 detected more instances of hippocampal atrophy in Alzheimer’s disease than acomparison region-of-interest based method. In summary, these studies found that for someresearch questions SPM2 may have greater sensitivity than region-of-interest methods, whilefor other questions it may have reduced sensitivity; however, none of these reports suggestedthat SPM2 produces false results.
From a theoretical perspective, Bookstein argued that registration and normalization errors inthe neighborhood of tissue boundaries can profoundly affect the outcome of statistical analyses(Bookstein, 2001). Ashburner and Friston (2001) agreed that such errors likely arise in VBM,but maintain that these errors should not be associated with group membership (bias), butshould only add to error (increasing noise, and therefore decreasing sensitivity). Recently, anumber of updated and optimized methods have been introduced to minimize registration andnormalization errors (often due to ventricle size and segmentation failures around the borderof the brain) by allowing use of custom templates (Davis et al., 2004;Good et al., 2001).
In our use of SPM2 for VBM, we found that a major source of error was the misregistrationof each individual’s brain image to the reference T1-weighted brain template. We hypothesizedthat these errors would be diminished if SPM2 operated on images from which non-brain tissue(scalp, skull, and meninges) was removed (brain-extracted images). We developed a modifiedSPM2 processing pipeline that used brain-extracted images as inputs to test this hypothesis.
In this manuscript, we describe the modifications to the SPM2 pipeline that allow analysis ofbrain-extracted inputs. We also evaluate the effects (both qualitatively and quantitatively) of
Fein et al. Page 2
Neuroimage. Author manuscript; available in PMC 2007 September 20.
NIH
-PA Author Manuscript
NIH
-PA Author Manuscript
NIH
-PA Author Manuscript
these changes through: 1) a qualitative visual inspection of each subject’s gray mattersegmentation, and 2) a quantitative analysis of residual mean square errors, which are the errorterms of the SPM2 General Linear Model statistical analyses (therefore directly associated withSPM2’s sensitivity).
MethodsSubjects
This study examines recent MRI data in abstinent alcoholics and controls. Each MRI was readby a neuroradiologist. Scans were excluded for abnormalities other than white matter signalhyperintensities. The images were normal observations that did not violate the SPM2assumptions (e.g., imaging artifact). The institutional review board approved all procedures,and written consent was obtained from all individuals prior to study.
Image AcquisitionAll studies were performed on a 1.5T GE Signa Infinity with the LX platform (GE MedicalSystems, Waukesha, WI) located at the Pacific Campus of the California Pacific MedicalCenter. The imaging protocol included a transaxial T1-weighted Spoiled Gradient image (TR/TE/NEX = 35/5/1; 0.859 × 0.859 mm2 in-plane resolution; contiguous 1.3 mm thick slices).
Optimized VBM AnalysisOptimized VBM was implemented in the framework of SPM2 (Good et al., 2001), testing forgray matter differences between groups and included age, years of education, and cranium sizeas covariates. The difference in tissue volumes associated with the normal variation in craniumsize was removed using the inverse of the FSL v-scaling parameter (Smith et al., 2002), whichwe have shown previously is an excellent surrogate variable for the size of the intracranialvault (Fein et al., 2004). The analysis included all voxels in the brain that segmented as morethan 15% gray matter.
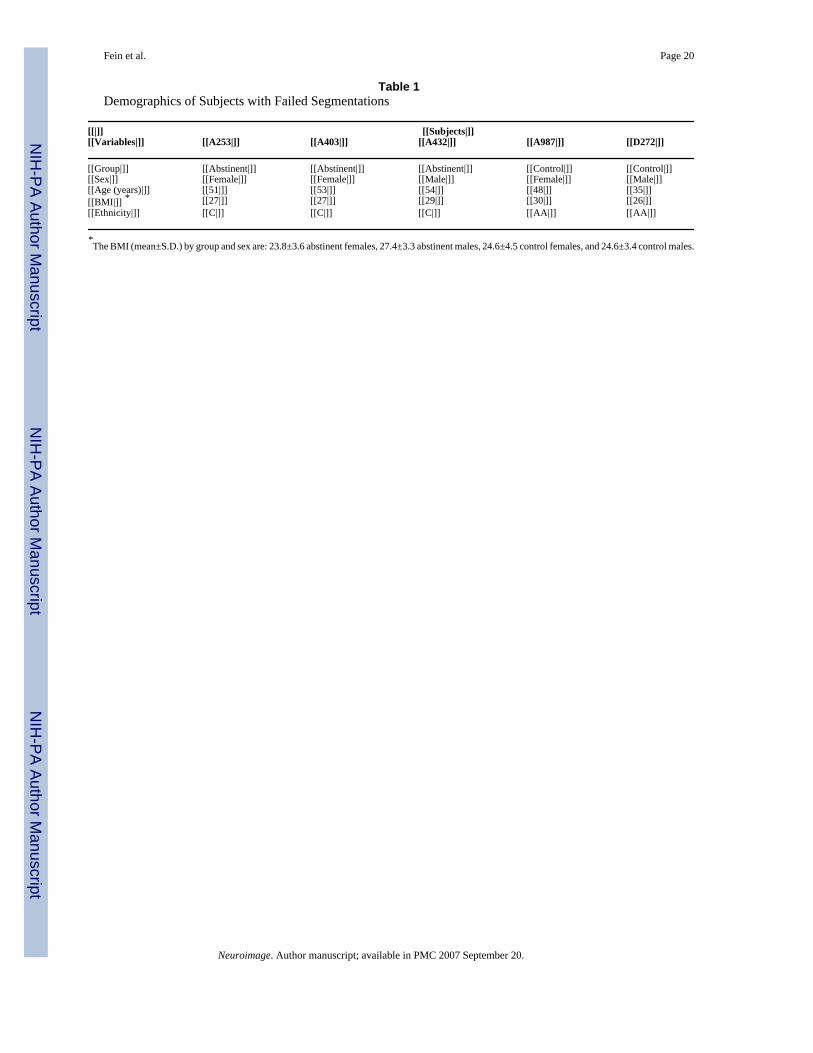
Examination of VBM PerformanceWe visually inspected the SPM2 gray matter segmentations (prior to scaling and smoothing)for all 101 research participants (see Figure 1). A gross inclusion of non-brain tissuesurrounding the entire brain as gray matter was apparent in five subjects (gross non-brain matterinclusions – gross NBMIs). In addition, for many other individuals, there were focal areasbordering the brain in which non-brain tissue was classified as gray matter (subtle NBMIs).Figure 2 shows the sagittal T1-weighted image and the gray matter segmentation for threeparticipants, illustrating gross NBMIs, subtle NBMIs and zero NBMIs. The relatively highamount of scalp fat (bright signal) around the boundary of the brain in the T1 images of thefive individuals with gross NBMIs was striking. Based on this observation, we hypothesizedthat the body mass index (BMI) was elevated in individuals with gross NBMIs. Table 1 presentsthe BMI and other demographics for the five individuals with gross NBMIs.
We performed a Monte-Carlo simulation to evaluate the hypothesis of elevated BMIs inindividuals with gross NBMIs. We constructed 10,000 random combinations of 3 females and2 males from the 100 participants for whom we had BMI values (the five segmentation failuresoccurred in 3 females and 2 males). The sum of the BMIs for the five participants with grossNBMIs was greater than the sum of 9366 of the 10,000 quintuples, yielding a probability of <0.064 that the gross NBMIs were unrelated to a participant’s BMI.
Since identification of non-brain tissue as gray matter appeared to be the primary error in thesegmentations, we hypothesized that misalignment of individuals’ brains with the brain in theMNI152 template was the culprit. Figures 3a, 3b, and 3c illustrate: 1) gross misalignment of
Fein et al. Page 3
Neuroimage. Author manuscript; available in PMC 2007 September 20.
NIH
-PA Author Manuscript
NIH
-PA Author Manuscript
NIH
-PA Author Manuscript
the MNI152 template brain with the participant’s brain for a gross NBMI individual, 2) focalmisalignments of the template brain for a subtle NBMI subject, and 3) the correct alignmentof the template brain in a zero NBMI subject. Figure 3 illustrates that misalignment also canresult in exclusion of cortical gray matter (see the subtle NBMI subject), not just in inclusionof non-brain tissue.
We tested the hypothesis that the presence of non-brain tissue in the input images and MNItemplate causes brain misalignment by modifying the SPM2 processing pipeline to use brain-extracted images and a brain-extracted MNI152 T1-weighted reference template. Non-braintissue was removed from each subject’s MRI using FSL’s Brain Extraction Tool (Smith,2002) (with default settings) followed by manual removal of any additional non-brain tissuemissed by BET using an in-house custom written plugin to Image J (Rasband, 2002). We alsoused the brain-extracted MNI152 template provided by FSL (rather than the MNI152 templatethat is provided by SPM2, which includes the non-brain tissues of scalp, skull, and meninges).The FSL template was smoothed using a 12 mm FWHM Gaussian kernel to match thesmoothing of the SPM2 template before inserting it into the SPM2 pipeline. Figures 4a, 4b,and 4c show that the outer boundaries of the SPM2 segmentations align with the outer boundaryof the brain when SPM2 uses brain-extracted inputs for the subjects in Figures 3a–c. Figure 5presents, for all 101 participants, the difference image subtracting the SPM2 segmentationcomputed with brain-extracted inputs from those computed with non-brain extracted inputs,displaying only the positive values as white. This figure illustrates the magnitude andprevalence of the effect of non-brain matter inclusions on the gray matter segmentations. Figure6 presents the difference images subtracting the SPM2 segmentations computed with non-brainextracted inputs from those computed with brain-extracted inputs, also only displaying thepositive values as white. This figure illustrates the magnitude and prevalence of the effect ofincorrect exclusion of gray matter on the gray matter segmentations (as displayed in Figure3b, above). In the analysis of non-brain extracted input images, the incorrect exclusion of graymatter appears to be as big a problem as are non-brain matter inclusions.
Residual Mean Square Errors (RMSEs)
We denote the theoretical average RMSEs for each SPM2 implementation by σi12 and σi2
2 , and
the measured RMSEs by si12 and si2
2 . Figures 7 and 8 present the measured RMSEs for SPM2using brain-extracted inputs versus non-brain extracted inputs. The histograms of the RMSEsacross the approximately 1.5 million observations (one for each voxel) are also presented inthese figures. These figures illustrate dramatically reduced RMSEs result from using brain-extracted inputs.
The mean RMSEs are s̄12 = .2098 and s̄2
2 = .4708, with variances v1 = .0132 and v2 = .0758.The average RMSE using brain-extracted inputs is less than half the average RMSE using non-brain extracted inputs, and the variance using brain-extracted inputs is about one sixth thevariance using non-brain extracted images. SPM2 test statistics for main effect and interactionswill have standard deviations proportional to 0.4580 and 0.6861 (√.2098 and √.4708). If brain-extracted image inputs are used, SPM2 can detect effect sizes that are about one third smallerthan those that can be detected using non-brain extracted inputs (0.4580/0.6861)=0.6675.
Given that the images have about 100 independent observations, and letting n = min (n1, n2)≈ 100,
Fein et al. Page 4
Neuroimage. Author manuscript; available in PMC 2007 September 20.
NIH
-PA Author Manuscript
NIH
-PA Author Manuscript
NIH
-PA Author Manuscript
z =(s̄1
2 − s̄22)
v1n1
+v2n2
will have an approximately normal distribution for reasonably large n. In this case, we obtainz = −5.96 which has a P-value of ≪0.001; a very strong rejection of the hypothesis of equalaverage RMSEs. In fact, for any n > 16, the 0.001 critical value for z = −3.09 is dramaticallyexceeded. With n ≈ 100, the α will be orders of magnitude smaller than 0.001.
DiscussionSPM2 is an implementation of VBM that uses T1-weighted brain images (that include thescalp, skull and meninges) as inputs, and incorporates a morphological clean-up step to remove‘non-brain’ tissue. We found that: 1) SPM2 does a poor job at the removal of non-brain tissue,2) poor alignment of individual images with the MNI template also results in incorrectexclusion of cortical gray matter, and 3) that both of these effects negatively impact thesensitivity of the method to detect experimental effects. Registration of each individual’s MRIto a template (the MNI152 is the SPM2 default template) is the first step in the SPM2 processingpipeline. In the work reported above, we show that errors in this initial registration occur inSPM2 and negatively impact results. Fortunately, a relatively simple modification to the SPM2pipeline can fix this misregistration problem.
Examining the SPM2 gray matter segmentation results, we observed gross segmentation errorsin a number of subjects. These errors occurred primarily at the outer boundaries of the brain,where non-brain was included in the segmentation of the brain and cortical gray matter wasincorrectly excluded from the segmentation of the brain. SPM2’s morphological clean-upfunction inadequately addressed these problems. Our solution to this problem was to modifySPM2 to process brain-extracted MRIs, and to register those images to a brain-extractedtemplate. This solution is conceptually very simple, but does involve significant work. Therewas nothing special (abnormal or ‘below par’) about our subjects’ MRIs. The MRIs wereclinically normal, except for the presence of white matter signal hyperintensities. However,sample characteristics may magnify the SPM2 registration errors described above. We notedthat MRIs with failed segmentations tended to have an abundance of high signal scalp fat. Wealso found a strong statistical trend for those individuals to have a higher BMI than our otherresearch participants. It may be that any condition or disease that affects the fat signal fromthe scalp (obesity, anorexia, etc.) may impact the sensitivity SPM2 results.
Senjem et al (2005) recently compared a number of different methodological implementationsof SPM2 in the analysis of morphological changes in Alzheimer’s disease. One of the methodshe presented did include removal of non-brain tissue from the image inputs (brain extraction).However, their publication is not directly comparable to this manuscript. While Senjem helpedidentify important questions about the SPM2 approach to VBM, they did not: 1) assesssensitivity or validity in a quantitative manner 2) incorporate brain extraction prior toregistration and alignment, 3) examine segmentation results for individual subjects.
The increased sensitivity that derives from the analysis of brain-extracted images has dramaticeffects on experimental power. For example, if one wanted to replicate a finding of a meandifference of d=0.8 from a non-brain extracted analysis, this would translate into an effect sizeof d=1.19 for the analysis of brain-extracted images. Power of 0.80 for such a replication studywould require samples of 26 subjects per group for non-brain extracted images (d=0.8) andabout 12 subjects per group for brain-extracted images (d=1.19). Conversely, an effect size ofd=0.8 from a study with brain-extracted images (requiring the same 26 subjects per group)
Fein et al. Page 5
Neuroimage. Author manuscript; available in PMC 2007 September 20.
NIH
-PA Author Manuscript
NIH
-PA Author Manuscript
NIH
-PA Author Manuscript
would translate to an effect size of d=0.54 for non-brain extracted images (now requiring 54subjects per group for power of 0.80). Thus, our best estimate is that sample sizes half as largeare required to detect the same size effects for brain-extracted vs. non-brain extracted inputs.
In sum, complete initial removal of all non-brain tissue from brain MRIs results in moresensitive analyses of brain morphology using SPM2. We note that we have not even begun toaddress the controversy in the literature regarding SPM2 that deals with its use of priorprobability templates in its Bayesian approach to tissue segmentation. First, the priorprobability template must be appropriate for the population from which research subjects aredrawn. For example, it may not be appropriate to use MNI152 tissue probability templates forsamples outside of the age range from which the MNI152 sample was drawn. Second, the priorprobability template used may better match tissue probabilities in one research group thananother. This is likely to be the case in comparing an Alzheimer Disease sample to agecomparable normal controls. The AD sample is likely to have much larger ventricles andcortical atrophy. No single template would be equally appropriate for both groups; however,each group’s MRIs must be processed identically to avoid the introduction of method inducedbias. One might consider replacing the Bayesian segmentation in SPM2 with a segmentationapproach that does not require a prior probability template. In the manuscript presented abovewe provide a framework for the examination of these problems and their potential solutions.
Acknowledgements
This work was supported by Grants AA11311 (GF) and AA13659 (GF), both from the National Institute of Alcoholismand Alcohol Abuse.
ReferencesAshburner J, Friston KJ. Voxel-based morphometry--the methods. Neuroimage 2000;11:805–21.
[PubMed: 10860804]Ashburner J, Friston KJ. Why voxel-based morphometry should be used. Neuroimage 2001;14:1238–
43. [PubMed: 11707080]Bookstein FL. Voxel-based morphometry” should not be used with imperfectly registered images.
Neuroimage 2001;14:1454–62. [PubMed: 11707101]Crum WR, Griffin LD, Hill DL, Hawkes DJ. Zen and the art of medical image registration:
correspondence, homology, and quality. Neuroimage 2003;20:1425–37. [PubMed: 14642457]Davis, B.; Lorenzen, P.; Joshi, S. Large deformation minimum mean squared error template estimation
for computational anatomy. Paper presented at the Proceedings of the IEEE Symposium on BiomedicalImaging; Arlington, VA. 2004; 2004.
Fein G, Di Sclafani V, Taylor C, Moon K, Barakos J, Tran H, Landman B, Shumway R. Controlling forpremorbid brain size in imaging studies: T1-derived cranium scaling factor vs. T2-derived intracranialvault volume. Psychiatry Res 2004;131:169–76. [PubMed: 15313523]
Good CD, Johnsrude IS, Ashburner J, Henson RN, Friston KJ, Frackowiak RS. A voxel-basedmorphometric study of ageing in 465 normal adult human brains. Neuroimage 2001;14:21–36.[PubMed: 11525331]
Mehta S, Grabowski TJ, Trivedi Y, Damasio H. Evaluation of voxel-based morphometry for focal lesiondetection in individuals. Neuroimage 2003;20:1438–54. [PubMed: 14642458]
Rasband, W. Image J [PC program]. National Institute of Health; USA: 2002.Salmond CH, Ashburner J, Vargha-Khadem F, Connelly A, Gadian DG, Friston KJ. Distributional
assumptions in voxel-based morphometry. Neuroimage 2002;17:1027–30. [PubMed: 12377176]Senjem ML, Gunter JL, Shiung MM, Petersen RC, Jack CR Jr. Comparison of different methodological
implementations of voxel-based morphometry in neurodegenerative disease. Neuroimage2005;26:600–8. [PubMed: 15907317]
Smith SM. Fast robust automated brain extraction. Human Brain Mapping 2002;17:143–155. [PubMed:12391568]
Fein et al. Page 6
Neuroimage. Author manuscript; available in PMC 2007 September 20.
NIH
-PA Author Manuscript
NIH
-PA Author Manuscript
NIH
-PA Author Manuscript
Smith SM, Zhang Y, Jenkinson M, Chen J, Matthews PM, Federico A, De Stefano N. Accurate, robust,and automated longitudinal and cross-sectional brain change analysis. Neuroimage 2002;17:479–89.[PubMed: 12482100]
Testa C, Laakso MP, Sabattoli F, Rossi R, Beltramello A, Soininen H, Frisoni GB. A comparison betweenthe accuracy of voxel-based morphometry and hippocampal volumetry in Alzheimer’s disease. JMagn Reson Imaging 2004;19:274–82. [PubMed: 14994294]
Tisserand DJ, Pruessner JC, Sanz Arigita EJ, van Boxtel MP, Evans AC, Jolles J, Uylings HB. Regionalfrontal cortical volumes decrease differentially in aging: an MRI study to compare volumetricapproaches and voxel-based morphometry. Neuroimage 2002;17:657–69. [PubMed: 12377141]
Wilke M, Kassubek J, Ziyeh S, Schulze-Bonhage A, Huppertz HJ. Automated detection of gray mattermalformations using optimized voxel-based morphometry: a systematic approach. Neuroimage2003;20:330–43. [PubMed: 14527593]
Wright IC, McGuire PK, Poline JB, Travere JM, Murray RM, Frith CD, Frackowiak RS, Friston KJ. Avoxel-based method for the statistical analysis of gray and white matter density applied toschizophrenia. Neuroimage 1995;2:244–52. [PubMed: 9343609]
Fein et al. Page 7
Neuroimage. Author manuscript; available in PMC 2007 September 20.
NIH
-PA Author Manuscript
NIH
-PA Author Manuscript
NIH
-PA Author Manuscript
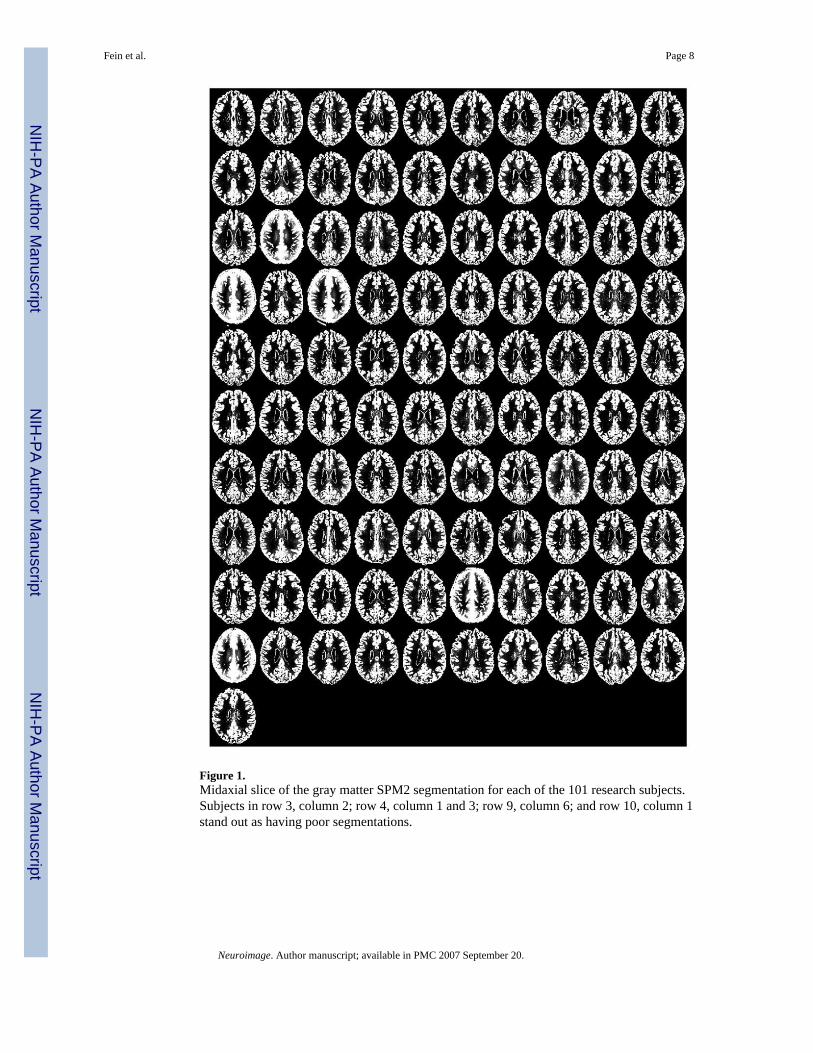
Figure 1.Midaxial slice of the gray matter SPM2 segmentation for each of the 101 research subjects.Subjects in row 3, column 2; row 4, column 1 and 3; row 9, column 6; and row 10, column 1stand out as having poor segmentations.
Fein et al. Page 8
Neuroimage. Author manuscript; available in PMC 2007 September 20.
NIH
-PA Author Manuscript
NIH
-PA Author Manuscript
NIH
-PA Author Manuscript
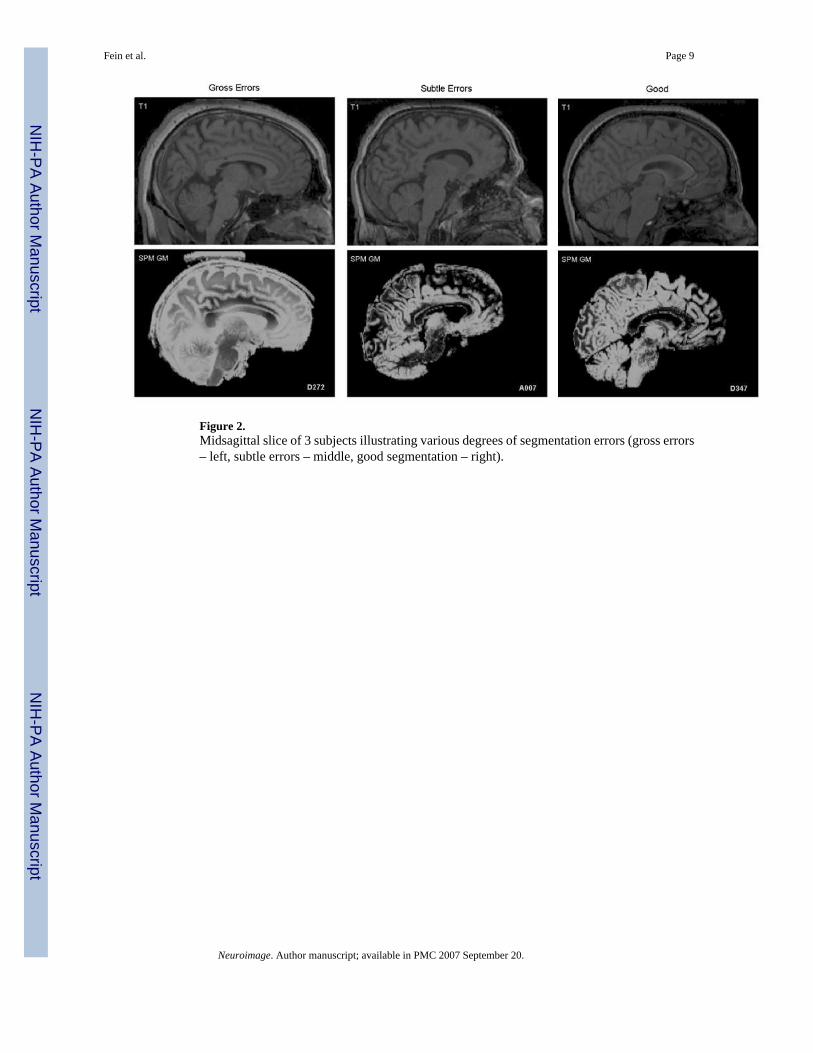
Figure 2.Midsagittal slice of 3 subjects illustrating various degrees of segmentation errors (gross errors– left, subtle errors – middle, good segmentation – right).
Fein et al. Page 9
Neuroimage. Author manuscript; available in PMC 2007 September 20.
NIH
-PA Author Manuscript
NIH
-PA Author Manuscript
NIH
-PA Author Manuscript
Fein et al. Page 10
Neuroimage. Author manuscript; available in PMC 2007 September 20.
NIH
-PA Author Manuscript
NIH
-PA Author Manuscript
NIH
-PA Author Manuscript

Fein et al. Page 11
Neuroimage. Author manuscript; available in PMC 2007 September 20.
NIH
-PA Author Manuscript
NIH
-PA Author Manuscript
NIH
-PA Author Manuscript
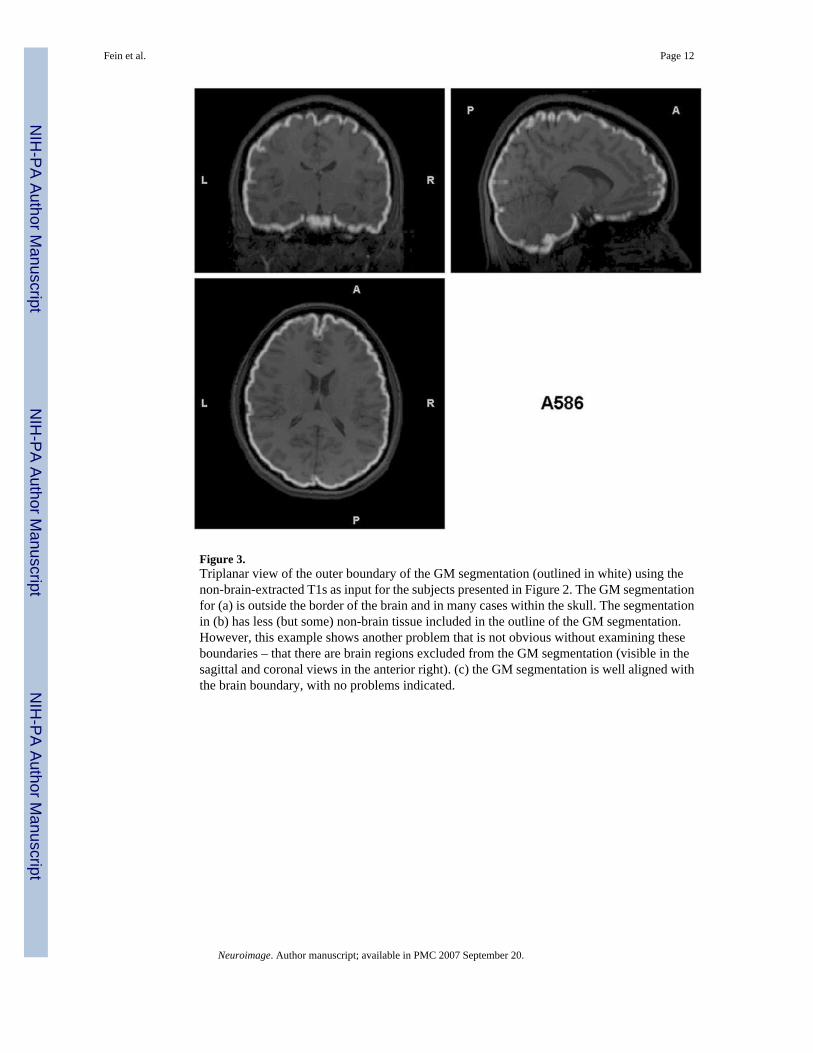
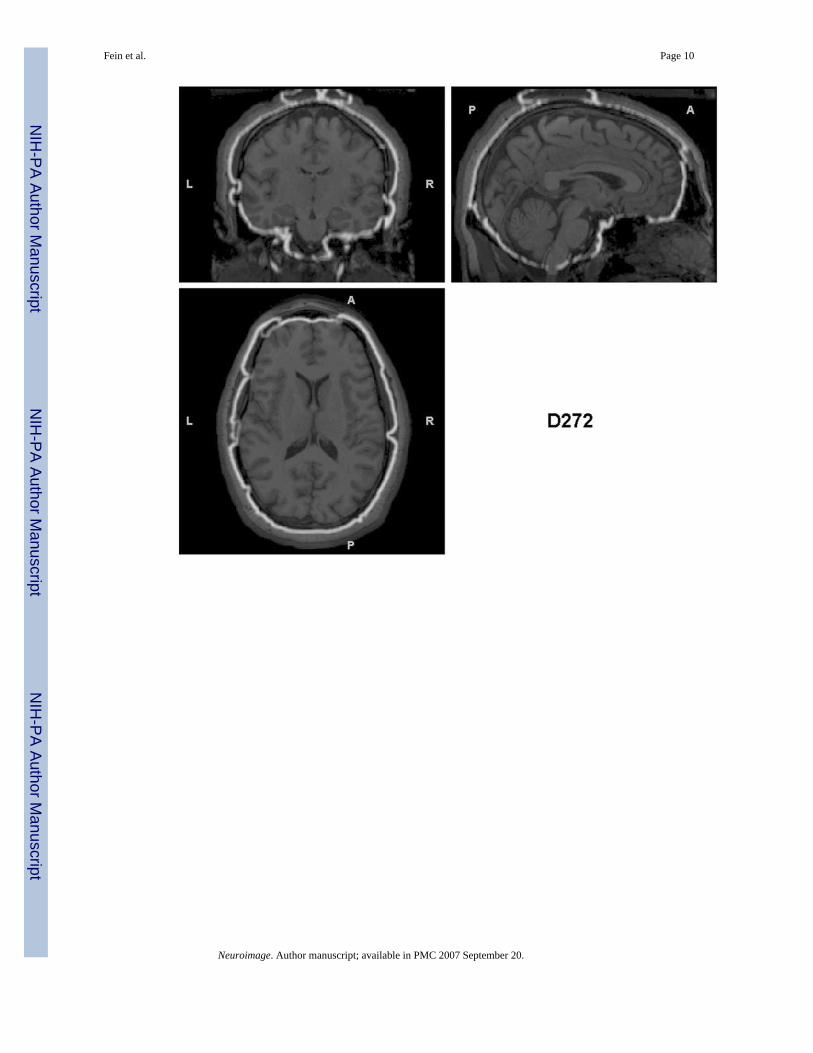
Figure 3.Triplanar view of the outer boundary of the GM segmentation (outlined in white) using thenon-brain-extracted T1s as input for the subjects presented in Figure 2. The GM segmentationfor (a) is outside the border of the brain and in many cases within the skull. The segmentationin (b) has less (but some) non-brain tissue included in the outline of the GM segmentation.However, this example shows another problem that is not obvious without examining theseboundaries – that there are brain regions excluded from the GM segmentation (visible in thesagittal and coronal views in the anterior right). (c) the GM segmentation is well aligned withthe brain boundary, with no problems indicated.
Fein et al. Page 12
Neuroimage. Author manuscript; available in PMC 2007 September 20.
NIH
-PA Author Manuscript
NIH
-PA Author Manuscript
NIH
-PA Author Manuscript

Fein et al. Page 13
Neuroimage. Author manuscript; available in PMC 2007 September 20.
NIH
-PA Author Manuscript
NIH
-PA Author Manuscript
NIH
-PA Author Manuscript

Fein et al. Page 14
Neuroimage. Author manuscript; available in PMC 2007 September 20.
NIH
-PA Author Manuscript
NIH
-PA Author Manuscript
NIH
-PA Author Manuscript
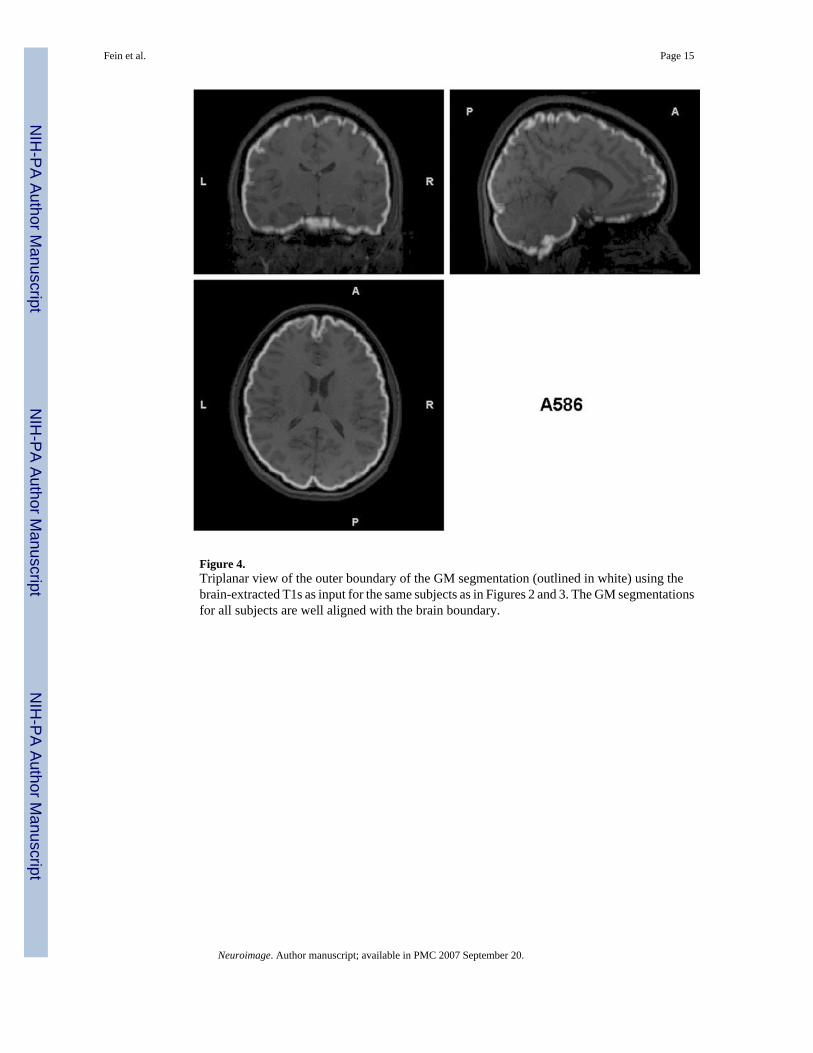
Figure 4.Triplanar view of the outer boundary of the GM segmentation (outlined in white) using thebrain-extracted T1s as input for the same subjects as in Figures 2 and 3. The GM segmentationsfor all subjects are well aligned with the brain boundary.
Fein et al. Page 15
Neuroimage. Author manuscript; available in PMC 2007 September 20.
NIH
-PA Author Manuscript
NIH
-PA Author Manuscript
NIH
-PA Author Manuscript
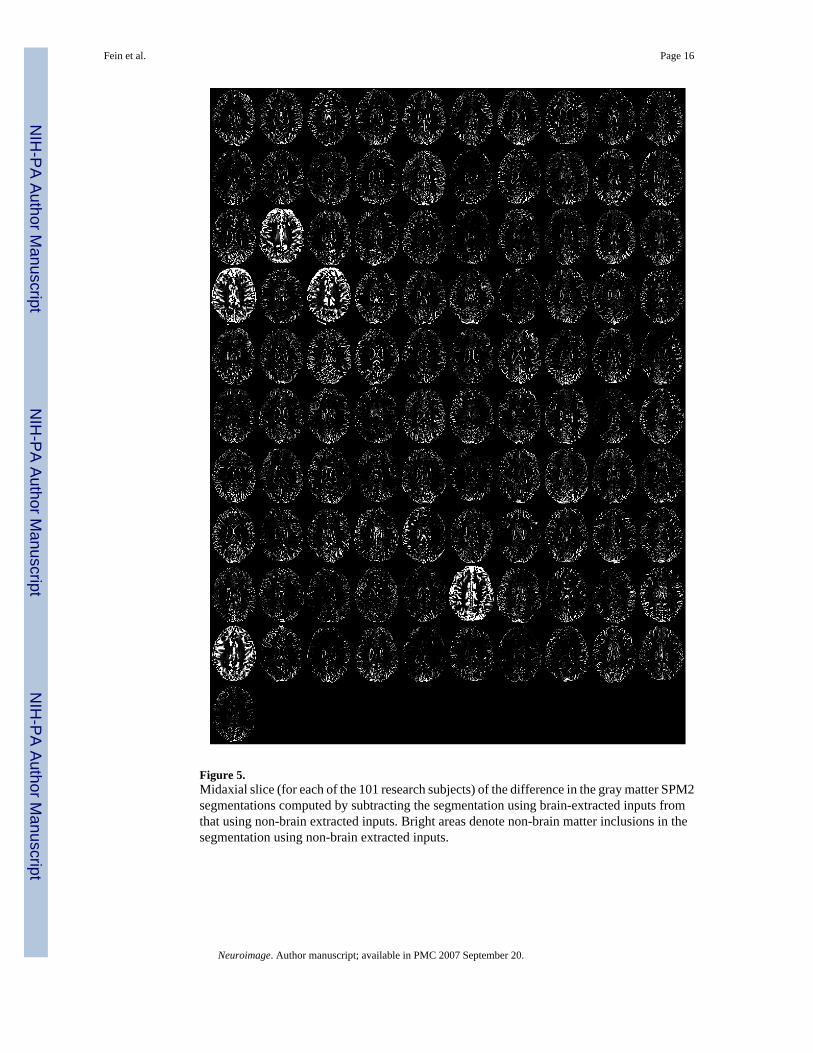
Figure 5.Midaxial slice (for each of the 101 research subjects) of the difference in the gray matter SPM2segmentations computed by subtracting the segmentation using brain-extracted inputs fromthat using non-brain extracted inputs. Bright areas denote non-brain matter inclusions in thesegmentation using non-brain extracted inputs.
Fein et al. Page 16
Neuroimage. Author manuscript; available in PMC 2007 September 20.
NIH
-PA Author Manuscript
NIH
-PA Author Manuscript
NIH
-PA Author Manuscript
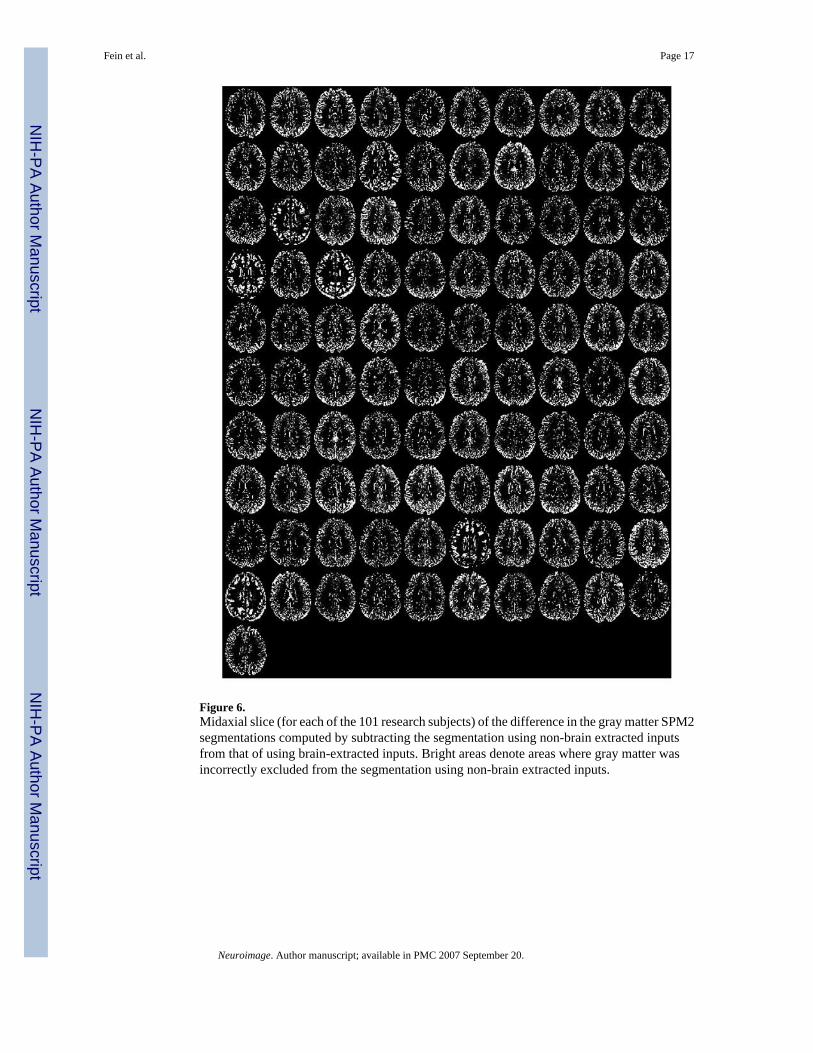
Figure 6.Midaxial slice (for each of the 101 research subjects) of the difference in the gray matter SPM2segmentations computed by subtracting the segmentation using non-brain extracted inputsfrom that of using brain-extracted inputs. Bright areas denote areas where gray matter wasincorrectly excluded from the segmentation using non-brain extracted inputs.
Fein et al. Page 17
Neuroimage. Author manuscript; available in PMC 2007 September 20.
NIH
-PA Author Manuscript
NIH
-PA Author Manuscript
NIH
-PA Author Manuscript
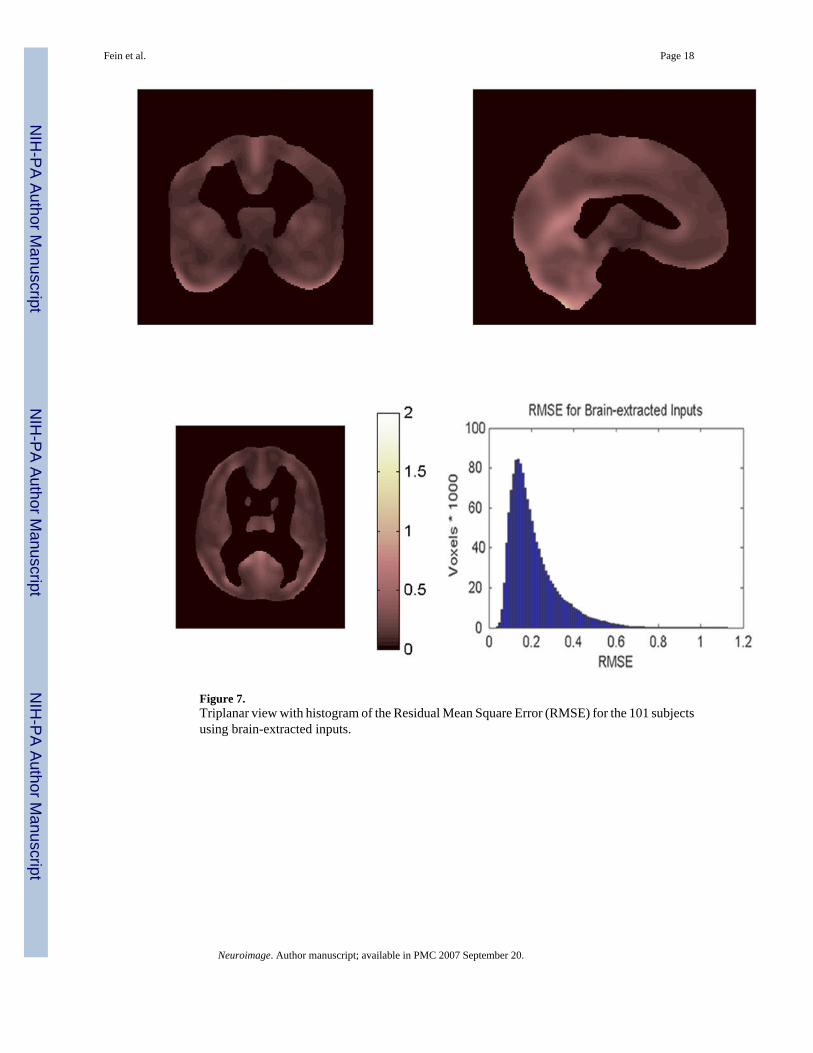
Figure 7.Triplanar view with histogram of the Residual Mean Square Error (RMSE) for the 101 subjectsusing brain-extracted inputs.
Fein et al. Page 18
Neuroimage. Author manuscript; available in PMC 2007 September 20.
NIH
-PA Author Manuscript
NIH
-PA Author Manuscript
NIH
-PA Author Manuscript
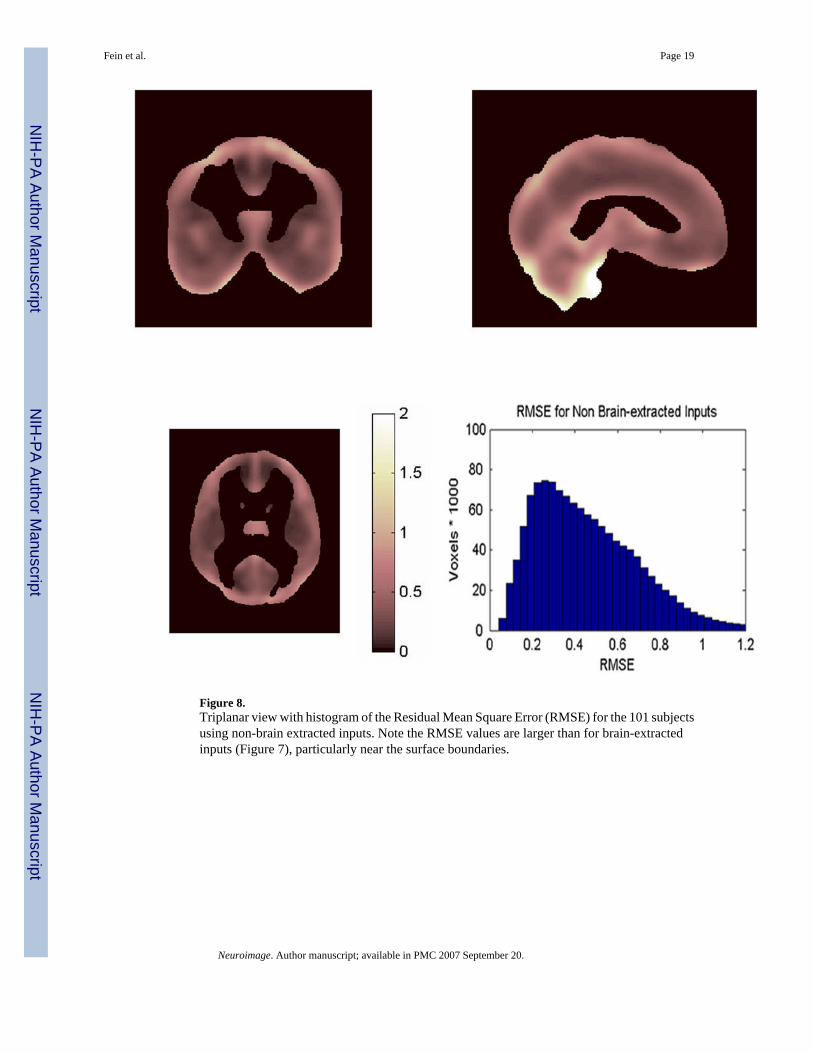
Figure 8.Triplanar view with histogram of the Residual Mean Square Error (RMSE) for the 101 subjectsusing non-brain extracted inputs. Note the RMSE values are larger than for brain-extractedinputs (Figure 7), particularly near the surface boundaries.
Fein et al. Page 19
Neuroimage. Author manuscript; available in PMC 2007 September 20.
NIH
-PA Author Manuscript
NIH
-PA Author Manuscript
NIH
-PA Author Manuscript
NIH
-PA Author Manuscript
NIH
-PA Author Manuscript
NIH
-PA Author Manuscript
Fein et al. Page 20
Table 1Demographics of Subjects with Failed Segmentations
[[|]] [[Subjects|]][[Variables|]] [[A253|]] [[A403|]] [[A432|]] [[A987|]] [[D272|]]
[[Group|]] [[Abstinent|]] [[Abstinent|]] [[Abstinent|]] [[Control|]] [[Control|]][[Sex|]] [[Female|]] [[Female|]] [[Male|]] [[Female|]] [[Male|]][[Age (years)|]] [[51|]] [[53|]] [[54|]] [[48|]] [[35|]][[BMI|]] * [[27|]] [[27|]] [[29|]] [[30|]] [[26|]][[Ethnicity|]] [[C|]] [[C|]] [[C|]] [[AA|]] [[AA|]]
*The BMI (mean±S.D.) by group and sex are: 23.8±3.6 abstinent females, 27.4±3.3 abstinent males, 24.6±4.5 control females, and 24.6±3.4 control males.
Neuroimage. Author manuscript; available in PMC 2007 September 20.
Recommended


