Structural Characterisation and Dehydration Behaviour ofSiramesine Hydrochloride
ANNE ZIMMERMANN,1 FANG TIAN,1 HEIDI LOPEZ DE DIEGO,2 KARLA FRYDENVANG,3 JUKKA RANTANEN,1
MICHIEL RINGKJØBING ELEMA,4 LARS HOVGAARD1
1Faculty of Pharmaceutical Sciences, Department of Pharmaceutics and Analytical Chemistry, University of Copenhagen,Universitetsparken 2, 2100 Copenhagen Ø, Denmark
2H. Lundbeck A/S, Preformulation, Ottiliavej 9, 2500 Copenhagen-Valby, Denmark
3Faculty of Pharmaceutical Sciences, Department of Medicinal Chemistry, University of Copenhagen, Universitetsparken 2,2100 Copenhagen Ø, Denmark
4H. Lundbeck A/S, Pharmaceutical Development, Ottiliavej 9, 2500 Copenhagen-Valby, Denmark
Received 20 June 2008; revised 14 October 2008; accepted 15 November 2008
Published online 20 January 2009 in Wiley InterScience (www.interscience.wiley.com). DOI 10.1002/jps.21679
Lars HovgaaPreformulationDenmark.
Corresponde35-33-63-66; Fa
Journal of Pharm
� 2009 Wiley-Liss
3596 JOURN
ABSTRACT: In this study the crystal structures of siramesine hydrochloride anhydratea-form and siramesine hydrochloride monohydrate were determined, and this struc-tural information was used to explain the physicochemical properties of the two solidforms. In the crystal structure of the monohydrate, each water molecule is hydrogenbonded to two chloride ions, and thus the water is relatively strongly bound in thecrystal. No apparent channels for dehydration were observed in the monohydratestructure, which could allow transmission of structural information during dehydration.Instead destructive dehydration occurred, where the elimination of water from themonohydrate resulted in the formation of an oily phase, which subsequently recrys-tallised into one or more crystalline forms. Solubility and intrinsic dissolution rate of theanhydrate a-form and the monohydrate in aqueous media were investigated and bothwere found to be lower for the monohydrate compared to the anhydrate a-form. Finally,the interactions between water molecules and chloride ions in the monohydrate as wellas changes in packing induced by water incorporation could be detected by spectroscopictechniques. � 2009 Wiley-Liss, Inc. and the American Pharmacists Association J Pharm Sci
98:3596–3607, 2009
Keywords: crystal structure; solid sta
te properties; X-ray powder diffractometry(XRPD); thermal analysis; monohydrate; dehydration; solubility; intrinsic dissolutionrate; near infrared spectroscopy (NIR); Raman spectroscopyINTRODUCTION
During crystallisation processes solvent mole-cules may become incorporated into the crystal
rd’s present address is Novo Nordisk A/S,and Delivery, Novo Nordisk Park, 2760 Maløv,
nce to: Anne Zimmermann (Telephone: þ45-x: þ45-35-33-60-30; E-mail: [email protected])
aceutical Sciences, Vol. 98, 3596–3607 (2009)
, Inc. and the American Pharmacists Associationl
AL OF PHARMACEUTICAL SCIENCES, VOL. 98, NO. 10, OC
structure of an active pharmaceutical ingredient(API). A hydrate is formed when the incorporatedsolvent is water.1 Changing the arrangement ofmolecules in the crystal lattice changes the solidstate properties such as solubility and stabilityof the solid. The solubility affects the dissolutionrate of an API, and hence, bioavailability may bealtered by hydrate formation. Generally theanhydrous form of a substance has higher watersolubility than corresponding hydrates.1–3 Further-more, solid state properties affect processing
TOBER 2009
SIRAMESINE HYDROCHLORIDE 3597
properties as well as the shelf life of drugs.4,5
Thus, knowledge of the possible solid forms of adrug and the solid state properties of these solidforms is of vital importance in the developmentof pharmaceutical drug substances and drugproducts.5
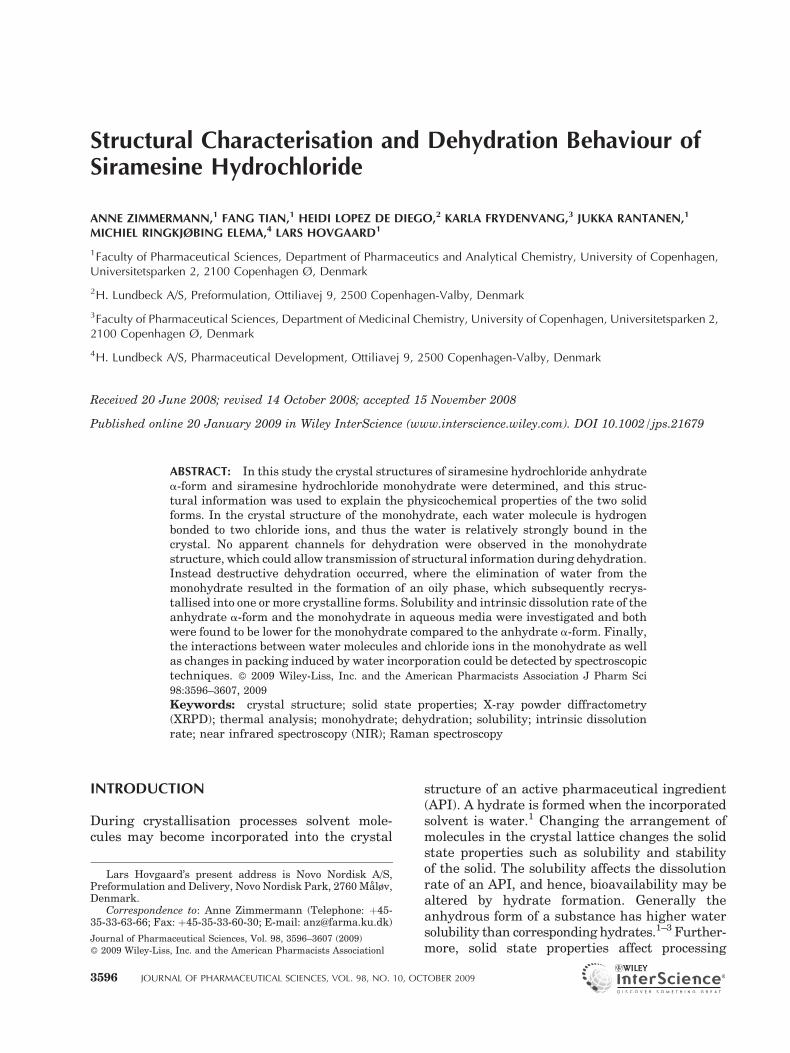
Siramesine (Lu 28-179) is a poorly water-soluble drug, which has been prepared as ahydrochloride salt (Fig. 1). The water-solubilityof siramesine hydrochloride is 150 mg/mL and themolecular weight is 491.06 g/mol. It has pKa� 9and log P� 8.5. Both the hydrochloride salt andthe free base have been used as model compoundsin studies on formulations with enhanced dis-solution rate. Lipid formulations6,7 and soliddispersions8 have been prepared and pro-drugsof the free base have been synthesised andevaluated.9 Furthermore, the drug has been usedto investigate solubilisation and lymphatic trans-port of lipophilic drugs.10,11 However, the crystalstructures and the solid state characterisation ofthe hydrochloride salt and its recently discoveredcorresponding monohydrate have not beenreported before.
Therefore, the aims of this study were (1) tosolve and report the structures of siramesinehydrochloride anhydrate and monohydrate, and(2) to characterise these two solid phases ofsiramesine hydrochloride. A specific emphasiswas to examine the possible relationship betweenthe crystal structure of each solid form and itsphysicochemical properties. Thermal methodswere employed to study the stability of the formsas well as to elucidate the dehydration mechanismof the monohydrate. Further, a spectroscopiccharacterisation of the solid forms includingRaman, mid-IR and near-IR was performed toasses the potential of these methods for control-ling the solid state properties of the drug duringprocessing. The investigation revealed the exis-tence of two anhydrous forms besides the knownanhydrate form (a). These will be designated b
and g in the following.
Figure 1. Molecular structure of siramesine hydro-chloride.
DOI 10.1002/jps JOURN
EXPERIMENTAL
Materials
The anhydrous a-form of the hydrochloride saltof siramesine 1’-[4-[1-(p-fluorophenyl)indol-3-yl]-butyl]spiro[phthalan-1,4’-piperidine] was suppliedby H. Lundbeck A/S, Denmark. The monohydratewas obtained from the anhydrous a-form throughantisolvent precipitation. The anhydrate a-formwas dissolved in 96% ethanol (1% w/v, 50 mL)followed by rapid mixing with 200 mL of waterunder stirring conditions. Precipitation occurredinstantly, and after 60 min the particles wereisolated by vacuum filtration and dried overanhydrous silica in a dessicator. In the following,the anhydrate a-form salt will be referred to asSMH anhydrate a-form and the monohydrate saltas SMH monohydrate.
Single Crystal Preparation
Single crystals of both forms for single crystalX-ray analysis were obtained by recrystallisationfrom 96% ethanol. A 5% solution of SMHanhydrate a-form was prepared at 508C understirring conditions, followed by cooling to roomtemperature. Within 24 h, needle shaped anhy-drate a-form crystals appeared, and of these somewere selected for analysis. During the following48 h, due to the activity of the 4% water present inethanol, the anhydrate a-form crystals dissolvedand recrystallised as the monohydrate form,which was finally isolated by filtration.
Single Crystal X-Ray Analysis of SMHAnhydrate a-Form and SMH Monohydrate
Data Collection and Processing
Diffraction data (Tab. 1) were collected on anEnraf-Nonius KappaCCD diffractometer usinggraphite monochromated Mo Ka radiation(l¼ 0.71073 A).12 Data were reduced using theprogram EvalCCD.13,14 Absorption correction wasapplied using the program NUMABS.15
Structure Solution and Refinement
The structure was solved by the direct methodusing the program SHELXS9716,17 and refinedusing the program SHELXL97.18 Full matrixleast-squares refinement on F2 was performed,minimizing
PwðF2
o�F2c Þ
2, with anisotropic
AL OF PHARMACEUTICAL SCIENCES, VOL. 98, NO. 10, OCTOBER 2009
Table 1. Crystal Data, Data Collection and Structure Refinement for SMH (Anhydrate a-Form at 122 and 293K andMonohydrate at 293K)
Chemical Formula C30H32ClFN2O C30H32ClFN2O C30H32ClFN2OþH2O
Mw 491.03 491.03 509.04Temp. (K) 122(1) 293(1) 293(1)Cell setting Orthorhombic Orthorhombic MonoclinicSpace group Pbca Pbca P21/cUnit cell:
a (A) 17.208(3) 17.3510(9) 14.7100(15)b (A) 6.969(10) 7.0590(16) 9.2910(4)c (A) 42.81(2) 42.859(10) 23.178(2)b (8) 90.0 90.0 120.391(11)V (A3) 5134(8) 5249.4(17) 2732.5(4)Z 8 8 4
Crystal density (g/cm3) 1.270 1.243 1.237Range u 2.24–25.00 2.23–19.89 2.42–26.00Reflection unique 4525 2411 5366R(int) 0.0904 0.1175 0.0986Reflections obs. (2s(I)) 3313 1962 4289Parameters 355 275 334Extinction parameter 0.0015(4) 0.0019(5) —R (obs) 0.077 0.0963 0.0636Rw (obs) 0.175 0.2181 0.1330Goodness of fit 1.032 1.165 1.142
3598 ZIMMERMANN ET AL.
displacement parameters for nonhydrogen atoms(Tab. 1). The positions of the hydrogen atomswere examined on intermediate difference elec-tron density maps. Nearly all hydrogen atomswere included in calculated positions, riding onthe parent atoms with fixed isotropic displace-ment parameters. Only the positions of hydrogenatoms connected to the nitrogen atom and thewater oxygen atom were refined with fixed iso-tropic displacement parameters. Complex atomicscattering factors for neutral atoms were asincorporated in SHELXL97.18,19
For the crystal structures of SMH anhydratea-form (low and room temperature) disorder wasobserved in diffraction images as Bragg rods in thedirection of c�. These were caused by disorder ofthe chloride ion and the phthalan ring systemlocated perpendicular to the long c-axis. Twoalternative positions (conformations) were intro-duced, but high displacement parameters indicatethat more positions might be relevant. A part ofthe piperidine ring also showed high displacementparameters and this indicates that alternativepositions could be relevant. Due to low parameter/reflection ratio this was not introduced. To reducethe number of parameters, the benzene moietieswere introduced as rigid moieties with fixedgeometry and for the room temperature data
JOURNAL OF PHARMACEUTICAL SCIENCES, VOL. 98, NO. 10, OCTOBER 2009
the disordered part of the molecule was refinedwith isotropic displacement parameters.
Fractional atomic coordinates, list of anisotro-pic displacement parameters and a complete listof geometrical data have been deposited in Cam-bridge Crystallographic Data Centre (anhydratea-form 122K CCDC 689613; anhydrate a-form293K CCDC 689614; monohydrate CCDC 689612).
X-Ray Powder Diffraction (XRPD)
X-ray powder diffractograms were measured ona PANalytical X’Pert PRO X-Ray Diffractometer(Almelo, Netherlands) using Cu Ka1 radiation(l¼ 1.5406 A). The voltage and current were 45 kVand 40 mA respectively. Samples were measuredin reflection mode in the 2u-range 5–408 using anX’celerator detector; the resolution was 0.0334 82u.Data were collected using X’Pert Data Collector(PANalytical B.V., Almelo, The Netherlands).Theoretical diffraction patterns were calculatedbased on single crystal X-ray analysis data usingMercury 1.4.2 software (The Cambridge Crystal-lographic Data Centre, Cambridge, UK).
Variable temperature XRPD of the monohy-drate was performed by employing an AntonPaar sample stage TTK 450 (Anton Paar, Graz,
DOI 10.1002/jps
SIRAMESINE HYDROCHLORIDE 3599
Austria). Analyses were carried out at tempera-tures between 30 and 2108C in the 2u-range 5–308.
Thermal Analysis
Differential Scanning Calorimetry (DSC)
DSC was used to determine the thermal beha-viour of SMH anhydrate and monohydrate.Measurements were performed in a DSC-Q1000(TA-Instruments, New Castle, DE). Approxi-mately 2 mg of sample was placed in pin-holedaluminium pans and heated from 25 to 2758C at aheating rate of 58C/min. Nitrogen was used aspurge gas at a flow rate of 50 mL/min.
Thermo Gravimetric Analysis (TGA)
To estimate the water contents of the dried mater-ials, a thermo gravimetric analyser (Perkin-ElmerTGA7, Shelton, CT) was used. Samples ofapproximately 5 mg were weighed into aluminiumpans and heated from 30 to 3508C at a heating rateof 108C/min under nitrogen flow.
Hot Stage Microscopy (HSM)
A Linkam Hotstage LTS350 (Linkam, Surrey,UK) was mounted on an Olympus BX50 micro-scope (Hamburg, Germany). SMH monohydratewas placed on the hot stage and heated to 3508C ata heating rate of 208C/min. Pictures were takenevery 15 s with a Pixelink PL-A662 digital camera.Linksys 32 software (Linkam) was used for dataacquisition and temperature control.
Equilibrium Solubility
The solubility of SMH anhydrate a-form andmonohydrate in 0.01 M acetic acid was investi-gated. Saturated solutions were prepared byintroducing excess amounts of drug (30 mg) into3 mL acetic acid in vials, which were rotated for72 h at room temperature. The samples were thenfiltered and the supernatant was assayed byHPLC as described by Christensen et al.10 Thesolubility of each solid form was analysed intriplicate. The HPLC system comprised an iso-cratic pump model L-6200, an autosampler (AS2000A), a column thermostat (L-5025), a D-6000Interface, and a L-4250 UV–VIS detector, allobtained from Merck Hitachi (Tokyo, Japan).Data acquisition and analysis were performedusing D-7000 HSM software, also obtained from
DOI 10.1002/jps JOURN
Merck Hitachi. Glacial acetic acid 100% and citricacid monohydrate, GR for analysis, was suppliedby Merck (Darmstadt, Germany) and HPLC gradeacetonitrile was obtained from LAB-SCAN analy-tical sciences (Dublin, Ireland). The precipitateswere analysed by XRPD to make sure that notransformation in crystal form occurred duringthe experiment.
Intrinsic Dissolution Rate (IDR)
Intrinsic dissolution rate in 0.01 M acetic acidwas determined using the USP paddle method ata temperature of 378C and a rotation speed of100 rpm. Each vessel was filled with 900 mL ofdissolution medium. Disks of the monohydrate(70 mg) were compressed at 1 ton, whereas 4 tonswere needed to make suitable disks of theanhydrate a-form. The disks were prepareddirectly into sample holders, which were placedat the bottom of flat-bottomed dissolution vessels.In this way, only one side of the disks were incontact with the dissolution medium. At fixed timepoints, 2 mL aliquots were withdrawn manuallyover a period of 4 h, followed by quantification byHPLC as described in Equilibrium SolubilitySection. Three replicates were performed for eachsolid phase. After completion of the dissolutionexperiment, the disks were examined by XRPD. Inaddition, disks of each species were compressedand examined by XRPD to ensure that no changesin crystal forms occurred during compression.
Vibrational Spectroscopy
Raman Spectroscopy
A Renishaw Ramascope System 1000 with a NIRdiode laser (l¼ 785 nm) was used to obtain Ramanspectra. The solid samples were viewed under anoptical Raman microscope through a 20� objective,and the Raman spectra were collected using thesame objective. A Rencam Charge Coupled Device(CCD) silicon detector was used to acquire Ramanshifts. The exposure time for all solid sampleswas 5 s with two accumulations at a laser powerof 50 mW. Wire V.2.0 software was used forinstrument control and data acquisition.
FT-IR Spectroscopy
Each sample was physically mixed with KBr toa drug concentration of 0.5 wt%. The powdermixtures (250 mg) were gently grinded and then
AL OF PHARMACEUTICAL SCIENCES, VOL. 98, NO. 10, OCTOBER 2009
3600 ZIMMERMANN ET AL.
compressed into a pellet of 12 mm w. The spectra ofall the samples were measured in absorption modeusing a BOMEN MB155 spectrophotometer, with64 scans and a resolution of 4 cm�1.
Near-Infrared Spectroscopy (NIR)
NIR spectra were obtained in the reflectance modeusing an FT-NIR spectrometer (Thermo FisherScientific (Waltham, MA), Nicolet Antaris Near-IR Analyzer) equipped with an InGaAs detectorand a quartz halogen lamp. A total of 32 scans perspectrum were acquired in the range 10,000 –4000 cm�1. Spectral resolution was 8 cm�1. Priorto analysis, each sample was transferred to a glassvial having an outer diameter of 17 mm. Subse-quently, samples were measured in random orderthrough the bottom of the glass vial. Measure-ments were performed in triplicate at differentvial positions.
RESULTS AND DISCUSSION
Crystal Structures of SMH Anhydrate a-Form andSMH Monohydrate
Single crystal X-ray analyses of SMH anhydratea-form and monohydrate were performed to study
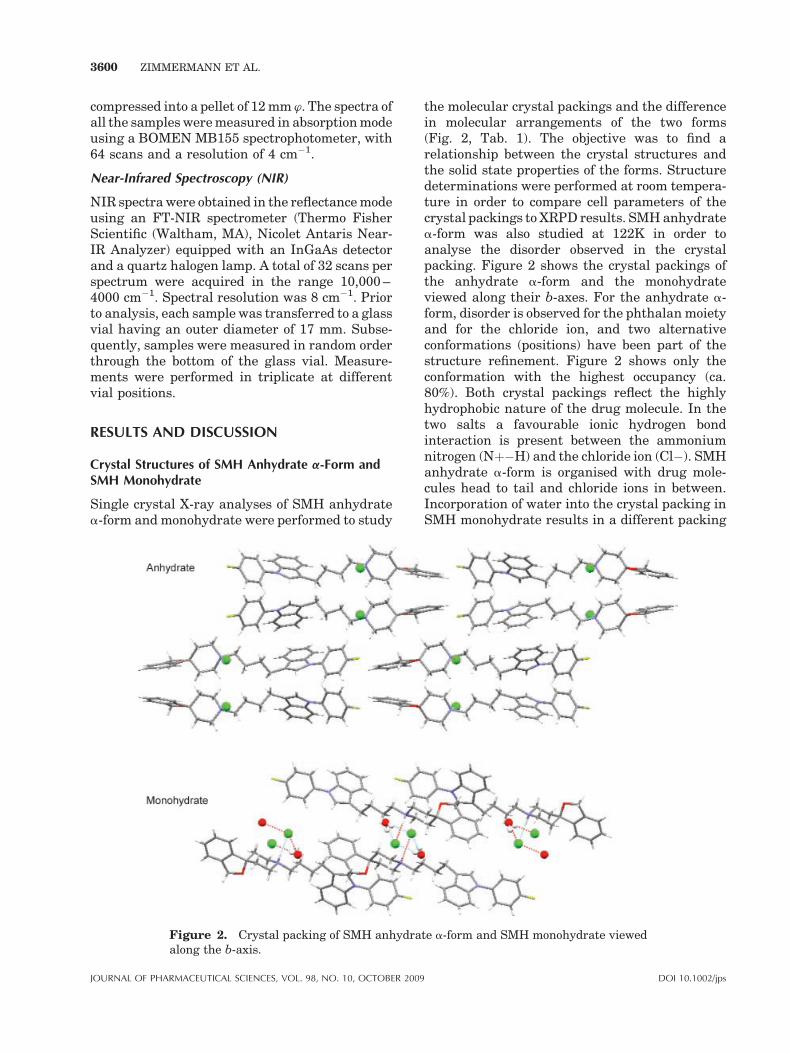
Figure 2. Crystal packing of SMH anhydraalong the b-axis.
JOURNAL OF PHARMACEUTICAL SCIENCES, VOL. 98, NO. 10, OCTOBER 2009
the molecular crystal packings and the differencein molecular arrangements of the two forms(Fig. 2, Tab. 1). The objective was to find arelationship between the crystal structures andthe solid state properties of the forms. Structuredeterminations were performed at room tempera-ture in order to compare cell parameters of thecrystal packings to XRPD results. SMH anhydratea-form was also studied at 122K in order toanalyse the disorder observed in the crystalpacking. Figure 2 shows the crystal packings ofthe anhydrate a-form and the monohydrateviewed along their b-axes. For the anhydrate a-form, disorder is observed for the phthalan moietyand for the chloride ion, and two alternativeconformations (positions) have been part of thestructure refinement. Figure 2 shows only theconformation with the highest occupancy (ca.80%). Both crystal packings reflect the highlyhydrophobic nature of the drug molecule. In thetwo salts a favourable ionic hydrogen bondinteraction is present between the ammoniumnitrogen (Nþ�H) and the chloride ion (Cl�). SMHanhydrate a-form is organised with drug mole-cules head to tail and chloride ions in between.Incorporation of water into the crystal packing inSMH monohydrate results in a different packing
te a-form and SMH monohydrate viewed
DOI 10.1002/jps
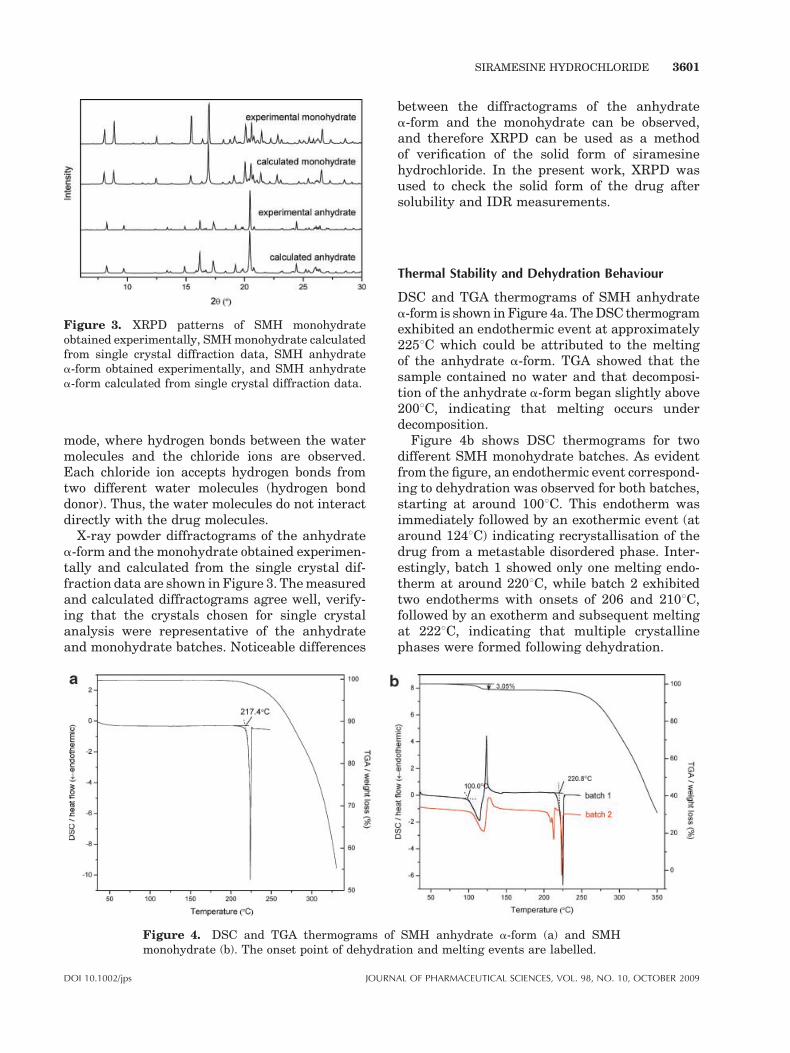
Figure 3. XRPD patterns of SMH monohydrateobtained experimentally, SMH monohydrate calculatedfrom single crystal diffraction data, SMH anhydratea-form obtained experimentally, and SMH anhydratea-form calculated from single crystal diffraction data.
SIRAMESINE HYDROCHLORIDE 3601
mode, where hydrogen bonds between the watermolecules and the chloride ions are observed.Each chloride ion accepts hydrogen bonds fromtwo different water molecules (hydrogen bonddonor). Thus, the water molecules do not interactdirectly with the drug molecules.
X-ray powder diffractograms of the anhydratea-form and the monohydrate obtained experimen-tally and calculated from the single crystal dif-fraction data are shown in Figure 3. The measuredand calculated diffractograms agree well, verify-ing that the crystals chosen for single crystalanalysis were representative of the anhydrateand monohydrate batches. Noticeable differences
Figure 4. DSC and TGA thermograms ofmonohydrate (b). The onset point of dehydrat
DOI 10.1002/jps JOURN
between the diffractograms of the anhydratea-form and the monohydrate can be observed,and therefore XRPD can be used as a methodof verification of the solid form of siramesinehydrochloride. In the present work, XRPD wasused to check the solid form of the drug aftersolubility and IDR measurements.
Thermal Stability and Dehydration Behaviour
DSC and TGA thermograms of SMH anhydratea-form is shown in Figure 4a. The DSC thermogramexhibited an endothermic event at approximately2258C which could be attributed to the meltingof the anhydrate a-form. TGA showed that thesample contained no water and that decomposi-tion of the anhydrate a-form began slightly above2008C, indicating that melting occurs underdecomposition.
Figure 4b shows DSC thermograms for twodifferent SMH monohydrate batches. As evidentfrom the figure, an endothermic event correspond-ing to dehydration was observed for both batches,starting at around 1008C. This endotherm wasimmediately followed by an exothermic event (ataround 1248C) indicating recrystallisation of thedrug from a metastable disordered phase. Inter-estingly, batch 1 showed only one melting endo-therm at around 2208C, while batch 2 exhibitedtwo endotherms with onsets of 206 and 2108C,followed by an exotherm and subsequent meltingat 2228C, indicating that multiple crystallinephases were formed following dehydration.
SMH anhydrate a-form (a) and SMHion and melting events are labelled.
AL OF PHARMACEUTICAL SCIENCES, VOL. 98, NO. 10, OCTOBER 2009
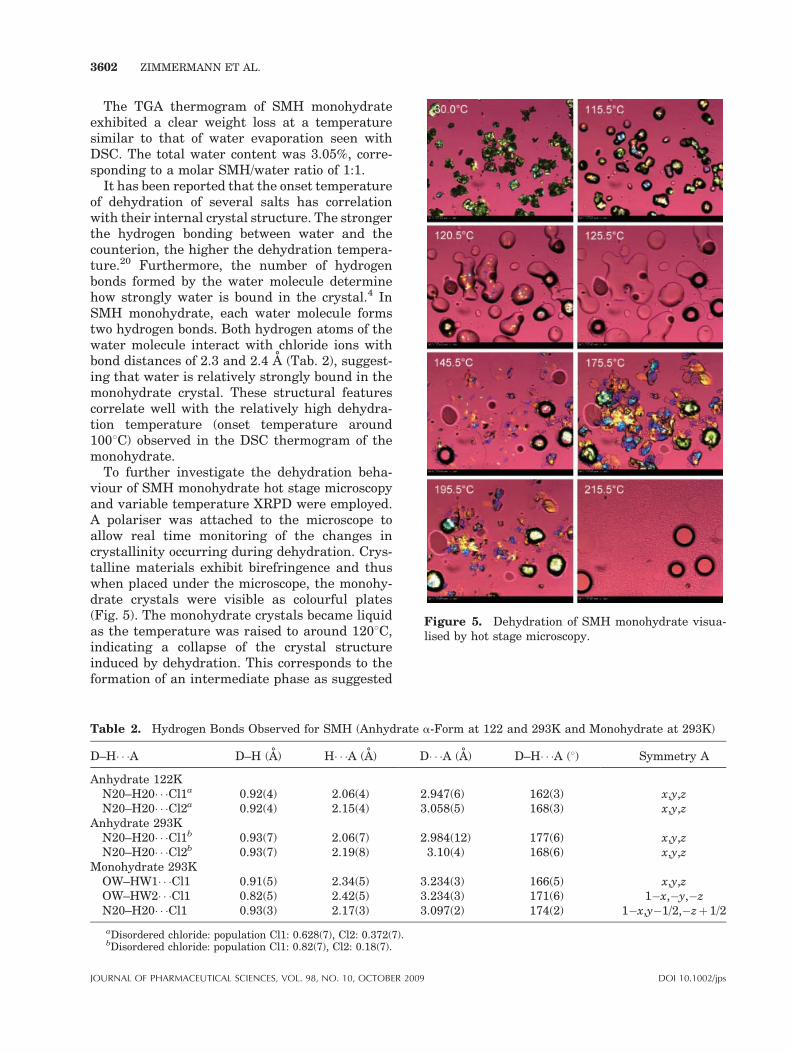
Figure 5. Dehydration of SMH monohydrate visua-lised by hot stage microscopy.
3602 ZIMMERMANN ET AL.
The TGA thermogram of SMH monohydrateexhibited a clear weight loss at a temperaturesimilar to that of water evaporation seen withDSC. The total water content was 3.05%, corre-sponding to a molar SMH/water ratio of 1:1.
It has been reported that the onset temperatureof dehydration of several salts has correlationwith their internal crystal structure. The strongerthe hydrogen bonding between water and thecounterion, the higher the dehydration tempera-ture.20 Furthermore, the number of hydrogenbonds formed by the water molecule determinehow strongly water is bound in the crystal.4 InSMH monohydrate, each water molecule formstwo hydrogen bonds. Both hydrogen atoms of thewater molecule interact with chloride ions withbond distances of 2.3 and 2.4 A (Tab. 2), suggest-ing that water is relatively strongly bound in themonohydrate crystal. These structural featurescorrelate well with the relatively high dehydra-tion temperature (onset temperature around1008C) observed in the DSC thermogram of themonohydrate.
To further investigate the dehydration beha-viour of SMH monohydrate hot stage microscopyand variable temperature XRPD were employed.A polariser was attached to the microscope toallow real time monitoring of the changes incrystallinity occurring during dehydration. Crys-talline materials exhibit birefringence and thuswhen placed under the microscope, the monohy-drate crystals were visible as colourful plates(Fig. 5). The monohydrate crystals became liquidas the temperature was raised to around 1208C,indicating a collapse of the crystal structureinduced by dehydration. This corresponds to theformation of an intermediate phase as suggested
Table 2. Hydrogen Bonds Observed for SMH (Anhydrate a-Form at 122 and 293K and Monohydrate at 293K)
D–H A D–H (A) H A (A) D A (A) D–H A (8) Symmetry A
Anhydrate 122KN20–H20 Cl1a 0.92(4) 2.06(4) 2.947(6) 162(3) x,y,zN20–H20 Cl2a 0.92(4) 2.15(4) 3.058(5) 168(3) x,y,z
Anhydrate 293KN20–H20 Cl1b 0.93(7) 2.06(7) 2.984(12) 177(6) x,y,zN20–H20 Cl2b 0.93(7) 2.19(8) 3.10(4) 168(6) x,y,z
Monohydrate 293KOW–HW1 Cl1 0.91(5) 2.34(5) 3.234(3) 166(5) x,y,zOW–HW2 Cl1 0.82(5) 2.42(5) 3.234(3) 171(6) 1�x,�y,�zN20–H20 Cl1 0.93(3) 2.17(3) 3.097(2) 174(2) 1�x,y�1/2,�zþ 1/2
aDisordered chloride: population Cl1: 0.628(7), Cl2: 0.372(7).bDisordered chloride: population Cl1: 0.82(7), Cl2: 0.18(7).
JOURNAL OF PHARMACEUTICAL SCIENCES, VOL. 98, NO. 10, OCTOBER 2009 DOI 10.1002/jps
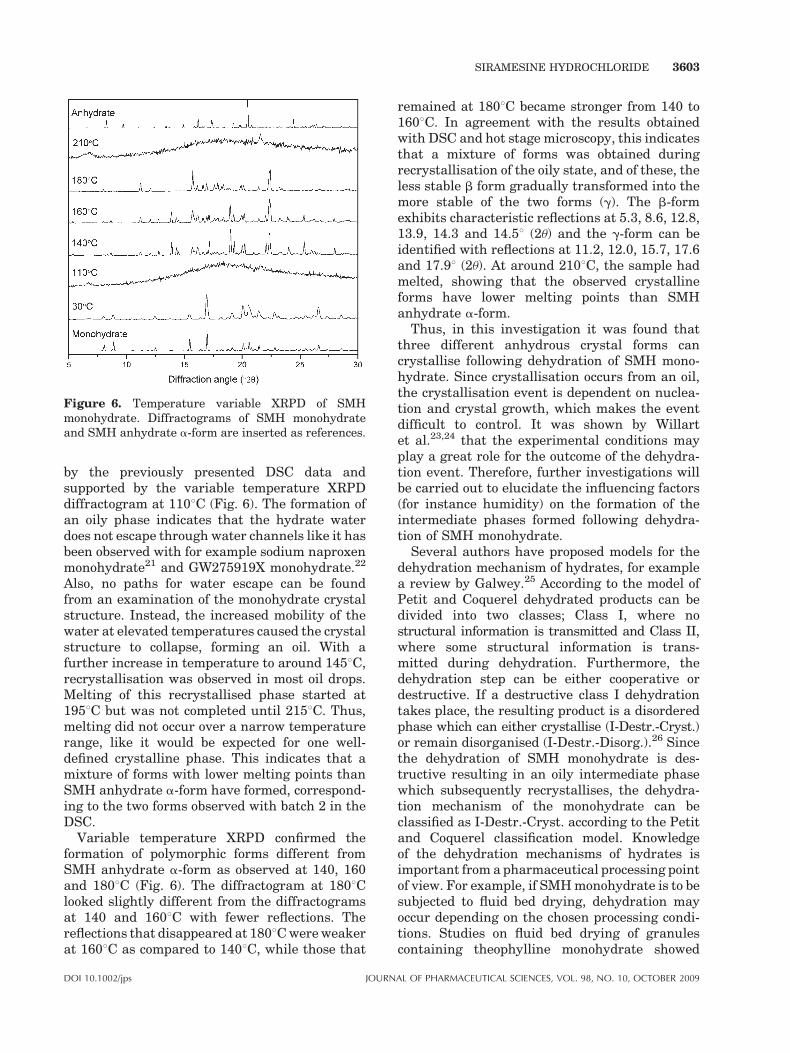
Figure 6. Temperature variable XRPD of SMHmonohydrate. Diffractograms of SMH monohydrateand SMH anhydrate a-form are inserted as references.
SIRAMESINE HYDROCHLORIDE 3603
by the previously presented DSC data andsupported by the variable temperature XRPDdiffractogram at 1108C (Fig. 6). The formation ofan oily phase indicates that the hydrate waterdoes not escape through water channels like it hasbeen observed with for example sodium naproxenmonohydrate21 and GW275919X monohydrate.22
Also, no paths for water escape can be foundfrom an examination of the monohydrate crystalstructure. Instead, the increased mobility of thewater at elevated temperatures caused the crystalstructure to collapse, forming an oil. With afurther increase in temperature to around 1458C,recrystallisation was observed in most oil drops.Melting of this recrystallised phase started at1958C but was not completed until 2158C. Thus,melting did not occur over a narrow temperaturerange, like it would be expected for one well-defined crystalline phase. This indicates that amixture of forms with lower melting points thanSMH anhydrate a-form have formed, correspond-ing to the two forms observed with batch 2 in theDSC.
Variable temperature XRPD confirmed theformation of polymorphic forms different fromSMH anhydrate a-form as observed at 140, 160and 1808C (Fig. 6). The diffractogram at 1808Clooked slightly different from the diffractogramsat 140 and 1608C with fewer reflections. Thereflections that disappeared at 1808C were weakerat 1608C as compared to 1408C, while those that
DOI 10.1002/jps JOURN
remained at 1808C became stronger from 140 to1608C. In agreement with the results obtainedwith DSC and hot stage microscopy, this indicatesthat a mixture of forms was obtained duringrecrystallisation of the oily state, and of these, theless stable b form gradually transformed into themore stable of the two forms (g). The b-formexhibits characteristic reflections at 5.3, 8.6, 12.8,13.9, 14.3 and 14.58 (2u) and the g-form can beidentified with reflections at 11.2, 12.0, 15.7, 17.6and 17.98 (2u). At around 2108C, the sample hadmelted, showing that the observed crystallineforms have lower melting points than SMHanhydrate a-form.
Thus, in this investigation it was found thatthree different anhydrous crystal forms cancrystallise following dehydration of SMH mono-hydrate. Since crystallisation occurs from an oil,the crystallisation event is dependent on nuclea-tion and crystal growth, which makes the eventdifficult to control. It was shown by Willartet al.23,24 that the experimental conditions mayplay a great role for the outcome of the dehydra-tion event. Therefore, further investigations willbe carried out to elucidate the influencing factors(for instance humidity) on the formation of theintermediate phases formed following dehydra-tion of SMH monohydrate.
Several authors have proposed models for thedehydration mechanism of hydrates, for examplea review by Galwey.25 According to the model ofPetit and Coquerel dehydrated products can bedivided into two classes; Class I, where nostructural information is transmitted and Class II,where some structural information is trans-mitted during dehydration. Furthermore, thedehydration step can be either cooperative ordestructive. If a destructive class I dehydrationtakes place, the resulting product is a disorderedphase which can either crystallise (I-Destr.-Cryst.)or remain disorganised (I-Destr.-Disorg.).26 Sincethe dehydration of SMH monohydrate is des-tructive resulting in an oily intermediate phasewhich subsequently recrystallises, the dehydra-tion mechanism of the monohydrate can beclassified as I-Destr.-Cryst. according to the Petitand Coquerel classification model. Knowledgeof the dehydration mechanisms of hydrates isimportant from a pharmaceutical processing pointof view. For example, if SMH monohydrate is to besubjected to fluid bed drying, dehydration mayoccur depending on the chosen processing condi-tions. Studies on fluid bed drying of granulescontaining theophylline monohydrate showed
AL OF PHARMACEUTICAL SCIENCES, VOL. 98, NO. 10, OCTOBER 2009
3604 ZIMMERMANN ET AL.
that the temperature and the humidity of thedrying air affected removal of both free and crystalbound water.27,28
Solubility and Intrinsic Dissolution Rate (IDR)
Solubility and dissolution rate in aqueous mediaare major factors determining the bioavailabilityof poorly water-soluble drugs.29 For this reasonthe equilibrium solubility and IDR of SMHanhydrate a-form and SMH monohydrate in0.01 M acetic acid were investigated (Tab. 3).XRPD was employed to examine the solid form ofthe samples following both solubility and IDRtests. Anhydrate–hydrate conversion can occurduring dissolution testing and has been encoun-tered with a number of drugs, for instancetheophylline and carbamazepine.30–32 However,during the experiments carried out in this study,no phase changes were observed.
The solubility of SMH monohydrate was lowerthan that of the anhydrate a-form, which is inagreement with what have been found for manypharmaceutical hydrates.1,2,33,34 IDR was chosenas a suitable method for assessing the release rateof drug from the two solid forms, as the effects ofparticle size and morphology are eliminated. Asobserved with the solubility, the IDR of themonohydrate was lower than that of the anhy-drate a-form. Thus, both solubility and IDRresults suggest that the monohydrate formrepresents the more thermodynamically stablestate of siramesine hydrochloride under thechosen aqueous conditions.
Spectroscopy of SMH Anhydrate a-Form and SMHMonohydrate
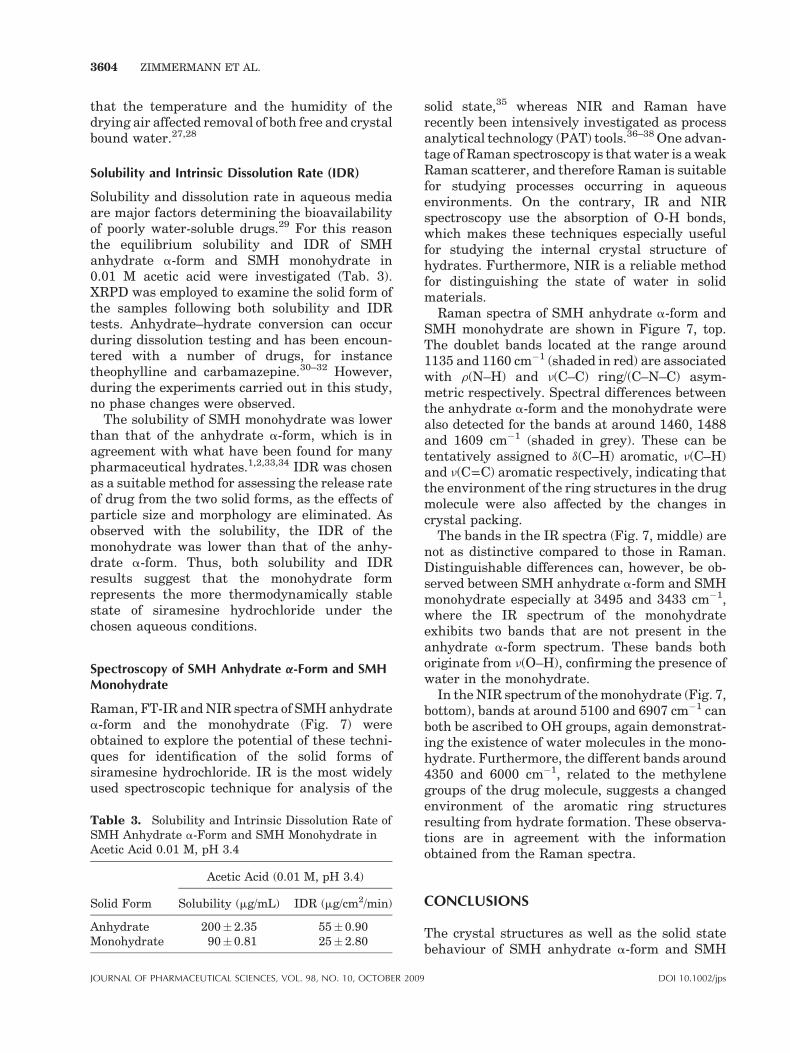
Raman, FT-IR and NIR spectra of SMH anhydratea-form and the monohydrate (Fig. 7) wereobtained to explore the potential of these techni-ques for identification of the solid forms ofsiramesine hydrochloride. IR is the most widelyused spectroscopic technique for analysis of the
Table 3. Solubility and Intrinsic Dissolution Rate ofSMH Anhydrate a-Form and SMH Monohydrate inAcetic Acid 0.01 M, pH 3.4
Solid Form
Acetic Acid (0.01 M, pH 3.4)
Solubility (mg/mL) IDR (mg/cm2/min)
Anhydrate 200 2.35 55 0.90Monohydrate 90 0.81 25 2.80
JOURNAL OF PHARMACEUTICAL SCIENCES, VOL. 98, NO. 10, OCTOBER 2009
solid state,35 whereas NIR and Raman haverecently been intensively investigated as processanalytical technology (PAT) tools.36–38 One advan-tage of Raman spectroscopy is that water is a weakRaman scatterer, and therefore Raman is suitablefor studying processes occurring in aqueousenvironments. On the contrary, IR and NIRspectroscopy use the absorption of O-H bonds,which makes these techniques especially usefulfor studying the internal crystal structure ofhydrates. Furthermore, NIR is a reliable methodfor distinguishing the state of water in solidmaterials.
Raman spectra of SMH anhydrate a-form andSMH monohydrate are shown in Figure 7, top.The doublet bands located at the range around1135 and 1160 cm�1 (shaded in red) are associatedwith r(N–H) and n(C–C) ring/(C–N–C) asym-metric respectively. Spectral differences betweenthe anhydrate a-form and the monohydrate werealso detected for the bands at around 1460, 1488and 1609 cm�1 (shaded in grey). These can betentatively assigned to d(C–H) aromatic, n(C–H)and n(C––C) aromatic respectively, indicating thatthe environment of the ring structures in the drugmolecule were also affected by the changes incrystal packing.
The bands in the IR spectra (Fig. 7, middle) arenot as distinctive compared to those in Raman.Distinguishable differences can, however, be ob-served between SMH anhydrate a-form and SMHmonohydrate especially at 3495 and 3433 cm�1,where the IR spectrum of the monohydrateexhibits two bands that are not present in theanhydrate a-form spectrum. These bands bothoriginate from n(O–H), confirming the presence ofwater in the monohydrate.
In the NIR spectrum of the monohydrate (Fig. 7,bottom), bands at around 5100 and 6907 cm�1 canboth be ascribed to OH groups, again demonstrat-ing the existence of water molecules in the mono-hydrate. Furthermore, the different bands around4350 and 6000 cm�1, related to the methylenegroups of the drug molecule, suggests a changedenvironment of the aromatic ring structuresresulting from hydrate formation. These observa-tions are in agreement with the informationobtained from the Raman spectra.
CONCLUSIONS
The crystal structures as well as the solid statebehaviour of SMH anhydrate a-form and SMH
DOI 10.1002/jps
Figure 7. Raman spectra (top), FT-IR spectra (middle) and NIR spectra (bottom) ofSMH anhydrate a-form and SMH monohydrate.
SIRAMESINE HYDROCHLORIDE 3605
monohydrate were investigated, and an under-lying relationship between these two aspects wasrevealed in this study. It was found that themonohydrate structure did not contain obviouschannels for dehydration. In addition, each watermolecule was relatively strongly bound in themonohydrate, forming hydrogen bonds with twochloride ions. This explains the collapse of themonohydrate crystal packing observed upon dehy-dration, which was confirmed by a recrystallisa-tion event observed in DSC and a halo patterndetected in temperature variable XRPD immedi-ately following the dehydration. Differences inhydrogen bonding between the anhydrate a-form
DOI 10.1002/jps JOURN
and monohydrate phases were detected by spec-troscopic techniques, which also indicated differ-ences in crystal packings between the two forms.Raman, FT-IR and NIR spectroscopy all exhibiteddistinctive spectral differences, and thereforethese techniques can be used to differentiatebetween the two solid forms of siramesinehydrochloride.
ACKNOWLEDGMENTS
The technical assistance of Flemming Hansen,University of Copenhagen, with the X-ray data
AL OF PHARMACEUTICAL SCIENCES, VOL. 98, NO. 10, OCTOBER 2009
3606 ZIMMERMANN ET AL.
collection is gratefully acknowledged. Specialthanks go to Morten Allesø, Faculty of Pharma-ceutical Sciences, University of Copenhagen,for helping with NIR spectra and Tim Smith,Renishaw, UK, for obtaining the Raman spectra.Furthermore, Dorthe Ørbæk and Marja Savolai-nen are sincerely acknowledged for help with DSCand variable temperature XRPD measurements.
REFERENCES
1. Khankari RK, Grant DJW. 1995. Pharmaceuticalhydrates. Thermochim Acta 248:61–79.
2. Shefter E, Higuchi T. 1963. Dissolution behavior ofcrystalline solvated and nonsolvated forms of somepharmaceuticals. J Pharm Sci 52:781–791.
3. Fung HL, Nealon T. 1974. Solvent effects on com-parative dissolution of pharmaceutical solvates.Chem Pharm Bull 22:454–458.
4. Morris KR. 1999. Structural aspects of hydratesand solvates. In: Brittain HG, editor. Polymorphismin pharmaceutical solids. New York: Marcel Dek-ker, Inc. pp 125–181.
5. Giron D, Mutz M, Gamier S. 2004. Solid-state ofpharmaceutical compounds. J Therm Anal Calorim77:709–747.
6. Holm R, Jensen IHM, Sonnergaard JM. 2006. Opti-mization of self-microemulsifying drug delivery sys-tems (SMEDDS) using a d-optimal design and thedesirability function. Drug Dev Ind Pharm 32:1025–1032.
7. Hansen T, Holm P, Rohde M, Schultz K. 2005.In vivo evaluation of tablets and capsules contain-ing spray-dried o/w-emulsions for oral delivery ofpoorly soluble drugs. Int J Pharm 293:203–211.
8. Vilhelmsen T, Eliasen H, Schaefer T. 2005. Effect ofa melt agglomeration process on agglomerates con-taining solid dispersions. Int J Pharm 303:132–142.
9. Nielsen AB, Buur A, Larsen C. 2005. Bioreversiblequaternary N-acyloxymethyl derivatives of thepoorly soluble tertiary amine Lu-28-179, Synthesis,pharmaceutical chemical characterization andbioavailability studies in dogs. Eur J Pharm Sci26:421–428.
10. Christensen JO, Schultz K, Mollgaard B, Kristen-sen HG, Mullertz A. 2004. Solubilisation of poorlywater-soluble drugs during in vitro lipolysis ofmedium- and long-chain triacylglycerols. Eur JPharm Sci 23:287–296.
11. Nielsen PB, Mullertz A, Norling T, Kristensen HG.2001. Comparison of the lymphatic transport of alipophilic drug from vehicles containing a-toco-pherol and/or triglycerides in rats. J Pharm Phar-macol 53:1439–1445.
12. COLLECT. Computer program. 1999. Nonius BV.Delft. The Netherlands.
JOURNAL OF PHARMACEUTICAL SCIENCES, VOL. 98, NO. 10, OCTOBER 2009
13. Duisenberg AJM. 1992. Indexing in single-crystaldiffractometry with an obstinate list of reflections.J Appl Cryst 25:92–96.
14. Duisenberg AJM. 1998. Reflections on area detec-tors: ab initio calculation of single-crystal x-rayreflection contours. Ph.D. Thesis. University ofUtrecht, The Netherlands.
15. Mackey S, Gilmore CJ, Edwards C, Steward N,Shankland K. 1999. maXus. Computer program.Nonius BV. Delft, The Netherlands.
16. Sheldrick GM. 1997. SHELXS97. Program for thesolution of crystal structures. University of Gottin-gen, Germany.
17. Sheldrick GM. 1990. Phase annealing in SHELX-90: Direct methods for larger structures. ActaCrystallogr A 46:467–473.
18. Sheldrick GM. 1997. SHELXL97. Program for crys-tal structure refinement. University of Gottingen,Germany.
19. Wilson AJC, editor. 1995. International tables forcrystallography. Dordrecht: Kluwer Academic Pub-lishers. Tables 4.2.6.8 and 6.1.1.4.
20. Forbes RT, York P, Fawcett V, Shields L. 1992.Physicochemical properties of salts of p-aminosa-licylic acid. I. Correlation of crystal structure andhydrate stability. Pharm Res 9:1428–1435.
21. Kim Y, Paskow HC, Rousseau RW. 2005. Propaga-tion of solid-state transformations by dehydrationand stabilization of pseudopolymorphic crystals ofsodium naproxen. Cryst Growth Des 5:1623–1632.
22. Zhu H. 2006. Dehydration behavior and structuralcharacterization of the GW275919X monohydrate.Int J Pharm 315:18–23.
23. Willart JF, De Gusseme A, Hemon S, Descamps M,Leveiller F, Rameau A. 2002. Vitrification and poly-morphism of trehalose induced by dehydration oftrehalose dihydrate. J Phys Chem B 106:3365–3370.
24. Willart JF, Hedoux A, Guinet Y, Danede F, PaccouL, Capet F, Descamps M. 2006. Metastabilityrelease of the form a of trehalose by isothermalsolid state vitrification. J Phys Chem B 110:11040–11043.
25. Galwey AK. 2000. Structure and order in thermaldehydration of crystalline solids. Thermochim Acta355:181–238.
26. Petit S, Coquerel G. 1996. Mechanism of severalsolid-solid transformations between dihydratedand anhydrous Copper(II) 8-Hydroxyquinolinates.Proposition for a unified model for the dehydrationof molecular crystals. Chem Mater 8:2247–2258.
27. Aaltonen J, Kogermann K, Strachan CJ, RantanenJ. 2007. In-line monitoring of solid-state transitionsduring fluidisation. Chem Eng Sci 62:408–415.
28. Rasanen E, Rantanen J, Mannermaa JP, YliruusiJ, Vuorela H. 2003. Dehydration studies using anovel multichamber microscale fluid bed dryer within-line near-infrared measurement. J Pharm Sci92:2074–2081.
DOI 10.1002/jps
SIRAMESINE HYDROCHLORIDE 3607
29. Amidon GL, Lennernas H, Shah VP, Crison JR.1995. A theoretical basis for a biopharmaceuticdrug classification: The correlation of in vitro drugproduct dissolution and in vivo bioavailability.Pharm Res 12:413–420.
30. Rodriguez-Hornedo N, Lechuga-Ballesteros D,Wu HJ. 1992. Phase transition and heteroge-neous/epitaxial nucleation of hydrated and anhy-drous theophylline crystals. Int J Pharm 85:149–162.
31. Debnath S, Suryanarayanan R. 2004. Influenceof processing-induced phase transformations onthe dissolution of theophylline tablets. AAPSPharmSciTech 5: article 8.
32. Kobayashi Y, Ito S, Itai S, Yamamoto K. 2000.Physicochemical properties and bioavailability ofcarbamazepine polymorphs and dihydrate. Int JPharm 193:137–146.
33. Bartolomei M, Bertocchi P, Antoniella E, Rodo-monte A. 2006. Physico-chemical characterisationand intrinsic dissolution studies of a new hydrate
DOI 10.1002/jps JOURN
form of diclofenac sodium: Comparison with anhy-drous form. J Pharm Biomed Anal 40:1105–1113.
34. Bettinetti G, Mura P, Sorrenti M, Faucci MT, NegriA. 1999. Physical characterization of picotamidemonohydrate and anhydrous picotamide. J PharmSci 88:1133–1139.
35. Bugay DE. 2001. Characterization of the solid-state: Spectroscopic techniques. Adv Drug DelivRev 48:43–65.
36. Morris KR, Nail SL, Peck GE, Byrn SR, GriesserUJ, Stowell JG, Hwang SJ, Park K. 1998. Advancesin pharmaceutical materials and processing.Pharm Sci Technol Today 1:235–245.
37. Rantanen J. 2007. Process analytical applicationsof Raman spectroscopy. J Pharm Pharmacol 59:171–177.
38. Jørgensen A, Rantanen J, Karjalainen M,Khriachtchev L, Rasanen E, Yliruusi J. 2002.Hydrate formation during wet granulation studiedby spectroscopic methods and multivariate analy-sis. Pharm Res 19:1285–1291.
AL OF PHARMACEUTICAL SCIENCES, VOL. 98, NO. 10, OCTOBER 2009
Recommended


