Earth Syst. Dynam., 4, 333–345, 2013www.earth-syst-dynam.net/4/333/2013/doi:10.5194/esd-4-333-2013© Author(s) 2013. CC Attribution 3.0 License.
EGU Journal Logos (RGB)
Advances in Geosciences
Open A
ccess
Natural Hazards and Earth System
Sciences
Open A
ccess
Annales Geophysicae
Open A
ccess
Nonlinear Processes in Geophysics
Open A
ccess
Atmospheric Chemistry
and Physics
Open A
ccess
Atmospheric Chemistry
and Physics
Open A
ccess
Discussions
Atmospheric Measurement
Techniques
Open A
ccess
Atmospheric Measurement
TechniquesO
pen Access
Discussions
Biogeosciences
Open A
ccess
Open A
ccess
BiogeosciencesDiscussions
Climate of the Past
Open A
ccess
Open A
ccess
Climate of the Past
Discussions
Earth System Dynamics
Open A
ccess
Open A
ccess
Earth System Dynamics
Discussions
GeoscientificInstrumentation
Methods andData Systems
Open A
ccess
GeoscientificInstrumentation
Methods andData Systems
Open A
ccess
Discussions
GeoscientificModel Development
Open A
ccess
Open A
ccess
GeoscientificModel Development
Discussions
Hydrology and Earth System
Sciences
Open A
ccess
Hydrology and Earth System
Sciences
Open A
ccess
Discussions
Ocean Science
Open A
ccess
Open A
ccess
Ocean ScienceDiscussions
Solid Earth
Open A
ccess
Open A
ccess
Solid EarthDiscussions
The Cryosphere
Open A
ccess
Open A
ccess
The CryosphereDiscussions
Natural Hazards and Earth System
Sciences
Open A
ccess
Discussions
The impact of nitrogen and phosphorous limitation on the estimatedterrestrial carbon balance and warming of land use change over thelast 156 yr
Q. Zhang1, A. J. Pitman2, Y. P. Wang3, Y. J. Dai1, and P. J. Lawrence4
1College of Global Change and Earth System Science, Beijing Normal University, Beijing 100875, China2ARC Centre of Excellence for Climate System Science and Climate Change Research Centre, University of New SouthWales, Sydney 2052, Australia3CSIRO Marine and Atmospheric Research, PMB #1, Aspendale, Vic 3195, Australia4National Centre for Atmospheric Research, Boulder, Colorado, USA
Correspondence to:Q. Zhang ([email protected])
Received: 12 April 2013 – Published in Earth Syst. Dynam. Discuss.: 8 May 2013Revised: 25 July 2013 – Accepted: 7 August 2013 – Published: 16 September 2013
Abstract. We examine the impact of land use and land coverchange (LULCC) over the period from 1850 to 2005 usingan Earth system model that incorporates nitrogen and phos-phorous limitation on the terrestrial carbon cycle. We com-pare the estimated CO2 emissions and warming from landuse change in a carbon-only version of the model with thosefrom simulations, including nitrogen and phosphorous limi-tation. If we omit nutrients, our results suggest LULCC coolson the global average by about 0.1◦C. Including nutrientsreduces this cooling to∼ 0.05◦C. Our results also suggestLULCC has a major impact on total land carbon over theperiod 1850–2005. In carbon-only simulations, the inclusionof LULCC decreases the total additional land carbon storedin 2005 from around 210 Pg C to 85 Pg C. Including nitrogenand phosphorous limitation also decreases the scale of theterrestrial carbon sink to 80 Pg C. Shown as correspondingfluxes, adding LULCC on top of the nutrient-limited simu-lations changes the sign of the terrestrial carbon flux from asink to a source (12 Pg C). The CO2 emission from LULCCfrom 1850 to 2005 is estimated to be 130 Pg C for carbononly simulation, or 97 Pg C if nutrient limitation is accountedfor in our model. The difference between these two esti-mates of CO2 emissions from LULCC largely results fromthe weaker response of photosynthesis to increased CO2 andsmaller carbon pool sizes, and therefore lower carbon lossfrom plant and wood product carbon pools under nutrient
limitation. We suggest that nutrient limitation should be ac-counted for in simulating the effects of LULCC on the pastclimate and on the past and future carbon budget.
1 Introduction
Human activity has modified 42–68 % of the terrestrial sur-face via deforestation, reforestation, clearing for crops, pas-ture and urban settlements (Hurtt et al., 2006). Land use andland cover change (LULCC) is concentrated in regions suchas eastern North America, Europe, India and China (Pielke etal., 2011). There is extensive literature pointing to significantimpacts of these changes on regional temperature (Bonan,1997; Gallo et al., 1999; Zhou et al., 2004; Lobell et al.,2008), temperature extremes (Avila et al., 2012; Pitman et al.,2012), rainfall (Niyogi et al., 2010; Pielke et al., 2011) and insome regions of intensive LULCC perhaps rainfall extremes(Pitman et al., 2012). Most of these studies have focusedon the biogeophysical impacts of LULCC. These includechanges in albedo that affects the net radiation available todrive the surface energy balance. LULCC also modifies theleaf area index, root depth, stomatal conductance and aero-dynamic roughness length (Bonan, 2008) which combine tochange the efficiency of water transfer from within the soil,through the plants and into the atmosphere via the stomata.
Published by Copernicus Publications on behalf of the European Geosciences Union.
334 Q. Zhang et al.: The impact of N and P limitation on the estimated terrestrial carbon balance
This affects the partitioning of net radiation between sensi-ble and latent heat fluxes (Bonan, 2008; de Noblet-Ducoudreet al., 2012; Boisier et al., 2012), which in turn can affectair temperature and the larger-scale climate (Feddema et al.,2005; Findell et al., 2007, 2009; Pitman et al., 2009; deNoblet-Ducoudre et al., 2012).
In addition to the biogeophysical impacts of LULCC,changing the nature of the surface also has a major impact onterrestrial biogeochemical cycles (Arneth et al., 2010; Levis,2010; Houghton et al., 2012). If forests are replaced by cropsor pasture, the soil carbon is reduced by 25–30 % as a re-sult of cultivation (Houghton and Goodale, 2004). The ef-fect of ecosystem carbon balance will depend on the totalecosystem carbon before the land use change occurs, net pri-mary productivity (NPP) of the crop or pasture and the rateof ecosystem carbon change after land use change. In addi-tion, increases in atmospheric CO2 likely stimulates photo-synthesis (Field et al., 1995) although nutrient limitation bynitrogen (N) and phosphorous (P) moderate this fertilizationeffect (Vitousek et al., 2010). The interactions between CO2-induced climate change and the terrestrial carbon balance,and the feedbacks associated with the response by the sur-face via CO2 emissions to climate change are extremely com-plex and uncertain (Friedlingstein et al., 2006) and LULCCis superimposed onto these interactions. As noted by Arnethet al. (2010), examining how LULCC interacts with biogeo-chemical cycling is a research priority.
The biogeochemical effects of LULCC in terms of landuse emissions have been investigated previously withinseveral climate models (e.g. Pongratz et al., 2009, 2011;Shevliakova et al., 2009). Carbon emissions from LULCCdampen biogeophysical cooling in some studies (Brovkinet al., 2004; Bala et al., 2007). In other studies, LULCC-induced cooling can be changed to warming once the terres-trial carbon feedback is included (Sitch et al., 2005; Pongratzet al., 2010). Recent studies in the Global Carbon Projectsuggest that LULCC nearly offsets the entire land sink fromreforestation and CO2 fertilization since the preindustrial pe-riod (Canadell et al., 2007; Le Quere et al., 2009). Thereare, however, large uncertainties in the magnitude of carbonloss linked to LULCC (Denman et al., 2007). Estimates ofthe scale of CO2 emission from LULCC between 1850 and2000 vary from 44 to 150 Pg C (Houghton, 2008; Arora andBoer, 2010). A recent inter-comparison study reported car-bon emissions due to LULCC for the 1990s had a range of0.75–1.50 Pg C yr−1, with a median value of 1.1 Pg C yr−1
based on 13 model estimates (Houghton et al., 2012).One weakness of existing studies of the impact of LULCC
on biogeochemical cycles is the lack of the inclusion of nu-trients. N limitation reduces the net carbon uptake by theglobal land biosphere by 37 % to 74 % from the preindus-trial through to 2100 in some modeling studies (Thornton etal., 2007; Sokolov et al., 2008; Zaehle et al., 2010). Zhanget al. (2011) has also included P to demonstrate regionallyspecific impacts over North America, Eurasia, China and
Australia. These are, of course, regions of extensive LULCC.Only a few current models incorporate LULCC and N cycle(Yang et al., 2010; Lawrence et al., 2012), and none includesphosphorus cycle. Here, we assess the impact of LULCC onterrestrial biogeochemical cycles in an Earth system modelthat includes LULCC, N and P cycles. We examine, in par-ticular, the impact of LULCC from 1850 through to 2005with a carbon-only version of our Earth system model anda version including N and P cycles on land biosphere. Ouraim is to determine whether including nutrient substantiallyaffects the global-scale impact of LULCC on the terrestrialcarbon budget.
2 Methods
2.1 Model description
We used the CSIRO Mk3L (Phipps et al., 2011) coupled witha land surface model including carbon, nitrogen and phos-phorous cycles, CABLE (Wang et al., 2010, 2011). Mk3L isa relatively low-resolution but computationally efficient gen-eral circulation model developed for studies of climate oncentennial to millennial timescales (Phipps et al., 2011). Theatmospheric component has a horizontal resolution of 5.6◦
by 3.2◦ and 18 levels in the vertical. CABLE performs wellin comparison to other land surface models (LSMs) in simu-lating latent and sensible heat as well as CO2 fluxes at the sitescale (Abramowitz et al., 2007, 2008; Wang et al., 2011). Anearlier version was used in the Land Use Change IDentifica-tion of robust impacts (LUCID) project (Pitman et al., 2009;de Noblet-Ducoudre et al., 2012). Mao et al. (2011) docu-ments the performance of Mk3L coupled to CABLE, whichprovides strong evidence that the coupled model produces areasonable large-scale climatology. The version of CABLEused here includes the biogeochemical model CASA-CNP(Wang et al., 2010). CASA-CNP simulates dynamics of car-bon, nitrogen and phosphorus in plant and soil. The coupledEarth system model has recently been used to explore thedependence of terrestrial carbon uptake due to N and P lim-itation through the 20th century without land cover change(Zhang et al., 2011).
3 Data and experimental design
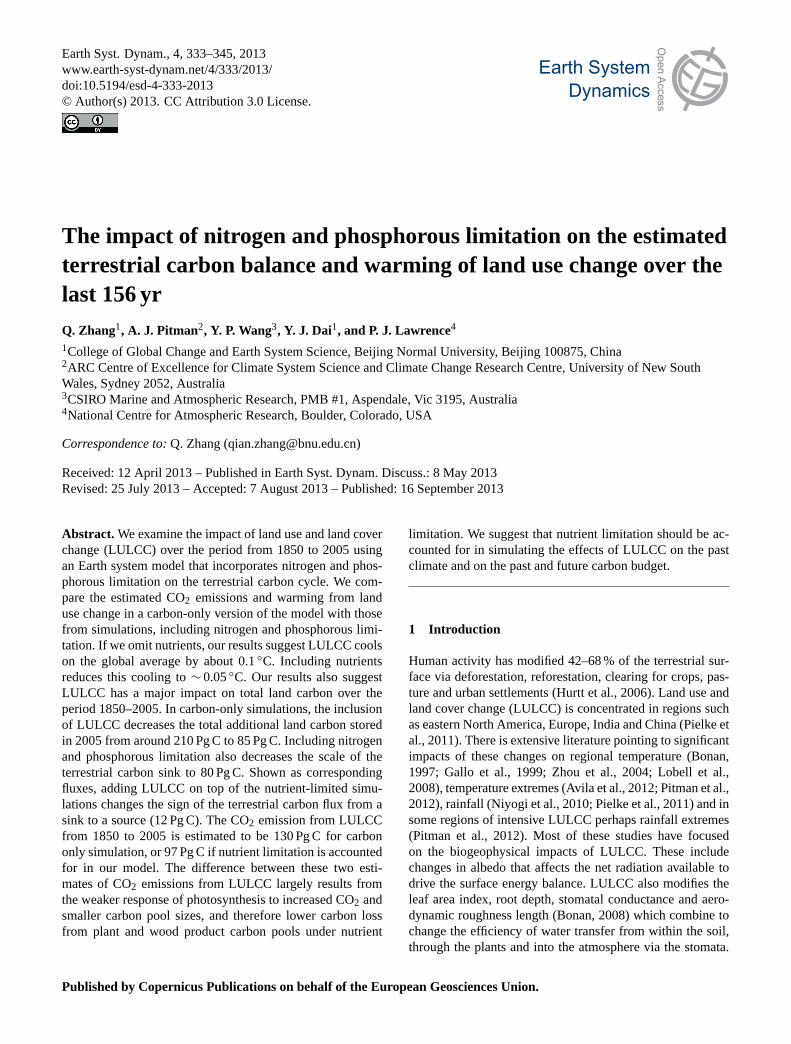
The interpretation of the Coupled Model IntercomparisonProject (CMIP-5, Taylor et al., 2012) land cover trajecto-ries by Lawrence et al. (2012) for the period 1850–2005is used to provide the change in area fractions of differentplant functional type (PFT) within a land cell as a functionof time compatible for CABLE. Figure 1 shows the patternof changes in (a) forests, (b) grass, and (c) crops. In general,a pattern of forest reduction is clear, in particular over east-ern North America, Europe and SE Asia. Grasslands havealso been reduced in similar regions; though note an increase
Earth Syst. Dynam., 4, 333–345, 2013 www.earth-syst-dynam.net/4/333/2013/
Q. Zhang et al.: The impact of N and P limitation on the estimated terrestrial carbon balance 335
Fig. 1. Fractional changes in coverage of(a) woody,(b) grass, and(c) crop plant functional types for the period 1850–2005.
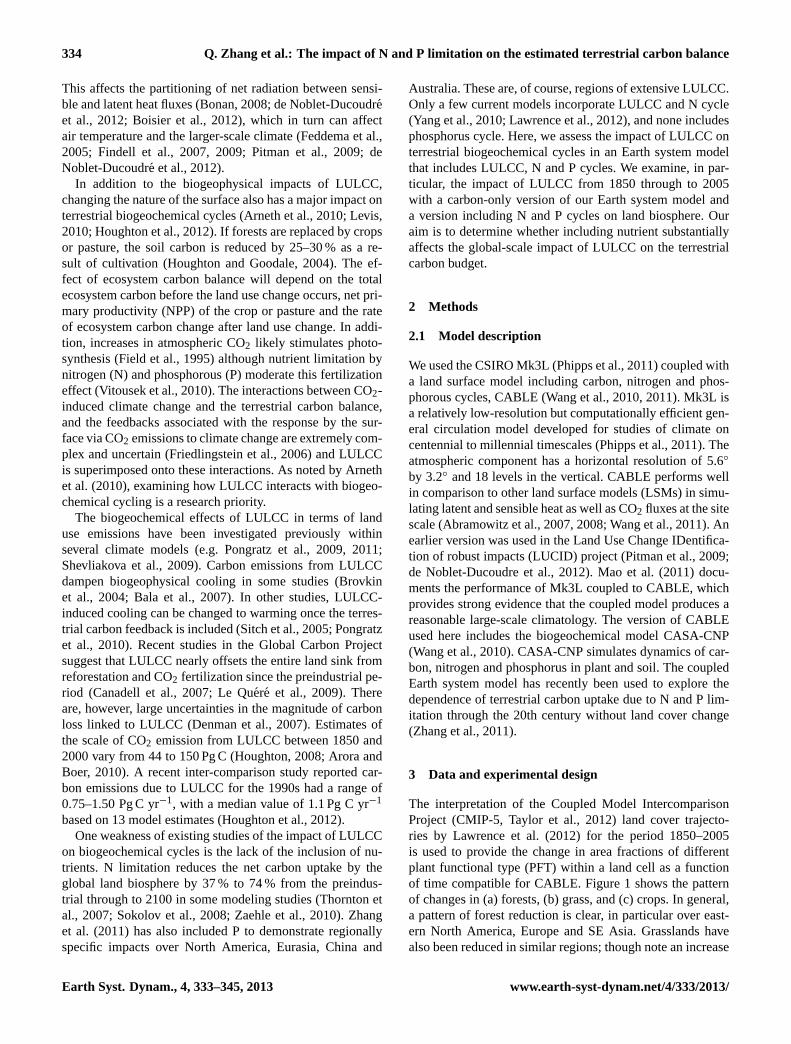
in grasslands in eastern South America coincident with de-crease in forests. In most regions of the Northern Hemi-sphere, the forest removal has resulted in increased croplands(Fig. 1c). The scale of these changes, according to the CMIP-5 experimental protocols are a reduction in total forest areafrom about 54× 106 km2 in 1850 to about 47× 106 km2 in2005. Grasslands were also reduced from about 39×106 km2
in 1850 to about 36× 106 km2 in 2005. To balance these netreductions, croplands increased from about 4× 10⁶ km2 in1850 to about 14× 106 km2 in 2005 (Fig. 2).
In this study, the atmosphere model was forced by CO2from CMIP-5 database for 1850–2005 (Meinshausen et al.,2011). The ocean is prescribed using monthly sea surfacetemperatures (SSTs) simulated by CSIRO-Mk3.6 (Rotstaynet al., 2010, 2012) for the CMIP-5 experiments associatedwith the same CMIP-5 CO2 for the same period. For modelspin-up, we ran Mk3L with recycled SSTs for 1850–1879 tostable states for the carbon cycle only (C-only), carbon nitro-gen and phosphorous cycles (CNP) cases under conditions ofCO2 and land cover in 1850. 200 yr preindustrial control sim-ulations under spin-up conditions were then performed be-fore forward model integration. An ensemble of three histor-ical (1850–2005) simulations are initialized at 10 yr intervals
from the last 30 yr of 200 yr control simulation under thepreindustrial condition for each of the C-only and CNP cases.
To evaluate the effects of land use change on terrestrial car-bon balance, we undertook two sets of experiments startedfrom the same initial states. In the “LUC” experiment, themodel was run using the land cover change and CO2 data.The land model was set up to run carbon cycle only (LUC-C) and carbon, nitrogen and phosphorous cycle (LUC-CNP)cases for each LULCC ensemble simulations. In the “CTL”experiment, the same simulations were run except the vegeta-tion distribution, which was kept constant as the one in 1850for the whole 1850–2005 period. Atmospheric CO2 was pre-scribed using the CMIP-5 input to vary over time from 1850to 2005. We used the spatially explicit estimates of N depo-sition for the 1990s (Dentener, 2006) and P deposition mapfrom Mahowald et al. (2008) over the simulation period be-cause of the relatively small effects of the changes in N or Pdeposition on global land carbon balance over the last 150 yr(Mahowald et al., 2008; Zaehle et al., 2010) and possiblecomplication in interpreting our simulation results if thosechanges are included.
3.1 Net CO2 emission from land use change
Total carbon on land comprises three carbon pools in vege-tation (cV), litter (cL) and soil (cS). Primary and secondaryforests are not represented explicitly in CABLE, and arecombined into one grid-cell averaged PFT fraction. This ap-proach does not account for the difference in the amount ofstanding biomass carbon between the primary and secondaryPFTs. Clear-cutting and wood harvest were performed at thelast time step of each model year while regrowth occurredat the first step of the next year. Note that wood harvest inthis study only accounted for fractional area change and as-sociated change in carbon pool size in woody PFTs but ex-cluding the change in standing biomass carbon from forestmanagement without land cover change. The harvested woodwas added to wood product carbon poolc∗
p while leaf androot biomass of those deforested PFTs was deposited in litterpools.
For land points that never experience LULCC over thesimulation period [0,t ], the budget equations of carbon ineach of these three pools are
dcV
dt= fGPP− rV − fL (1)
dcL
dt= fL − rL − fS (2)
dcS
dt= fS− rS, (3)
wherefGPP is gross primary production in g C m−2 yr−1, rV ,rL , andrS are the respired CO2 from vegetation, litter andsoil carbon pools in g C m−2 yr−1, respectively;fL andfS
www.earth-syst-dynam.net/4/333/2013/ Earth Syst. Dynam., 4, 333–345, 2013
336 Q. Zhang et al.: The impact of N and P limitation on the estimated terrestrial carbon balance
Fig. 2. CMIP-5 global historical land cover changes in land area(106 km2). Note that they axis scale used for each land use categoryvaries.
are carbon fluxes from vegetation to litter, and from the litterto the soil pool in g C m−2 yr−1, respectively.
Land use change can affect total carbon pool sizes directlyand indirectly. Land use change can affect climate throughthe biogeophysical effects and biogeochemical effects, andthe changed climate will then impact all the fluxes on theright-hand sizes of Eqs. (1) and (3). Since atmospheric CO2concentration from 1850 to 2005 is prescribed as an inputto our model in this study, only the biogeochemical effect istaken into account here. The dynamic equations for carbonin vegetation, litter and soil of a land point under land usechange over the study period are given by
dc∗
V
dt= f ∗
GPP− r∗
V − f ∗
L − f ∗
W (4)
dc∗
L
dt= f ∗
L − r∗
L − f ∗
S (5)
dc∗
S
dt= f ∗
S − r∗
S. (6)
The flux terms with star as superscript in Eqs. (4) to (6) arethe equivalent fluxes in Eqs. (1) to (3) but for pools underthe influences (both direct and indirect effects) of land usechange, and are calculated using an earth system model thattakes account of the both indirect and direct effects of landuse change on all the fluxes in Eqs. (3) to (4). Even for theundisturbed land points, the fluxes are different because ofthe indirect effects.
The dynamics of the harvest wood carbon pool,c∗
P, is gov-erned by
dc∗
P
dt= f ∗
W − f ∗
P , (7)
wheref ∗w is the rate of wood harvest in g C m−2 yr−1 and
f ∗p is the associated CO2flux released from consumption of
anthropogenic pools. Similar to Shevliakova et al. (2009) wepartitioned equally into three anthropogenic pools character-ized by their turnover rates: fuel wood (1 yr−1), paper andpaper products (0.1 yr−1) and wood products (0.01 yr−1).
The net CO2 emission from land use change,FLUC, is cal-culated as the difference of net land carbon uptake betweenLUC and CTL experiments, which includes both the carbonreleases from deforestation and carbon absorptions from for-est regrowth:
FLUC = (c∗v + c∗
L + c∗
S+ c∗
P) − (cV + cL + cS)
= 1FGPP− (1RV + 1RH) − FP (8)
where
1FGPP=
t∫0
(f ∗
GPP− fGPP)dt (9)
1RV =
t∫0
(r∗
V − rV)dt (10)
1RH =
t∫0
(r∗
L + r∗
S − rL − rS)dt (11)
Fp =
t∫0
f ∗
Pdt . (12)
Net ecosystem exchange (NEE) of a land point is calculatedas
fNEE = fGPP− rV − rL − rS (13)
f ∗
NEE = f ∗
GPP− r∗
V − r∗
L − r∗
S − f ∗
P . (14)
Earth Syst. Dynam., 4, 333–345, 2013 www.earth-syst-dynam.net/4/333/2013/
Q. Zhang et al.: The impact of N and P limitation on the estimated terrestrial carbon balance 337
3.2 Effects of nutrient limitation on carbon fluxes
Carbon fluxes in Eqs. (13) and (14) are tightly linked to N andP concentrations in plant, litter and soil pools (Wang et al.,2010). To avoid repetition, here we only give the equationsfor the carbon fluxes without land uses. In CABLE,fGPP iscalculated as
fGPP= f1 (L,vcmax,jmax) , (15)
where L is canopy leaf area index (m2 m−2), vcmax andjmax are the maximal carboxylation rate (mmol m−2 s−1) andmaximal rate of potential electron transport (mmol m−2 s−1)
in the leaf photosynthesis model.vcmax is calculated as
vcmax= a + b · f (pn) · nleaf, (16)
wherea and b are two empirical coefficients according todifferent PFTs (see Wang et al., 2012, Table S2 for furtherdetails),nleaf is leaf nitrogen amount (g N m−2), pn is leafphosphorus to nitrogen ratio (g P / g N).
Based on the result of Reich et al. (2009),f (pn) for ever-green broadleaf forest is calculated as
f (pn) = 0.4+ 9pn. (17)
This is also supported by the result of Kattage et al. (2009)who found the tropical trees grown at more phosphorus-limited soil (oxisols) had a lower sensitivity to leaf nitrogenthan those at less phosphorus-limited soil (non-oxisols). Forother PFTs, we assume thatf (pn) = 1 because of lack ofdata.
Autotrophic plant respiration is the sum of maintenanceand growth respiration. It is
rV = rleaf+ rwood+ rroot+ rG, (18)
whererleaf, rwood andrroot are maintenance respiration ratesof leaf, wood and root in g C m−2 day−1, rG is growth respi-ration in g C m−2 day−1. They are calculated as
rleaf = f2(vcmax,L) (19)
rwood = rwNw exp
(308.56
(1
56.02−
1
Ta+ 46.02
))(20)
rroot = rrNr exp
(308.56
(1
56.02−
1
T s+ 46.02
)), (21)
where rw is wood maintenance respiration at daily meanair temperature (Ta) of 10◦C in g C (g N)−1 day−1, rr ismaintenance respiration of root at a daily mean soil tem-perature of the rooting zone (T s) at 10◦C in g C (g N)−1
day−1. Their values are based on the estimates by Reich etal. (2008).Nw andNr are nitrogen amount in wood and roottissue in g N m−2, respectively. The temperature dependenceof Eqs. (20) and (21) are based on Lloyd and Taylor (1994).
Plant growth respiration is modeled as
rG = (1− yg) · (fGPP− rleaf− rwood− rroot) (22)
and
yg = 0.65+ 0.2pn
pn + 1/15. (23)
Equation (23) is based on the work by Kerkhoff et al. (2005)who showed that plant growth respiration increases withpn.
Respiration rates of litter (rL) and soil (rS) also depend onN, P states in litter and soil (Wang et al., 2010).
When plants and soils are disturbed by LULCC, the valuesof carbon and nutrient pool sizes will be different. Accordingto Sects. 2.3 and 2.4, the carbon fluxes depending on poolsizes and nutrient concentrations in pools can be affectedby LULCC directly. Therefore the impacts of N and P onLULCC fluxes are calculated by the differences between thetwo sets of experiments (LUC-CNP− CTL-CNP)− (LUC-C− CTL-C).
4 Results
4.1 Impacts of nutrient limitation on terrestrial carbon
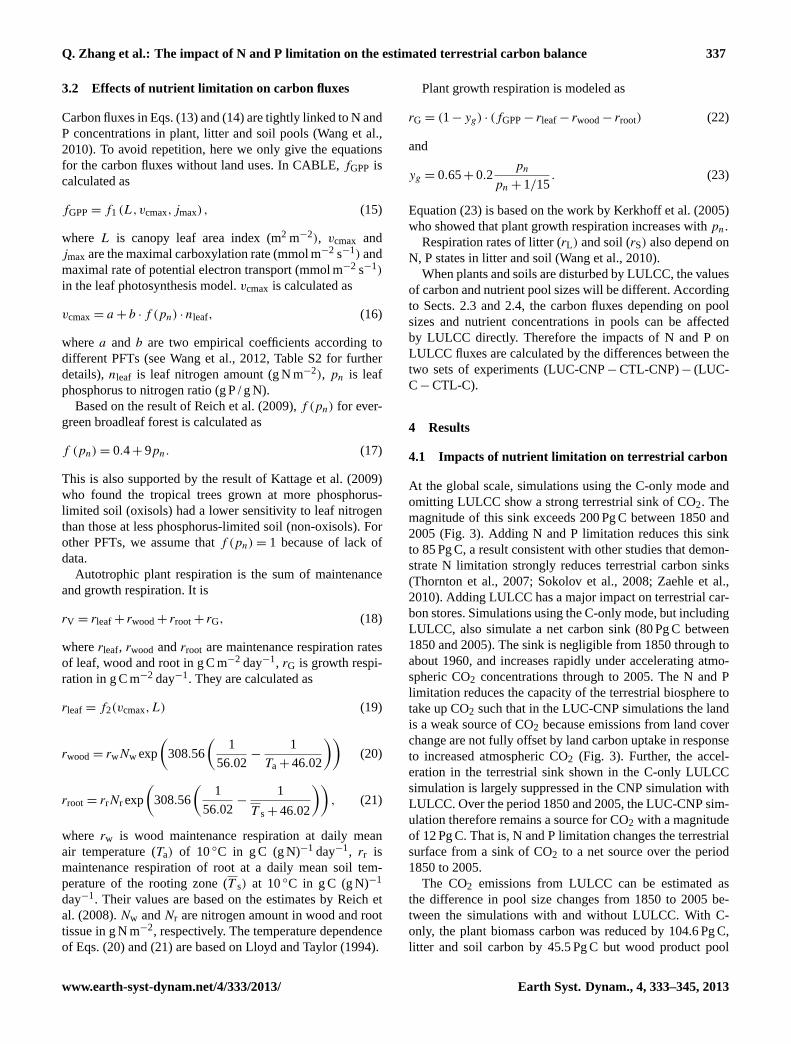
At the global scale, simulations using the C-only mode andomitting LULCC show a strong terrestrial sink of CO2. Themagnitude of this sink exceeds 200 Pg C between 1850 and2005 (Fig. 3). Adding N and P limitation reduces this sinkto 85 Pg C, a result consistent with other studies that demon-strate N limitation strongly reduces terrestrial carbon sinks(Thornton et al., 2007; Sokolov et al., 2008; Zaehle et al.,2010). Adding LULCC has a major impact on terrestrial car-bon stores. Simulations using the C-only mode, but includingLULCC, also simulate a net carbon sink (80 Pg C between1850 and 2005). The sink is negligible from 1850 through toabout 1960, and increases rapidly under accelerating atmo-spheric CO2 concentrations through to 2005. The N and Plimitation reduces the capacity of the terrestrial biosphere totake up CO2 such that in the LUC-CNP simulations the landis a weak source of CO2 because emissions from land coverchange are not fully offset by land carbon uptake in responseto increased atmospheric CO2 (Fig. 3). Further, the accel-eration in the terrestrial sink shown in the C-only LULCCsimulation is largely suppressed in the CNP simulation withLULCC. Over the period 1850 and 2005, the LUC-CNP sim-ulation therefore remains a source for CO2 with a magnitudeof 12 Pg C. That is, N and P limitation changes the terrestrialsurface from a sink of CO2 to a net source over the period1850 to 2005.
The CO2 emissions from LULCC can be estimated asthe difference in pool size changes from 1850 to 2005 be-tween the simulations with and without LULCC. With C-only, the plant biomass carbon was reduced by 104.6 Pg C,litter and soil carbon by 45.5 Pg C but wood product pool
www.earth-syst-dynam.net/4/333/2013/ Earth Syst. Dynam., 4, 333–345, 2013
338 Q. Zhang et al.: The impact of N and P limitation on the estimated terrestrial carbon balance
Fig. 3.Changes in total land carbon (Pg C) for 1850–2005, with andwithout land use change under C-only and N and P limitation. Pos-itive value indicates land carbon uptake from atmosphere to land.
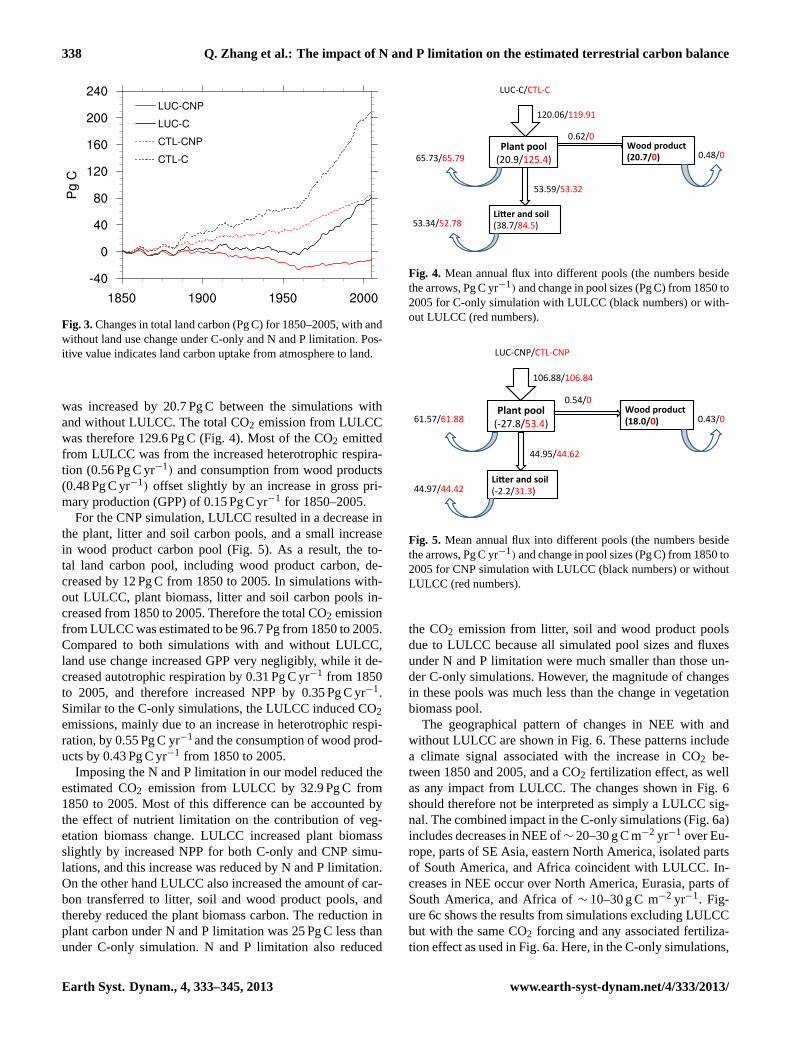
was increased by 20.7 Pg C between the simulations withand without LULCC. The total CO2 emission from LULCCwas therefore 129.6 Pg C (Fig. 4). Most of the CO2 emittedfrom LULCC was from the increased heterotrophic respira-tion (0.56 Pg C yr−1) and consumption from wood products(0.48 Pg C yr−1) offset slightly by an increase in gross pri-mary production (GPP) of 0.15 Pg C yr−1 for 1850–2005.
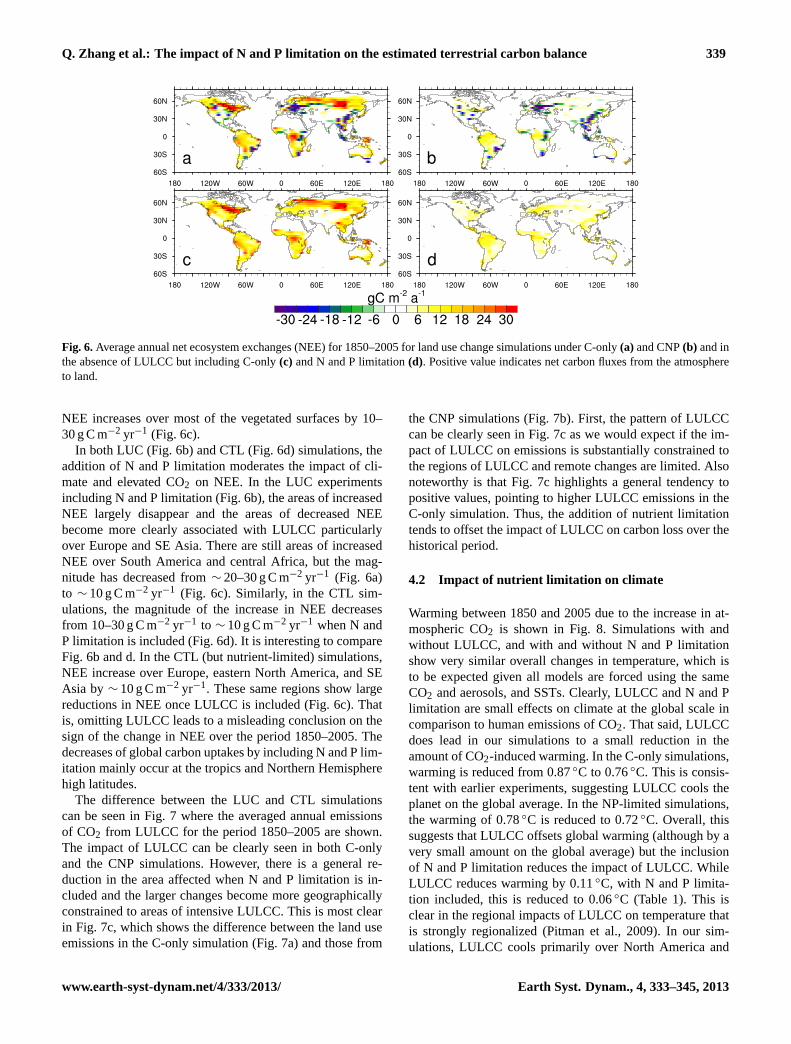
For the CNP simulation, LULCC resulted in a decrease inthe plant, litter and soil carbon pools, and a small increasein wood product carbon pool (Fig. 5). As a result, the to-tal land carbon pool, including wood product carbon, de-creased by 12 Pg C from 1850 to 2005. In simulations with-out LULCC, plant biomass, litter and soil carbon pools in-creased from 1850 to 2005. Therefore the total CO2 emissionfrom LULCC was estimated to be 96.7 Pg from 1850 to 2005.Compared to both simulations with and without LULCC,land use change increased GPP very negligibly, while it de-creased autotrophic respiration by 0.31 Pg C yr−1 from 1850to 2005, and therefore increased NPP by 0.35 Pg C yr−1.Similar to the C-only simulations, the LULCC induced CO2emissions, mainly due to an increase in heterotrophic respi-ration, by 0.55 Pg C yr−1and the consumption of wood prod-ucts by 0.43 Pg C yr−1 from 1850 to 2005.
Imposing the N and P limitation in our model reduced theestimated CO2 emission from LULCC by 32.9 Pg C from1850 to 2005. Most of this difference can be accounted bythe effect of nutrient limitation on the contribution of veg-etation biomass change. LULCC increased plant biomassslightly by increased NPP for both C-only and CNP simu-lations, and this increase was reduced by N and P limitation.On the other hand LULCC also increased the amount of car-bon transferred to litter, soil and wood product pools, andthereby reduced the plant biomass carbon. The reduction inplant carbon under N and P limitation was 25 Pg C less thanunder C-only simulation. N and P limitation also reduced
Plant pool (20.9/125.4)
Li+er and soil (38.7/84.5)
Wood product (20.7/0)
120.06/119.91
53.59/53.32
65.73/65.79
53.34/52.78
0.62/0
0.48/0
LUC-‐C/CTL-‐C
Fig. 4. Mean annual flux into different pools (the numbers besidethe arrows, Pg C yr−1) and change in pool sizes (Pg C) from 1850 to2005 for C-only simulation with LULCC (black numbers) or with-out LULCC (red numbers).
Plant pool (-‐27.8/53.4)
Li+er and soil (-‐2.2/31.3)
Wood product (18.0/0)
106.88/106.84
44.95/44.62
61.57/61.88
44.97/44.42
0.54/0
0.43/0
LUC-‐CNP/CTL-‐CNP
Fig. 5. Mean annual flux into different pools (the numbers besidethe arrows, Pg C yr−1) and change in pool sizes (Pg C) from 1850 to2005 for CNP simulation with LULCC (black numbers) or withoutLULCC (red numbers).
the CO2 emission from litter, soil and wood product poolsdue to LULCC because all simulated pool sizes and fluxesunder N and P limitation were much smaller than those un-der C-only simulations. However, the magnitude of changesin these pools was much less than the change in vegetationbiomass pool.
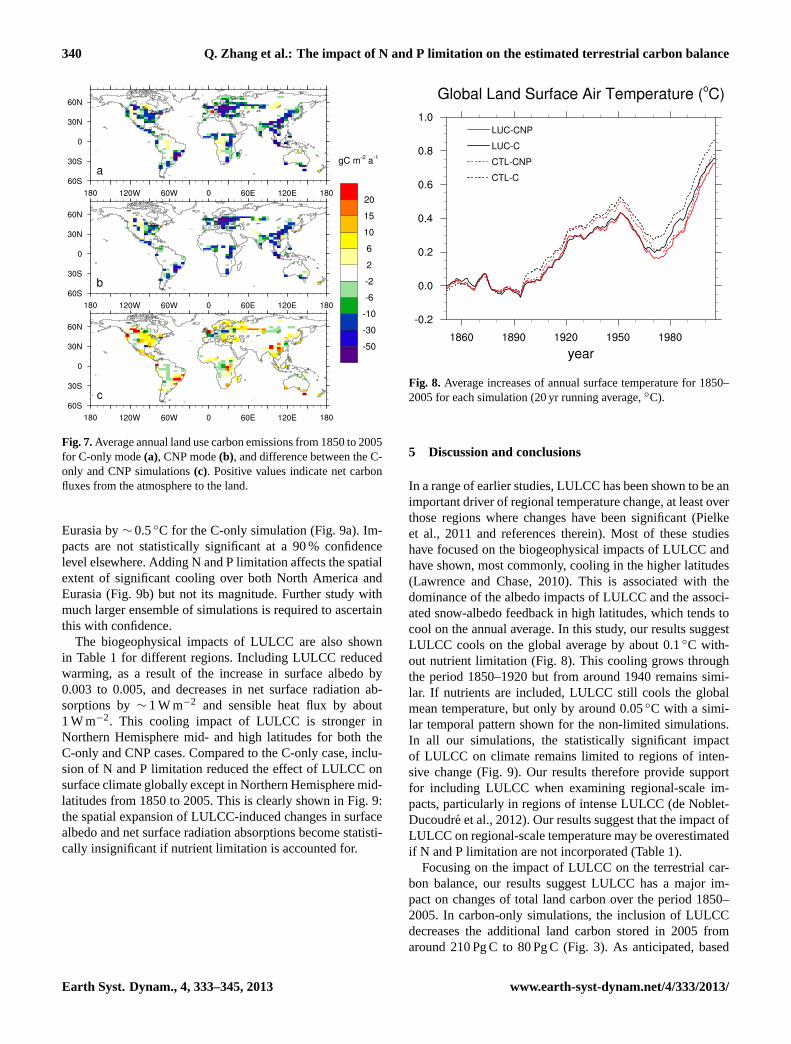
The geographical pattern of changes in NEE with andwithout LULCC are shown in Fig. 6. These patterns includea climate signal associated with the increase in CO2 be-tween 1850 and 2005, and a CO2 fertilization effect, as wellas any impact from LULCC. The changes shown in Fig. 6should therefore not be interpreted as simply a LULCC sig-nal. The combined impact in the C-only simulations (Fig. 6a)includes decreases in NEE of∼ 20–30 g C m−2 yr−1 over Eu-rope, parts of SE Asia, eastern North America, isolated partsof South America, and Africa coincident with LULCC. In-creases in NEE occur over North America, Eurasia, parts ofSouth America, and Africa of∼ 10–30 g C m−2 yr−1. Fig-ure 6c shows the results from simulations excluding LULCCbut with the same CO2 forcing and any associated fertiliza-tion effect as used in Fig. 6a. Here, in the C-only simulations,
Earth Syst. Dynam., 4, 333–345, 2013 www.earth-syst-dynam.net/4/333/2013/
Q. Zhang et al.: The impact of N and P limitation on the estimated terrestrial carbon balance 339
Fig. 6.Average annual net ecosystem exchanges (NEE) for 1850–2005 for land use change simulations under C-only(a) and CNP(b) and inthe absence of LULCC but including C-only(c) and N and P limitation(d). Positive value indicates net carbon fluxes from the atmosphereto land.
NEE increases over most of the vegetated surfaces by 10–30 g C m−2 yr−1 (Fig. 6c).
In both LUC (Fig. 6b) and CTL (Fig. 6d) simulations, theaddition of N and P limitation moderates the impact of cli-mate and elevated CO2 on NEE. In the LUC experimentsincluding N and P limitation (Fig. 6b), the areas of increasedNEE largely disappear and the areas of decreased NEEbecome more clearly associated with LULCC particularlyover Europe and SE Asia. There are still areas of increasedNEE over South America and central Africa, but the mag-nitude has decreased from∼ 20–30 g C m−2 yr−1 (Fig. 6a)to ∼ 10 g C m−2 yr−1 (Fig. 6c). Similarly, in the CTL sim-ulations, the magnitude of the increase in NEE decreasesfrom 10–30 g C m−2 yr−1 to ∼ 10 g C m−2 yr−1 when N andP limitation is included (Fig. 6d). It is interesting to compareFig. 6b and d. In the CTL (but nutrient-limited) simulations,NEE increase over Europe, eastern North America, and SEAsia by∼ 10 g C m−2 yr−1. These same regions show largereductions in NEE once LULCC is included (Fig. 6c). Thatis, omitting LULCC leads to a misleading conclusion on thesign of the change in NEE over the period 1850–2005. Thedecreases of global carbon uptakes by including N and P lim-itation mainly occur at the tropics and Northern Hemispherehigh latitudes.
The difference between the LUC and CTL simulationscan be seen in Fig. 7 where the averaged annual emissionsof CO2 from LULCC for the period 1850–2005 are shown.The impact of LULCC can be clearly seen in both C-onlyand the CNP simulations. However, there is a general re-duction in the area affected when N and P limitation is in-cluded and the larger changes become more geographicallyconstrained to areas of intensive LULCC. This is most clearin Fig. 7c, which shows the difference between the land useemissions in the C-only simulation (Fig. 7a) and those from
the CNP simulations (Fig. 7b). First, the pattern of LULCCcan be clearly seen in Fig. 7c as we would expect if the im-pact of LULCC on emissions is substantially constrained tothe regions of LULCC and remote changes are limited. Alsonoteworthy is that Fig. 7c highlights a general tendency topositive values, pointing to higher LULCC emissions in theC-only simulation. Thus, the addition of nutrient limitationtends to offset the impact of LULCC on carbon loss over thehistorical period.
4.2 Impact of nutrient limitation on climate
Warming between 1850 and 2005 due to the increase in at-mospheric CO2 is shown in Fig. 8. Simulations with andwithout LULCC, and with and without N and P limitationshow very similar overall changes in temperature, which isto be expected given all models are forced using the sameCO2 and aerosols, and SSTs. Clearly, LULCC and N and Plimitation are small effects on climate at the global scale incomparison to human emissions of CO2. That said, LULCCdoes lead in our simulations to a small reduction in theamount of CO2-induced warming. In the C-only simulations,warming is reduced from 0.87◦C to 0.76◦C. This is consis-tent with earlier experiments, suggesting LULCC cools theplanet on the global average. In the NP-limited simulations,the warming of 0.78◦C is reduced to 0.72◦C. Overall, thissuggests that LULCC offsets global warming (although by avery small amount on the global average) but the inclusionof N and P limitation reduces the impact of LULCC. WhileLULCC reduces warming by 0.11◦C, with N and P limita-tion included, this is reduced to 0.06◦C (Table 1). This isclear in the regional impacts of LULCC on temperature thatis strongly regionalized (Pitman et al., 2009). In our sim-ulations, LULCC cools primarily over North America and
www.earth-syst-dynam.net/4/333/2013/ Earth Syst. Dynam., 4, 333–345, 2013
340 Q. Zhang et al.: The impact of N and P limitation on the estimated terrestrial carbon balance
Fig. 7.Average annual land use carbon emissions from 1850 to 2005for C-only mode(a), CNP mode(b), and difference between the C-only and CNP simulations(c). Positive values indicate net carbonfluxes from the atmosphere to the land.
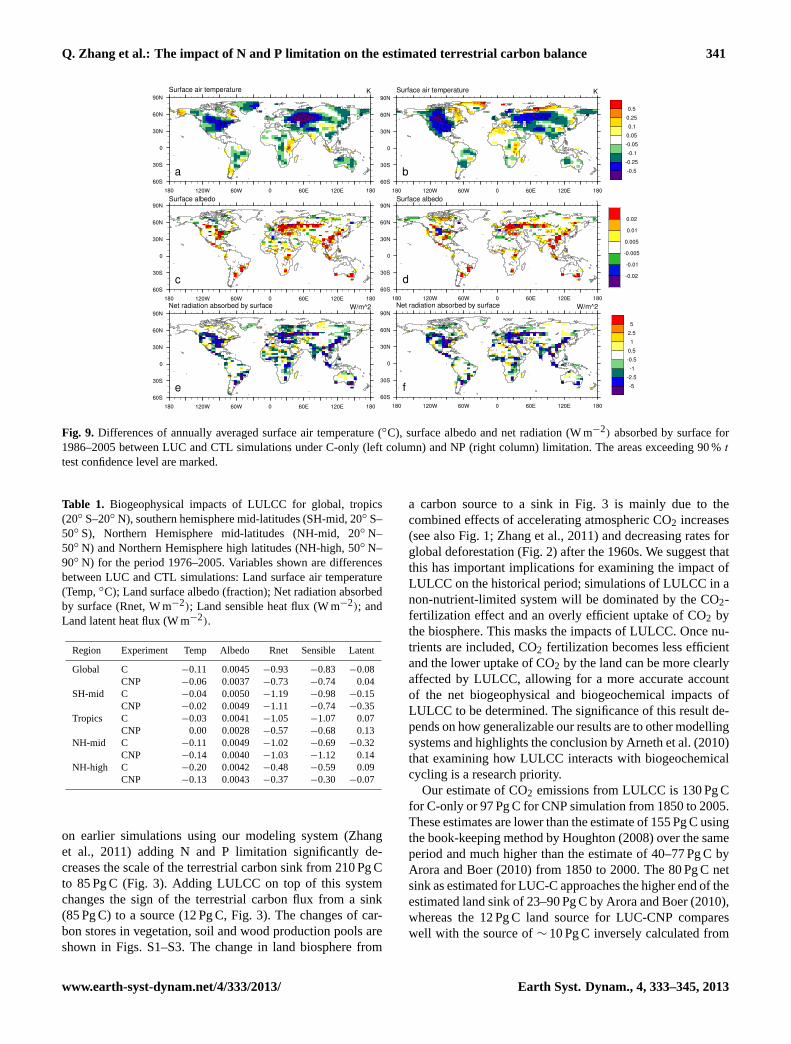
Eurasia by∼ 0.5◦C for the C-only simulation (Fig. 9a). Im-pacts are not statistically significant at a 90 % confidencelevel elsewhere. Adding N and P limitation affects the spatialextent of significant cooling over both North America andEurasia (Fig. 9b) but not its magnitude. Further study withmuch larger ensemble of simulations is required to ascertainthis with confidence.
The biogeophysical impacts of LULCC are also shownin Table 1 for different regions. Including LULCC reducedwarming, as a result of the increase in surface albedo by0.003 to 0.005, and decreases in net surface radiation ab-sorptions by∼ 1 W m−2 and sensible heat flux by about1 W m−2. This cooling impact of LULCC is stronger inNorthern Hemisphere mid- and high latitudes for both theC-only and CNP cases. Compared to the C-only case, inclu-sion of N and P limitation reduced the effect of LULCC onsurface climate globally except in Northern Hemisphere mid-latitudes from 1850 to 2005. This is clearly shown in Fig. 9:the spatial expansion of LULCC-induced changes in surfacealbedo and net surface radiation absorptions become statisti-cally insignificant if nutrient limitation is accounted for.
Fig. 8. Average increases of annual surface temperature for 1850–2005 for each simulation (20 yr running average,◦C).
5 Discussion and conclusions
In a range of earlier studies, LULCC has been shown to be animportant driver of regional temperature change, at least overthose regions where changes have been significant (Pielkeet al., 2011 and references therein). Most of these studieshave focused on the biogeophysical impacts of LULCC andhave shown, most commonly, cooling in the higher latitudes(Lawrence and Chase, 2010). This is associated with thedominance of the albedo impacts of LULCC and the associ-ated snow-albedo feedback in high latitudes, which tends tocool on the annual average. In this study, our results suggestLULCC cools on the global average by about 0.1◦C with-out nutrient limitation (Fig. 8). This cooling grows throughthe period 1850–1920 but from around 1940 remains simi-lar. If nutrients are included, LULCC still cools the globalmean temperature, but only by around 0.05◦C with a simi-lar temporal pattern shown for the non-limited simulations.In all our simulations, the statistically significant impactof LULCC on climate remains limited to regions of inten-sive change (Fig. 9). Our results therefore provide supportfor including LULCC when examining regional-scale im-pacts, particularly in regions of intense LULCC (de Noblet-Ducoudre et al., 2012). Our results suggest that the impact ofLULCC on regional-scale temperature may be overestimatedif N and P limitation are not incorporated (Table 1).
Focusing on the impact of LULCC on the terrestrial car-bon balance, our results suggest LULCC has a major im-pact on changes of total land carbon over the period 1850–2005. In carbon-only simulations, the inclusion of LULCCdecreases the additional land carbon stored in 2005 fromaround 210 Pg C to 80 Pg C (Fig. 3). As anticipated, based
Earth Syst. Dynam., 4, 333–345, 2013 www.earth-syst-dynam.net/4/333/2013/
Q. Zhang et al.: The impact of N and P limitation on the estimated terrestrial carbon balance 341
Fig. 9. Differences of annually averaged surface air temperature (◦C), surface albedo and net radiation (W m−2) absorbed by surface for
1986–2005 between LUC and CTL simulations under C-only (left column) and NP (right column) limitation. The areas exceeding 90 %t
test confidence level are marked.
Table 1. Biogeophysical impacts of LULCC for global, tropics(20◦ S–20◦ N), southern hemisphere mid-latitudes (SH-mid, 20◦ S–50◦ S), Northern Hemisphere mid-latitudes (NH-mid, 20◦ N–50◦ N) and Northern Hemisphere high latitudes (NH-high, 50◦ N–90◦ N) for the period 1976–2005. Variables shown are differencesbetween LUC and CTL simulations: Land surface air temperature(Temp,◦C); Land surface albedo (fraction); Net radiation absorbedby surface (Rnet, W m−2); Land sensible heat flux (W m−2); andLand latent heat flux (W m−2).
Region Experiment Temp Albedo Rnet Sensible Latent
Global C −0.11 0.0045 −0.93 −0.83 −0.08CNP −0.06 0.0037 −0.73 −0.74 0.04
SH-mid C −0.04 0.0050 −1.19 −0.98 −0.15CNP −0.02 0.0049 −1.11 −0.74 −0.35
Tropics C −0.03 0.0041 −1.05 −1.07 0.07CNP 0.00 0.0028 −0.57 −0.68 0.13
NH-mid C −0.11 0.0049 −1.02 −0.69 −0.32CNP −0.14 0.0040 −1.03 −1.12 0.14
NH-high C −0.20 0.0042 −0.48 −0.59 0.09CNP −0.13 0.0043 −0.37 −0.30 −0.07
on earlier simulations using our modeling system (Zhanget al., 2011) adding N and P limitation significantly de-creases the scale of the terrestrial carbon sink from 210 Pg Cto 85 Pg C (Fig. 3). Adding LULCC on top of this systemchanges the sign of the terrestrial carbon flux from a sink(85 Pg C) to a source (12 Pg C, Fig. 3). The changes of car-bon stores in vegetation, soil and wood production pools areshown in Figs. S1–S3. The change in land biosphere from
a carbon source to a sink in Fig. 3 is mainly due to thecombined effects of accelerating atmospheric CO2 increases(see also Fig. 1; Zhang et al., 2011) and decreasing rates forglobal deforestation (Fig. 2) after the 1960s. We suggest thatthis has important implications for examining the impact ofLULCC on the historical period; simulations of LULCC in anon-nutrient-limited system will be dominated by the CO2-fertilization effect and an overly efficient uptake of CO2 bythe biosphere. This masks the impacts of LULCC. Once nu-trients are included, CO2 fertilization becomes less efficientand the lower uptake of CO2 by the land can be more clearlyaffected by LULCC, allowing for a more accurate accountof the net biogeophysical and biogeochemical impacts ofLULCC to be determined. The significance of this result de-pends on how generalizable our results are to other modellingsystems and highlights the conclusion by Arneth et al. (2010)that examining how LULCC interacts with biogeochemicalcycling is a research priority.
Our estimate of CO2 emissions from LULCC is 130 Pg Cfor C-only or 97 Pg C for CNP simulation from 1850 to 2005.These estimates are lower than the estimate of 155 Pg C usingthe book-keeping method by Houghton (2008) over the sameperiod and much higher than the estimate of 40–77 Pg C byArora and Boer (2010) from 1850 to 2000. The 80 Pg C netsink as estimated for LUC-C approaches the higher end of theestimated land sink of 23–90 Pg C by Arora and Boer (2010),whereas the 12 Pg C land source for LUC-CNP compareswell with the source of∼ 10 Pg C inversely calculated from
www.earth-syst-dynam.net/4/333/2013/ Earth Syst. Dynam., 4, 333–345, 2013
342 Q. Zhang et al.: The impact of N and P limitation on the estimated terrestrial carbon balance
other better-constrained fluxes (Denman et al., 2007). Basedon the same interpretation of land cover trajectories fromHurtt et al. (2006), the LULCC emission (119 Pg C) simu-lated by CLM4 with N limitation (Lawrence et al., 2012) isconsistent but lower than our C-only estimate (130 Pg C) andhigher than the estimate for CNP (97 Pg C). CLM4 also pro-duced a land carbon source of 68 Pg C for the 1850–2005period, which is higher than the estimated source of 12 Pg Cin our LUC-CNP simulation.
Our study shows that nutrient limitation significantly re-duced CO2 emission from LULCC from 1850 to 2005, andthis has significant implications on the global carbon bud-get. From 1850 to 2005, the total CO2 emission from fos-sil fuel burning was estimated to be 314 Pg C (Andres et al.,2011), about 200 Pg C was accumulated in the atmosphere,135 Pg C was taken up by the ocean (Khatiwala et al., 2009).If the CO2 emission from LULCC was 97 Pg C over the sameperiod, the accumulated land carbon uptake is calculated as76 Pg C for the nutrient-limiting simulation, which is 21 Pg Cless than the estimated land carbon uptake from 1960 to 2005by Canadell et al. (2007).
As stated by Houghton et al. (2012), the high uncertaintyin estimating carbon fluxes is linked to LULCC not only be-cause of uncertainties in rates of changes in land surface,but also because of the incomplete processes adopted by dif-ferent models (e.g. wood harvest and shifting cultivation).It is also conceivable that using estimated N and P deposi-tions for the 1990s for the whole simulation period in thisstudy would likely underestimate the effects on nutrient lim-itation on land carbon uptakes. The overall effect is likely tobe secondary, and will not substantially alter our conclusion.This will be explored in the future. We note that there areinevitably some other caveats to our study. It is dependenton one Earth system model, one representation of the bio-geochemical cycles and one implementation of LULCC. Wehave also used prescribed SSTs from earlier simulations withour modeling system, which has the potential to suppress im-pacts from LULCC (Davin and de Noblet-Ducoudre, 2010).Clearly, we would advocate experiments such as ours beingrepeated with other Earth system models that include N andP limitation. That said, we suspect that our core conclusionthat the inclusion of N and P limitation reduces the impactof LULCC on both temperature and on the terrestrial carbonbalance will be supported by other modeling results in thefuture.
Supplementary material related to this article isavailable online at:http://www.earth-syst-dynam.net/4/333/2013/esd-4-333-2013-supplement.pdf.
Acknowledgements.The authors thank Leon Rotstayan andhis team for providing the modeled sea surface tempera-ture data from their simulations, and the financial support ofNSFC 41305083, China Scholarship Council and China MOSTNo. 2010CB951802 to Qian Zhang, and the Australian departmentof Climate Change and Energy efficiency to Ying Ping Wang. Thiswork was supported by the Australian Research Council Centre ofExcellence for Climate System Science grant CE110001028, andvia Discovery Grant DP110102618.
Edited by: R. Betts
References
Abramowitz, G., Pitman, A. J., Gupta, H., Kowalczyk, E., andWang, Y.: Systematic bias in land surface models, J. Hydrom-eteorol., 8, 989–1001, doi:10.1175/JHM628.1, 2007.
Abramowitz, G., Leuning, R., Clark, M., and Pitman, A. J.: Eval-uating the performance of land surface models, J. Climate, 21,5468–5481, 2008.
Andres, R. J., Gregg, J. S., Losey, L., Marland, G., and Boden, T.A.: Monthly, global emissions of carbon dioxide from fossil fuelconsumption, Tellus B, 63, 309–327, 2011.
Arneth, A., Harrison, S. P., Zaehle, S., Tsigaridis, K., Menon, S.,Bartlein, P. J., Feichter, J., Korhola, A., Kulmala, M., O’Donnell,D., Schurgers, G., Sorvari, S., and Vesala T.: Terrestrial biogeo-chemical feedbacks in the climate system, Nat. Geosci., 3, 525–532, doi:10.1038/ngeo905, 2010.
Arora, V. and Boer, G. J.: Uncertainties in the 20th century carbonbudget associated with land use change, Glob. Change Biol., 16,3327–3348, doi:10.1111/j.1365-2486.2010.02202.x, 2010.
Avila, F. B., Pitman, A. J., Donat, M., Alexander, L., andAbramowitz G.: Climate model simulated changes in tempera-ture extremes due to land cover change, J. Geophys. Res., 117,D04108, doi:10.1029/2011JD016382, 2012.
Bala, G., Caldeira, K., Wickett, M., Phillips, T. J., Lobell, D. B.,Delire, C., and Mirin, A.: Combined climate and carbon-cycleeffects of large-scale deforestation, P. Natl. Acad. Sci. USA, 106,6550–6555, doi:10.1073/pnas.0608998104, 2007.
Boisier, J. P., de Noblet-Ducoudre, N., Pitman, A. J., Cruz,F., Delire, C., van den Hurk, B. J. J. M., van der Molen,M. K., Muller, C., and Voldoire, A.: Attributing the biogeo-physical impacts of Land-Use induced Land-Cover Changeson surface climate to specific causes. Results from the firstLUCID set of simulations, J. Geophys. Res., 117, D12116,doi:10.1029/2011JD017106, 2012.
Bonan, G. B.: Effects of land use on the climate of the United States,Climatic Change, 37, 449–486, 1997.
Bonan, G. B.: Forests and climate change: forcings, feedbacks, andthe climate benefits from the forests, Science, 320, 1444–1449,doi:10.1126/science.1155121, 2008.
Brovkin, V., Sitch, S., von Bloh, W., Claussen, M., Bauer, E., andCramer, W.: Role of land cover changes for atmospheric CO2increase and climate change during the last 150 years, Glob.Change Biol., 10, 1253–1266, 2004.
Canadell, J. G., Le Quere, C., Raupach, M. R., Field, C., Buitenhuis,E. T., Ciais, P., Conway, T. J., Gillett, N. P., Houghton, R. A.,and Marland, G.: Contributions to accelerating atmospheric CO2growth from economic activity, carbon intensity, and efficiency
Earth Syst. Dynam., 4, 333–345, 2013 www.earth-syst-dynam.net/4/333/2013/
Q. Zhang et al.: The impact of N and P limitation on the estimated terrestrial carbon balance 343
of natural sinks, P. Natl. Acad. Sci. USA, 104, 18866–18870,doi:10.1073/pnas.0702737104, 2007.
Davin, E. L. and de Noblet-Ducoudre, N.: Climatic impact ofglobal-scale deforestation: Radiative versus nonradiative pro-cesses, J. Climate, 23, 97–112, 2010.
de Noblet-Ducoudre, N., Boisier, J. P., Pitman, A. J., Bonan, G. B.,Brovkin, V., Cruz, F., Delire, C., Gayler, V., van den Hurk, B.J. J. M., Lawrence, P. J., van der Molen, M. K., Muller, C., Re-ick, C. H., Strengers, B. J., and Voldoire, A.: Determining robustimpacts of land-use induced land-cover changes on surface cli-mate over North America and Eurasia: Results from the first setof LUCID experiments, J. Climate, 25, 3261–3281, 2012.
Denman, K. L., Brasseur, G., Chidthaisong, A., Ciais, P., Cox, P.M., Dickinson, R. E., Hauglustaine, D., Heinze, C., Holland, E.,Jacob, D., Lohmann, U., Ramachandran, S., da Silva Dias, P. L.,Wofsy S. C., and Zhang, X.: Couplings Between Changes in theClimate System and Biogeochemistry, in: Climate Change 2007:The Physical Science Basis. Contribution of Working Group Ito the Fourth Assessment Report of the Intergovernmental Panelon Climate Change, edited by: Solomon, S., Qin, D., Manning,M., Chen, Z., Marquis, M., Averyt, K. B., Tignor, M., and Miller,H. L., Cambridge University Press, Cambridge, United Kingdomand New York, NY, USA, 2007.
Dentener, F. J.: Global Maps of Atmospheric Nitrogen Deposition,1860, 1993, and 2050, Data set, available at:http://daac.ornl.gov/(last access: 2 August 2012), from Oak Ridge National Labora-tory Distributed ActiveA rchive Center, Oak Ridge, Tennessee,US, 2006.
Feddema, J. J., Oleson, K. W., Bonan, G. B., Mearns, L. O., Buja,L. E., Meehl G. A., and Washington, W. M.: The importance ofland-cover change in simulating future climates, Science, 310,1674–1678, doi:10.1126/science.1118160, 2005.
Field, C., Jackson, R., and Mooney, H.: Stomatal responses to in-creased CO2: implications from the plant to the global scale,Plant Cell. Environ., 18, 1214–1225, 1995.
Findell, K. L., Shevliakova, E., Milly, P. C. D., and Stouffer, R. J.:Modeled impact of anthropogenic land cover change on climate,J. Climate, 20, 3621–3634, 2007.
Findell, K. L., Pitman, A. J., England, M. H., and Pegion, P.: Re-gional and Global Impacts of Land Cover Change and Sea Sur-face Temperature Anomalies, J. Climate, 22, 3248–3269, 2009.
Friedlingstein, P., Cox, P., Betts, R., Bopp, L., von Bloh, W.,Brovkin, V., Cadule, P., Doney, S., Eby, M., Fung, I., Bala, G.,John, J., Jones, C., Joos, F., Kato, T., Kawamiya, M., Knorr, W.,Lindsay, K., Matthews, H. D., Raddatz, T., Rayner, P., Reick,C., Roeckner, E., Schnitzler, K. G., Schnur, R., Strassmann, K.,Weaver, A. J., Yoshikawa, C., and Zeng, N.: Climate-carbon cy-cle feedback analysis: Results from the C4MIP model intercom-parison, J. Climate, 19, 3337–3353, 2006.
Gallo, K. P., Owen, T. W., Easterling, D. R., and Jamason, P. F.:Temperature trends of the U.S. historical climatology networkbased on satellite designated land use/land cover, J. Climate, 12,1344–1348, 1999.
Houghton, R. A.: Carbon Flux to the Atmosphere from Land-UseChanges: 1850-2005. In TRENDS: A Compendium of Data onGlobal Change, Carbon Dioxide Information Analysis Center,Oak Ridge National Laboratory, U.S. Department of Energy, OakRidge, Tenn., USA, 2008.
Houghton, R. A. and Goodale, C. L.: Effects of land-use change onthe carbon balance of terrestrial ecosystems, in: Ecosystems andLand Use Change, edited by: DeFries, R. S., Asner, G. P., andHoughton, R. A., 85–98, American Geophysical Union, Wash-ington, DC, 2004.
Houghton, R. A., House, J. I., Pongratz, J., van der Werf, G. R., De-Fries, R. S., Hansen, M. C., Le Quere, C., and Ramankutty, N.:Carbon emissions from land use and land-cover change, Biogeo-sciences, 9, 5125–5142, doi:10.5194/bg-9-5125-2012, 2012.
Hurtt, G. C., Frolking, S., Fearon, M. G., Moore III, B., Shevli-akova, E., Malyshev, S., Pacala, S., and Houghton, R. A.: Theunderpinnings of land-use history: three centuries of global grid-ded land-use transitions, wood harvest activity, and resulting sec-ondary lands, Glob. Change Biol., 12, 1–22, doi:10.1111/j.1365-2486.2006.01150.x, 2006.
Kattge, J., Knorr, W., Raddatz, T., and Wirth, C.: Quantifying pho-tosynthetic capacity and its relationship to leaf nitrogen contentfor global-scale terrestrial biosphere models, Glob. Change Biol.,15, 976–991, 2009.
Kerkhoff, A. J., Enquist, B. J., Elser, J. J., and Fagan, W. F.: Plantallometry, stoichiometry and the temperature-dependence of pri-mary productivity, Global Ecol. Biogeogr., 14, 585–598, 2005.
Khatiwala, S., Primeau, F., and Hall, T.: Reconstruction of the his-tory of anthropogenic CO2 concentrations in the ocean, Nature,462, 346–349, 2009.
Lawrence, P. J. and Chase, T. N.: Investigating the climate impactsof global land cover change in the community climate systemmodel, Int. J. Climatol., 30, 2066–2087, doi:10.1002/joc.2061,2010.
Lawrence, P. J., Feddema, J. J., Bonan, G. B., Meehl, G. A., O’Neill,B. C., Levis, S., Lawrence, D. M., Oleson, K. W., Kluzek, E.,Lindsay, K., and Thornton, P. E.: Simulating the biogeochemi-cal and biogeophysical impacts of transient land cover changeand wood harvest in the Community Climate System Model(CCSM4) from 1850 to 2100, J. Climate, CCSM4 Special Col-lection, 25, 3071–3095, doi:10.1175/JCLI-D-11-00256.1, 2012.
Le Quere, C., Raupach, M. R., Canadell, J. G., Marland, G., Bopp,L., Ciais, P., Conway, T. J., Doney, S. C., Feely, R. A., Foster, P.,Friedlingstein, P., Gurney, K. R., Houghton, R. A., House, J. I.,Huntingford, C., Levy, P. E., Lomas, M. R., Majkut, J., Metzl, N.,Ometto, J., Peters, G. P., Prentice, I. C., Randerson, J. T., Run-ning, S. W., Sarmiento, J. L., Schuster, U., Sitch, S., Takahashi,T., Viovy, N., van der Werf, G. R., and Woodward, F. I.: Trendsin the sources and sinks of carbon dioxide, Nat. Geosci., 2, 831–836, doi:10.1038/NGEO689, 2009.
Levis, S.: Modeling vegetation and land use in models of the EarthSystem, WIREs, Climatic Change, 1, 1–17, doi:10.1002/wcc.83,2010.
Lloyd, J. and Taylor, J. A.: On the temperature dependence of soilrespiration, Funct. Ecol, 8, 315–323, 1994.
Lobell, D. B., Bonfils, C., and Faures, J. M.: The Role of IrrigationExpansion in Past and Future Temperature Trends, Earth Inter-act., 12, 1–11, 2008.
Mahowald, N., Jickells, T. D., Baker, A. R., Artaxo, P., Benitez-Nelson, C. R., Bergametti, G., Bond, T. C., Chen, Y., Cohen,D. D., Herut, B., Kubilay, N., Losno, R., Luo, C., Maenhaut,W., McGee, K. A., Okin, G. S., Siefert, R. L., and Tsukuda, S.:Global distribution of atmospheric phosphorus sources, concen-trations and deposition rates, and anthropogenic impacts, Global
www.earth-syst-dynam.net/4/333/2013/ Earth Syst. Dynam., 4, 333–345, 2013
344 Q. Zhang et al.: The impact of N and P limitation on the estimated terrestrial carbon balance
Biogeochem. Cy., 22, GB4026, doi:10.1029/2008GB003240,2008.
Mao, J., Phipps, S. J., Pitman, A. J., Wang, Y. P., Abramowitz,G., and Pak, B.: The CSIRO Mk3L climate system model v1.0coupled to the CABLE land surface scheme v1.4b: evaluationof the control climatology, Geosci. Model Dev., 4, 1115–1131,doi:10.5194/gmd-4-1115-2011, 2011.
Meinshausen, M., Smith, S. J., Calvin, K., Daniel, J. S., Kainuma,M. L. T., Lamarque, J. F., Matsumoto, K., Montzka, S. A., Raper,S. C. B., Riahi, K., Thomson, A., Velders, G. J. M., and van Vu-uren, D. P. P.: The RCP greenhouse gas concentrations and theirextensions from 1765 to 2300, Climatic Change, 109, 213–241,2011.
Niyogi, D., Kishtawal, C. M., Tripathi, S., and Govindaraju,R. S.: Observational evidence that agricultural intensifica-tion and land use change may be reducing the Indian Sum-mer Monsoon rainfall, Water Resour. Res., 46, W03533,doi:10.1029/2008WR007082, 2010.
Phipps, S. J., Rotstayn, L. D., Gordon, H. B., Roberts, J. L., Hirst,A. C., and Budd, W. F.: The CSIRO Mk3L climate system modelversion 1.0 – Part 1: Description and evaluation, Geosci. ModelDev., 4, 483–509, doi:10.5194/gmd-4-483-2011, 2011.
Pielke, R. A. Sr., Pitman, A. J., Niyogi, D., Mahmood, R.,McAlpine, C., Hossain, F., Klein Goldewijk, K., Nair, U., Betts,R., Fall, S., Reichstein, M., Kabat, P., and de Noblet-Ducoudre,N.: Land use/land cover changes and climate: Modeling analysisand observational evidence, WIREs Climatic Change, 2, 828–850, doi:10.1002/wcc.144, 2011.
Pitman, A. J., de Noblet-Ducoudre, N., Cruz, F. T., Davin, E. L.,Bonan, G. B., Brovkin, V., Claussen, M., Delire, C., Ganzeveld,L., Gayler, V., van den Hurk, B. J. J. M., Lawrence, P. J., vander Molen, M. K., Muller, C., Reick, C. H., Seneviratne, S. I.,Strengers, B. J., and Voldoire, A.: Uncertainties in climate re-sponses to past land cover change: First results from the LU-CID intercomparison study, Geophys. Res. Lett., 36, L14814,doi:10.1029/2009GL039076, 2009.
Pitman, A. J., de Noblet-Ducoudre, N., Avila, F. B., Alexander, L.V., Boisier, J.-P., Brovkin, V., Delire, C., Cruz, F., Donat, M. G.,Gayler, V., van den Hurk, B., Reick, C., and Voldoire, A.: Effectsof land cover change on temperature and rainfall extremes inmulti-model ensemble simulations, Earth Syst. Dynam., 3, 213–231, doi:10.5194/esd-3-213-2012, 2012.
Pongratz, J., Reick, C. H., Raddatz, T., and Claussen, M.: Ef-fects of anthropogenic land cover change on the carbon cycleof the last millennium, Global Biogeochem. Cy., 23, GB4001,doi:10.1029/2009GB003488, 2009.
Pongratz, J., Reick, C. H., Raddatz, T., and Claussen, M.: Biogeo-physical versus biogeochemical climate response to historical an-thropogenic land cover change, Geophys. Res. Lett., 37, L08702,doi:10.1029/2010GL043010, 2010.
Pongratz, J., Reick, C. H., Raddatz, T., Caldeira, K., and Claussen,M.: Past land use decisions have increased mitigation po-tential of reforestation, Geophys. Res. Lett., 38, L15701,doi:10.1029/2011GL047848, 2011.
Reich, P. B., Tjoelker, M. G., Pregitzer, K. S., Wright, I. J., Oleksyn,J., and Machado, J. L.: Scaling of respiration to nitrogen inleaves, stems and roots of higher land plants, Ecol. Lett., 11, 793–801, 2008.
Reich, P. B., Oleksyn, J., and Wright, I. J.: Leaf phosphorus in-fuences the photosynthesis– nitrogen relation: a cross-biomeanalysis of 314 species, Oecologia, 160, 207–212, 2009.
Rotstayn, L. D., Collier, M. A., Feng, Y., Gordon, H. B., O’Farrell,S. P., Smith, I. N., and Syktus, J.: Improved simulation of Aus-tralian climate and ENSO-related rainfall variability in a GCMwith an interactive aerosol treatment, Int. J. Climatol., 30, 1067–1088, doi:10.1002/joc.1952, 2010.
Rotstayn, L. D., Jeffrey, S. J., Collier, M. A., Dravitzki, S. M., Hirst,A. C., Syktus, J. I., and Wong, K. K.: Aerosol- and greenhousegas-induced changes in summer rainfall and circulation in theAustralasian region: a study using single-forcing climate simula-tions, Atmos. Chem. Phys., 12, 6377–6404, doi:10.5194/acp-12-6377-2012, 2012.
Shevliakova, E., Pacala, S. W., Malyshev, S., Hurtt, G. C., Milly,P. C. D., Caspersen, J. P., Sentman, L. T., Fisk, J. P., Wirth,C., and Crevoisier, C.: Carbon cycling under 300 years of landuse change: Importance of the secondary vegetation sink, GlobalBiogeochem. Cy., 23, GB2022, doi:10.1029/2007GB003176,2009.
Sitch, S., Brovkin, V., von Bloh, W., van Vuuren, D., Eickhout,B., and Ganopolski A.: Impacts of future land cover changeson atmospheric CO2 and climate, Global Biogeochem. Cy., 19,GB2013, doi:10.1029/2004GB002311, 2005.
Sokolov, A. P., Kicklighter, D. W., Melillo, J. M., Felzer, B. S.,Schlosser, C. A., and Cronin, T. W.: Consequences of Consid-ering Carbon–Nitrogen Interactions on the Feedbacks betweenClimate and the Terrestrial Carbon Cycle, J. Climate, 21, 3776–3796, 2008.
Taylor, K. E., Stouffer, R. J., and Meehl, G. A.: An overview ofCMIP5 and the experiment design, B. Am. Meteorol. Soc., 93,485–498, 2012.
Thornton, P. E., Lamarque, J. F., Rosenbloom, N. A., andMahowald, N. M.: Influence of carbon-nitrogen cycle cou-pling on land model response to CO2 fertilization andclimate variability, Global Biogeochem. Cy., 21, GB4018,doi:10.1029/2006GB002868, 2007.
Vitousek, P. M., Porder, S., Houlton, B. Z., and Chadwick, O.A.: Terrestrial phosphorus limitation: mechanisms, implications,and nitrogen-phosphorus interactions, Ecol. Appl., 20, 5–15,doi:10.1890/08-0127.1, 2010.
Wang, Y. P., Law, R. M., and Pak, B.: A global model of carbon,nitrogen and phosphorus cycles for the terrestrial biosphere, Bio-geosciences, 7, 2261–2282, doi:10.5194/bg-7-2261-2010, 2010.
Wang, Y. P., Kowalczyk, E., Leuning, R., Abramowitz, G., Rau-pach, M. R., Pak, B., van Gorsel, E., and Luhar, A.: Di-agnosing errors in a land surface model (CABLE) in thetime and frequency domains, J. Geophys. Res., 116, G01034,doi:10.1029/2010JG001385, 2011.
Wang, Y. P., Lu, X. J., Wright, I. J., Dai, Y. J., Rayner, P. J., andReich, P. B.: Correlations among leaf traits provide a significantconstraint on the estimate of global gross primary production.Geophys. Res. Lett., 39, L19405, doi:10.1029/2012GL053461,2012.
Yang, X., Richardson, T. K., and Jain, A. K.: Contributions ofsecondary forest and nitrogen dynamics to terrestrial carbonuptake, Biogeosciences, 7, 3041–3050, doi:10.5194/bg-7-3041-2010, 2010.
Earth Syst. Dynam., 4, 333–345, 2013 www.earth-syst-dynam.net/4/333/2013/
Q. Zhang et al.: The impact of N and P limitation on the estimated terrestrial carbon balance 345
Zaehle, S., Friedlingstein, P., and Friend, A. D.: Terrestrial nitrogenfeedbacks may accelerate future climate change, Geophys. Res.Lett., 37, L01401, doi:10.1029/2009GL041345, 2010.
Zhang, Q., Wang, Y. P., Pitman, A. J., and Dai, Y. J.: Limi-tations of nitrogen and phosphorous on the terrestrial carbonuptake in the 20th century, Geophys. Res. Lett., 38, L22701,doi:10.1029/2011GL049244, 2011.
Zhou, L., Dickinson, R. E., Tian, Y., Fang, J., Li, Q., Kaufman, R.K., Tucker, C. J., and Myneni, R. B.: Evidence for a significanturbanization effect on climate in China, P. Natl. Acad. Sci. USA,101, 9540–9544, doi:10.1073/pnas.0400357101, 2004.
www.earth-syst-dynam.net/4/333/2013/ Earth Syst. Dynam., 4, 333–345, 2013
Recommended


