
Chemical Geology 272 (2010) 20–30
Contents lists available at ScienceDirect
Chemical Geology
j ourna l homepage: www.e lsev ie r.com/ locate /chemgeo
The rare earth element chemistry of estuarine surface sedimentsin the Chesapeake Bay
Robyn Hannigan a,⁎, Emmanis Dorval b, Cynthia Jones c
a Environmental, Earth & Ocean Sciences, University of Massachusetts Boston, 100 Morrissey Blvd, Boston, MA 02125, United Statesb Dorval Initiative de Recherche Ecologique & Consultation, Rue Baussan # 34, Port-au-Prince Haiti, W.I., Haitic Center for Quantitative Fisheries Ecology, Old Dominion University, Norfolk, VA 23529, United States
Sediment chemistry
⁎ Corresponding author. Tel.: +1 617 287 4857; fax:E-mail addresses: [email protected] (R. Han
[email protected] (E. Dorval), [email protected]
0009-2541/$ – see front matter © 2010 Elsevier B.V. Adoi:10.1016/j.chemgeo.2010.01.009
a b s t r a c t
a r t i c l e i n f oArticle history:Received 23 June 2009Received in revised form 12 January 2010Accepted 16 January 2010
Editor: J.D. Blum
Keywords:Estuarine sedimentRare earth elementsEuropium anomaly
Concentrations of rare earth elements (REE) were measured in the fine fraction of shallow surface sedimentsfrom the lower Chesapeake Bay as studies suggest that coagulation of colloids dominates the removal of REEfrom the dissolved load in low salinity regions of estuaries. REE in sediments showed spatial heterogeneity,both laterally and longitudinally. We observed the influence of salinity on the spatial and temporal variabilityin total REE content and on Eu-anomalies. Lower total REE was found in sediments deposited along theEastern Shore. The chemistry of the mid-Bay Islands was distinct with higher overall REE content and slightlymore positive Ce-anomaly values. Positive Ce/Ce* in the mid-Bay are attributed to Coriolis accelerationrestricting freshwater flow towards the west away from the Islands leading to oxidative removal of Ce fromthe pore waters to the sediments. The presence of positive Eu/Eu* in sediments deposited along the EasternShore is linked to salinity. We suggest that unique local conditions along the Eastern Shore, possiblyincluding submarine groundwater discharge of nutrient-rich reducing waters, combined with organic matterdecay and the predominance of oceanic water flow toward this region leads to the development of a stronglocalized salinity gradient. This study demonstrates the utility of REE sediment chemistry in identifying andresolving local and estuarine-wide geochemical processes.
+1 617 287 7474.nigan),u (C. Jones).
ll rights reserved.
© 2010 Elsevier B.V. All rights reserved.
1. Introduction
Processes occurring in estuaries modify the abundance, species,and flux of trace elements, including the rare earth elements (REE; Lato Lu), delivered by rivers to the ocean. Estuarine processes influencingthe relative abundances of trace elements include coagulation of river-borne colloids across the salinity gradient, adsorption–desorptionfrom particulate matter and sediments, and remobilization due toremineralization of sediments. REE are ideally suited to the study ofestuarine processes as they form a coherent group of trace elementswhose chemical properties change systematically across the series. Forexample, changes in the relative abundance of REE in the dissolvedphase are attributable to coagulation of river colloids in estuaries(Sholkovitz, 1992, 1995; Sholkovitz and Szymczak, 2000).
TheREEchemistry of estuarine sediments is largely controlledbybothphysical and chemical processes regulating the delivery of dissolved andparticulate REE from river to ocean (Martin et al., 1976; Sholkovitz andElderfield, 1988; Toyoda et al., 1990; Elderfield et al., 1990; Sholkovitz,1995). As such, sediment chemistry results from a number of processesincluding sediment provenance (e.g., Taylor and McLennan, 1985;
Murray and Leinen, 1993; Sholkovitz, 1993; Sholkovitz et al., 1999) aswell as the chemistry of the water from which the particles settle (e.g.,McLennan, 1989; Brookins, 1989; Sholkovitz, 1990; Sholkovitz et al.,1994; Sholkovitz et al., 1999). Although much is known about the largescale processes governing the behavior of REE in estuarine waters,comparatively little is known about the behavior of REE in estuarinesediments (Sholkovitz, 1990; Somayajulu et al., 1993; Nozaki et al., 2000;Chaillou et al., 2006; Lawrence and Kamber, 2006; Censi et al., 2007).Although REE chemistry of estuarine sediments is a product of exchangebetween surfacewaters,mineral surfaces, and porewaters, the processesleading to the resultant chemistry are oftendifficult to resolve. REE canberemoved from the water column through adsorption, flocculation, andprecipitation (Elderfield and Sholkovitz, 1987; Sholkovitz and Elderfield,1988; Elderfield et al., 1990; Sholkovitz, 1992; Murray and Leinen, 1993;Bau, 1999; Lawrence andKamber, 2006). Once deposited in the sedimentthe REE remain mobile with this mobility, both chemical and physical,leading to complexity in the distribution of REE in estuarine sediments.
Recent studies of permeable estuarine sediments suggest that therelative abundance of trace elements is controlled, in part, by the com-petitive influence of local conditions including advective transport andmixing of saline and freshwater such as under conditions of submarinegroundwater discharge (Huettel et al., 1996, 1998; Moore, 1999; Jahnkeet al., 2003; Charette and Buessler, 2004; Charette et al., 2005). In clay andorganic matter rich estuarine sediments, like those in seagrass beds,

21R. Hannigan et al. / Chemical Geology 272 (2010) 20–30
colloidal material may serve as a repository for REE. In these sedimentsadsorption–desorption reactionsoccur in regionsof highsalinity aswell aswith seasonal changes in redox conditions (Aller, 1980; Sholkovitz andElderfield, 1988; Charette et al., 2005). Discerning, from these sediments,changes in redox conditions can be accomplished using sediment Fe–Mnhydroxide abundances [e.g., (Froelich et al., 1979; Aller, 1980; Burdige,1993) and the redox sensitive REE Cerium (Ce) and Europium (Eu).
The redox behavior of Ce is well understood. Depletions of dissolvedCe occur during oxidation of Ce(III) to insoluble particulate Ce(IV)leading to increased sediment Ce relative to neighboring La andPr. Conversely, depletions in sediment Ce can be caused by reductionof Ce(IV) to soluble Ce(III). This leads to depletions in sediment Ce andenrichments in dissolved Ce. In addition to the redox sensitive Ce, Euexhibits redox behavior. Enrichments in Eu in marine waters areassociatedwith hydrothermal activity leading to the reduction of Eu(III)toEu(II) (Erel andStolper, 1993; Sholkovitz et al., 1994). Euenrichmentsin estuarine sediments may also occur due to the slow dissociation rateof Eu-humate complexes at slightly alkaline pHs found in estuaries(Benes et al., 2003), by removal of Eu-organic complexes from thewaterunder reducing conditions (Johannesson et al., 2004), and/or thepresence of an adsorbed component formed under reducing conditions(McLennan, 1989; Erel and Stolper, 1993).
The shape and size of an estuary, as well as sediment type (sandy vs.clay-rich), influence sediment REE chemistry. In small narrow estuariessuch as Waquoit Bay (MA) and the Fly/Gulf of Papua and Amazonestuaries, rapid cross-sectional mixing likely leads to little lateral vari-ability in sediment REE chemistry. The variability observed in permeablesandy estuarine sediments can be attributed to localizedphenomena suchas advective transport of solutes and particles and submarine discharge ofgroundwaters along the coast (Huettel et al., 1996, 1998; Moore, 1999;Ataie-Ashtiani et al., 1999; Jahnke et al., 2003; Reimers et al., 2004;Charette et al., 2005). In large estuaries, suchas theChesapeakeBaywheresignificant lateral variability in salinity exists, we hypothesize that REEsediment chemistry is laterally variable. Variation in sediment chemistryin this estuary may be related to large scale estuarine processes such aslateral mixing, changes in freshwater delivery of REE to the estuary, andtidal fluctuations. Superimposed on these processes is a record of localconditions including advective particle transport, variations in porewaterchemistry due to submarine groundwater discharge, redox, and temper-ature and salinity dependent sediment–water solute exchange.
Here we present REE data from the fine fraction of shallow surfacesediments collected from seagrass beds in the lower Chesapeake Bay.We chose to focus on the REE chemistry of the fine fraction as studiessuggest that coagulation of colloids dominates the removal of REEfrom the dissolved load in low salinity regions of estuaries (Sholk-ovitz, 1995). Therefore, the fine fraction will record resuspension ofREE due to adsorption–desorption related to changes in salinity, pHand redox. Examination of the fine fraction (b63 um which includescoarse silt to very fine clay; Lane et al., 1947) allowed us to explore theprocesses influencing estuarine sediment REE chemistry therebyproviding unique insights that would be unavailable when studyingpermeable sediment or whole sediment chemistry. Given thedynamic physical structure and unique riverine–estuarine–oceanboundary conditions, Chesapeake Bay provides the ideal setting inwhich to elucidate potential processes controlling sediment REE.
2. Area descriptions, methods and material studied
2.1. Study area
We studied the REE composition of 92 shallow surface sedimentsamples from seagrass bedswithin the lower portion of the ChesapeakeBay (Fig. 1). Freshwater input to the Bay is provided by five majortributaries: Susquehanna, Potomac, Rappahannock, York and James.Mean freshwater discharge to the Bay is approximately 2280 m3 s−1
(Austin, 2004) with the Susquehanna, Potomac and James contributing
80% of the total freshwater input (Valle-Levinson and Lwiza, 1995;Valle-Levinson et al., 2000). Besides the Susquehanna, freshwater inputalong theWesternShore is providedmainly by thePotomac,York, Jamesand Rappahannock Rivers. Dissolved REE chemistry of the tributaries isgoverned, to a large extent, by the geology of the drainage basins. Thegeologyof thePotomac, Rappahannock, York, and James drainagebasinsfalls across four physiographic provinces which are, from West to East,the Valley and Ridge Province (Paleozoic sedimentary rocks), the BlueRidge Province (Mesoproterozoic crystalline basement and LateNeoproterozoic to Early Paleozoic units), the Piedmont Province(Proterozoic and Paleozoic units including sedimentary units, meta-morphic sequences and intrusive igneous rocks) and the Coastal PlainProvince (Tertiary andQuaternary sand, silt, and clay). The Potomac andJames initiate in the Blue Ridge Province. The York initiates in thePiedmont Province, the most geologically complex region, and theJames initiates in the Valley and Ridge Province. The James River drainsthe largest area of the Piedmont. Although there are local variations inbedrockwithin these regions, these rivers drainpredominantly identicalgeological terrain. Along the Eastern Shore minor tributaries drainQuaternary coastal plain sediments and provide minimal seasonalfreshwater input into theBay. Samples collected along the lowerEasternShore from the Cape Charles region are located within the zone of theChesapeake impact crater (Poag, 1997; Johnson et al., 1998). Despite thelocationof the samples, no evidence ofmineralogic influencewas found.The coarse fraction contained no plagioclase or clinopyroxene. Wefoundnomineralogical indication of granodiorite basement in anyof thesamples and expect REE signatures attributable to granodiorite to beabsent and therefore assume that any observed enrichment in Eu in thefine fraction of the samples to be attributable to estuarine processes.
Submarine groundwater discharge has been recorded alongboth theEastern and Western Shores of the Bay (Hussain et al., 1999; Charetteand Buessler, 2004) and is a potential influence on sediment chemistry.Recent studies of permeable estuarine sediment chemistry have showndevelopment of redox fronts associated with the formation of a saltwedge causedby aplumeofflowing fresh groundwater and recirculatedseawater (e.g., Li et al., 1999; Ataie-Ashtiani et al., 1999; Charette et al.,2005). The mixing of these two waters leads to changes in redoxconditions within the pore waters, altering the Fe and Mn redoxchemistry and transport of Fe–Mn hydroxides) (Charette et al., 2005).Such phenomena may be recorded by the redox sensitive REE, Ce andEu. Although near-shore shallow waters of the Bay periodicallyexperience hypoxia/anoxia (Officer et al., 1984; Breitburg, 1990;Adelson et al., 2001; Hagy et al., 2004), dissolved oxygen values at thesample sites (mean dissolved oxygen within sea grass beds, mg/L:Islands=7.47±0.32, Pocomoke Sound (Eastern Shore)=7.11±1.24,Lower Eastern Shore=8.14±0.69, Potomac–Rappahannock=6.90±0.39, Rappahannock–York=7.86±0.69, York–James=6.71±1.31) in-dicate well oxygenated water column conditions (Dorval et al., 2005).The influence of variations in dissolved oxygen in the pore water and atthe sediment–water interface cannot be discounted.
3. Methods
Briefly, samples were collected from 37o00′ to 38o20′ (N) latitudefrom regions historically dominated by seagrass beds (Moore et al.,2000; Dorval et al., 2005). These beds are located close to the confluenceof tributaries on the Western Shore and represent shallows wheredesorption of REE from sediments is likely to occur. Based on thephysical characteristics of these seagrass beds and their spatialdistribution, we divided our sampling scheme into six areas (Fig. 1).
(1) PORA (Western Shore, squares)—mouth of the Potomac to thenorthern shore of the Rappahannock River
(2) RAYO (Western Shore, diamonds) — mouth of the Rappahan-nock to the northern shore of the York River

Fig. 1. Map of the Chesapeake Bay showing the locations of sampling areas and stations. Six seagrass habitats were sampled: Potomac (PORA, squares), Rappahannock (RAYO,diamonds), York (YOJA, stars), Islands (ISLE, circles), Pocomoke Sound (POSO, triangles), and lower Eastern Shore (LESH, inverted triangles).
22 R. Hannigan et al. / Chemical Geology 272 (2010) 20–30
(3) YOJA (Western Shore; stars) — mouth of the York to thenorthern shore of the James River
(4) POSO (Eastern Shore, triangles) — Pocomoke Sound(5) LESH (Eastern Shore, inverted triangles)— Lower Eastern Shore
south of Pocomoke Sound to Cape Charles(6) ISLE (Islands, circles) — Tangier Island to Bloodsworth Island.
Within each sampling region we established stations along thesalinity gradient. Stationswere accessedusing a 21-ftfiberglass boatwithsamples collected twice monthly during spring tide from July throughSeptember 2001.Mixing ismaximized in thewater columnduring springtide (Valle-Levinson et al., 2000) and so we assume that surface watermixing was at maximum across the estuary. Under maximum mixingconditions, spatial differences inREE sediment chemistry among seagrassbeds reflect minimal differences compared to neap tide conditions.
3.1. Sediment collection
Shallow (top 2–3 cm) sediment sampleswere collected using tracemetal clean procedures. Samples were collected as grab samples fromthe top 2–3 cm using a fresh acid-washed Teflon scoop. Samples weretransferred to acid-washed sterile whirlpaks and stored at 4 °C untilprepared for analysis. In the laboratory, samples were air dried underlaminar flow at room temperature and then at 110°C in a drying
chamber. All samples were comprised of a minimum of 75% clay withthe average clay-size (b63 um) fraction accounting for an average of90% of the bulk sample. After drying, samples were sieved using nylonmesh sieves and the fine fraction (b63 um) was retained for analysis.
3.2. Sediment chemistry
Fifty mg of sample was completely dissolved by acid digestion(Murray and Leinen, 1993). Samples were digested under clean roomconditions using Savillex digestion bombs and a digestion block with acombinationof concentratedultrapureHF andHNO3 acids. Sampleswererepetitively dried down after digestion using aliquots of HNO3 to removeany residual HF before analysis. Finally H2O2 (30%) was added to ensurecomplete oxidation of organic matter. Yttrium, quantified at 89Y, wasadded as an internal spike to quantitatively monitor yield throughoutdigestion and analysis (N95%). Sub-samples (three splits per sample)were diluted within range of the calibration standards (1 ppb–200 ppb).
Concentrations weremeasured by external calibration with internalstandardization (Indium). All tracemetals were analyzed using a PerkinElmer Sciex DRCII dynamic-reaction cell inductively coupled plasmamass spectrometer in peak jumping mode with reaction cell gas (NH3)set to 0.8 mLmin−1. NH3 reaction cell gas removed potential isobaricoxide−REE interferents, such as 135Ba16O on 151Eu, from the samplestream (Feldman et al., 1999; Kishi et al., 2004).Most of the REE are free

Table1
Mea
nwater
quality,Mnan
drare
earthelem
entc
oncentration
sin
parts-pe
r-millionfors
urface
sedimen
tsfrom
thelower
Chesap
eake
Bayav
erag
edacross
area
spe
rsam
plinginterval.Sam
plepe
riod
0—
July
10–16
,200
1,Sa
mple1—July
23–27
,20
01,S
ample2—
Aug
ust6–
9,20
01,S
ample3—
Aug
ust20
–23
,200
1,Sa
mple4—
Septem
ber4–
7,20
01.
Area
Sampling
period
Temp°C
diss.O
2(m
g/L)
pH (std.u
nits)
Salin
ity
(‰)
Cond
uctivity
(mho
s/co
m)
Mn
LaCe
PrNd
SmEu
Gd
TbDy
Ho
ErTm
YbLu
Ce/Ce*
Eu/Eu*
ILES
028
.43
7.74
8.41
16.80
29.26
54.11
115.53
251.50
26.40
100.51
17.42
3.08
14.29
2.01
10.53
1.86
5.93
0.83
5.35
0.86
1.01
−0.05
LESH
025
.60
7.24
8.35
23.40
35.71
68.66
24.87
43.37
4.84
18.43
3.53
1.43
2.82
0.40
1.83
0.35
1.10
0.15
0.90
0.13
0.86
0.32
POSO
028
.87
8.40
8.34
18.90
32.86
60.04
49.79
103.81
10.45
39.07
6.85
1.63
5.70
0.82
4.20
0.72
2.25
0.31
1.86
0.28
0.95
0.13
PORA
027
.47
7.56
8.47
17.07
29.18
73.73
36.36
78.45
7.84
29.42
5.05
0.88
4.16
0.56
2.64
0.43
1.27
0.17
1.04
0.15
1.03
−0.06
RAYO
028
.27
8.56
8.44
19.23
32.97
87.46
33.52
68.32
6.67
24.89
4.42
0.69
3.68
0.50
2.07
0.37
1.09
0.14
0.86
0.13
0.70
−0.09
YOJA
026
.53
6.05
8.20
21.60
35.42
101.41
77.93
160.15
17.62
66.86
11.54
1.61
9.30
1.19
4.47
0.75
2.11
0.27
1.68
0.26
0.95
−0.14
ILES
126
.30
7.76
8.11
17.18
28.67
53.02
119.75
239.58
22.25
83.90
14.84
2.70
12.69
1.90
8.86
1.73
5.38
0.75
5.83
0.96
1.03
−0.05
LESH
126
.85
8.17
8.55
23.90
39.09
47.14
19.71
31.65
3.28
11.46
1.86
0.78
1.65
0.24
1.08
0.21
0.67
0.10
0.74
0.13
0.86
0.31
POSO
126
.43
8.02
7.09
19.07
31.60
67.56
48.73
95.83
10.01
37.05
6.52
1.22
5.53
0.78
3.53
0.66
1.98
0.26
2.00
0.32
0.95
0.00
PORA
126
.30
6.79
8.15
18.80
31.09
95.05
67.44
136.46
14.25
53.22
9.08
1.59
7.80
1.07
4.67
0.88
2.68
0.38
2.85
0.45
0.98
−0.08
RAYO
127
.70
7.17
8.06
19.50
33.14
79.57
55.53
119.64
12.26
46.27
8.12
1.47
6.72
0.95
4.48
0.79
2.43
0.34
2.56
0.42
1.02
−0.04
YOJA
126
.17
5.38
7.68
21.83
35.64
143.84
50.04
121.66
10.98
41.64
7.34
0.94
6.00
0.79
3.15
0.51
1.67
0.25
1.82
0.30
1.16
−0.17
ILES
230
.27
6.99
8.05
17.82
31.94
101.19
87.39
191.93
20.16
76.74
13.56
2.44
11.14
1.57
7.80
1.32
3.96
0.56
3.95
0.63
1.02
−0.06
LESH
229
.53
7.70
8.09
22.53
39.18
73.26
65.03
137.35
14.29
53.09
9.12
1.69
7.56
1.08
4.79
0.91
2.80
0.38
3.01
0.49
1.00
0.02
POSO
230
.87
7.33
7.97
19.37
34.94
52.54
42.68
97.15
9.31
34.74
6.03
1.25
5.03
0.70
3.09
0.58
1.79
0.24
1.87
0.31
1.03
0.03
PORA
228
.30
6.90
8.05
18.17
31.26
106.66
26.13
55.46
5.47
20.50
3.74
0.52
3.00
0.41
1.64
0.28
0.78
0.10
0.78
0.12
1.01
−0.13
RAYO
228
.90
7.08
8.12
20.15
34.82
114.88
19.20
41.54
3.61
13.29
2.28
0.38
1.96
0.25
1.07
0.20
0.60
0.08
0.64
0.10
1.11
−0.09
YOJA
228
.13
5.88
8.00
22.87
38.53
99.17
49.98
103.54
10.84
41.00
7.08
1.25
5.76
0.78
3.56
0.58
1.66
0.22
1.58
0.24
0.97
−0.06
ILES
327
.76
7.32
8.09
17.03
29.27
42.06
51.38
115.09
11.54
43.74
7.66
1.32
6.15
0.83
3.57
0.68
2.15
0.30
2.38
0.40
1.05
−0.06
LESH
328
.00
8.92
8.23
22.50
37.83
76.38
20.06
38.30
3.87
14.41
2.45
0.89
2.05
0.30
1.36
0.27
0.87
0.12
0.99
0.17
0.94
0.26
POSO
326
.03
5.30
7.78
18.67
30.77
89.54
59.95
118.35
12.39
45.72
7.71
1.39
6.63
0.93
4.12
0.72
2.29
0.32
2.28
0.37
0.94
−0.06
PORA
327
.37
6.73
8.25
17.67
30.03
86.30
34.21
74.69
7.54
28.81
5.07
0.77
4.10
0.56
2.29
0.42
1.24
0.17
1.28
0.21
1.01
−0.10
RAYO
328
.60
8.22
8.28
20.90
35.91
42.74
15.02
29.66
3.01
11.01
1.87
0.32
1.61
0.23
1.05
0.20
0.65
0.09
0.72
0.12
0.94
−0.08
YOJA
327
.77
8.32
8.25
22.30
37.37
101.38
51.73
104.49
11.11
41.93
7.39
1.27
6.29
0.89
3.94
0.73
2.20
0.30
2.29
0.37
0.97
−0.10
ILES
426
.24
7.54
8.03
17.51
29.16
65.67
97.40
215.55
21.85
82.22
14.60
2.71
12.24
1.84
9.99
1.69
5.34
0.82
5.77
0.97
1.09
−0.05
LESH
426
.50
8.69
8.20
22.45
36.67
92.11
55.55
110.19
12.41
47.28
8.51
1.94
7.21
1.09
5.10
0.99
3.06
0.43
3.30
0.54
0.90
0.23
POSO
425
.13
6.49
7.85
19.27
31.11
65.08
56.57
120.46
12.57
47.69
8.45
1.79
7.11
1.03
5.22
0.88
2.73
0.38
2.96
0.49
0.97
0.10
PORA
426
.03
6.53
8.11
18.37
30.31
87.79
80.25
174.29
18.41
69.82
12.25
2.16
10.17
1.41
7.40
1.18
3.71
0.52
4.01
0.66
0.98
−0.07
RAYO
427
.05
8.26
8.16
19.60
32.77
118.49
69.89
145.63
15.50
59.14
10.69
1.97
9.26
1.42
7.76
1.27
3.89
0.53
4.02
0.65
0.97
−0.12
YOJA
426
.30
7.90
8.00
22.00
35.94
54.94
32.87
68.73
7.05
26.46
4.75
0.86
4.04
0.58
2.57
0.48
1.44
0.19
1.47
0.24
0.98
−0.05
1NASC
3273
7.9
335.7
1.2
5.2
0.85
5.8
13.4
0.5
3.1
0.48
Eu/Eu*
=log[2*Eu
NASC/(Sm
NASC+
Gd N
ASC)].
Ce/Ce*
=Ce
NASC/(0.5*(La N
ASC+
PrNASC)).
1Ta
ylor
andMcLen
nan,
1985
.
23R. Hannigan et al. / Chemical Geology 272 (2010) 20–30
24 R. Hannigan et al. / Chemical Geology 272 (2010) 20–30
of isobaric interferences; however, we monitored multiple isotopes(55Mn, 137Ba, 138Ba, 139La, 140Ce, 142Ce, 141Pr, 143Nd, 146Nd, 148Sm, 149Sm,151Eu, 153Eu, 157Gd, 158Gd, 159Tb, 161Dy, 163Dy, 164Dy, 165Ho, 166Er, 167Er,169Tm, 172Yb, 173Yb, 174Yb, 175Lu) as an additional check of isobaricinterference (Hodge et al., 1998). REEO+/REE+ ratios measured by theDRC II are consistently below 0.2%. Precision, as determined fromtriplicate analyses of the samples beginning with the original sampleweighing, was generally b2% for the REEs. We used MAG-1 (U.S.Geological Survey marine sediment) to assess precision with thisreference standard processed in the same way the samples wereprocessed.Methoddetection limits (Hubaux andVos, 1970)werebelow2parts-per-trillion for all elements. Least-square regressionwas appliedwith goodness of fit (r2) greater than 0.999 for all analytes. Analysis ofcalibration standards and MAG-1 was performed every six samples.
Variations inREE compositionbetween samples is assessedusing theconvention of normalization of concentrations to average shale (NorthAmerican Shale Composite, NASC; Taylor and McLennan, 1985).Variations in redox conditions as well as differences in REE complex-ation and adsorption behavior are reflected by changes in the oxidationstate of cerium Ce(III)–Ce(IV) and Eu(II)–Eu(III). These changes mayresult in differences in Ce and Eu abundances. Ce-anomaly (Ce/Ce*) andEu-anomaly (Eu/Eu*) values are calculated by
Ce=Ce� ¼ CeNASC=ð0:5�ðLaNASC þ PrNASCÞÞ ð1Þ
and,
Eu=Eu� ¼ log½2�EuNASC=ðSmNASC þ GdNASCÞ� ð2ÞCe/Ce* values less than 1.0, depletion in sediment Ce, suggest
reductive dissolution of insoluble Ce(IV) to soluble Ce(III). Negative Eu/Eu* values (i.e., depletion in Eu) reflect oxidation of Eu(II) to Eu(III) andloss of Eu from the sediments.
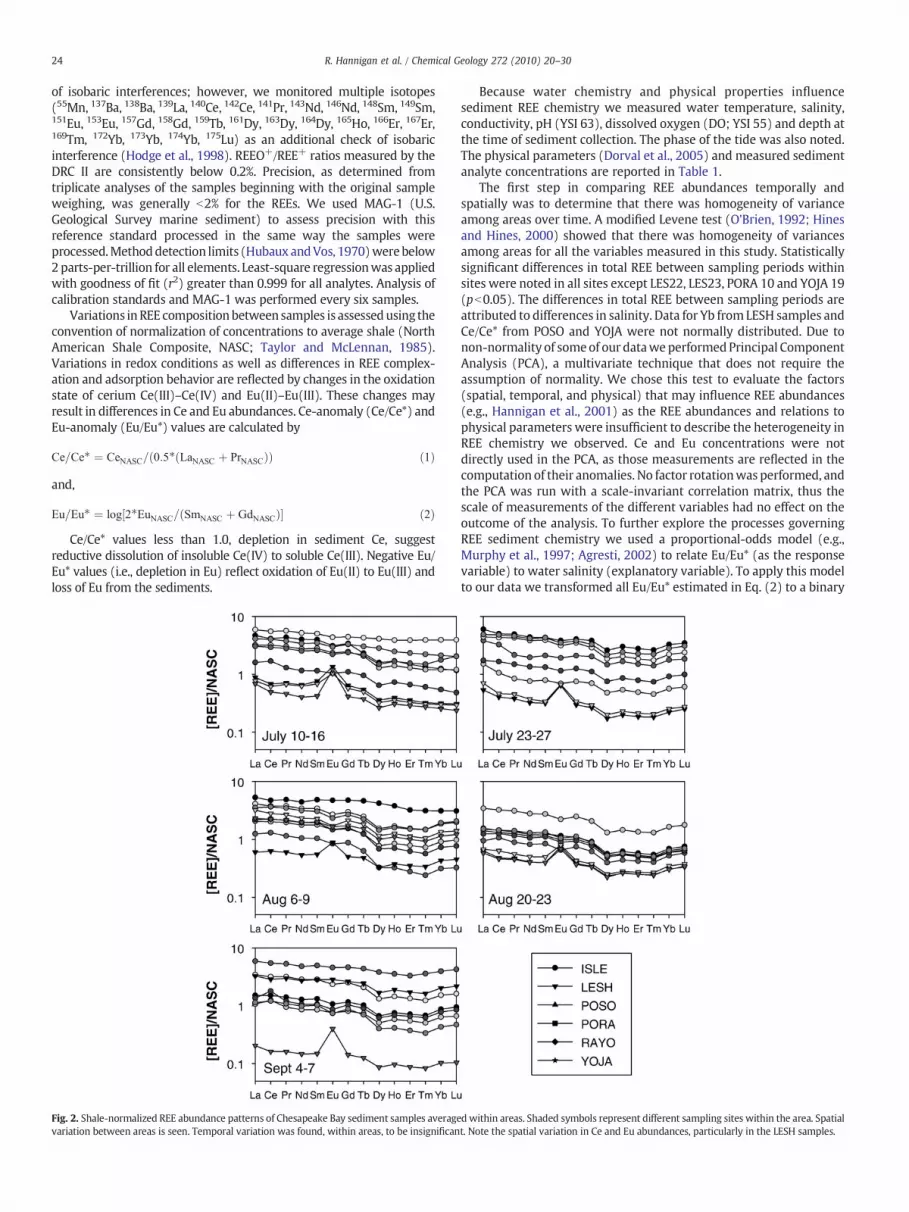
Fig. 2. Shale-normalized REE abundance patterns of Chesapeake Bay sediment samples averagevariation between areas is seen. Temporal variation was found, within areas, to be insignifican
Because water chemistry and physical properties influencesediment REE chemistry we measured water temperature, salinity,conductivity, pH (YSI 63), dissolved oxygen (DO; YSI 55) and depth atthe time of sediment collection. The phase of the tide was also noted.The physical parameters (Dorval et al., 2005) and measured sedimentanalyte concentrations are reported in Table 1.
The first step in comparing REE abundances temporally andspatially was to determine that there was homogeneity of varianceamong areas over time. A modified Levene test (O'Brien, 1992; Hinesand Hines, 2000) showed that there was homogeneity of variancesamong areas for all the variables measured in this study. Statisticallysignificant differences in total REE between sampling periods withinsites were noted in all sites except LES22, LES23, PORA 10 and YOJA 19(pb0.05). The differences in total REE between sampling periods areattributed to differences in salinity. Data for Yb from LESH samples andCe/Ce* from POSO and YOJA were not normally distributed. Due tonon-normality of someof our dataweperformedPrincipal ComponentAnalysis (PCA), a multivariate technique that does not require theassumption of normality. We chose this test to evaluate the factors(spatial, temporal, and physical) that may influence REE abundances(e.g., Hannigan et al., 2001) as the REE abundances and relations tophysical parameters were insufficient to describe the heterogeneity inREE chemistry we observed. Ce and Eu concentrations were notdirectly used in the PCA, as those measurements are reflected in thecomputation of their anomalies. No factor rotationwas performed, andthe PCA was run with a scale-invariant correlation matrix, thus thescale of measurements of the different variables had no effect on theoutcome of the analysis. To further explore the processes governingREE sediment chemistry we used a proportional-odds model (e.g.,Murphy et al., 1997; Agresti, 2002) to relate Eu/Eu* (as the responsevariable) to water salinity (explanatory variable). To apply this modelto our data we transformed all Eu/Eu* estimated in Eq. (2) to a binary
dwithin areas. Shaded symbols represent different sampling sites within the area. Spatialt. Note the spatial variation in Ce and Eu abundances, particularly in the LESH samples.

25R. Hannigan et al. / Chemical Geology 272 (2010) 20–30
dataset by assigning a value of 1 to any positive estimate and a value of0 to any negative estimate. This transformation allowed us to use theLogit regressionmodel (Eq. (3)) as a statistical method (Agresti, 2002)to determine the probability (p) that a sediment sample collected in anarea with known salinity will exhibit a negative Eu/Eu*.
LogitðpÞ ¼ log½p=ð1−pÞ�: ð3Þ
4. Results and analyses
4.1. Environmental (physical and chemical) variables
Variations in water temperature, salinity, dissolved oxygen (DO), andpH are described in Dorval et al. (2005). Those results showed that therewere no significant differences in dissolved oxygen (DO) between sam-pling intervals and that these shallowenvironments had consistently highDO values. Similarly, salinitywithin zone over timewas consistent and nostatistical differences were found. Differences in salinity between zoneswere significant. Temperature was spatially similar within a samplingperiod across all zones but temporally variable (Dorval et al., 2005).
4.2. Sediment chemistry
Shale-normalized (North American Shale Composite, NASC) REEabundance patterns were slighted enriched in (Fig. 2; LREE; La to Nd;(La/Yb)NASCN1.0). REE sediment chemistry was spatially consistentwithin a given area across time; no significant differences were foundbetween sample sites within areas or between sampling periodswithin zones. The only significant differences in REE chemistry wereseen between areas and are associated with salinity (Fig. 3). LESH
Fig. 3. Within area mean La, Nd, Yb and ΣREE compared to salinity showing lateral andlongitudinal variation in REE abundances. ISLE samples are consistently higher in REEthat other regions. The relation between REE abundance and salinity is evident with themean REE falling along the salinity gradient (non-linear regression, solid line).
showed consistently distinct Eu abundances (Fig. 2) and lower ΣREEtowards the end of the sampling period.
Overall, total REE concentrations were highest in the Islands(Fig. 4) with patterns that were flat or slightly heavy REE depleted(Fig. 2, Ho to Lu; (Tb/Yb)NASCN1.0). No significant difference wasobserved in total REE between Eastern Shore LESH sediments andthose collected from the Western Shore at PORA, RAYO, and YOJA.Thus, we saw consistent REE chemistry between the Eastern Shoreand Western Shore sediments with the exception of the higherconcentrations of Eu in Eastern Shore samples (Fig. 2). For both meanCe- and Eu-anomalies, the LESH sedimentswere significantly differentfrom those collected from the Islands and Western Shore. The meanCe-anomaly of samples collected in the Islands and Western Shorewas close to 1.0, indicative of oxygenated pore waters and/orsediment/water interface. In contrast, mean Ce-anomaly in EasternShore samples was slightly below 1, but significantly different fromthe Ce-anomaly values of sediments from the Islands and WesternShore. Similarly, mean Eu-anomaly was not significantly differentbetween samples from the Islands and Western Shore, while EasternShore mean sediment Eu-anomaly was significantly different fromthose of Island and Western Shore. Relations between the anomalies(Fig. 5) show the distinctiveness of the LESH sediments which areconsistently different throughout the sampling period. Variability inEu concentration between sites (e.g., Fig. 2) within the LESH is notsignificant.
No relation was found between Ce/Ce* and Eu/Eu* withdissolved oxygen. Similarly, comparison between the anomalyvalues and Mn concentration, which might indicate redox behaviorfor Ce and Eu, also revealed no relation. It is expected that increasesin sediment Mn due to reduction of Mn(IV) to particulate Mn(II)may result in a loss of Ce from the sediment due to reduction ofCe(IV) to Ce(III). If this occurred it is not evident in our samples. Wealso found no significant relation between Eu/Eu* and Mn at any ofthe sites.
Evaluation of complex relations among variables requires amultivariate approach to identify processes which may be respon-sible for the variance in composition of the sediments across samplesites. Use of Principal Components Analysis (PCA) allows us toreduce the variance in the data to unique “components” therebyallowing us to assess the overarching processes governing thechemistry of the sediments. PCA revealed that the first two principalcomponents (PC1–PC2) accounted for 90% of the variability (i.e., interms of cumulative proportion of total variance) in the data;therefore, only those two principal components were used infurther analyses (c.f. Khattree and Naik, 2000). PC1 contrasted thebehavior of the REEs and Ce/Ce* (positive score coefficients) againstMn and Eu/Eu* (negative score coefficients, PC1, Fig. 6) separatingISLE samples from Eastern Shore samples, POSO and LESH. PC2contrasted the behavior of the LREEs (La to Nd), Mn and Ce/Ce* tothat of the HREEs and Eu/Eu*, and separated Western Shore samplesPORA and YOJA from Island and Eastern Shore samples ISLE, POSOand LESH.
Our PCA results indicate that Eu/Eu* responds to condition(s)unique to the Eastern Shore. To further elucidate the potential causesof the unique Eu-anomaly chemistry in this area, we used a logitregression to test the hypothesis that Eu/Eu* is responding to salinity.The Chi-square distribution-based probability for this model washighly significant, indicating that salinity predicted Eu/Eu* (Eq. (4),Fig. 7)
Logit ðpÞ ¼ log½p=ð1−pÞ ¼ 10:9557−0:4679�Salinity ð4Þ
In contrast to the Eu/Eu* results, Logit Regression using Ce/Ce* asthe response variable was not significant (p=0.1453), demonstratingthat salinity had no predicative power for Ce/Ce*.

Fig. 4. Map showing mean ΣREE at each site. Though temporal differences were significant for most sites the mean relations are consistent with ISLE samples having the highestoverall REE abundances.
26 R. Hannigan et al. / Chemical Geology 272 (2010) 20–30
5. Discussion and conclusions
The REE chemistry of the shallow sediments along and across thelower Chesapeake Bay varied significantly. Variation cannot be solelyattributed to estuarine mixing and differences in salinity, althoughsalinity clearly sediment REE chemistry. Other factors such as physicalmixing, sediment provenance, groundwater discharge, and seasonalanoxiamayalso contribute to differences inREE abundances. Teasingoutthe impact of each process on sediment REE in our data is difficult.However, it is possible to interpret the relation between Ce/Ce* and Eu/Eu* as evidence of competitive processes whereby Eu/Eu* is respondingto salinity andCe/Ce* is responding to slight changes in oxidation aswellas physical mixing and particle settling. The relation between the twoanomalies approaches that of binary mixing; however, we lack the datato accurately assess the influence of specific conditions, aside fromsalinity, that lead to this relation. The Islands and Eastern Shore (ISLE,POSO, and LESH) samples have distinct REE chemistries from oneanother and from the Western Shore samples, with spatial variationsfully resolvable across all seagrass habitats in the lower Bay. Variation insediment REE chemistry is expected given that during estuarinecirculation progressive mixing of fresh and oceanic water leads toremoval of these elements from the dissolved load along the salinity
gradient (Goldstein and Jacobsen, 1988; Sholkovitz and Elderfield, 1988;Sholkovitz, 1992, 1993, 1995; Guieu et al., 1998; Bau, 1999; Lawrenceand Kamber, 2006; Chaillou et al., 2006). Austin (2004) showed that thesalinity gradient in the lower Chesapeake Bay has a gentle but uniformgradient. This gradient is preserved in the shallower seagrass habitats ofour study area and plays a fundamental role in controlling the chemistryof the dissolved load (Dorval et al., 2005) and sediment. In a wideestuary, such asChesapeake Bay, Coriolis accelerationmodifies estuarinecirculation restricting the outflow of freshwater from rivers such as thePotomac, Rappahannock, York and James. Coriolis acceleration restrictsoutflow to the western shore and inflow of oceanic water toward theEastern Shore (Pritchard, 1952; Austin, 2004). The resulting densitygradients are likely responsible for the spatial differences in REEabundance patterns from the Western to the Eastern Shore. Super-imposed on the development of lateral density gradients are localizedphenomena including submarine discharge of freshwater along theEastern and Western Shores (Simmons, 1989, 1992; Reay et al., 1992;Reay and Simmons, 1992; Moore, 1999) and summer season hypoxiawithin the Bay (Officer et al., 1984; Breitburg, 1990; Adelson et al., 2001).Competing effects of the salinity gradient, Coriolis acceleration,associated complexation reactions, and redox cycles lead to spatialheterogeneities in the redox sensitive REE such as Ce and Eu and in the

Fig. 5. Variation in Ce/Ce* and Eu/Eu* in surface sediments of the Chesapeake Bay.ISLE and LESH samples are distinct with the bulk of the LESH sediments having positiveEu/Eu* values across sampling periods.
Fig. 7. Relation between Eu/Eu* and salinity. A. Eu/Eu* vs. salinity showing the distinctnature of the eastern shore samples LESH and POSO compared to the other areas of theBay. B. Probability that Eu/Eu* will be negative for a given salinity, derived from Logitregression analysis, vs. salinity (Eq. (3)) showing the strong relation between salinityand Eu/Eu*. Chi-square probability is significant showing that salinity can predictsediment Eu/Eu*. Logit regression of Ce/Ce*on salinity was not significant.
27R. Hannigan et al. / Chemical Geology 272 (2010) 20–30
degree of HREE depletion (Ho to Lu; (Tb/Yb)NASCN1.0) and LREE en-richment (La to Nd; (La/Yb)NASCN1.0).
Variation in relative abundances of REE occurs, for the most part,along the salinity gradient where progressive mixing of freshwaterand ocean water leads to colloidal removal of REE from the dissolvedload and sequestration in the sediments (Sholkovitz, 1995). SedimentREE chemistry in the lower Bay is consistent with the observations ofSholkovitz and Elderfield (1988). Our data show that the colloidalmaterial deposited in the seagrass beds is enriched in LREE anddepleted in HREE. The degree of LREE enrichment ((La/Yb)NASC) ismore pronounced in regions significantly influenced by estuarinemixing such as along the Western Shore. Studies of estuarine REEchemistry point to the fact that not only does estuarine mixing reducethe flux of dissolved REE to estuaries but that chemical and physicalprocesses associated with mixing modify the relative abundances ofREE reaching the oceans. We infer that these processes similarly alterthe material deposited in estuaries. This inference is supported by thespatial variability in REE concentrations and abundance patterns inthe Chesapeake Bay sediments which are attributed primarily tosalinity differences.
5.1. Anomalies of Ce
Both positive and negative Ce/Ce* values occur in marine pelagicsediments. The relation between oxidation of the overlying watercolumn and pore waters to sediment Ce/Ce* is straightforward (e.g.,
Fig. 6. Principal component loadings of samples on PC1 and PC2. PC1 contrasts the REEand Ce/Ce* against Mn and Eu/Eu* separating ISLE samples from eastern shore samplesPOSO and LESH. PC2 contrasts the light REE (La to Nd), Mn and Ce/Ce* against the HREE(Tb to Lu) and Eu/Eu* separating western shore samples PORA and YOJA from islandand eastern shore samples ISLE, POSO, and LESH.
Murray and Leinen, 1993). Preferential oxidation of Ce(III) to Ce(IV)and scavenging of Ce(IV) from seawater to sediment leads to positiveCe-anomalies in equatorial Pacific red clays (Toyoda et al., 1990).Sholkovitz (1995) showed that removal of dissolved Ce in the AmazonEstuary is enhanced in the low salinity zone as well as in the zone ofhigh biological productivity (salinity 18–26; Sholkovitz, 1993).
Similar linkages between biological productivity and the develop-ment of redox fronts within the sediment or at the sediment–waterinterface have been documented in a number of estuarine settings(e.g., Toyoda et al., 1990; Riedel et al., 1999). When comparing ourdata to water quality parameters such as PO4
3− (Dorval, 2004), Ce/Ce*positively correlates only in the mid-Eastern Shore (PocomokeSound) suggesting that the slightly negative Ce/Ce* could beassociated with biological productivity. This is a possibility but cannotbe substantiated without further investigation. Our data showed nodirect influence of salinity on Ce/Ce*. Given the redox behavior of Ce,the intermittent positive Ce-anomalies could be attributable tooxidative removal of Ce(IV) from the water column and accumulationof Ce in the sediments.
Though intermittent positive Ce-anomalies were found, we did notfind a statistically significant relation between dissolved oxygen of theoverlying waters and sediment Ce-anomaly. The absence of a directlinkage between dissolved oxygen and Ce/Ce* does not preclude thatpositive Ce/Ce* values in these samples are attributable to changes inredox conditions. Direct inquiry into the influence of oxidativeaccumulation of Ce in the sediments resulting in Ce/Ce* values greaterthan 1.0 in some samples requires measurement of pore water REE

28 R. Hannigan et al. / Chemical Geology 272 (2010) 20–30
chemistry. The vast majority of samples had Ce/Ce* values below 1.0indicative of Ce depletion in the sediments due to reduction of Ce(IV)to Ce(III) and resuspension of Ce(III) to the water column. Themajority of positive Ce/Ce* values were found in samples collected inthe Islands suggesting oxidative removal of Ce and accumulation of Cein the sediments in this region.
If redox is playing a role in the resuspension of Ce(III) to the watercolumn we would expect to see a relation between Ce and redoxsensitive tracemetals such asMn. Asmentioned above the presence ofreducing conditions in the Bay could be due to microbial degradationof organic matter (Froelich et al., 1979; Aller, 1980; Kristensen et al.,2002). Under reducing conditions Mn(IV) will be reduced to Mn(II)which is released to the dissolved phase depleting the sediment ofMn. The reduction of Mn(IV) and transfer of Mn(II) occurs in the Baywhen suboxic and anoxic conditions develop in spring and summer(Taft et al., 1980; Seliger et al., 1985). Remobilization of Mn fromreducing sediments controls most of the supply of Mn into surfacewaters of the Bay (Eaton, 1979). This supply of Mn(II) may originatefrom the reduction and dissolution of oxidized manganese particlesformed in deep anoxic water of the Bay (Gavis and Grant, 1986). Asthe PCA results indicated, PC1 contrasted the behavior of Ce/Ce* toMnsuggesting that the two variables are, to some extent, decoupled. Therelation between Ce/Ce* and Mn in the sediments indicatesresuspension of REE and Mn under reducing conditions. The factthat this relation is not strong may be attributable to the fact that Ce isless mobile than Mn as well as leading to a moderate inverse relationbetween the two variables.
Variations in sediment Ce in the Loire Estuary (Negrel, 1997) wererelated, at least in part, to the in situ formation of particles within theturbiditymaximum. Our samples were collected south of the turbiditymaximum such that large scale production of particles is unlikely.Localized turbidity zonesmay developwhere submarine groundwaterdischarge occurs with a resulting steep salinity gradient leading to thedevelopment of negative Ce/Ce* values. Though this may be occurringwe do not have sufficient data to support the formation of theselocalized turbidity maxima beyond circumstantial data provided byCe/Ce*. We expect that Ce concentrations would be elevated in thepore waters of the upper 2 cm of the sediments studied here as wasobserved by Sholkovitz and Elderfield (1988) in samples north of ourstudy area. Sholkovitz and Elderfield (1988) suggest that benthic fluxof anoxic REE-rich fluids is required to explain the high concentrationsof Ce observed in some pore water samples from Chesapeake Bay.Benthic flux of REE-rich anoxic fluids can be provided via submarinegroundwater discharge, particularly along the Eastern and WesternShore (Reay and Simmons, 1992; Reay et al., 1992; Moore, 1999;Charette and Buessler, 2004). Discharge of anoxic freshwater at depthcombined with Coriolis acceleration restricting inflow of oxygenatedseawater to the east could lead to localized intermittent sedimenthypoxia and development of negative Ce-anomalies. The spatialvariation in Ce/Ce* we found in the sediments is commensurate withthe water column redox conditions described by Dorval et al. (2005).
5.2. Anomalies of Eu
Our data reveal that anomalies of Ce and Eu are decoupled.Decoupling of these anomalies can be related to the slow dissolutionrate of Eu-humate complexes (Benes et al., 2003), differences in thecomplexation behavior of Eu relative to the other REE (Moermondet al., 2001), and the presence of allochthonous adsorbed Eu (Erel andStolper, 1993).
Generally little variation in Eu/Eu* is observed in marinesediments with the majority of marine sediments having negativeEu/Eu* except under hydrothermal conditions (McLennan, 1989; Ereland Stolper, 1993). One would anticipate that conditions within thesediment or at the sediment–water interface are insufficient tochange the oxidation state of Eu. Eu-anomalies in estuarine sediments
tend to be negative as is the case in the majority of the Bay samples.Negative Eu-anomalies are explained by the reductive remobilizationof Eu(II) from the sediments to the surface waters leading to negativeEu-anomalies in the sediment (Elderfield and Sholkovitz, 1987).Positive Eu/Eu* have been observed in marine sediments (e.g., Pregoet al., 2009) where these positive values are attributed to sedimentparent material. The distinct positive Eu/Eu* values of the LESHsamples suggest unique conditions in this region of the Bay. Wediscount the influence of mineralogy as no plagioclase was found inthese sediments and the positive Eu/Eu* were found in the finesediment fraction representative of relatively fresh colloidal material.
One possible explanation for the positive Eu-anomalies is thatextreme reducing conditions are developed in the lower EasternShore sediments. Erel and Stolper (1993) andMcLennan (1989) foundthat model water–sediment distribution coefficients predict smallpositive Eu-anomalies (Eu/Eu*∼0.1–0.2 ) due to the elevated firsthydroxide binding constant of Eu being higher than that of Gd and Sm(Brookins, 1989). Erel and Stolper (1993) hypothesize that positiveEu-anomalies in sediments form as a consequence of the adsorptionchemistry of Eu rather than being an inherited signature fromsolution. Because coatings of organic matter and Mn–Fe oxides playamajor role in the binding of REE to particle surfaces (Sholkovitz et al.,1994) it is no surprise that, in the fine fraction of these sediments, wefind a unique record of sediment deposition conditions. However,statistical examination of the data did not reveal the influence ofredox on the development of positive Eu/Eu* in these sediments andpointed, instead, to salinity as the primary variable influencing Euchemistry.
Diagenetic reactions occurring under reducing conditions havebeen invoked to explain the positive Eu/Eu* values found inphosphate rich sedimentary rocks (Kidder et al., 2003; Murthy et al.,2004). While diagenesis can lead to the formation of positive Eu-anomalies under extreme reducing conditions (Ogihara, 1999) suchexplanations cannot be invoked for the Bay's positive Eu-anomalies.These shallow surface sediments contain relatively fresh colloidalmaterial as the samples were collected from the top 2–3 cm of thesediment column at each seagrass bed and so have not undergonesignificant diagenetic alteration. To explain the positive Eu/Eu* valueswe need to identify conditions unique to the Eastern Shore wheresamples consistently showed positive Eu/Eu* values. We hypothesizethat decay of organic matter and the development of very localizedreducing conditions combined with submarine discharge of reducinggroundwaters and restricted inflow of oxygenated saline waters couldlead to the development of unique conditions within these sediments.Organic matter decay rates in this area have not been directlymeasured at our study sites. Zimmerman and Canuel (2001) found, atsites in the center of the Bay due west of our LESH sites, lower totalorganic carbon concentrations in the southern Chesapeake Bay. Theseauthors found the organic matter in this region to be primarilyautochthonous and suggested that this material undergoes lessdegradation prior to deposition. Being more labile this materialdegrades in summer and fall (Zimmerman and Canuel, 2001). Thisdegradation may lead to localized seasonal reducing conditions whichare maintained by a persistent off-shore convergent residual eddy(Hood et al., 1999) resulting in downwelling and further restriction offlow along the Eastern Shore. The combination of organic matterdegradation, down welling and strong tidal circulation in the southBaymay lead to reducing conditions at the sediment surface as well asa steep salinity gradient.
The decoupling of Ce/Ce* and Eu/Eu* requires an explanation forpositive Eu/Eu* to be developed that is unique to the lower EasternShore. As discussed above, unique conditions do exist in this region. Inaddition to the above we propose that submarine groundwaterdischarge of anoxic groundwaters occurring along the Eastern Shoreenhances the development of redox and salinity conditions unique tothis area of the Bay. Support for submarine groundwater discharge

29R. Hannigan et al. / Chemical Geology 272 (2010) 20–30
occurring along the Eastern Shore includes the observation thatbrackish water moves into shallow, near-shore marine environmentsunder positive hydraulic head (Simmons, 1992). Submarine ground-waters in this region are enriched in ammonium with little to nonitrate (Reay et al., 1992) indicative of reducing conditions. Thesubmarine groundwater discharge rate for the entire Chesapeake Baysystem is estimated to be 17×106 m3 d−1 (Hussain et al., 1999). The222Rn estimated groundwater discharge in the Elizabeth River estuaryon the southern Western Shore is 8.5× 10⁶ m3 d−1 (Charette andBuessler, 2004). Submarine groundwater discharge at a site close toour LESH samples has been measured at a rate of 23.2 m−3 d−1
(Simmons, 1989). A recent study of the shallow groundwaterchemistry along the Eastern Shore revealed decreases in groundwaterlevels and decreased chlorinity (Sanford et al., 2009). Submarinegroundwater discharge along the Western Shore is significantlyhigher than the discharge along the Eastern Shore. Along theWesternShore the influence of these fluids on sediment REE chemistry isoverwhelmed by the freshwater discharge of the rivers and lessdramatic salinity changes from Bay mouth to river mouth. Conditionsalong the Eastern Shore are distinct from the Western Shore and aresuch that the surface sediments in this area are more likely to recordlocal conditions, including submarine groundwater discharge, due tothe limited inflow of oxygenated seawater and little, if any, surfacewater input. The combination of reducing fresh water from submarinegroundwater discharge, Coriolis acceleration restricting ocean waterinflow to the east, and local downwelling leads to conditions underwhich the groundwater fluids are not well-mixed. These fluids, wepropose, would cross a strong localized salinity gradient leading toreduced coagulation of clays, poor efficiency of REE removal,reduction of Eu(III) to Eu(II) leading to the development of positiveEu/Eu* and negative Ce/Ce*. This hypothesis cannot be confirmed byour data and requires a focused study relating submarine groundwa-ter discharge, pore water chemistry, and sediment chemistry in thisregion of the Bay.
6. Conclusions
We show spatial heterogeneity, both laterally and longitudinally,in the REE chemistry of shallow fine-grained estuarine sediments. Thechemistry of the Islands is distinct with higher overall REE contentand more positive Ce-anomaly values. Positive Ce/Ce* are attributedto the Coriolis acceleration restricting freshwater flow towards thewest away from the Islands, thus leading to oxidative removal of Cefrom the pore waters to the sediments. Our data reveal positive Eu/Eu* in sediments deposited along the Eastern Shore. We propose thatunique conditions along the Eastern Shore, submarine groundwaterdischarge of reducing freshwaters combined with organic matterdecay and restricted saline oceanic water flow toward this region,leads to the development of a strong localized salinity gradient. Theseunique conditions reduce the efficiency of sediment removal leadingto lower total REE concentrations in the sediments as well asreduction of Eu(III) to Eu(II) and consequent development of positiveEu/Eu* and negative Ce/Ce*. Whether these anomalies persistthroughout the year and are the result of groundwater interactionswith the pore waters and/or surface waters remains to be determined.
Acknowledgements
This work was funded by a grant to Hannigan and Jones from theVirginia Sea Grant (R/CF-37), an additional grant to Jones from theVirginia Salt Water Recreational Fishing Development Board admin-istered by the Virginia Marine Resources Commission (RF 00-5), andfunds from the National Science Foundation (NSF OCE-0525964). Theauthors acknowledge the field, laboratory, and technical support of D.Combs and J. van Montfrans (Virginia Institute of Marine Sciences),and students Aboubakar Sako and Bradley Hamilton. We gratefully
acknowledge the comments by two anonymous reviewers thatgreatly strengthened this manuscript.
References
Adelson, J.M., Helz, G.R., Miller, C.V., 2001. Reconstructing the rise of recent coastalanoxia: molybdenum in Chesapeake Bay sediments. Geochim. Cosmochim. Acta 65,237–252.
Agresti, A., 2002. Categorical Data Analysis. Wiley Series on Probability and Statistics.John Wiley & Sons, Inc., New York. 734 pp.
Aller, R.C., 1980. Diagenetic processes near the sediment–water interface of Long IslandSound II. Fe and Mn. Adv. Geophys. 22, 351–415.
Ataie-Ashtiani, B., Volker, R.E., Lockington, D.A., 1999. Tidal effects on sea waterintrusion in unconfined aquifers. J. Hydrol. 216, 17–31.
Austin, J.A., 2004. Estimating effective longitudinal dispersion in the Chesapeake Bay.Estuar. Coast. Shelf Sci. 60, 359–368.
Bau, M., 1999. Scavenging of dissolved yttrium and rare earths by precipitating ironhydroxide: experimental evidence for Ce oxidation, Y–Ho fractionation, andlanthanide tetrad effect. Geochim. Cosmochim. Acta 63, 67–77.
Benes, P., Stamberg, K., Vopalka, D., Siroky, L., Prochazkova, S., 2003. Kinetics ofradioeuropium sorption on Gorelben sand from aqueous solutions and ground-water. J. Radioanal. Nucl. Chem. 256, 465–472.
Breitburg, D.L., 1990. Near-shore hypoxia in the Chesapeake Bay: patterns andrelationships among physical factors. Estuar. Coast. Shelf Sci. 30, 593–609.
Brookins, D.G., 1989. Aqueous geochemistry of rare earth elements. In: Lipin, B.R.,McKay, G.A. (Eds.), Geochemistry and Mineralogy of Rare Earth Elements. Reviewsin Mineralogy. Mineralogical Society of America, pp. 201–225.
Burdige, D.J., 1993. The biogeochemistry of Mn and Fe reduction in marine sediments.Earth-Sci. Rev. 35, 249–284.
Censi, P., et al., 2007. The behaviour of REEs in Thailand's Mae Kong estuary:suggestions from the Y/Ho ratios and lanthanide tetrad effects. Estuar. Coast. ShelfSci. 71, 569–579.
Chaillou, G., Anschitz, P., Lavaux, G., Blanc, G., 2006. Rare earth elements in the modernsediments of the Bay of Biscay (France). Mar. Chem. 100, 39–52.
Charette, M.A., Buessler, K.O., 2004. Submarine groundwater discharge of nutrients andcopper to an urban subestuary of Chesapeake Bay (Elizabeth River). Limnol.Oceanogr. 49, 376–385.
Charette, M.A., Sholkovitz, E.R., Hansel, C.M., 2005. Trace element cycling in asubterranean estuary: Part 1. Geochemistry of the permeable sediments. Geochim.Cosmochim. Acta 69, 2095–2109.
Dorval, E., 2004. Relating water and otolith chemistry in Chesapeake Bay, and theirpotential to identify essential seagrass habitats for juveniles of an estuarine-dependent fish, spotted seatrout (Cynoscion nebulosus). Old Dominion University,Norfolk. 134 pp.
Dorval, E., Jones, C.M., Hannigan, R., 2005. Chemistry of surface waters: distinguishingfine-scale differences in seagrass habitats of Chesapeake Bay. Limnol. Oceanogr. 50,1073–1083.
Eaton, A., 1979. The impact of anoxia on Mn fluxes in the Chesapeake Bay. Geochim.Cosmochim. Acta 43, 429–432.
Elderfield, H., Sholkovitz, E.R., 1987. Rare earth elements in the pore waters of reducingnearshore sediments. Earth Planet. Sci. Lett. 8, 280–288.
Elderfield, H., Upstill-Goddard, R., Sholkovitz, E.R., 1990. The rare earth elements inrivers, estuaries, and coastal seas and their significance to the composition of theocean waters. Geochim. Cosmochim. Acta 54, 971–991.
Erel, Y., Stolper, E.M., 1993. Modeling of rare-earth element partitioning betweenparticles and solution in aquatic environments. Geochim. Cosmochim. Acta 57,513–518.
Feldman, I., Jakubowski, N., Thomas, C., Stuewer, D., 1999. Application of a hexapolecollision and reaction cell in ICP-MS Part II: Analytical figures of merit and firstapplications. Fresen. J. Anal. Chem. 365, 422–428.
Froelich, P.N., et al., 1979. Early oxidation of organic matter in pelagic sediments of theeastern equatorial Atlantic: suboxic diagenesis. Geochim. Cosmochim. Acta 43,1075–1090.
Gavis, J., Grant, V., 1986. Sulfide, iron, manganese, and phosphate in the deep water ofthe Chesapeake Bay during anoxia. Estuar. Coast. Shelf Sci. 23, 451–463.
Goldstein, S.L., Jacobsen, S.B., 1988. REE in the Great Whale River Estuary, NW Quebec.Earth Planet. Sci. Lett. 88, 241–252.
Guieu, C., et al., 1998. On trace metal geochemistry in the Danube River and westernBlack Sea. Estuar. Coast. Shelf Sci. 47, 471–485.
Hagy, J.D., Boynton, W.R., Keefe, C.W., Wood, K.V., 2004. Hypoxia in Chesapeake Bay,1950–2001: long-term change in relation to nutrient loading and river flow.Estuaries 27, 634–658.
Hannigan, R.E., Basu, A.R., Teichmann, R., 2001. Mantle reservoir geochemistry fromstatistical analysis of ICP-MS trace element data of equatorial mid-Atlantic MORBglass. Chem. Geol. 175, 397–428.
Hines, W.G.S., Hines, R.J.O.H., 2000. Increased power with modified forms of the Levene(Med) Test for heterogeneity of variance. Biometrics 56, 451–454.
Hodge, V.F., Stetzenbach, K.J., Johannesson, K.H., 1998. Similarities in the chemicalcomposition of carbonate groundwaters and seawater. Environ. Sci. Technol. 32,2481–2486.
Hood, R.R., Wang, H.V., Purcell, J.E., Houde, E.D., Harding Jr., L.W., 1999. Modelingparticles and pelagic organisms in Chesapeake Bay: convergent features controlplankton distributions. J. Geophys. Res. 104, 1223–1243.
Hubaux, A., Vos, G., 1970. Decision and detection limits for linear calibration curves.Anal. Chem. 42, 849–855.

30 R. Hannigan et al. / Chemical Geology 272 (2010) 20–30
Huettel, M., Ziebis, W., Forster, S., 1996. Flow-induced uptake of particulate matter inpermeable sediments. Limnol. Oceanogr. 41, 309–322.
Huettel, M., Ziebis, W., Forster, S., Luther, G.W., I., 1998. Advective transport affectingmetal and nutrient distributions and interfacial fluxes in permeable sediments.Geochim. Cosmochim. Acta 62, 613–631.
Hussain, N., Church, T.M., Kim, G., 1999. The use of 222Rn and 226Ra to tracegroundwater discharge into the Chesapeake Bay. Mar. Chem. 65, 127–134.
Jahnke, R.A., Alexander, C.R., Kostka, J.E., 2003. Advective pore water input of nutrientsto the Satilla River Estuary, Georgia, USA. Estuar. Coast. Shelf Sci. 56, 641–653.
Johannesson, K.H., Tang, J., Daniels, J.M., Bounds, W.J., Burdige, D.J., 2004. Rare earthelement concentrations and speciation in organic-rich black waters of the GreatDismal Swamp, Virginia, USA. Chem. Geol. 209, 271–294.
Johnson, G.H., et al., 1998. Post impact deformation associated with the late EoceneChesapeake Bay impact structure in southeastern Virginia. Geology 26, 507–510.
Khattree, R., Naik, D.N., 2000. Multivariate Data Reduction and Discrimination with SASSoftware. SAS Press and John Wiley Sons Inc., New York, NY. 574 pp.
Kidder, D.L., Krishnaswamy, R., Mapes, R., 2003. Elemental mobility in phosphaticshales during concretion growth and implications for provenance analysis. Chem.Geol. 198, 335–353.
Kishi, Y., Kawabata, K., Shi, H., Thomas, R., 2004. Reduction of carbon-basedinterferences in organic compound analysis by dynamic reaction cell ICP MS.Spectroscopy 19, 14–20.
Kristensen, E., Kristensen, K.D., Jensen, M.H., 2002. The influence of water columnhypoxia on the behavior of menganese and iron in sandy coastal marine sediment.Estuar. Coast. Shelf Sci. 55, 645–654.
Lane, E.W., et al., 1947. Report of the subcommittee on sediment terminology. Trans.Am. Geophys. Un. 28, 936–938.
Lawrence, M.G., Kamber, B.S., 2006. The behaviour of the rare earth elements duringestuarine mixing — revisited. Mar. Chem. 100, 147–161.
Li, L., Barry, D.A., Stangnitti, F., Parlange, J.-Y., 1999. Submarine groundwater dischargeand associated chemical input to a coastal sea. Water Resour. Res. 35, 3253–3259.
Martin, J.M., Hogdahl, O., Phillippot, J.C., 1976. Rare earth element supply to the oceans.J. Geophys. Res. 81, 3119–3124.
McLennan, S.M., 1989. Rare earth elements in sedimentary rocks: the influence ofprovenance and sedimentary processes. In: Lipin, B.R., McKay, G.A. (Eds.),Geochemistry and Mineralogy of Rare Earth Elements. Reviews in Mineralogy.Mineralogical Society of America, pp. 169–200.
Moermond, C.T.A., Tijink, J., Wezel, A.P.v., Koelmans, A.A., 2001. Distribution, speciation,and bioavailability of lanthanides in the Rhine-Meuse Estuary, The Netherlands.Environ. Toxicol. Chem. 20, 1916–1926.
Moore, W.S., 1999. The subterranean estuary: a reaction zone of groundwater and seawater. Mar. Chem. 65, 111–125.
Moore, K.A., Wilcox, D.J., Orth, R.J., 2000. Analysis of the abundance of submersedaquatic vegetation communities in the Chesapeake Bay. Estuaries 23, 115–127.
Murphy, S.A., Rossini, A.J., Waart, A.W.v.d., 1997. Maximum likelihood estimation in theproportional odds model. J. Am. Stat. Assoc. 92, 968–976.
Murray, R.W., Leinen, M., 1993. Chemical transport to the seafloor of the equatorialPacific across a latitudinal transect at 135°W: tracking sedimentary major, trace,and rare earth element fluxes at the Equator and the ITCZ. Geochim. Cosmochim.Acta 57, 4141–4163.
Murthy, R., Kidder, D.L., Mapes, R.H., Hannigan, R., 2004. Rare Earth Element Chemistryof Mississippian-Age Phosphate Nodules in the Fayetteville Shale of Oklahoma andArkansas. Environ. Geosci. 11, 99–111.
Negrel, P., 1997. Multi-element chemistry of Loire Estuary sediments: anthropogenicvs. natural sources. Estuar. Coast. Shelf Sci. 44, 395–410.
Nozaki, Y., Lerche, D., Alibo, D.S., Snidvongs, A., 2000. The estuarine geochemistry ofrare earth elements and indium in the Chao Phraya River, Thailand. Geochim.Cosmochim. Acta 64, 3983–3994.
O'Brien, P.C., 1992. Robust procedures for testing equality of covariance matrices.Biometrics 48, 819–827.
Officer, C.B., et al., 1984. Chesapeake Bay anoxia: origin, development and significance.Science 223, 22–27.
Ogihara, S., 1999. Geochemical characteristics of phosphorite and carbonate nodulesfrom the Miocene Funakawa Formation, western margin of the Yokote Basin,northeast Japan. Sediment. Geol. 125, 69–82.
Poag, C.W., 1997. The Chesapeake Bay bolide impact: a convulsive event in AtlanticCoastal Plain evolution. Sediment. Geol. 108, 45–90.
Prego, R., Caetano, M., Vale, C., Marmolejo-Rodríguez, J., 2009. Rare earth elements insediments of the Vigo Ria, NW Iberian Peninsula. Cont. Shelf Res. 29, 896–902.
Pritchard, D.W., 1952. Salinity distribution and circulation in the Chesapeake Bayestuarine system. J. Mar. Res. 107–123 X.
Reay, W.G., Simmons, G.M., 1992. Groundwater discharge in coastal systems:implications for Chesapeake Bay, Perspect. Ches. Bay 1992, 17–44.
Reay,W.G., Gallagher,D.L., Simmons,G.M., 1992.Groundwaterdischarge and its impact onsurface–water quality in a Chesapeake Bay inlet. Water Resour. Bull. 28, 1121–1134.
Reimers, C.E., et al., 2004. In situ measurements of advective solute transport inpermeable shelf sands. Cont. Shelf Res. 24, 183–201.
Riedel, G.F., Sanders, J.G., Osman, R.W., 1999. Biogeochemical control on the flux of traceelements from estuarine sediments: effects of seasonal and short-term hypoxia.Mar. Environ. Res. 47, 349–372.
Sanford, W.E., Pope, J.P. and Nelms, D.L., 2009. Simulation of groundwater-level andsalinity changes in the Eastern Shore, Virginia. U.S. Geol. Surv. Report 2009–5066,125 pp.
Seliger, H.H., Boggs, J.A., Biggley, W.H., 1985. Catastrophic anoxia in the Chesapeake Bayin 1984. Science 228, 70–73.
Sholkovitz, E.R., 1990. Rare earth elements in marine sediments and geochemicalstandards. Chem. Geol. 88, 333–347.
Sholkovitz, E.R., 1992. Chemical evolution of rare earth elements: fractionationbetween colloidal and solution phases of filtered river water. Earth Planet. Sci.Lett. 114, 77–84.
Sholkovitz, E.R., 1993. The geochemistry of rare earth elements in the Amazon Riverestuary. Geochim. Cosmochim. Acta 57, 2181–2190.
Sholkovitz, E.R., 1995. The aquatic chemistry of rare earth elements in rivers andestuaries. Aquat. Geochem. 1, 1–34.
Sholkovitz, E.R., Elderfield, H., 1988. Cycling of dissolved rare earth elements inChesapeake Bay. Glob. Biogeochem. Cycles 2, 157–176.
Sholkovitz, E., Szymczak, R., 2000. The estuarine chemistry of rare earth elements:comparison of the Amazon, Fly, Sepik and the Gulf of Papua systems. Earth Planet.Sci. Lett. 179, 299–309.
Sholkovitz, E.R., Landing, W.M., Lewis, B.L., 1994. Ocean particle chemistry: thefractionation of rare earth elements between suspended particles and seawater.Geochim. Cosmochim. Acta 58, 1567–1580.
Sholkovitz, E.R., Elderfield, H., Szymczak, R., Casey, K., 1999. Island weathering: riversources of rare earth elements to the Western Pacific Ocean. Mar. Chem. 68, 39–57.
Simmons, G.M., 1989. The Chesapeake Bay's hidden tributary: submarine groundwaterdischarge. Groundwater Issues and Solutions in the Potomac River basin/Chesapeake Bay region, pp. 9–29.
Simmons, G.M., 1992. Importance of submarine groundwater discharge (SGWD) andseawater cycling to the material flux across sediment/water interfaces in marineenvironments. Mar. Ecol., Prog. Ser. 84, 173–184.
Somayajulu, B.L.K., Martin, J.M., Thomas, A.J., Borole, D.V., Rao, K.S., 1993. Geochemicalstudies in the Godavari estuary, India. Mar. Chem. 43, 83–93.
Taft, J.L., Taylor, W.R., Hartwig, E.O., Loftus, R., 1980. Seasonal oxygen depletion inChesapeake Bay. Estuaries 3, 242–247.
Taylor, S.R., McLennan, S.H., 1985. The Continental Crust: Its Composition andEvolution. Blackwell, Oxford. 312 pp.
Toyoda, K., Nakamura, Y., Masuda, A., 1990. Rare earth elements of Pacific pelagicsediments. Geochim. Cosmochim. Acta 54, 1093–1103.
Valle-Levinson, A., Lwiza, K.M.M., 1995. The effects of channels and shoals on exchangebetween the Chesapeake Bay and the adjacent ocean. J. Geophys. Res. 100,18551–18563.
Valle-Levinson, A., Wong, K., Lwiza, K.M.M., 2000. Fortnightly variability in thetransverse dynamics of a coastal plain estuary. J. Geophys. Res. 105, 3413–3424.
Zimmerman, A.R., Canuel, E.A., 2001. Bulk organic matter and lipid biomarkercomposition of Chesapeake Bay surficial sediments as indicators of environmentalprocesses. Estuar. Coast. Shelf Sci. 53, 319–341.
Recommended


