The Validity of Value-Added
Measures in Secondary Schools
By Vanessa Scherman
Submitted in fulfilment of the requirements for the degree of
PhD: Assessment and Quality Assurance
In the Department of Curriculum Studies
Faculty of Education
University of Pretoria
PRETORIA
March 2007
Supervisor: Prof. Sarah Howie, University of Pretoria
Co-supervisor: Prof. Tjeerd Plomp, University of Twente
i
Table of Contents
List of Tables vi
List of Figures viii
List of Acronyms ix
Summary xi
Acknowledgements xiii
CHAPTER 1 INTRODUCTION 1
1.1 Introduction 2
1.2 South African education context 4
1.2.1 The South African education system 4
1.2.2 National revised curriculum statement 8
1.2.3 Assessment policies 12
1.3 Key concepts 16
1.3.1 Quality in education 16
1.3.2 Monitoring in education 17
1.3.3 Value-added assessment as a monitoring mechanism 19
1.4 Policies on monitoring quality in education 19
1.5 Research problem in context 23
1.6 Structure of the dissertation 26
CHAPTER 2 MONITORING QUALITY EDUCATION: REVIEW OF THE LITERATURE 27
2.1 Introduction 27
2.2 Monitoring systems in education 28
2.2.1 Characteristics of monitoring systems 30
2.2.2 The ZEBO-project in the Netherlands 31
2.2.3 The Victorian Certificate of Education (VCE) data project in Australia 33
2.2.4 The ABC+ model in the United States of America 35
2.3 Comparison of selected monitoring systems 38
2.4 Value-added monitoring systems 42
2.4.1 Value-added monitoring systems in the United Kingdom 43
2.4.2 Value-added monitoring systems in the United States 45
2.4.3 Concluding remarks regarding value-added monitoring systems 46
2.5 Ability as a predictor of academic success 48
ii
2.6 The relevance of skills and abilities against the backdrop of curriculum 50
2.7 Factors influencing performance 52
2.8 Conclusion 59
CHAPTER 3 CONCEPTUAL FRAMEWORK FOR THE STUDY 63
3.1 Introduction 63
3.2 School effectiveness models 64
3.3 Scheeren’s model for school effectiveness research 66
3.4 Model for monitoring education in South Africa 69
3.4.1 The context 74
3.4.2 Input indicators 75
3.4.3 Process indicators 75
3.4.4 Output indicators 78
3.5 Specific research questions 79
3.6 Conclusion 85
CHAPTER 4 MIDDLE YEARS INFORMATION SYSTEM (MIDYIS): CHALLENGES AND
CHANGES 86
4.1 Introduction 86
4.2 MidYIS in the United Kingdom 88
4.3 The MidYIS instruments 90
4.3.1 The MidYIS Scales 90
4.3.2 The vocabulary sub-test 91
4.3.3 The mathematics sub-test 92
4.3.4 The proof reading sub-test 93
4.3.5 The perceptual speed and accuracy sub-test 93
4.3.6 The cross-sections sub-test 94
4.3.7 The block counting sub-test 95
4.3.8 The pictures sub-test 95
4.3.9 Extended MidYIS 96
4.4 Feedback provided by the MidYIS project 97
4.4.1 Nationally standardised feedback 98
4.4.2 Band profile graphs 100
4.4.3 Predictions to Key Stage 3 and GCSE 101
4.4.4 Chances graphs 103
4.4.5 Value-added feedback 103
4.5 Evaluation of the MidYIS project and relevance for South Africa 104
iii
4.6 Summary and adaptations to enhance MidYIS for South Africa 107
4.7 Conclusion 112
CHAPTER 5 RESEARCH DESIGN AND METHODS 117
5.1 Introduction 117
5.1.1 The development of pragmatism 118
5.1.2 Rationale for working within a pragmatist paradigm 121
5.2 Design issues 123
5.3 Methodology 130
5.3.1 Sample 131
5.3.2 Instruments 132
5.3.2.1 Assessment instrument 132
5.3.2.2 Questionnaires 132
5.3.2.3 Interview schedules 135
5.3.3 Validity issues related to the instruments 135
5.3.3.1 Validation of assessment instrument 136
5.3.3.2 Validation of the questionnaires 142
5.3.4 Data collection 143
5.3.4.1 Document analysis 144
5.3.4.2 Evaluation reports 145
5.3.4.3 National-level data collection 145
5.3.4.4 Provincial level data collection 146
5.3.4.5 School-level data collection 146
5.3.5 Data analysis 147
5.3.5.1 Analysis of documents 148
5.3.5.2 Analysis of qualitative data 149
5.3.5.3 Analysis of assessment data 151
5.3.5.4 Analysis of contextual data 158
5.3.5.5 Building an exploratory model using assessment and contextual data 159
5.3.6 Research procedures 163
5.4 Ethical issues 164
5.5 Methodological constraints 165
5.6 Conclusion 165
CHAPTER 6 THE CONTENT–RELATED VALIDITY OF THE MIDYIS ASSESSMENT 167
6.1 Introduction 167
6.2 Exploring the curriculum validity of the MidYIS assessment 170
iv
6.2.1 Perspectives from National and Provincial Departments of Education 171
6.2.2 The language learning area 177
6.2.3 The mathematics learning area 184
6.2.4 Exploring possible suggestions for the revision of MidYIS 191
6.3 Exploring the content validity of the MidYIS assessment 194
6.4 Conclusion 197
CHAPTER 7 THE CONSTRUCT-RELATED VALIDITY AND RELIABILITY OF THE MIDYIS
ASSESSMENT 201
7.1 Introduction 201
7.2 Participant characteristics 205
7.3 Elaborating on construct validity 206
7.3.1 Investigating construct validity by means of Rasch analysis 207
7.3.1.1 Vocabulary sub-test 208
7.3.1.2 Mathematics sub-test 211
7.3.1.3 Proof reading sub-test 213
7.3.1.4 Perceptual speed and accuracy sub-test 217
7.3.1.5 Cross-sections sub-test 220
7.3.1.6 Block counting sub-test 222
7.3.1.7 Pictures sub-test 225
7.3.2 Conclusions drawn from the Rasch analyses 228
7.4 Exploring the reliability of the MidYIS assessment 230
7.5 Exploring relationships between MidYIS scores and academic achievement 232
7.6 Conclusion 238
CHAPTER 8 FACTORS THAT INFLUENCE PERFORMANCE ON MIDYIS 240
8.1 Introduction 240
8.2 Preparation for model building 242
8.2.1 Identifying variables to be explored with multilevel analyses 242
8.2.2 Approach to model building 246
8.3 The results of the multilevel analyses 248
8.3.1 The null model 248
8.3.2 The learner, classroom, school-level model 250
8.4 Conclusion 256
v
CHAPTER 9 CONCLUSIONS AND RECOMMENDATIONS 260
9.1 Introduction 260
9.2 Summary of the research 261
9.3 Discussion and reflection 278
9.3.1 Methodological reflections 278
9.3.2 Reflection on this research in of light school effectiveness research 280
9.3.3 Contribution to scientific and practical knowledge 283
9.4 Recommendations 288
9.4.1 Recommendations and issues regarding monitoring systems 288
9.4.2 Recommendations and issues regarding policy 289
9.4.3 Recommendations for further research 290
9.5 The role of feedback and intervention 292
9.6 Conclusion 299
REFERENCES 301
Appendix A: Description of the MidYIS sub-tests 334
Appendix B: Description of constructs included in the learner questionnaire 337
Appendix C: Description of constructs included in the educator questionnaire 340
Appendix D: Description of the constructs in the principal questionnaire 344
Appendix E: Audit trail documents 348
Appendix F: Evaluation report guidelines 350
Appendix G: Summary of reports from the language and mathematics specialists 352
Appendix H: Diagramatic representation of the research procedures undertaken 360
Appendix I: Letters of consent 362
Appendix J: Assessment framework for mathematics 369
Appendix K: Complete list of ability factors 376
Appendix L: Rasch and correlation analyses 380
Appendix M: Multilevel analyses 382
Appendix N: Ethical clearance and language editing 385
vi
List of Tables
Table 1.1 Information on learners, educators and schools in 2003 6
Table 1.2 Trends in the purpose of assessment 15
Table 1.3 Policy initiatives aimed at monitoring the quality of education 21
Table 2.1 Components and indicators of the ZEBO-project 33
Table 2.2 Data elements of the ABC+ model 37
Table 2.3 Characteristics of the monitoring systems 39
Table 3.1 Overview of indicators and variables included in the conceptual model 73
Table 4.1 Typology of indicators for education monitored by CEM 87
Table 4.2 Age group of learners participating in the MidYIS project 89
Table 4.3 Correlations between MidYIS assessments and Key Stage 3 examinations 97
Table 4.4 Reliability coefficients for the UK, Year 7/ 8 assessment 97
Table 4.5 Reliability coefficients for the UK, Year 9 assessment 98
Table 4.6 GCSE grades and equivalent MidYIS scores 102
Table 4.7 Characteristics of the MidYIS monitoring system 105
Table 5.1 Comparison between post-positivism, constructivism, and pragmatism 120
Table 5.2 Summary of research questions, sources and data instruments 144
Table 6.1 Skills as indicated by the Provincial Department Education officials 176
Table 6.2 Outcomes in the languages learning area 177
Table 6.3 Proposed overlap between the language learning area and MidYIS 182
Table 6.4 Outcomes in the mathematics learning area 185
Table 6.5 Accessibility of mathematics items 188
Table 6.6 Proposed overlap between the mathematics learning area and MidYIS 190
Table 6.7 Summary of ability factors associated with abilities or aptitude assessments 196
Table 7.1 Age and gender distribution of participating learners 205
Table 7.2 Home language of learners who participated 206
Table 7.3 Population group of learners who participated 206
Table 7.4 Initial statistics for vocabulary sub-test 209
Table 7.5 Final statistics for vocabulary sub-test 209
Table 7.6 Initial statistics for mathematics sub-test 211
Table 7.7 Final statistics for mathematics sub-test 212
Table 7.8 Initial statistics for proof reading 1 sub-test 214
Table 7.9 Final statistics for proof reading 1 sub-test 214
Table 7.10 Initial statistics for proof reading 2 sub-test 216
Table 7.11 Final statistics for proof reading 2 sub-test 216
Table 7.12 Initial statistics for perceptual speed and accuracy sub-test 218
Table 7.13 Final statistics for perceptual speed and accuracy sub-test 218
vii
Table 7.14 Initial statistics for cross-sections sub-test 220
Table 7.15 Final statistics for cross-sections sub-test 220
Table 7.16 Initial statistics for block counting sub-test 223
Table 7.17 Final statistics for block counting sub-test 223
Table 7.18 Initial statistics for pictures sub-test 226
Table 7.19 Final statistics for pictures sub-test 226
Table 7.20 Reliability analysis and standard error of measurement per scale 231
Table 7.21 Reliability analysis per scale and population groups of learners 232
Table 7.22 Correlations between the revised MidYIS scales and school mathematics 234
Table 7.23 Correlations between the revised MidYIS scales and school English 236
Table 8.1 Description and significant correlations with MidYIS total 244
Table 8.2 The intercept-only model 249
Table 8.3 Variance explained at the learner, classroom and school-level 250
Table 8.4 Progression in model building 252
Table 8.5 Proportion of variance explained by consecutive models for language 255
Table 9.1 A comparison of the ZEBO-project, VCE data project, ABC+ model and MidYIS 270
viii
List of Figures Figure 3.1 School effectiveness model as developed by Scheerens (1990) 67
Figure 3.2 Conceptual framework for monitoring education in South Africa 72
Figure 3.3 Criteria for evaluating quality of measurement used in monitoring systems 80
Figure 3.4 Components included for study 84
Figure 4.1 The scales and sub-tests of the MidYIS assessment 90
Figure 4.2 Example from the vocabulary sub-test 92
Figure 4.3 Example from the mathematics sub-test 92
Figure 4.4 Example item from the proof reading sub-test 93
Figure 4.5 Example item from the perceptual speed and accuracy sub-test 94
Figure 4.6 Example item from the cross-sections sub-test 94
Figure 4.7 Example item from the block counting sub-test 95
Figure 4.8 Example item from the pictures sub-test 96
Figure 4.9 Standardised scores 99
Figure 4.10 MidYIS bands represented on a normal distribution 100
Figure 4.11 Band profile graphs 101
Figure 4.12 Predictions to GCSE subjects 102
Figure 4.13 Learner-level chances graph for English 103
Figure 4.14 Value-added analysis 104
Figure 5.1 A mixed method process model 129
Figure 5.2 Iterative model of the different components of qualitative data 150
Figure 5.3 Example of an item characteristic curve 152
Figure 6.1 Extension of the criteria for evaluating quality of measurement 168
Figure 7.1 Extension of the criteria for evaluating quality of measurement 202
Figure 7.2 Item and person map for the vocabulary sub-test 210
Figure 7.3 Item and person map for the mathematics sub-test 213
Figure 7.4 Item and person map for the proof reading 1 sub-test 215
Figure 7.5 Item and person map for the proof reading 2 sub-test 217
Figure 7.6 Item and person map for the perceptual speed and accuracy sub-test 219
Figure 7.7 Item and person map for the cross-sections sub-test 222
Figure 7.8 Item and person map for the block counting sub-test 225
Figure 7.9 Item and person map for the pictures sub-test 228
Figure 8.1 Proposed model for the multilevel analyses 246
Figure 9.1 Overview of the main research, specific research and sub-research questions 267
Figure 9.2 Conceptual framework for monitoring education in South Africa 287
Figure 9.3 Conceptual framework for this study on monitoring the quality of education 295
Figure 9.4 School-based model for improvement 296
Figure 9.5 Evaluation model for school-based improvement 297
ix
List of Acronyms
ABC+ - Attitudinal/Behavioural/Cognitive Indicators plus Context
Alis - A-level Information System
CASS - Continuous Assessment
CEA - Centre for Evaluation and Assessment
CEM - Curriculum, Evaluation and Management Centre
DAT - Differential Aptitude Test
FET - Further Education and Training
GAT - General Achievement Test
GCSE - General Certificate for Secondary Education
GDE - Gauteng Department of Education
GET - General Education and Training Band
GSAT - General Scholastic Aptitude Test Battery (GSAT)
HET - Higher Education and Training
HLM - Hierarchical Linear Models
HSRC – Human Sciences Research Council
IQMS - Integrated Quality Management System
LEA - Local Education Authorities
JAT – Junior Aptitude Test
MLA - Monitoring Learning Achievement
MidYIS - Middle Years Information System
NAPTOSA – National Professional Teachers’ Organisation of South Africa
NFER - National Foundation for Educational Research
OBE - Outcomes-Based Education
OFSTED - Gauteng Department of Education Office for Standards in Education
PARIS - Predictions and Reporting Interactive Software
PIPS - Performance Indicators at Primary School
PIRLS - Progress in International Reading Literacy Study
QAIT/MACRO - Quality, Appropriateness, Incentive, Time of instruction/Meaningful goals,
Attention to academic focus, Coordination, Recruitment and training,
Organisation
QUAN - Quantitative Research
QUAL - Qualitative Research
QUASE - Quantitative Analysis for Self Evaluation
RNCS - Revised National Curriculum Statement
x
SACMEQ - Southern Africa Consortium for Monitoring Educational Quality
SER – School Effectiveness Research
SGB – School-Governing Body
SSAIS - Senior South African Individual Scale (SSAIS)
SASSIS - South African Secondary School Information System
SAT - Senior Aptitude Test
SATIS - Student Attitudes Information System
SE - Systemic Evaluation
SITES - Second International Technology in Education Study
TAD - Test of Developed Ability
TIMSS - Third International Mathematics and Science Study
UK - United Kingdom
USA - United States of America
VCE - Victorian Certificate of Education
WAIS - South African Wechsler Adult Intelligence Scale
WISC - Wechsler Intelligence Scale for Children
WSE - Whole School Evaluation
ZEBO - Self-Evaluation in Primary Schools
xi
Summary
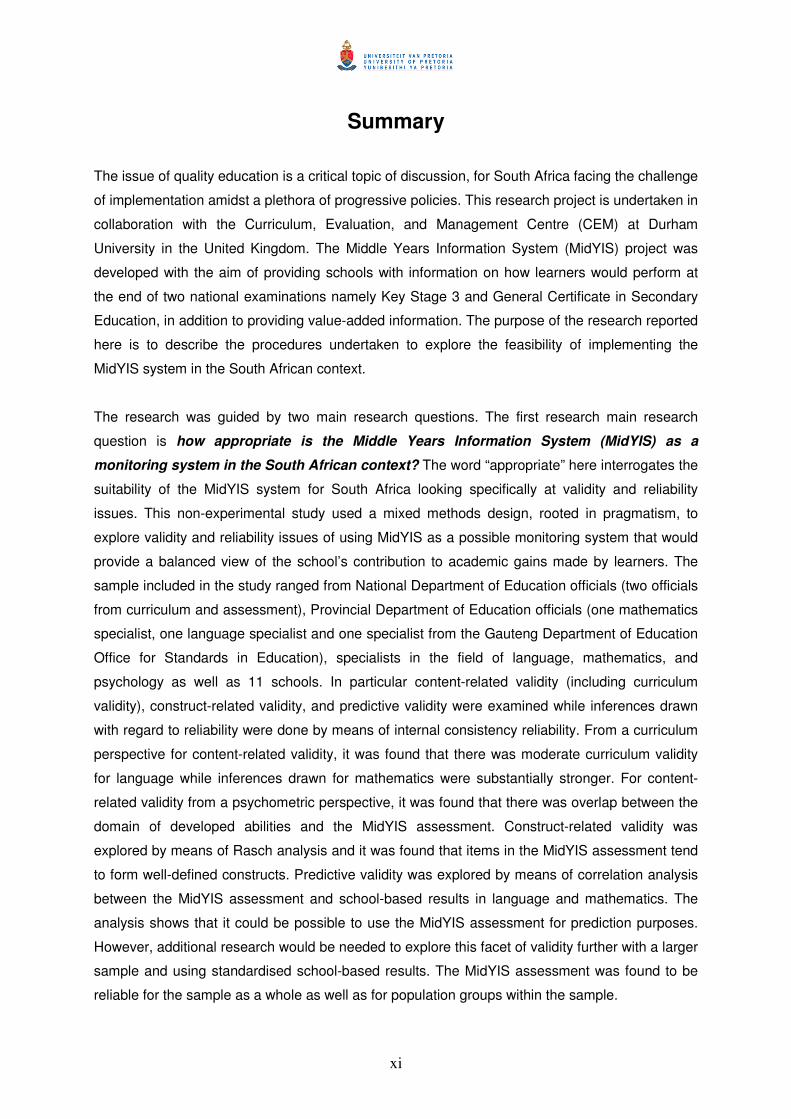
The issue of quality education is a critical topic of discussion, for South Africa facing the challenge
of implementation amidst a plethora of progressive policies. This research project is undertaken in
collaboration with the Curriculum, Evaluation, and Management Centre (CEM) at Durham
University in the United Kingdom. The Middle Years Information System (MidYIS) project was
developed with the aim of providing schools with information on how learners would perform at
the end of two national examinations namely Key Stage 3 and General Certificate in Secondary
Education, in addition to providing value-added information. The purpose of the research reported
here is to describe the procedures undertaken to explore the feasibility of implementing the
MidYIS system in the South African context.
The research was guided by two main research questions. The first research main research
question is how appropriate is the Middle Years Information System (MidYIS) as a
monitoring system in the South African context? The word “appropriate” here interrogates the
suitability of the MidYIS system for South Africa looking specifically at validity and reliability
issues. This non-experimental study used a mixed methods design, rooted in pragmatism, to
explore validity and reliability issues of using MidYIS as a possible monitoring system that would
provide a balanced view of the school’s contribution to academic gains made by learners. The
sample included in the study ranged from National Department of Education officials (two officials
from curriculum and assessment), Provincial Department of Education officials (one mathematics
specialist, one language specialist and one specialist from the Gauteng Department of Education
Office for Standards in Education), specialists in the field of language, mathematics, and
psychology as well as 11 schools. In particular content-related validity (including curriculum
validity), construct-related validity, and predictive validity were examined while inferences drawn
with regard to reliability were done by means of internal consistency reliability. From a curriculum
perspective for content-related validity, it was found that there was moderate curriculum validity
for language while inferences drawn for mathematics were substantially stronger. For content-
related validity from a psychometric perspective, it was found that there was overlap between the
domain of developed abilities and the MidYIS assessment. Construct-related validity was
explored by means of Rasch analysis and it was found that items in the MidYIS assessment tend
to form well-defined constructs. Predictive validity was explored by means of correlation analysis
between the MidYIS assessment and school-based results in language and mathematics. The
analysis shows that it could be possible to use the MidYIS assessment for prediction purposes.
However, additional research would be needed to explore this facet of validity further with a larger
sample and using standardised school-based results. The MidYIS assessment was found to be
reliable for the sample as a whole as well as for population groups within the sample.
xii
The second main research question extends the first research question. If MidYIS is valid, with
South African adaptations, and reliable, then what factors on a school, classroom, and learner-
level could have an effect on learner performance. Thus, the second main research question is
which factors could have an effect on learner performance and therefore inform the design
of the monitoring system?
In order to explore factors, multilevel analysis was undertaken on the various levels within the
school system namely the principals, mathematics and language educators, as well as learners
who completed questionnaires. It was found that four learner-level factors (with whom learners
live, mother’s level of education, importance of mathematics and importance of English), one
educator level factor (challenges to assessment due to lack of in-service training) and two school-
level factors (educators make use of monitoring systems and encouraging academic
achievement) seem to have an effect on the performance of learners.
Key words: school effectiveness, school improvement, monitoring, quality education, monitoring
systems, factors influencing achievement, construct-related validity, content-related validity,
curriculum validity, test-curriculum-overlap, predictive validity, reliability, Rasch analysis,
multilevel analysis, mixed methods, pragmatism
xiii
Acknowledgements
I am thankful to God for providing me with this special opportunity. He provided every step of
the way whether sending someone upon my path to encourage me or giving me the quiet
assurance that He is present and will make a way.
I would like to extend my gratitude and appreciation to Prof Sarah Howie and Prof Tjeerd
Plomp who guided my along this Safari. It has been a long journey not without its heartaches
and rewards. You have shown me what it means to dig a little deeper, to stretch the
boundaries a little further, to explore a little more even when time seemed too short and the
ideas too big.
To the most precious gift of all Victor Scherman, my husband, you have been a continued
source of support. I am extremely thankful for your hugs or reassurance and kind words of
encouragement when things just seemed to be too much or the road just too long to travel.
To Tina Lopes for walking this path called PhD with me. Your friendship has meant the world
to me.
To my Family, thank you for understanding when I regrettably declined the opportunity of
spending time with you.
To Elsie Venter, Hayley Barnes and Liz Archer, your friendship and ongoing support is
greatly appreciated.
To the Staff at the Centre for Evaluation and Assessment (CEA), you have continually
supported and encouraged me throughout my studies. Thank you for your patience when my
thoughts were elsewhere.
To the Staff in the Department of Curriculum Studies for the words of encouragement and
interest in my progress, especially Prof William Fraser for his continued support.
To Prof Jonathan Jansen for believing in me and for the words of encouragement given.
Thank you to the National Research Foundation from whom I received a grant holder’s
doctoral bursary.

xiv
To John Barnard and Hans Luyten who helped with some of the technical aspects of the
analysis included in the pages to follow. Thank you for your willingness to assist and guide
me.
To Pieter van der Merwe who assisted with the language editing. The dissertation is a better
product thanks to your patient intervention.
To Jeannie Beukes from the Faculty of Education Administration, who provided substantial
administrative support during the examination process. Thank you for your time and effort.
To the Curriculum, Evaluation and Management Centre (CEM) for allowing the use of their
instruments. Also to the staff at the CEM centre, who assisted with queries and helped me to
understand the rationale behind the use of the monitoring systems in the context of the
United Kingdom.
To the specialists in the fields of education and psychology. Thank you for your time and
effort.
A special word of thanks to the National and Provincial Department of Education officials who
participated in this research.
Finally but by far not the least, to the 11 schools, educators, parents and learners who
participated in the study, thank you for allowing me into your schools and classrooms. This
research would not have been possible without you.
1
CHAPTER 1CHAPTER 1CHAPTER 1CHAPTER 1
INTRODUCTIONINTRODUCTIONINTRODUCTIONINTRODUCTION
This study aims to explore the feasibility of adapting an existing monitoring
system developed in the United Kingdom, to the South African context. Quality in
education has, once again, become a key focus point for governments, as
highlighted by international studies, such as the Third International Mathematics
and Science Study (TIMSS), Progress in International Reading Literacy Study
(PIRLS), Monitoring Learning Achievement (MLA) and Southern Africa
Consortium for Monitoring Educational Quality (SACMEQ). The international
studies, such as TIMSS and PIRLS, shed light on performance in reading and
mathematics and seem to encourage governments to address issues relating to
literacy, mathematics, and quality of education more broadly. International
initiatives, such as Education for All, have emphasised educational quality as a
main objective and highlighted the role that monitoring education can play in
determining the quality of education. By using a monitoring system that provides
valid and reliable information, important decisions on quality can be made. The
decisions on quality of education then have the potential to facilitate the design
and development of adequate intervention strategies. This research aims to
explore whether the Middle Years Information System (MidYIS), which was
developed in the United Kingdom, could be adapted and implemented for South
Africa. This research is linked to a research project initiated in the United
Kingdom in 1996 and a more recent one in South Africa since 2003 at the Centre
for Evaluation and Assessment, which is funded by the National Research
Foundation. The South African project takes place in collaboration with the
project originators, the Curriculum, Evaluation, and Management Centre at the
University of Durham in the United Kingdom.

2
1.1 Introduction
The challenge we have taken up is to ensure that we nurture a high
quality education system that is accountable, transparent, accessible,
and efficient. It is also to ensure that public education is a vehicle that
really does assist us in realising our dreams, that really does work to
free the potential in all of us (Asmal, 2001, p. 1).
The aim of this research is to investigate the feasibility of adapting an existing monitoring
system developed in the United Kingdom, to South Africa. The ultimate aim of the research is
to investigate whether the Middle Year Information System (MidYIS), developed by the
Curriculum, Evaluation and Management Centre (CEM) at the University of Durham, is a
valid and reliable monitoring system for South Africa. The project in South Africa is named
the South African Secondary School Information System (SASSIS) and the research
investigates to what extent the system can be used to monitor the quality of teaching and
learning at the beginning of the secondary school phase.
The challenge of any education system is to be able to provide quality education for
participants in the system and it is not surprising that, internationally, there has been a re-
emphasis on quality education. Two of the United Nations conferences, namely the Jomtien
Declaration, in 1990, and the Dakar Framework for Action, in 2000, have recognised that
quality in education is imperative if goals and objectives of developing countries are to be
met (UNESCO, 2005).
There is little consensus, however, on what quality education is, as the concept could be
understood differently by different stakeholders (Fitz-Gibbon, 1996). When asked to describe
quality, many would use the terms such as useful, good, efficient, or measuring up (Botha,
2002) rather than a descriptor that is generically understood and standardised. For the
purposes of this research, the quality of education is seen in definitive terms that require the
identification of aims and objectives and is based on the concept that the more education
realises these aims and objectives, the better the quality of education.
In 2003, the Centre for Evaluation and Assessment (CEA), at the University of Pretoria, in
collaboration with the Curriculum, Evaluation, and Management Centre (CEM), at the
University of Durham, embarked on a research project. The National Research Foundation, a
national funding body in South Africa, funded this project in order to investigate the possibility
of adapting existing monitoring systems established in the United Kingdom to the South
3
African context. The aim of adapting the monitoring systems is to provide information about
the quality of education that learners receive, and more specifically the extent of academic
gains made with the purpose to intervene timeously and effectively in the learners’
development.
The CEM Centre is a research centre in the United Kingdom and has developed a number of
monitoring systems for various stages of the United Kingdom’s schooling system, most
notably, Primary Indicators at Primary Schools (PIPS), The Middle Years Information System
(MidYIS), The Year 11 Information System (YELLIS) and, finally, The Advanced Level
Information System or Alis (CEM, 2002a). Of the several systems that could have been
investigated, the CEA selected PIPS, to be implemented at the beginning of primary school,
and MidYIS to be implemented at the beginning of the secondary school phase. PIPS and
MidYIS were chosen because of the lack of monitoring systems in South Africa that focused
specifically on the beginning of the primary and secondary school phases. The research
reported on here concentrates on the secondary school component that focuses on Grade 8,
which is the beginning of secondary school.
The MidYIS project was developed with the aim of providing schools with information on how
learners would perform at the end of Key Stage 3 and at the end of their General Certificate
Secondary Education (GCSE). Both Key Stage 3 and the GCSE are national assessments in
the United Kingdom. The MidYIS project predicts how learners would perform in Key Stage 3
and GCSE. The predictions are based on results obtained from a baseline assessment. In
order to provide schools with information on the future achievement of enrolled learners, the
CEM Centre developed assessments that could be used for prediction and monitoring
purposes as well as to work out the “value” the school has added to learners over a set
period. Specific details of the MidYIS are elaborated on later in Chapter 4.
Before continuing, however, the current research project needs to be placed in context; thus
a brief description of the South African context is appropriate (1.2). In this section, the
condition of schooling is discussed as well as education policies relevant to monitoring,
curriculum, and assessment issues. This will be followed by a discussion of the key concepts
(1.3) of this study, namely: quality, monitoring systems and value-added monitoring systems.
Thereafter, the problem this research aims to address is presented, including the general
research questions, which guide the research (1.4). The chapter concludes with the structure
of the dissertation (1.5).

4
1.2 South African education context
South Africa is located at the southern tip of the African continent and has a total land area of
more than 1.2 million square kilometres. Several countries border South Africa, namely:
Namibia, Botswana, Zimbabwe, Lesotho, Swaziland, and Mozambique. There are
approximately 46, 9 million people living in South Africa. South Africa is a multi-lingual
country, recognising eleven official languages, namely: Afrikaans, English, isiNdebele,
isiXhosa, isiZulu, Sepedi, Sesotho, Setswana, SiSwati, Tshivenda and Xitsonga
(International Marketing Council of South Africa, 2005). South Africa is divided into nine
provinces with the Eastern Cape, Northern Cape, and Western Cape in the west and south,
while the central region is known as the Free Sate. The Limpopo and North West Province
can be found to the north of the country while KwaZulu-Natal can be found to the east.
Gauteng and Mpumalanga are situated in the north-eastern region of the country. The largest
provincial population can be found in Kwa-Zulu Natal, followed by Gauteng, while the most
sparsely populated province is Northern Cape (International Marketing Council of South
Africa, 2005).
The democratic government elected in 1994 has embarked on a substantial reform effort in
many areas, including education (Howie, 2002). One of the key focus points was to make
education more accessible and equitable to all population groups. One of the first steps in
addressing the unequal education system was to focus on the allocation of funding and the
content taught. In the section to follow, the education system is discussed (1.2.1), and the
national curriculum (1.2.2) as well as the role that assessment plays in the curriculum (1.2.3)
is presented.
1.2.1 The South African education system
Twelve million learners are currently enrolled in approximately 29 000 public schools
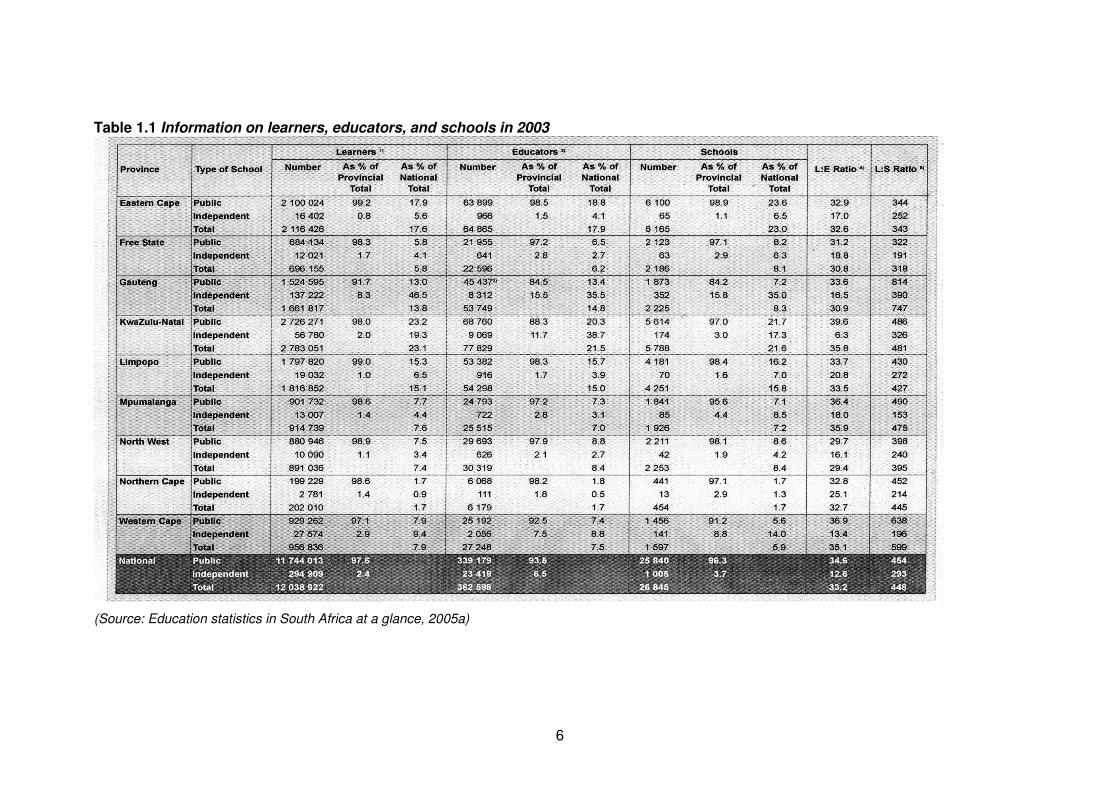
throughout the country (Garson, 2005). Twenty-four percent of schools can be found in
Eastern Cape, while a further 22% and 16% are located in Kwa-Zulu Natal and Limpopo
respectively (see Table 1.1 for more detail). The structure of school education in South Africa
comprises three bands. The first band is the General Education and Training (GET) Band
that encompasses compulsory education. Compulsory education comprises Grade R, which
is the reception year, as well as Grade 1 - Grade 9. The General Education and Training
Band is divided into three phases: the Foundation Phase, which comprises Grade 1-3, the
Intermediate Phase (Grade 4-6) and the Senior Phase, which comprises Grade 7-9 (South
Africa Yearbook, 2003). The second band is the Further Education and Training (FET) Band
5
encompasses Grade 10 – 12, while the third band is called Higher Education and Training
(HET), which includes all tertiary education (South Africa Yearbook, 2003).
Currently, illiteracy rates in South Africa are approximately 30% of the adult population (an
adult is defined as a person who is over 15 years of age). It is estimated that 6-8 million
adults are not functionally literate (Garson, 2005). The net enrolment ratio for 2002 was 66%.
In 2000, of the learners who completed primary school, only 93% progressed to secondary
school (World Bank Education Profile, 2002). Furthermore, the largest percentage of learners
enrolled in 2003 as a portion of the national enrolments were found in Kwa-Zulu Natal (23%)
while the smallest percentage of learners were enrolled in the Northern Cape, with 2% of the
national enrolments (see Table 1.1 for details).
6
Table 1.1 Information on learners, educators, and schools in 2003
(Source: Education statistics in South Africa at a glance, 2005a)
7
The main challenge for South African education in recent years has been to address access,
equity, and quality. The apartheid system left the country with marked inequalities along
racial lines. International studies, such as SACMEQ and MLA, have alluded to this, revealing
marked underperformance of South African learners compared with other countries in the
southern and eastern region of Africa (UNESCO, 2005).
Conditions in many South African schools are extremely poor and there are substantial
disparities between schools because of the apartheid legacy (Howie, 2003). The vast
backlogs created by the educational policies of the apartheid government, in conjunction with
modest economic growth, have prevented extensive transformation of schools that serve
historically disadvantaged groups. These deep inequalities and conditions of deprivation
were highlighted in a comprehensive National Study of School Needs (Lemon, 2004). The
School Register of Needs Survey (2000) established that approximately 16.6% of learners
were without toilet facilities. In addition, 28% of schools surveyed did not have access to
water, while only 57.1% of schools had access to electricity. Thirty-five point five percent of
the schools reported that they had no access to any form of telecommunication, not even a
telephone (National Department of Education, 2001). Moreover, there was insufficient
funding to rebuild schools, renovate buildings as well as to supply learning materials and
teaching aids in time for use (Lethoko, Heystek & Maree, 2001). Learning materials in some
schools were scarce, with up to five learners sharing a book. In addition, although the School
Register of Needs found that, on average, the learner to teacher ratio was 32:1, in some rural
areas, this figure was tripled, with a learner to teacher ratio of 90:1 (Buthelezi, 2003).
The fact remains that schools are situated in different contexts and are faced with many
challenges; however, South Africa is a country with “natural wealth and many cultures”
(Howie, 2002, p.9). It is also notorious, as mentioned earlier, for the apartheid policies that
have left a lasting impression on the education system in the country. Evidence of this lies in
the appalling conditions in many schools across the country as described above. It is of
significance to note that these conditions exist primarily in previously designated African,
Coloured and Indian schools. Prior to 1994, South Africa had nineteen different Departments
of Education. These were separated by race, geography and ideology (National Curriculum
Statement, 2002). The curriculum played a powerful role in reinforcing inequality, by dictating
what children were taught, how children were taught and, even, whether children were taught
at all. The situation was exacerbated by the philosophy that different population groups were
to be taught differently according to the roles they were expected to play in society (National
Curriculum Statement, 2002). South Africa has attempted to address the issue of inequality,
since the first democratic elections in 1994 (Howie, 2002).
8
1.2.2 National revised curriculum statement
Policy, as well as curriculum change in post-apartheid South Africa started immediately after
the election in 1994. Changes to the curriculum included a process of syllabus revision and
subject rationalisation: laying the foundations for a single national core syllabus. The national
curriculum for Grades R-9 was first published in October 1997, and was introduced into
schools in 1998. The new curriculum was named Curriculum 2005 to indicate the year in
which the curriculum should be fully implemented. Outcomes-based education (OBE) forms
the core of the new curriculum.
OBE is an educational model that originated in the United States of America (The Chalk
Face, 1999). The model was developed in response to the view that traditional education
systems were not ‘producing’ citizens with the skills, values, and knowledge that were
needed to participate in the changing world of work (JUTA, 2003). At the heart of OBE are
three basic premises (Killen, 2002, p. 3):
1) All learners can learn as well as succeed; but the rate at which they do this is not
necessarily the same for everyone or even performed in the same way;
2) Success in learning promotes success in learning;
3) Schools, as well as educators, can control the conditions that will determine whether
learners are successful.
In South Africa, OBE has elements of the economic accountability features of OBE systems
in other countries (e.g. the United States, United Kingdom, Australia, and New Zealand). In
addition to incorporating accountability features, the system, as implemented in South Africa,
differs slightly in other ways (Botha, 2002). In South Africa there is an emphasis on the
transformation process, where equity in education, access to education, redress, and quality
assurance are highlighted (Botha, 2002). In the South African context, OBE is an attempt to
reform educational practices so that learners become better prepared to cope with life’s
demands and changing circumstances. In this context, learners are not merely required to
acquire knowledge, but also be able to demonstrate skills and to display values (Kotzé,
2002).
The National Department of Education (1998, p. 9) views OBE as “a learner centred, result-
oriented approach to education and training that builds on the notion that all learners need to
and can achieve their full potential, but notes that this may not happen in the same way or
within the same period”. For the National Department of Education, this implies that what the
learner needs to learn is clearly defined, that progress is determined by demonstrated
9
achievement and that each learner’s needs are accommodated by using multiple strategies
and assessment tools. In addition, each learner is provided with the time and assistance
needed in order to realise his or her potential. Killen (2002, p. 16-17) elaborates on the
National Department of Education’s view stating that OBE should be developed around
certain principles that would serve to guide the design, the delivery and the documentation,
as well as the decision-making process that occurs. These principles include the premise
that:
� The outcomes-based programme must have a clear focus on learning outcomes that
are stated clearly;
� These outcomes are what learners should know and be able to demonstrate, should
be practical and useful;
� Curriculum and instructional design is ‘derived’ from the most significant outcomes;
� The outcomes should be challenging and achievable, in order to motivate students to
progress to a higher performance level;
� Time should be used as a flexible resource that allows educators to accommodate
learner differences;
� Students should be given more than one chance to receive instruction and to
demonstrate their learning;
� Assessment should be an integral component of instruction and, ideally, should use
real-world situations to assess application of knowledge and skills;
� Learners should take responsibility for their learning.
In 2000, a Ministerial Committee reviewed Curriculum 2005 and its implementation. The
review included the structure and design of the curriculum, educator orientation, training and
development, learning support materials, provincial support to educators in schools and
implementation timeframes (National Curriculum Statement, 2002). The main findings of the
review were that there was support for the change in curriculum but that the understanding of
the new curriculum and its implications varied. In addition, the review found that there were
basic flaws in the structure and design of the curriculum. The language used in the new
curriculum was often complex and confusing. Moreover, there was a lack of alignment
between the curriculum and the assessment policies. However, the lack of alignment could
be traced back to inadequate training, especially in the early implementation process (Howie,
2003). The result of the review process was the revision of the curriculum.
In the Revised National Curriculum Statement (RNCS), both learning outcomes and
assessment standards were designed using the critical and developmental outcomes as a
starting point. Here a learning outcome refers to everything that has to be learnt and the term

10
assessment standard refers to the level at which learners should demonstrate that the
outcome has been achieved (Kotze, 2004). The critical and developmental outcomes
describe the kind of citizen the education and training system should ideally create. A critical
outcome refers to broad, generic cross-curricular statements and could be compared to
culminating outcomes or real-life roles that everybody should attain. Developmental
outcomes, on the other hand, contribute to the personal, social and economic development
of the learner and could be likened to discrete outcomes and information that is ‘’nice to know
but not essential” to know (du Toit & du Toit, 2004, p. 15).
The revised national curriculum comprises eight learning areas. Each learning area is viewed
as a field of knowledge, skills, and values. It is unique in itself but also has links with other
learning areas and consists of learning outcomes that are derived from both the critical and
the developmental outcomes (National Department of Education, 2002a).
1) Language learning area: during the Foundation Phase, 40% of time is allocated to the
language learning area while 25% of time is allocated in the Intermediate and Senior
Phases. Learners are expected to be proficient in at least two official languages and
to be able to communicate in other languages. This learning area encompasses six
(6) learning outcomes (National Department of Education, 2002a):
� Listening, this focuses on listening for information and enjoyment and the ability
to respond appropriately.
� Speaking, in which the learner is expected to communicate confidently and
effectively.
� Reading and viewing, which entails reading and viewing information and
responding critically.
� Writing, in which learners are expected to be able to write different kinds of
factual and imaginative texts.
� Thinking and reasoning, where the learner is enabled to use language to think
and reason and to access, process, and use information for learning purposes.
� Language structure and use emphasises the sounds, words, and grammar of
language.
2) Mathematics learning area. Thirty-five percent of learners’ learning time is allocated to
mathematics in the Foundation Phase while 18% is allocated in the Intermediate and
Senior Phases. Five Outcomes are included in the mathematics learning area
(National Department of Education, 2002a):
� Numbers, operations and relationships where the learner is expected to be able
to recognise, describe and represent numbers. In addition, learners are
11
expected to recognize relationships between numbers and to count, estimate
and calculate with the aim to solve problems.
� Patterns, functions, and algebra. In this Outcome, learners are exposed to
algebraic language and taught the skills to solve algebraic problems.
� Space and shape, where learners are expected to describe and represent 2-D
and 3-D objects in a variety of orientations.
� Measurement that entails the use of appropriate measuring units, instruments,
and formulae.
� Data handling where learners are exposed to collecting, summarizing,
displaying and critically analysing data in order to make inferences and draw
conclusions.
3) Natural sciences is the third learning area. Thirteen percent of learning time is
allocated to this learning area for both the Intermediate and Senior Phases. Three
outcomes are included in the natural sciences learning area (National Department of
Education, 2002a):
� Scientific investigations in which learners investigate relationships and solve
problems in science, technology and in environmental contexts.
� Constructing scientific knowledge. Here learners are expected to know, to
interpret, and to apply scientific, technological, and environmental knowledge.
� Science, society and the environment in which learners are expected to
demonstrate understanding of the interrelationships between science,
technology, the environment, and society.
4) Social sciences learning area is allocated thirteen percent of learning time. This
learning area comprises of two components, namely geography and history, each
with three learning outcomes (National Department of Education, 2002a).
The outcomes of the history component are:
� Historical enquiry
� Historical knowledge
� Understanding and historical interpretation.
The outcomes of the geography component are:
� Geographical enquiry
� Geographical knowledge
� The understanding as well as the exploring of issues
5) Arts and culture learning area is allocated eight percent of learning time. Four learning
outcomes are included in this learning area (National Department of Education,
2002a), namely:
� Creating, interpreting and presenting

12
� Reflecting
� Participating and collaborating
� Expressing and communicating
6) Life orientation comprises five learning outcomes and totals 8% of teaching and
learning time for the Intermediate and Senior Phases. The five outcomes are
(National Department of Education, 2002a):
� Health promotion
� Social development
� Personality development
� Physical development and movement
� Orientation to the world of work
7) Economic and management sciences has four learning outcomes and totals 8% of
teaching and learning time for the Intermediate and Senior Phases The four learning
outcomes are (National Department of Education, 2002a):
� Knowledge and understanding of the economic cycle
� Understanding of sustainable growth and development
� Managerial, consumer and financial knowledge as well as skills
� Entrepreneurial knowledge and skills
8) Technology learning area is allocated eight percent learning time in the Intermediate
and Senior Phases. Its three learning outcomes are (National Department of
Education, 2002a):
� Technological processes and skills
� Technological knowledge and understanding
� Technology, society and environment
Curriculum objectives require mechanisms to determine whether implementation is
successful. Assessment is one of the mechanisms used for this purpose. It is an essential
element of OBE and an integral part of the teaching and learning process (Siebörger &
Macintosh, 2004). Furthermore, learners do not necessarily learn what is expected of them
but rather, as du Toit and du Toit (2004, p. 24) phrase it, “learn what is inspected”. Learning
is expected to improve when continuous, transparent, and valid assessment forms part of the
learning programme (du Toit & du Toit, 2004).
1.2.3 Assessment policies
Assessment is a fundamental part of OBE and is the mechanism used to demonstrate the
achievement of predetermined outcomes (Killen, 2002). Assessment is seen as the process

13
of collecting, synthesising, and interpreting information about learners’ achievement (Gay &
Airasian, 2003). Furthermore, assessment needs to be developed with a clear sense of
curricular purpose and analysis, including what assessment will be undertaken, by whom it
will be undertaken and how the assessment will be marked (Reddy, 2004). Four distinct steps
can be identified in this process (GDE Circular, 2002, p. l3):
1) Generating and collecting evidence of achievement;
2) Evaluating this evidence against outcomes;
3) Recording the findings of the evaluation ;
4) Using the information to assist the learner in his/her development and to improve the
process of teaching and learning.
Moreover, assessment is undertaken in order to monitor learner progress so that decisions
can be made about how to best facilitate further learning (GDE Circular, 2002). Decisions
have to be made about what to teach, how to teach, how long to teach, whether learners
should be grouped, what questions to ask, (and how these questions should be asked) and
what activities should be included (McMillian, 2001) so that educators can (National
Department of Education, 1996):
i. Determine whether learning required for the achievement of specific outcomes is
taking place and what difficulties are experienced.
ii. Report to parents and other role-players and stakeholders on the levels of
achievement during the learning process and to build a profile of achievement.
iii. Provide the necessary information for the evaluation and review of learning
programmes.
iv. Maximise learners’ access to knowledge, their skills, attitudes, and values as defined
by the curriculum statements (National Department of Education, 1996).
In the OBE system, adopted by the South African government, continuous assessment
(CASS) is used, as it enables educators to use any planned learning experience to assess
learner achievement and progress. Continuous assessment is the process of gathering valid
and reliable information about learner performance on an ongoing basis and measuring it
against clearly defined criteria (GDE Circular, 2002). In addition, CASS takes place over a
period in which learner growth and development is supported. CASS allows for integrated
assessment in which a variety of assessment strategies is used and it allows for feedback as
an integral mechanism for learning (National Department of Education, 2002). The continuous
assessment model that is promoted by the South African government makes use of five
different types of assessment and may use several different strategies to obtain the
necessary information (National Department of Education, 1998):
14
� Baseline assessment is undertaken at the beginning of a new set of activities in
order to ascertain what learners already know and what they can demonstrate.
� Formative assessment involves a developmental approach and is specifically
designed to monitor and to improve the learning progress. Positive achievement of
the learner is recognised and discussed and appropriate further steps are
considered. This assessment highlights a particular child's strengths and needs
while information gained from formative assessment can be used when discussing
and devising the next steps in that child’s development.
� Diagnostic assessment focuses on ascertaining the nature and cause of a learning
difficulty in order to provide the appropriate remedial help and guidance. Diagnostic
assessment identifies a pupil's underlying strengths and needs in a particular area.
Such an assessment may be able to explain why a child is experiencing a specific
learning difficulty and can help teachers to evaluate the severity of the problem
while providing information to help future teaching programmes.
� Summative assessment focuses on grading and certification, making use of a series
of assessment activities and results in an overall report of the learner’s
performance. Summative assessment usually occurs at the end of a scheme of
work or phase of education
� Systemic evaluation is used to evaluate the appropriateness of the education
system and involves the monitoring of learners’ attainment at regular intervals
making use of instruments designed provincially and nationally. Systemic evaluation
plays an integral part in ensuring that learners obtain the maximum benefit from the
education system. In South Africa, this assessment takes place at the Grade 3, 6
and 9 levels. The main objective of the systemic evaluation is to assess the
effectiveness of the system as well as the extent to which the goals of educational
transformation have been achieved. Systemic evaluation is intended to monitor the
national standards and the quality of education.
One of the biggest paradigm shifts that educators had to make is using assessment in
different ways and for different purposes. The curriculum used during the apartheid years
was prescriptive, content heavy, detailed and authoritarian in nature, heavily dependent
on textbooks and rote-learning (Howie, 2003). As a result, thinking about assessment had
to change from a more traditional orientation to an authentic assessment orientation. Here
authentic assessment refers to the learners demonstrating the application knowledge and
skills to real-life tasks (McMillan, 2001). The shift between traditional assessment and
authentic assessment is presented in Table 1.2.
15
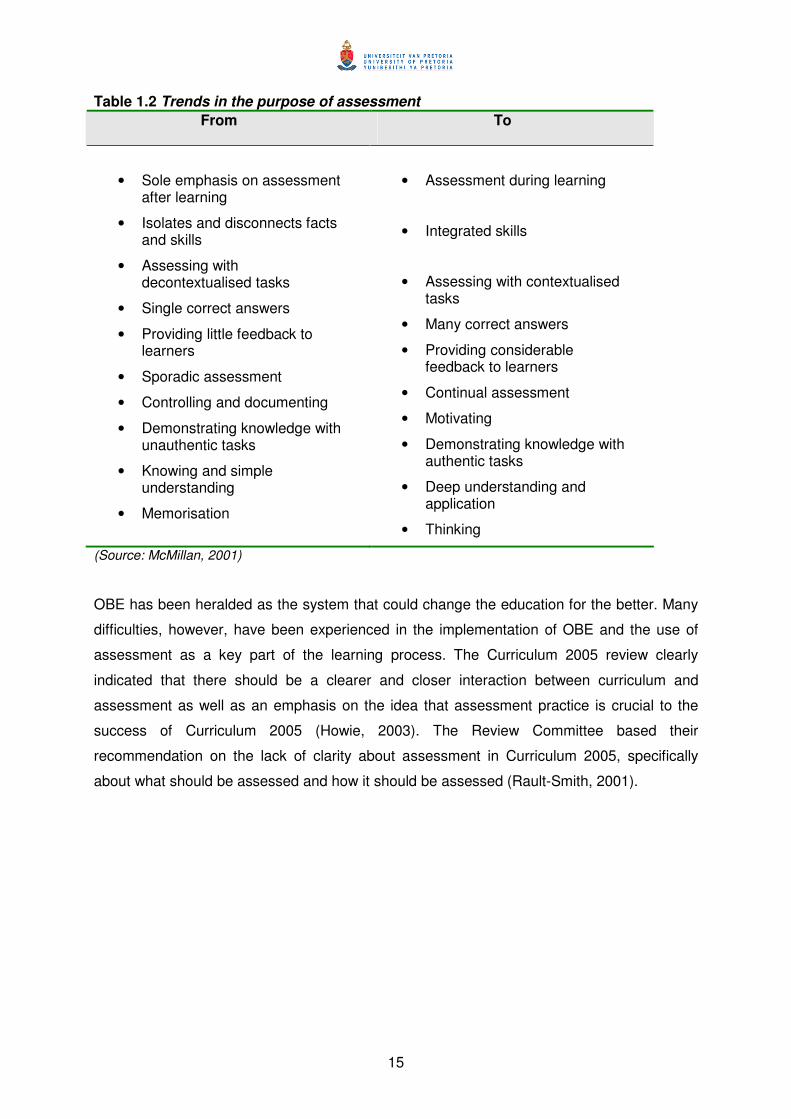
Table 1.2 Trends in the purpose of assessment
From To
• Sole emphasis on assessment after learning
• Isolates and disconnects facts and skills
• Assessing with decontextualised tasks
• Single correct answers
• Providing little feedback to learners
• Sporadic assessment
• Controlling and documenting
• Demonstrating knowledge with unauthentic tasks
• Knowing and simple understanding
• Memorisation
• Assessment during learning
• Integrated skills
• Assessing with contextualised tasks
• Many correct answers
• Providing considerable feedback to learners
• Continual assessment
• Motivating
• Demonstrating knowledge with authentic tasks
• Deep understanding and application
• Thinking
(Source: McMillan, 2001)
OBE has been heralded as the system that could change the education for the better. Many
difficulties, however, have been experienced in the implementation of OBE and the use of
assessment as a key part of the learning process. The Curriculum 2005 review clearly
indicated that there should be a clearer and closer interaction between curriculum and
assessment as well as an emphasis on the idea that assessment practice is crucial to the
success of Curriculum 2005 (Howie, 2003). The Review Committee based their
recommendation on the lack of clarity about assessment in Curriculum 2005, specifically
about what should be assessed and how it should be assessed (Rault-Smith, 2001).
16
1.3 Key concepts
As this study addresses the issue of monitoring education, it is important that key concepts
associated with monitoring be discussed. In the section to follow, the concept of quality in
education (1.3.1) and monitoring (1.3.2), as well as the use of value-added approaches
(1.3.3), are elaborated on. These concepts are discussed in more detail in Chapter 2, which
comprises a review of the relevant literature. The concepts of quality and monitoring are
interrelated and one could view monitoring as a vehicle on the road to ensure quality.
Monitoring is the cornerstone of this research. Although monitoring can take place at various
levels of the education system, e.g. at a national-level, a provincial-level or at the school-
level, for the purposes of this research, only the learner, classroom and school-level will be
addressed.
1.3.1 Quality in education
The current research takes place against the backdrop of the monitoring of education in
order to ascertain the quality of teaching and learning. Educational quality can be thought of
in the following terms:
� Schools being able to transform system-inputs into system-outputs (OECD, 2005).
� The functioning of education and the relevance of educational objectives
(Scheerens, Glas & Thomas, 2003)
� The fairness of educational resource distribution and the economic use of these
resources (Scheerens et al., 2003)
� What learners learn, not only in terms of knowledge but also in terms of skills that
have been mastered (van der Werf, Brandsma, Cremers-van Wees & Lubbers,
1999).
� The value of the certificate learners receive after schooling (van der Werf,
Brandsma et al., 1999).
The National Qualifications Framework (NQF), in South Africa, defines “quality education”
and how “quality education” can be measured. Quality is measured against NQF
specifications and is monitored to ascertain whether quality has been maintained or whether
progress has been made with regard to the prescribed specifications. This monitoring
process should lead to decision-making and improvement strategies (Gawe & Heyns, 2004).
There may be debate about what quality education entails, but it would appear that there is
common ground. Implicit in the concept of quality education is the idea that there are certain
17
aims and objectives that should be achieved, and the more education realises these aims
and objectives, the better the quality becomes. Thus quality refers to the adequacy and
appropriateness of aims and objectives that often imply a scale, so that quality can be
assessed as being good or poor (Kellaghan & Greaney, 2001). For the purposes of this
research, quality is seen in terms of whether the aims and objectives identified are being
realised. The more education realises these aims and objectives the better the quality of the
education. Once the aims and objectives have been identified, a process of evaluation or
monitoring takes place in order to ascertain which aims and objectives should have been met
and which aims and objectives have actually been met (Scheerens et al., 2003).
1.3.2 Monitoring in education
School success has often been thought of in terms of achievement. Emphasis has also been
placed on the tools used to monitor the progress of learners in order to ensure achievement
(Safer & Fleischman, 2005). School success, however, is not merely achievement and the
concept of monitoring needs to be defined. At present, there is little agreement in literature
on the definition of monitoring (Sammons, 1999). Even though there is little agreement on
what the concept means, monitoring is constantly mentioned in school effectiveness
research (SER) and is often linked to the achievement of learners (Scheerens et al., 2003, p.
14) “…frequent monitoring and evaluation of students’ progress stand out as a factor that is
consistently mentioned in research reviews as a correlate of educational achievement.” In
this section, the concept of monitoring in education will be elaborated on as well as the
reasons for the importance of monitoring and how monitoring can be applied.
Scheerens et al. (2003) are of the opinion that monitoring can be defined as a systematic
gathering of information in order to make judgments about the effectiveness of schooling.
Furthermore, monitoring stresses ongoing gathering of information as a basis for making
decisions with the purpose to improve learning. Raffan and Ruthen (2003) further elaborate
on the gathering of information by linking the activity to learning and observing learning, in
terms of difficulties experienced and progress made. The monitoring system utilised and
envisaged in this research concentrates on the learner at the classroom-level, but is also
situated at the school-level as a monitoring system for governance and management bodies.
Monitoring is important, as it provides mechanisms for formally regulating the desired level of
quality (Scheerens et al., 2003). It is seen as a tool that focuses learners, educators and the
principal on set goals (Sammons, 1999). Monitoring of learners also has the potential to
inform planning, teaching and assessment, but, most importantly, monitoring sends the
18
message that the educator and the school are interested in the learner and in the progress
being made (Sammons, 1999). Lockheed and Murphy (1996) concur by stating that
monitoring is vital to the learning process and assists children who are not performing to
reach their potential. Monitoring assesses achievement trends over time (Lockheed, 1996)
and in the words of Hager and Slocum (2005, p. 58) in “a system for ongoing progress,
monitoring is critical to ensure the student is continually moving toward mastery”. For the
purpose of this research, monitoring is seen as gathering relevant information about learner
performance, at various stages, in order to ascertain whether academic gains have been
made and to identify strategies where necessary.
Monitoring can be formal or informal and can therefore take various forms (Sammons, 1999).
In its formal context, monitoring could refer to learner monitoring systems, by which is meant
a set of educational achievement tests that help to identify not only learners who have fallen
behind, but also the subject matter or skills in which difficulties are experienced. Alternatively,
there is informal monitoring which can take the form of assessment-based self-evaluation in
which performance is evaluated either internally or externally (Scheerens et al., 2003).
Regardless of which form of monitoring is applied, certain tools are required to track progress
(Lockheed, 1996). Many assessments have been designed and developed to monitor learner
progress. Scheerens (2001) is of the opinion that factors that have received support in
international school effectiveness literature, such as leadership or feedback and
reinforcement, should be used as a basis for the selection of indicators for monitoring
purposes in developing countries. One could argue that the factors identified in international
school effectiveness literature could be adapted to serve as measurement criteria that would
be appropriate in the intended context.
The current research aims to adapt an existing monitoring system for Grade 8, i.e. the
beginning of secondary school. Various contextual factors are taken into account in order to
interpret the gathered information (see Chapters 2 and 3 where these factors are presented
and discussed). In addition, the current research can be classified as a learner monitoring
system because the learner and the classroom-level are the primary focus, but, for the
purposes of this research, contextual information is also gathered at the school-level.
19
1.3.3 Value-added assessment as a monitoring mechanism
Value-added assessment is not a new type of assessment (School Directors Handbook,
2003). Rather, it refers to a model in which academic gains made by learners are
investigated and thus fulfils a monitoring function (refer to Chapter 2 where models of value-
added assessment are presented). This model specifically uses statistical analysis to
determine the effects of educators and schools on learning (School Directors Handbook,
2003). As such, the model can be viewed in terms of different levels, namely the individual
learner-level, between the learner or classroom-level and the school-level.
On the learner-level, the primary meaning of value-added assessment is the contribution that
the school makes to the learner and the relative progress that learners make in comparison
to their past progress as well as to other learners for monitoring purposes (Tymms, 2000).
Value-added assessments can also be used in order to monitor schools by taking the
difference in the learner populations of the schools into account (Harker, 2003). This is done
by isolating the factors possibly tied to learners’ achievement, such as gender, ethnic group,
date of birth, level of special education needs and socially disadvantaged backgrounds
(Saunders, 2002) in order to determine the value that the school has added to learner growth
(academic gains) from one point in time to another. Schools that are similar in nature (size,
resources and learner population) can be compared with one another in order to monitor
progress made by learners.
To be able to investigate academic gains, it is necessary not only to assess learners’
performance at certain points in their development but also to measure the progress of a
larger population in order to determine whether the learner did better or worse than might be
expected (McDouall, 1998). Therefore, value-added assessments can be thought of in terms
of a pre-post test assessment framework, in which the relationship between scores is
compared in order to establish whether the learner is advancing and at what pace (School
Directors Handbook, 2003). Value-added assessments also provide sophisticated ways of
analysing potential school effects (Mortimore & Sammons, 1994).
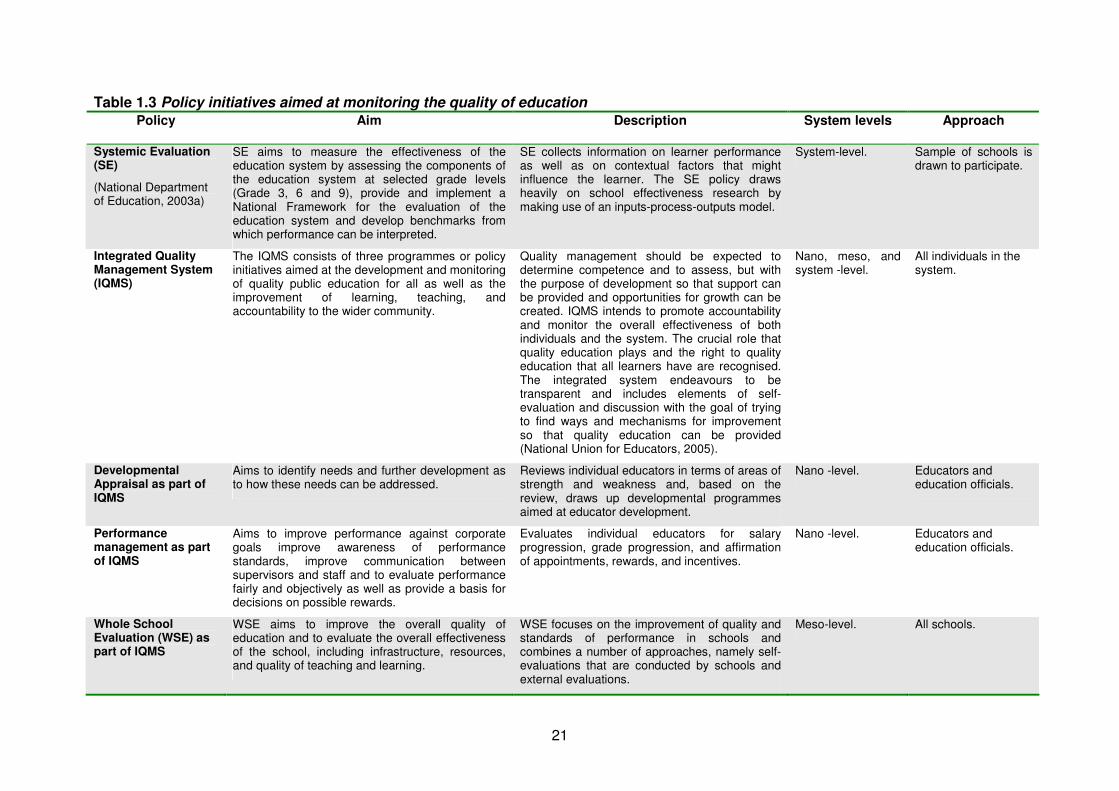
1.4 Policies on monitoring quality in education
Three South African government initiatives in the monitoring of education, directed toward
the establishment of systems with which to ascertain the level of quality in the education
system, will be discussed in this section. They are Systemic Evaluation, the Integrated

20
Quality Management System, and Whole School Evaluation. In the words of NAPTOSA
(2006, p.1), an education union:
An improvement in the quality of provision of education to redress the inequalities of the
past in South Africa is probably the most crucial element of a truly transformatory agenda.
An improvement in quality lies at the heart of the vision for education and must inform all
our decisions about policy development, how policy is implemented, and how we measure
our successes or failures.
The three policy initiatives discussed were developed at different times. For example, the
policy on Whole School Evaluation (WSE) and Systemic Evaluation (SE) was established
before the Integrated Quality Management System (IQMS). As a result of challenges
encountered with the implementation of the Whole School Evaluation policy, other avenues
had to be sourced and the policy on Whole School Evaluation was subsumed under the
Integrated Quality Management System. The policy initiatives for monitoring the quality of
education are summarised in Table 1.3. The table provides information pertaining to the aim
of the policy and provides a brief description of the policy. Whether the policy is focused on a
system or national-level, meso or school-level, micro or classroom-level and finally the nano
or individual/personal-level is indicated. Finally, the approach to the policy is also provided.
21
Table 1.3 Policy initiatives aimed at monitoring the quality of education Policy Aim Description System levels Approach
Systemic Evaluation (SE)
(National Department of Education, 2003a)
SE aims to measure the effectiveness of the education system by assessing the components of the education system at selected grade levels (Grade 3, 6 and 9), provide and implement a National Framework for the evaluation of the education system and develop benchmarks from which performance can be interpreted.
SE collects information on learner performance as well as on contextual factors that might influence the learner. The SE policy draws heavily on school effectiveness research by making use of an inputs-process-outputs model.
System-level. Sample of schools is drawn to participate.
Integrated Quality Management System (IQMS)
The IQMS consists of three programmes or policy initiatives aimed at the development and monitoring of quality public education for all as well as the improvement of learning, teaching, and accountability to the wider community.
Quality management should be expected to determine competence and to assess, but with the purpose of development so that support can be provided and opportunities for growth can be created. IQMS intends to promote accountability and monitor the overall effectiveness of both individuals and the system. The crucial role that quality education plays and the right to quality education that all learners have are recognised. The integrated system endeavours to be transparent and includes elements of self-evaluation and discussion with the goal of trying to find ways and mechanisms for improvement so that quality education can be provided (National Union for Educators, 2005).
Nano, meso, and system -level.
All individuals in the system.
Developmental Appraisal as part of IQMS
Aims to identify needs and further development as to how these needs can be addressed.
Reviews individual educators in terms of areas of strength and weakness and, based on the review, draws up developmental programmes aimed at educator development.
Nano -level. Educators and education officials.
Performance management as part of IQMS
Aims to improve performance against corporate goals improve awareness of performance standards, improve communication between supervisors and staff and to evaluate performance fairly and objectively as well as provide a basis for decisions on possible rewards.
Evaluates individual educators for salary progression, grade progression, and affirmation of appointments, rewards, and incentives.
Nano -level. Educators and education officials.
Whole School Evaluation (WSE) as part of IQMS
WSE aims to improve the overall quality of education and to evaluate the overall effectiveness of the school, including infrastructure, resources, and quality of teaching and learning.
WSE focuses on the improvement of quality and standards of performance in schools and combines a number of approaches, namely self-evaluations that are conducted by schools and external evaluations.
Meso-level. All schools.

22
The policies described are in various stages of development. Systemic Evaluation has taken
place at Grade 3 and Grade 6, in 2001 and 2004, respectively. Systemic Evaluation has not
yet, however, been implemented on the Grade 9 level. The Integrated Quality Management
System as well as Whole School Evaluation are still in infancy and, as such, need to be
refined, streamlined and, possibly, simplified in order to make implementation possible
(NAPTOSA, 2006).
However, the implementation of these policies has not been without challenges. At the
launch of the Foundation Phase Systemic Evaluation, Kader Asmal (2003), the Minister of
Education at the time, was open about the challenges experienced during the implementation
of policy, however, he added that ways should be found to address these limitations and that
was where research could play an important role. The implementation of the policy for Whole
School Evaluation was difficult as key stakeholders viewed this policy with suspicion - see
Jansen (2004, p. 60) who states, “…the WSE policy has not yet taken off because of
contestations between teacher unions and the government as the driver of this policy”. The
opposition to Whole School Evaluation policy was based on the view that the policy was
imposed from top down and was punitive in nature rather than developmental in nature as
had been proposed. Furthermore, there was a lack of understanding as to what the policy
entailed and how schools should go about implementing the policy (Jansen, 2004).
Clearly the policies needed to be evaluated. According to the Plan of Action: Improving the
Access to Free and Quality Basic Education (2003b), the monitoring and evaluation
framework of the Department of Education went into a review process (National Department
of Education, 2003b). The reason for the review was that current structures did not
adequately cover learner performance and the performance of the school in general. It is the
Department’s contention that an effective system and a well-managed school contribute to
learner performance and should therefore be focused on.
The Department of Education then introduced the Integrated Quality Management System
which has paved the way for the improvement of quality teaching and learning (Pampallis,
2004). In response to the National Councils of Provinces (2005), the current Minister of
Education, Naledi Pandor, states that two key initiatives are already providing valuable data
on the quality of education, namely the Integrated Quality Management System and
Systemic Evaluation.
23
1.5 Research problem in context
Both initiatives, Integrated Quality Management System and Systemic Evaluation, mentioned
by Minister Pandor are not yet adequately defined for use in secondary schools. Systemic
Evaluation has taken place at the Grade 3 level, in 2001, and the Grade 6 level, in 2004, but
has not yet been implemented in Grade 9. Furthermore, secondary schools need valid and
reliable information from primary schools so they can attune and structure their learning
programmes. The information, which is needed, could be provided in learner profiles but
these are often missing or incomplete on arrival at secondary schools.
In addition, due to the lack of an adequate monitoring system for secondary schools, schools
and educators lack baseline information from which to work and the pressures associated
with the Whole School Evaluation component of the Integrated Quality Management System
are still a reality. At the heart of the Whole School Evaluation, process is the concept of self-
evaluation, not only in terms of learner performance but also in terms of other key areas such
as management and classroom practice. At the beginning of 2007, the way in which this
evaluation should take place has not been clarified.
This PhD research explores the Middle Years Information System (MidYIS) as a possible
monitoring system for the South African context for use in secondary schools particularly.
The appeal of the MidYIS project lies in the fact that the system attempts to ascertain the
relative contribution the school has made to learners’ learning by using a value-added
approach. The MidYIS project has also been established in other countries such as New
Zealand and Hong Kong. This poses the question that, if the MidYIS project is applied in
other countries with success, then would such a system not be of value in the context of
South Africa and, if so, under what conditions? Furthermore, the MidYIS project makes use
of a “developed abilities” assessment and not an assessment that is purely curriculum-based.
Developed abilities are the common ground between intelligence, aptitude, and achievement
and reflect the effects of experience and learning (Reschly, 1990). Even though the
assessment is not strictly curriculum-based, however, researchers in the United Kingdom
have shown that there is a link between performance on the MidYIS assessment and that of
school subjects, as will be shown in Chapters 2 and 4 of the dissertation. Even though the
assessment is not curriculum-based and is an abilities assessment, it can be used to draw
inferences based on the curriculum. This has added appeal for South Africa as resources
and the implementation of the curriculum in addition to knowledge of the abilities of learners
entering secondary school vary greatly among schools in different areas. Such a system
could be of great value not only to schools and educators, but also to districts. By means of
24
focusing on Grade 8, on entry to secondary school, valuable information about the level of
learner ability is provided which educators, schools, districts, and provinces can then use for
monitoring purposes and to provide clues as to what intervention strategies need to be
developed. Furthermore, subsequent performance can be compared with the baseline
information to ascertain academic gain.
As a result of the vast disparities and variation among schools, additional information on the
school and classroom-level, which would shed light on performance, has to be part of the
monitoring system for South Africa. MidYIS focuses exclusively on the learner-level and does
not make provision for collecting information on a classroom and school-level (see Chapter 4
for further elaboration). If performance, or rather, lack of performance, is to be investigated
as part of the monitoring system, then additional information is necessary. Additional
information on school, classroom, and learner-level will assist in the identification of key
factors that could play a role in the performance of learners. Furthermore, schools that are
similar in nature could be grouped and comparisons between like schools would be possible.
This would give a more balanced view of learner performance and indeed the school’s
contribution to learner performance.
This research focuses specifically on how the instruments, a learner assessment and learner
questionnaire, developed in the MidYIS project, can best be adapted for the South African
context to obtain information about learner performance. Moreover, the type of system
proposed aims to monitor the quality of teaching and learning at the learner, classroom, and
school-level by means of including additional contextual information on the various levels. It
is believed that the assessment used in MidYIS and contextualised for South Africa, in
addition to the contextual indicators, will provide information that can be used by schools.
The information could provide a base from which to evaluate the value the school has added
to the learners’ learning and identify potential problem areas. In order to achieve the aim of
investigating MidYIS as a monitoring system that is feasible for South Africa, a number of
research questions have been identified.
The first main research question identified for this research is how appropriate is the
Middle Years Information System (MidYIS) as a monitoring system in the South African
context?
25
The first main research question comprises the following specific questions:
1.1 How does the Middle Years Information System (MidYIS) compare with other
monitoring systems?
1.2 How valid and reliable are the data generated by the MidYIS monitoring system for
South Africa?
1.3 What adaptations are needed to transform MidYIS into SASSIS, a monitoring system
for the South African context?
MidYIS uses a developed abilities assessment to gather information. However, ability is only
one factor in academic success and thus ability can only account for so much variance in
terms of performance. Kline (1993) is of the opinion that a moderate, but significant,
correlation of 0.3 or 0.4 is sufficient for the ability-academic relationship, but cautions that
there are other factors that could have an effect on performance. If it could be established
that the instruments are valid and reliable and that there is a link between MidYIS and school
subjects, then what other factors need to be considered when interpreting performance? It
could be argued, based on literature (Mortimore & Sammons, 1994; Sammons, 1999;
Scheerens & Bosker, 1997; Scheerens, 1990, 2000), that contextual factors play a very
important role in performance and, as ability can only account for a certain percentage of
variance explained in terms of performance, then the question is what other factors could
have an effect on performance and should form part of the monitoring system.
Thus a secondary question has been identified namely which factors have an effect on
learner performance and therefore inform the design of the monitoring system?
Four specific questions can be identified to address the second main research question, as
the school system is a nested system with learners within classes and classes within schools.
2.1 What factors on a school-level affect the performance of learners on the assessment?
2.2 What factors on a classroom-level affect the performance of learners on the
assessment?
2.3 What factors on a learner-level affect performance of learners on the assessment?
2.4 How can the identified factors be included in the design of the monitoring system?
26
1.6 Structure of the dissertation
Nine chapters compose this dissertation. Chapter 2 continues with the themes of monitoring
and value-added assessment and critiques the literature in these areas, building upon the
structure provided in Chapter 1. In this chapter (Chapter 2), types of monitoring systems as
well as the use of a value-added system as a monitoring tool are elaborated on.
Commonalities and differences are discussed and compared. Different approaches to value-
added assessment are discussed as well as the use of ability as a predictor of academic
success. Literature alludes to the fact that ability can only account for so much of academic
success and that other factors play a role. Therefore, other factors influencing academic
success based on school effectiveness research are also discussed. Chapter 3 includes a
description of the conceptual framework, building on discussions found in Chapter 2.
Furthermore, the discussions in Chapters 2, 3 and 4 are aimed at addressing the question of
how MidYIS compares with other monitoring systems. The MidYIS project is discussed in
detail in Chapter 4. In addition, steps are identified as to how the MidYIS project could be
adapted for the South African context. The research design and methodology are discussed
in Chapter 5 where issues of paradigmatic framework, sampling, instruments, validity issues,
data collection, and data analysis are elaborated on. The chapter concludes with ethical
considerations taken into account when conducting this research. Chapter 6 marks the
beginning of the results chapters. The results of the validation strategies undertaken in terms
of content-related validity (including face, content and curriculum validity) are presented in
Chapter 6. Chapter 7 extends the discussion of validity by focusing on the construct-related
validity and predictive validity of the assessment in addition to how reliable the assessment
is. While Chapter 6 and 7 address the first main research question, Chapter 8 focuses on the
second main research question. In this chapter factors on the school-, classroom-, and
learner-level that (according to literature) may influence achievement are explored by means
of multilevel analyses. The final chapter of the dissertation is the conclusions and
recommendations chapter (Chapter 9) in which the main findings are discussed in light of the
guiding research questions, literature, and conceptual framework. In light of the integration of
the literature, research questions and conceptual framework recommendations are given.
27
CHAPTER 2CHAPTER 2CHAPTER 2CHAPTER 2
MONITORING QUALITY EDUCATION: MONITORING QUALITY EDUCATION: MONITORING QUALITY EDUCATION: MONITORING QUALITY EDUCATION:
A REVIEW OF THE LITERATURE A REVIEW OF THE LITERATURE A REVIEW OF THE LITERATURE A REVIEW OF THE LITERATURE
In recent years, there has been a re-emphasis on the quality of education, where
quality education entails certain aims and objectives and the more education
realises these aims and objectives, the better the quality of education. As argued
in Chapter 1 monitoring systems are used to gauge the quality of education. This
chapter provides the review of literature pertaining to monitoring. Specifically,
value-added systems are explored as these provide information on the
contribution that the school makes to the learners’ learning. Furthermore, value-
added systems may use either a curriculum-based assessment or a developed
abilities assessment. Curriculum-based assessments are used to track learner
achievement from one grade to the next, while developed abilities assessments
provide a baseline measure from which future achievement can be predicted.
Learner achievement is not the only variable that should be considered, however,
as there are contextual factors that affect performance which also need to be
considered. These factors can be divided into school-level factors, classroom-
level factors and learner-level factors.
2.1 Introduction
A better schooling system places significant emphasis on the measurement of learner
performance, and on the need for improved management to ensure that education
resources are translated into quality teaching and learning (National Department of
Education, 2003b, p. 7).
The search for quality education within the context of the emerging global village has resulted
in education systems across the world sharing many characteristics. Characteristics include
an economic rationale for transforming education, an emphasis on standards, the need for
valid and reliable indicators, performance as well as issues relating to accountability (Smith &
Ngoma-Maema, 2003). Although the definition of quality is illusive, quality can be defined as
28
aims and objectives that have been achieved. In order to assess quality scientifically, certain
mechanisms have to be used. The mechanisms used include systems that provide
information on the extent to which identified aims and objectives have been attained.
Monitoring systems are the mechanisms that are used and issues pertaining to monitoring
will be discussed in this chapter. Monitoring is a key element in this research as stated in the
first main research question addressing the appropriateness of MidYIS as a monitoring
system for the South African context.
Monitoring systems in education are discussed in 2.2 of this chapter in which the term
“monitoring” is elaborated upon. In addition, the characteristics of monitoring systems are
examined, followed by examples of prominent monitoring systems developed in the
Netherlands, Australia, and the United States of America. A comparison of the systems is
discussed in 2.3 while value-added systems as a basis for monitoring are elaborated on in
2.4. The term “value-added” is discussed, including the origins of value-added systems in
education and the different approaches to them, namely, the use of curriculum-based
measures or developed ability measures. Furthermore, ability correlates with performance,
this is discussed in 2.5 and is followed by a discussion of abilities against the backdrop of the
curriculum. In 2.6, the role of abilities and the skills they represent are discussed in terms of
the aims and objectives of curricula specifically in the demonstration of performance.
Performance cannot be interpreted in a vacuum and contextual factors influencing
performance need to be considered in order to provide an accurate assessment of
performance as addressed by the second main research question. In 2.7, contextual factors
affecting performance, factors that are school-related, classroom-related and learner-related,
are discussed.
2.2 Monitoring systems in education
In Chapter 1, section 1.3, the concept of monitoring was introduced and, essentially, refers to
the gathering of relevant information on learner performance at various stages in order to
ascertain whether academic gains have been made. Building on this, monitoring can be
thought of in terms of watching, keeping track of, or checking with a purpose (Merriam-
Webster Dictionary, 2005). Monitoring of learner performance provides important information
to politicians and the public alike and monitoring of education systems has become a major
policy issue (Husén & Tuijnman, 1994). In addition, monitoring refers to the procedures for
the collection of information about various aspects of the education system at national,
regional, and local levels (Husén & Tuijnman, 1994), the main purpose of which is to monitor
performance to support learning or reach a judgement on achievement. Other functions of
29
monitoring are to provide information on school functioning and to map changes in
performance over time (Nuttall, 1994). Monitoring is a coherent approach in which both
achievement and contextual information are included (Husén & Tuijnman, 1994).
Moreover, monitoring can be thought of in terms of professional monitoring systems (PMS),
on the one hand, which are confidential and used by schools for self-evaluation purposes,
and official accountability systems (OAS), on the other hand, which function on a national-
level and involve publication of information (Tymms, 1999). Until recently, however, few
countries have systematically collected information on education outcomes or made them
available. Thus there is an absence of evidence of the quality of teaching and learning taking
place (Greaney & Kellaghan, 1996).
Quality of education is increasingly being emphasised (UNESCO, 2005; OECD, 2005;
Greaney & Kellaghan, 1996) and school success, in terms of quality, is increasingly being
highlighted where success is seen as ensuring achievement. In order to ensure that learners
are performing, tools are needed not only to ascertain whether academic improvements have
occurred but also to identify learners who are at risk (Safer & Fleishman, 2005). Thus data
has to be collected at different times (Greaney & Kellaghan, 1996). Moreover, research has
shown that, when quality education is tracked by means of monitoring systems, learners
seem to learn more and are more aware of their own performance (Greaney & Kellaghan,
1996; Lockheed, 1996; Sammons, 1999). Furthermore, decision-making about the learning
process improves (Safer & Fleishman, 2005) as quality assessments provide not only a basis
for learning but also diagnose areas that need attention (Scheerens & Hendriks, 2002). As
stated by Fitz-Gibbon (1996, p. 69) “what students learn represents one of those major
outcomes that we care about enough to measure, so assessment is an integral part of
monitoring.”
What is clear from the discussion above is that monitoring systems used to ascertain quality
education comprise of characteristics that could provide a framework for classifying and
comparing systems. For example, it provides answers to questions about which tools are
needed to collect information and about which tools are used for what purpose. Furthermore,
monitoring systems have a purpose, namely, to ascertain whether goals are being reached,
thus monitoring systems have an underlying rationale. In the section to follow, a framework
for comparing monitoring systems is proposed (2.2.1). This is followed by a discussion on
monitoring systems used in the Netherlands (2.2.2), Australia (2.2.3) and the United States of
America (2.2.4).
30
2.2.1 Characteristics of monitoring systems
Monitoring systems have certain characteristics and, according to Fitz-Gibbon (1992), these
include:
� Dealing with a manageable unit of education;
� Having an explicit rationale underpinning the system as well as a primary aim;
� Are negotiated among stakeholders;
� Have a positive affect on behavioural aspects;
� Do not interfere with the system that is being monitored.
In other words, a school or a school department is the unit that is being monitored according
to a set of inputs, outcomes, and related processes that can be directly linked to that school
or school department. The inputs, processes, and outcomes that are included in the
monitoring system have to be specified and justification must be given as to why the set of
indicators have been included. Furthermore, the monitoring system and the indicators
included in the system have to be accepted by the stakeholders of the school or school
department and should affect the learners equally. Finally, collecting data that is essential to
the monitoring process should not take up excessive and unwarranted amounts of time
distracting stakeholders from their daily duties.
One of the major problems in designing any monitoring system, according to Fitz-Gibbon
(2002), is the selection of indicators to be included. Thus the purpose of the system has to be
kept in mind. An indicator, in this context, refers to a statistic that conveys information
regarding the change, status or performance of the education system (Bottani & Tuijnman,
1994). Moreover, an indicator is quantifiable in nature, representing a snapshot of the
situation at one point in time. Indicators are measured against stipulated criteria and describe
conditions that can be improved upon, using information that is collected regularly to indicate
change (Greaney & Kellaghan, 1996). For selecting indicators, Fitz-Gibbon (2002) suggests
that one considers, as a starting point, the range of possible kinds of indicators (attitudes
towards school work, leadership style, classroom management), within a conceptual
framework, so that the process of monitoring and flow of information can be established.
The characteristics described by Fitz-Gibbon (1992) provide a useful framework when
comparing monitoring systems. In her framework, she not only places emphasis on the
purpose of the monitoring system but also on operational aspects such as what data are
collected, how data are collected, and how the information benefits the stakeholders. All four
aspects mentioned are consistent with the definition of monitoring as discussed in the
31
introductory paragraphs of 2.2. In the sections to follow, examples from the Netherlands
(2.2.2), Australia (2.2.3) and the United States of America (2.2.4) are presented. Only one
example, per country, is discussed. The examples discussed have been specifically chosen,
as they have similar characteristics, such as the rationale behind using the monitoring
system; but, differ greatly in the approach followed and in the implementation of the system.
The discussion is concluded with a comparison of the systems, based on the characteristics
identified by Fitz-Gibbon (1992).
2.2.2 The ZEBO-project in the Netherlands
In the Netherlands, schools are responsible for the quality of education provided and for
pursuing a policy that ensures improvement of education. Good quality education is seen as
a basic right and the government has to create favourable conditions for fostering quality
education. Furthermore, quality education is seen as not just investing in individuals but also
as an investment in society as a whole (Plomp, 2004). Under the Quality Law, which came
into effect in 1998, schools are encouraged to carry out self-evaluations, but are not provided
detailed formats or directions as to how the self-evaluation should be carried out. In addition,
responsibilities for quality evaluation and the curricular domain, specifically, are becoming
increasingly centralised. Furthermore, the Quality Law stipulates that schools are
accountable for the quality of education they provide and, as a result, schools are required to
develop three policy documents aimed at making their approach to quality transparent. The
first document is a school plan, which outlines the school’s approach to quality education.
The second is a school prospectus containing the school’s objectives, educational activities,
and results achieved. The third document is an arrangement of information that offers
interested parties additional information on various possibilities of involvement and the
participation of parents, learners and staff in the decision-making process regarding school
activities (Scheerens & Hendriks, 2002).
In order to assist schools with the task of evaluating themselves, many approaches and tools
have been developed. However, many school self-evaluation approaches were characterised
by a lack of regard for the reliability and validity of instruments and were therefore
questionable (Scheerens & Hendriks, 2002). Three organisations, namely the Foundation of
Educational Research, the Foundation for Curriculum Development and the Institute for
Educational Measurement, collaborated in the development of self-evaluation instruments for
primary schools, which were scientific in nature and based on sound research approaches.
Thus the ZEBO-project (Self-Evaluation in Primary Schools) was developed (Hendriks,
Doolaard & Bosker, 2001, 2002). In the ZEBO-project, different approaches to school self-
32
evaluation and monitoring are integrated, each with theoretical and disciplinary
underpinnings (Scheerens & Hendriks, 2002).
The ZEBO-project is comprises three distinct components that are integrated into one
system, as mentioned previously. The first component is a pupil monitoring system that is
based on psychometric theory and includes issues of adaptive instruction (ZEBO-PM). The
second component of the project assesses the educational content covered, or “opportunities
to learn”, within the framework of curriculum planning and curriculum evaluation (ZEBO-CC).
Finally, the project measures school process indicators within the framework of school
effectiveness and school improvement research (ZEBO-PI). Thus the ZEBO-project makes
use of various instruments, namely standardised tests and background questionnaires
(Hendriks et al., 2001, 2002) which are grounded in an inputs, processes and outcomes
framework (see Table 2.1).
Table 2.1 provides an outline of the aspects that are included in the ZEBO-project and, as
can be seen, contextual factors as well as achievement are taken into consideration. The
achievement information is used to ascertain the contribution the school is making to the
learning process or the value the school is adding, while the contextual information is used to
identify factors that should be considered when interpreting the gains or lack of gains made
by learners.
Various interpretive frameworks could be used by schools to evaluate the quality of
education that they provide, based on the information received as part of the ZEBO-project.
The frameworks include comparing themselves with nationally established norms or by
comparing themselves with other schools and interpreting the results by means of reflection
with no reference to external benchmarks or points of reference. The aim of using a
monitoring system such as the ZEBO-project is that schools will be able to track performance
over time and set targets to be attained (Scheerens & Hendriks, 2002) as well as develop
self improvement plans and strategies (Hendriks et al., 2001, 2002).
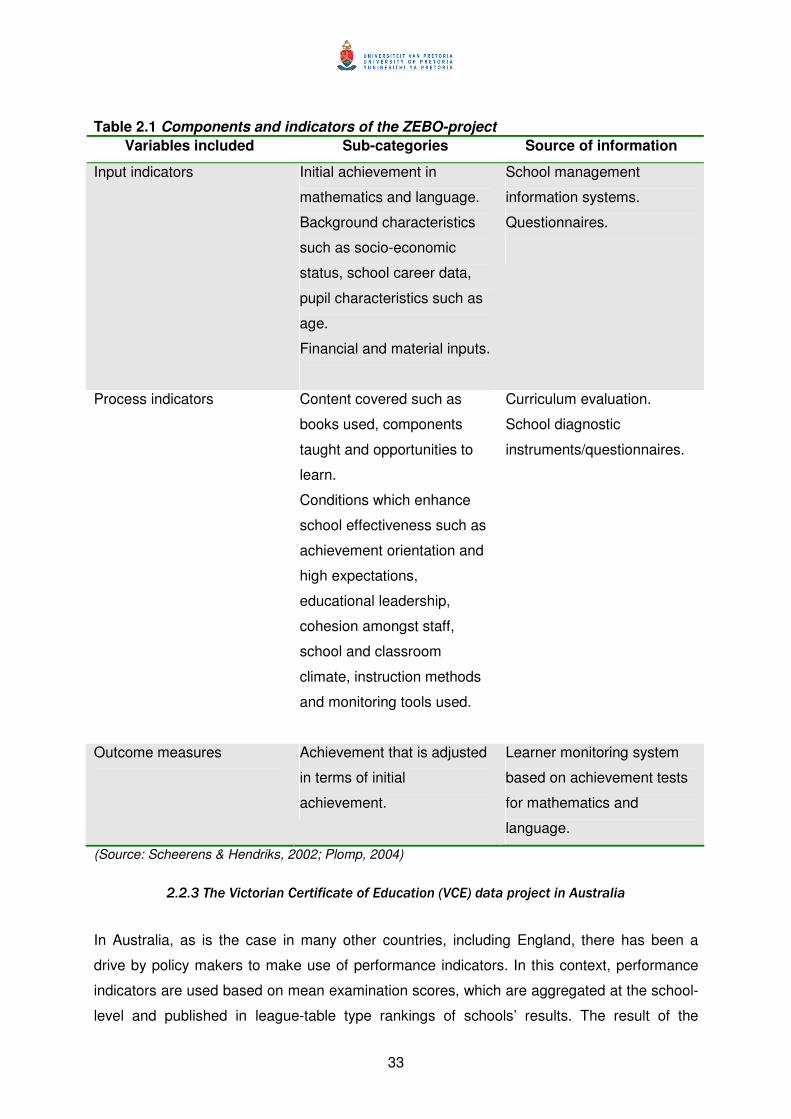
33
Table 2.1 Components and indicators of the ZEBO-project
Variables included Sub-categories Source of information
Input indicators Initial achievement in
mathematics and language.
Background characteristics
such as socio-economic
status, school career data,
pupil characteristics such as
age.
Financial and material inputs.
School management
information systems.
Questionnaires.
Process indicators Content covered such as
books used, components
taught and opportunities to
learn.
Conditions which enhance
school effectiveness such as
achievement orientation and
high expectations,
educational leadership,
cohesion amongst staff,
school and classroom
climate, instruction methods
and monitoring tools used.
Curriculum evaluation.
School diagnostic
instruments/questionnaires.
Outcome measures Achievement that is adjusted
in terms of initial
achievement.
Learner monitoring system
based on achievement tests
for mathematics and
language.
(Source: Scheerens & Hendriks, 2002; Plomp, 2004)
2.2.3 The Victorian Certificate of Education (VCE) data project in Australia
In Australia, as is the case in many other countries, including England, there has been a
drive by policy makers to make use of performance indicators. In this context, performance
indicators are used based on mean examination scores, which are aggregated at the school-
level and published in league-table type rankings of schools’ results. The result of the
34
publication of league-table rankings, however, impacts negatively on the education system
as it includes criticism of schools and educators by the media, a ‘test dominated’ curriculum
and parents choosing to enrol their children in certain schools and not others based on the
league-table results (Rowe, 1999). Furthermore, league-tables very often include crude
estimations while aspects of the school are lost in the statistics, so that vastly different
schools are compared with one another rather than similar schools. In addition, the
estimation of variation, designed to inform school improvement strategies, is ignored by the
league-tables (Rowe, 1999). In reaction to this, a project was launched to stimulate within-
school improvements in teaching, learning, and performance of learners by means of
providing performance feedback from the Year 12 Victoria Certificate of Education (VCE)
assessment programme.
This project is known as the VCE data project and aims to assist schools to monitor
effectiveness of teaching and learning in 53 subjects over time. The focus of the project is to
provide schools with performance data that facilitates the process of monitoring effectiveness
of teaching and learning programmes. The idea behind the project is that performance
feedback is a necessary precursor for the identification of strengths and weaknesses in
teaching and learning programmes. However, having access to the information does not
necessarily mean that the information will be used. Thus careful and responsible
management of performance information is called for in an environment where all the
stakeholders are committed to strategic and continual improvement (Rowe, Turner & Lane,
2002).
In Australia, information on the abilities and academic achievements of Year 12 learners is
collected as part of the Victorian Certificate of Education (VCE) assessment programme. The
primary aim of the assessment programme is certification; however, the results could be
used for monitoring the effectiveness of schooling, planning, and support in addition to
facilitating learners’ entry into tertiary education and the work force. The VCE data project
was implemented in 1992. It included a mix of examinations and structured school-based
tasks. As part of the assessment programme, learners in Year 12 were required to take the
General Achievement Test, or GAT, halfway through the year. The results were used as a
quality control device to identify which school-based tasks were either over- or under-scored,
based on predicated results from the GAT (Rowe et al., 2002). The rationale for this was that
additional information was needed about the competence or ability of learners as opposed to
making use of standardised tests only (Rowe et al., 1999). In addition, as is argued by Rowe
(1999), the majority of standardised tests assessed skills in terms of general academic
abilities or traits and not learning outcomes as a result of instruction per se.
35
The GAT is a measure of general abilities focusing on three domains. The first domain is
written communication while the second domain comprises mathematics, science, and
technology. The third domain includes arts, social science, and the humanities. In addition,
learners are given a subject score. By using the subject score and abilities score it becomes
possible to estimate the effect of the school on learner achievement. Thus the role of the
VCE data project is to supplement the annual statistical information received as part of the
VCE assessment programme with information that facilitates the investigation of questions
related to effectiveness of teaching and learning (Rowe et al., 2002).
Feedback is seen as the fundamental core of the VCE data project and a key mechanism
with which schools are able to claim ownership of their learners’ performance data. Feedback
in the VCE data project is provided by means of computer software designed specifically for
the project. Schools are provided with data for each learner and subject and this is presented
graphically. A manual, or user guide, is supplied with the software providing information on
how to interpret the graphs generated by the software. In addition, further support is provided
by means of a telephone help-desk, via email and consultations (Rowe et al., 2002).
2.2.4 The ABC+ model in the United States of America
Education reform in the United States of America has tended to focus exclusively on learner
performance and accountability with little attention being paid to process information. The
ABC+ (Attitudinal/Behavioural/Cognitive Indicators plus Context) monitoring and feedback
model was developed with the aim of providing process data to schools and districts at the
classroom, grade and school-level (see Table 2.2 for details). The interpretation of the data
and application of the data are context specific. The ABC+ model takes cognisance of this
and assists in the development of school improvement plans that are driven by best practices
in school effectiveness and staff development research (Teddlie, Koshan & Taylor, 2002).
A key consideration of the proposed model was that the instruments and procedures used
should make sense to practitioners. Practitioners should be able to trust the information if
they are expected to use the information. Furthermore, the research should be efficient in
scope and function but also be affordable. Finally, the data collection should be replicable
over time and across schools so that performance can be measured against itself and be
comparable to other schools. Additional characteristics of the ABC+ model are that it
provides schools with school effectiveness indicators that can be used to track performance
over time and that it makes use of mixed methods for collecting process information on site.
36
Also, the ABC+ model makes use of a variety of reporting formats that can be used to
illustrate improvement progress to a variety of stakeholders (Teddlie et al., 2002).
Data are generated on the parent, learner, classroom/educator and school/principal-level,
making use of various data collection instruments (see Table 2.2) for the different types of
process information required. The rationale behind the inclusion of attitudes, behaviour,
cognitive indicators, and context variables is the belief that attitude change precedes
behavioural change that precedes cognitive change and that school context affects the
course of the change process (Teddlie et al., 2002). In addition, school effectiveness
research has been criticised for using performance as the prime criterion for effectiveness
and ignoring alternative indicators of effectiveness which are also necessary (Koshan,
Tashakorri & Teddlie, 1996).
The ABC+ model was developed as a professional monitoring system, which means that
data are generated for direct use by schools for improvement purposes. Stakeholders, in this
case school staff members, decide which data elements should be monitored and who
should collect the data - the school staff themselves, or external evaluators (Teddlie et al.,
2002).
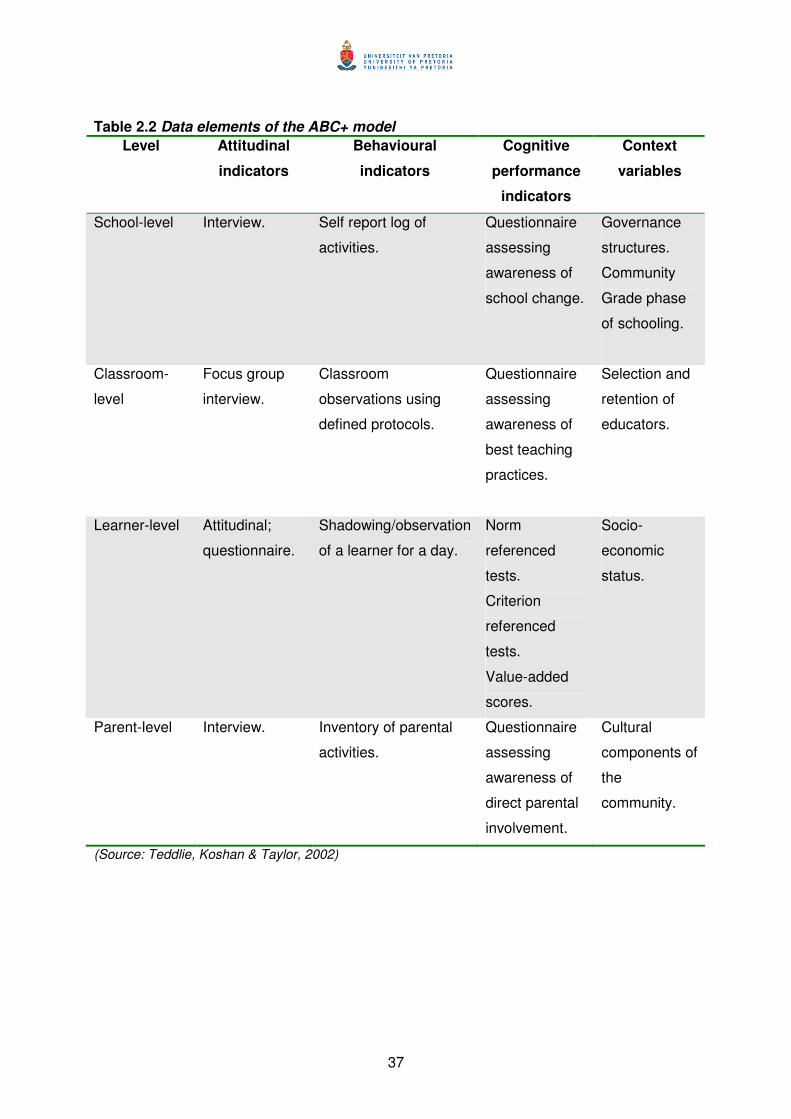
37
Table 2.2 Data elements of the ABC+ model
Level Attitudinal
indicators
Behavioural
indicators
Cognitive
performance
indicators
Context
variables
School-level Interview. Self report log of
activities.
Questionnaire
assessing
awareness of
school change.
Governance
structures.
Community
Grade phase
of schooling.
Classroom-
level
Focus group
interview.
Classroom
observations using
defined protocols.
Questionnaire
assessing
awareness of
best teaching
practices.
Selection and
retention of
educators.
Learner-level Attitudinal;
questionnaire.
Shadowing/observation
of a learner for a day.
Norm
referenced
tests.
Criterion
referenced
tests.
Value-added
scores.
Socio-
economic
status.
Parent-level Interview. Inventory of parental
activities.
Questionnaire
assessing
awareness of
direct parental
involvement.
Cultural
components of
the
community.
(Source: Teddlie, Koshan & Taylor, 2002)
38
2.3 Comparison of selected monitoring systems
In the sections above, various monitoring systems have been discussed in order to provide
the reader with an overview of the different type of monitoring systems available. In the
beginning of the section on monitoring systems, Fitz-Gibbon (1992) states that monitoring
systems have various characteristics, namely:
� A measurable unit/level of analysis;
� A rationale for the monitoring system;
� Stakeholder participation is included;
� There is an effect on behaviour;
� The implementation process should not interfere with the functioning of the system
being monitored.
Table 2.3 provides a summary of the three monitoring systems discussed in terms of the
framework provided by Fitz-Gibbon (1992). From the comparison, it can be seen that in all
three systems:
� The school and classroom-levels have been identified as the unit of analysis;
� The rationale underlying the system focuses on school effectiveness and the
monitoring of aspects within the school;
� Stakeholders are important to identify aspects which should be monitored so that
improvement plans may be based on those aspects;
� Data collection takes place during school hours and thus has to be negotiated so that
there is minimal disruption;
� The degree of stakeholder input as well as the impact of implementation varied from
one approach to another.
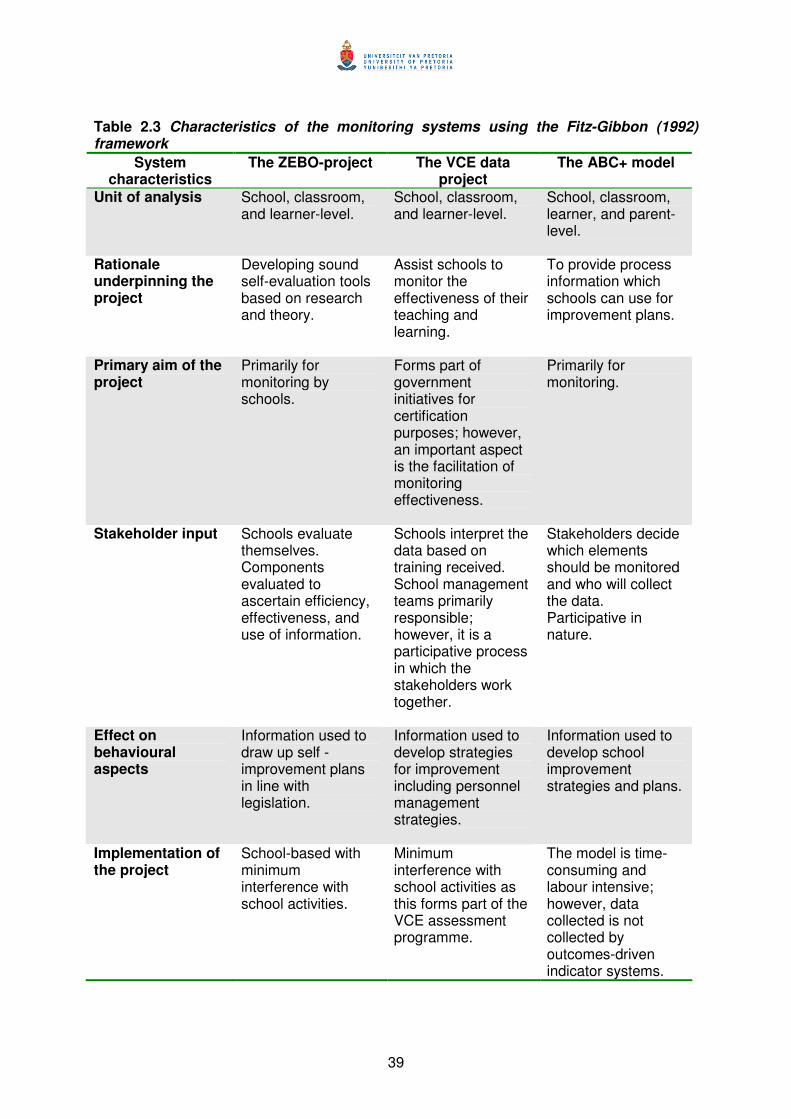
39
Table 2.3 Characteristics of the monitoring systems using the Fitz-Gibbon (1992) framework
System characteristics
The ZEBO-project The VCE data project
The ABC+ model
Unit of analysis School, classroom, and learner-level.
School, classroom, and learner-level.
School, classroom, learner, and parent-level.
Rationale underpinning the project
Developing sound self-evaluation tools based on research and theory.
Assist schools to monitor the effectiveness of their teaching and learning.
To provide process information which schools can use for improvement plans.
Primary aim of the project
Primarily for monitoring by schools.
Forms part of government initiatives for certification purposes; however, an important aspect is the facilitation of monitoring effectiveness.
Primarily for monitoring.
Stakeholder input Schools evaluate themselves. Components evaluated to ascertain efficiency, effectiveness, and use of information.
Schools interpret the data based on training received. School management teams primarily responsible; however, it is a participative process in which the stakeholders work together.
Stakeholders decide which elements should be monitored and who will collect the data. Participative in nature.
Effect on behavioural aspects
Information used to draw up self -improvement plans in line with legislation.
Information used to develop strategies for improvement including personnel management strategies.
Information used to develop school improvement strategies and plans.
Implementation of the project
School-based with minimum interference with school activities.
Minimum interference with school activities as this forms part of the VCE assessment programme.
The model is time-consuming and labour intensive; however, data collected is not collected by outcomes-driven indicator systems.

40
A monitoring system in the South African context has to serve the same purposes as the
three examples discussed and, as such, the lessons for South Africa that can be taken from
these examples are:
� The unit of analysis should be the district, school and classroom-level;
� There should be a clear rationale which underpins the monitoring system;
� Stakeholder participation is vital if the system is to be a success;
� Indicators included in the system should be chosen with care;
� The information gathered and analysed should be followed up with positive action
such as improvement plans;
� There should be a minimal effect on school activities.
It is, however, pertinent to consider that, although the classroom and the school-level are
primarily focused on, other areas of the system cannot be ignored. Thus one has to consider
the inclusion of the parents or community as well as higher levels of the education system
such as district, provincial or national-levels. Furthermore, the rationale has to be clear as to
whether the goal is to develop tools for self-evaluation to monitor effectiveness or to make
use of already developed tools in order to develop self-improvement plans. Finally, the level
of participation of the school has to be identified. Does the school collect the information
themselves, send the information for capturing and transformation and then analyse the data
or does the school liaise with research consultants who collect the data, analyse the data and
provide detailed feedback reports?
For South Africa, in the light of policy initiatives, it would be important to include other levels
of the system as well to ensure that no vital elements are neglected. For example, without
the inclusion of the district office, schools may not be able to obtain the official support they
need to carry out improvement plans, especially in light of the uncertainty as to what is
expected in terms of self-evaluation. It may be beneficial to make use of instruments that are
already developed but can be adapted to the South African context. This approach may take
the least time in terms of development and has the potential of yielding effective results.
Finally, with the demands placed on schools, it is not likely that they would have the time to
collect and analyse the information themselves, but rather that they would make use of
researchers who would be able to collect the necessary data as well as supply the
information that is needed, tailored to the school’s needs.
Important lessons can be learnt from literature when developing a monitoring system.
Involvement in self-evaluation, monitoring, and feedback is a learning experience in itself
(Hendriks et al., 2002). It is of the utmost importance to provide accurate, informative, and
41
appropriately adjusted information, which presents the performance data in a responsible
manner (Rowe et al., 2002). In addition, the school principals are of crucial importance, as
the driving force for monitoring and self-evaluation usually originates by them (Hendriks et
al., 2002). It is imperative that schools are provided with an opportunity to take ownership of
learner performance data (Rowe et al., 2002). To this end, staff should be included in the
design of the data collection (Teddlie et al., 2002). Schools tend to compare the performance
information received with their own experiences, if the results match their expectations they
are satisfied but at the same time, disappointed because of the lack of new insight. Schools
may often make use of the self-evaluation and monitoring as an accountability check for
parents and school boards (Hendriks et al., 2002), while Gray (2002) indicates that schools,
as well as educators, are more likely to respond when they perceive the data to be
something worthwhile at both school and subject-level.
Hendriks et al. (2002) suggest that, when developing a monitoring system, instruments need
to be flexible in order to meet the needs of the school. The type of performance information
has to be tailored to schools’ needs, especially in terms of presentation, including norm-
referenced tables as part of the feedback and support structures to assist schools in the
interpretation of information. In terms of analysis, one should take the hierarchical structure
of learner performance data into account before the information is given to the school (Rowe
et al, 2002). Over and above these points, it is important to make a distinction between the
basic monitoring function of such a system on the one hand and additional instruments for
diagnostic purposes and further analysis on the other (Hendriks et al., 2002). The culture and
context of schools must be taken into account: if a school has built up defences in terms of
performance related information, the information could simply be rejected (Gray, 2002). In
order to remedy this situation, educators and researchers should try to establish an
atmosphere of support for school-level improvement at both state and district-levels. In
addition, researchers should undertake comparative longitudinal studies in order to evaluate
the effect of the information (Teddlie et al., 2002).
Research (Gray, 2002; Hendriks et al., 2002; Rowe et al, 2002; Teddlie et al., 2002)
suggests that the potential benefits of implementing adequate monitoring systems are great.
A word of caution though, the aim of the monitoring system must entail more than merely
improving upon test scores, as this narrow concentration on test scores could lead to a
narrowing of the curriculum, inadequate learning and the possibility of lowering educational
standards instead of raising them (Torrance, 2003). Furthermore, the misuse of monitoring
systems is immense (Husén & Tuijnman, 1994). However, when monitoring systems are
created and implemented with knowledge of the likely effects and the characteristics of these
42
effects are continuously being tracked and documented, as well as evaluated, then one is
one-step closer to a system that is truly beneficial (Coe, 2002). In the words of Rowe et al.
(2002, p. 182-183):
…learning and achievement outcomes are not likely to be brought about by academic
polemic, nor by “top-down-driven” administrative fiats of bureaucracies…Rather, with
access to, ownership of, and control over their own data and their supporting products,
sustained improvement can be achieved by schools via leadership support and teacher
professional development practices that maximize the quality of teaching, learning and
achievement.
2.4 Value-added monitoring systems
In Chapter 1 (1.3.3), the reader was introduced to value-added as a mechanism used for
monitoring. In this section, value-added monitoring systems are elaborated on. The question
of whether schools make a difference in terms of learning has long been answered
(Sammons, 2006). This section elaborates on the question being posed not of whether
schools make a difference but rather how much they affect learning (Zurawsky, 2004). Value-
added systems are useful in ascertaining the quality of education as value-added measures
address questions about the way in which a school and learners are performing and also
stimulate discussion on how to organise teaching and learning activities (Saunders, 2001).
The term “value-added” originated in economics where it was used to describe the difference
between the price of the finished product and the cost of the raw materials that were needed
to produce the product (Pickering & Bowers, 1990). However, value-added and value-added
data on performance have become major features in the educational landscape and part of
the story of school effectiveness (Saunders & Rudd, 1999). As part of the educational
landscape, the measurement of value-added is central to the development of a good
indicator system that is based on empirical underpinnings and is open to scrutiny as well as
to refinement. Such a system should include elements such as prior attainment, the
longitudinal nature of progress, the very nature of the school (multileveled), the knowledge
that the factors involved in hindering or boosting progress are multivariate in nature and that
there is a differential effectiveness for different groups of learners (Saunders, 1999;
Zurawsky, 2004).
Value-added can be interpreted in a variety of ways. It could refer to measures of progress
made by learners in one school as compared to similar learners in other schools (Strand,
1998) or refer to the gains made by individual learners (Bianchi, 2003). Value-added could
43
also be expressed in the calculation of the contribution schools make to learners’ progress
(Saunders & Rudd, 1999) or even the difference between learners’ knowledge and skills at
entry level and knowledge and skills at graduation (Pickering & Bowers, 1990).
Value-added analyses have the potential to be informative to all stakeholders whether
districts, schools or parents (Strand, 1998). In order for them to be informative, however, it is
necessary to consider the following (Saunders & Rudd, 1999, p. 3):
i. Outcome measures which reflect the various levels of pupil performance
ii. Measures of prior attainment
iii. Background information
iv. Calculations should be based on data collected at individual learner-level
v. Use advanced statistical techniques
Various methods have been developed over the years to produce information about the
relative effectiveness of schools on the one hand and providing diagnostic assistance for
managers and educators alike on the other. Furthermore, schools are in need of strategies or
systems that can be used, not only to identify what learners know and do not know, but also
to provide information that establishes a basis against which future achievement can be
compared (Kyriakides, 2002). Until now, the focus of the work on value-added measures has
been on the methodological accuracy and the conceptualisation of statistical models to be
used in an appropriate manner in order to collect the right kind of data in the right form
(Saunders, 2000). This emphasis has led to different value-added approaches. In the section
to follow, two different approaches, from the United Kingdom (2.4.1) and the United States of
America (2.4.2), will be discussed as they represent the two ways in which value-added
monitoring systems could be approached. The section concludes with reflections on value-
added monitoring systems (2.4.3).
2.4.1 Value-added monitoring systems in the United Kingdom
In the United Kingdom, schools use assessments, including aptitude assessments, to
calculate the value-added. Value-added assessment is commonly undertaken by secondary
schools when a new cohort of learners joins the school in Year 7, which is the beginning of
secondary education, although systems are available for primary schools. The rationale
behind implementing a value-added system is that the national curriculum tests undertaken
at the end of primary school, very often are not suitable for calculating value-added. As a
result, many schools opt for abilities type assessments which give an indication of general
attainment that is used to calculate the value a school has added, based on the General
44
Certificate for Secondary Education (GCSE) results at the age of 16 (National Foundation for
Educational Research, 2004). In addition, it is pertinent to mention that value-added
measures are seen as increasingly important due to the pressure placed on schools to
perform as a result of the publication of league-tables (Fitz-Gibbon, 1996).
Value-added systems in the United Kingdom make use of a baseline against which later
performance is compared, and progress made by the learner can be ascertained based on
the difference between the initial measure and later performance. The progress made by
learners can be attributed to the school and, hence, can be thought of as the value the
school has added. Thus the method entails comparing the baseline measure and the output
measure in order to ascertain the difference (National Foundation for Educational Research,
2004).
The National Foundation for Educational Research (NFER) in the United Kingdom has been
a major contributor to the development of value-added research, in terms of empirical
investigations of variables that are associated with learner performance, and has also
contributed to the practical application of value-added analyses. The NFER developed a
“service,” which was called the Quantitative Analysis for Self Evaluation or QUASE
(Saunders & Rudd, 1999). The aim of QUASE is to provide detailed, confidential information
on learner performance based data from a developed abilities assessment to schools and to
Local Education Authorities (LEA). The analyses undertaken as part of the QUASE system
are derived from sophisticated statistical modelling techniques and assist schools to evaluate
how well they are faring, based on the school’s background and learners' prior attainments
(Schagen, 1996).
Attitude questionnaires are used in addition to the abilities test. By taking background
characteristics into account, the performance results are placed in context and enable the
NFER to undertake multilevel analysis of data about individual learners, year groups and the
school as a whole (Arkin, 1997). QUASE feedback consists of tables as well as graphic
representations. Included in the feedback is information about learners’ performance, for
instance whether they have performed significantly above, below or no different in the GCSE
result in comparison with the predicted result based on the baseline measure. Bar charts, in
addition to scatter plots, provide information per subject as well as against and scatter plots
provide three kinds of information – about subjects, prior performance, and national
percentile scores. Thus schools can compare performance against national standards and
can identify learners who may need additional assistance as well as learners who performed
relatively well (Schagen, 2004). Moreover, attendance and differential effectiveness for girls
45
and boys are also included (Saunders & Rudd, 1999). What is particularly interesting about
the approach followed by the NFER is that seminars and in-service training courses are
offered in order to assist in interpreting and using the data (Saunders, 2000).
As mentioned in Chapter 1, the CEM centre has also developed a number of value-added
systems at various stages of the United Kingdom school system, most notably Primary
Indicators at Primary Schools (PIPS), Middle Years Information System (MidYIS), Year 11
Information System (YELLIS) and A-level Information System or Alis (CEM, 2002a). The
current research focuses on MidYIS, which is described in Chapter 4. However, the first
project developed by the CEM centre will be briefly discussed as this project forms the
template from which the other projects were developed.
The Advanced Level Information System (Alis) was designed to provide performance
indicators for learners after GCSE. Alis was developed in 1983 and, as with the other
systems discussed in this section, makes use of a value-added approach. It uses a baseline
measure, representing learner ability before the learner starts with what is called post-16
courses, i.e. courses taken after the age of 16. A two-pronged approach is followed in the
Alis Project. If learners have a GCSE score, the average is used as the baseline measure. If
learners do not have a GCSE score the CEM centre makes use of the Test of Developed
Ability or TAD (CEM, 2006e). In addition to making use of a baseline measure to provide
value-added feedback for Advanced Subsidiary-Level (which is the first year of advanced
studies) as well as A-Level (which is the second year of advanced studies), Alis also provides
attitudinal information based on questionnaires which learners complete (CEM, 2006f). The
questionnaire takes approximately 15 minutes to complete and includes items pertaining to
home background, prior achievement, attitudes towards subjects, attitudes towards
institutions and likelihood of staying in education, career choices and preferences in work
(CEM, 2006g).
2.4.2 Value-added monitoring systems in the United of States
Essentially, the approach to value-added in the United States is based on the idea that
educators are to be evaluated on the difference between incoming levels of achievement and
outgoing levels of achievement. Initially, value-added systems were meant to level the
playing field (Ballou, 2005), where educators could not be held accountable for factors that
they could not control. However, the theory and the practice are often very different. In the
United States, for instance, value-added has become synonymous with accountability
(Ballou, 2005).
46
Sanders (then at the University of Tennessee) developed a value-added assessment model
of accountability in the United States of America in the early 1980’s (Sanders & Horn, 1998).
The system developed by Sanders and his colleagues focuses on the gains, which are made
by individual learners as well as the schools and districts, from one year to the next. The
primary purpose of the system was to provide information for summative evaluation of
schools’ or educators’ effectiveness in leading learners to academic gains over a period of
time (Sanders & Horn, 1998).
The basic propositions of this system were to try to measure the influence the districts,
schools and educators have on learner performance. The system developed by Sanders and
his colleagues was later incorporated into the Tennessee Educational Improvement Act and
became known as the Tennessee Value-Added Assessment System (TVAAS), which
assesses learners in mathematics, science, reading, language and social studies from Grade
3 to Grade 8 (Sanders, 1998). The assessments, which are administered annually, are
vertically linked from one year to the next and effectiveness is based on learner progress
(Ballou, 2005). The rationale underpinning the TVAAS was to provide learner and educator
performance scores that were free from the biases normally associated with standardised
testing, as TVAAS scores reflect growth regardless of initial level of performance (Sanders,
Wright, Ross & Wang, 2000). The value-added measure of the TVAAS was derived from
comparing the expected scores (obtained from past results such as the previous year) with
the actual score achieved in the current year of study (Bianchi, 2003) and made use of
scales which correlated highly with curricular objectives (Sanders, 1998). According to
Sanders and Horn (2003), the TVAAS is a statistical process that measures the influence of
the school system, where schools and educators are used as indicators of learning taking
place. Specifically, the growth in learning is aggregated on a yearly basis as reflected in the
assessment scores of the five academic subjects tested (Kupermintz, 2003). The TVAAS
model uses unbiased estimates of the influence of educators, schools and school systems on
learning (Sanders & Horn, 2003).
2.4.3 Concluding remarks regarding value-added monitoring systems
There are benefits attached to value-added assessments. In the words of Steen (in Olson,
2002, p. 1), value-added approaches “provide more accurate estimates of changes in test
scores than we currently get with a lot of the systems being used. It [value added
assessments] also … does a better job of communicating what we really want to know, which
is the extent to which individual students are gaining or losing”. Other benefits are
47
� Value-added measures provide a way of monitoring effectiveness in terms of
increases in achievement over previous performance, as each learner is compared to
his or her own record (Kupermintz, 2003; Legres, 2000; Olson; 2002)
� Value-added data could assist in academic advising, developing learners, and
improving teaching (Kyriakides, 2002; Pickering & Bowers, 1990; Olson; 2002;
Zurawsky, 2004).
� Value-added assessment provides schools with objective feedback regarding
progress made by the educator, school, and/or district, as it focuses on learners’ rate
of advancement. It thus provides a basis for measuring future performance
(Kyriakides, 2002; School Directors Handbook, 2003).
Value-added assessment systems are not without criticism (Drury & Doran, 2003; School
Directors Handbook, 2003):
� They are not always easily understood. Most of them are based on advanced
statistical techniques which may well be above the grasp of educators;
� They can be misused in the name of accountability;
� Value-added assessments adjust for learner background characteristics which are
specifically associated with academic growth and which could lower performance
expectations of disadvantaged learners and schools;
� Critics also state that value-added assessments based on the curriculum will lead to
teaching to the test and that standardised tests do not measure all the aspects of
learning.
Furthermore, value-added analyses are only as good as the assessments used and data
gathered (Zurawsky, 2004) and are costly to set up and manage. One should be mindful that
these systems are based on normative and retrospective models, which do not say anything
about desirable levels of performance. These systems deal in correlations, not causes, and,
as a result, are limiting for evaluation purposes. Moreover, value-added systems could be
used in different contexts: either in an accountability context or in a development and
improvement context. In terms of accountability, value-added analyses can only be used as a
screening device: they should not be used for making definitive assessments. In an
improvement context, require staff training and support in order to maximise the analyses. As
beneficial as value-added analyses can be, these analyses do not provide quick fixes to the
problems facing schools and should be used with caution (Saunders, 2002). However, value-
added assessments support the notion that all learners can learn and provide a means of
determining at which pace they learn.
48
The ultimate use of value-added assessment information is that it is elicited with the aim of
improving teaching and learning. This cannot be accomplished, however, without giving
adequate feedback that is a key component in many value-added systems. Feedback,
according to Black and Wiliam (1998), should be about particular qualities of learners,
learners’ work, and the extent to which the learner can improve. For value-added feedback to
be effective, both positive and negative aspects need to be highlighted (Duke, 2002) so that
the recipients of the feedback would be motivated to fulfil educational purposes (Siebörger &
Macintosh, 2004). The issue of value-added feedback nevertheless needs to be approached
with caution. Evidence suggests that feedback can often be almost as harmful as beneficial
(Coe, 2002). When designing and implementing a feedback system, one should be mindful of
the fact that it might not automatically lead to an improvement in the situation though it might,
under the right conditions, have a substantial effect on the improvement of task performance
(Coe, 2002).
No assessment system will completely explain or evaluate all aspects of learning, but the
data, which is obtained from value-added assessments, can be a helpful tool for stakeholders
to use in their efforts to improve upon learning (School Directors Handbook, 2003). A growing
body of knowledge about research on value-added methods is being developed, with specific
emphasis on new approaches and techniques that are both credible and useful for schools
(Doran & Fleischman, 2005). Two of these approaches have been discussed in this section:
making use of assessments that are aligned with the curriculum and making use of an
abilities type assessment in order to gather baseline data from which future achievement can
be predicted. In the section to follow, the use of abilities assessments to predict academic
performance is discussed, with a view to providing a theoretical base for the use of ability
assessments.
2.5 Ability as a predictor of academic success
Ability could be defined as being competent in a certain area, acquiring proficiency in a
certain skill, or even having a natural aptitude in an area (Merriam-Webster, 2005). Ability
can also be viewed as cognitive (information processing) traits or characteristics used when
solving problems. Intelligence is seen as general reasoning ability and accounts for
performance in a wide variety of contexts (Anastasi & Urbina, 1997; Kline, 2000) as it
involves the ability to plan, solve problems, think abstractly, comprehend complex ideas,
learn quickly and learn from experience (Gottfredson, 1997a). Intelligence or abilities
assessment, however, is very often riddled with certain misconceptions, such as the idea that
intelligence scores cannot change and those scores, once obtained, will remain for life
49
(Gottfredson, 1997a). Historical misinterpretation, in addition to the misuse of intelligence test
scores, has added to the debate of making use of such tests (Haladyna, 2002). In South
Africa for instance, the results of this type of assessment were used to discriminate against
racial groups and thus to reinforce the apartheid philosophy. In reaction to this, the
Department of Education, as part of the newly elected Government, in 1994 discontinued
support for school wide use of intelligence tests.
Modern explanations of intelligence and the abilities that constitute intelligence, range from
the capacity for learning (Haladyna, 2002) to the differences in the rate in which learning
takes place and the time taken to learn (Carroll, 1997). Explanations also include the ability
to profit from being exposed to materials and situations (Rowe, 1997) and the differences in
the capacity to process complex information (Gottfredson, 1997b). These explanations
provide a snapshot of how differences in abilities could produce differences in the quality of
learning taking place. Furthermore, intelligence and ability are not factors that merely
influence performance in school but also have a lifelong impact (Gottfredson, 1997c).
The knowledge and skills that are considered to be the hallmarks of intelligence or ability are
very often taught (Spearritt, 1996; Rowe, 1997), thus schooling increases ability scores
(Colom, Abad, García & Jaun-Espinosa, 2002). Furthermore, Perlman and Kaufman (1990)
state that intelligence and the assessment thereof was developed out of a pragmatic need to
predict academic success. Up to 25% of variance can be accounted for in school results, as
many items included in the assessments represent content that is grounded in the school
curricula. Researchers have been interested in the role of ability in determining academic
success, not just for the sake of undertaking research but also with the aim of identifying
adequate intervention strategies (Kline, 1993).
Cognitive abilities and motivation are mentioned, as determinants of academic performance
and the relationship between cognitive abilities and achievement are well documented
(Gagné & St Père, 2001). For example, Walhberg (1984) in a survey of 3000 empirical
studies on school learning, found an average correlation of .71 between achievement and
ability. In addition, Gagné and St Père (2001) found a multiple correlation of .55 to .60
between ability and achievement. Kline (1993) reports a multiple correlation for ability and
achievement in language of 0.6 and, in mathematics, of 0.64. Kline (2000) states that on a
primary school-level, a correlation of .60 between achievement and ability has been
established. In addition, Jenson (in Kline, 2000), confirming claims made by Vernon in the
1960’s, found that intelligence is the single best predictor of achievement at any level,
whether at primary school, secondary school or university. The studies mentioned here
50
reinforce the statement that cognitive ability is a good predicator of academic achievement
(Facon, 2004; Haladyna, 2002; Howie, 2002; Kendall, Verster & von Mollendorf, 1988; Kline,
1993; Rowe, 1997; Rushton, Skuy & Fridjhon, 2003; Snow, 1998; Spearritt, 1996). There are
many reasons for this, one of them being that the knowledge and skills that are assessed by
achievement tests are also assessed by abilities tests (Rowe, 1997). Another reason is that
the correlation between ability and academic success can be explained by the
conceptualisation of intelligence as the ability to reason (Kline, 2000).
Wood (1987) is of the opinion that discussions on abilities and attainment testing exclude the
educational context and educational achievement, as achievement is often seen as being
interchangeable with ability. In the section to follow, knowledge, skills, and abilities are
discussed against the backdrop of the educational context and, more specifically, in the
context of the curriculum.
2.6 The relevance of skills and abilities against the backdrop of curriculum
The preceding section illustrates the relationship between ability and academic performance.
Two processes seem to be of importance when the development of abilities is considered,
namely, the exposure process or the opportunity to learn and the ability to take advantage of
the learning moment in order to acquire knowledge and skills (Rowe, 1997). Here knowledge
can be thought of in terms of facts, concepts and principles, as well as procedures. A fact
can be viewed as a declarative truth, a concept requires a definition and has certain
characteristics, a principle is a “lawful” relationship, and a procedure is a purposeful activity
(Haladyna, 2002). Thus knowledge involves the knowing or understanding of facts, while a
skill is complementary to knowledge. It involves doing, which is the application of knowledge.
Knowing, however, is seen as more than the accumulation of factual information and
procedures. It is also seen as having the ability to integrate knowledge, skills, and
procedures in different ways, depending on the context, in order to solve problems (le
Grange, 2004; National Research Council, 2001). During the learning process, knowledge
and skills are acquired, which are then organised and changed into functional systems, which
in turn are used in thought and further learning (Snow, 1998).
How learning takes place depends on the curriculum that is followed, where curriculum can
be thought of as what is to be learned. It may consist of aims (Posner & Rudnitsky, 1997) or
be a formal academic programme. A curriculum is a structured programme that provides
opportunities to learn (Graham-Jolly, 2003) or a plan for learning (Van den Akker, 2003).
Various levels of curriculum exist. On a systems-level, curriculum development is normally
51
generic in nature while site-specific approaches take place on the school, classroom, and
learner-level. The curriculum as implemented differs from both its intended and its attained
aspects (Travers & Westbury, 1989). The intended, implemented, and attained curriculum
may be described in the following manner (Travers & Westbury, 1989; Van der Akker, 2003):
� The intended curriculum contains the rationale underlying the curriculum, what should
be taught in schools and learned by learners, and what is found in curriculum policy
documents;
� The implemented curriculum is the curriculum as interpreted by educators for the
purposes of teaching, i.e. the actual teaching- learning activities taking place;
� The attained curriculum is the curriculum as experienced by learners and which
results in learning outcomes.
In terms of an outcomes-based education (OBE) system, such as the system in South Africa,
learning is facilitated by outcomes that can be thought of as the aims, goals, or standards of
the learning process. An outcome is the end product of a learning process, it is the
knowledge or insight that learners should acquire as well as skills that learners should have
mastered and be able to demonstrate (Killen, 2000, 2002; Olivier, 1998; Posner & Rudnitsky,
1997). The outcomes, aims, or learning targets reflect what is important in education and
consist of (Kotzé, 2002):
1) Knowledge that emphasises the need to learn and to be familiar with information.
Knowledge also refers to the sum of what is known or the body of truth (Merriam-
Webster, 2005).
2) Reasoning, which pertains to the understanding of knowledge and refers to the ability
to think and draw conclusions (Merriam-Webster, 2005).
3) Skills, which are the application of knowledge in a practical manner. To have a skill
entails using one's knowledge effectively in order to execute a task (Merriam-
Webster, 2005; Posner & Rudnitsky, 1997).
4) Products, which refer to the ability to think critically about what is commonly accepted
as knowledge (Merriam-Webster, 2005).
An OBE curriculum emphasises learner experience, active learning, and the development of
learner abilities and skills (Gultig, 2003; Kraak, 1998). However, learning ideas without
acquiring corresponding competences mean that learners may not necessarily be able to use
the ideas (Posner & Rudnitsky, 1997). Therefore a competence-based approach to education
is followed, in which knowledge and skills are taught with the intention that the knowledge
and skills learned can be applied (Van der Wagen & Ridley, 2001). Knowledge and skills not
52
only have to be integrated but also have to be demonstrated against defined standards or
criteria within a specific context. Competence is a skill or cluster of skills that can be applied
within a context, integrating understanding of performance and the underlying knowledge
base (Bellis, 1999). Thus within an OBE curriculum, the transferability of skills (cognitive
skills) and knowledge is emphasised (Van der Wagen & Ridley, 2001). Also emphasised is
the capacity to apply knowledge and skills in an integrated manner (Kraak, 1998). Skills
include basic skills such as reading, writing and arithmetic as well as thinking skills such as
creativity, problem-solving and reasoning (Pullin, 1994).
What is clear is that learners should be equipped via the curriculum with skills that will enable
them to evaluate choices and to identify and solve problems based on logical reasoning.
Thinking processes play a major role in learning activities and should form part of the
curriculum as learners who are not adequately equipped or who have a limited command of
basic skills are likely to fall behind in school, especially in mathematics, reading and writing,
where thinking skills play a major role in success (Hamers & Csapó, 1999). Marsh (1992)
concurs, stating that the mastery of basic skills and abilities, such as problem-solving skills
and the ability to use and evaluate knowledge, as well as the mastery of fundamental
processes is imperative, as learners who are not proficient in basic skills will be restricted in
their ability to function in society.
In the section above, elements of the curriculum have been briefly discussed with a focus on
skills, abilities, and competence. There are still instances, however, where rote-learning is
focused on, at times to the exclusion of conceptual learning; the emphasis is placed on the
recall and recognition of facts instead of the demonstration of knowledge and skills (Falk,
2000). The achievement of outcomes and the development of knowledge remain the core
business of a functional curriculum; however, achievement should be understood within the
context in which it occurs (Wood, 1987). In the section to follow, factors affecting
achievement are elaborated upon in order to provide the context which Wood (1987) is
referring to.
2.7 Factors influencing performance
In this section of the chapter, factors influencing performance will be elaborated on, drawing
on school effectiveness research, as school effectiveness research attempts to identify
factors that influence learner outcomes. In addition to school effectiveness, there is literature
on school improvement where the focus is primarily on the processes and conditions leading
to improved learner outcomes. School improvement literature is included but only with regard
53
to the factors under discussion and, as a field of research in its own right, is not elaborated
on. The reason for this is that school improvement literature primarily focuses the sustained
efforts of stakeholders to change conditions within schools (Marsh, 1992).
School effectiveness developed in reaction to the statement that schools do not make any
difference and that background factors were the dominant influences in learner performance
(Gray, Hopkins, Reynolds, Wilcox, Farrell & Jesson, 1999). The term “school effectiveness”
describes educational research that is concerned with exploring the differences within and
between schools. The aim of school effectiveness research is to obtain information about the
relationships between variables (Goldstein, 1997) in order to describe the characteristics
associated with successful learner outcomes (March, 1992). This relationship, however, is
not causal in nature but should be thought of it terms of tendencies (Sammons, 2006).
School effectiveness can be said to be the degree to which schools achieve their goals and,
in the educational context, is often associated with the quality of education (Scheerens,
1999).
School effectiveness studies generally involve the random sampling of schools and learners
or classes of learners as well as the identification and the collection of information related to
learner outcomes. Background information is used to map patterns in order to outline school
processes that could be linked to good practice (Mortimore & Sammons, 1994) and, as a
result, has the potential of providing substance to school improvement. To this end, two
approaches could be used, especially in developing countries (Scheerens, 2001a). Firstly, a
more pro-active approach, in which focus is placed on planned change in malleable
conditions of the school context as well as the school organisation and the instructional
processes at the classroom-level that have shown to have an effect on learner performance.
Secondly, a retroactive approach in which variables and indicators are selected for
monitoring and evaluation purposes with the aim to use the indicators as guides for
improvement at a later stage (Scheerens, 2001a).
A fundamental design for school effectiveness research is the association of hypothetical
effectiveness-enhancing conditions or factors and various measures of output, i.e. learner
performance. Here, a basic model taken from systems theory is utilised. The school is seen
as a black box inside which certain processes take place that impact on the output. The aim
is to reveal the impact of relevant input characteristics on the output and to bring to light the
process or throughput factors, as well as the impact of contextual conditions (Scheerens,
2000). School effectiveness research is best guided by a model in which one has an input-
process-output- context categorisation of variables that is multi-level in nature and oriented
54
towards a value-added approach (Scheerens, 2001a) in which learner background
characteristics are controlled (Sammons, 1999; Scheerens, 1990).
The most distinguishing feature of effective school research is that it attempts to study
characteristics related to the organisation, form, and content of schools. The results from
early studies lead to the design of the “Five-Factor Model of School Effectiveness”
(Creemers, 1994; Scheerens & Bosker, 1997; Scheerens, 2000). The factors are strong
educational leadership, acquiring basic skills, an orderly and secure environment, and high
expectations of learner performance and frequent assessment of learner progress
(Creemers, 1994; Scheerens, 2000). However, these five factors are not the only factors that
influence achievement.
Characteristics of the school, educator, and learner could have an effect on performance. A
relationship between school characteristics and performance has been found. Specific
characteristics that have been mentioned in literature are location (Adewuyi, 2002; Howie,
2002; Teddlie, 1994) and the school’s resources, including the physical, human, and material
resources at the school’s disposal (Greenwald, Hedges & Laine, 1996; Hill, 2001; Mortimore,
1998; Muijs, Harris & Chapman, 2004; Sammons, 1999; Scheerens, 1990; Scheerens,
2001b; Willms & Somers, 2001). Educator characteristics that have an effect on achievement
are gender, age, qualifications, and competence. (Bliss, 1991; Grobler, Grobler &
Esterhuyse, 2001; Howie, 2002). Other factors influencing performance are learner
background characteristics, such as home environment, socio economic status (Adewuyi,
2002; Bliss, 1999; Howie, 2002; Sammons, 1999; Scheerens, 1990; Teddlie, 1994a) and the
number of books in the home, the occupation of parents and their level of education (Howie,
2002).
Additional factors influencing school-level performance are achievement orientation and high
expectations at both school and classroom-level where there is a clear focus on the
mastering of basic subjects. (Bliss, 1991; Grey et al., 1999; Heck, 2000; Hill, 2001; Howie,
2002; Marsh, 1992; Newmann, 1991; Sammons, Thomas, Mortimore, Walker, Cairns &
Bausor, 1998; Scheerens & Bosker, 1997; Scheerens, 1990; 1992; 2001a; Teddlie, 1994a;
1994b; 1994c; Wills & Somers, 2001). The focus is not only on achievement but also on
communicating the expectations to stakeholders and to provide intellectual challenges for
learners. (Mortimore, 1998; Sammons, 1999). A school’s degree of achievement orientation
can be ascertained from its expressed policies (Scheerens, 1990).
55
Educational leadership has also been cited as a factor that influences performance. Here,
general leadership skills and the characteristics of the school principal as an information
provider, co-ordinator, meta-controller of classroom processes and as an instigating
participatory decision-maker are included (Adewuyi, 2002; Bliss, 1991; Gray et al., 1999;
Heck, 2000; Howie, 2002; Marsh, 1992; Mortimore, 1998; Muijs et al., 2004; Newmann,
1991; Sammoms et al., 1998; Scheerens & Bosker, 1997; Scheerens, 1990, 1992; Teddlie,
1994a, 1994b). Of importance is professional leadership in which leadership is firm,
purposeful, and participative in nature (Sammons, 1999). This can be seen in the amount of
time the principal spends on educational matters and the amount of time spent on
instructional issues (Scheerens, 1990).
School-based staff development also has a bearing on achievement (Howie, 2002; Muijs et
al., 2004; Sammons, 1999; Teddlie, 1994b). Whether or not professional development
support schemes are present, can be deduced from a school’s policies. It is also important
that professional development is linked to the school and embedded in the workplace (Muijs
et al., 2004).
School climate is another factor correlating with learner performance. School climate is
characterised by an orderly atmosphere in which there are rules and regulations, punishment
as well as reward, where absenteeism and dropout is monitored and the behaviour and
conduct of learners are taken into account. Internal relationships are also highlighted here, in
terms of priorities, perceptions, and relationships between the various parties in the school,
appraisal of roles and tasks and the facilities and buildings (Adewuyi, 2002; Heck, 2000;
Marsh, 1992; Muijs et al.; 2004; Sammons, 1999; Scheerens & Bosker, 1997; Scheerens,
1990, 1992; Teddlie, 1994a).
Likewise, classroom-level performance is influenced by the classroom climate. Classroom
climate is characterised by relationships within the classroom - between learners and
between educator and learners - whether order and discipline are maintained, attitudes
towards work done within the classroom and the satisfaction with the classroom environment
(Marsh, 1992; Scheerens & Bosker, 1997; Scheerens, 2001b; Teddlie, 1994c; Willm &
Somers, 2001).
Consensus and cohesion among staff are also viewed as important correlates of
performance, which is illustrated by the type and frequency of meetings and consultations,
content sharing and extent of co-operation as well as educator satisfaction levels with regard
to co-operation. In addition, the importance attributed to co-operation and the various
56
indicators of successful co-operation is of importance (Marsh, 1992; Scheerens & Bosker,
1997; Scheerens, 1990, 1992). Shared vision and goals signalling unity of purpose and
consistency of practice stimulate an environment of collegiality and collaboration (Newmann,
1991; Sammoms et al., 1998; Sammons, 1999). It is of significance that, a mission statement
should be in place, that staff are actively involved in planning and decision-making and that
there is a measure of organisational cohesion (Grey, et al., 1999; Mortimore, 1998).
Apart from educator coherence, curriculum quality and opportunities to learn are considered
to be important factors affecting learner performance. Here opportunities to learn refer to the
extent to which what is taught is tested (Scheerens, 1992). Learners who have been exposed
to material included in assessments tend to fare better (Scheerens, 1990). The way the
curricular priorities and objectives are set out, the choice and application of methods and
textbooks, opportunities for learning and the satisfaction with the curriculum are relevant
when addressing factors that influence performance (Adewuyi, 2002; Hill, 2001; Marsh, 1992;
Newmann, 1991; Scheerens & Bosker, 1997; Scheerens, 1990; Scheerens, 1992; Teddlie,
1994c).
Effective learning time, often referred to in the literature as time-on-task or time allocated to
learning activities, is also of importance when considering factors associated with
performance. Monitoring of absenteeism, classroom management, and homework are also
important determinants (Bliss, 1991; Hill, 2001; Howie, 2002; Marsh, 1992; Newmann, 1991;
Sammoms et al, 1998; Scheerens & Bosker, 1997; Scheerens, 1992; Teddlie, 1994a,
1994c). Also of significance are specific aspects of learning time, such as duration of classes,
school day, week or year, i.e. the actual time spent on task-related work (Scheerens, 1990).
The specific aspects of learning time do not include homework, although research indicates
that homework does correlate with achievement (Cotton, 2001; Nkhoma, 2002) as this is an
extension of learning time (Cotton, 2001). Homework that is assigned regularly is positively
related to learner attitudes towards school, subject, and homework itself (Cotton, 2001).
Furthermore, approaches to teaching such as independent learning (Scheerens & Bosker,
1997), not grouping learners by ability (Scheerens, 2001a; Willms & Somers, 2001) and co-
operative learning (Teddlie, 1994c) are considered important.
The structure of instruction in addition to effective learning time is important. Under structure
is understood the preparation of lessons, structure of lessons, direct instruction, monitoring
and maximisation of learning time (Hill, 2001; Marsh, 1992; Scheerens & Bosker, 1997;
Scheerens & Creemers, 1999; Scheerens, 2001a). Teaching should be purposeful and
efficiently organised. The purpose should be clear with lessons being structured so that they
57
are flexible and adaptable (Sammons, 1999; Scheerens, 1990, 1992). The monitoring of
class work is also important and entails the educator moving around the classroom, being
aware of how well or how poorly learners are faring with assignments and working with
learners one-to-one if need be (Cotton, 2001), thus indicating differentiation in terms of
general orientation and special attention given to learners at risk (Marsh, 1992; Scheerens &
Bosker, 1997).
Monitoring of learner progress, making use of monitoring systems, school process
evaluation, and the use of the evaluation results and satisfaction with evaluation activities all
have an effect on learner performance (Heck, 2000; Marsh, 1992; Mortimore, 1998;
Scheerens & Bosker, 1997; Scheerens & Creemers, 1999; Scheerens, 1992; Scheerens,
2001a; Teddlie, 1994a). Monitoring here refers to the tracking of learner performance, by
including the frequency of assessments as well as making use of computer programs to track
learner progress at all grades are key (Cotton, 2001; Sammons, 1999; Scheerens, 1990).
Reinforcement in the form of rewards and incentives as well as feedback, is related to learner
performance (Mortimore, 1999; Scheerens & Bosker, 1997; Scheerens, 2001a), especially
positive reinforcement in which there is clear and fair discipline as well as feedback
(Sammons, 1999; Raffan & Ruthen, 2003). Feedback provides the opportunity to let learners
know how they are faring, helps in the correction of errors, and fills gaps in their knowledge
base (Cotton, 2001). Motivation is widely used in many studies and is linked to reinforcement
(Scheerens, 1990). Motivation is an internal process, originating from a variety of sources,
such as needs or cognition. It impacts on such behaviour patterns as the desire to achieve
academically or the desire to learn, striving for excellence and personal incentives (Raffan &
Ruthven, 2003; Waugh, 2001). Motivation can be viewed as the degree to which learners are
willing to commit to achieve a goal and is either extrinsic or intrinsic. Extrinsic motivation is
motivation that comes from outside the learner, such as a tangible reward, while intrinsic
motivation comes from within the learner because s/he wants to set the goal for personal
satisfaction (Haladyna, 2002).
Additional learner-level factors include learner rights and responsibilities in which issues of
learner self-esteem, self-concept and learner aspirations have an impact on achievement
(Grobler, Grobler & Esterhuyse, 2001; Howie, 2002; Mortimore, 1998; Sammons, 1999).
Learner rights and responsibilities refer to the extent to which learners are involved in school
related activities whereby learners acquire a sense of ownership in the school and their own
learning (Mortimore, 1998).
58
Finally, parental involvement in school affairs such as participation in the development of
school policies – regarded as an important form of contact with parents - and general school
satisfaction with parental involvement have been found to be correlates of performance
(Heck, 2000; Hill, 2001; Mortimore, 1998; Muijs et al., 2004; Newmann, 1991; Sammoms et
al., 1998; Scheerens & Bosker, 1997; Scheerens, 1992; Scheerens, 2001a; Willms &
Somers, 2001). The home-school partnership, in which parental involvement occurs in the
learning process, (Sammons, 1999; Scheerens, 2001b), in which strategies are used to
involve parents or significant others (Grey et al, 1999) and in which parents motivate their
children to learn, to do their homework and to use their time efficiently (Van der Werf,
Creemers & Guldmond, 2001) is therefore important.
Scheerens and Bosker (1997) state that effectiveness-enhancing conditions appear to be
measured by assigning priority to factors and components in terms of attitudes, beliefs and
goals as well as the factual state of affairs. All of this is relevant in the appraisal of the degree
to which the various factors and components are achieved. Even though the various factors
mentioned by authors in the preceding paragraphs are based on literature from the
international arena, there is reason to believe that a correlation with developing countries can
be established, seeing that in the developing world similar factors are highlighted as being
important.
However, Scheerens and Bosker (1997) warn that most factors are broad when the
components associated with them are considered. This makes it difficult to identify which set
of elements is crucial in enhancing effectiveness. The divergence and broadness of the
factors also make identifying single definitions of each factor difficult, as these could be
operationalised differently across studies (Fertig, 2000). Much of the literature, which forms
the body of knowledge, takes the form of a review of reviews or meta-evaluations with only a
small number of studies providing evidence, which critics view as a serious drawback.
Furthermore, the context of developed versus developing world needs to be taken into
consideration. In the developing world, school effectiveness research is characterised by
differences between schools, variations in stability and the consistency of school inputs
(Fertig, 2000) as well as cultural contingencies and the challenges of studying classroom
processes where a mixed method approach is preferable (Fertig, 2000; Scheerens, 2001a,
2001b).
Fuller and Clark (1994) emphasise that school effectiveness research in the developing
countries context has to follow a dual process: researchers and policy makers who wish to
59
identify inputs into the system in order to raise learner achievement have to consider cultural
conditions and “culturalists” will have to link classroom processes to effects or as accepted in
school effectiveness research trends (Sammons, 2006). Research indicates that material and
human resource input factors have stronger effects in developing countries than in developed
countries (Scheerens, 2001a) which, in developed countries, there are no consistent
inferences which can be drawn with regard to family inputs (Hanushek, 1997).
While school effectiveness models are not as volatile as critics would have it, they are still not
as firmly established as some enthusiasts proclaim (Wyatt, 1996). Studies of school
effectiveness in developing countries should make use of the advanced statistical analysis
available, i.e. multilevel analysis, an element that has been missing in school effectiveness
research generated in developing countries. Studies should also make use of baseline
measures of outcomes if school effects are to be inferred (Riddell, 1997).
2.8 Conclusion
The use of school performance data has great potential to contribute to improvement efforts;
but, at the same time, if handled ineptly, the research could prove to be irrelevant or create a
situation, which would have been better if it were avoided altogether (Wyatt, 1996).
Nevertheless, it could be said that learning is determined by the quality of education,
provided by schools, that includes all that learners do in the classroom. Teaching and
learning should be an interactive process. For this to take place, schools need to know not
only how their learners are progressing but also what learner difficulties are being
experienced so that the needs of the learners can be met (Black & Wiliam, 1998). Adequate
monitoring systems could be of use in this regard.
In this chapter, different types of monitoring systems have been discussed namely the ZEBO
project in the Netherlands, the VCE data project in Australia, and the ABC+ model in the
United States. The need for projects such as these arose out of policy initiatives undertaken
by local and national government. The aim of these projects was to develop tools which
schools could use for self-evaluation purposes so that adequate interventions could be put in
place if need be.
Value-added monitoring systems were also discussed in this chapter. The way in which
value-added measures are used to produce the necessary information is of vital importance
in order to find measures that would best suit the South African context. Different approaches
can be learnt from in order to develop a system that is focused on the improvement of
60
learners and quality of education by raising expectations regardless of background
characteristics. Two approaches have been discussed, namely a curriculum-based approach
and a developed abilities approach. Both approaches yield important information. The
curriculum-based approach makes use of assessments that are grounded in the curriculum
and are administered on a yearly basis so that progress from one grade to another can be
ascertained. This type of system also lends itself to educator accountability, where educators
are held responsible for the lack of progress made by learners. This approach has been
criticised, however, as it could result in “teaching to the test” and, thus, other important skills
are not developed adequately. A developed abilities assessment, on the other hand, provides
baseline information on skills which the learners have already developed (cross-curricula
skills) are then used to predict future performance.
The relationship between abilities and performance was touched upon as well, with
overwhelming evidence that once adequate ways to measure prior achievement in terms of
abilities have been developed, these could be used to predict future performance. However,
the skills tested in a developed abilities assessment are skills that are taught and thus the
role of skills and abilities was discussed against the backdrop of the curriculum.
Various contextual factors seem to be highlighted by a number of authors, when considering
how performance information should be interpreted. Specifically, factors on a school-level
include resources available to the school, high academic expectations, leadership, and
school climate. Factors on a classroom-level have also been identified, such as educator
expectations, curriculum quality, quality of instruction, monitoring of learner progress,
reinforcement and feedback, and cohesion. On a learner-level, factors such as motivation,
learner responsibilities, and self-conceptualisation have been identified, as well as the role of
parents and the community. These factors have implications for this PhD research, as they
will need to be adequately defined and operationalised in order to explore them within a
developing world context. They can serve as a useful point of departure, to learn from studies
that have taken place elsewhere.
Lessons can be taken from the literature reviewed and be woven into the fabric of the current
research. If quality education is to be investigated, some form of monitoring is needed. The
type of monitoring system used depends on the aim, purpose, or rationale of the system. For
this research, the aim is to develop a system, which schools and educators could use to
monitor learner performance and as a self-evaluation tool for improvement purposes. This
rationale assists in addressing questions of which indicators to include, how data would be
collected and what type of instruments would be most effective. From literature, one finds
61
that either a curriculum-based or a developed ability type assessment could be used. In the
context of South Africa, a situation arises where secondary schools need information on the
basic skills learners have when entering secondary school. These skills can then be built
upon, problematic areas can be identified, and strategies can be developed to focus on
identified areas. The idea here is that content can always be taught; however, if learners do
not have the basic skills necessary, they will have problems accessing and mastering the
content taught and a situation may arise where learners fall further and further behind. The
lack of performance in international content-based or curriculum-based assessments as well
as national content-based or curriculum-based assessments is a case in point. South Africa
has not performed well in international comparative assessments like the TIMSS studies in
2003, 1999, and 1995 (Howie 1997, 2001, HSRC, 2006) as well as the SACMEQ study
(Moloi & Strauss, 2005) where learners performed well below the international averages and
below those of many countries. Likewise the learners performed well below expectation in
the Systemic Evaluation in Grades 3 and 6. The disappointing results could be due to
learners being ill prepared in terms of the content areas in addition to being unable to
achieve the expected assessment standards (National Department of Education, 2005b).
It is evident in the literature that there is a link between ability and academic performance, in
essence, both measure similar aspects (as discussed in 2.5 of this chapter). Thus predictions
about academic performance can be made, based on the results of the developed abilities
assessment. In value-added systems such as the systems employed at the CEM centre this
rationale is used so that, based on the results of the developed abilities assessment,
predictions can be made about academic subjects. The value the school has added is
worked out by comparing the predicted result with the actual result achieved in national
examinations and the difference is then referred to as the value added.
Literature sensitises one to the reality that achievement does not take place in a vacuum.
There are various factors that need to be considered in order to place achievement in
context. The factors, which influence achievement, may vary from context to context.
However, literature suggests that certain factors are more prominent than others are. Thus if
an effective monitoring system is to be developed for the South African context, factors
affecting achievement have to be considered as well. These factors are not just on one level.
The school system forms a hierarchy. Within schools, there are educators and classrooms,
within classrooms there are learners. Because of the constant interaction among levels, it is
only logical to assume that factors from one level have an effect on other levels. Literature
verifies this assumption (Scheerens, 1990; Scheerens & Bosker, 1997). Thus factors from
the school, classroom, and learner-level, have to be included for exploration.
62
The literature reviewed for this research would indicate that, for the South African context, a
developed abilities assessment is preferable to a curriculum-based assessment because
schools will have information about the basic skills that learners are equipped with.
Furthermore, a baseline that makes use of a developed ability assessment provides
measures from which growth can be ascertained and from this the contribution the school
makes to the learning process can be determined. Thus in a context where schools are
becoming more and more accountable for learner performance, a system, such as the one
employed at the CEM centre, using abilities assessments, is beneficial. Schools would be
able to demonstrate the contribution they have made to learners’ learning, relative to the
level at which the learner started.
Additionally, literature indicates that contextual factors should be included when exploring
learner achievement as these factors do influence achievement. In South Africa, as a
developing world context, the factors that would influence achievement have to be
determined. A more compelling reason perhaps for the inclusion of contextual factors may be
that for South Africa, as a result of the apartheid era and disparities in schooling, the
contextual factors have to be taken into account.
63
CHAPTER 3CHAPTER 3CHAPTER 3CHAPTER 3
CONCEPTUAL FRAMEWORK FOR THE STUDYCONCEPTUAL FRAMEWORK FOR THE STUDYCONCEPTUAL FRAMEWORK FOR THE STUDYCONCEPTUAL FRAMEWORK FOR THE STUDY
Several conceptual frameworks related to the topic of monitoring education exist
in literature and in this chapter; three school effectiveness research models are
presented, namely the Creemers model (1994), the Stringfield and Slavin model
(1992) and the Scheerens model (1990). These models are included as they
provide possible components for monitoring the quality of education in South
Africa. Highlighted in particular is the Scheerens model (1990) which is based on
an extensive review of school effectiveness research. School effectiveness
models utilise a systems thinking approach, identifying indicators into the system
(inputs), processes through the system and outputs. Furthermore, the Scheerens
model (1990) takes the multilevel nature of relationships within schools into
account, as well as causal and reciprocal relationships. For these reasons, the
Scheerens model (1990) represents the most likely candidate. However, the
literature used to construct the model is from a developed world context and this
research takes place within a developing world context. Thus adaptations are
needed to reflect the change in context. The adaptations proposed are taken from
literature and debates in the field of school effectiveness research, which are
relevant for a developing world context. The adaptations resulted in a conceptual
model for monitoring education in South Africa. The two main research questions
guiding this research are also discussed in light of the conceptual model.
3.1 Introduction
The aim of this research is to develop a monitoring system for secondary schools, which can
be used to gauge the effectiveness of teaching and learning or the quality of education
learners are receiving. The notion of quality in education has been discussed in Chapter 1 as
well as in Chapter 2. The use of indicators, which provide the basis for monitoring systems, in
order to measure the characteristics of educational systems have been alluded to but not
discussed in depth.
The idea behind the use of indicators is to identify key aspects that would provide a snapshot
of current conditions within the education system. Furthermore, indicators are statistics,
64
which provide a benchmark against which quality can be evaluated, thus quality can be
monitored (Scheerens et al., 2003). Indicators provide summary information about the
functioning of an area of the system with the intention to inform stakeholders and serve as a
basis from which improvements may be suggested, thus reflecting the condition of an aspect
of the education system or of the system as a whole. Moreover, indicators provide
diagnostics tools from which aims, goals, or expectations can be evaluated and future aims,
goals, or expectations can be identified (Bottani & Tuijnman, 1994). Indicators are the basic
building blocks used to construct conceptual models in school effectiveness research.
In the section to follow (3.2) models of school effectiveness are discussed, with the
Scheerens model (1990) elaborated on in 3.3 This is followed by a comprehensive
discussion of the conceptual model used in this research (3.4) as well as the specific
research questions (3.5).
3.2 School effectiveness models
Indicators are central in monitoring systems based on school effectiveness research. In
recent years, research on school effectiveness using different approaches to educational
effectiveness has been integrated, resulting in the technical and conceptual development in
the field. For example, indicators are carefully considered before including them for study and
the use of multilevel analysis has facilitated the analysis of “nested” data where the central
assumption is that higher-level variables facilitate conditions that enhance effectiveness at
lower-levels (Scheerens et al., 2003). Various models have been developed based on an
integrated approach, such as the Creemers model, Stringfield and Slavin model, as well as
the Scheerens model. These models have three things in common:
� They are conceptualised in terms of a basic systems model with inputs, processes,
and context of schooling;
� They have a multilevel structure, which implies that the school system can be
thought of as an onion with one layer “nested” within another;
� They include complex causal structures, where certain components are dynamic
and certain components are static (Scheerens, 1997).
Various levels, like the layers of an onion, could exist within the school, such as the learner-
level, classroom-level, and the school-level. However, within the education system higher
additional levels could be identified, such as community and parental-level, district-level,
provincial-level, and the national-level. The models discussed, in the section to follow,
65
include various levels ranging from strictly school-based levels (school, classroom, and
learner-level) to broader system levels (such as community and parental-level).
Creemers (1994) developed a model that focused specifically on the classroom-level and
essentials of effective instruction elements, as can be seen in his integrated model for
educational effectiveness developed in 1994. The integrated model developed by Creemers
makes provision for the assumption that higher-level school organisational and contextual
conditions facilitate lower-level conditions. Therefore, the context of the education board
policy targets attainment, material, and financial conditions, which is seen as facilitating
conditions on the school-level. In the same way, school-level aspects such as the school
work plan, school organisation and material conditions facilitate conditions on the classroom-
level. Of importance on a classroom-level, are indicators such as training and experience,
instruction, including method, grouping pattern and educator behaviour. The instruction
component has an effect on effective learning time and the opportunity to learn. Classroom-
level components facilitate conditions on the learner-level and learner achievement. Learner
aptitude, socio-economic status (SES) and peer group are seen as contributing factors to
achievement, while learner achievement has an effect on learner motivation and
perseverance (Scheerens, 1997).
The second model to be discussed is that of Stringfield and Slavin (Stringfield, 1994). The
model developed by Stringfield and Slavin in 1992 is an integrated model known as the
Quality, Appropriateness, Incentive and Time of instruction/Meaningful goals, Attention to
academic focus, Coordination, Recruitment and training as well as Organisation or
QAIT/MACRO for short (Scheerens, 1997). This model of elementary school effects has four
levels, each with its own discernable elements (Stringfield, 1994):
� The learner-level, which includes elements such as ability to understand instruction,
perseverance, opportunity and the quality of instruction;
� The level of groups providing school relevant instruction, including parents, educators,
and persons giving additional academic support. Elements at this level are quality,
appropriateness, incentives and time;
� The school-level, including meaningful goals, attention to academic functioning,
coordination of curricula and instruction, recruitment and development of staff, and the
organisation of the school to support universal learner learning;
� The groups-beyond-the-school-level include the community, school district, state
sources of programming, funding, and assessment
66
The third model is that of Scheerens (1990), which is discussed in detail in the section to
follow. The model is based on a context-input-process-output model that originated in
systems thinking and has been widely used in school effectiveness research (Scheerens,
2000). Incorporating systems thinking in the model, in which indicators associated with the
inputs into the system, the processes through the system and the output are central, this
model takes the multilevel nature of relationships into account as well as the intermediate
causal effects and reciprocal relationships (Scheerens, 1992). These characteristics make
the model suitable as the basis from which a conceptual model for monitoring education in
South Africa can be developed.
3.3 Scheeren’s model for school effectiveness research
This model developed by Scheerens (1990) is based on a review of school effectiveness
research. The model developed by Scheerens (1990) can be called an integrated model as it
draws heavily on production functions, instructional effectiveness, and school effectiveness
literature. Essentially the Scheerens model is used as the basis to carry out meta-analyses
as well as multilevel analyses (Scheerens, 2000). According to Scheerens (2000, p. 55) the
“choice of variables in this model is supported by the ‘review of reviews’ on school
effectiveness research.”
As with the two models discussed above, the Scheerens model sees higher-level conditions
as facilitating lower-level conditions (Scheerens & Bosker, 1997). In addition, the model
makes provision for the nested structure found within the education system. The use of data
on the different levels allows for the analysis of variation between units and also allows better
adjustments to be made so that it is possible to draw more valid causal inferences
(Scheerens et al., 2003). Statistical models based on the conceptual model make across-
level interpretations possible for the investigation of direct effects, indirect effects and
interaction effects. Thus it is possible to investigate the direct effects of school characteristics
on learner outputs but also indirect effects mediated by classroom-level conditions. The
interactions of these are then interpreted as values of higher-level variables working in
conjunction with intermediary conditions (Scheerens, 1997). Figure 3.1 illustrates the
Scheerens (1990) model.
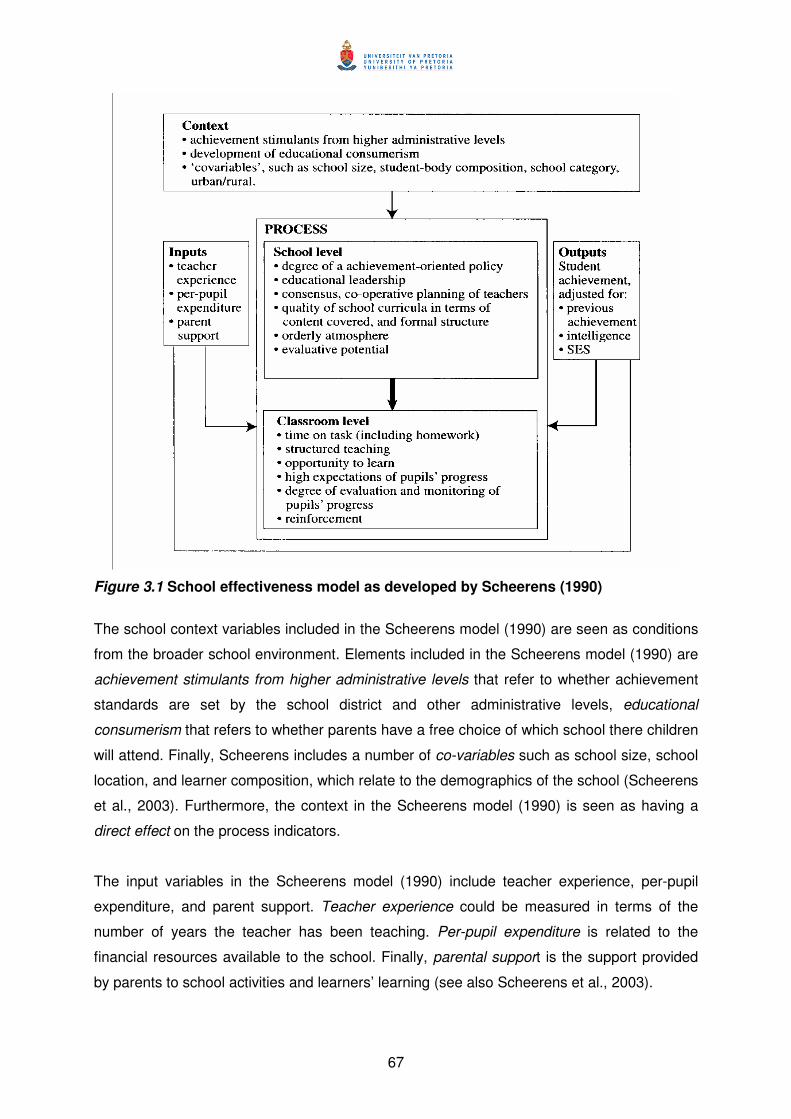
67
Figure 3.1 School effectiveness model as developed by Scheerens (1990)
The school context variables included in the Scheerens model (1990) are seen as conditions
from the broader school environment. Elements included in the Scheerens model (1990) are
achievement stimulants from higher administrative levels that refer to whether achievement
standards are set by the school district and other administrative levels, educational
consumerism that refers to whether parents have a free choice of which school there children
will attend. Finally, Scheerens includes a number of co-variables such as school size, school
location, and learner composition, which relate to the demographics of the school (Scheerens
et al., 2003). Furthermore, the context in the Scheerens model (1990) is seen as having a
direct effect on the process indicators.
The input variables in the Scheerens model (1990) include teacher experience, per-pupil
expenditure, and parent support. Teacher experience could be measured in terms of the
number of years the teacher has been teaching. Per-pupil expenditure is related to the
financial resources available to the school. Finally, parental support is the support provided
by parents to school activities and learners’ learning (see also Scheerens et al., 2003).
68
In the Scheerens model (1990), the process mechanisms can be divided into two levels,
namely the school-level and the classroom-level. Variables included on the school-level
include the following (see also Scheerens et al., 2003):
� The degree of an achievement oriented policy such as whether there is a set of
achievement standards and whether schools measure achievement against local
constituency standards.
� Educational leadership refers to the amount of time spent on educational matters as well
as appraisal of educators and the amount of time dedicated to instructional matters
during staff meetings.
� Consensus and cooperative planning of educators are articulated in terms of the type
and frequency of meetings, nature of cooperation as well as importance attributed to
cooperation.
� Quality of curricula is seen as the cornerstone of the most important function of
education. Quality of curricula includes indicating clear targets, formal structure, and the
degree to which the specified content is covered.
� Orderly environment refers to the school climate in which there is good discipline and the
learner behaviour is considered acceptable.
� Evaluative potential expresses the aspirations and possibilities of schools to make use of
evaluation mechanisms with the aim of improving learning and feedback at various
levels within the school.
Variables on a classroom-level include:
� Time on task as defined in terms of instruction time (Scheerens et al., 2003), the
duration of lesson periods spent on task related activities as well as whether or not
homework is given (Scheerens, 1990).
� Structured teaching which is seen in the use of lesson plans, preparation and use of
materials (see also Scheerens et al., 2003) as well as stating objectives clearly,
providing well sequenced units and providing feedback (Scheerens, 1990).
� Opportunity to learn which can be thought of as the overlap of what is assessed and
what has been covered in lessons (Scheerens, 1990).
� High expectations of learner progress, which is the degree to which educators strive for
high learner achievement (see also Scheerens et al., 2003).
� Degree of evaluation and monitoring of learner progress as seen in the evaluation of
assessment results in order to ascertain learner progress (see also Scheerens et al.,
2003), as well as the frequency of assessments and standardised tests (Scheerens,
1999).

69
� Reinforcement, which is the extent to which assignments are discussed, whether
mistakes are corrected, as well as the frequency of discussing progress (see also
Scheerens et al., 2003).
The final component of the Scheerens (1990) model is the output in which only one variable
or factor has been included which is in line with school effectiveness research namely learner
achievement. However, Scheerens (1990) stipulates that learner achievement is not taken on
raw scores but is evaluated in light of previous achievement, intelligence, as well as socio-
economic status.
3.4 Model for monitoring education in South Africa
According to Scheerens (2000, p. 36):
In developing countries there is a strong predominance of studies of the
education production function type. Relatively few of these studies have been
expanded to include school organizational and instructional variables.
Of the three models of school effectiveness discussed above, the Scheerens model (1990)
would possibly be best suited as a framework for monitoring education in South Africa as it
does include production functions, instructional effectiveness, and school effectiveness
variables. Not only does the model include the various levels of the school system, it is also
based on a ‘review of reviews’ providing a framework for meta-analyses and re-analyses of
international datasets (Scheerens, 2000). The literature used to develop this model comes
predominantly from the developed world whereas the current research takes place within a
developing country context. Therefore the applicability of the model needs to be evaluated
against the backdrop of evidence emerging from developing countries.
In a literature review carried out on school effectiveness research in developing countries
Fuller and Clark (1994) found that a substantial number of research projects were
undertaken in primary schools with a limited number of research projects undertaken at the
secondary school-level. In addition, factors which are in the control of policymakers and
which are easier to measure such as average class size and textbook supply have received
considerable attention with very little work done on what occurs inside the classroom. Fuller
and Clark go on to argue that only modest progress has been made in specifying which
conditions are likely to impact learner performance and that little work is done showing how
basic inputs are mobilised within classrooms. Furthermore, Fuller and Clark are of the
70
contention that accumulating more evidence without linking inputs to educator practices is a
less than fruitful exercise and that local context highlighting cultural variation is an important
aspect that has been ignored. Local conditions highlighted by Fuller and Clark include the
family’s demand for schooling, the school’s aggregated influence on learning via contextual
forces, the indigenous character of knowledge being instructed in the classroom, the level of
complexity of the demands on educators inside the classroom and the meaning of
pedagogical behaviours.
The Systemic Evaluation of Grade 6 learners found that certain contextual factors were
associated with learner achievement (National Department of Education, 2005b). These
factors included socio-economic status, information available at school and at home, parental
involvement, homework practices, learning material and textbooks. Other factors are
resources available to the educators, school resources, school fees, staff qualifications,
learner participation, educator and learner attendance, discipline and safety and throughput
rates as seen as the time it took learners to complete Grade 4-6 (National Department of
Education, 2005b).
In addition to Fuller and Clark (1994), Scheerens (2001a) undertook a review of school
effectiveness research emerging from developing countries for the World Bank. The results
indicate that three major conclusions could be drawn from the emerging research. Firstly,
there is considerably larger between-school variation in developing countries as opposed to
developed countries. Secondly, there is a consistent and strong effect of material and human
input factors. Finally, there is weak and at times inconclusive evidence on instructional
factors that have research support from developed countries.
An additional concern pertains to the redundancy of school effectiveness research in
developing countries as a result of the lack of methodological sophistication (Riddell, 1997).
So, not only has very little work been undertaken in secondary schools as far as school
effectiveness research in developing countries is concerned but the way in which analysis is
being undertaken is also highlighted. Furthermore, studies that are taking place in a
developing world context do not always consider factors such as family’s demand for
schooling, the school’s aggregated influence on learning via contextual forces or the
indigenous character of knowledge. As a rule studies do not focus on instructional processes
on a classroom-level either, resulting in a dearth of studies of this nature. Scheerens (2001a)
states that the use of multilevel school effectiveness studies could in principle be used to
allow for the study of instructional processes. Multilevel analysis could be used to integrate
conditions at school and classroom-levels that could address the cultural concerns that have
71
been raised by Fuller and Clark (1994) as well as address the concern that school
effectiveness research in developing countries runs the risk of becoming redundant.
What are the implications for the development of a framework for monitoring education in a
developing world context? Firstly, the Scheerens model (1990), although a useful point of
departure, in its current form does not take into account factors emerging from the
developing world context, namely the strong effect of material and human input factors,
comprehensive factors relating to instructional processes, the role of the school, educator
and contextual factors. Secondly, important measures of system level policy concerns are
not covered in the model developed by Scheerens (1990) and Scheerens et al. (2003) warn
that the model as it currently stands should not be seen as a tool to be used in solving all
educational problems, especially in a developing world context. Finally, the Scheerens model
(1990) was developed as a general integrated model of educational effectiveness, whereas
the conceptual model of this study focuses specifically on factors that could elucidate school
functioning for monitoring purposes.
The Scheerens model (1990) in its present form is not ideal as it does not include literature
from the developing world and certain adaptations have been made based on the literature
and debates presented in Chapter 2 (Fuller & Clark, 1994; Gray et al, 1999; Howie, 2002;
Leithwood, Aitken & Jantzi, 2001; Mortimore & Sammons, 1994; Riddell, 1997; Sammons,
1999; Scheerens & Bosker, 1997; Scheerens, 1999, 2000). In addition, literature pertaining
to monitoring systems in a developing world context has been presented in this chapter and
could inform a model for monitoring education in developing countries, specifically South
Africa. Figure 3.2 visually depicts the conceptual model for monitoring education in South
Africa.
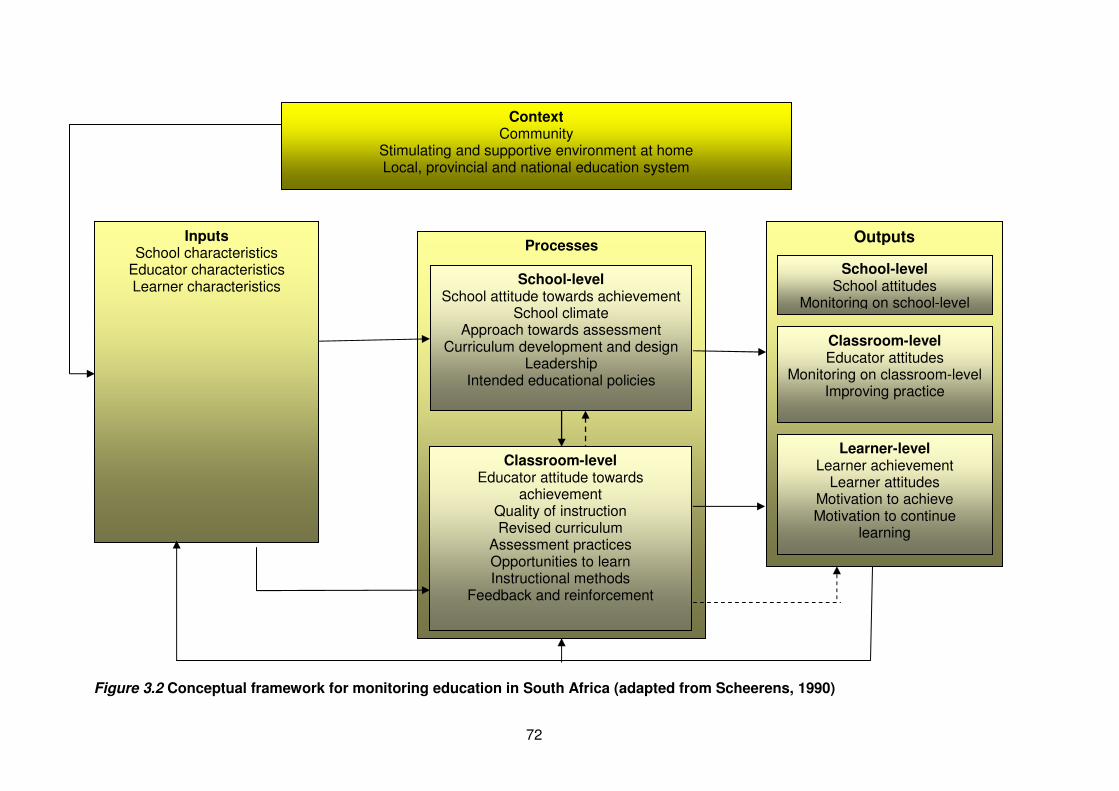
72
Figure 3.2 Conceptual framework for monitoring education in South Africa (adapted from Scheerens, 1990)
Context Community
Stimulating and supportive environment at home Local, provincial and national education system
Inputs School characteristics
Educator characteristics Learner characteristics
Processes
School-level School attitude towards achievement
School climate Approach towards assessment
Curriculum development and design Leadership
Intended educational policies
Classroom-level Educator attitude towards
achievement Quality of instruction Revised curriculum
Assessment practices Opportunities to learn Instructional methods
Feedback and reinforcement
Outputs
Learner-level Learner achievement
Learner attitudes Motivation to achieve Motivation to continue
learning
Classroom-level Educator attitudes
Monitoring on classroom-level Improving practice
School-level School attitudes
Monitoring on school-level
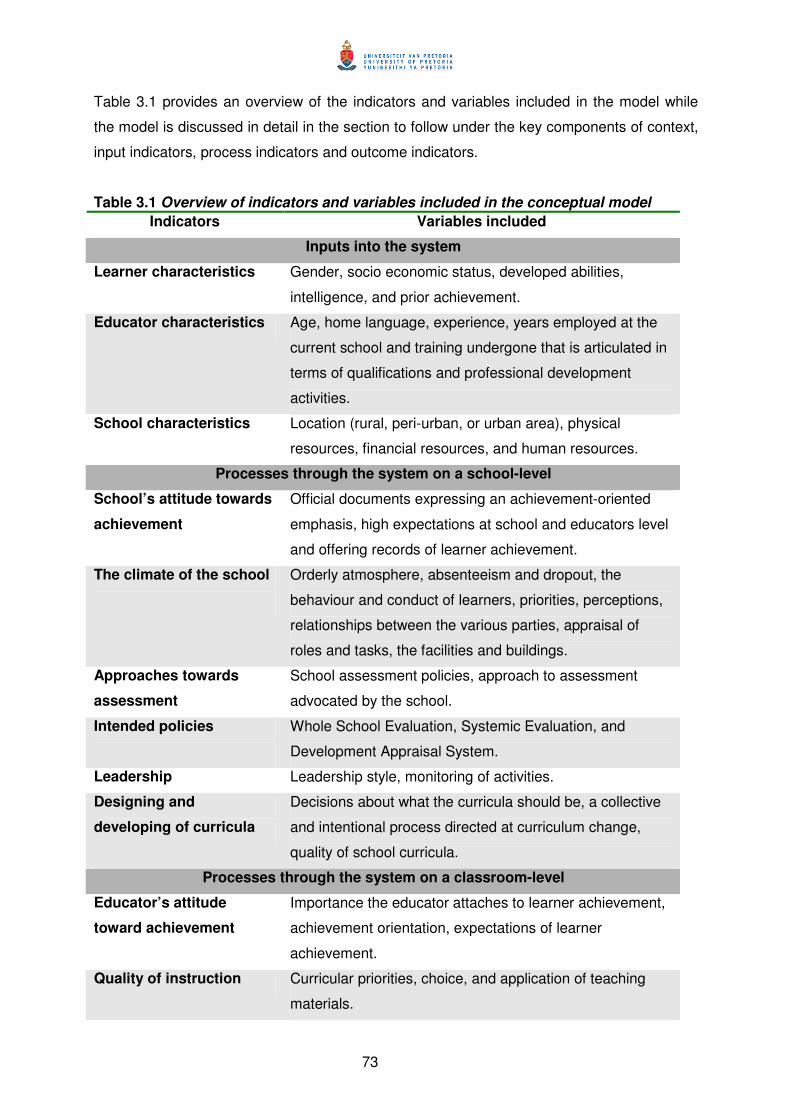
73
Table 3.1 provides an overview of the indicators and variables included in the model while
the model is discussed in detail in the section to follow under the key components of context,
input indicators, process indicators and outcome indicators.
Table 3.1 Overview of indicators and variables included in the conceptual model
Indicators Variables included
Inputs into the system
Learner characteristics Gender, socio economic status, developed abilities,
intelligence, and prior achievement.
Educator characteristics Age, home language, experience, years employed at the
current school and training undergone that is articulated in
terms of qualifications and professional development
activities.
School characteristics Location (rural, peri-urban, or urban area), physical
resources, financial resources, and human resources.
Processes through the system on a school-level
School’s attitude towards
achievement
Official documents expressing an achievement-oriented
emphasis, high expectations at school and educators level
and offering records of learner achievement.
The climate of the school
Orderly atmosphere, absenteeism and dropout, the
behaviour and conduct of learners, priorities, perceptions,
relationships between the various parties, appraisal of
roles and tasks, the facilities and buildings.
Approaches towards
assessment
School assessment policies, approach to assessment
advocated by the school.
Intended policies
Whole School Evaluation, Systemic Evaluation, and
Development Appraisal System.
Leadership Leadership style, monitoring of activities.
Designing and
developing of curricula
Decisions about what the curricula should be, a collective
and intentional process directed at curriculum change,
quality of school curricula.
Processes through the system on a classroom-level
Educator’s attitude
toward achievement
Importance the educator attaches to learner achievement,
achievement orientation, expectations of learner
achievement.
Quality of instruction Curricular priorities, choice, and application of teaching
materials.
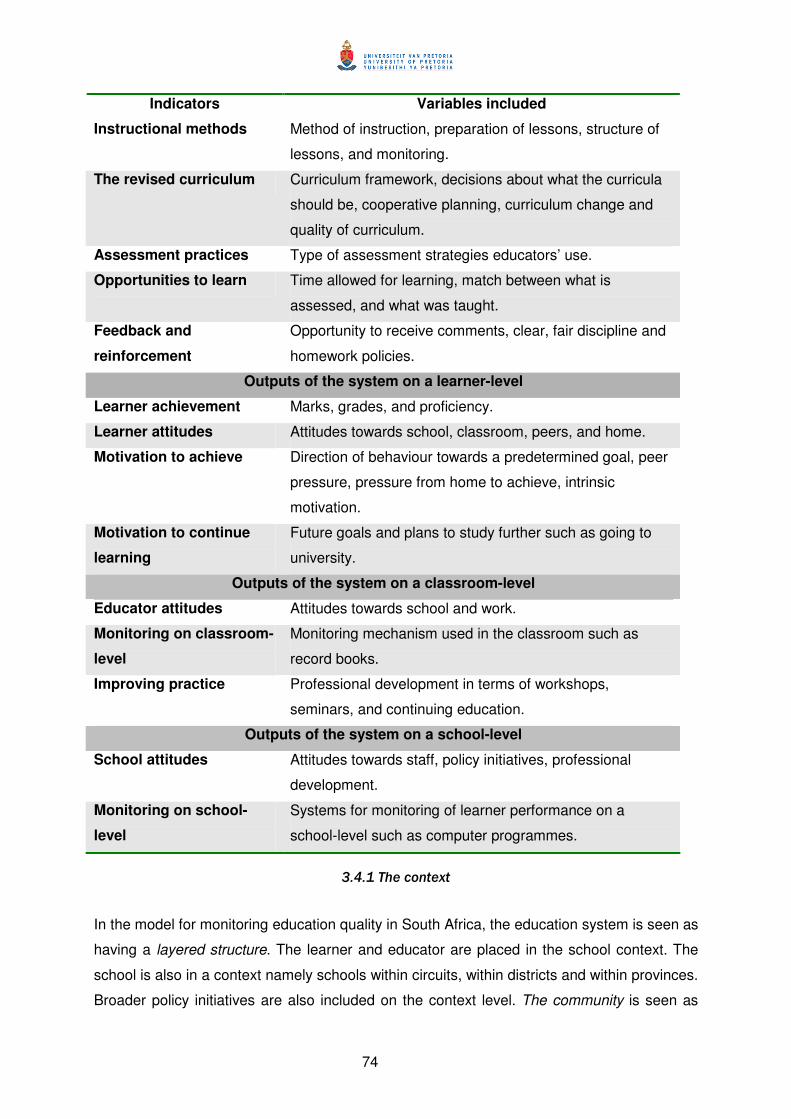
74
Indicators Variables included
Instructional methods Method of instruction, preparation of lessons, structure of
lessons, and monitoring.
The revised curriculum Curriculum framework, decisions about what the curricula
should be, cooperative planning, curriculum change and
quality of curriculum.
Assessment practices Type of assessment strategies educators’ use.
Opportunities to learn Time allowed for learning, match between what is
assessed, and what was taught.
Feedback and
reinforcement
Opportunity to receive comments, clear, fair discipline and
homework policies.
Outputs of the system on a learner-level
Learner achievement Marks, grades, and proficiency.
Learner attitudes Attitudes towards school, classroom, peers, and home.
Motivation to achieve Direction of behaviour towards a predetermined goal, peer
pressure, pressure from home to achieve, intrinsic
motivation.
Motivation to continue
learning
Future goals and plans to study further such as going to
university.
Outputs of the system on a classroom-level
Educator attitudes Attitudes towards school and work.
Monitoring on classroom-
level
Monitoring mechanism used in the classroom such as
record books.
Improving practice Professional development in terms of workshops,
seminars, and continuing education.
Outputs of the system on a school-level
School attitudes Attitudes towards staff, policy initiatives, professional
development.
Monitoring on school-
level
Systems for monitoring of learner performance on a
school-level such as computer programmes.
3.4.1 The context
In the model for monitoring education quality in South Africa, the education system is seen as
having a layered structure. The learner and educator are placed in the school context. The
school is also in a context namely schools within circuits, within districts and within provinces.
Broader policy initiatives are also included on the context level. The community is seen as
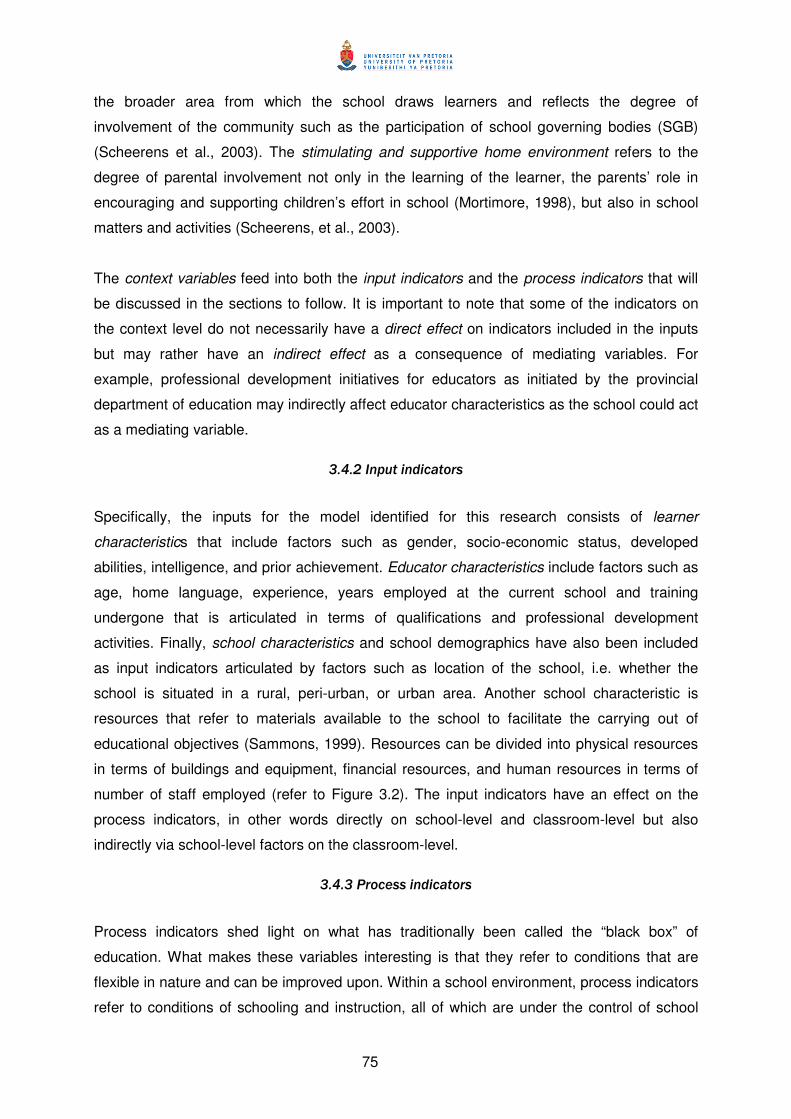
75
the broader area from which the school draws learners and reflects the degree of
involvement of the community such as the participation of school governing bodies (SGB)
(Scheerens et al., 2003). The stimulating and supportive home environment refers to the
degree of parental involvement not only in the learning of the learner, the parents’ role in
encouraging and supporting children’s effort in school (Mortimore, 1998), but also in school
matters and activities (Scheerens, et al., 2003).
The context variables feed into both the input indicators and the process indicators that will
be discussed in the sections to follow. It is important to note that some of the indicators on
the context level do not necessarily have a direct effect on indicators included in the inputs
but may rather have an indirect effect as a consequence of mediating variables. For
example, professional development initiatives for educators as initiated by the provincial
department of education may indirectly affect educator characteristics as the school could act
as a mediating variable.
3.4.2 Input indicators
Specifically, the inputs for the model identified for this research consists of learner
characteristics that include factors such as gender, socio-economic status, developed
abilities, intelligence, and prior achievement. Educator characteristics include factors such as
age, home language, experience, years employed at the current school and training
undergone that is articulated in terms of qualifications and professional development
activities. Finally, school characteristics and school demographics have also been included
as input indicators articulated by factors such as location of the school, i.e. whether the
school is situated in a rural, peri-urban, or urban area. Another school characteristic is
resources that refer to materials available to the school to facilitate the carrying out of
educational objectives (Sammons, 1999). Resources can be divided into physical resources
in terms of buildings and equipment, financial resources, and human resources in terms of
number of staff employed (refer to Figure 3.2). The input indicators have an effect on the
process indicators, in other words directly on school-level and classroom-level but also
indirectly via school-level factors on the classroom-level.
3.4.3 Process indicators
Process indicators shed light on what has traditionally been called the “black box” of
education. What makes these variables interesting is that they refer to conditions that are
flexible in nature and can be improved upon. Within a school environment, process indicators
refer to conditions of schooling and instruction, all of which are under the control of school

76
management and staff (Scheerens et al., 2003). The process mechanisms can be divided
into two levels, namely the school-level and the classroom-level (Figure 3.2).
On the school-level, the key indicators for the conceptual framework include:
� School’s attitude towards achievement. This is articulated in terms of official documents
expressing an achievement oriented emphasis (Scheerens, 1990), which provides a
clear focus for the mastering of basic subjects, stipulates high expectations at school
and educators level as well as offers records of learner achievement (Scheerens &
Bosker, 1997).
� The climate of the school is seen as an orderly atmosphere in which there are rules and
regulations, punishment as well as rewards, where absenteeism and dropout are
monitored and the behaviour and conduct of learners are taken into account. Internal
relationships are also highlighted here in terms of the priorities, perceptions, and
relationships between the various parties in the school, appraisal of roles, tasks of
parties in the school and finally the facilities and buildings available to schools
(Scheerens & Bosker, 1997).
� Approaches to assessment are reflected in whether there are school assessment
policies in place where assessment is viewed as the process of gathering information
(Gay & Airasian, 2003). The approach to assessment is mirrored in the assessment
strategies that are used as advocated by the school and stipulated in an assessment
policy.
� The effect of intended policies such as Whole School Evaluation, Systemic Evaluation,
and Development Appraisal System. These are the policies that Government put in
place for schools and educators to follow. The focus of these policies is to gauge the
extent to which the intended curriculum and the Government legislation on teaching
goals and objectives are adhered to and to monitor school functioning (Bosker &
Visscher, 1999).
� The leadership within the school is characterised by the leadership style of the principal,
e.g. whether s/he is actively involved in the development and monitoring of educational
activities (Scheerens, 1990). This indicator makes provision for general leadership skills
and characterises the school principal as an information provider, coordinator, meta-
controller of classroom processes, instigator of participatory decision-making, and
initiator and facilitator of staff professional development (Scheerens & Bosker, 1997).
� Designing and developing of curricula include decisions about what the curricula should
be; of which cooperative planning is an important component. Collective and intentional
processes or activities directed at beneficial curriculum change are included here (Marsh

77
& Willis, 2003), as well as the design and the development of curricula in which is
reflected the overall quality of school curricula (Bosker & Visscher, 1999).
The following classroom-level indicators are included in the conceptual framework (Figure
3.2):
� Educator’s attitude toward achievement including the importance an educator attaches
to learner achievement, whether the educator has a positive attitude towards
achievement (Mortimore, 1998) and the extent to which educators are achievement
oriented and have positive expectations of learner achievement (Sammons, 1999).
� Quality of instruction is mirrored in the way the curricular priorities are set out, the choice
and application of methods and textbooks utilised and the educator’s satisfaction with
the curriculum (Scheerens & Bosker, 1997).
� Instructional methods. Here is understood the methods used in the classroom and their
degree of effectiveness. This indicator is also reflected in the structure of instruction as
represented by preparation of lessons, structure of lessons, direct instruction, and
monitoring taking place (Scheerens & Bosker, 1997).
� Revised curriculum. A curriculum framework comprises of a set of principles and
guidelines which provides both a philosophical base and an organisational structure for
curriculum development initiatives at all levels, be they nationally, provincially,
community or school-based. This is the framework which is based on the principles of
co-operation, critical thinking, and social responsibility, and which should empower
individuals to participate in all aspects of society (Curriculum, 2005). Reflected in this
indicator are decisions about what the curricula should be, the presence of cooperative
planning, the collective and intentional processes or activities which are directed at
beneficial curriculum change (Marsh & Willis, 2003) and the quality of school curricula
more generally (Bosker & Visscher, 1999).
� Assessment practices represent a type of assessment strategies and methods educators
use in the classroom; it is the process of gathering information (Gay & Airasian, 2003) by
means of various strategies and tools.
� Opportunities afforded learners to learn indicate the amount of time allowed for learning
(Scheerens, 1997) and whether there is a match between what is being assessed and
what has been taught during lessons (Scheerens, 1992).
� Feedback is the opportunity to receive comment (feedback) on work done, comments,
which are clearly understood, timely, and of use in the learning situation. Reinforcement
can be positive or negative. Positive reinforcement is reflected in whether clear, fair
discipline is present and whether feedback is received (Sammons, 1999). Homework is

78
included under this indicator as it forms part of the comments learners receive on
learning. Here the quantity and quality of homework are highlighted (Sammons, 1999).
Conditions on the school-level are seen as facilitating conditions on the classroom-level.
These levels are in interaction with one another and the classroom-level adapts according to
the changes taking place on the school-level (refer to Figure 3.2). Both school-level
conditions and classroom-level conditions have a direct effect on the outputs. However, while
certain school-level conditions have a direct effect on certain elements included in the output,
school-level conditions also have an indirect effect via classroom-level conditions.
3.4.4 Output indicators
The outputs for the conceptual model can be divided into the various levels of the school
system namely the learner, classroom, and school-level (Figure 3.2). Two indicators have
been identified on a school-level, namely school attitudes and monitoring on a school-level,
while three indicators have been identified on a classroom-level, namely educators’ attitudes,
motivation to improve practice and monitoring.
Factors on a school-level are school attitudes and monitoring on a school-level. The latter is
the use of curriculum specific tests and the use of standardised achievement monitoring
systems to track students from one grade level to the next (Scheerens, 1990). These are
articulated as well established mechanisms for monitoring the performance and progress of
learners, classes and the school as a whole and can be formal or informal in nature. The
monitoring system provides a mechanism for determining whether goals are met, focuses
staff and learners on these goals, informs planning, teaching and assessment, and gives a
clear message that the educator and school are interested in progress (Sammons, 1999).
On the classroom-level, motivation to improve practice refers to vocational training
undertaken for professional development purposes (Sammons, 1999) as articulated by in-
service training opportunities, updating policies, and introduction of new programmes
(Taggart & Sammons, 1999). Monitoring on a classroom-level is the monitoring of learner
progress and making use of monitoring systems (Scheerens & Bosker, 1997) that are well
established mechanisms for monitoring the performance and progress of learners and
classes. Monitoring systems provide a mechanism for the educator to determine whether
goals have been met and inform planning, teaching and assessment (Sammons, 1999).
79
The learner-level has four indicators:
� Learner achievement is seen as the current status of learners with respect to proficiency
in given areas of knowledge or skills (Gay & Airasian, 2003).
� Learner attitudes, seen as the emotions that prepare or predispose an individual to
respond consistently in a favourable or unfavourable manner when confronted with a
particular object, a specific affective characteristic (Anderson, 1988). Depending on
whether attitudes are positively or negatively directed towards a particular object, they
can promote or inhibit learner behaviour in the classroom, home, peer group and
ultimately learning (Anderson, 1994).
� Motivation to achieve. Motivation is defined as the cause for initiation, continuation, or
cessation of an activity or behaviour and as the direction of behaviour towards a
predetermined goal. Achievement motivation is described as a pattern of planning, of
actions, and feelings connected with striving to achieve some internalised standard of
excellence (Day, 1988). Academic motivation on the other hand, is concerned with the
factors that determine the direction, intensity, and persistence of behaviour related to
learning and achievement in academic frameworks (Nisan, 1988).
� Motivation to continue education or learning as defined by the initiation of and
persistence in mindful learning in order to attain a future goal (Lens, 1994).
The output indicators as discussed in the previous section are then fed back into the system
by means of input as well as process indicators.
3.5 Specific research questions
Figure 3.2 presents a comprehensive model that can be used to monitor the quality of
education in South Africa. Various indicators have been included in the model on a school-
level, classroom-level, and learner-level. The indicators included are based on literature from
the developed as well as developing world and give a flavour of what is of importance when
the monitoring of education is the main aim. As was seen from the literature review
presented in Chapter 2, the main aim of any monitoring system is to ascertain what learners
achieve academically. This aim is also present in the conceptual framework under learner
outputs. In this research, learner achievement is measured by means of the MidYIS
instrument, which, in addition to the feedback mechanisms, form part of the MidYIS value-
added monitoring system. Thus the first main research question addresses the
appropriateness of the MidYIS system how appropriate is the Middle Years Information
System (MidYIS) as a monitoring system in the South African context?
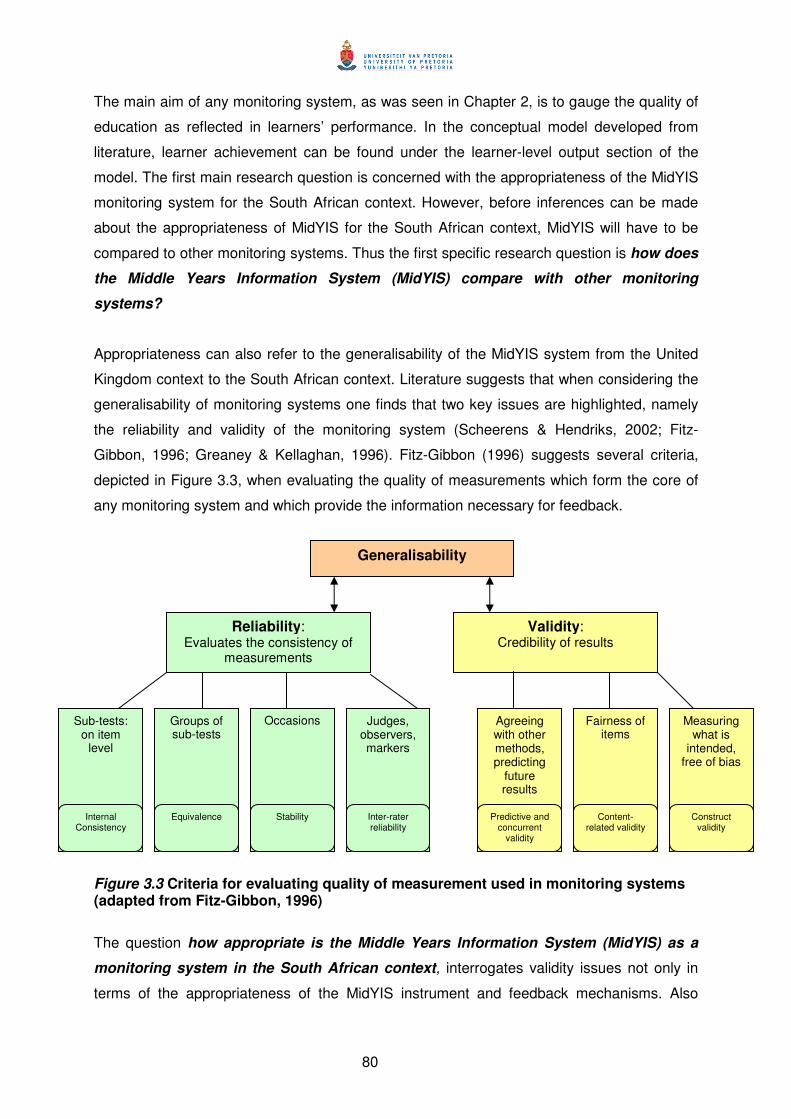
80
The main aim of any monitoring system, as was seen in Chapter 2, is to gauge the quality of
education as reflected in learners’ performance. In the conceptual model developed from
literature, learner achievement can be found under the learner-level output section of the
model. The first main research question is concerned with the appropriateness of the MidYIS
monitoring system for the South African context. However, before inferences can be made
about the appropriateness of MidYIS for the South African context, MidYIS will have to be
compared to other monitoring systems. Thus the first specific research question is how does
the Middle Years Information System (MidYIS) compare with other monitoring
systems?
Appropriateness can also refer to the generalisability of the MidYIS system from the United
Kingdom context to the South African context. Literature suggests that when considering the
generalisability of monitoring systems one finds that two key issues are highlighted, namely
the reliability and validity of the monitoring system (Scheerens & Hendriks, 2002; Fitz-
Gibbon, 1996; Greaney & Kellaghan, 1996). Fitz-Gibbon (1996) suggests several criteria,
depicted in Figure 3.3, when evaluating the quality of measurements which form the core of
any monitoring system and which provide the information necessary for feedback.
Figure 3.3 Criteria for evaluating quality of measurement used in monitoring systems (adapted from Fitz-Gibbon, 1996)
The question how appropriate is the Middle Years Information System (MidYIS) as a
monitoring system in the South African context, interrogates validity issues not only in
terms of the appropriateness of the MidYIS instrument and feedback mechanisms. Also
Generalisability
Reliability: Evaluates the consistency of
measurements
Validity: Credibility of results
Sub-tests: on item
level
Groups of sub-tests
Occasions Judges, observers, markers
Agreeing with other methods, predicting
future results
Fairness of items
Measuring what is
intended, free of bias
Internal Consistency
Equivalence Stability Inter-rater reliability
Predictive and concurrent
validity
Content-related validity
Construct validity
81
assumed is what adaptations need to be made in order for the MidYIS system to be feasible
in the South African context. An important aspect as illustrated by literature (Scheerens &
Hendriks, 2002; Fitz-Gibbon, 1996; Greaney & Kellaghan, 1996) is that of acquiring a valid
measure, which would translate into credibility of results in terms of predictive validity, face
validity and construct validity, as illustrated in Figure 3.3. As South Africa has diverse
schooling conditions, it is important that the instrument can be used in schools that are vastly
different and that the results are consistent (illustrated in Figure 3.3). Therefore, from
literature one finds that in order to investigate the first main research question of how
appropriate the MidYIS monitoring system is for the South African context, issues of validity
and reliability have to be interrogated. Thus a specific research question that is a stepping-
stone to obtain answers to the first main research question is how valid and reliable are the
data generated by the MidYIS monitoring system for South Africa? Here validity is used
as an overarching term that includes content-related validity (which includes face validity as
well as curriculum validity); construct validity and predictive validity, all of which refer to the
credibility of the results and where the term reliable refers to the consistency of results.
A third specific research question can be identified that draws on the two specific research
questions elaborated on in the preceding sections. The specific research question is what
adaptations are needed to transform MidYIS into SASSIS, a monitoring system for the
South African context? In order to fully investigate the MidYIS system as a system, which is
appropriate for South Africa, the characteristics of the MidYIS system has to be interrogated
and suitable changes made. These changes are vital if the monitoring system is ever truly
going to be a system that can be used in South Africa. The MidYIS monitoring system is
elaborated on in Chapter 4 and possible avenues of investigation suggested.
As was seen from the school effectiveness models presented in Chapter 2 and elaborated on
in this chapter, various factors affect performance. This forms the essence of the second
main research question namely which factors could have an effect on learner
performance and therefore inform the design of the monitoring system? The school
system is part of a nested structure, as in the school effectiveness models described in this
chapter. In the models presented in this chapter, the levels of monitoring range from school
specific levels (classroom and learner) to levels from the broader educational system
(districts and provinces). For the purposes of this research, three levels have been identified
for inclusion and form the specific research questions that will be used as stepping stones to
answer the second main research question. The three specific question research questions
encompass the school, classroom, and the learner-level. The context as illustrated in Figure
3.2 is not included for study. The specific research questions are:
82
2.1 What factors on a school-level affect the performance of learners on the
assessment?
2.2 What factors on a classroom-level affect the performance of learners on the
assessment?
2.3 What factors on a learner-level affect performance of learners on the assessment?
2.4 How can the identified factors be included in the design of the monitoring system?
The conceptual model introduced in the previous section was constructed based on literature
and includes factors that affect achievement. Literature suggests that the school has a
hierarchical structure in which one level has an influence on the other (Scheerens & Bosker,
1997). However, when considering factors that are of relevance for a developing world
context, certain factors seem to be stronger or more important than others are. For example,
Fuller and Clark (1994) found that the local context in which schools find themselves is of
importance. Howie (2002) found that the location of the school has an effect on achievement.
Scheerens (2001a) found that material and human input factors were important; this was
corroborated by the Systemic Evaluation Grade 6 (2005) results that highlighted factors such
as learning materials and textbooks, school resources and staff qualifications as well as the
socio-economic status of learners. In addition, Fuller and Clark state that very little research
has been done in developing world contexts on how inputs are mobilised within the
classroom, while Scheerens (2001a) found that there is conflicting information on the role of
instructional factors. However, Howie (2002) found that classroom-level factors as well as
teacher characteristics have an effect on achievement.
In order to address the second main research question, factors from the developing world
literature have to be considered. This includes the input indicators comprising of learner,
educator, and school characteristics, as these indicators provide information pertaining to the
home background of the learner, background information of educators such as qualifications,
gender, and age while school characteristics provide information pertaining to location.
Indicators from the school-level and classroom-level processes were included as found in
literature in the conceptual framework. However, it is recognised that not all these factors will
effect learner achievement as strongly in a developing world context. Therefore a two-fold
approach has been identified consisting of a conceptual approach based on literature and an
empirical approach based on what emerges from the data. From a conceptual point of view
only one school-level process indicator will be included for study namely school attitude to
achievement. On a classroom-level educator attitude towards achievement, quality of
instruction, instructional method, and opportunities to learn have been included because they
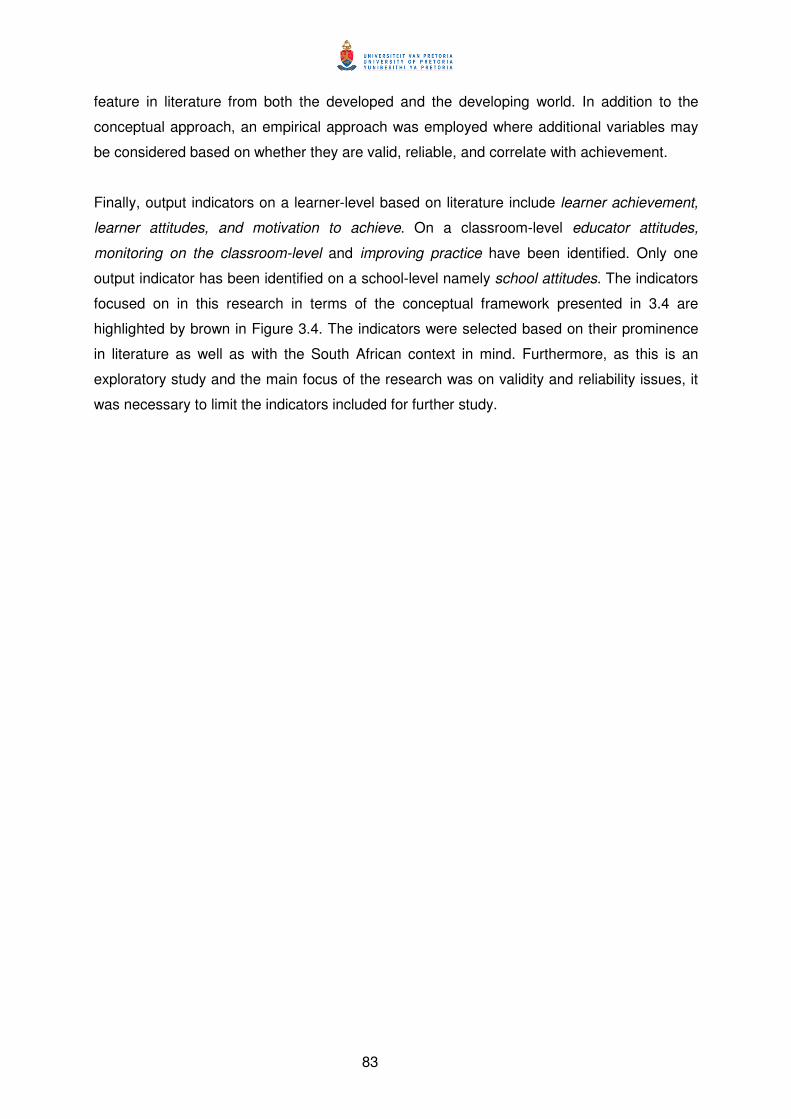
83
feature in literature from both the developed and the developing world. In addition to the
conceptual approach, an empirical approach was employed where additional variables may
be considered based on whether they are valid, reliable, and correlate with achievement.
Finally, output indicators on a learner-level based on literature include learner achievement,
learner attitudes, and motivation to achieve. On a classroom-level educator attitudes,
monitoring on the classroom-level and improving practice have been identified. Only one
output indicator has been identified on a school-level namely school attitudes. The indicators
focused on in this research in terms of the conceptual framework presented in 3.4 are
highlighted by brown in Figure 3.4. The indicators were selected based on their prominence
in literature as well as with the South African context in mind. Furthermore, as this is an
exploratory study and the main focus of the research was on validity and reliability issues, it
was necessary to limit the indicators included for further study.
84
Figure 3.4 Components included for study (adapted from Scheerens, 1990)
Context Community
Stimulating and supportive environment at home Local, provincial and national education system
Inputs School characteristics
Educator characteristics Learner characteristics
Processes
School-level School attitude towards achievement
School climate Approach towards assessment
Curriculum development and design Leadership
Intended educational policies
Classroom-level Educator attitude towards
achievement Quality of instruction Revised curriculum
Assessment practices Opportunities to learn Instructional methods
Feedback and reinforcement
Outputs
Learner-level Learner achievement
Learner attitudes Motivation to achieve Motivation to continue
learning
Classroom-level Educator attitudes
Monitoring on classroom-level Improving practice
School-level School attitudes
Monitoring on school-level
85
3.6 Conclusion
In this chapter, school effectiveness models were reviewed with the aim to ascertain whether
they could be applied as models for monitoring the quality of education in the South African
context. One particular model was focused on, namely the Scheerens model (1990). This
model, although providing a solid point of departure, was found not to be ideal in its present
form. Adaptations based on literature and debates in the field of school effectiveness were
proposed. These adaptations resulted in a conceptual framework for monitoring education in
South Africa that included many features of school effectiveness models, such as having a
multilevel structure and accounting for interactions between variables. The conceptual model,
however, also differs from the Scheerens model in that it includes the type of indicators that
reflect South Africa’s developing world context.
In the conceptual framework proposed for monitoring education, a key element is learner
achievement. The aim of any monitoring system is to ascertain how much learners are
learning in order to make judgements on the effectiveness of education. In the model
presented learner achievement, reflected under the output component and measured using
the MidYIS instrument, encompasses the first research question. As this research focuses on
the school, classroom, and learner-level, variables included under the inputs, processes and
outputs are highlighted for study and encompass the second main research question.
MidYIS as a value-added monitoring system has, however, not been described in detail. In
Chapter 4 the MidYIS monitoring system will be discussed in light of the literature review
presented in Chapter 2. Key criteria, based on literature, are presented as a basis for
evaluating the MidYIS system and for providing a framework within which recommendations
of adaptations can be made.
86
CHAPTER 4CHAPTER 4CHAPTER 4CHAPTER 4
MIDDLE YEARS INFORMATION SYSTEM (MIDYIS): MIDDLE YEARS INFORMATION SYSTEM (MIDYIS): MIDDLE YEARS INFORMATION SYSTEM (MIDYIS): MIDDLE YEARS INFORMATION SYSTEM (MIDYIS):
CHALLENGES AND CHANGESCHALLENGES AND CHANGESCHALLENGES AND CHANGESCHALLENGES AND CHANGES
The use of monitoring systems for internal evaluations in schools is
not new and several countries such as the United States of America,
United Kingdom, the Netherlands, and New Zealand have developed
monitoring systems. In this chapter the monitoring system Middle
Years Information System (MidYIS) developed by the Curriculum,
Evaluation and Management (CEM) centre is discussed as a feasible
option in the context of South Africa. The discussion takes place
against the backdrop of literature. Key characteristics of monitoring
systems have been identified in Chapter 2 and MidYIS is discussed in
light of these characteristics. Core components of the MidYIS system
are highlighted, as well the aim of the project, target population,
administration procedures, instruments used and feedback provided.
4.1 Introduction
In the literature chapter of this dissertation (Chapter 2) various monitoring systems, including
value-added assessment systems were discussed. In this chapter, one system that was not
included in the literature chapter is discussed in depth namely the Middle Years Information
System (MidYIS) which was developed by the Curriculum, Evaluation, and Management
(CEM) Centre at the University of Durham in the United Kingdom.
The Curriculum, Evaluation and Management (CEM) Centre is a research centre at the
University of Durham, England. CEM has done extensive work in developing monitoring
systems that are unique and confidential to schools and colleges (CEM, 2005). Participation
by schools in the projects developed by CEM is voluntary and not enforced by the
government. This approach is in contrast with systems that are imposed on schools by the
national education system. Monitoring systems, like those developed by CEM, were
encouraged by the need to measure outcomes along with process variables and covariates
so that fair comparisons between schools could be made. This was largely in reaction to the
league-tables that evaluated schools from different areas were evaluated as equal. The
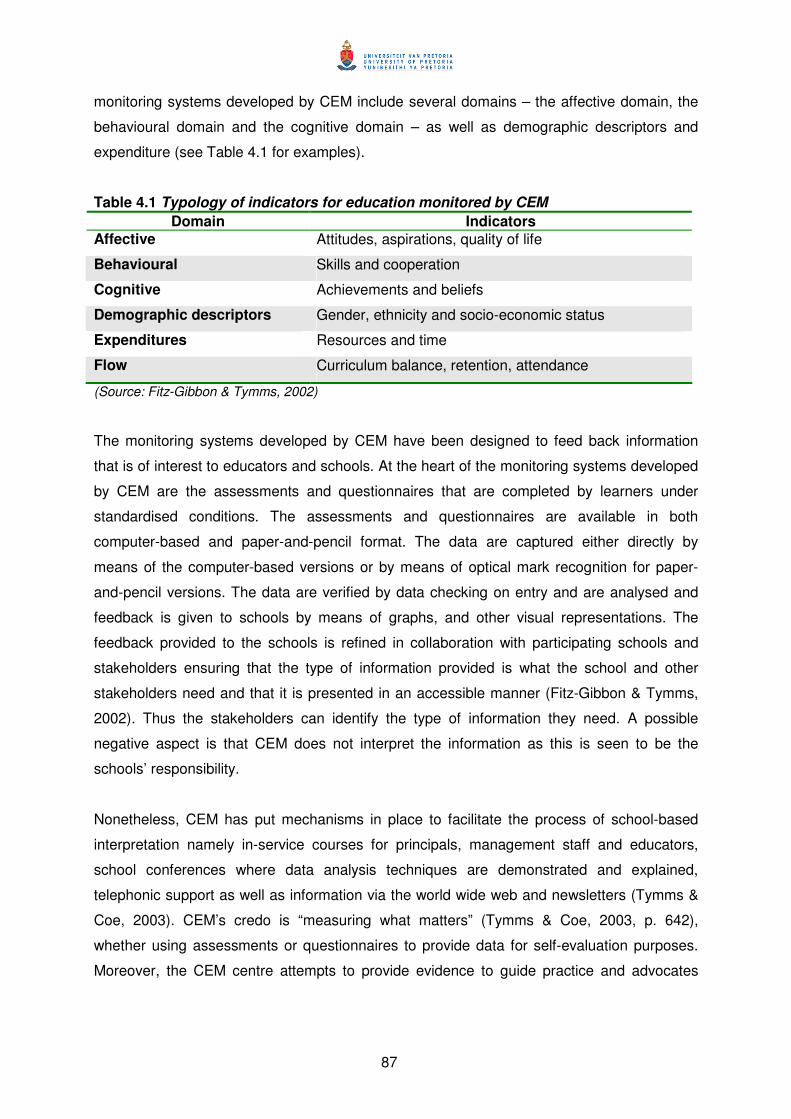
87
monitoring systems developed by CEM include several domains – the affective domain, the
behavioural domain and the cognitive domain – as well as demographic descriptors and
expenditure (see Table 4.1 for examples).
Table 4.1 Typology of indicators for education monitored by CEM
Domain Indicators
Affective Attitudes, aspirations, quality of life
Behavioural Skills and cooperation
Cognitive Achievements and beliefs
Demographic descriptors Gender, ethnicity and socio-economic status
Expenditures Resources and time
Flow Curriculum balance, retention, attendance
(Source: Fitz-Gibbon & Tymms, 2002)
The monitoring systems developed by CEM have been designed to feed back information
that is of interest to educators and schools. At the heart of the monitoring systems developed
by CEM are the assessments and questionnaires that are completed by learners under
standardised conditions. The assessments and questionnaires are available in both
computer-based and paper-and-pencil format. The data are captured either directly by
means of the computer-based versions or by means of optical mark recognition for paper-
and-pencil versions. The data are verified by data checking on entry and are analysed and
feedback is given to schools by means of graphs, and other visual representations. The
feedback provided to the schools is refined in collaboration with participating schools and
stakeholders ensuring that the type of information provided is what the school and other
stakeholders need and that it is presented in an accessible manner (Fitz-Gibbon & Tymms,
2002). Thus the stakeholders can identify the type of information they need. A possible
negative aspect is that CEM does not interpret the information as this is seen to be the
schools’ responsibility.
Nonetheless, CEM has put mechanisms in place to facilitate the process of school-based
interpretation namely in-service courses for principals, management staff and educators,
school conferences where data analysis techniques are demonstrated and explained,
telephonic support as well as information via the world wide web and newsletters (Tymms &
Coe, 2003). CEM’s credo is “measuring what matters” (Tymms & Coe, 2003, p. 642),
whether using assessments or questionnaires to provide data for self-evaluation purposes.
Moreover, the CEM centre attempts to provide evidence to guide practice and advocates
88
processes that are transparent (using ordinary least squares regression instead of multilevel
models) and focuses on the outcome (Tymms & Coe, 2003).
The aim of the present study is to determine whether one of the projects developed by the
CEM centre, the Middle Years Information System (MidYIS) is a feasible monitoring system
for the South African context. MidYIS has been briefly referred to in Chapter 1 but was not
discussed in Chapter 2 because MidYIS is the focus of this research and requires a separate
in-depth discussion. A description of the MidYIS project is given in 4.2 including the aims and
objectives of the project, target population and administration procedures. 4.2 is followed by
an overview of the assessments and questionnaires used (4.3) and then by the feedback
provided (4.4). The MidYIS project is evaluated, in 4.5, against the backdrop of the findings
from Chapter 2 and the arguments presented in favour of MidYIS being used as a viable
monitoring system for the South African context. Recommendations on how this project could
be adapted and extended for the South African context are presented in 4.6.
4.2 MidYIS in the United Kingdom
The MidYIS system, focusing on 11 to 13 year old learners (Year 7 to Year 9), was the last
project to be developed by the CEM centre and was launched in 1996 with a pilot study in
200 schools. The MidYIS system provides an assessment that forms a baseline value-added
measure for secondary schools in the United Kingdom of which 1500 schools are
participating in the project. The MidYIS assessment, a developed abilities assessment, has
been designed to take approximately 45 minutes to complete and provides a good predictor
of later academic achievement (Fitz-Gibbon & Tymms, 2002). In addition, MidYIS provides a
value-added system for two United Kingdom national examinations, namely Key Stage 3 and
General Certificate Secondary Education (GCSE), based on results of the baseline
assessment. In this context, value-added in CEM’s view, refers to the growth in learner
achievement that could be attributed to the efforts made by the school. Thus the focus is on
the “value” the school has added to the achievement of a learner (CEM, 2002c).
A reason why schools would choose MidYIS is possibly because the assessment is
independent of the curriculum. The assessment gives an indication of abilities rather than
strictly academic performance based on primary schools attended and quality of education.
MidYIS also provides a viable alterative baseline to Key Stage 2 tests. Furthermore, with
standardised administration procedures, teachers are not required to do anything.
Audiotapes are used and testing takes place during regular class periods with little disruption

89
to school timetables. Finally, the assessments are externally marked and provide high quality
data with feedback given promptly and results clearly presented (CEM, 2002a).
The aim of MidYIS is to provide secondary schools with a monitoring system that would be
efficient and effective in predicting later achievement and to provide a baseline measure for
value-added (Tymms & Coe, 2003). The CEM centre developed assessments that could be
used for prediction purposes and to work out the “value” the school has added to learners
over time. The idea behind the value-added component is to provide a fair measure of
assessing how learners in one school performed in comparison to learners of similar abilities
from other schools (CEM, 2002a). Furthermore, MidYIS assessments are designed to
measure developed ability and are designed to be relatively curriculum content free. This
baseline is then used to determine how easy or difficult it would be for learners to succeed in
subsequent grades (Fitz-Gibbon & Tymms, 2002).
The MidYIS assessments are administered in England and Wales to Year 7 (or 11 year olds),
Year 8 (or 12 year olds) as well as Year 9 (or 13 year olds) (CEM, 2002b). Year 7
corresponds to the first year of secondary school in England and Wales, while the
assessment is administered in Year 8 in Northern Ireland and P 6 in Scotland (refer to Table
4.2). However, schools may want learners, who were not tested in Year 7, to be tested in
Year 8 or 9 (for England and Wales). In these cases, an additional baseline assessment is
also made available to schools and is designed specifically for learners who did not take part
in the assessment at Year 7 or 8 such as learners who transferred from one school to
another.
Table 4.2 Age group of learners participating in the MidYIS project
The assessment is a paper-and-pencil assessment that is administered under timed
examination conditions. The administration of the assessment is standardised. All learners
hear the same information, are given the same examples, and receive the same amount of
help throughout data collection. By means of having a standardised administration procedure
in place it is possible to provide a measure of typical performance which is both fair to the
participating learners as well as the schools (CEM, 2002b).
Assessment table for the MidYIS project
Age group England and Wales Northern Ireland Scotland
11 + years Year 7 Year 8 P 6
12 + years Year 8 Year 9 S1
13 + years Year 9 Year 10 S2
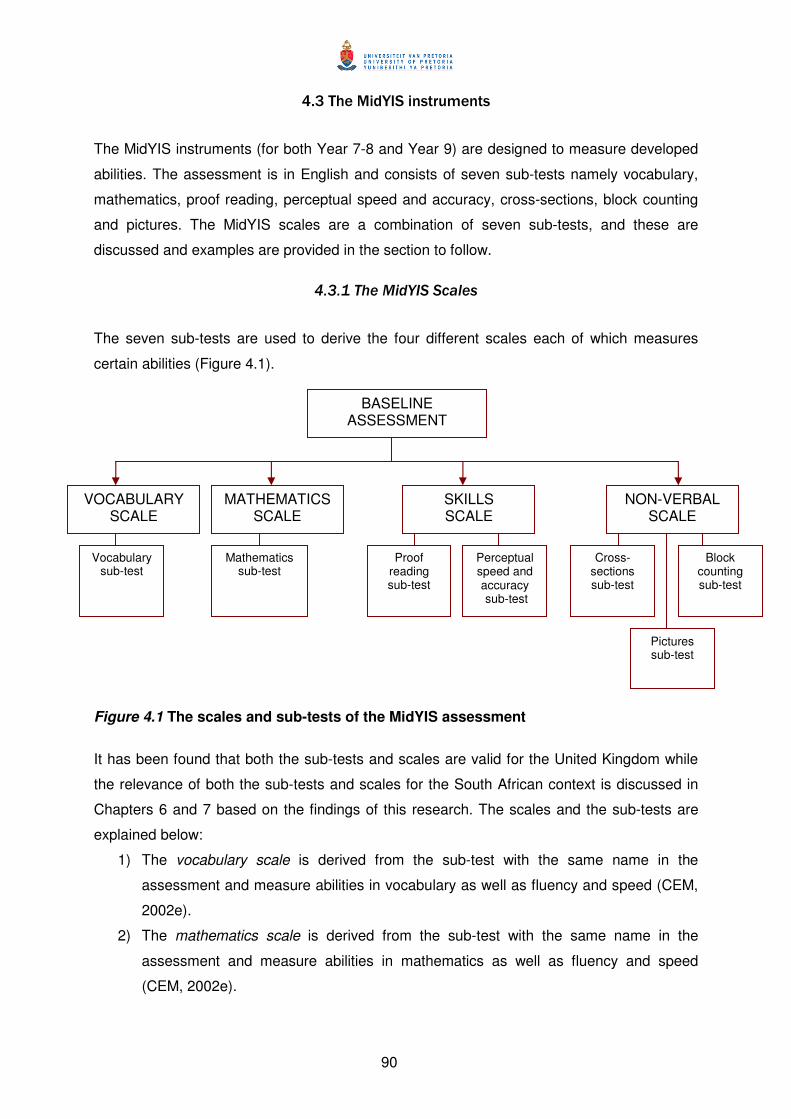
90
4.3 The MidYIS instruments
The MidYIS instruments (for both Year 7-8 and Year 9) are designed to measure developed
abilities. The assessment is in English and consists of seven sub-tests namely vocabulary,
mathematics, proof reading, perceptual speed and accuracy, cross-sections, block counting
and pictures. The MidYIS scales are a combination of seven sub-tests, and these are
discussed and examples are provided in the section to follow.
4.3.1 The MidYIS Scales
The seven sub-tests are used to derive the four different scales each of which measures
certain abilities (Figure 4.1).
Figure 4.1 The scales and sub-tests of the MidYIS assessment
It has been found that both the sub-tests and scales are valid for the United Kingdom while
the relevance of both the sub-tests and scales for the South African context is discussed in
Chapters 6 and 7 based on the findings of this research. The scales and the sub-tests are
explained below:
1) The vocabulary scale is derived from the sub-test with the same name in the
assessment and measure abilities in vocabulary as well as fluency and speed (CEM,
2002e).
2) The mathematics scale is derived from the sub-test with the same name in the
assessment and measure abilities in mathematics as well as fluency and speed
(CEM, 2002e).
BASELINE ASSESSMENT
VOCABULARY SCALE
MATHEMATICS SCALE
SKILLS SCALE
NON-VERBAL SCALE
Vocabulary sub-test
Mathematics sub-test
Proof reading sub-test
Perceptual speed and accuracy sub-test
Cross-sections sub-test
Block counting sub-test
Pictures sub-test
91
3) The skills scale comprises two sub-tests namely the proof reading sub-test and the
perceptual speed and accuracy sub-test. Both sub-tests are designed to measure
fluency and speed in finding patterns and spotting mistakes and therefore make
heavy demands on the learner’s scanning and skimming skills (CEM, 2002e).
Because of this scale’s demanding nature as far as learners’ skimming and scanning
skills are concerned, it is not only addressed in only the language component of the
curriculum (by including reading and drilling exercises to develop those skills) but also
in geography where educators could include exercises in which learners are
requested to find places on a map. The abilities (skills) included in the skills scale are
important as they prepare learners to effectively and efficiently look for information
and these skills are essential in the work environment.
4) The non-verbal scale comprises three sections namely cross-sections, block counting
and pictures. These tests attempt to measure 2-D and 3-D visualisation, spatial
aptitude, pattern recognition, and logical thinking. The non-verbal score is a useful
indicator of ability in the case of learners for whom English is a second language, as
there is no reliance on language (CEM, 2002e). Development of the non-verbal skills
could primarily take place in mathematics with the introduction of geometry where 2-D
and 3-D visualisation is important. Educators could include exercises where learners
systematically revisit the progression of 2-D shapes to 3-D shapes such as taking
cereal boxes apart and then trying to put them back together again. Educators could
get learners to draw objects from different angles and give them blocks to play with.
For pattern recognition, exercises in which learners identify the next number or picture
can be used.
4.3.2 The vocabulary sub-test
The vocabulary sub-test provides a measure of verbal fluency and is a strong indicator of
later academic achievement. In the vocabulary section, learners are presented with a series
of multiple-choice items designed to test their verbal ability or their ability in vocabulary
(CEM, 2002e). Learners are given a word and the learner is then asked to identify the
synonym from the four answer options provided. Figure 4.2 provides an example item.
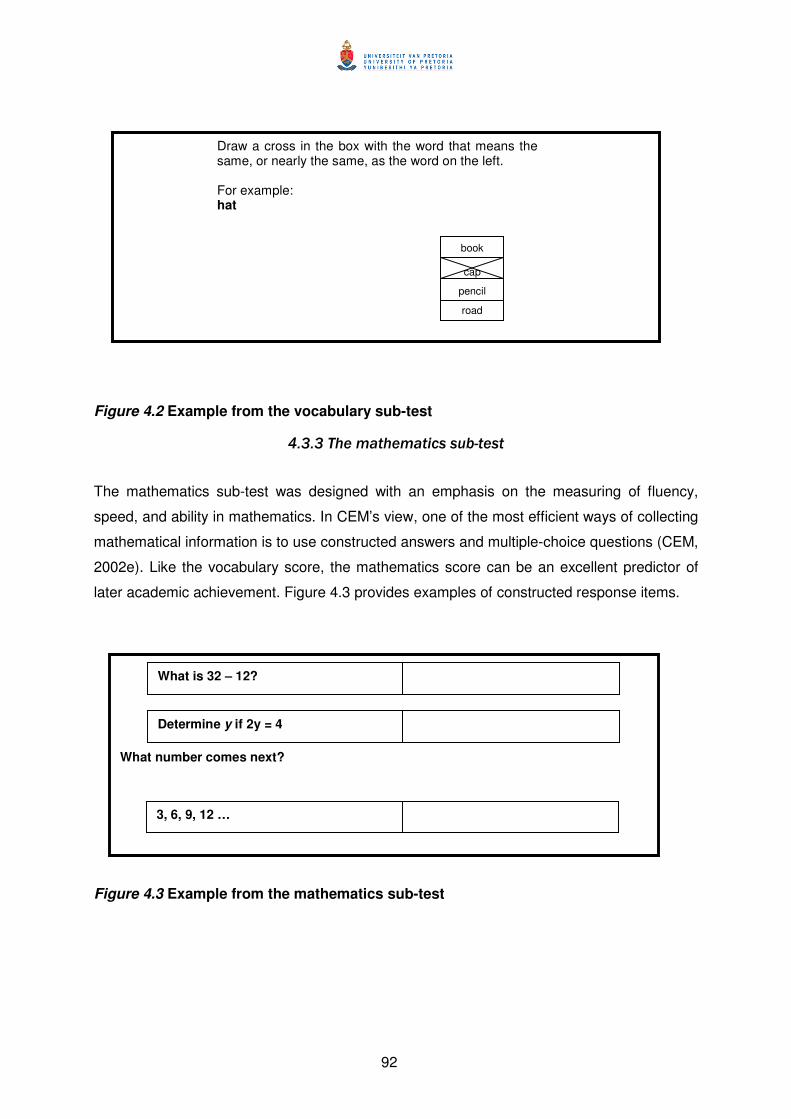
92
Draw a cross in the box with the word that means the same, or nearly the same, as the word on the left. For example: hat
book
cap
pencil
road
Figure 4.2 Example from the vocabulary sub-test
4.3.3 The mathematics sub-test
The mathematics sub-test was designed with an emphasis on the measuring of fluency,
speed, and ability in mathematics. In CEM’s view, one of the most efficient ways of collecting
mathematical information is to use constructed answers and multiple-choice questions (CEM,
2002e). Like the vocabulary score, the mathematics score can be an excellent predictor of
later academic achievement. Figure 4.3 provides examples of constructed response items.
What number comes next?
What is 32 – 12?
Determine y if 2y = 4
3, 6, 9, 12 …
Figure 4.3 Example from the mathematics sub-test
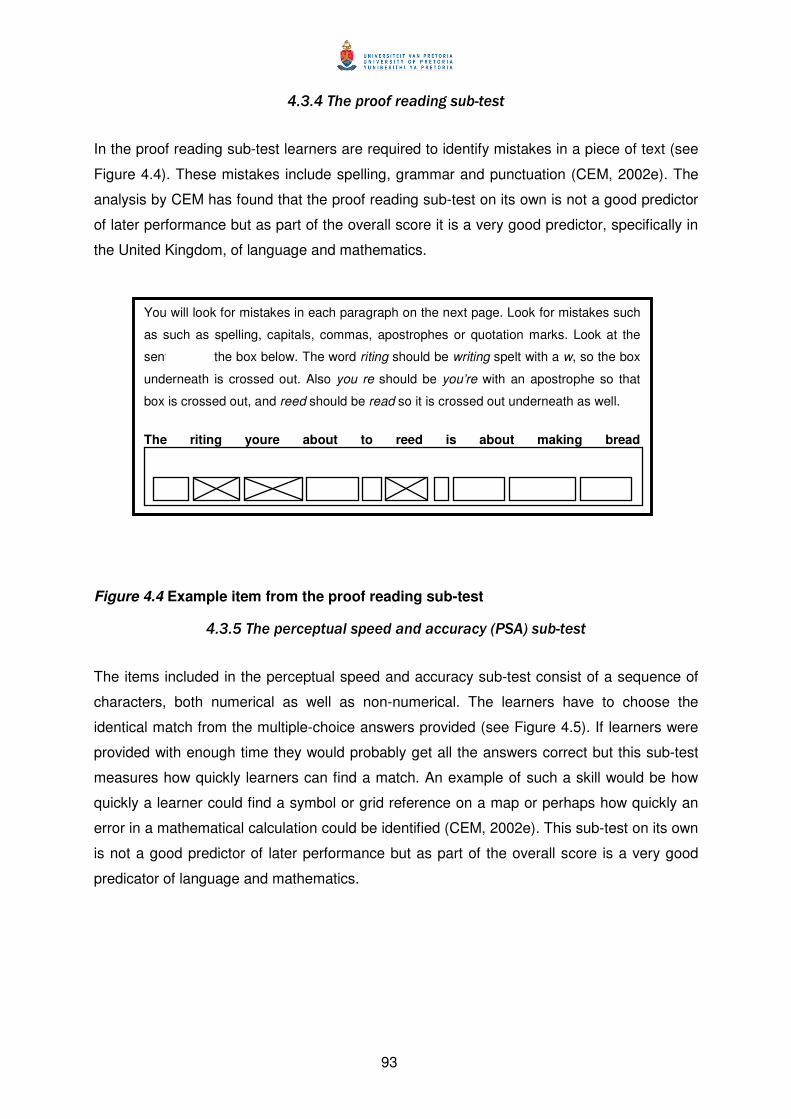
93
4.3.4 The proof reading sub-test
In the proof reading sub-test learners are required to identify mistakes in a piece of text (see
Figure 4.4). These mistakes include spelling, grammar and punctuation (CEM, 2002e). The
analysis by CEM has found that the proof reading sub-test on its own is not a good predictor
of later performance but as part of the overall score it is a very good predictor, specifically in
the United Kingdom, of language and mathematics.
Figure 4.4 Example item from the proof reading sub-test
4.3.5 The perceptual speed and accuracy (PSA) sub-test
The items included in the perceptual speed and accuracy sub-test consist of a sequence of
characters, both numerical as well as non-numerical. The learners have to choose the
identical match from the multiple-choice answers provided (see Figure 4.5). If learners were
provided with enough time they would probably get all the answers correct but this sub-test
measures how quickly learners can find a match. An example of such a skill would be how
quickly a learner could find a symbol or grid reference on a map or perhaps how quickly an
error in a mathematical calculation could be identified (CEM, 2002e). This sub-test on its own
is not a good predictor of later performance but as part of the overall score is a very good
predicator of language and mathematics.
You will look for mistakes in each paragraph on the next page. Look for mistakes such
as such as spelling, capitals, commas, apostrophes or quotation marks. Look at the
sentence in the box below. The word riting should be writing spelt with a w, so the box
underneath is crossed out. Also you re should be you’re with an apostrophe so that
box is crossed out, and reed should be read so it is crossed out underneath as well.
The riting youre about to reed is about making bread
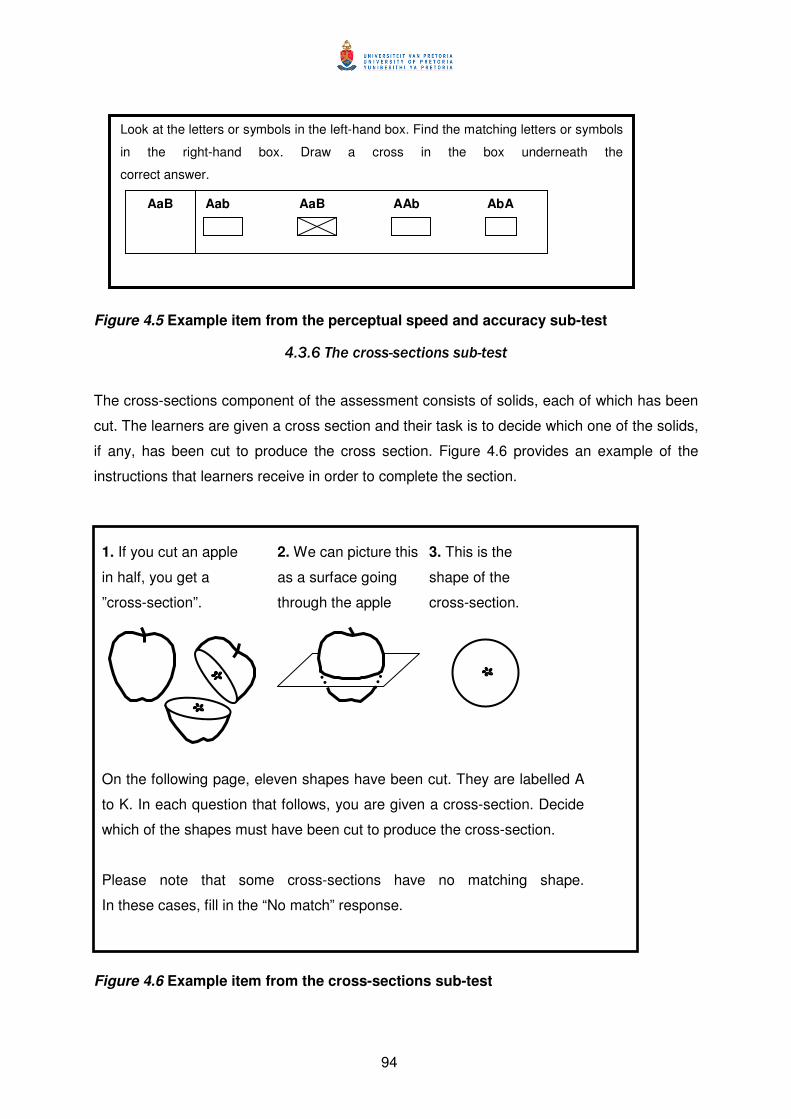
94
Look at the letters or symbols in the left-hand box. Find the matching letters or symbols
in the right-hand box. Draw a cross in the box underneath the
correct answer.
AaB Aab AaB AAb AbA
Figure 4.5 Example item from the perceptual speed and accuracy sub-test
4.3.6 The cross-sections sub-test
The cross-sections component of the assessment consists of solids, each of which has been
cut. The learners are given a cross section and their task is to decide which one of the solids,
if any, has been cut to produce the cross section. Figure 4.6 provides an example of the
instructions that learners receive in order to complete the section.
1. If you cut an apple 2. We can picture this 3. This is the
in half, you get a as a surface going shape of the
”cross-section”. through the apple cross-section.
On the following page, eleven shapes have been cut. They are labelled A
to K. In each question that follows, you are given a cross-section. Decide
which of the shapes must have been cut to produce the cross-section.
Please note that some cross-sections have no matching shape.
In these cases, fill in the “No match” response.
Figure 4.6 Example item from the cross-sections sub-test
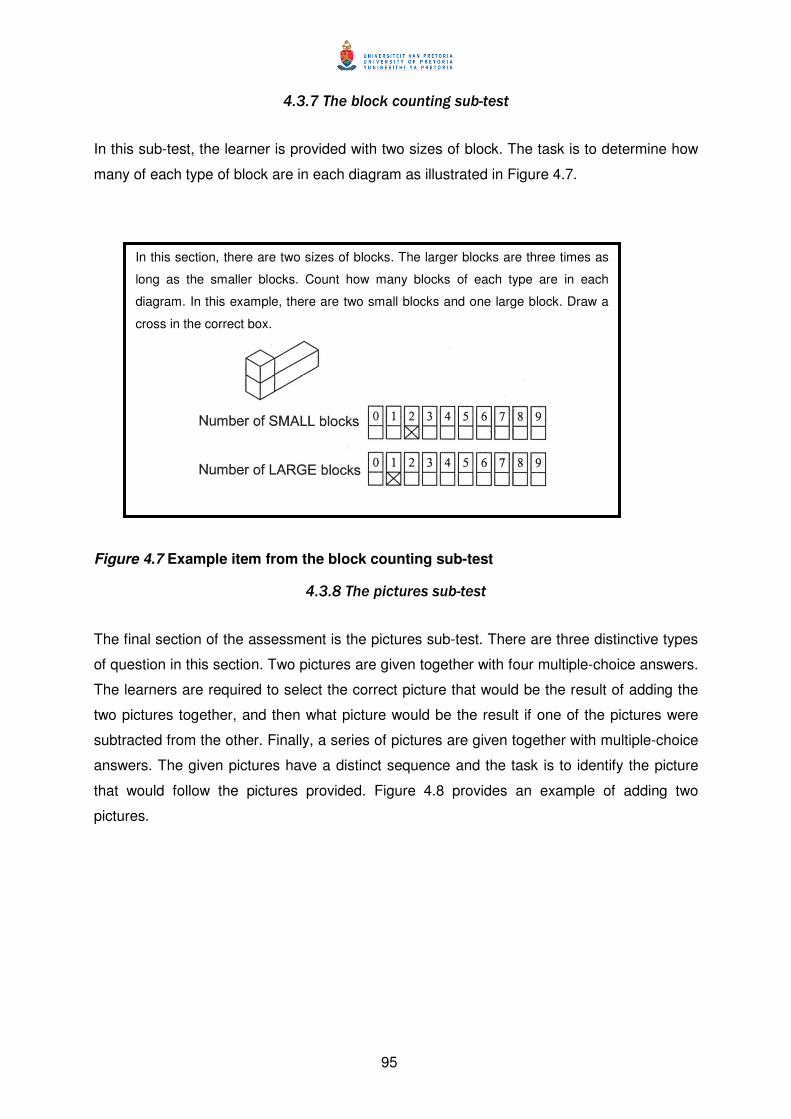
95
4.3.7 The block counting sub-test
In this sub-test, the learner is provided with two sizes of block. The task is to determine how
many of each type of block are in each diagram as illustrated in Figure 4.7.
In this section, there are two sizes of blocks. The larger blocks are three times as
long as the smaller blocks. Count how many blocks of each type are in each
diagram. In this example, there are two small blocks and one large block. Draw a
cross in the correct box.
Figure 4.7 Example item from the block counting sub-test
4.3.8 The pictures sub-test
The final section of the assessment is the pictures sub-test. There are three distinctive types
of question in this section. Two pictures are given together with four multiple-choice answers.
The learners are required to select the correct picture that would be the result of adding the
two pictures together, and then what picture would be the result if one of the pictures were
subtracted from the other. Finally, a series of pictures are given together with multiple-choice
answers. The given pictures have a distinct sequence and the task is to identify the picture
that would follow the pictures provided. Figure 4.8 provides an example of adding two
pictures.
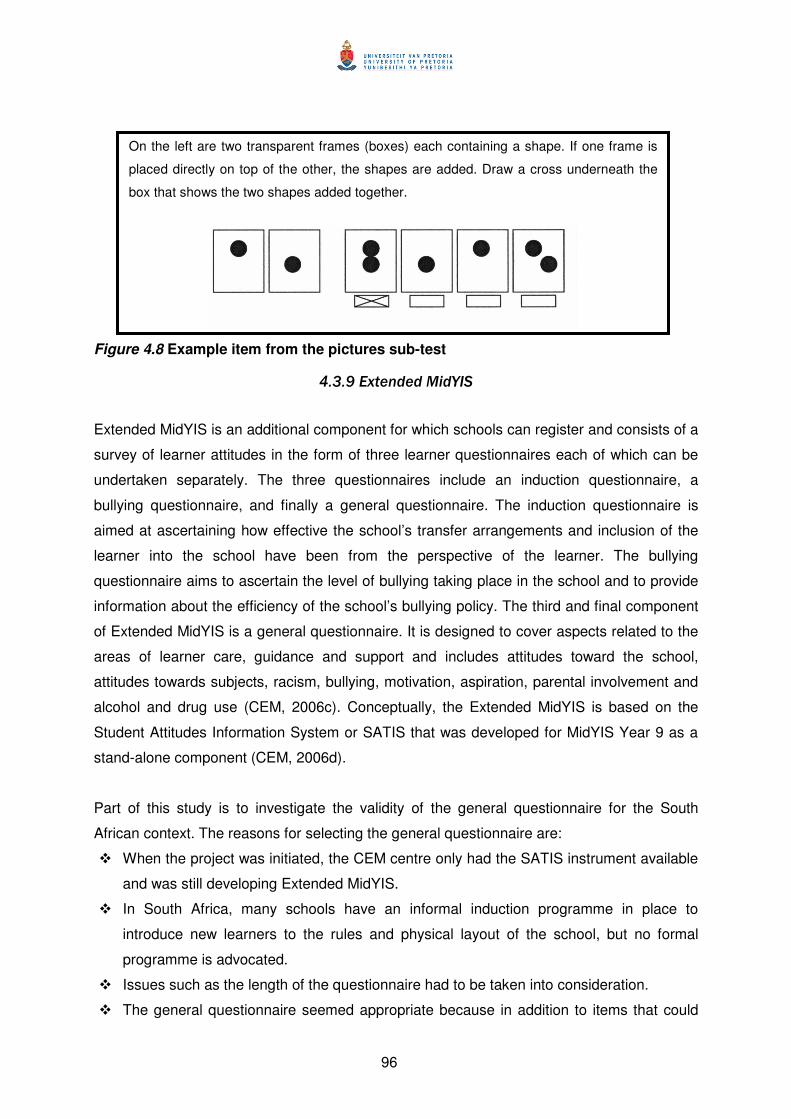
96
Figure 4.8 Example item from the pictures sub-test
4.3.9 Extended MidYIS
Extended MidYIS is an additional component for which schools can register and consists of a
survey of learner attitudes in the form of three learner questionnaires each of which can be
undertaken separately. The three questionnaires include an induction questionnaire, a
bullying questionnaire, and finally a general questionnaire. The induction questionnaire is
aimed at ascertaining how effective the school’s transfer arrangements and inclusion of the
learner into the school have been from the perspective of the learner. The bullying
questionnaire aims to ascertain the level of bullying taking place in the school and to provide
information about the efficiency of the school’s bullying policy. The third and final component
of Extended MidYIS is a general questionnaire. It is designed to cover aspects related to the
areas of learner care, guidance and support and includes attitudes toward the school,
attitudes towards subjects, racism, bullying, motivation, aspiration, parental involvement and
alcohol and drug use (CEM, 2006c). Conceptually, the Extended MidYIS is based on the
Student Attitudes Information System or SATIS that was developed for MidYIS Year 9 as a
stand-alone component (CEM, 2006d).
Part of this study is to investigate the validity of the general questionnaire for the South
African context. The reasons for selecting the general questionnaire are:
� When the project was initiated, the CEM centre only had the SATIS instrument available
and was still developing Extended MidYIS.
� In South Africa, many schools have an informal induction programme in place to
introduce new learners to the rules and physical layout of the school, but no formal
programme is advocated.
� Issues such as the length of the questionnaire had to be taken into consideration.
� The general questionnaire seemed appropriate because in addition to items that could
On the left are two transparent frames (boxes) each containing a shape. If one frame is
placed directly on top of the other, the shapes are added. Draw a cross underneath the
box that shows the two shapes added together.
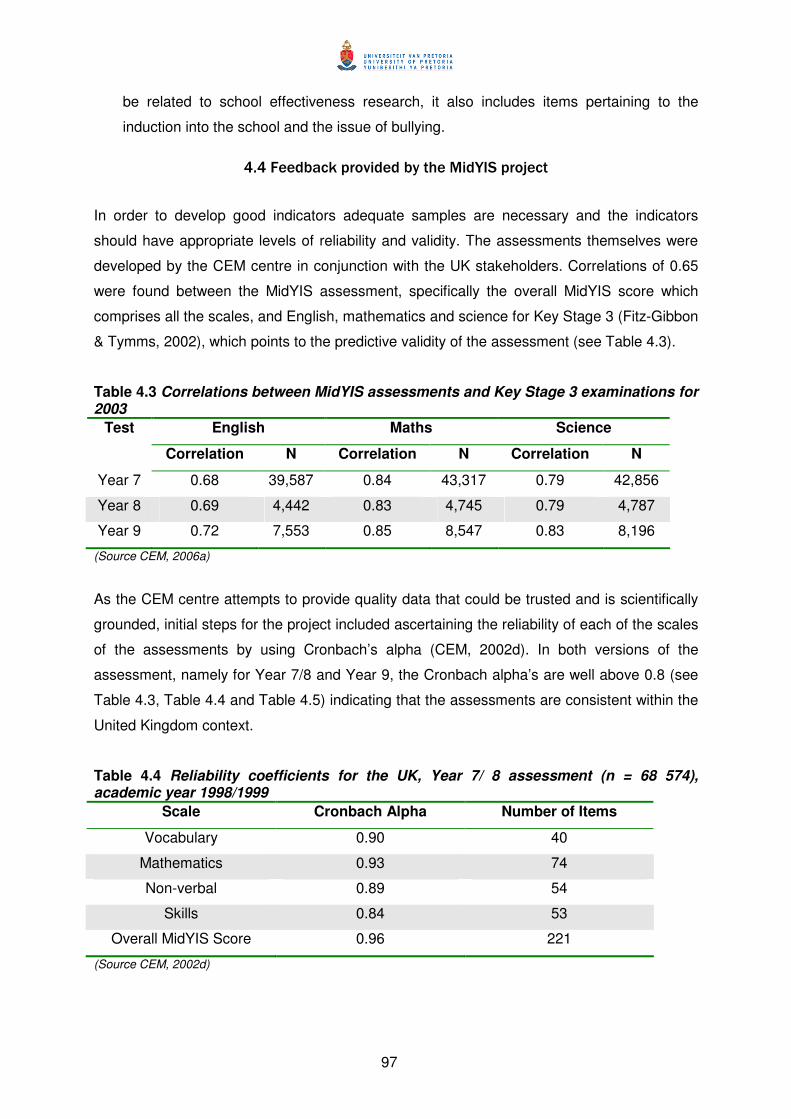
97
be related to school effectiveness research, it also includes items pertaining to the
induction into the school and the issue of bullying.
4.4 Feedback provided by the MidYIS project
In order to develop good indicators adequate samples are necessary and the indicators
should have appropriate levels of reliability and validity. The assessments themselves were
developed by the CEM centre in conjunction with the UK stakeholders. Correlations of 0.65
were found between the MidYIS assessment, specifically the overall MidYIS score which
comprises all the scales, and English, mathematics and science for Key Stage 3 (Fitz-Gibbon
& Tymms, 2002), which points to the predictive validity of the assessment (see Table 4.3).
Table 4.3 Correlations between MidYIS assessments and Key Stage 3 examinations for 2003
English Maths Science Test
Correlation N Correlation N Correlation N
Year 7 0.68 39,587 0.84 43,317 0.79 42,856
Year 8 0.69 4,442 0.83 4,745 0.79 4,787
Year 9 0.72 7,553 0.85 8,547 0.83 8,196
(Source CEM, 2006a)
As the CEM centre attempts to provide quality data that could be trusted and is scientifically
grounded, initial steps for the project included ascertaining the reliability of each of the scales
of the assessments by using Cronbach’s alpha (CEM, 2002d). In both versions of the
assessment, namely for Year 7/8 and Year 9, the Cronbach alpha’s are well above 0.8 (see
Table 4.3, Table 4.4 and Table 4.5) indicating that the assessments are consistent within the
United Kingdom context.
Table 4.4 Reliability coefficients for the UK, Year 7/ 8 assessment (n = 68 574), academic year 1998/1999
Scale Cronbach Alpha Number of Items
Vocabulary 0.90 40
Mathematics 0.93 74
Non-verbal 0.89 54
Skills 0.84 53
Overall MidYIS Score 0.96 221
(Source CEM, 2002d)
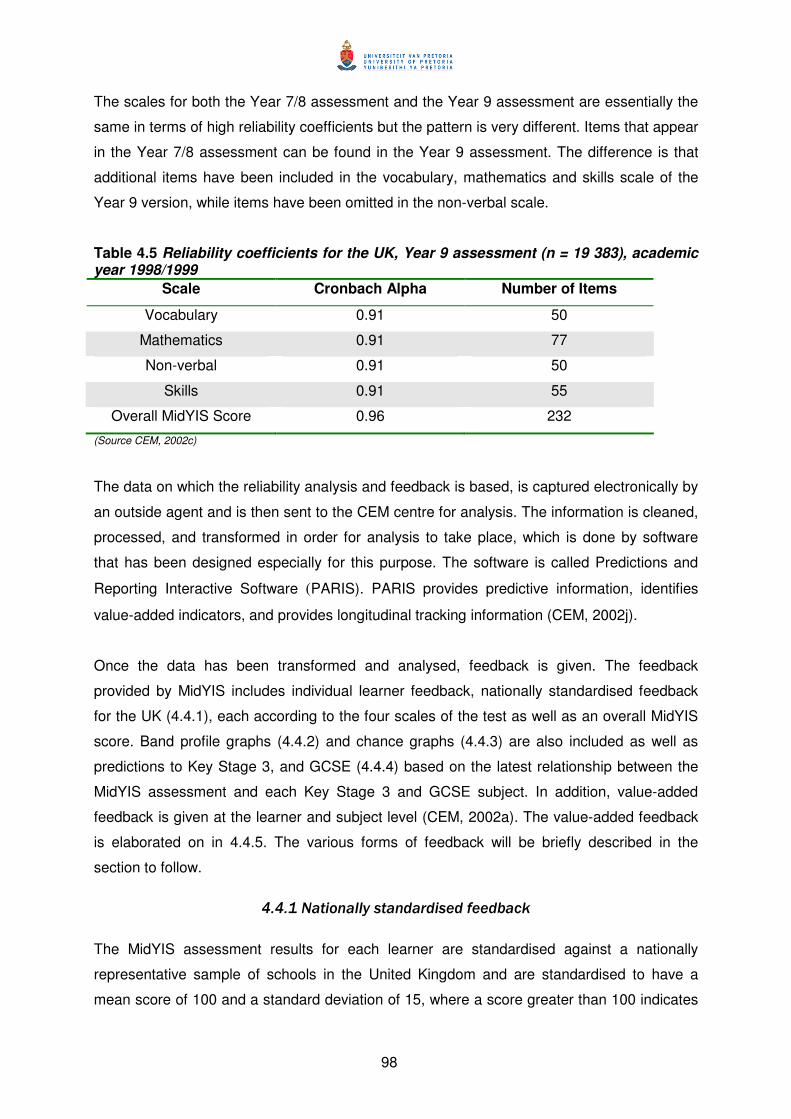
98
The scales for both the Year 7/8 assessment and the Year 9 assessment are essentially the
same in terms of high reliability coefficients but the pattern is very different. Items that appear
in the Year 7/8 assessment can be found in the Year 9 assessment. The difference is that
additional items have been included in the vocabulary, mathematics and skills scale of the
Year 9 version, while items have been omitted in the non-verbal scale.
Table 4.5 Reliability coefficients for the UK, Year 9 assessment (n = 19 383), academic year 1998/1999
Scale Cronbach Alpha Number of Items
Vocabulary 0.91 50
Mathematics 0.91 77
Non-verbal 0.91 50
Skills 0.91 55
Overall MidYIS Score 0.96 232
(Source CEM, 2002c)
The data on which the reliability analysis and feedback is based, is captured electronically by
an outside agent and is then sent to the CEM centre for analysis. The information is cleaned,
processed, and transformed in order for analysis to take place, which is done by software
that has been designed especially for this purpose. The software is called Predictions and
Reporting Interactive Software (PARIS). PARIS provides predictive information, identifies
value-added indicators, and provides longitudinal tracking information (CEM, 2002j).
Once the data has been transformed and analysed, feedback is given. The feedback
provided by MidYIS includes individual learner feedback, nationally standardised feedback
for the UK (4.4.1), each according to the four scales of the test as well as an overall MidYIS
score. Band profile graphs (4.4.2) and chance graphs (4.4.3) are also included as well as
predictions to Key Stage 3, and GCSE (4.4.4) based on the latest relationship between the
MidYIS assessment and each Key Stage 3 and GCSE subject. In addition, value-added
feedback is given at the learner and subject level (CEM, 2002a). The value-added feedback
is elaborated on in 4.4.5. The various forms of feedback will be briefly described in the
section to follow.
4.4.1 Nationally standardised feedback
The MidYIS assessment results for each learner are standardised against a nationally
representative sample of schools in the United Kingdom and are standardised to have a
mean score of 100 and a standard deviation of 15, where a score greater than 100 indicates
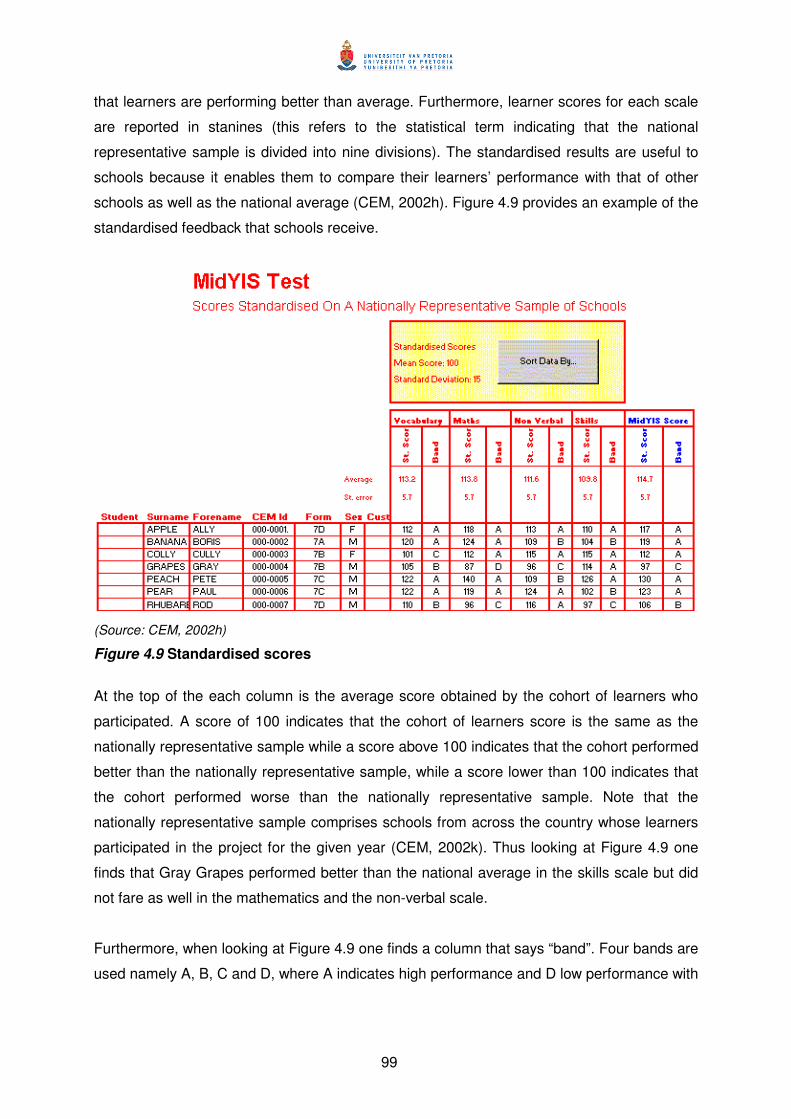
99
that learners are performing better than average. Furthermore, learner scores for each scale
are reported in stanines (this refers to the statistical term indicating that the national
representative sample is divided into nine divisions). The standardised results are useful to
schools because it enables them to compare their learners’ performance with that of other
schools as well as the national average (CEM, 2002h). Figure 4.9 provides an example of the
standardised feedback that schools receive.
(Source: CEM, 2002h)
Figure 4.9 Standardised scores
At the top of the each column is the average score obtained by the cohort of learners who
participated. A score of 100 indicates that the cohort of learners score is the same as the
nationally representative sample while a score above 100 indicates that the cohort performed
better than the nationally representative sample, while a score lower than 100 indicates that
the cohort performed worse than the nationally representative sample. Note that the
nationally representative sample comprises schools from across the country whose learners
participated in the project for the given year (CEM, 2002k). Thus looking at Figure 4.9 one
finds that Gray Grapes performed better than the national average in the skills scale but did
not fare as well in the mathematics and the non-verbal scale.
Furthermore, when looking at Figure 4.9 one finds a column that says “band”. Four bands are
used namely A, B, C and D, where A indicates high performance and D low performance with
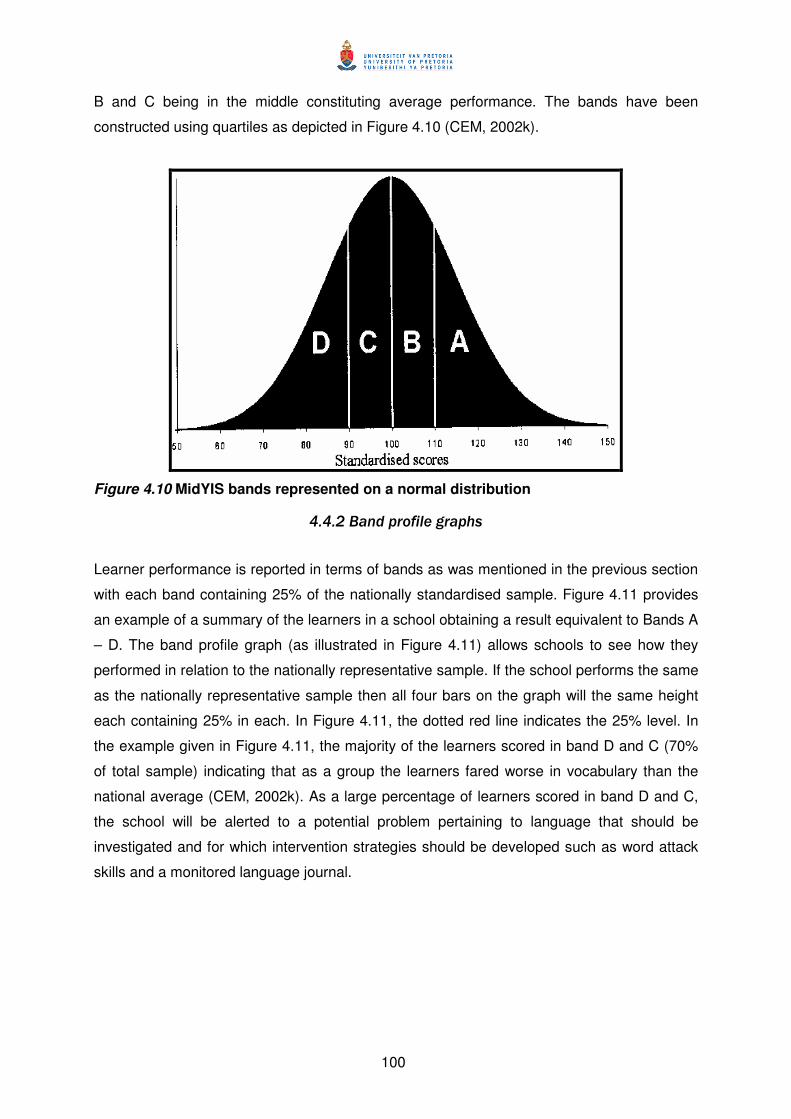
100
B and C being in the middle constituting average performance. The bands have been
constructed using quartiles as depicted in Figure 4.10 (CEM, 2002k).
Figure 4.10 MidYIS bands represented on a normal distribution
4.4.2 Band profile graphs
Learner performance is reported in terms of bands as was mentioned in the previous section
with each band containing 25% of the nationally standardised sample. Figure 4.11 provides
an example of a summary of the learners in a school obtaining a result equivalent to Bands A
– D. The band profile graph (as illustrated in Figure 4.11) allows schools to see how they
performed in relation to the nationally representative sample. If the school performs the same
as the nationally representative sample then all four bars on the graph will the same height
each containing 25% in each. In Figure 4.11, the dotted red line indicates the 25% level. In
the example given in Figure 4.11, the majority of the learners scored in band D and C (70%
of total sample) indicating that as a group the learners fared worse in vocabulary than the
national average (CEM, 2002k). As a large percentage of learners scored in band D and C,
the school will be alerted to a potential problem pertaining to language that should be
investigated and for which intervention strategies should be developed such as word attack
skills and a monitored language journal.
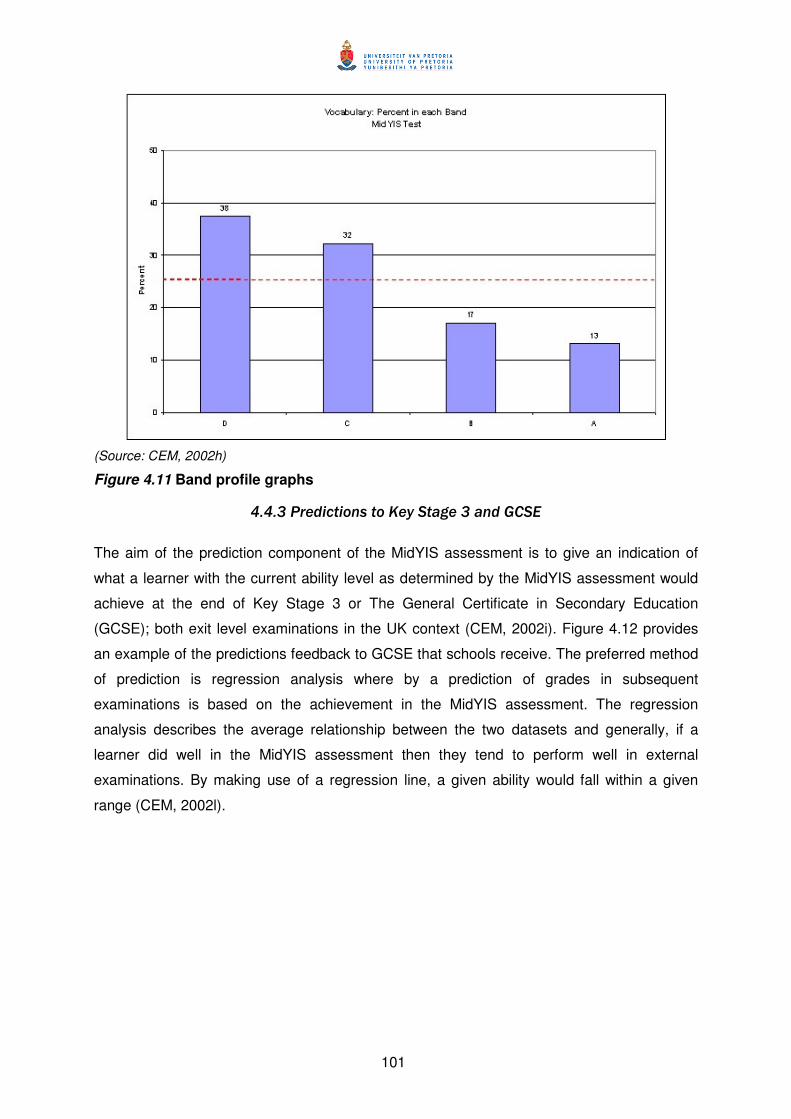
101
(Source: CEM, 2002h)
Figure 4.11 Band profile graphs
4.4.3 Predictions to Key Stage 3 and GCSE
The aim of the prediction component of the MidYIS assessment is to give an indication of
what a learner with the current ability level as determined by the MidYIS assessment would
achieve at the end of Key Stage 3 or The General Certificate in Secondary Education
(GCSE); both exit level examinations in the UK context (CEM, 2002i). Figure 4.12 provides
an example of the predictions feedback to GCSE that schools receive. The preferred method
of prediction is regression analysis where by a prediction of grades in subsequent
examinations is based on the achievement in the MidYIS assessment. The regression
analysis describes the average relationship between the two datasets and generally, if a
learner did well in the MidYIS assessment then they tend to perform well in external
examinations. By making use of a regression line, a given ability would fall within a given
range (CEM, 2002l).
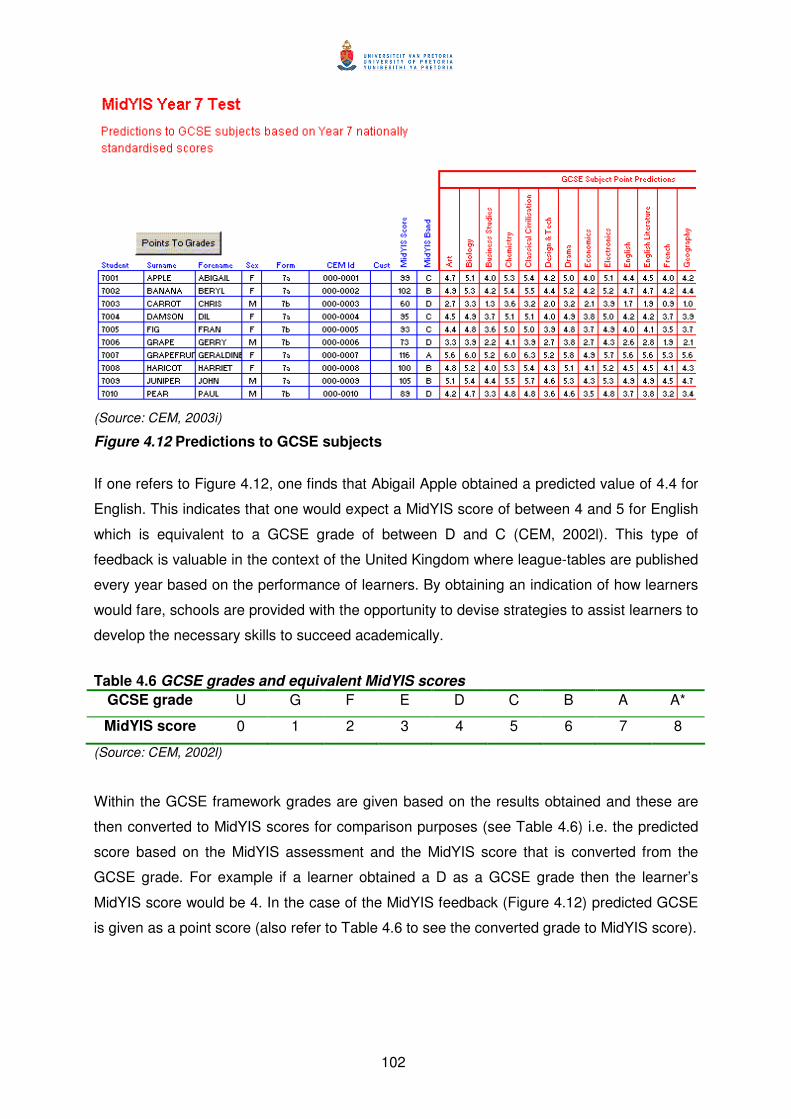
102
(Source: CEM, 2003i)
Figure 4.12 Predictions to GCSE subjects
If one refers to Figure 4.12, one finds that Abigail Apple obtained a predicted value of 4.4 for
English. This indicates that one would expect a MidYIS score of between 4 and 5 for English
which is equivalent to a GCSE grade of between D and C (CEM, 2002l). This type of
feedback is valuable in the context of the United Kingdom where league-tables are published
every year based on the performance of learners. By obtaining an indication of how learners
would fare, schools are provided with the opportunity to devise strategies to assist learners to
develop the necessary skills to succeed academically.
Table 4.6 GCSE grades and equivalent MidYIS scores
GCSE grade U G F E D C B A A*
MidYIS score 0 1 2 3 4 5 6 7 8
(Source: CEM, 2002l)
Within the GCSE framework grades are given based on the results obtained and these are
then converted to MidYIS scores for comparison purposes (see Table 4.6) i.e. the predicted
score based on the MidYIS assessment and the MidYIS score that is converted from the
GCSE grade. For example if a learner obtained a D as a GCSE grade then the learner’s
MidYIS score would be 4. In the case of the MidYIS feedback (Figure 4.12) predicted GCSE
is given as a point score (also refer to Table 4.6 to see the converted grade to MidYIS score).
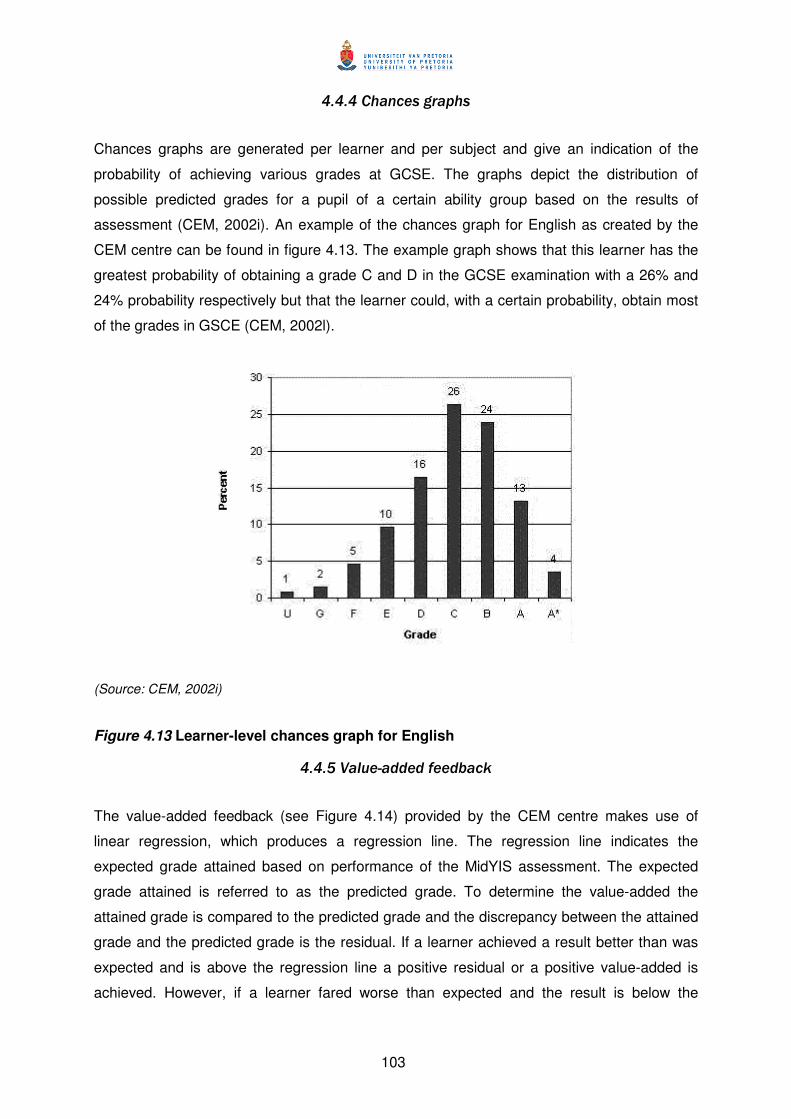
103
4.4.4 Chances graphs
Chances graphs are generated per learner and per subject and give an indication of the
probability of achieving various grades at GCSE. The graphs depict the distribution of
possible predicted grades for a pupil of a certain ability group based on the results of
assessment (CEM, 2002i). An example of the chances graph for English as created by the
CEM centre can be found in figure 4.13. The example graph shows that this learner has the
greatest probability of obtaining a grade C and D in the GCSE examination with a 26% and
24% probability respectively but that the learner could, with a certain probability, obtain most
of the grades in GSCE (CEM, 2002l).
(Source: CEM, 2002i)
Figure 4.13 Learner-level chances graph for English
4.4.5 Value-added feedback
The value-added feedback (see Figure 4.14) provided by the CEM centre makes use of
linear regression, which produces a regression line. The regression line indicates the
expected grade attained based on performance of the MidYIS assessment. The expected
grade attained is referred to as the predicted grade. To determine the value-added the
attained grade is compared to the predicted grade and the discrepancy between the attained
grade and the predicted grade is the residual. If a learner achieved a result better than was
expected and is above the regression line a positive residual or a positive value-added is
achieved. However, if a learner fared worse than expected and the result is below the
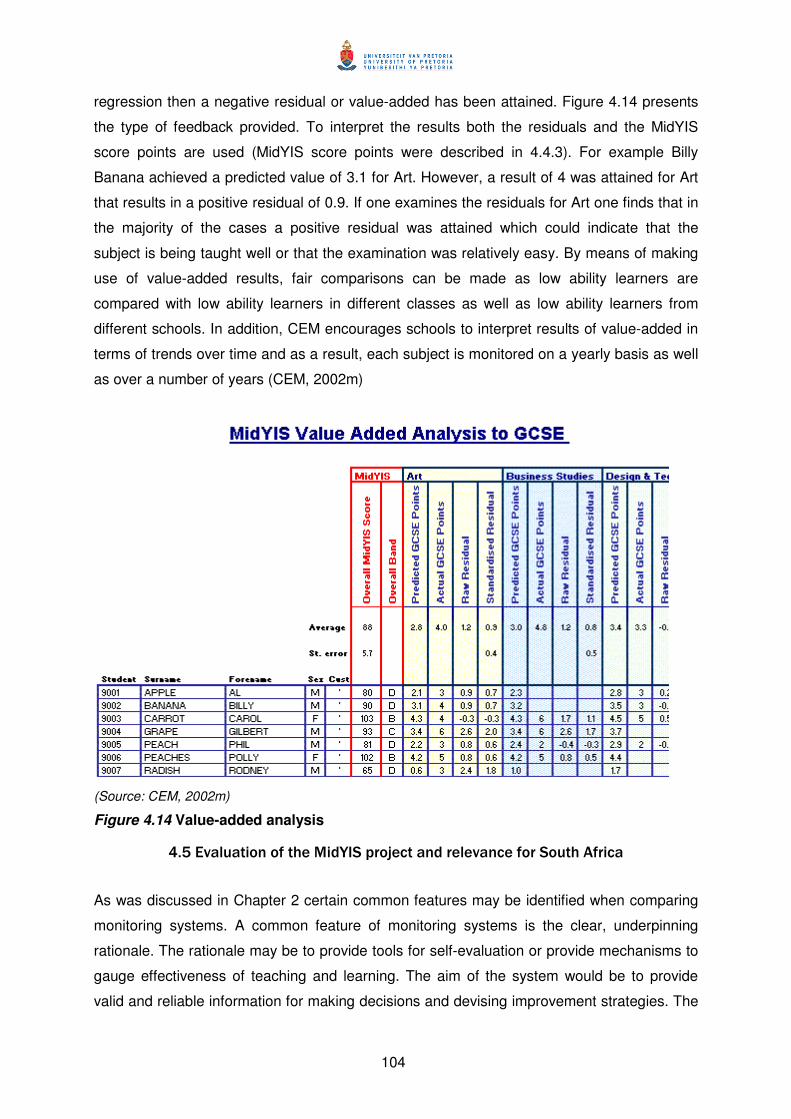
104
regression then a negative residual or value-added has been attained. Figure 4.14 presents
the type of feedback provided. To interpret the results both the residuals and the MidYIS
score points are used (MidYIS score points were described in 4.4.3). For example Billy
Banana achieved a predicted value of 3.1 for Art. However, a result of 4 was attained for Art
that results in a positive residual of 0.9. If one examines the residuals for Art one finds that in
the majority of the cases a positive residual was attained which could indicate that the
subject is being taught well or that the examination was relatively easy. By means of making
use of value-added results, fair comparisons can be made as low ability learners are
compared with low ability learners in different classes as well as low ability learners from
different schools. In addition, CEM encourages schools to interpret results of value-added in
terms of trends over time and as a result, each subject is monitored on a yearly basis as well
as over a number of years (CEM, 2002m)
(Source: CEM, 2002m)
Figure 4.14 Value-added analysis
4.5 Evaluation of the MidYIS project and relevance for South Africa
As was discussed in Chapter 2 certain common features may be identified when comparing
monitoring systems. A common feature of monitoring systems is the clear, underpinning
rationale. The rationale may be to provide tools for self-evaluation or provide mechanisms to
gauge effectiveness of teaching and learning. The aim of the system would be to provide
valid and reliable information for making decisions and devising improvement strategies. The
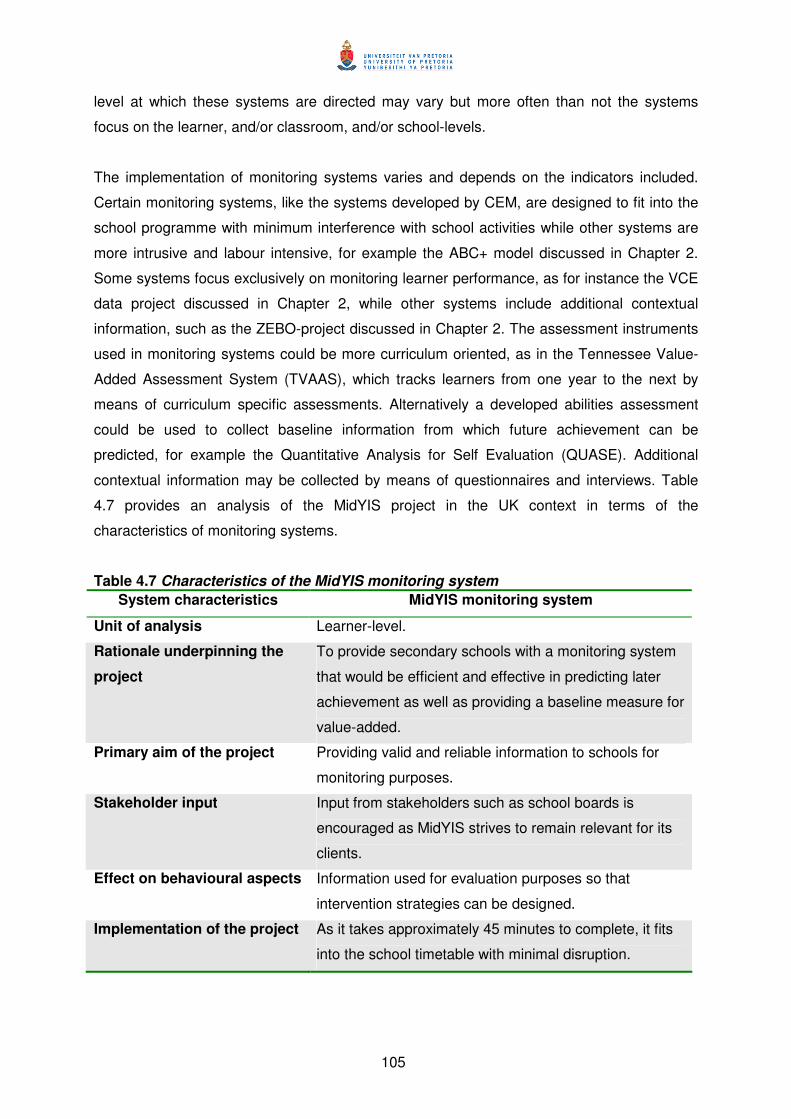
105
level at which these systems are directed may vary but more often than not the systems
focus on the learner, and/or classroom, and/or school-levels.
The implementation of monitoring systems varies and depends on the indicators included.
Certain monitoring systems, like the systems developed by CEM, are designed to fit into the
school programme with minimum interference with school activities while other systems are
more intrusive and labour intensive, for example the ABC+ model discussed in Chapter 2.
Some systems focus exclusively on monitoring learner performance, as for instance the VCE
data project discussed in Chapter 2, while other systems include additional contextual
information, such as the ZEBO-project discussed in Chapter 2. The assessment instruments
used in monitoring systems could be more curriculum oriented, as in the Tennessee Value-
Added Assessment System (TVAAS), which tracks learners from one year to the next by
means of curriculum specific assessments. Alternatively a developed abilities assessment
could be used to collect baseline information from which future achievement can be
predicted, for example the Quantitative Analysis for Self Evaluation (QUASE). Additional
contextual information may be collected by means of questionnaires and interviews. Table
4.7 provides an analysis of the MidYIS project in the UK context in terms of the
characteristics of monitoring systems.
Table 4.7 Characteristics of the MidYIS monitoring system
System characteristics MidYIS monitoring system
Unit of analysis Learner-level.
Rationale underpinning the
project
To provide secondary schools with a monitoring system
that would be efficient and effective in predicting later
achievement as well as providing a baseline measure for
value-added.
Primary aim of the project Providing valid and reliable information to schools for
monitoring purposes.
Stakeholder input Input from stakeholders such as school boards is
encouraged as MidYIS strives to remain relevant for its
clients.
Effect on behavioural aspects Information used for evaluation purposes so that
intervention strategies can be designed.
Implementation of the project As it takes approximately 45 minutes to complete, it fits
into the school timetable with minimal disruption.
106
There are many similarities between MidYIS and other monitoring systems discussed in
Chapter 2. MidYIS has a clear rationale underpinning the system namely to provide tools for
schools to undertake self-evaluation by means of the valid and reliable information from
which decisions can be made and improvement strategies devised. The MidYIS system
focuses on a learner-level, as only assessment data based on an ability type assessment is
included. The information from the assessment is used for prediction purposes and
calculating the “value” the school has added to learners learning. The system is designed to
fit into school timetable so as not to disrupt school activities. However, MidYIS also differs
from many monitoring systems, as only one level, i.e. the learner-level, has been included; in
other words, MidYIS does not include any additional contextual information apart from what
is supplied by the learner. The information is used for predicting future achievement rather
than tracking learners from one grade to the next.
South Africa is a country with rich diversity (Howie, 2002), diversity that any monitoring
system will have to take into account. The appeal of MidYIS lies in the fair comparisons that
can be made not only between learners but also between schools. The systems developed
by CEM answer a need, in the United Kingdom, for fairer comparisons between schools
amidst the league-table debates (Fitz-Gibbon, 1996; West, 2000). In the United Kingdom
traditionally, league-tables have been published in which schools are ranked according to
achievement. Schools are unilaterally compared with each other regardless of the location
and school population (West, 2000). Elite schools typically drawing learners from affluent
backgrounds are compared with schools which typically cater for disadvantaged learners
(West, 2000). Schools catering for disadvantaged learners are typically located in poorer
areas and are less likely to be as well resourced as elite schools. In the words of Taylor, Fitz
and Gorard (2005, p. 59) “…different social backgrounds have a direct influence upon the
relative performance as measured by public examination result.”
By means of developing a system that considers covariates, fairer comparisons of the quality
of education received can be obtained. In South Africa vast discrepancies among schools
exist and persist even after more than 10 years of democracy. Despite these discrepancies
schools are still expected to function at the same level. They are compared as if they were
equal, especially when the Grade 12 (matriculation) results are published at the end of the
academic year. The MidYIS project developed by CEM provides the opportunity to include
covariates. It will not only place achievement in context, but will by means of calculating the
value-added also give an indication of the academic gains made by a learner relative to
his/her starting position. This information is valuable to schools because it enables them to
demonstrate their contribution towards learning taking place. Furthermore, as predictions of
107
subsequent achievement are based on the assessment results, schools will have enough
time to react to the needs of their learners and provide a starting point for the development of
intervention strategies.
Secondly, the approach the MidYIS project used is considered as appropriate as it was
developed especially for schools in collaboration with schools and district officials, and is free
from the accountability functions inherent in United States driven initiatives. Thus the aim of
using this system is to help the schools develop themselves by means of school-based
interventions that are based on the results.
The monitoring system has also been developed to slot into the school timetable with relative
ease and is not time intensive so that minimal disruption takes place. The CEM system uses
a developed abilities assessment to provide baseline information about a learner’s abilities
free from the curriculum. This makes the assessment fair to learners because due to
discrepancies in schooling, learners have different kinds of exposure to the curriculum.
Finally, the developed abilities assessment was designed to provide a means of measuring
typical performance and has been correlated with academic subjects. The correlations
between the academic subjects and the MidYIS assessment are high in the UK (refer to
Table 4.3), and thus allow for reliable prediction of subsequent performance. In the context of
South Africa this is a desirable characteristic as achievement at the end of Grade 9, which is
the first exit point and end of compulsory education, can be determined. This would assist in
identifying learners in need of additional assistance in time to give them a fair chance to
continue education to the Grade 12 level.
4.6 Summary and adaptations to enhance MidYIS for South Africa
The problems relating to the adoption of successful programmes from other contexts
without the consideration of local conditions has been mentioned
frequently…Contextual adaptation does not only mean fitting into a South African
context, but into a local context as well. There is tremendous variance in schools within
South Africa... Furthermore the same school is experienced differently by different
groups of students (Smith & Ngomo-Maema, 2003, p. 361).
It is acknowledged that importing programmes or assessments from other countries is often
problematic and a point of contestation as the quote above indicates. On the other hand,
noteworthy lessons can be learnt from the international examples. In South Africa, there is a

108
need for school-based monitoring systems. A system to assist the schools’ self-evaluation
processes for growth and development. Research within the international community is rich
with possibilities which may be used to inform initiatives in South Africa that would end the
dearth in research in developing countries.
However, the “importance of context in education (sic)…cannot be underestimated” (Smith &
Ngomo-Maema, 2003, p. 348). Any international initiative must be evaluated in terms of
appropriateness for the South African context. Issues of feasibility, validity, and reliability
become important. In addition, the context both past and present affects the decision to
implement international initiatives.
In this chapter, the Middle Years Information System (MidYIS) has been discussed in detail
in order to provide the information needed to make recommendations for changes. The
MidYIS system has many advantages, which are appealing for the South African context:
� The system provides tools that schools can use with relative ease as well as information
with which schools can evaluate themselves in order to identify strategies for
development.
� As the assessment information can be used to predict future achievement, schools are
in a better position to identify learners at risk of failing and who may need additional
support.
� As the system provides value-added information, schools from different contexts can be
compared with similar schools, the evaluation being based on the academic growth of
learners with similar abilities. In this regard, learners are compared according to the point
at which they started and by academic gains made, instead of being compared on raw
scores regardless of background and context.
� The MidYIS system has been designed to fit into the school timetable, which means that
minimum disruption of school activities takes place.
� The feedback given to schools is comprehensive and due to the support programmes in
place, schools are able to interpret the information that provides them with valuable
insights for future planning.
Although the MidYIS system is appealing and, as discussed in 4.5, could be relevant for
South Africa, it may in its present form not be suitable for South Africa. The feasibility of
using the assessment in South African schools has to be established. For example in the
United Kingdom the language of learning is English. However, South Africa has 11 official
languages and mother tongue instruction takes place until the fourth grade at which time the
109
language of learning should switch to English or Afrikaans. Consequently, the question has
been raised whether English second language learners would be able to access the words
included in the vocabulary sub-test when they have only received four years of instruction in
English. In addition, the results of the MidYIS assessment are based on nationally
standardised samples for the United Kingdom and not South Africa. Furthermore, developed
abilities type assessments are viewed with scepticism in South Africa because in the past
similar assessments were used to reinforce the apartheid system. Avenues need to be
explored further if MidYIS is to be used in the South African context. The MidYIS system may
be an asset for South Africa if correctly contextualised. Therefore, the following aspects were
investigated to ascertain the relevance of the MidYIS monitoring system:
1) The issue of curriculum validity: The overlap of skills tested in the MidYIS
assessment and the skills taught in the curriculum had to be ascertained. This was a
vital step in order to ascertain curricular validity, a specialised form of content-related
validity, and suitability of the assessment in terms of the outcomes-based education
system followed in South Africa. The relevance of MidYIS for the educational context
and curriculum had to be established.
2) The issue of content-related validity: The MidYIS assessment is an assessment of
developed abilities, which falls within the domain of psychology. As such, the overlap
of items included in the assessment with the psychological domains had to be
ascertained in order to establish face and content validity of the assessment. This
was done by comparing the assessment to other “abilities” assessments as well as by
asking psychologists to evaluate the assessment. The assessment, although used in
an educational context, was originally developed by drawing on abilities theory in the
realm of psychology. As MidYIS is a well established assessment one would expect
the items drawn from abilities theory, to be thorough. However, for reporting purposes
the overlap between items and the possible domain had to be explored. The content-
related validity in question is different from the curriculum validity as inferences were
made with regard to two different domains namely the curriculum and abilities.
3) Additional learner questionnaire: The MidYIS system does not include learner
contextual information unless schools register for Extended MidYIS (an online learner
questionnaire or Student Attitudes Information System). This component is an
additional element to the proposed monitoring system for South Africa. The general
learner questionnaire (discussed earlier) was used which provides information on
learner attitudes, aspirations, and quality of life. The learner questionnaire includes
items pertaining to the age of the learner, gender of the learner and home
background of the learner, future aspirations, attitudes towards the school and school
work, motivation to achieve and motivation to continue learning. The learner
110
questionnaire was also included in order to obtain information on learner attitudes.
The questionnaire was evaluated in order to ascertain face and content validity. It was
also evaluated to see which items had to be included to provide more detailed
information on attitudes to school subjects and classroom practices (see Chapter 5 for
details).
4) Assessment and questionnaire format: The language used as well as the format
and layout of the assessment and questionnaire was evaluated and adapted where
necessary, so that these are accessible for South African learners, for instance
converting UK English to South African English.
5) Time allocation for the sub-tests: The time allocated for each sub-test was
evaluated in order to ensure that learners had adequate time and that the
assessment was fair for South African learners.
6) Suitability of the assessment for second language learners: The assessment was
evaluated to ensure that it is suitable for second language learners. An important
aspect is that the MidYIS assessment is in English. In many South African schools,
neither the language of learning nor the first language of the majority of learners is
English. The assessment had to be deemed appropriate for learners taught in English
as a second language.
7) Administration procedures: The administration procedures had to be revised, as
tape recorders are not always available in South African schools. For the monitoring
system to be standardised, tape recorders would have to be provided or the schools
and educators trained. In order for the initial work to be undertaken the data had to be
collected by trained fieldworkers for quality monitoring purposes. Furthermore, in
order to ensure that the ESL learners understood the instructions and what is
expected, the instructions had to be translated into learners’ mother tongue.
8) Additional contextual questionnaires had to be developed to broaden the scope
of MidYIS: Indicators included in monitoring systems may vary as was explored in the
beginning of this chapter as well as in Chapter 2. Different kinds of inputs, processes
and outputs should be included in the monitoring system so as to broaden the scope
of the monitoring system. With the additional information the monitoring system would
be appropriate for the purposes of self-evaluation in terms of management and the
design, development and implementation of curricula. For the monitoring system to be
used for self-evaluation purposes, it has to encapsulate more than the learner
performance. Therefore, principal and educator questionnaires had to be developed.
The education system is a nested system where learners are within classes and
classes are within schools. As was seen from literature presented in Chapter 2, each
of the levels affects the other and in order to identify explanatory variables, to design

111
interventions programmes and effect change, information from the various levels is
needed. The questionnaires had to be sound to ensure the collection of valid
information and they had to be evaluated to ensure that they have face and content
validity before being finalised and administered.
9) Issues of construct validity: Problematic items had to be identified and the
underlying data structure evaluated in terms of construct validity to ensure that the
constructs or scales in the assessment were found in the South African data. Rasch
analysis was undertaken to identify the items which seem to measure the same
construct. Reliability analysis was also undertaken to evaluate whether the items in
the sub-tests cohere to form the scales as found in MidYIS.
10) Predictive validity had to be established for the South African context: The
assessment is used for prediction purposes in the context of the United Kingdom. If
predictive validity was to be established for South Africa, the results from the
assessment had to be correlated with academic results, specifically language and
mathematics, obtained from school-based assessments.
11) Analysis procedures used to provide schools with information: Analysis
procedures used to provide information given to schools were evaluated and
appropriate analysis procedures for the initial validation phase as well as more
developed phases had to be identified. For example, standardised feedback will not
be given initially, as the assessment has not been standardised for the South African
context. Because of financial constraints and as a result of small sample sizes,
standardisation was not possible in the initial stages of the project. However, the aim
is to standardise the assessment for the South African context and to develop
national norms.
12) The feedback reports to schools: The feedback provided had to be simplified and
narratives added so that the results were presented in a comprehensive manner.
Individual school reports were considered more appropriate in the South African
context. These were presented to the schools during information sessions and follow-
up telephone calls. The report included background information on the assessment
and how the learner results should be interpreted. Individual learner results were
provided as well as aggregated scores. Exceptional learners were identified as well
as those who may require additional attention. As far as possible visual
representations in the form of graphs were provided, possible reasons for poor
performance were given and key areas identified where learners had difficulty.
112
4.7 Conclusion
Monitoring systems are important mechanisms that schools can use to gauge their
effectiveness in teaching and learning. Yet, monitoring systems on school-level to assist in
self-evaluation processes in the context of South Africa are not readily available. The schools
in South Africa vary greatly and schools in rural areas as well as in townships are still
disadvantaged in terms of resources and facilities. However, current assessments, such as
the Grade 12 examination, do not take the complexities within which disadvantaged schools
work into account. In order to evaluate the true performance of a school more appropriate
monitoring and measurement systems are necessary. Moreover, with the increasing demand
of the provincial and national education departments that schools become accountable for
their learners’ performance, the need for a system, which monitors learner performance, has
become imperative. Schools will have to develop the capacity to monitor their own
effectiveness in order to be accountable for their learners’ performance. By means of using a
system such as MidYIS with adaptations for the South African context, school processes as
well as outputs can be monitored.
In this chapter, an attempt has been made to provide information about MidYIS developed by
the CEM centre in the United Kingdom. This has been done in order to provide a framework
within which the proposed South African project or SASSIS (South African Secondary School
Information System) can be developed by means of putting forward recommendations of how
the MidYIS components can be built upon and extended to make it feasible for the South
African context. What has been discussed in this chapter pertains to the relevance of MidYIS
for the South African context, thus, is directly linked with the first main research question
identified for this research namely how appropriate is the Middle Years Information
System (MidYIS) as a monitoring system in the South African context?
In this chapter, changes were discussed as to how MidYIS could be enhanced for South
Africa. A number of changes were directly related to the validity and reliability of the
assessment, as discussed in 4.6. Thus a specific research question emerges namely how
valid and reliable are the data generated by the MidYIS monitoring system for South
Africa. This is related to Figure 3.3 presented in Chapter 3. The concept of validity although
a unitary concept (Gronlund, 1998; Linn & Gronlund, 2000) comprises various facets as was
highlighted in 4.6 such as curricular validity, and content-related validity. For this reason the
specific research question how valid and reliable are the data generated by the MidYIS
monitoring system for South Africa can be refined further into a number of sub-questions.
113
The sub-questions identified are directly linked to the steps needed to make inferences
related to validity and reliability. The sub-questions are:
1.2.1 To what extent are the skills tested by MidYIS valid for the South African
curriculum?
This research question explores the extent to which the skills assessed in the
MidYIS assessment are prevalent in the South African curriculum. This speaks of
the degree to which learners have been exposed to learning situations which
foster the skills assessed.
1.2.2 To what extent are the items in MidYIS in agreement with the domain of
ability testing and applicable for South Africa?
The domain of abilities is a well-documented field, one in which psychologists
have been working for a number of years. This question is to map the extent to
which the items in the assessment sample the items prevalent in the domain of
ability. This also relates to the theoretical constructs underlying the MidYIS
assessment and together with sub-questions 1.2.1 and 1.2.3 inferences made
with regard to validity are strengthen.
1.2.3 How well do the items per sub-test function and do they form well-defined
constructs?
This sub-question addresses issues on construct validity. The question addresses
whether or not the items cohere in the intended manner to form the theoretical
construct intended.
1.2.4 To what extent are the results obtained on MidYIS reliable?
The consistency of the results is an important aspect of an assessment as the
results of one testing situation should be comparable and similar to the results of
another testing situation using the same assessment. This gives an indication of
how reliable the results are.
1.2.5 To what extent do the data predict future achievement?
This sub-question explores the concept of predictive validity. Specifically focusing
on the extent to which the assessment data is related to results obtained by
learners in academic subjects.
Both the validity of the assessment and the reliability of assessment give an indication of
whether the results or learner achievement can be trusted, where the learner achievement
component is illustrated in the output section under learner outputs of the conceptual model
identified for this research, as illustrated in Figure 3.4 in Chapter 3. The emphasis was on
what adaptations were needed in order to develop MidYIS into a monitoring system for the
114
South African context. Therefore, another specific research question emerges namely what
adaptations are needed to transform MidYIS into SASSIS, a monitoring system for the
South African context? The discussion of what adaptations are needed is drawn from
investigations related to validity and reliability in which key aspects are highlighted for closer
examination. In 4.6 several aspects were noted. These aspects relate to time allocations,
language, and format of the assessment. As key aspects can be highlighted, the specific
research question related to adaptations can be refined into sub-questions. The sub-
questions are:
1.3.1 To what extent are the administration procedures appropriate and if not,
how can they be adjusted?
As was seen in this chapter and highlighted in the discussion in 4.6 administration
procedures need to be standardised. Not only is the way in which MidYIS is
undertaken in the UK not suitable for South Africa but standardisation is vital as
issues of administration can negatively influence the reliability of the assessment
(Frisbie, 1988).
1.3.2 To what extent is the content in MidYIS appropriate for second language
learners?
In South Africa, even though a learner attends an English medium school it does
not mean that the learner’s home language is English. For this reason, it is
important to ascertain the extent to which second language learners understand
the language used in the assessment. This is an important aspect as only 8.2% of
the South African population speaks English in the home (About South Africa,
2006).
1.3.3 To what extent is the format of the assessment appropriate and if not, how
can it be changed?
The assessment is compiled in a manner in which electronic data capturing can
be undertaken in order to ensure quick turnaround times as was briefly discussed
in the Chapter. However, this format although advantageous may not yet be the
optimal in South Africa.
1.3.4 To what extent are the time allocations appropriate and if not, what
adjustments are needed?
In the United Kingdom time per section has been allocated in a manner in which
the majority of the learners would be able to complete the sections. In South
Africa the time allocations may need to be adjusted to ensure that the majority of
the learners will be able to complete the sections.
115
1.3.5 To what extent is the feedback given in MidYIS appropriate for South Africa
and how can this format be improved upon?
As was discussed in this chapter feedback is provided to schools in a particular
manner. The extent to which this form of feedback is appropriate has to be
evaluated. In the United Kingdom, educators have a certain theoretical grounding
which makes it possible for them to learn how to interpret the results. In South
Africa however, a significant percentage of the educators are underqualified whilst
others obtained their qualification at a College of Education (most of which are
now closed) and not a university. The quality of teacher training varied greatly
across colleges and universities as did the qualifications due to the fact that these
were based on race i.e. Colleges of Education catered formally for African
teachers were mostly poorly funded, under-resourced and produced teachers
most often with insufficient skills and knowledge for teaching effectively. It is
anticipated that educators in South Africa may not benefit from the type of
feedback in its current form.
In addition to the assessment, the Chapter briefly discussed the learner questionnaire or
Extended MidYIS (4.3.9) as well as in the adaptations section (4.6). The information in the
questionnaire includes factors that could influence performance and has direct relevance to
the second main research question namely which factors could have an effect on learner
performance and therefore inform the design of the monitoring system? Issues related
to the learner are addressed, thus the following specific research question associated with
the second main research question is highlighted namely what factors on a learner-level
affect the performance of learners on the assessment. Not only does the questionnaire
provide the opportunity to collect information on learner characteristics (as indicated in the
inputs section of the conceptual framework in Figure 3.4) but also information on learner
attitudes and motivation to achieve (as indicated in the outputs section under learner-level of
the conceptual framework in Figure 3.4). Furthermore, the educator and school-level has
been identified as important as discussed in Chapter 3 but also highlighted in section 4.6 of
this chapter. In order for the educator and school-level to be investigated data from
questionnaires are needed. Thus two additional specific research questions can be identified
what factors on a school-level affect the performance of learners on the assessment
and what factors on a classroom-level affect the performance of learners on the
assessment.
However, there is another component of the second main research question namely how the
factors identified on a school, classroom and learner-level can inform the design and

116
development of a comprehensive monitoring system for South Africa. Thus the fourth specific
question identified, as a stepping-stone to answer the second main research question is how
can the identified factors be included in the design of the monitoring system?
In the chapter to follow, Chapter 5, the research questions are elaborated on further in terms
of data questions. Here the question of what data is needed in order to answer the specific
research questions that in turn will provide answers to the main research questions identified
is elaborated on. Issues pertaining to the sample, data collection and data analysis are
addressed in addition to the theoretical and methodological foundation of the research.
117
CHAPCHAPCHAPCHAPTER 5TER 5TER 5TER 5
RESEARCH DESIGN AND METHODSRESEARCH DESIGN AND METHODSRESEARCH DESIGN AND METHODSRESEARCH DESIGN AND METHODS The aim of this research was to explore the feasibility of adapting an
existing monitoring system to the South African context. A non-
experimental pragmatic approach was used in the research, which
utilised a mixed method design, namely a concurrent nested design.
Participants in the research included Department of Education
officials, principals, educators, and learners. Data was collected by
means of a variety of instruments and different validation strategies
were used. This study also made use of various data analysis
strategies in order to address the research questions identified. The
data analysis strategies included thematic content analysis, item
response theory, reliability analysis, correlation analysis, and
multilevel analysis. The multilevel analysis ascertained the variance in
performance explained by factors on a school, classroom, and
learner-level. Finally, ethical considerations are discussed and
methodological constraints elaborated on.
5.1 Introduction
The foundation of the research process rests on an overarching methodological framework
consisting of questions, designs, data structures and decisions about analysis (Heck &
Thomas, 2000). The framework draws the various elements of research together into a
cohesive, comprehensive whole culminating in a chain of reasoning (Krathwohl, 1998).
Furthermore, this framework is rooted in a particular worldview, or a particular way in which
truth is perceived and understood (Worthen, Sanders & Fitzpatrick, 1987). This framework or
rather the assumption about how things are understood is referred to as a paradigm. This is
the lens used to make sense of things (Creswell, 2003; Worthen et al., 1987). Within a
paradigmatic framework knowledge claims are made about what knowledge is, how one
knows, what values are attached, the way in which we study phenomena and how the
phenomena are written about (Creswell, 2003). A pragmatic approach was adopted in this
research. The pragmatic approach is discussed below (5.1.1), including a brief overview of
different paradigms and a description of the development of pragmatism. The section
concludes with a justification of pragmatism as an overarching framework (5.1.2).
118
5.1.1 The development of pragmatism
Petter and Gallivan (2004) state that until World War II, positivism was the prominent
paradigm in the social sciences, which was rooted in the belief that knowledge was based on
observable facts. However, after World War II positivism was severely criticised for not
producing significant outcomes in social sciences when compared with the physical sciences
over and above the argument that human behaviour is complex and needs to be explored
more thoroughly. In reaction to this post-positivism was born in order to address the
problems experienced in positivism (Petter & Gallivan, 2004).
Post-positivism as an extension of positivism, is characterised by the use of quantitative
methods (QUAN), and is governed by the underlying philosophy that causes for effects or
outcomes could be obtained. The aim is to examine causes in order to determine the
influence on outcomes. Knowledge is developed based on careful observation and the
measurement of objective reality by means of developing numeric measures. First, there is
theory, then the collection of data or evidence, then the conclusion that the theory is right or
wrong (Creswell, 2003).
Discontentment with positivism and post-positivism deepened a need for an alternative
approach to research in the social sciences. In the 1970’s qualitative methods became more
prominent. Researchers like Lincoln and Guba, Stake and Eisner wrote several books that
were critical of the positivist orientation. In response to their criticisms, an alternative in the
form of a variety of qualitative methods (QUAL) was proposed. Constructivism was the
common name given to the paradigm using qualitative methods (Teddlie & Tashakkori,
2003). During this time, several debates raged in the social sciences regarding the
superiority of one or the other of these two paradigms. Numerous attempts were made to
make peace between the two paradigms by “pacifists”, such as Tashakkori and Teddlie
(1998), Maxcy (2003) as well as Johnson and Onwuegbuzie (2004), who stated that
qualitative and quantitative methods are compatible (compatibility thesis). However,
paradigm purists, such as Smith and Heshusius (see Teddlie & Tashakkori, 2003) as well as
Lincoln and Guba, Popper, Maxwell and Delaney (see Johnson & Onwuegbuzie, 2004),
reject the compatibility thesis stating that compatibility between quantitative methods and
qualitative methods is impossible due to the knowledge claims made by the different
methods (Tashakkori & Teddlie, 1998). Nevertheless, authors promoting the compatibility
thesis still support the thesis basing their claims on a different paradigm namely pragmatism
(Patton, 1990; Tashakkori & Teddlie, 1998). Pragmatism gained momentum in the 1990’s
with researchers becoming frustrated with having to choose between qualitative and
119
quantitative methods (Petter & Gallivan, 2004). Furthermore, knowledge claims for
pragmatists arise out of actions and consequences rather than antecedent conditions (as in
post-positivism). Pragmatists are concerned with solving problems and applying the most
appropriate methods in order to do so. The problem is foremost, followed by an elaboration
on the best methods suited to address the problem (Creswell, 2003).
Pragmatism is a philosophical movement that began towards the end of the 19th century
(Maxcy, 2003). It originated in the United States unlike most philosophical movements, which
originated in Europe (Expers, 2000). It has historical roots with noteworthy contributors such
as Charles Sanders Pierce, William James, John Dewey, and George Herbert Mead
(Creswell, 2003). A common element of these contributors was their rejection of traditional
assumptions about the nature of knowledge, truth and the nature of inquiry. They also
rejected the notion that the real world could be accessed solely by means of one scientific
method (Maxcy, 2003). Maxcy (2003) states that for these early pragmatists meaningful
research was not rooted in the methods employed but rather in ordinary experience and the
desire to understand, a desire for a better world. Maxcy goes on to say that two eras exist in
the development of pragmatism, namely early pragmatism in which Pierce, James, Dewey,
Mead, and Bentley are highlighted and neo-pragmatism in which there were contributors
such as Abraham Kaplan, Richard Rorty, Richard Berstein and Hilary Putnam. The neo-
pragmatists draw on the work of the early pragmatist as elaborated on in the discussion
above. Neo-pragmatists reframe the tenets of early pragmatism stressing the importance of
“richer modes of inquiry” (Maxcy, 2003, p. 54) as in “methodological pragmatism” (Maxcy,
2003, p. 81), according to which a researcher should not focus on a single method but
instead test different methods of inquiry for their effectiveness in achieving the intended goal.
Neo-pragmatists also place emphasis on new ways of communicating by making use of
“metaphors”, “stories” and other “narratives” as in the case of Richard Rorty (Maxcy, 2003, p.
80), and attempts to secure forms of common experience (Maxcy, 2003).
Maxcy (2003) is of the opinion that in pragmatism both the meaning and the truth of any idea
are functions of its practical outcome. It is the problem that is of importance and not a
preoccupation with methods (Creswell, 2003). Outcomes are what counts and not
necessarily prior knowledge claims, laws or even what is true (Maxcy, 2003). All principles
are viewed as working hypotheses rather than metaphysically binding truths (The Radical
Academy, 2002). Subjective and objective perspectives in addition various methods should
be used in order to achieve the desired outcome. According to pragmatists, the integration of
methods from the different paradigms is a powerful way of enhancing the credibility of
findings (Petter & Gallivan, 2004). Pragmatists are of the opinion that there are similarities in
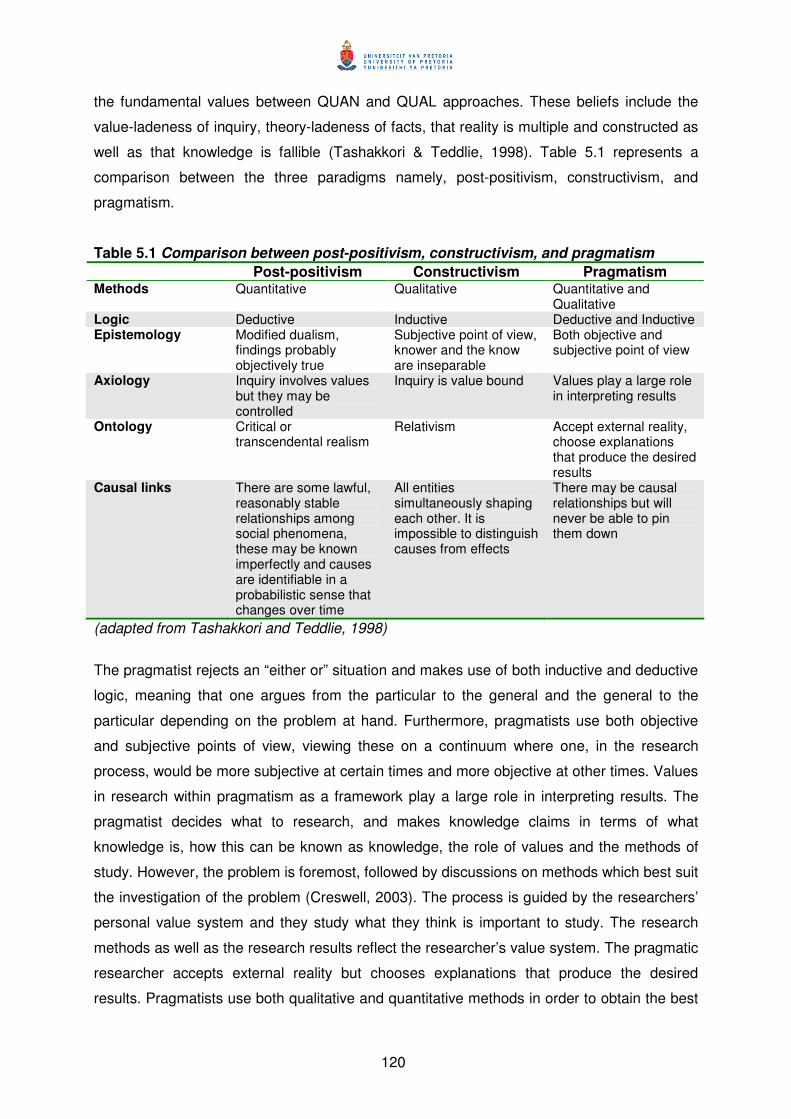
120
the fundamental values between QUAN and QUAL approaches. These beliefs include the
value-ladeness of inquiry, theory-ladeness of facts, that reality is multiple and constructed as
well as that knowledge is fallible (Tashakkori & Teddlie, 1998). Table 5.1 represents a
comparison between the three paradigms namely, post-positivism, constructivism, and
pragmatism.
Table 5.1 Comparison between post-positivism, constructivism, and pragmatism
Post-positivism Constructivism Pragmatism Methods Quantitative Qualitative Quantitative and
Qualitative Logic Deductive Inductive Deductive and Inductive Epistemology Modified dualism,
findings probably objectively true
Subjective point of view, knower and the know are inseparable
Both objective and subjective point of view
Axiology Inquiry involves values but they may be controlled
Inquiry is value bound Values play a large role in interpreting results
Ontology Critical or transcendental realism
Relativism Accept external reality, choose explanations that produce the desired results
Causal links There are some lawful, reasonably stable relationships among social phenomena, these may be known imperfectly and causes are identifiable in a probabilistic sense that changes over time
All entities simultaneously shaping each other. It is impossible to distinguish causes from effects
There may be causal relationships but will never be able to pin them down
(adapted from Tashakkori and Teddlie, 1998)
The pragmatist rejects an “either or” situation and makes use of both inductive and deductive
logic, meaning that one argues from the particular to the general and the general to the
particular depending on the problem at hand. Furthermore, pragmatists use both objective
and subjective points of view, viewing these on a continuum where one, in the research
process, would be more subjective at certain times and more objective at other times. Values
in research within pragmatism as a framework play a large role in interpreting results. The
pragmatist decides what to research, and makes knowledge claims in terms of what
knowledge is, how this can be known as knowledge, the role of values and the methods of
study. However, the problem is foremost, followed by discussions on methods which best suit
the investigation of the problem (Creswell, 2003). The process is guided by the researchers’
personal value system and they study what they think is important to study. The research
methods as well as the research results reflect the researcher’s value system. The pragmatic
researcher accepts external reality but chooses explanations that produce the desired
results. Pragmatists use both qualitative and quantitative methods in order to obtain the best
121
result. Qualitative refers to research designed to address questions of meaning,
interpretation, and realities, which are socially constructed. Quantitative in this context refers
to research designed to address questions that formulate hypotheses about relationships
among variables, is essentially descriptive in nature, makes use of numeric variables, and
attempts to measure the relationships in objective ways (Newton, Ridenour, Newman &
DeMarco, 2003). The choice of which method to use, however, depends largely on the
research question and with each method one would apply either subjective or objective
points of view.
For the pragmatist the research question is more important than the method that is used or
the worldview that underlies the method. Furthermore, researchers should address these
questions with whatever methodological tool is available. “What works” is what counts.
Pragmatists prefer to deal with the practical problem at hand viewing modes of inquiry as
tools for better understanding and effective problem-solving (Reeves, 1996). Tashakkori and
Teddlie (1998, p. 21) concur and state that pragmatists are “committed to the thorough study
of the research problem, method is secondary to the question itself, and the underlying
worldview hardly enters the picture, except in the most abstract sense”. Moreover, Greene
and Caracelli (2003) are of the opinion that applied social inquirers ground decisions
primarily on the nature of the phenomenon being investigated, as well as the context in which
the investigations are taking place with philosophical assumptions rarely being considered.
5.1.2 Rationale for working within a pragmatist paradigm
Tashakkori and Teddlie (1998) suggest that pragmatism is appealing as:
1) It abstains from metaphysical concepts that have caused endless debates.
2) It presents a practical and applied research philosophy, which states that one should
study what is of interest and value to you, study it in different ways, as one deems
appropriate and use the results in a way that brings about consequences within the
value system one is working in.
3) It provides a paradigm, which philosophically embraces the use of mixed methods.
The primary appeal of pragmatism for this research is not that it abstains from endlessly
defending metaphysical concepts or even that it embraces mixed methods, although these
are intriguing. Rather, the primary appeal lies with the fact that pragmatism represents a
practical and applied research philosophy. It provides the opportunity to investigate what is of
importance to the research and broader society in manner, which is compatible with the
122
questions that one wishes to address. Pragmatism makes the investigation of the perceived
problem possible without imposing constraints on methods to be used but allows the
researcher the option of making use of all possible tools in order to address the problem in a
comprehensive manner. Patton (in Teddlie & Tashakkori, 2003, p. 18) states that:
…in real world practice, methods can be separated from the epistemology out of which
they have emerged. One can use statistics in a straightforward way without doing a
literature review of logical positivism. One can make an interpretation without studying
hermeneutics. In addition, one can conduct open-ended interviews without reading
treatises on phenomenology.
Furthermore, pragmatism was chosen as the overarching paradigm for this research as the
research aims to adapt a monitoring system for secondary schools. Presently such a system
does not formally exist although schools may be making use of various informal systems. In
essence, the components and characteristics of a monitoring system, which would be
effective and efficient in the South African context, were investigated bearing in mind the vast
diversity of secondary schools. Literature offers many alternatives in terms of school-level
monitoring systems available. These systems, however, originate in the developed world.
The key question was whether these systems or rather one particular system would be
applicable within a developing world context, whether the identified monitoring system was
the best option, and how this monitoring system would be received by the education system.
Pragmatism provides a philosophical framework within which to work, using whichever
means necessary in order to establish whether the monitoring system chosen would be a
feasible option.
Pragmatism lends itself to the use of mixed methods, which provides the researcher with the
opportunity to answer the research questions adequately (Teddlie & Tashakkori, 2003). By
using mixed methods, one comes to a more comprehensive understanding of the
phenomena under investigation by means of developing a more complete portrayal of the
social world and developing fresh perspectives and new ideas. The account of research
using mixed methods is also more defensible as the results are credible and there is less
bias as the one method compensates for the other method. Thus one is able to develop
stronger knowledge claims (Greene, 2005). The researcher for this study was able to choose
from various designs in order to investigate whether MidYIS, as a feasible monitoring system,
is applicable in the South African context.
123
Tashakkori and Teddlie (1998) state that when doing research you should study what is of
interest and of value to you and undertake the study in a variety of ways appropriate to the
identified aims. It is believed that by grounding the research in pragmatism the tools, which
could be used to ascertain whether MidYIS is a feasible system increase dramatically. This is
due to the use of various methods both qualitative and quantitative, to tease out nuances
presented during the course of the research. Thus by means of including various methods
and designs the research is reinforced. Moreover, an iterative process exists between the
purpose of the research and the research questions. The iterative process facilitates
decisions about methods. As various questions are developed from the purpose of the
research, so it becomes necessary to make use of mixed methods to address the questions
(Newton et al., 2003).
In summary, the first part of the chapter addressed the question of paradigmatic grounding
focusing specifically on the use of pragmatism as a philosophical framework. The rest of the
chapter provides a detailed explanation of design issues considered (5.2) as well as the
methodology employed in the research (5.3). The methodology section of the chapter
provides an overview of the sampling techniques used (5.3.1), the instruments used to collect
data (5.3.2), validity issues pertaining to the instruments (5.3.3) as well as the data collection
procedures undertaken (5.3.4). The methodology section concludes with a detailed
description of the data analysis techniques used (5.3.5) and a summary of the research
procedures (5.3.6), ending with a section discussing the ethical issues considered in the
research (5.4) and the methodological constraints (5.5).
5.2 Design issues
The design issues comprise the specifics of the sample, data collection, instruments and
data analysis. These, however, are determined by the research questions. As was discussed
in Chapter 1 and elaborated on in Chapters 3 and 4 two main research questions have been
identified for this research. The first main research question comprising three specific
research questions:
1) How appropriate is the Middle Years Information System (MidYIS) as a
monitoring system in the South African context?
1.1 How does the Middle Years Information System (MidYIS) compare to
other monitoring systems? Research question 1.1 was addressed by means of a
literature review focusing on the characteristics of different monitoring systems and
124
then by drawing a comparison between these and the characteristics of MidYIS. The
literature used to address this question is discussed in Chapters 2, 3 and 4.
1.2 How valid and reliable are the data generated by the MidYIS monitoring
system for South Africa? This research question focuses specifically on how valid
and reliable, the results of the MidYIS instrument are. However, determining validity is
not a straightforward procedure as in the case of reliability, which is a technical
procedure (Kline, 1993). As was discussed in Chapter 4 this specific research
question can be further refined to address reliability and specific facets of validity.
1.2.1 To what extent are the results obtained on MidYIS reliable?
Reliability analysis was undertaken for the assessment and where possible for the
questionnaires. The aim of the analysis was to examine the extent to which the
instruments are consistent across contexts as well as to strengthen investigations
into construct validity. The results of the reliability analysis can be found in
Chapter 7 of the dissertation.
1.2.2 To what extent are the skills tested by MidYIS valid for the South
African curriculum? From an educational perspective, content-related validity in
terms of curriculum or curricular validity is viewed as the extent to which the
content of the items can be linked to the South African curriculum. In order to
address issues of content-related validity (which included issues of face, content
and curriculum validity), literature suggests that information is needed from
specialists in the field in which the research is located and thus these specialists
should be consulted (Anastasi & Urbina, 1997; Kline, 1993). For this reason,
education specialists were consulted. In order to investigate issues relating to the
curriculum, document analysis was undertaken (mathematics and language
curriculum documents), educational consultants (mathematics and language
specialists) as well as Provincial Education Department officials and National
Education Department officials were approached in order to adequately explore
issues of the intended, implemented, and attained curriculum.
The intended curriculum comprises system-level initiatives from the National and
Provincial Departments of Education such as curriculum documents. The
implemented curriculum is on a school-level and educator-level and refers to how
the school as a whole and educators, in particular, interpret and implement the
curriculum. The attained curriculum is what learners have learnt (Van den Akker,
125
2003). In the case of educational consultants, evaluation reports were required in
terms of whether the MidYIS assessment adequately covers the domain, appears
valid and corresponds with the intended and implemented curriculum. Provincial
Education Department officials working with curriculum issues, who know the
intended curriculum well and know when certain skills are introduced to learners
and how they should be built upon, were also included, not only to obtain
additional information pertaining to the curriculum validity but also as a form of
triangulation (Newman & Benz, 1998). Provincial Education Department officials
were asked to complete a questionnaire in which specific curriculum related
questions were posed. However, to obtain clarity around responses one official
was contacted to undertake a follow-up interview. Furthermore, the issue of
curriculum and curriculum validity was investigated from an intended curriculum
perspective, thus, interviews with National Department of Education officials were
undertaken. Two officials were interviewed in the areas of curriculum and
assessment (this decision is discussed in more detail in the sections to follow).
The results of this exploration are presented in Chapter 6.
1.2.3 To what extent are the items in MidYIS in agreement with the domain of
ability testing and applicable for South Africa? In order to address issues of
content-related validity, it is suggested that specialists in the field evaluate the
instrument (Thorndike, 1997; Urbina, 2004). For this reason, psychologists were
consulted. Chapter 6 of this dissertation provides the results pertaining to content-
related validity.
1.2.4 How well do the items per sub-test function and do they form well-
defined constructs? The prominence of construct validity was highlighted in
Chapter 3 and in order to investigate construct validity literature suggests
undertaking inferential statistics (Gronlund, 1998; Suen, 1990). Data from the
assessment and questionnaires was needed in order to investigate construct
validity. Statistics procedures used to investigate construct validity included Rasch
analysis to examine item characteristics as well as reliability analysis. The results
of the analyses pertaining to construct validity are presented in Chapter 7 of this
dissertation.
126
1.2.5 To what extent do the data predict future achievement?
The extent to which the instruments predict performance in academic subjects is
another aspect of validity, namely predictive validity, as highlighted by the specific
research question. Literature suggests that predictive validity is investigated by
means of correlating two sets of scores from different instruments in order to
investigate the relationship between them (Grunlund, 1998; Kline, 1993). In order
to explore the predictive validity, correlation analysis was undertaken where the
results of the assessment instrument were correlated with the language and
mathematics results as obtained at the end of the school year. Chapter 7 of the
dissertation provides the analyses pertaining to the predictive validity.
1.3 What adaptations are needed to transform MidYIS into SASSIS, a
monitoring system for the South African context? Based on the investigations of
specific research question 1.2.2 and 1.2.3 changes and adaptations are put forward
in order to transform the MidYIS monitoring system into SASSIS or the South African
Secondary School Information System. Sub-questions can be identified based on the
discussion in Chapter 4.
1.3.1 To what extent are the administration procedures appropriate and if
not, how can they be adjusted? Recommendations of the specialists in the field
were used to address this research question. However, this research question can
also be linked to the sub-research question related to reliability as was discussed
in Chapter 4.
1.3.2 To what extent is the content in MidYIS appropriate for second
language learners? Initial results are presented in Chapter 6 of the dissertation
based on the recommendation of the specialist in the field. However, this question
is also addressed in Chapter 7 of the dissertation to a lesser degree.
1.3.3 To what extent is the format of the assessment appropriate and if not,
how can it be changed? This research question is addressed in Chapter 6 as the
format was one of the aspects which specialists in the field were asked to
evaluate.
1.3.4 To what extent are the time allocations appropriate and if not, what
adjustments are needed? The time allowed for each section of the assessment
has implications for the quality of data. Specialists in the field were asked to
127
evaluate the time constraints allowed for each section. The results of this
evaluation are presented in Chapter 6.
1.3.5 To what extent is the feedback given in MidYIS appropriate for South
Africa and how can this format be improved upon? The feedback reports, which
form part of MidYIS, were addressed in Chapter 4. This question is elaborated on
in Chapter 9 of the dissertation.
The first main research question addresses issues of validity and reliability. The second main
research question is an extension of the first main research question if MidYIS is valid, with
the necessary adaptations, and reliable then which factors on a school, classroom and
learner-level could have influenced learner performance.
2) Which factors could have an effect on learner performance and therefore inform
the design of the monitoring system? This research question addresses the
exploration of variables that could possibly have a significant effect on the
performance of learners. When investigating the effect of factors on performance,
literature suggests that some form of regression analysis be undertaken (Newton &
Rudestam, 1999). In school effectiveness research multilevel analysis, which is a
form of regression analysis, is undertaken to investigate which factors are associated
with performance of learners (Scheerens, 1990; Scheerens & Bosker, 1997; Riddell,
1997; Sammons, 1999; Scheerens, 2001a). Likewise, in this research, multilevel
analysis was undertaken to investigate factors on a school, classroom, and learner-
level that have an effect on learner performance. Four specific research questions
can be identified namely:
2.1 What factors on a school-level affect the performance of learners on
the assessment? Prominent school-level factors were identified from literature
(Scheerens, 1990; Scheerens & Bosker, 1997; Bosker & Visscher, 1999; Marsh &
Willis, 2003) and included in the principal questionnaire. The factors not only are
prominent in literature but also had to correlate with the results of the assessment.
Significant factors were retained and were included for exploration by means of
multilevel analysis (see Chapter 8 for details).
2.2 What factors on a classroom-level affect the performance of learners
on the assessment? Relevant factors from literature were identified (Scheerens
& Bosker, 1997; Bosker & Visscher, 1999; Sammons, 1999; Marsh & Willis, 2003)
128
for inclusion in the educator questionnaire. The results from the educator
questionnaire were correlated with assessment data. Only the most significant
factors were retained for further analysis using multilevel modelling (see Chapter
8 for details).
2.3 What factors on a learner-level affect performance of learners on
the assessment? Literature suggests that several factors affect performance
(Anderson, 1988; Lens, 1994; Anderson, 1994; Howie, 2002). Some of these
factors were already present in the questionnaire as designed as part of the
MidYIS system (Extended MidYIS and SATIS). Additional information pertaining
to frequency of events in the classroom was added. The factors in the
questionnaire were explored and correlated with the assessment data. Significant
factors were included in the multilevel model (see Chapter 8 for details).
2.4 How can the identified factors be included in the design of the
monitoring system? This research question draws on the results presented in
Chapter 8. Suggestions on how the significant factors can be incorporated into the
monitoring system are presented.
Given the exploratory nature of the research and aims identified in Chapter 1, the research
was approached with an open mind in terms of using complementary methods. With
pragmatism underpinning the research design, both quantitative and qualitative methods
were used to answer the identified questions and mixed methods were adopted. According to
Johnson and Onwuegbuzie (2004, p. 16), “the bottom line is that research approaches
should be mixed in ways that offer the best opportunities for answering important research
questions”. Johnson and Onwuegbuzie (2004, p. 17-18), go on to say “…research methods
should follow research questions in a way that offers the best chance to obtain useful
answers”. Figure 5.1 illustrates a mixed method process model.
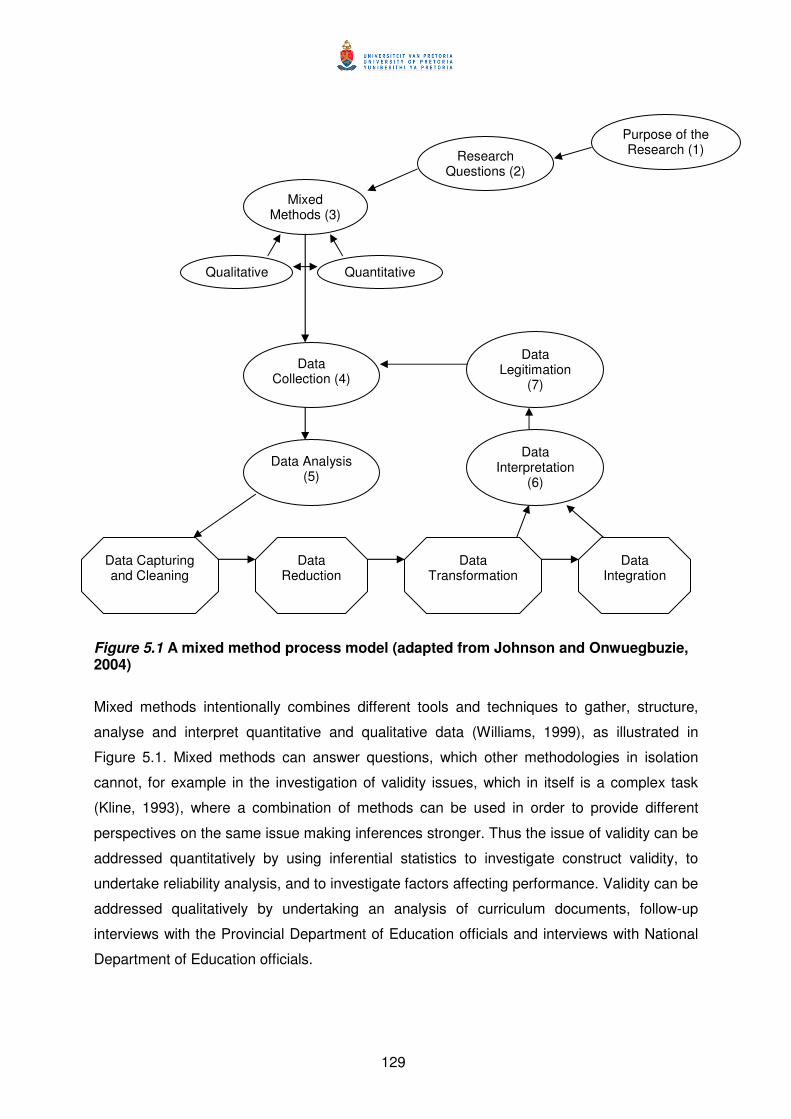
129
Figure 5.1 A mixed method process model (adapted from Johnson and Onwuegbuzie, 2004)
Mixed methods intentionally combines different tools and techniques to gather, structure,
analyse and interpret quantitative and qualitative data (Williams, 1999), as illustrated in
Figure 5.1. Mixed methods can answer questions, which other methodologies in isolation
cannot, for example in the investigation of validity issues, which in itself is a complex task
(Kline, 1993), where a combination of methods can be used in order to provide different
perspectives on the same issue making inferences stronger. Thus the issue of validity can be
addressed quantitatively by using inferential statistics to investigate construct validity, to
undertake reliability analysis, and to investigate factors affecting performance. Validity can be
addressed qualitatively by undertaking an analysis of curriculum documents, follow-up
interviews with the Provincial Department of Education officials and interviews with National
Department of Education officials.
Research Questions (2)
Purpose of the Research (1)
Mixed Methods (3)
Qualitative Quantitative
Data Collection (4)
Data Analysis (5)
Data Interpretation
(6)
Data Integration
Data Legitimation
(7)
Data Capturing and Cleaning
Data Reduction
Data Transformation
130
Furthermore, mixed methods comprise various design dimensions (Morse, 2003, Greene,
2005). The typology used for this research was a concurrent nested strategy. A concurrent
nested strategy implies that there is a dominant method that guides the research. In the case
of this research a quantitative approach is the dominant method. The qualitative component
was given lesser priority but was nested within the quantitative approach. The qualitative
approach was embedded in the quantitative approach as the method addresses a different
aspect of the question relating to validity and seeks information from a different level. While
the quantitative approach makes use of information at the school, classroom, and learner-
level, the qualitative approach makes use of information at the provincial and national-levels.
According to Creswell (2003) the use of a concurrent nested strategy provides a broader
perspective and makes it possible to study different groups and different levels
simultaneously. In terms of this research for example, a quantitative approach was used to
investigate issues of construct validity, predictive validity, and significant factors influencing
performance all of which can be attributed to a school, classroom, and learner-level.
However, a qualitative approach was used to investigate issues of curriculum validity,
specifically at national and provincial levels focusing on the intended curriculum. In both
instances, information from one level builds upon information from the other levels (Creswell,
Plano Clark, Gutman & Hanson, 2003).
Several advantages can be identified when using a concurrent nested strategy:
� The researcher can collect quantitative and qualitative data at the same time (Creswell
et al., 2003).
� The integrity of both methods is maintained as the assumptions underlying each method
are not violated (Morse, 2003).
� The advantages of using quantitative and qualitative approaches can be exploited
(Creswell et al., 2003).
� The researcher can provide different perspectives from different types of data and from
different levels within one study (Creswell et al., 2003) working both inductively and
deductively to accomplish the aims of the research (Morse, 2003).
5.3 Methodology
In the section to follow issues pertaining to the methodology followed in the research is
discussed namely the sample included (5.3.1); instruments used (5.3.2), validity issues
(5.3.3), data collection (5.3.4) and data analysis (5.3.5).
131
5.3.1 Sample
Eleven schools were purposefully selected in the Gauteng Province to participate in this
project, the schools were sample for maximum variation (according to Patton (2002) this is
called a maximum variation sample which is a form of purposive sampling). Purposive
sampling is a non-probability sampling technique. Its aim is to select candidates with a
specific purpose in mind (Neuman, 1997). In this case, due to financial constraints only a
limited number of schools could be accommodated. As the aim of the research was to
develop a monitoring system, which would be appropriate for secondary schools regardless
of the diversity of schools, it is was imperative to include schools from a variety of
environments, including demographic variations in learners, educators, surrounding
communities and access to funding. Thus three former White suburban schools of which two
were English medium and one school dual medium (English-Afrikaans) were included as well
as three former African township schools (ex-Department of Education and Training), two
former Indian schools (ex-House of Delegates) and finally two former Coloured schools (ex-
House of Representatives). Two Grade 8 classes from every school were randomly selected
by means of WinW3S (IEA, 2005). Therefore, all learners had an equal and independent
chance of being selected (Gay & Airasian, 2003). WinW3S is a within-in school sampling
package developed by the Data Processing Centre of the International Association for the
Evaluation of Educational Achievement (IEA). Special permission was obtained to use the
program as the program is normally only used in IEA studies. In total 794 learners from the
two classes in each school participated. The characteristics of the realised sample are
discussed in detail in Chapter 7.
In addition, all eleven principals from participating schools were asked to complete a
questionnaire as well as the mathematics and language educators of the selected classes
(44 educators if each class had a different educator). Ten principals’ questionnaires were
received while 36 (out of the possible 44) questionnaires of mathematics and language
educators were returned.
Apart from the eleven participating schools, two General Education and Training officials
specialising in the areas of mathematics and language were asked to participate as well as a
representative from the Gauteng Department of Education Office for Standards in Education
(OFSTED). In addition, two national government officials in the fields of curriculum and
assessment participated. Members of the provincial and national government were
purposefully selected for their specialisation in the fields of curriculum, specifically language
and mathematics and assessment.

132
5.3.2 Instruments
The instruments discussed in the section to follow pertain to both research questions. The
first main research question is to what extent is the Middle Years Information System
(MidYIS) appropriate as a monitoring system in the South African context? MidYIS
consists of an assessment instrument and learner questionnaire as was discussed in
Chapter 4. The learner questionnaire as well as the newly developed educator and principal
questionnaires are of relevance for the second main research question, namely which
factors could have an effect on learner performance and therefore inform the design of
the monitoring system as the factors identified will be taken out of the questionnaires.
5.3.2.1 Assessment instrument
The assessment instrument consists of seven sub-sections, which were collapsed into four
different scales namely the vocabulary scale, the mathematics scale, the skills scale, and the
non-verbal scale each of which was designed to measure certain skills and abilities as
discussed in Chapter 4. The seven sub-tests were timed and consist of multiple-choice items
with the exception of the mathematics sub-test, which included both constructed response
items and multiple-choice items (please refer to Appendix A for a description of sub-tests and
number of items included). The assessment itself was a combination of a speed assessment
and power assessment. Speed assessments measure not only the achievement, but also the
speed with which participants perform tasks and the difficulty of tasks are manipulated
through timing. A power assessment on the other hand has no time limit and difficulty is
manipulated by increasing or decreasing the complexity of items. As the assessment is a
combination of a speed assessment and a power assessment, the time limits typically allow
the majority of participants to attempt most or all of the items (Urbina, 2004).
5.3.2.2 Questionnaires
Over and above the assessment instrument, various background questionnaires formed part
of this project, including a learner questionnaire, educator questionnaire and principal
questionnaire.
Learner questionnaire. The CEM centre designed the questionnaire for learners as part of
another project called Student Attitudes Information System (SATIS) in which background
information and attitudes of learners towards school were collected. The questionnaire
included items pertaining to the demographic characteristics of the learner as well as
attitudes towards school life, school class, future aspirations, home and family life, use of
133
substances such as alcohol, personal or traumatic events that could have affected school
work, school climate, particularly safety and finally motivation to achieve, motivation to
continue learning and peer attitudes. The questionnaire was comprehensive in nature, but
additional items on aspects pertaining to instructional practices of educators were included
for triangulation purposes. The additional items which were included were based on school
effectiveness literature (Newmann, 1991; Scheerens, 1992; Scheerens & Bosker, 1997;
Mortimore, 1998; Sammons, 1999; Grobler et al., 2001; Howie, 2002; Harris & Chapman,
2004) or taken from developed questionnaires, such as the Third International Mathematics
and Science Study (TIMSS) and Progress in International Reading Literacy Study (PIRLS)
learner questionnaires (refer to Appendix B for a description of subsections and number of
items included). The items included were operationalised concepts as discussed in Chapters
2 and 3. They were mostly closed-ended items with the exception of three items that were
open-ended.
Educator questionnaire. Literature (Scheerens, 1990; Newmann, 1991; Marsh, 1992;
Teddlie, 1994c; Scheerens & Bosker, 1997; Sammoms et al., 1998; Sammons, 1999;
Scheerens, 2001a; Willm & Somers, 2001) was used to identify factors on a classroom-level
that have shown to effect learner performance. The educator questionnaire was developed
not only to collect background information but also to ascertain educator attitudes in
accordance with literature. The questionnaire included items pertaining to the age of the
educator, qualifications and teaching experience, quality of instruction and instructional
methods, revised national curriculum, assessments practices, opportunities to learn,
challenges experienced, feedback and reinforcement resources, professional development,
school climate, monitoring at classroom-level and attitudes towards the school and work.
Developed questionnaires, which included the identified factors, were consulted in order to
find exemplar items. Items pertaining to identified factors which were not included in already
developed questionnaires were constructed by using school effectiveness literature as a
departure point (refer to Appendix C for a description of subsections and number of items
included). The following questionnaires were used in the development of the educator
questionnaire; however, it is pertinent to mention that the items used in this research were
adapted from the items in the questionnaires mentioned below:
1) School Achievement Indicators Program educator questionnaire.
2) Education Quality and Accountability Office educator questionnaire.
3) The Third International Mathematics and Science Study-1999 educator questionnaire.
4) Education Quality and Accountability Office Grade 3 and 6 Assessment of reading,
writing, and mathematics.
134
The items included were mostly closed-ended items with the exception of two items, which
were open-ended.
Principal questionnaire. The school or principal questionnaire was developed in order to
collect background information as well as information pertaining to attitudes of principals. The
principal questionnaire was based on school effectiveness literature (Scheerens, 1990; Bliss,
1991; Newmann, 1991; Marsh, 1992; Scheerens, 1992; Teddlie, 1994a; Teddlie, 1994c;
Scheerens & Bosker, 1997; Sammons, Thomas, Mortimore, Walker, Cairns & Bausor, 1998;
Grey et al., 1999; Heck, 2000; Scheerens, 2001a; Wills & Somers, 2001; Hill, 2001; Howie,
2002) or made use of exemplar items from already developed questionnaires. Items relevant
to factors identified from literature which were not included in already developed
questionnaires were constructed by using school effectiveness literature as a departure point
(refer to Appendix D for a description of subsections and number of items included). The
following questionnaires were used in the development of the principal questionnaire; the
items, however, were adapted:
1) The Third International Mathematics and Science Study-1999 principal questionnaire.
2) Education Quality and Accountability Office principal questionnaire.
The principal questionnaire included items pertaining to the school’s attitude toward
achievement and approach towards assessment, leadership style, school climate, curriculum
development and design, professional development, monitoring at school-level, resources,
parental involvement and the impact of intended policies such as Whole School Evaluation
and Systemic Evaluation (refer to Appendix D for a description of subsections and number of
items included). The items included were mostly closed-ended items with the exception of
two items that were open-ended.
Provincial-level questionnaire. The provincial-level questionnaire was a short
questionnaire developed for curriculum specialists within the Provincial Department of
Education in order to collect information pertaining to the intended curriculum as discussed in
5.2. The questionnaire included items pertaining to assessment practices, and use of
developed assessments, issues related to curriculum validity, items related to skills
development in terms of the curriculum and background information such as age, gender,
qualifications, previous as well as current employment. The questionnaire consisted of both
closed-ended items as well as open-ended items.
135
5.3.2.3 Interview schedules
National Department of Education. The aim of the interview schedule for the National
Department of Education was to collect information on assessment and curriculum issues
including policy, making use of developed assessments, strategies advocated to ensure
curricular or curriculum validity and issues pertaining to monitoring. The schedule was semi-
structured in that although the questions had been formulated and the order determined the
order as well as the questions were modified during the interview as deemed appropriate.
The questions included were open-ended with the responses recorded and taped by the
interviewer (Gay & Airasian, 2003).
Provincial Department of Education. . . . The questionnaire developed for Provincial
Department of Education officials was used in a telephonic interview. This was done to obtain
clarity on the answers provided in questionnaire. The questionnaire lent itself to be used as
an interview schedule due to the open-ended questions.
5.3.3 Validity issues related to the instruments
Validity ascertains the extent to which the interpretations of results are appropriate as well as
meaningful. Validation is the process whereby validity evidence is gathered (Urbina, 2004).
Issues pertaining to the validity of research are an important aspect, more so now that there
are a variety of methodological choices available. According to Newman et al. (2003, p. 167):
…researchers strengthen validity …when they can show the consistency among
research purposes, the questions, and the methods they use. Strong consistency
grounds the credibility of research findings and helps to ensure that audiences have
confidence in the findings and implications of research studies.
Validity per se has the following characteristics (Gronlund, 1998; Linn & Gronlund, 2000):
� It is inferred from evidence and ultimately depends on many different types of evidence
from which inferences are drawn.
� It is expressed by degree, in terms of high, moderate and low and is specific to a
particular use.
� It is a unitary concept that is based on various forms of evidence, with construct-related
validity being the central concept, and ultimately it is concerned with the consequences
of using the assessment or questionnaire.

136
Among the factors adversely affecting validity, are:
� Tasks included that inadequately sample the domain to be assessed or do not function
as they were intended. This could be due to lack of relevance, inappropriate difficulty, or
bias (Gronlund, 1998).
� Inadequate administration causing directions to be unclear or inadequate time allowed,
resulting in the collection of skewed data, thus lowering the validity of the results
(Gronlund, 1998).
� Validity can be influenced if the items are poorly constructed, if there is an overemphasis
of certain aspects, or if there is an identifiable pattern of answers (Linn & Gronlund,
2000).
In the section to follow, the aspects of validity are discussed separately for the assessment
instrument (5.3.3.1), interview schedules (5.3.3.2), and contextual questionnaires (5.3.3.3).
5.3.3.1 Validation of assessment instrument
The concept of validity is multifaceted in terms of forms of evidence and the interpretation of
validity differs depending on the context in which it is used. To illustrate the point, if one was
looking at the degree to which items are spread over a particular domain (content-related
validity) one would not interpret the information from the perspective of whether or not the
results could be used to predict future achievement (criterion-related evidence, predictive
validity). Validity in this research is seen as a unitary concept, even though it comprises
several facets. The facets are highlighted according to the aims of the study and may be
content-related validity (which includes face and curriculum validity), predictive validity, or
construct validity (construct-related validity). Validity here is seen as a property of
interpretation (Gronlund, 1998; Linn & Gronlund, 2000).
In the context of this research, the different types of validity were viewed as categories for
accumulating evidence to support validity claims. Various forms of evidence are discussed
namely in terms of content-related validity from a psychometric perspective, in terms of face
validity and content validity and from an educational perspective in terms of curricular validity.
Other forms of evidence included construct-related validity, and criterion-related evidence
using a predictive study or predictive validity.
Traditionally, face validity is the extent to which an assessment looks as if it measures
properties of constructs (Anastasi & Urbina, 1997). Face validity is considered a non-
professional’s assessment of validity. It refers to whether the assessment or questionnaire
137
looks valid and is a desirable feature in assessments and questionnaires since it can
increase the motivation of participants and high motivation is essential for valid testing (Kline,
1993). Face validity or the superficial appearance of what the test measures from the
perspective of the participant is subsumed under content-related validity (Urbina, 2004).
Content-related validity is generally understood as the extent to which the questions in the
assessment match the field within which the assessment can be located (Coolican, 1999).
Thus the sampling of items from the broader domain is important (Gronlund, 1998) in terms
of relevance as well as of representativeness (Urbina, 2004). Factors of importance when
evaluating content-related validity are the emphasis of content areas and objectives, types of
items included, number of items included and the appropriate difficulty level of items
(Thorndike, 1997).
The MidYIS instrument is a developed abilities assessment and specialists are consulted to
map the overlap of developed abilities tests domain and items included in the assessment.
However, when administering a developed abilities test within an educational setting the
curriculum and the abilities that are supposed to be taught (according to the curriculum) are
important. Content-related validity refers specifically to the match of items and content
domains and a different facet of content-related validity is necessary in addition to examining
the extent to which items are adequately represented from the domain of abilities. This type
of validity is called curricular or curriculum validity and refers to the extent to which the
abilities or competencies assessed match the curriculum (Thorndike, 1997). Curriculum
validity is of particular importance in this research as it attempts to map the tested
competencies or abilities onto what the learners have been exposed to in the curriculum,
especially in light of South Africa using an outcomes-based or rather competency-based
curriculum. Content-related validity, which includes face validity and curriculum validity, is
evaluated by means of drawing up tables of specifications or by consulting content
specialists (Suen, 1990).
Criterion-related validity, in terms of traditionally predictive validity, examines the degree of
relationship between the assessment scores and the criteria to be predicted (Gronlund,
1998) in order to estimate future levels of performance (Urbina, 2004). Therefore, predictive
validity is the degree to which assessment scores can predict future scores (Coolican, 1999).
Predictive validity is investigated by means of correlation analysis. When a correlation
coefficient is used to ascertain validity, it is referred to as a validity coefficient. In addition to
correlation analysis, expectancy tables can also be used to illustrate the relationship between
two measures. The relationship can be represented in a twofold chart with the assessment
138
scores arranged in categories down the left side of the table and the measure to be
predicated arranged in categories across the top (Gronlund, 1998).
Construct validity or construct-related evidence on the other hand refers to whether the
assessment possesses certain psychological characteristics (Gronlund, 1998) that are
indicators of the theoretical construct of interest (Suen, 1990). These characteristics are
hypothetical qualities or constructs which include a description of the theoretical framework
that specifies the nature of constructs, description of development of the assessment and
aspects of measurement and the pattern of relationships. Thus construct-related validity is
the extent to which the results support the theory behind the research (McBurney, 1994).
Construct validation includes all categories of evidence drawing upon the comparison of the
sample of assessment tasks to the domain of tasks. This includes examining test features
and their influence on the meaning of scores, determining the internal consistency of the
assessment and correlating assessment scores with other assessments that measure the
same construct or making use of other academic results (Gronlund, 1998).
Expert opinion as a validation strategy. One way in which to investigate content-related
validity is by judgements regarding the degree to which the assessment adequately samples
a particular content domain from a psychometric perspective or curricular domain from an
educational perspective (Murphy & Davidshofer, 1994; Thorndike, 1997). For this research, it
was important to examine how well the content of the assessment was aligned with both the
abilities domain (Linn & Gronlund, 2000) and curricular domain (Thorndike, 1997). The
judgement process can be formal or informal in nature. The least formal process used was a
casual overall impression as to whether the assessment appears to measure what it was
suppose to measure, thus looking at the face validity. A formal process entailed a systematic
procedure of consulting content area specialists (Suen, 1990). While the judgements
concerning face and content-related validity are neither final nor absolute, these judgements
are not arbitrary (Murphy & Davidshofer, 1994). For this research, to ensure content-related
validity the assessment was given to three education specialists, an educational psychologist
and two research psychologists to assess.
The use of test-curriculum overlap as a validation strategy. . . . Test-curriculum overlap (TCO)
is the extent to which the content of the assessment is present in the curriculum (De Haan,
1992). De Haan distinguishes five (5) different approaches to TCO:
� One could directly observe what is being taught and whether the content is covered
by the assessment.
� Alternatively, one could follow a taxonometric approach where both assessment
139
content and curriculum content are mapped on a taxonomy, which consists of topics
and intellectual processes or skills. The taxonometric approach lends itself well to
ascertain the overlap of the assessment content and the intended curriculum.
� If either of the two approaches already mentioned are inappropriate, another
alternative is to undertake text analysis. In text analysis, textbooks used by the
sample learners are analysed and similar items as those in the assessment are
identified. However, as it is not possible to ascertain whether all items in the textbook
are exercised, this type of analysis can only give an indication of the assessment
content and formal or intended curriculum.
� The fourth type of analysis is instructional analysis. By undertaking instructional
analysis one tries to obtain estimations from educators, learners and curriculum
experts as to whether the content in the test was or should be taught.
� Another approach is to make use of data analytic strategies in which one tries to
assess the content coverage of tests by identifying unusual response patterns of
individual learners.
Regardless of which approach one selects to undertake an analysis of the test-curriculum
overlap, the reason behind such an analysis remains the same. The reason is always to
ascertain the validity of such assessments: does the assessment measure what it is
supposed to measure and is the assessment instrument suited to the study and fair to
participants?
When reflecting upon the five approaches to TCO, it would seem that an either or situation is
not preferable if curricular validity is to be assessed. Only a combination of approaches
would strengthen any claim made. Two approaches were deemed best suited to this
research, namely a taxonometric approach and instructional analysis. A taxonometric
approach lends itself to document analysis and the development of a framework in which to
match skills and curriculum, whilst instructional analysis lends itself to specialist evaluation.
Specialists were asked to assess the assessment and also to assess the extent to which
what had been assessed should have been taught. Therefore, the extent to which the
content of the assessment was aligned with curriculum goals were examined (Linn &
Gronlund, 2000). Both approaches focused on the intended curriculum.
The documents included for analysis were the national curriculum policy documents. These
documents provide a snapshot of what the intended curriculum is according to the national
government. The intended curriculum, namely what ideally should be taught (Van der Akker,
2003), was explored in this study as curricular validity refers to the extent to which the
140
content of the assessment is aligned with curriculum goals. Only relevant policy documents
were analysed, specifically the language and mathematics policy documents. These were
important because the content of the assessment, although a developed abilities test
assessing basic skills, is related to the areas of language and mathematics and because the
National Department of Education has identified literacy, mathematics, and science as key
areas of intervention (South African Yearbook, 2003). Elements of literacy and mathematics
are directly covered in the assessment. By providing insight into the skills and competences
that should be addressed per grade level, specifically for language and mathematics, the
curriculum documents serve as a source of information on what skills and competences
should be taught.
Specialists in the field evaluated the assessment, using the instructional analysis approach.
Two language specialists and two mathematics specialists were approached. Due to
unforeseen circumstances one of the mathematics specialists was unable to finish the
review. One language specialist is a practitioner and head of curriculum development at the
school where she works while the other is a member of the Faculty of Education, University
of Pretoria who has specialised in languages and has a wealth of teaching experience at
both school and university level. The mathematics specialist is a research consultant, who
has worked in the field of mathematics for a number of years, and has authored a number of
mathematics textbooks.
In addition to document analysis and specialist evaluation, two National Department of
Education officials were interviewed in order to obtain additional information on issues
pertaining to curricular validity and monitoring systems. Moreover, two Provincial Department
of Education officials specialising in language and mathematics were asked to complete
questionnaires. The questionnaires were developed based the results from the document
analysis and specialist evaluation. Finally, one representative from OFSTED was
interviewed. Both the questionnaire and the interview focused specifically on skills and
competences in the curriculum.
Validity strategies for the qualitative data as part of test-curriculum overlap. . . . Validity in
qualitative research is described in terms of the trustworthiness, relevance, plausibility,
credibility, or representativeness of the research (Babbie & Mouton, 1998; Lincoln & Guba,
1985; Trochim, 2001). The validity of the research is located with the representation of the
participants, the purpose of the research and the appropriateness of the processes employed
(Winter, 2000).
141
Validity for the qualitative component of this research has to do with the adequacy of the
researcher to understand as well as represent the participants’ meaning. Thus validity
becomes a quality of the knower in his/her relation to the data, enhancing different vantage
points and forms of knowing (Tindall, 1990). It raises questions about the validity of the
results (Trochim, 2001). Validity in qualitative research is personal, relational, as well as
contextual in nature. How the research was conducted was of importance in terms of whether
the researcher was aware of her own perspective, processes, and the influence of these on
the research (Marshall, 1986). When considering issues of validity in qualitative research it is
accepted that one’s impression of what truth is will determine how one views the
trustworthiness, accuracy and reliability or dependability of the research (Winter, 2000). The
examination of how one’s own truth influences the research process is known as reflexivity
(Tindall, 1990).
The notion of reflexivity in this research is important. It is not only consistent with the
underlying paradigm, pragmatism, but is also an important component of qualitative
research. Reflexivity is consistent with pragmatism, as pragmatism is concerned with the
value-ladeness of research and calls for the researcher to select a research approach that
would reflect what s/he deems important. Also of importance here is personal reflexivity,
which refers to aspects of the researcher’s identity and the fact that research undertaken is
very often an expression of personal interests and values (Wilkinson, 1988, Tindall, 1990). In
terms of mixed methods, an important aspect is that the assumptions of the methodology
used must not be violated (Morse, 2003). Reflexivity is a vital part of the qualitative research
process. Likewise the credibility, dependability, and conformability of the research results are
of importance as indicators of the trustworthiness of the research (Babbie & Mouton, 1998).
Credibility is similar to the concept of internal validity (Lincoln & Guba, 1985). It refers to
procedures aimed at ascertaining whether the interpretations of the data are compatible with
the constructed realities of the participants (Babbie & Mouton, 1998). Although many
procedures exist to ascertain credibility of interpretations such as peer debriefing or member
checking, triangulation was used in this research.
Triangulation is the use of two or more methods of data collection in order to gather
information on an aspect of behaviour (Cohen, Manion & Morrison, 2004). It reduces the risk
of chance associations and bias as well as assists in formulating better explanations
(Maxwell, 1996). The aim of triangulation was to explain the complexity of behaviour or a
phenomenon in a comprehensive manner by studying it from more than one standpoint. For
the purposes of this research, method triangulation (Tindall, 1990) was applied by using

142
multiple instruments and by using different respondent categories. As triangulation allows for
the illumination of different vantage points, investigator triangulation, using more than one
researcher, was used in order to reflect on multiple viewpoints (Tindall, 1990).
Triangulation is a procedure also used to establish the credibility of interpretations.
Procedures similar to those used to establish credibility could also be used to establish the
dependability of results. Dependability is very similar to reliability in quantitative studies. It
refers to the provision of evidence that if the inquiry were to be repeated with the same or
similar people in the same or similar circumstances, the findings would be the same.
Assertions pertaining to dependability are strengthened by means of an inquiry audit in which
an “auditor” examines documentation on which the findings are based, in order to attest to
the dependability and confirmability of results. Such documentation include interview and
process notes (Babbie & Mouton, 1998).
An audit trail is a record of decisions made and processes followed during the data analysis
process. The aim of the audit trail is to enable the auditor to establish whether the
interpretations, conclusions, and recommendations are rooted in the data (Babbie & Mouton,
1998). Different kinds of documentation are required to undertake an audit trail ranging from
raw data to process and data reconstructions. The audit trail (refer to Appendix E) for this
research comprised (Lincoln & Guba, 1985):
� The raw data that included the transcripts of the interviews with National Education
Department officials as well as the policy documents used.
� Data reduction and analysis products that included the theoretical notes taken from
literature as well as the coding system used (presented in the form of a concept map).
� Data reconstruction and synthesis products that included the categories of themes
and relationships as well as the conclusions drawn.
� Instrument development information that included the interview schedule and
provincial education questionnaire.
5.3.3.2 Validation of the questionnaires
Content-related validity was used in validating the questionnaires. Content-related validity
was discussed in detail under the validation of the assessment. Of importance is the extent to
which the items in the questionnaires match the field within which the questionnaires can be
located (Coolican, 1999), in this case school effectiveness and school improvement
research. In order to establish whether the items match the field and whether the items
143
looked valid, specialists in the field were consulted. Two researchers working in the fields of
school effectiveness and school improvement reviewed all the questionnaires used in this
research. Both researchers have extensive knowledge of survey research, having worked on
cross-national studies such as the Third International Mathematics and Science Study
(TIMSS). One of the researchers is the Director of the Centre for Evaluation and Assessment
and National Coordinator for the Progress in Reading Studies (PIRLS). While the other
researcher has been chairman of the IEA for a number of years and is currently coordinating
the Second International Technology in Education Study (SITES).
5.3.4 Data collection
The data collection in this study comprises various forms of evidence ranging from document
analysis, assessments and questionnaires to interviews (refer to Table 5.2). In the section to
follow, the data collection process for each of the different types of evidence is described
(refer to Chapters 2, 3 and 4).
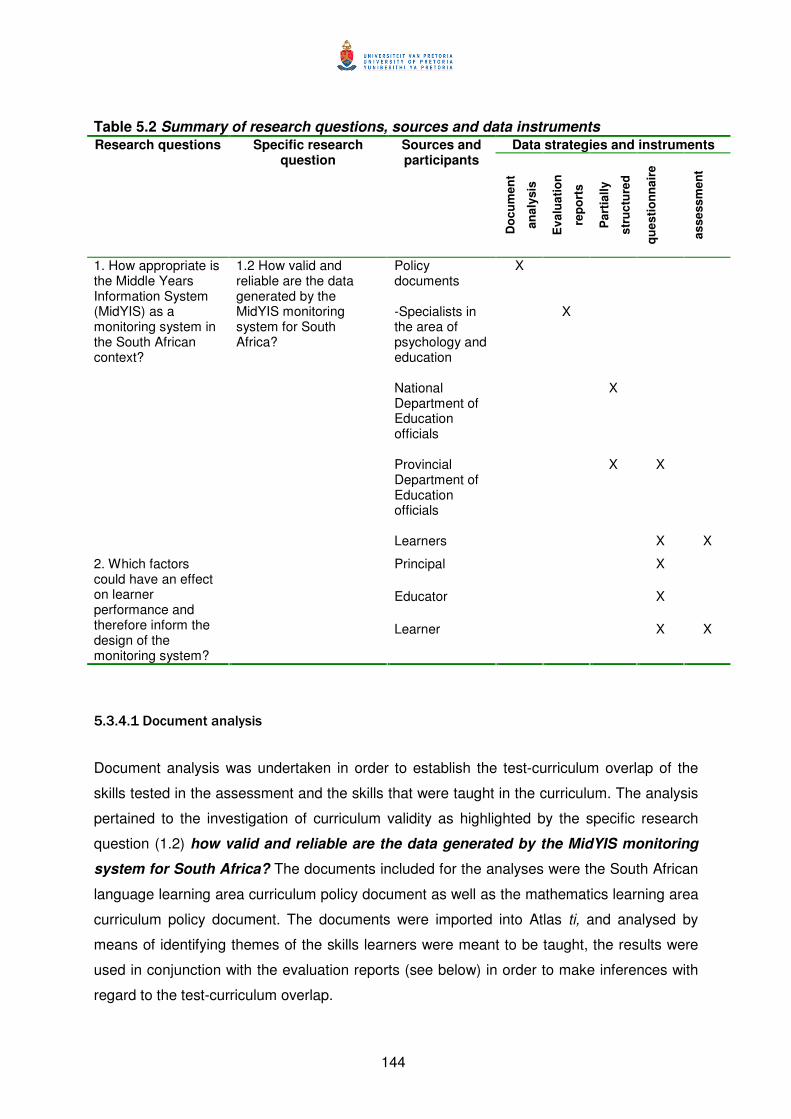
144
Table 5.2 Summary of research questions, sources and data instruments Data strategies and instruments Research questions Specific research
question Sources and participants
Do
cu
me
nt
an
aly
sis
Ev
alu
ati
on
rep
ort
s
Pa
rtia
lly
str
uc
ture
d
qu
es
tio
nn
air
e
as
se
ss
me
nt
Policy documents
X
-Specialists in the area of psychology and education
X
National Department of Education officials
X
Provincial Department of Education officials
X X
1. How appropriate is the Middle Years Information System (MidYIS) as a monitoring system in the South African context?
1.2 How valid and reliable are the data generated by the MidYIS monitoring system for South Africa?
Learners X X
Principal
X
Educator
X
Learner X X
2. Which factors could have an effect on learner performance and therefore inform the design of the monitoring system?
5.3.4.1 Document analysis
Document analysis was undertaken in order to establish the test-curriculum overlap of the
skills tested in the assessment and the skills that were taught in the curriculum. The analysis
pertained to the investigation of curriculum validity as highlighted by the specific research
question (1.2) how valid and reliable are the data generated by the MidYIS monitoring
system for South Africa? The documents included for the analyses were the South African
language learning area curriculum policy document as well as the mathematics learning area
curriculum policy document. The documents were imported into Atlas ti, and analysed by
means of identifying themes of the skills learners were meant to be taught, the results were
used in conjunction with the evaluation reports (see below) in order to make inferences with
regard to the test-curriculum overlap.
145
5.3.4.2 Evaluation reports
The evaluation report forms part of the validity strategy employed in this research, specifically
focusing on issues of content-related validity as highlighted by the specific research question
(1.2) how valid and reliable are the data generated by the MidYIS monitoring system
for South Africa? In order to investigate the different aspects of validity, specialists in the
field of psychology and education were approached. Two research psychologists as well as
an educational psychologist evaluated the assessment instrument for content-related validity.
The psychologists were asked to complete an evaluation form relating to issues of language,
bias and content covered (refer to Appendix F). A meeting was scheduled to discuss the
results of the evaluation and process notes taken.
Specialists in the field of education, specifically in mathematics and language, were also
approached and the assessment was evaluated from a curriculum perspective. The
specialists were asked to complete an evaluation form similar to the form used for the
psychologists. Issues of curriculum relevance were covered and a table of specification
drawn up in order to identify the difficulty of items. Grade level introduction of the content
were included from a theoretical perspective (refer Appendix G). Once the evaluation task
was completed, a meeting was scheduled with each specialist to discuss the results of the
evaluation and process notes taken.
5.3.4.3 National-level data collection
Two national government officials were visited for face-to-face interviews with the purpose of
obtaining additional information on issues pertaining to curriculum validity and monitoring
systems more generally. The interviews with National Education Department officials is
related to curriculum validity issues as highlighted by the specific research question (1.2)
how valid and reliable are the data generated by the MidYIS monitoring system for
South Africa? The participants were contacted telephonically to request that they participate
in the research project. Details of the project were provided and the aim and background of
the interview itself were explained. Forty-five minutes were requested; however, the
interviews were completed in 30 minutes. The interviews were conducted using a semi-
structured interview schedule, which was emailed to the participants before the interview took
place. The interview was recorded with the permission of the participants.
146
5.3.4.4 Provincial-level data collection
The purpose of this data collection was to provide additional information pertaining to
curriculum validity and it relates to the specific research question (1.2) how valid and
reliable are the data generated by the MidYIS monitoring system for South Africa? The
provincial-level education officials were first contacted telephonically to request their
participation in this research. Background information was provided on the project as a whole
and the purpose of the questionnaire explained. Once the officials had agreed the
questionnaires were emailed and faxed to them. Upon completion, the questionnaires were
emailed and faxed back to the researcher (refer to 5.3.2 for a discussion on topics covered in
the questionnaire).
The OFSTED representative was contacted telephonically to ascertain whether if the official
would be willing to participate in this research. During the telephonic conversation,
information on the project was provided - the purpose of the questionnaire as well as the
follow-up interview. Once the official had agreed to participate, the questionnaire was
emailed to the OFSTED official. That was followed-up with a telephone interview using the
questionnaire as an interview schedule. The telephone interview lasted 15 minutes (refer to
5.3.2 for a discussion of topics covered in the questionnaire and follow-up interview).
5.3.4.5 School-level data collection
Each school was visited on a separate day and fieldworkers administered the instruments.
The instruments included the learner assessment, learner questionnaire, principal
questionnaire and questionnaires for the mathematics and language educator of the two
classes selected (refer to 5.3.2 for a discussion on topics covered in the instruments). Each
classroom had a fieldworker overseeing the standardised administration procedure. The
fieldworker read a script explaining the assessment and questionnaire as well as the time
limits for each sub-section. This ensured that the administration procedures were
standardised across the schools and that each learner received exactly the same
information. The assessment as well as the questionnaire took approximately two and a half
hours to complete. The English script was translated into Sepedi and Afrikaans (the two
additional languages of instruction for the sampled schools) to ensure that each learner
would understand what was expected. Two groups of translators were used for the
translation of the administration script. The first group translated the English script into
Sepedi and Afrikaans, while the second group of translators checked the Sepedi and
Afrikaans translations against the English version. Any changes or corrections were made in
consultation with the specialists before the scripts were finalised. Thus administration of the
147
instructions for assessments took place in English, Sepedi, and Afrikaans depending on the
school that was visited. The assessment itself, however, was in English.
In order to capture the administration process the fieldworkers completed an administration
questionnaire detailing the administration process, including problems experienced,
comments made by learners and general impressions and time taken for the majority of
learners to complete the sub-sections.
While learner assessments were conducted, the principal and educators were asked to
complete background questionnaires. However, in certain instances the principal and
educators could not completed the questionnaires in the time taken for the learner data
collection. In these cases, the questionnaires were either collected later or faxed to the
researcher.
5.3.5 Data analysis
Data analysis is the vehicle used to generate and validate interpretations, formulate
inferences, and draw conclusions. In this study, parallel mixed methods analysis was used.
In parallel mixed methods analysis, interpretation and writing up of the qualitative and
quantitative data are undertaken separately (Onwuegbuzie & Teddlie, 2003). For the
qualitative data, such as curriculum documents and semi-structured interviews, document
analysis and thematic content analysis were undertaken (5.3.5.1 and 5.3.5.2). The
assessment data was analysed by means of descriptive statistics, Rasch analysis, reliability
analysis and correlation analysis (5.3.5.3) while the contextual data was analysed by means
of descriptive statistics, reliability analysis (5.3.5.4). The results from the assessment as well
as variables from the contextual data were used to build a multilevel model (5.3.5.5).
The data analysis for the quantitative component was undertaken by means of the Statistical
Package for the Social Sciences (SPSS) unless otherwise indicated, while the qualitative
component was undertaken using Atlas ti. Atlas ti is a qualitative data analysis tool that is
classified as coding and theory building software (Barry, 1998). It is therefore acceptable for
this research as thematic content analysis is used. The only other software package that is
classified as a coding and theory building software is Nudist. Atlas ti was chosen for this
research, however, and for the following reasons
� Its visual and spatial qualities, creativity, and the ability to interlink ideas (Barry,
1998).
� The researcher is able to visualise relationships between different parts of the data
148
and theoretical ideas, enabling pattern recognition (Barry, 1998).
� It is easy to work with and easier to learn, especially at a basic level of operation,
much easier than Nudist (Barry, 1998).
� It is ideal for less complex projects (Barry, 1998) and thus ideal for the purposes of
this research. It provides easy access to documents, quotations, codes, and memos
and allows the researcher to work with data in the form of text, graphics, or sound
(Henning, van Rensburg & Smit, 2004).
� It provides researchers with a code-retrieve function and essentially provides support
for theory building (Henning et al., 2004).
� It enables researchers to connect codes in order to facilitate higher-order
classifications and categories (Henning et al., 2004).
� It provides a platform for the facilitation of cross-referencing of data and enables the
researcher to develop networks to describe relationships (Henning et al., 2004).
In the section to follow the analysis techniques used for the document analysis, qualitative
data and the assessment data as well as the questionnaire data are discussed in detail.
5.3.5.1 Analysis of documents
Document analysis was undertaken to provide information pertaining to the curriculum
validity of the assessment. Curriculum validity is a crucial component of the specific research
question 1.2 (how valid and reliable are the data generated by the MidYIS monitoring
system for South Africa?). The curriculum policy documents were imported into Atlas ti and
a thematic content analysis undertaken. The procedure followed for the thematic content
analysis is discussed in detail in the section to follow, analysis of qualitative data (5.3.5.2).
Both an inductive and a deductive approach to analysis were followed. A deductive approach
was followed because the structure of the document, in terms of learning areas and learning
outcomes, was used as an overarching framework. An inductive approach was used
because skills were identified and directed by the text of the curriculum documents.
However, themes that were coded in text generally referred to the type of skills the
curriculum tries to develop and the way in which the skills are developed. As mentioned
earlier, the developed abilities assessment is essentially a psychological assessment, yet the
relevance to the curriculum also had to be established. Thus the various skills the curriculum
aims to develop constitute an important link that needed to be explored. Specific skills, such
as problem solving, skimming and scanning capabilities and proof reading, were focused on.
149
5.3.5.2 Analysis of qualitative data
Semi-structured interview schedules were used in the research in order to obtain data
relevant to the specific research question (1.2) how valid and reliable are the data
generated by the MidYIS monitoring system for South Africa? The interviews were
recorded so that transcriptions could be generated. As in any analysis, data reduction must
take place. The procedure includes organising data so that emerging themes or patterns can
be identified (McRoy, n.d.). Data reduction however was not separate from the analysis, it is
inherently part of the analysis, first in terms of editing, segmenting, and summarising and
secondly in terms of coding, memoing (notes on codes and themes), and developing themes
to conceptualising and explaining. The aim of the reduction of data was to reduce the data
without substantial loss of information or context.
Although a semi-structured interview schedule was used, both an inductive and a deductive
approach were followed. The interview schedule served as a guide to ensure that information
relevant to certain aspects was covered, however, this did not bind the participants to adhere
strictly to what was asked. Thus participants had the freedom to elaborate on issues that
were not necessarily covered in the schedule but which they felt were important.
The next step in the qualitative data analysis was data display in which information was
organised, compressed, and assembled by means of graphs, charts or networks and models.
The final stage of the data analysis is drawing and verifying conclusions (Punch, 1995).
Figure 5.2 provides a visual representation of the process followed in the research when
undertaking the data analysis.
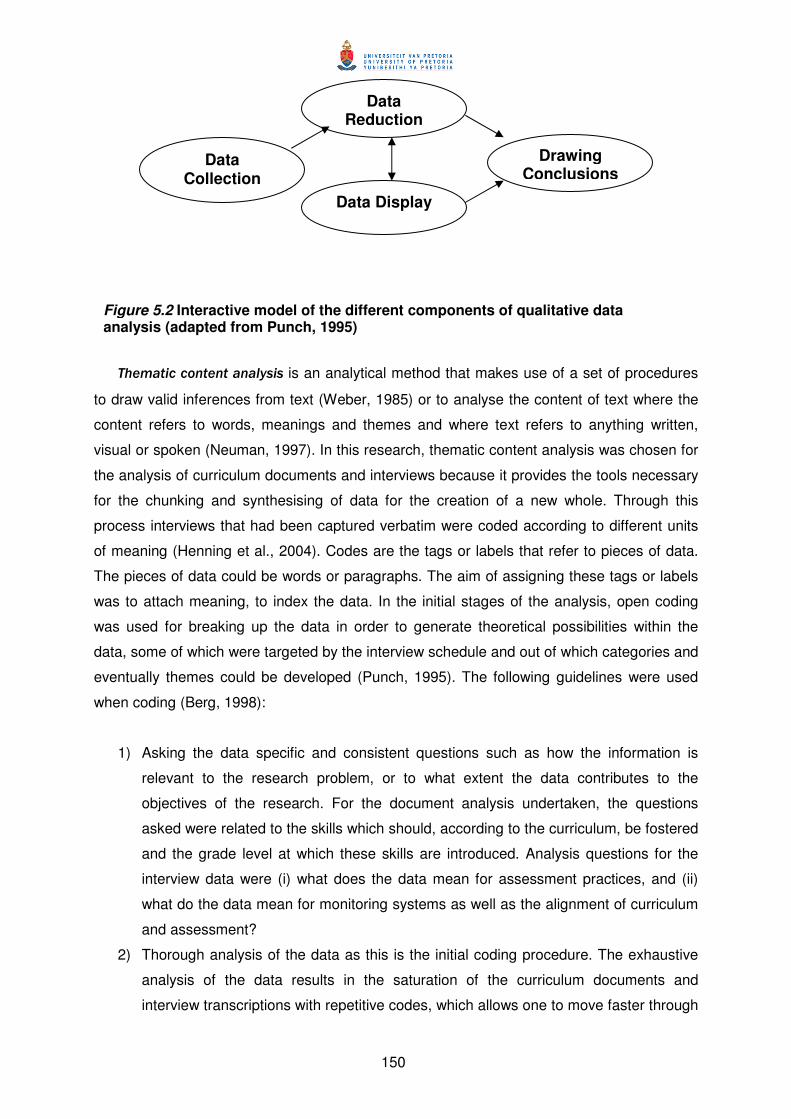
150
Thematic content analysis is an analytical method that makes use of a set of procedures
to draw valid inferences from text (Weber, 1985) or to analyse the content of text where the
content refers to words, meanings and themes and where text refers to anything written,
visual or spoken (Neuman, 1997). In this research, thematic content analysis was chosen for
the analysis of curriculum documents and interviews because it provides the tools necessary
for the chunking and synthesising of data for the creation of a new whole. Through this
process interviews that had been captured verbatim were coded according to different units
of meaning (Henning et al., 2004). Codes are the tags or labels that refer to pieces of data.
The pieces of data could be words or paragraphs. The aim of assigning these tags or labels
was to attach meaning, to index the data. In the initial stages of the analysis, open coding
was used for breaking up the data in order to generate theoretical possibilities within the
data, some of which were targeted by the interview schedule and out of which categories and
eventually themes could be developed (Punch, 1995). The following guidelines were used
when coding (Berg, 1998):
1) Asking the data specific and consistent questions such as how the information is
relevant to the research problem, or to what extent the data contributes to the
objectives of the research. For the document analysis undertaken, the questions
asked were related to the skills which should, according to the curriculum, be fostered
and the grade level at which these skills are introduced. Analysis questions for the
interview data were (i) what does the data mean for assessment practices, and (ii)
what do the data mean for monitoring systems as well as the alignment of curriculum
and assessment?
2) Thorough analysis of the data as this is the initial coding procedure. The exhaustive
analysis of the data results in the saturation of the curriculum documents and
interview transcriptions with repetitive codes, which allows one to move faster through
Data Collection
Data Reduction
Data Display
Drawing Conclusions
Figure 5.2 Interactive model of the different components of qualitative data analysis (adapted from Punch, 1995)
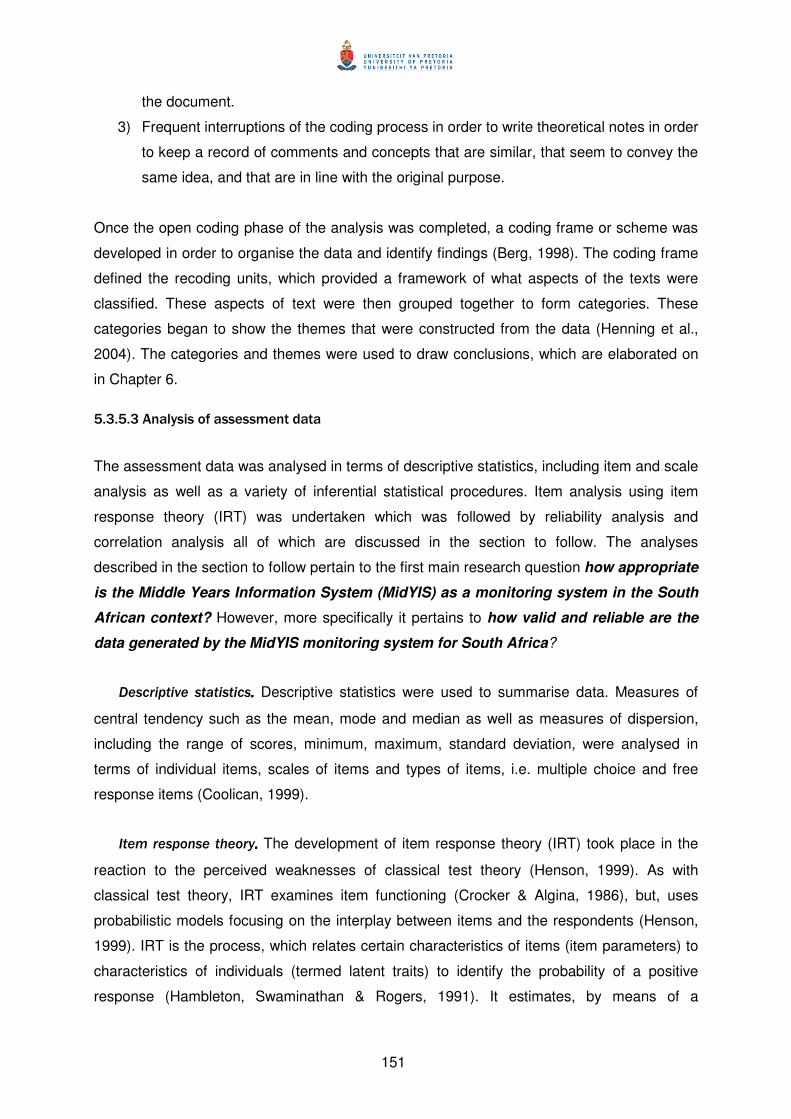
151
the document.
3) Frequent interruptions of the coding process in order to write theoretical notes in order
to keep a record of comments and concepts that are similar, that seem to convey the
same idea, and that are in line with the original purpose.
Once the open coding phase of the analysis was completed, a coding frame or scheme was
developed in order to organise the data and identify findings (Berg, 1998). The coding frame
defined the recoding units, which provided a framework of what aspects of the texts were
classified. These aspects of text were then grouped together to form categories. These
categories began to show the themes that were constructed from the data (Henning et al.,
2004). The categories and themes were used to draw conclusions, which are elaborated on
in Chapter 6.
5.3.5.3 Analysis of assessment data
The assessment data was analysed in terms of descriptive statistics, including item and scale
analysis as well as a variety of inferential statistical procedures. Item analysis using item
response theory (IRT) was undertaken which was followed by reliability analysis and
correlation analysis all of which are discussed in the section to follow. The analyses
described in the section to follow pertain to the first main research question how appropriate
is the Middle Years Information System (MidYIS) as a monitoring system in the South
African context? However, more specifically it pertains to how valid and reliable are the
data generated by the MidYIS monitoring system for South Africa?
Descriptive statistics. . . . Descriptive statistics were used to summarise data. Measures of
central tendency such as the mean, mode and median as well as measures of dispersion,
including the range of scores, minimum, maximum, standard deviation, were analysed in
terms of individual items, scales of items and types of items, i.e. multiple choice and free
response items (Coolican, 1999).
Item response theory. . . . The development of item response theory (IRT) took place in the
reaction to the perceived weaknesses of classical test theory (Henson, 1999). As with
classical test theory, IRT examines item functioning (Crocker & Algina, 1986), but, uses
probabilistic models focusing on the interplay between items and the respondents (Henson,
1999). IRT is the process, which relates certain characteristics of items (item parameters) to
characteristics of individuals (termed latent traits) to identify the probability of a positive
response (Hambleton, Swaminathan & Rogers, 1991). It estimates, by means of a
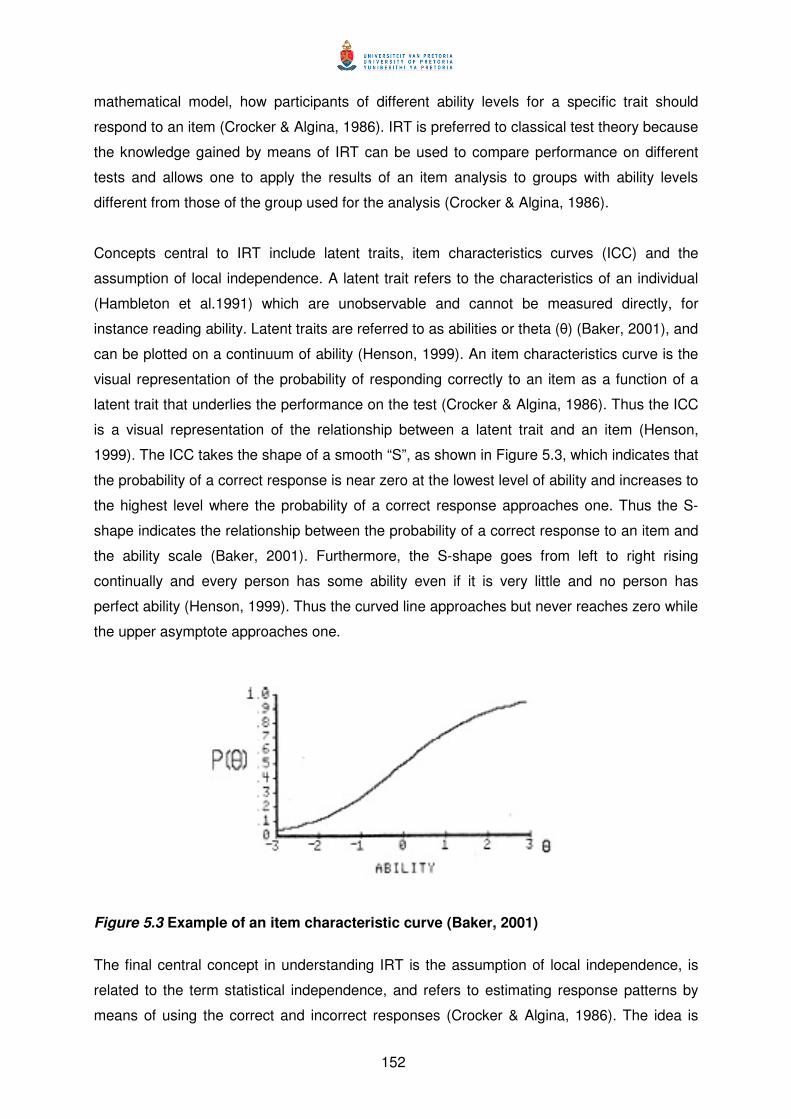
152
mathematical model, how participants of different ability levels for a specific trait should
respond to an item (Crocker & Algina, 1986). IRT is preferred to classical test theory because
the knowledge gained by means of IRT can be used to compare performance on different
tests and allows one to apply the results of an item analysis to groups with ability levels
different from those of the group used for the analysis (Crocker & Algina, 1986).
Concepts central to IRT include latent traits, item characteristics curves (ICC) and the
assumption of local independence. A latent trait refers to the characteristics of an individual
(Hambleton et al.1991) which are unobservable and cannot be measured directly, for
instance reading ability. Latent traits are referred to as abilities or theta (θ) (Baker, 2001), and
can be plotted on a continuum of ability (Henson, 1999). An item characteristics curve is the
visual representation of the probability of responding correctly to an item as a function of a
latent trait that underlies the performance on the test (Crocker & Algina, 1986). Thus the ICC
is a visual representation of the relationship between a latent trait and an item (Henson,
1999). The ICC takes the shape of a smooth “S”, as shown in Figure 5.3, which indicates that
the probability of a correct response is near zero at the lowest level of ability and increases to
the highest level where the probability of a correct response approaches one. Thus the S-
shape indicates the relationship between the probability of a correct response to an item and
the ability scale (Baker, 2001). Furthermore, the S-shape goes from left to right rising
continually and every person has some ability even if it is very little and no person has
perfect ability (Henson, 1999). Thus the curved line approaches but never reaches zero while
the upper asymptote approaches one.
Figure 5.3 Example of an item characteristic curve (Baker, 2001)
The final central concept in understanding IRT is the assumption of local independence, is
related to the term statistical independence, and refers to estimating response patterns by
means of using the correct and incorrect responses (Crocker & Algina, 1986). The idea is
153
that if items are to have statistical properties across samples then the items must be
answered independently of one another. Items should contain no information that could be
used to answer other items (Cantrell, 1997; Henson, 1999). Unidimensionality on the other
hand refers to the statistical dependence of items, which can be accounted for by a single
latent trait (Cantrell, 1997; Crocker & Algina, 1986) or rather that the items represent only
one latent trait or dominant factor (Henson, 1999; McCamey, 2002).
Many approaches or models can be used under the umbrella term of IRT namely, one, two,
three, and four-parameter models including elements of difficulty, discrimination and
guessing (Crocker & Algina, 1986). In this research, Rasch modelling is used (which is a
one-parameter model). The Rasch model not only contributes to inferences made about
construct validity but also indicates how well the item fits within the underlying construct
(Bond & Fox, 2001). Rasch was used as interval measures and are constructed by means of
a stochastic process that creates inferential stability and locates a person on the latent
continuum. This analysis technique is ideal for exploratory data analysis where one wants to
understand the structure of items or identify items functioning well, as in the case of this
research (McCamey, 2002). Furthermore, assessments based on Rasch are item and person
free in that the person’s response is the dependent variable while the independent variables
are the person’s trait score and item difficulty (McCamey, 2002). Rasch enables researchers
to estimate person abilities independently of the sample used and provides statistics that
indicate the precision at which abilities are estimated (Henson, 1999). Items which contribute
to the sub-test are identified and poor items are eliminated. Items which are regarded as poor
are items that do not contribute to the sub-test or possibly measure another construct
contrary to the construct under exploration (Barnard, 2004). This is an essential first step and
forms the building blocks in which the sub-tests are combined into the theoretical scales as
identified by the CEM centre.
The Rasch model uses the parameter “item difficulty” (b). Item difficulty is defined as the
position on a latent trait variable in which a person has a fifty percent probability of a correct
response (McCamey, 2002). The more the participant’s latent trait (θ) exceeds the item
difficulty the more likely it is that a person will answer the item correctly. If the item difficulty
exceeds ability (θ), according to the Rasch model, the participant will not answer the item
correctly (McCamey, 2002).
For the purposes of the analysis, a dichotomous Rasch model was used where 1 denotes a
correct response and 0 an incorrect responses. Missing data were kept and not recoded into
incorrect as a missing value could indicate that the participant never reached the item. It is
154
probable that by allocating an incorrect response in the model, incorrect assumptions could
be made. Furthermore, retaining missing data is not problematic for the WINSTEPS program
(Linacre, 2005). For the purposes of analysis any item which all participants answered
incorrectly or correctly, were removed from the analysis as this does not provide additional
information. After this was done, calibrations were undertaken for both persons and items in
order to place both statistics on the same metric scale (Henson, 1999). The data were
transformed into measures that are linear so that meaningful comparisons could be made.
Logits were used to achieve approximate linearity (Cantrell, 1997).
The mean was used to centre item difficulty estimates at zero, with a standard deviation of 1.
Once the item difficulties were calibrated, the initial person abilities were derived. The real
person and real item separation was evaluated to the estimated standard errors of
measurement that were adjusted for any misfit in the data. In addition, the real person and
real item separation reliabilities were scrutinised (Smith, 2003). The separation reliabilities
are similar to measures of internal consistency in that a value between 0 and 1 is obtained.
The interpretation of the separation reliabilities is the same as when evaluation internal
consistency reliability, in that a higher value is advantageous (Andrich, 1982).
The INFIT and OUTFIT statistics were considered. The INFIT means square (MNSQ) is
associated with the response patterns, and the OUTFIT mean square (MNSQ) is associated
with response patterns that are not expected. Both pick up aberrant response patterns with
the former not as influenced by the outliers as the OUTFIT statistic. The question of fit is
related to discrimination or how well the item discriminates between persons of high and low
ability. Traditionally, high discrimination values are a “desirable characteristic” (Masters,
1988, p. 15). However in Rasch analysis, items with unusually high discriminations are
eliminated from the analysis (Masters, 1988), as this over-discrimination does not provide
any additional information and the fit is considered too good to be true (Andrich, 2006). Both
these statistics have an expected value of 1, values lower than 1 indicate a lack of fit, while
values higher than 1 indicate what is referred to as “noise” (Smith, 2003). For the purposes of
this analysis values of 0.7 to 1.3 for the mean squares were considered adequate (Bond &
Fox, 2001; Barnard, 2004). This is more stringent than the values of 0.5 – 1.5 recommended
by Linacre (2005). The corresponding Z values were also evaluated in order to provide a
complete picture. However, more weight was attached to the mean square (MNSQ)
interpretation as Z-values derived from more than 300 observations tend to be very sensitive
and items which should not misfit tends to misfit (Linacre, 2005). However, they are important
to consider. Items with an absolute Z-value greater than 2.0 were identified. Generally, a Z-
value of greater than 2.0 indicates irregular response patterns across items (lack of
155
unidimensionality) while a Z value of less than -2.0 would indicate possible redundancy which
indicates a violation of local item independence (Schumacker, 2004). Any person or item
misfitting the above criteria was removed from the analysis.
The item number and the logit values were displayed on a continuum (Schumacker, 2004) in
order to evaluate items and odd ratios. The odds in Rasch measurement refers to the
probability of successfully answering an item correctly divided by the probability of answering
the item incorrectly. The natural logarithm of the odds ratio is called natural log-odds, which
in turn are referred to as logits. In terms of items, the item difficulty in logits is the natural log-
odds of failure, where positive values indicate items that are more difficult and negative
values indicate less difficult items. The logit for person measures, on the other hand, are the
natural log-odds of success on items included in the scale or variable. A positive value here
would indicate more ability on the scale, while a negative value indicates less ability on the
scale. If however, both an item and a person share the same logit location on the scale, then
the person has a 50% chance of answering the item correctly (Schumacker, 2004). In this
research, a program called WINSTEPS was used to undertake the analysis.
WINSTEPS as a data analysis tool WINSTEPS was designed for practitioners in the field
who, due to the nature of their job, have to make practical decisions while developing
effective tests and assessments (WINSTEPS, n.d.). WINSTEPS constructs Rasch models by
using participants’ responses to a set of items; these responses could take the form of letters
or integers of varying characters (Linacre, 2005). The advantage of using WINSTEPS is that,
once one has familiarised oneself with the program, it is easy to use in combination with
other programs such as SPSS or EXCEL. Furthermore, one is able to analyse data
stemming from dichotomous, multiple-choice, rating scale or partial credit items as with other
programs such as RUMM and Quest (Bond & Fox, 2001). Another advantage of WINSTEPS
is that, along with other Rasch programs, it handles missing data well (Bond & Fox, 2001). It
was designed specifically for the facilitation of data exploration by providing the researcher
with tools to analyse items and participants in depth. The diagnostic procedures used in
WINSTEPS provide information on outliers, unexpected data points, and multidimensionality
(WINSTEPS, n.d.). WINSTEPS makes use of the joint maximum likelihood estimation
method, which is an unconditional estimation (Schumacker, 2004) unlike RUMM that makes
use of conditional estimations (Bond & Fox, 2001).
WINSTEPS analysis starts with a central estimate for each person measure, item calibration,
and response structure calibration. Furthermore, the output generated by WINSTEPS
consists of graphic representations in the form of graphs, plots, and tables that can be
156
incorporated into reports (Linacre, 2005). The item and person outputs include measures,
standard errors, fit statistics, reports on item/person responses that cause person/item misfit,
as well as DOS files for additional analysis. In addition to complete output files of
observations, residuals and their errors for additional analyses of differential item function
and other residual analyses (WINSTEPS, n.d.).
Limitations of using WINSTEPS as a data analysis tool. The WINSTEPS program was
designed using the Rasch measurement model as a departure point. However, the Rasch
model is a one-parameter model as explained in the beginning of the section. If one wanted
to include additional parameters such as discrimination (i.e. two-parameter model), another
program such as PARSCALE would have to be used. Another limitation is that WINSTEPS
does not permit a Bayesian maximum likelihood estimation method in order to infer logit
values for individuals with extreme scores (Schumacker, 2004). WINSTEPS is however an
ideal program for exploratory purposes, where the aim is to analyse items with the purpose of
developing sound constructs and even though it does not permit Bayesian maximum
likelihood estimation method it does provide diagnostic information on outliers.
Reliability analysis. Reliability analysis was undertaken in order to provide assertions in
response to the specific research question (1.2) how valid and reliable, for South African
schools, are the results of the instrument used in the MidYIS monitoring system on
which feedback is based? Although the analysis is primarily undertaken to investigate the
reliability component of the specific research question, inferences can be made from the
content-related validity of the assessment (Suen, 1990).
Reliability addresses the extent to which the results are free from error (Gronlund, 1998).
Generally, reliability refers to the consistency of scores, which are obtained by the same
individuals when they are requested to complete the assessment on different occasions
(Anastasi & Urbina, 1997). Furthermore, reliability is important, because unless results are
stable one cannot expect the results to be valid. Additionally, consistency of results indicates
smaller measurement errors - and thus is more dependable (Gronlund, 1998). This also
gives an indication of how constant the scores were which were obtained in different
administrations (Owen & Taljaard, 1996).
Internal consistency is a pre-requisite for construct validity, where one would expect a high
item-total correlation since items measuring the same construct contributes to the total score
of a test (Kline, 1993). As the assessment data was recoded into a dichotomous items,
Kuder-Richardson 21 (KR-21) was used, which is a special form of Cronbach’s alpha
157
(Coolican, 1999). KR-21 and Cronbach’s alpha estimate internal consistency by determining
how well all the items on the assessment relate to one another as well as to the total test
(Gay & Airasian, 2003). Reliabilities for assessment data should be high, preferably around
0.9 but should never drop below 0.7 (Kline, 1993).
Apart from overall reliability coefficients, the standard error of measurement was calculated.
The standard error of measurement is a useful way of expressing test reliability as it gives an
indication of the amount of error allowed for interpreting individual results (Thorndike, 1997).
The standard error of measurement is an index of instability of performance on the
assessment using the reliability to estimate how much an individual score might change from
one testing to another (Thorndike, 1997).
Internal consistency reliability is not recommended in assessments where speed is a factor,
as the results may be artificially inflated (Frisbie, 1988). The decision to make use of internal
consistency in this research instead of using another method to estimate the reliability was
based on the fact that it is the method preferred by CEM and the assessment is not a pure
speeded test but rather a combination of a speed test and a power test. Time allocations
were adjusted so that the majority of learners would be able to attempt the majority of the
items if not all the items.
Correlation analysis. The aim of the correlation analysis was to establish whether a
relationship existed between the ability assessment and academic achievement in
specifically language and mathematics, i.e. whether the ability assessment could be used to
predict future achievement. The analysis pertained to the specific research question (1.2)
how valid and reliable are the data generated by the MidYIS monitoring system for
South Africa. More specifically the sub-research question is focused on, namely to what
extent does the data predict future performance? Thus predictive validity was
investigated by means of correlation analysis where a correlation (r) is the measure of
association between two variables (Blaikie, 2003). As the variables used in this analysis are
continuous in nature, Pearson product moment correlation was used, which measures the
extent to which a variable covaries with another or rather the degree to which variables are
related (Yaffee, 2003).
The correlation coefficient has direction, as it can be positive or negative, has magnitude as it
can be large or small and is interpreted in terms of statistical significance (Yaffee, 2003). For
this research, a positive correlation of 0.3 or 0.4 was considered sufficient for the ability-
academic relationship (Kline, 1993). While the language and mathematics achievement
158
obtained from the participating schools are used it is acknowledged that the correlation
analysis is an indicator of possible predictive validity. However, will only be relevant to the
school and class used in the analysis due to possible variations in composition of marks,
different educators and assessments were involved.
Generally, large correlation coefficients are obtained when the characteristics of the
assessments correlated are alike, the spread of scores is large, and the scores are stable
(Linn & Gronlund, 2000). A 1.00 refers to a perfect correlation. However, in practice, this
seldom happens.
5.3.5.4 Analysis of contextual data
The analysis described in the section to follow pertains to the first main research question
how appropriate is the Middle Years Information System (MidYIS) as a monitoring
system in the South African context, with specific reference to reliability issues. However,
the analysis also forms the basis for the second main research question of which factors
could have an effect on learner performance and therefore inform the design of the
monitoring system. The questionnaire data was analysed in terms of descriptive statistics
as well as a variety of inferential statistical procedures. Reliability analysis was undertaken.
The procedures are briefly discussed below.
Descriptive statistics. Measures of central tendency such as the mean, mode, and median
as well as measure of dispersion, including the range of scores, minimum, maximum,
standard deviation, were analysed in terms of individual items as well as for scales of items
(Coolican, 1999). The object of this exercise is to summarise and describe the data in order
to make the reporting process easier.
Reliability analysis. Reliability analysis allows the researcher to study the properties of
measurement scales in terms of relationships between individual items and the scale as a
whole (SPSS, 2001) and individual items giving an indication of the stability over time and
internal consistency of items. Problematic items can easily be identified. These items were
omitted not only for the analysis but also from future versions of the questionnaires. Internal
consistency is a pre-requisite for construct validity, where one would expect a high item-total
correlation since items measuring the same construct contribute to the total score of a test
(Kline, 1993). Internal consistency is measured by Cronbach’s coefficient alpha when the
score is not dichotomous and it reflects how well the different items complement each other
in their measurement of different aspects of the same variable (Litwin, 1995).
159
The closer the alpha is to one, the greater the internal consistency of the items in the
questionnaire being assessed (George & Mallery, 2001). According to Kline (1993),
reliabilities should ideally be high for assessments, around 0.9 but should never drop below
0.7 (Kline, 2003). However, for questionnaire data DeVillis (1991) states that, the minimally
acceptable reliability is between 0.65 and 0.7, although a coefficient as low as 0.5 was
acceptable for exploration of the data (Howie, 2002).
5.3.5.5 Building an exploratory model using assessment and contextual data
The sections to follow pertain to the second main research question guiding this study
namely which factors could have an effect on learner performance and therefore
inform the design of the monitoring system. Often in research processes at a higher level
of analysis influence processes at a lower-level (Luke, 2004). Multilevel analysis is used for
the analysis of complex data (Snijders & Bosker, 1999) such as data with hierarchical or
nested structures (learners in classes, classes in schools for example) with the aim of
explaining variability in a dependent variable(s) through a set of independent variables (Heck
& Thomas, 2000). In the words of Snijders and Bosker (1993, p. 237):
Hierarchical linear models incorporating both random and fixed effects provide a useful
statistical paradigm for situations where nesting is an obvious and direct consequence
of multistage sampling as well as situations with nested sources of variability.
Important concepts in multilevel analysis include intra-class correlations, random and fixed
coefficients. The first concept intra-class correlation refers to the degree of dependence of
individuals. At the core of the concept is the view that the more individuals share common
experiences the more similar they are or rather the more homogeneous the groups are (Kreft
& de Leeuw, 1998). The intra-class correlation is equal to the estimated proportion of group
level variance as compared to total variance (Hox, 1995). Random and fixed coefficients
refer to different sections or parameters of the multilevel equation. Random coefficients are
values assumed to be distributed as a probability function or the residual error terms. Fixed
coefficients are the intercept and slope, which are estimated from data. Other important
concepts include cross-level interactions, and estimation methods. In multilevel modelling,
cross-level interactions refer to interactions between variables at different levels of the data
structure (Kreft & de Leeuw, 1998). Finally, estimation methods refer to the techniques used
to estimate parameters.
160
When investigating the effect of factors on performance, literature suggests that some form
of regression analysis be undertaken (Newton & Rudestam, 1999). In school effectiveness
research, multilevel analysis is undertaken to investigate which factors are associated with
performance of learners (Riddell, 1997; Sammons, 1999; Scheerens, 1990, 2001a;
Scheerens & Bosker, 1997). Multilevel analysis is specifically suitable for this purpose
because of the nested structure of data collected in education where learners are nested in
classes that are nested in schools, as described in Chapter 3. When identifying factors that
influence performance, the nested structure that is present cannot be ignored because
inferences may be skewed. Multilevel analysis was therefore used in order to ascertain which
factors, identified from literature and correlating with achievement, affect learner performance
on the assessment. Multilevel analysis allows for the identification of factors on the different
levels and makes it possible to determine to what extent these factors affected the outcome
of the assessment (Hox, 1995). As the research is exploratory in nature, the ideal would be
to explore direct, indirect and interaction effects where possible. A prerequisite is to have
information on three levels at least (Scheerens, 1997). Thus the research attempted to build
a model using three levels, namely school, classroom, and learner-level.
Sampling considerations. Generally when undertaking multilevel analysis, the larger the
sample the smaller the effect size and greater the power of the analysis (Snijders & Bosker,
1999). Literature on multilevel analysis has tended to focus on estimation and interpretation
and not necessarily on sample design questions (Cohen, 1998). As the use of multilevel
analysis increases, however, and the approach is used in a variety of contexts, issues of
sampling do become important. Cohen (1998) is of the opinion that where it is important to
estimate the variance components one must sample more learners and fewer schools.
Furthermore, Maas and Hox (2004) state that if one is only interested in the fixed effects of
the model as few as ten groups can lead to good estimates. According to Snijders and
Bosker (1993) the optimality of sample sizes in a design means that minimal standard errors
for the parameters of interest are calculated and if the sample size for either the macro or
micro level is smaller than 10, the resulting standard errors should not be trusted. Snijders
and Bosker suggest that the sample should be greater than 10. Conversely, Maas and Hox
(2002) state that ten groups are too few, but if one is only interested in fixed regression
coefficients, as few as ten seem reasonable. But they advise one to use bootstrapping or a
simulation-based method to assess sampling variability (Maas & Hox, 2004). Mok (1995) is
of the opinion that more schools and fewer learners per school are required in order to
minimize bias. From the discussion above it is apparent that sample size has to be evaluated
not only in terms of the power of the statistical test but also in terms of the effect that the
variance component of the model has on the estimates (Hox, 1998) The sample sizes of the
161
three levels were therefore evaluated (10 on the school-level, 36 on the classroom-level and
794 on the learner-level).
Approach to model building. This research is exploratory in nature and therefore a specific
model was not specified in the beginning. Rather, the analysis started with the most basic
model, which is the intercept-only model, and parameters were systematically included. The
most basic model is specified by:
Yijk= γ000 + v0k + u0jk+ eijk
Where (Hox, 2002):
Yijk = dependent variable, in this case the results on the assessment
γ00 = intercept or regression coefficients
v0k = residual error at the highest level
u0jk = residual error at the second-level
eijk = residual error at the lower-level
This model does not include any explanatory variables. It estimates the intra-class correlation
and provides a measure of the degree of misfit in the model (Hox, 1995; 2002). The model is
built by adding the first-level or lower-level explanatory variables so that the contribution of
each explanatory variable could be assessed. The lower-level explanatory variables are the
learner-level variables of age, gender, learner attitudes (in terms of school, language and
mathematics classes) and motivation to achieve (language and mathematics classes,
pressure from parents and peers, future aspirations). This was followed by the analysis of the
slope of the explanatory variables in order to evaluate whether there was a significant
variance component between the groups.
The second-level explanatory variables were added, making it possible to examine whether
these variables explained between-group-variation in the dependent variable (Hox, 1995;
2002; Luke, 2004). The second-level explanatory variables refer to educator variables such
as gender, age, experience, qualifications, educator attitude towards achievement, quality of
instruction, instructional method, and opportunities to learn. The third-level explanatory
variables were added, making it possible to examine whether these variables explained
between-group-variation in the dependent variable (Hox, 1995; 2002; Luke, 2004). The third-
level of explanatory variables included type of school and school attitude to achievement.
162
Finally, the cross-level interactions between explanatory group level variables and the
individual level explanatory variables were added (Hox, 1995; 2002; Luke, 2004). After each
step, additional parameters were added. The results were inspected to see whether the
parameters were significant and to examine the residual error left (Hox, 1995) until a final
model was constructed including cross-level interactions, explanatory group level variables
and individual level explanatory variables as given by:
Yijk =γ000 + γp0Xpijk + γ0qWqjk + γ0rZrk + γpqrZrkWqjkXpijk + upjkXpijk + v0k + u0jk+ eijk
Where:
γp0Xpijk = lower explanatory variables
Subscript p = explanatory variables at the lower-level
upjkXpijk = variance of slopes of the explanatory variables
γ0qWqjk = second-level explanatory variables
Subscript q = explanatory variables at the second-level
γ0rZrk = third-level explanatory variables
Subscript r = explanatory variables at the third-level
γpqrWrkZqjkXpijk = cross-level interaction term
To conclude, in each of the steps indicated above a decision was taken on which regression
coefficients to include based on significance tests, the change in deviance and change in
variance components (Hox, 1995).
MLwiN as data analysis tool. . . . MLwiN version 2.02 was used in this analysis as opposed to
HLM (Hierarchical Linear Models). The Centre for Multilevel Modelling, in the United Kingdom
at the University of Bristol, developed MLwiN. HLM was developed by Scientific Software
International (SSI) based in Lincolnwood, Illinois in the United States of America. Features of
HLM are useful. Easy-to-use features include multinomial and ordinal models for two-level
data, multivariate models for incomplete data, latent variable analysis, and log-linear model
for heterogeneous level 1 variance. However, HLM has some restrictions with regards to
data preparation in the database files, which are not present in MLwiN. HLM also does not
have any facility to carry out data manipulation. Users have to resort to other software to
prepare data for the format required by HLM and then import it into the program. Data input is
therefore difficult (Yang, 2006).
163
MLwiN provides researchers with a system that meets the demands of specification and
analysis of multilevel models because of its following characteristics (Hox, 1995; (Rasbash,
Browne, Goldstein, Yang, Plewis, Healy, Woodhouse, Draper, Lanford & Lewis, 2001) :
� The program has a graphic user interface for specifying and fitting models. Additional
features include plotting, diagnostic and data manipulation facilities, and a user-
friendly help system.
� It includes a spreadsheet with columns denoting variables, frequency data, or
parameter estimates while the rows denoting the lowest level units in the hierarchy
used to structure data.
� The software allows researchers to analyse data with arbitrary levels and to use FLM
estimation as well as RLM estimation.
� MLwiN allows all regression coefficients to be random at all levels. It is therefore able
to analyse non-standard as well as standard multilevel models.
� MLwiN allows for the repetition of computations and for the use of residuals from one
analysis as an input in another model.
� It is very interactive in nature and provides researchers with control over
computations, making it easy to try out different sub-sets of variables and error
structures.
However, as with many programs used for statistical analysis, MLwiN does not handle
missing data well. Before importing data into MLwiN missing values were replaced with
plausible alternatives such as the mean, median or mode depending on the type of variable.
If the number of missing values was more than 5%, dummy variables were used (Luyten,
personal communication, November, 2005).
5.3.6 Research procedures
The initial design was refined in terms of the resources such as time, personnel, and
finances. This took place in 2003 and 2004. Initial adaptations of the assessments started in
2004. This comprised format changes, as the assessment used by CEM is electronically
marked and therefore set out in order to facilitate this process. The sample was drawn in late
2003. It consisted of several schools in the Pretoria area. The Gauteng provincial
government was contacted in 2004 to obtain permission to undertake the study and
permission was granted. Three schools were contacted in early 2004 to participate in a pre-
pilot. Principals were contacted telephonically to describe the project. In addition consent
forms were sent to principals and the parents of the learners participating in the study.
National Department of Education officials as well as Provincial Department of Education
164
officials were contacted telephonically and follow-up emails were sent. The pre-pilot took
place in Mid-2004. The process of instrument development and adaptation took place in early
2005, which included sending the instruments to specialist and adapting the instruments
accordingly. Principal and educator questionnaires were developed from a review of literature
as well as already developed questionnaires towards the end of 2004 while the interview
schedule for the national department officials and questionnaire for provincial department
officials were developed in early 2005. Data collection took place from May 2005 to July
2005. The National Department of Education interviews took place during May 2005, while
the Provincial Department of Education questionnaires were emailed in May 2005. The
follow-up interview took place during June 2005. School-level data collection took place
during May 2005 and June 2005. The instruments were coded and captured during June
2005 and July 2005. Finally, the results were written up and reports compiled for schools
during August 2005 (refer to Appendix H for a diagrammatic representation of the procedures
followed).
5.4 Ethical issues
Two aspects, regarding ethical issues are discussed for this research. Firstly, the ethics
requirements as prescribed by the Faculty of Education of the University of Pretoria and
secondly the researcher’s integrity. Before the research could take place, permission had to
be sought from the Faculty of Education in terms of the ethical considerations of the research
project. The Faculty was satisfied with the procedures suggested and granted permission to
continue with the research.
In terms of professional integrity, it was important to be transparent about the research. The
Gauteng Department of Education as well as schools were contacted in order to obtain
informed consent (refer to Appendix I for the letters to the participants). In addition, parents of
every learner were sent a letter explaining the project and asking them to grant permission
for their child to participate. The research was also explained to the learners who were
selected to participate. The project was placed in context, namely that the project was
undertaken in collaboration with the CEM centre at the University of Durham. Furthermore,
schools and educators were approached and asked if they would be willing to participate by
completing a background questionnaire. Confidentiality was promised to parents, learners,
educators and schools as well as National and Provincial Department of Education officials.
Furthermore, participants could withdraw at any time.
165
5.5 Methodological constraints
In this chapter, the research design and methodology was elaborated on in detail. The
research is situated within a pragmatic paradigm and makes use of mixed methods. Several
constraints were observed during the course of the research:
� The sample sizes on classroom-level as well as school-level were rather small. This
resulted in a situation where certain analyses, for instance reliability analyses, could
not be performed due to minimum sampling requirements that were not met. Small
sample sizes also influenced the multilevel analyses (refer to sampling considerations
under 5.3.3.5).
� The sample included on urban and peri-urban schools from one province. Thus
schools from rural areas and schools from other provinces were not included.
� Schools from only one province were included for study. Although steps were taken to
ensure a maximum variation sample, the results still reflect an urban/peri-urban
setting and therefore do not transfer to the more rural areas. This is seen as a
constraint as a large percentage of South African schools are situated in rural areas.
As this research was exploratory in nature this constraint may however be an artificial
one seeing that the aim was to investigate the feasibility of using MidYIS in the South
African context.
� The measure used for academic achievement was provided by the schools. Therefore
the inferences made in terms of predictive validity can only be investigated per class
or teacher and are relevant only to specific schools and specific educators, as was
discussed earlier in this chapter.
5.6 Conclusion
In this chapter, the information pertaining to the research design and methodology followed in
this research was detailed. The intention of the current research was to investigate the
feasibility of adapting an already existing and well-functioning monitoring system to the South
African context. In order to accomplish the aims of the research, the research was grounded
in the pragmatic paradigm. The use of pragmatism as a grounding paradigm was explored
and justified. Pragmatism makes use of qualitative and quantitative methods of inquiry, which
is called a mixed method approach, where the research question drives decisions about
which method to use. A case was made for the appropriateness of mixed methods as well as
a concurrent nested strategy approach, where such an approach implies that there is a
dominant method that guides the research. The dominant method of this research is
quantitative while the qualitative component is given a lesser priority though nested within the
166
quantitative approach. The qualitative approach can be said to be nested or embedded
because it addresses a different question to the quantitative approach while also seeking
information from a different level.
The reader was also provided with a description of the sample included in the research,
which comprised National Department of Education officials, Provincial Department of
Education officials, specialists in key areas, schools, principals, educators and learners.
Several instruments were used to collect data, ranging from semi-structured interview
schedules to assessments and questionnaires. As with any instrument used for research
purposes, issues of validity are of utmost importance, even more so in this research because
the feasibility of adapting an already existing monitoring system was being explored. Validity
issues pertaining to content-related validity, curricular validity, construct-related validity and
criterion-related validity were discussed. Also described were the validation strategies
employed for both the qualitative and quantitative component, including expert opinion, test-
curriculum overlap, and triangulation.
Various data collection strategies as well as data analysis strategies were discussed. The
data analyses included thematic content analysis, descriptive statistics, item response
theory, reliability analysis, correlation analysis, and multilevel analysis. These discussions
included an elaboration of what the analysis entails, steps undertaken and statistical
considerations that were taken into account. The results of which can be found in Chapters 6,
7 and 8. Lastly, the chapter also included a discussion on the ethical considerations as well
as the methodological constraints.
167
CHAPTER 6CHAPTER 6CHAPTER 6CHAPTER 6
THE CONTENTTHE CONTENTTHE CONTENTTHE CONTENT––––RELATED VALIDITY OF THE MIDYRELATED VALIDITY OF THE MIDYRELATED VALIDITY OF THE MIDYRELATED VALIDITY OF THE MIDYIS IS IS IS ASSESSMENTASSESSMENTASSESSMENTASSESSMENT
The main aim of the current research is to investigate the
feasibility of implementing the MidYIS monitoring system
developed in the United Kingdom in the context of South Africa.
The discussion in this chapter relates to the specific research
question of how valid and reliable are the data generated by
the MidYIS monitoring system for South Africa? As
discussed in Chapters 3, 4 and 5, validity is a unitary concept
but comprises several facets namely content-related validity,
predictive validity and construct-related validity. The present
chapter describes the outcome of the content-related
investigation of the assessment instrument, not only in terms of
the South African curriculum but in the field of abilities
assessments as well.
6.1 Introduction
This chapter represents the first of the results chapters and elaborates on the outcome of
validation strategies relating to the first main research question how appropriate is the
Middle Years Information System (MidYIS) as a monitoring system in the South African
context? More specifically the chapter addresses the specific research question 1.2 (as
described in Chapter 5) how valid and reliable are the data generated by the MidYIS
monitoring system for South Africa? The focus of this chapter is on the validity of MidYIS
in terms of content-related validity while the findings for construct validity, predictive validity,
and reliability analysis are presented in Chapter 7.
In Chapters 3, 4 and 5 issues pertaining to the first main research question and the specific
research questions were discussed in terms of the criteria for evaluating the quality of
measurements and how the research project is designed in order to make inferences related
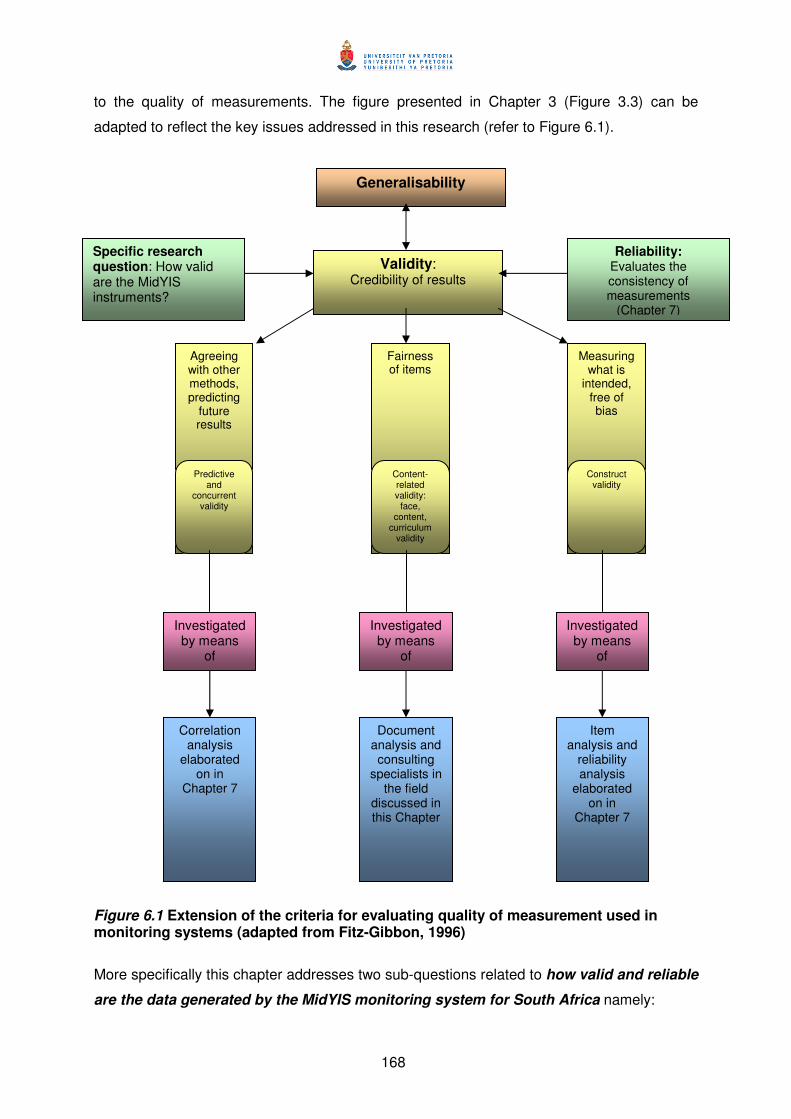
168
to the quality of measurements. The figure presented in Chapter 3 (Figure 3.3) can be
adapted to reflect the key issues addressed in this research (refer to Figure 6.1).
Figure 6.1 Extension of the criteria for evaluating quality of measurement used in monitoring systems (adapted from Fitz-Gibbon, 1996)
More specifically this chapter addresses two sub-questions related to how valid and reliable
are the data generated by the MidYIS monitoring system for South Africa namely:
Generalisability
Validity: Credibility of results
Agreeing with other methods, predicting
future results
Fairness of items
Measuring what is
intended, free of bias
Predictive and
concurrent validity
Content-related validity:
face, content,
curriculum validity
Construct validity
Specific research question: How valid are the MidYIS instruments?
Investigated by means
of
Correlation analysis
elaborated on in
Chapter 7
Document analysis and consulting
specialists in the field
discussed in this Chapter
Item analysis and
reliability analysis
elaborated on in
Chapter 7
Investigated by means
of
Investigated by means
of
Reliability: Evaluates the consistency of measurements
(Chapter 7)
169
1.2.2 To what extent are the skills tested by MidYIS valid for the South African
curriculum?
1.2.3 To what extent are the items in MidYIS in agreement with the domain of ability
testing and applicable for South Africa?
The discussion in this chapter also relates to the third specific research question (question
1.3 as described in Chapter 5) which is what adaptations are needed to transform MidYIS
into SASSIS, a monitoring system for the South African context? The proposed
adaptations, which were discussed in Chapter 4 (Section 4.6) and Chapter 5, present the first
step in the transformation from the Middle Years Information System (MidYIS) to the South
African Secondary School Information System (SASSIS). The adaptations addressed in this
chapter are included in the sub-questions identified:
1.3.1 To what extent are the administration procedures appropriate and if not, how
can these be adjusted?
1.3.2 To what extent is the content in MidYIS appropriate for second language
learners?
1.3.3 To what extent is the format of the assessment appropriate and if not, how can
it be changed?
1.3.4 To what extent are the time allocations appropriate and if not, what adjustments
are needed?
The second section (6.2) of the Chapter addresses the sub-question (1.2.2) to what extent
are the skills tested by MidYIS valid for the South African curriculum, which is related to
the curriculum validity of the assessment. This section is divided into four sub-sections.
Background information drawing from the interviews undertaken with the National
Department of Education officials and questionnaires completed by the Provincial
Department of Education officials is provided in 6.2.1. The language learning area drawing
on the curriculum documents and evaluations from language specialists is elaborated on in
6.2.2. The mathematics learning area is described in 6.2.3 drawing from information in the
curriculum documents and the mathematics specialist. What adaptations are needed to
transform MidYIS into SASSIS, a monitoring system for the South African context is
explored in 6.2.4, by means of integrating the findings from 6.2.1, 6.2.2, and 6.2.3. Content-
validity from a psychometric perspective is explored in 6.3, and addresses the sub-question
(1.2.3) to what extent are the items in MidYIS in agreement with the domain of ability
testing and applicable for South Africa. The chapter concludes with Section 6.4 in which
inferences are drawn based on the three sub-questions concerning the content-related
validity of the MidYIS assessment addressed in this chapter.
170
6.2 Exploring the curriculum validity of the MidYIS assessment
In Chapter 5 issues relating to the validity of the MidYIS assessment were elaborated upon.
Content-related validity was described from two perspectives namely from a curriculum and a
psychological perspective. Section 6.2 elaborates on the curriculum perspective from an
intended curriculum perspective (see Chapter 5).
Policy is neither static nor does it occur in a vacuum. Instead, it is constantly
subjected to various influences that impact upon it…As policy evolves towards
practical application, distortions and obstacles to its successful execution become
apparent (Mahomed, 2001, p. 105).
South Africa has undergone extensive policy changes in education since 1994. The issue of
policy in terms of monitoring education and the curriculum has at times been difficult to
navigate as was described at the end of Chapter 1. However, the aims and objectives of the
curriculum as set out in the curriculum policy documents do have an inherent logic. For
example, the aim of the South African intended curriculum, i.e. the vision or philosophy
underlying the curriculum as expressed in curriculum policy documents (Travers & Westbury,
1989; Van den Akker, 2003), is to provide learners with generic skills and knowledge which
can be applied to different contexts (Gultig, 2003). The need for a combination of skills and
knowledge can be ascribed to the ever changing world of work where “greater skills are
required” (Mohamed, 2001, p. 125) as a result of technological advances and globalisation
(Kraak, 1998). Essentially the concepts of skills and curriculum are important. The
connection between skills and curriculum is related to the sub-question (1.2.2) to what
extent are the skills tested by MidYIS valid for the South African curriculum.
Mahomed (2001, p. 133) states that the government adopted an outcomes-based education
system because of its promise to “integrate content, skills and outcomes”, however, he goes
on to say that a “major cause of poor quality education in South Africa can be attributed to
the pedagogical approach of education institutions especially curricular content and
processes”. The aim of this section is to provide an analysis of the extent to which the
generic or basic skills tested in the MidYIS assessment are present in the curriculum.
However, before presenting the results of the language and mathematics curriculum
document analyses and evaluations from experts in the language and mathematics learning
areas, background information from the National and Provincial Departments of Education is
provided.

171
6.2.1 Perspectives from National and Provincial Departments of Education
The aim of the interviews with the National Department of Education was to elicit views
pertaining to curriculum, assessment, and monitoring of learning. Although the current
research is on a small scale, the ultimate aim is to have a monitoring system that could be
implemented nationally. As a result, it was important to understand what would be acceptable
for and what would be endorsed by the National Department of Education. For example
would the Department promote a Tylerian approach in which the focus is on defined
outcomes (du Toit & du Toit, 2003) and in which the quality of the curriculum is monitored by
means of collecting data relating specifically to the outcomes (Burks, 1998). Alternatively,
would the Department be in favour of a more holistic approach as advocated by Stake (1967)
in which background information of learners, educators and schools, interactions between
the school and community, educator and learner as well as outcomes are considered
(Stufflebeam & Shinkfield, 1984).
Two interviews were undertaken with officials in key positions in the Department, a Chief
Director, and Director. Although the sentiments expressed during the interviews were very
similar in nature, one of the interviewees was particularly articulate; as a result many of the
quotations included in the discussion to follow are taken from that interview (refer to
Appendix E for the audit trail documents).
From the interviews (see below) emerge a suggestion that a more holistic approach to
monitoring would be preferred. This is perhaps not surprising as the Systemic Evaluation
Framework (National Department of Education, 2003a) draws heavily on an input-process-
outcome model in which background information on learner, educator, and school-level is a
key aspect. Furthermore, the Whole School Evaluation model implemented by the
Department of Education is meant to be comprehensive by including information collected
from all levels within the school, from management to classroom observations and learner
performance. As illustrated below, the issue of quality is of importance and learner
performance may be used as an indicator to determine the quality of education:
…learner performance … can [be] used as indicator for quality or
determining quality of the system (Interviewee 2, personal
communication, June, 2005).

172
I think we need to move beyond assessment you know especially
learner assessment as the only tool of monitoring
performance…[rather] a system that will operate at all levels of
education, all levels starting from the classroom (Interviewee 2,
personal communication, June, 2005).
What emerges from the interview is the idea that whichever monitoring system is used, it
needs to be multilayered, and able to provide information at a number of levels namely
school, district, province, and national. With this in mind perhaps a similar model to those
used in the Quality Learning Project (QLP), the Integrated Education Project and the
Khanyisa Education Support Programme could be adapted, a system including both the
district and provincial level. The school improvement models that are used in these projects
adopt a more systemic approach (Taylor & Prinsloo, 2005, p. 7):
…schools and teachers respond best when support is accompanied by
accountability demands, and that capacity therefore needs to be built at district,
school and classroom levels so as to strengthen systems for both monitoring and
supporting learning.
Another important consideration is the types of schools across the country. The monitoring
system would have to be valid for the variety and diversity of school contexts. In Chapter 1
background information on education in South Africa was given. In one province there could
be schools ranging from those with adequate facilities, trained teaching staff, and efficient
management to those with less than adequate facilities, teaching staff who are barely
qualified and no management to speak of. Thus a monitoring system would have to be
applicable to the whole spectrum of contexts. This need was expressed as follows:
A system that needs to talk to different contexts in our country
(Interviewee 2, personal communication, June, 2005).
The implications for the current research are that if the MidYIS is to be accepted on a
national-level, it should include in its framework a number of levels, namely classroom,
school and provincial-levels, and be appropriate in a variety of contexts, taking into account
the diversity of resources and people. Thus an approach in line with that of Stake (1967),
mentioned earlier in the section, may be more appropriate in that background information on
learner, classroom, school and provincial-level must be considered in conjunction with
outcome or performance of learners. Apart from the monitoring system having to be
173
applicable to different contexts, it should also make use of assessment practices that are in
line with the continuous assessment model advocated by the Department of Education.
Different ways of collecting evidence are encouraged and
assessment, which is linked to outcomes within the curriculum
(Interviewee 1, personal communication, June, 2005).
Assessment should be used formatively.... If you even ask the
teacher, what do you do with the results of the assessment? Nothing I
just record them and that’s it (Interviewee 1, personal communication,
June, 2005).
What was important for the research was the reiteration of the importance of skills in
conjunction with knowledge or, as referred to here, as content. This emphasis is perhaps not
surprising as it is rooted in the philosophy underpinning education documents, namely a
competency-based approach to education (Kraak, 1998).
I think there needs to be a relationship between what is taught and
what is assessed. But this relationship goes beyond the content. It
has to also focus on …skills … content … the two definitely need to
go together (Interviewee 2, personal communication, June, 2005)
You need to understand that there is a relationship between the
teaching process and the assessment process (Interviewee 1,
personal communication, June, 2005).
Judging from the interviews as illustrated in the quotations above, there is the tendency by
the interviewees to delineate between what is taught and what is assessed. It appears that
even though the interviewees refer to the relationship between assessment and the
curriculum, they tend to separate the two without reflecting upon how assessment is
embedded in the curriculum. In terms of conceptualisation, curriculum and assessment have
traditionally been kept separate, but increasingly there is a specific focus on assessment of
learning to assessment for learning (Gardner, 2006). In addition, the skills component of the
curriculum is also kept as a separate issue, not embedded in the curriculum, but rather
something additional to the curriculum. Kraak (1998) has suggested from a competency-
based perspective that the integration of curriculum and skills is essential.

174
The assessment used must be aligned with the curriculum. This presented some challenges
for this PhD research. Firstly, because the assessment used in the monitoring system being
explored in this study was not designed as a curriculum-based measurement but rather as a
developed abilities assessment. Secondly because the extent in which the skills being tested,
although present in the curriculum (see 6.2.2. and 6.2.3), has to be ascertained. However, in
any assessment used in a research project the challenge is always to provide for sufficient
curriculum coverage while also considering practicalities such as time and length of the
assessment. The discussion on MidYIS and curriculum overlap is elaborated on further in
6.2.2 and 6.2.3.
While it would appear that the National Department officials might accept the use of already
developed assessments, as long as the assessment is clearly aligned with the curriculum,
the three Provincial Education officials who completed the questionnaire (see Chapter 5)
were not in favour of using already developed assessments or assessments that were not
developed by the educator him/herself. The official who works for the Gauteng Department of
Education Office for Standard in Education (OFSTED) was contacted telephonically to clarify
some issues that emerged from the questionnaire he completed. When asked why he was
not in favour of developed assessment, the respondent indicated that continuous
assessment practices are new. Furthermore, the respondent revealed that he had not seen
assessments that were closely related to the curriculum, as the curriculum was open to
interpretation and customisation by schools. If however, the school had a programme or
curriculum in place and the assessment was related to the programme he felt that then it
might work. The OFSTED official also indicated that it might be good to have a standardised
assessment in place, as some schools might want to have a benchmark from which to
evaluate their performance, specifically against similar schools, as well as against
international standards.
The statements from the OFSTED official reinforce the idea, which emerged from the
interviews with the National Department officials, that the assessment should be curriculum-
based. Therefore, if a monitoring system is to be acceptable to government, the tools used in
the monitoring system should be valid for the school’s curriculum and if learner progress is to
be followed, the assessment should take place at intervals. This could be related to the
curriculum-based measurement.
Curriculum-based measurement is a standardised measurement system in which key areas
of the curriculum are identified and monitored in order to ascertain whether learners have
reached a level of mastery in relation to the identified level within the curriculum (Fuchs &
175
Fuchs, 1991). Curriculum-based measurement systems are primarily used in special needs
education but also used in mainstream education where basic skill areas such as vocabulary,
reading, and mathematics are the focus (Espin, Shin & Busch, 2005). The point that Espin et
al. (2005, p. 353) make is that “one of the most difficult components of education is the
measurement of change. By measuring change in performance, teachers can reliably
evaluate student learning and the effects of instructional interventions on that learning”.
Change in the context of the quotation refers to progress being made based on assessment
results before and after interventions in instructions. The point here is that if the MidYIS
monitoring system is to be used by schools to measure change, then the assessment should
provide guidance as to what instructional interventions are needed. However, the
assessment cannot provide the necessary guidance if the skills assessed cannot be linked to
the curriculum, which is taught.
In an attempt to ascertain whether the skills assessed in the MidYIS (refer to column 1 of
Table 6.1) are present in the intended curriculum, the Provincial Department of Education
officials were asked to indicate whether the skills were indeed present. The results are
depicted in Table 6.1. The list of skills was compiled based on the skills that are assessed in
the MidYIS instrument (while the question of whether the skills mentioned in the curriculum
are sufficiently covered by MidYIS is addressed in 6.2.2 and 6.2.3). The results indicate that
the skills present in the instrument were present in the curriculum and that many of the skills
were introduced to learners during primary school and therefore could be considered basic
skills underpinning the secondary school curricula such as number sense in mathematics.
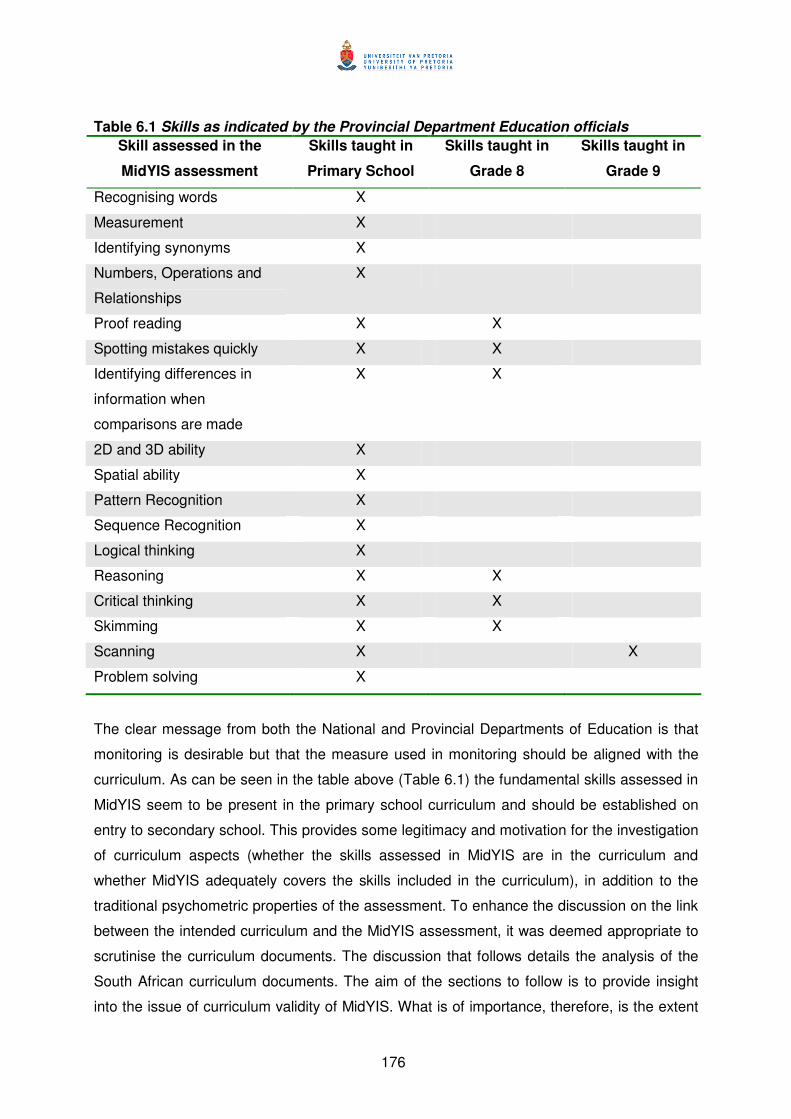
176
Table 6.1 Skills as indicated by the Provincial Department Education officials
Skill assessed in the
MidYIS assessment
Skills taught in
Primary School
Skills taught in
Grade 8
Skills taught in
Grade 9
Recognising words X
Measurement X
Identifying synonyms X
Numbers, Operations and
Relationships
X
Proof reading X X
Spotting mistakes quickly X X
Identifying differences in
information when
comparisons are made
X X
2D and 3D ability X
Spatial ability X
Pattern Recognition X
Sequence Recognition X
Logical thinking X
Reasoning X X
Critical thinking X X
Skimming X X
Scanning X X
Problem solving X
The clear message from both the National and Provincial Departments of Education is that
monitoring is desirable but that the measure used in monitoring should be aligned with the
curriculum. As can be seen in the table above (Table 6.1) the fundamental skills assessed in
MidYIS seem to be present in the primary school curriculum and should be established on
entry to secondary school. This provides some legitimacy and motivation for the investigation
of curriculum aspects (whether the skills assessed in MidYIS are in the curriculum and
whether MidYIS adequately covers the skills included in the curriculum), in addition to the
traditional psychometric properties of the assessment. To enhance the discussion on the link
between the intended curriculum and the MidYIS assessment, it was deemed appropriate to
scrutinise the curriculum documents. The discussion that follows details the analysis of the
South African curriculum documents. The aim of the sections to follow is to provide insight
into the issue of curriculum validity of MidYIS. What is of importance, therefore, is the extent
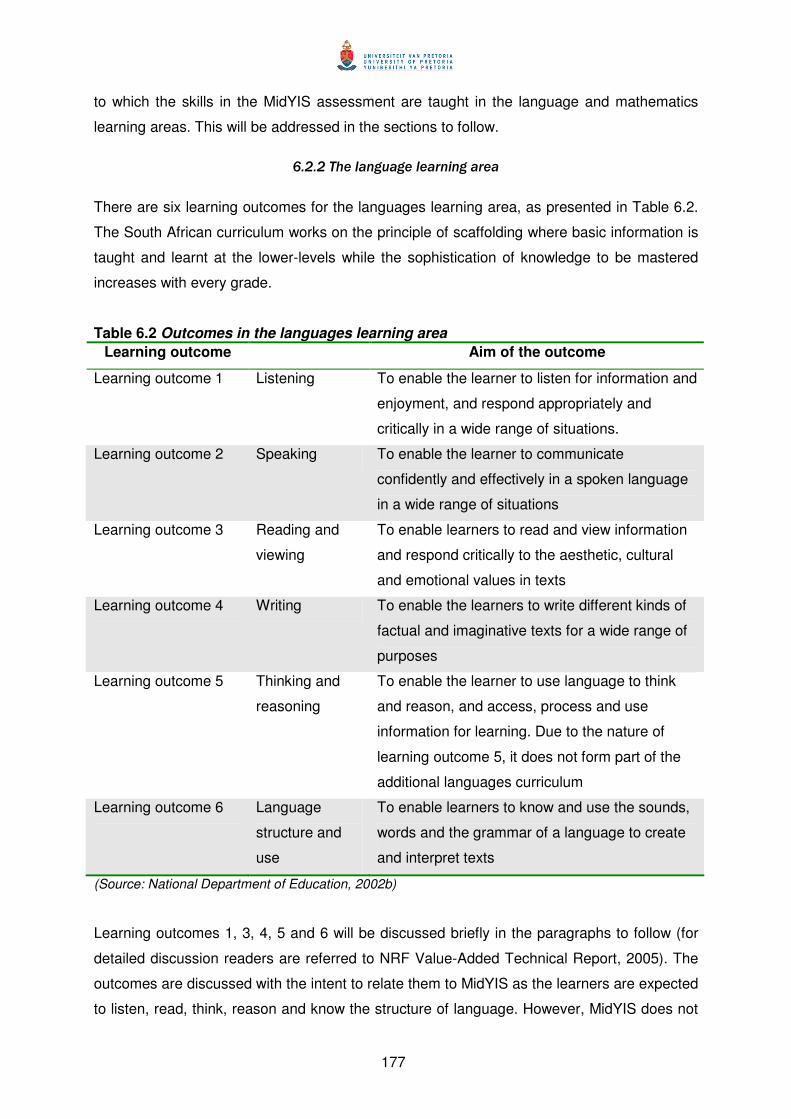
177
to which the skills in the MidYIS assessment are taught in the language and mathematics
learning areas. This will be addressed in the sections to follow.
6.2.2 The language learning area
There are six learning outcomes for the languages learning area, as presented in Table 6.2.
The South African curriculum works on the principle of scaffolding where basic information is
taught and learnt at the lower-levels while the sophistication of knowledge to be mastered
increases with every grade.
Table 6.2 Outcomes in the languages learning area
Learning outcome Aim of the outcome
Learning outcome 1 Listening To enable the learner to listen for information and
enjoyment, and respond appropriately and
critically in a wide range of situations.
Learning outcome 2 Speaking To enable the learner to communicate
confidently and effectively in a spoken language
in a wide range of situations
Learning outcome 3 Reading and
viewing
To enable learners to read and view information
and respond critically to the aesthetic, cultural
and emotional values in texts
Learning outcome 4 Writing To enable the learners to write different kinds of
factual and imaginative texts for a wide range of
purposes
Learning outcome 5 Thinking and
reasoning
To enable the learner to use language to think
and reason, and access, process and use
information for learning. Due to the nature of
learning outcome 5, it does not form part of the
additional languages curriculum
Learning outcome 6 Language
structure and
use
To enable learners to know and use the sounds,
words and the grammar of a language to create
and interpret texts
(Source: National Department of Education, 2002b)
Learning outcomes 1, 3, 4, 5 and 6 will be discussed briefly in the paragraphs to follow (for
detailed discussion readers are referred to NRF Value-Added Technical Report, 2005). The
outcomes are discussed with the intent to relate them to MidYIS as the learners are expected
to listen, read, think, reason and know the structure of language. However, MidYIS does not
178
assess learners’ ability to speak the language, in this case English, as described in learning
outcome 2 and for this reason outcome 2 is not elaborated on.
Being able to listen and understand what is being said is an important skill that is used
throughout life. In learning outcome 1 (listening) listening skills are focused on. Listening
entails being attentively and actively paying attention to instructions, announcements, and
being able to respond appropriately by means of carrying out instructions and follow
directions. Learning outcome 1 also focuses on the development of phonic awareness so
that the learner can distinguish between different phonemes, especially at the beginning of
words (National Department of Education, 2002b, 2002c).
Learning outcome 3 (reading and viewing) can be broken down into certain skills namely
viewing, reading, skimming, and scanning. According to policy, viewing entails using
visual cues to deduce meaning, in that the learner should be able to look at pictures and be
able to recognise common objects and experiences. The learner should also be able to
identify a picture or figure from the background, make sense of picture stories, match
pictures and words (National Department of Education, 2002b, 2002c)
Reading on the other hand entails reading for meaning. The aim is to cultivate techniques
and strategies that would help learners to read for meaning. Reading, in the policy
documents, is seen as an essential element in the development of language, learning to write
and learning about the world. Reading entails the ability to distinguish pictures from print and
recognise the meaning being conveyed. The meaning then links up with learner experiences
and the learner is enabled to describe and give opinions of characters in stories or television
programmes (National Department of Education, 2002b; National Department of Education,
2002c). The aim of reading is to enable learners to read spontaneously and often, for
pleasure and information, across a range of text types, to describe personal response and
discuss the kinds of texts enjoyed and finally to use appropriate reading strategies such as
skimming and scanning. Skimming according to policy entails glancing over texts in order to
obtain a sense of the general ideas being conveyed. Scanning entails looking or searching
for specific details (National Department of Education, 2002b, 2002c).
Learning outcome 4 (writing) can also be divided into a number of skills. Language does
not only consist of spoken words but also of written words. The aim of learning outcome 4 is
to develop writing skills that enables learners to write in such a way that others can
understand. This entails enabling the learner to use appropriate grammatical structures
and writing conventions and use writing frames that show different kinds of sentence and
179
text structures. In addition, the learner should be able to use basic punctuation and
experiment with other punctuation marks. The learner should also be taught how to use
punctuation appropriately and when to make use of spelling rules, strategies, and phonics to
assist in spelling familiar and unfamiliar words correctly. Learners should be encouraged to
use a thesaurus as well as identify synonyms and antonyms (National Department of
Education, 2002b, 2002c). In addition to the writing skills mentioned above the learner should
also be taught to be critical of their own work. The learner should be able to edit his/her own
work by means of deleting or adding words to clarify meaning, re-ordering sentences. Proof
reading forms a substantial part of an editing skill in that corrections are made to drafts of
writing by applying knowledge of language in context, focusing on grammar and grammatical
rules, punctuation, spelling and vocabulary (National Department of Education, 2002b,
2002c).
Thinking and reasoning (learning outcome 5) can be thought of in terms of three (3)
components namely reason, critical skills, and processing information. The curriculum is
clear on the development of critical skills in the form of asking questions and searching for
explanations, suggesting alternatives and offering solutions, solving puzzles and asking
questions for clarification. In terms of the language learning area, critical thinking is
articulated in asking critical questions where appropriate. Critical thinking is also displayed in
responding critically to texts and being able to reflect on own work as well as that of one’s
peers. Reason on the other hand is characterised by inferring and deducing meaning.
Reasoning entails identifying and describing similarities and differences with the aim to
match things that go together and comparing things that are different. There is an element of
classification and separating the parts from the whole. (National Department of Education,
2002b) While reason is characterised by inferring and deducing meaning, processing
information is characterised by assimilating and using information for learning. This is done
by means of picking out selected information from a description, organising the information
and putting the information in the right order, summarising the information in various ways
and categorising and classifying information (National Department of Education, 2002b).
The final learning outcome for languages (learning outcome 6) combines key skills touched
upon in the other learning areas. Learning outcome 6 deals specifically with language
structure and use where vocabulary, grammar, and punctuation are vital in creating and
interpreting texts. Grammar and punctuation have been addressed in preceding paragraphs
and will thus not be discussed again here. Vocabulary has not been addressed in any depth
and will be discussed here. Vocabulary entails the understanding of the meaning of words,
where words are letters used to form units, which in turn are used in sentences. Learners
180
should be able to explain and use word families as well as words of the same field of
knowledge to develop vocabulary. Learners are also expected to know how languages
borrow words from one another and how words change meaning with time. The meanings of
words should also be understood in terms of connotative meanings, denotative meanings,
implied meanings and multiple meanings could be identified (National Department of
Education, 2002b, 2002c).
It would appear from the analysis of the language policy document discussed above that
there is overlap between the MidYIS assessment and the intended policy documents. For
example, the instructions provide some overlap with the learning outcome 1, which is
listening. The main aim of the listening outcome is to enable learners to listen to the spoken
word and be able to respond appropriately. The instructions for each scale are read to the
learners to ensure standardisation of procedures. Learners have to listen to and understand
the instructions in order to complete MidYIS in the correct manner. By the time learners
reach Grade 8 they should be proficient in listening. The instructions to learners are read to
them but they have to read each question in order to provide an answer. Thus learning
outcome 3 (reading and viewing) is represented in MidYIS. Learning outcome 4 (writing) is
represented in terms of proof reading, where learners should be able to identify the mistakes
included in passages on a Grade 8 level. Finally, learning outcome 6 is present because
vocabulary and proof reading contain elements of the structures used in language.
Vocabulary has been included because learners should be able to recognise the meaning of
words and their synonyms and be able to match words on this basis. Proof reading requires
learners to identify mistakes in terms of spelling, grammar, and punctuation.
In order to verify the document analysis undertaken, specialists in the field of language were
asked to evaluate MidYIS (refer to Chapter 5). From the specialists perspective the
instructions, vocabulary sub-test, and proof reading sub-test were of relevance for the
language learning area. Skills needed in order to succeed in these areas are taught in the
curriculum, specifically learning outcome 1 (listening), learning outcome 3 (reading and
viewing) and learning outcome 6 (language structure and use). Furthermore, one of the
specialists indicated that the items in the MidYIS assessment were not biased in terms of
gender or race and that the language used is age appropriate. However, the other specialist
indicated that although the basic skills were present in the curriculum, certain items would
prove difficult for second language learners and that these items should either be modified or
replaced (refer to Appendix G for the detailed reports)

181
Table 6.3 provides a summary of the discussion between the researcher and the specialists
on the overlap between skills assessed in MidYIS and the content and skills taught according
to the language learning area. During the discussion, both the results of the document
analysis and the evaluation reports were considered.
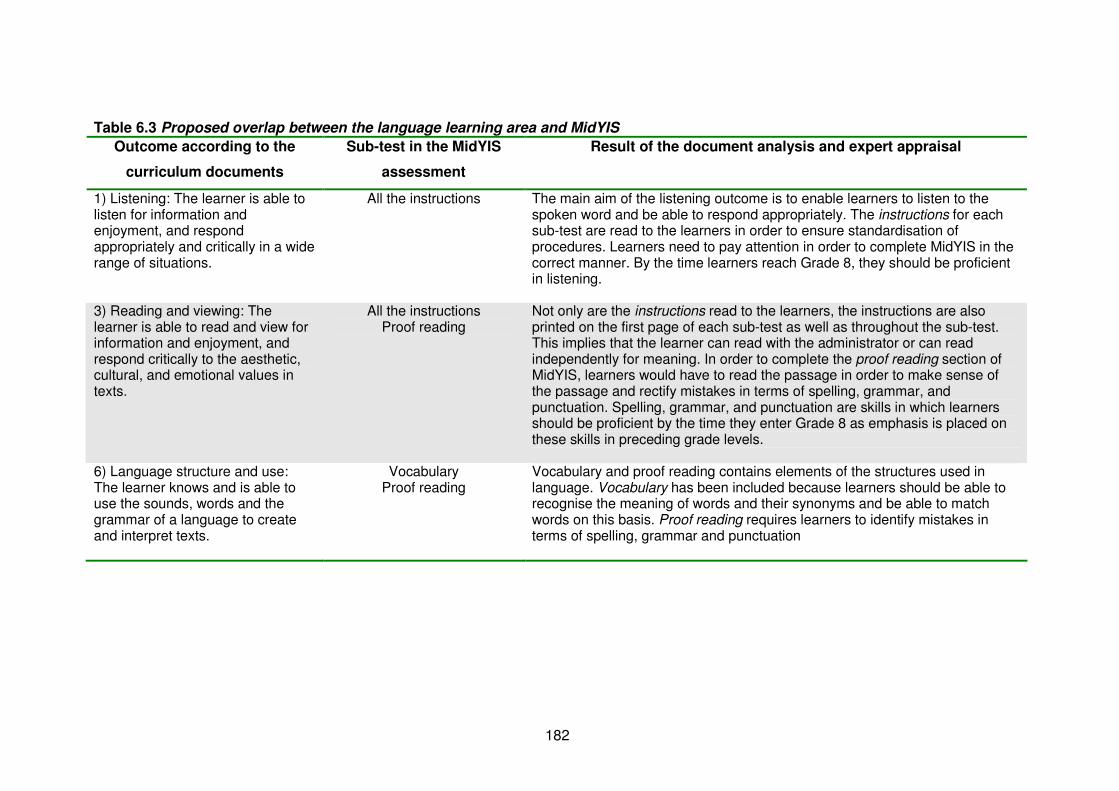
182
Table 6.3 Proposed overlap between the language learning area and MidYIS
Outcome according to the
curriculum documents
Sub-test in the MidYIS
assessment
Result of the document analysis and expert appraisal
1) Listening: The learner is able to listen for information and enjoyment, and respond appropriately and critically in a wide range of situations.
All the instructions The main aim of the listening outcome is to enable learners to listen to the spoken word and be able to respond appropriately. The instructions for each sub-test are read to the learners in order to ensure standardisation of procedures. Learners need to pay attention in order to complete MidYIS in the correct manner. By the time learners reach Grade 8, they should be proficient in listening.
3) Reading and viewing: The learner is able to read and view for information and enjoyment, and respond critically to the aesthetic, cultural, and emotional values in texts.
All the instructions Proof reading
Not only are the instructions read to the learners, the instructions are also printed on the first page of each sub-test as well as throughout the sub-test. This implies that the learner can read with the administrator or can read independently for meaning. In order to complete the proof reading section of MidYIS, learners would have to read the passage in order to make sense of the passage and rectify mistakes in terms of spelling, grammar, and punctuation. Spelling, grammar, and punctuation are skills in which learners should be proficient by the time they enter Grade 8 as emphasis is placed on these skills in preceding grade levels.
6) Language structure and use: The learner knows and is able to use the sounds, words and the grammar of a language to create and interpret texts.
Vocabulary Proof reading
Vocabulary and proof reading contains elements of the structures used in language. Vocabulary has been included because learners should be able to recognise the meaning of words and their synonyms and be able to match words on this basis. Proof reading requires learners to identify mistakes in terms of spelling, grammar and punctuation
183
The National Department of Education officials believe that the content and skills in
assessments have to be linked to outcomes within the curriculum. From the discussion
above it is proposed that there is overlap between the MidYIS assessment and the
curriculum. However, of the six language learning outcomes only three language learning
outcomes are represented. The MidYIS assessment does not include all of the skills
represented in the language curriculum. What the MidYIS assessment does include are the
basic proficiency skills needed to succeed in language, namely vocabulary, proof reading,
and comprehension. These basic skills form the building blocks for the skills, such as
reasoning, in the three learning outcomes not represented in the MidYIS assessment. It is
important to note that all six learning outcomes are needed to succeed in language. The
ability to speak a language (learning outcome 2), write in a language (learning outcome 4)
and think and reason in a language (learning outcome 5) are important if the learner is to be
proficient in the language. However, vocabulary needs to be learnt. Likewise, vocabulary and
spelling are important for obtaining writing proficiency in a language. The three learning
outcomes not assessed by MidYIS are important but proficiency in these three outcomes
presupposes a basic knowledge of vocabulary, spelling, grammar, and punctuation.
Furthermore, the limited curriculum validity for the language learning areas can be
compensated for, if it can be shown that the MidYIS assessment is correlated with academic
achievement (see Chapter 7) and thus have predictive validity.
Various facets of validity are investigated in this research and each of these provides
information from which inferences can be drawn relating to the validity of MidYIS for the
South African context. A distinction was made between the facets specifically between
content-related validity and curriculum validity. Traditionally, content-related validity of an
assessment ascertains the degree to which items included in MidYIS sample the domain of
items for the specific construct under investigation. The MidYIS assessment is a developed
abilities assessment and thus falls within the ambit of psychology, and intelligence theory
more specifically. However, if the MidYIS assessment is to be used in school settings then it
has to be shown that MidYIS is relevant for the context and the curriculum in which it is used.
This means that MidYIS (or the South African version called SASSIS) has to provide
information that educators can use to develop intervention programmes where necessary.
The content of the programmes will undoubtedly be rooted in the curriculum. For this reason
it is important to determine that MidYIS had curriculum relevance in terms of skills assessed.
A skill, according to the Merriam-Webster dictionary (2006) is “the ability to use one's
knowledge effectively” or a “learned power of doing something competently…a developed
aptitude or ability”. According to Atherton (2003), a skill incorporates knowledge in terms of
possession or accessibility. Drawing on the definition provided by the Merriam-Webster
184
Dictionary a skill is learnt and incorporates competency or proficiency. Proficiency was
regarded as the level of knowledge or insight that learners have attained (Claassen, van
Heerden, Vosloo & Wheeler, 2000). As MidYIS assessment is a developed abilities
assessment, abilities have to be taught or included. In the context of the school environment,
this implies that the skills or abilities should be rooted in the curriculum policy documents
because the curriculum documents provide guidelines to educators as to what should be
taught.
MidYIS does, however, have limited curriculum relevance for the language learning area and
taking into account the concerns, perhaps additional scales should be added. However, this
would substantially increase the time needed to administer MidYIS assessment in one sitting.
The additional time needed may impact negatively on the school’s timetable and schools
may be less inclined to participate in the study. A possible solution to the lack of overlap
between the assessment and the curriculum could be to develop a follow-up assessment that
is more diagnostic in nature and more comprehensive in terms of the skills included in the
language learning area. The diagnostic assessment could then be administered to learners
who may benefit from an intervention programme, at a time convenient for the school. The
intervention programme could then be tailored according to the results of the intervention
programme.
6.2.3 The mathematics learning area
The aim of this section is to provide an answer to the question of whether the mathematical
skills in the mathematics learning area curriculum document are sufficiently represented in
MidYIS. Mathematics in terms of the South African mathematics curriculum is defined as a
human activity that involves observing, representing and investigating patterns and
relationships. Mathematics is seen as a product of investigation by different cultures – a
purposeful activity in the context of social, political, and economic goals as well as
constraints (National Department of Education, 2002d).
Within this framework certain features and/or skills can be identified, all of which are
encapsulated in the curriculum. The features and/or skills include working with numbers,
data, space, and shape, visualising, measuring, ordering, calculating, estimating, interpreting,
making informed choices, comparing, contrasting, classifying, and representing.
Furthermore, the learner should be able to display critical and insightful reasoning and
interpretative and communicative skills when dealing with mathematical and
contextualised problems (National Department of Education, 2002d).
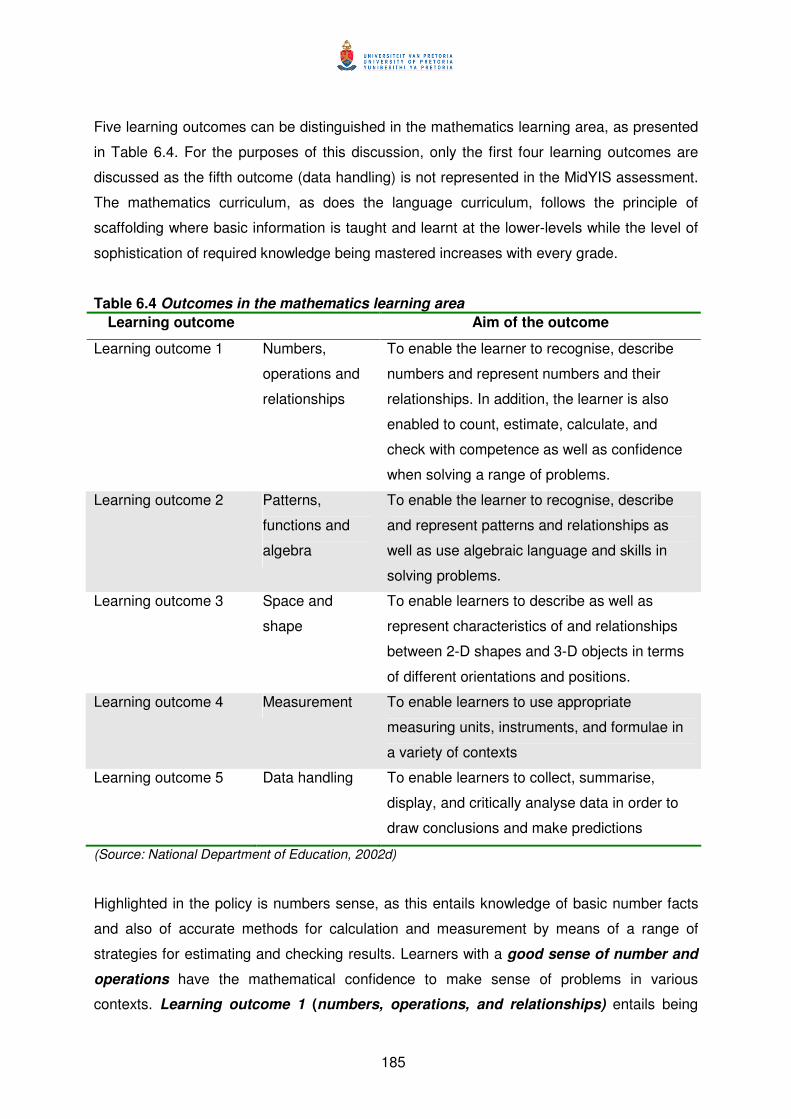
185
Five learning outcomes can be distinguished in the mathematics learning area, as presented
in Table 6.4. For the purposes of this discussion, only the first four learning outcomes are
discussed as the fifth outcome (data handling) is not represented in the MidYIS assessment.
The mathematics curriculum, as does the language curriculum, follows the principle of
scaffolding where basic information is taught and learnt at the lower-levels while the level of
sophistication of required knowledge being mastered increases with every grade.
Table 6.4 Outcomes in the mathematics learning area
Learning outcome Aim of the outcome
Learning outcome 1 Numbers,
operations and
relationships
To enable the learner to recognise, describe
numbers and represent numbers and their
relationships. In addition, the learner is also
enabled to count, estimate, calculate, and
check with competence as well as confidence
when solving a range of problems.
Learning outcome 2 Patterns,
functions and
algebra
To enable the learner to recognise, describe
and represent patterns and relationships as
well as use algebraic language and skills in
solving problems.
Learning outcome 3 Space and
shape
To enable learners to describe as well as
represent characteristics of and relationships
between 2-D shapes and 3-D objects in terms
of different orientations and positions.
Learning outcome 4 Measurement To enable learners to use appropriate
measuring units, instruments, and formulae in
a variety of contexts
Learning outcome 5 Data handling To enable learners to collect, summarise,
display, and critically analyse data in order to
draw conclusions and make predictions
(Source: National Department of Education, 2002d)
Highlighted in the policy is numbers sense, as this entails knowledge of basic number facts
and also of accurate methods for calculation and measurement by means of a range of
strategies for estimating and checking results. Learners with a good sense of number and
operations have the mathematical confidence to make sense of problems in various
contexts. Learning outcome 1 (numbers, operations, and relationships) entails being
186
able to describe and recognise numbers. This includes knowing what numbers mean and
being able to identify how numbers relate to one another, knowing the relative size of
numbers and how to order and compare numbers in terms of more, less or equal. In addition,
the learner should be able to manipulate numbers by adding, subtracting, multiplying,
dividing, building up numbers, breaking down numbers, rounding off and compensating. The
learner should have an understanding of whole numbers, place value, fractions and decimal
fractions, percentages, decimals, ratio, rate and be able to convert numbers from one form to
another. The learner, according to policy, should be able to use a range of techniques and
tools at his/her disposal to perform calculations efficiently and to the required degree of
accuracy (National Department of Education, 2002d).
Learning outcome 2 (patterns, functions and algebra) focuses on patterns and
relationships and on making use of algebraic skills to solve problems. A key element and
focus area of this learning outcome is the ability to describe patterns and relationships, using
symbolic expressions, graphs, and tables. Also of importance is the ability to identify and
analyse regularities and changes in patterns and relationships to be able to make
predictions and solve problems. Numeric and geometric patterns are investigated and
extended in order to establish relationships between variables or express rules governing
patterns in algebraic language or symbols. The patterns and relationships should be
explained so that the rules used could be justified. Patterns and relationships are important
elements in algebra. A central part of learning outcome 2 is for the learner to achieve efficient
manipulative skills using algebra. The study of algebra begins with writing number sentences
to describe a problem situation, solving or completing number sentences by inspection or by
trial-and-improvement and checking the solutions by substitution. Learners will also be able
to write algebraic expressions, formulae, or equations in simpler or more useful equivalent
forms in context and to interpret and use algebraic vocabulary in context (National
Department of Education, 2002d).
Learning outcome 3 is the study of space and shape. According to policy, the study of
space and shape improves understanding and appreciation of the pattern, precision,
achievement, and beauty found in natural and cultural forms. The focus of this outcome is on
the properties, relationships, orientations, positions and transformations of two-
dimensional shapes as well as three-dimensional objects. The aim of the learning
outcome is to enable the learner to describe and represent characteristics of and
relationships between two-dimensional shapes and three-dimensional objects. The learner
should be able to recognise, identify, sort, and compare two-dimensional as well as three-
dimensional objects. The learner should also be able to identify three-dimensional objects
187
from different positions and orientations. As in every outcome, there is a progression from
simpler forms to more complex forms. In the case of learning outcome 3, the learner first
starts with two-dimensional shapes and progresses to three-dimensional objects, geometric
objects, and shapes. The outcome culminates in making use of transformations, congruence,
and similarity in order to investigate, describe, and justify properties of geometric figures and
solids (National Department of Education, 2002d).
Measurement (learning outcome 4) focuses on the selection and use of appropriate
units, instruments, and formulae to quantify characteristics of events, shapes, objects,
and the environment. It is suggested in policy that the study of measurement should be
introduced by means of using everyday occurrences such as describing time of day in terms
of day and night and concretely comparing objects using appropriate language to describe
mass, capacity, and length. The learner should be able to use time-measuring instruments to
appropriate levels of precision in order to describe and illustrate ways of representing time.
Furthermore, learners should be able to estimate, measure, record, compare, and arrange
two-dimensional shapes and three-dimensional objects. S.I. units should be used with
appropriate precision for mass (grams and kilograms), capacity (millilitres and litres), length
(millimetres, centimetres, metres, and km), and temperature using degree Celsius. Learning
outcome 4 aims to expand knowledge of measurement through various investigative
activities such as time, distance, speed as well as derive rules for calculating measurements
relating to geometric figures and solids (National Department of Education, 2002d).
Initial indications are that it would appear from the policy documents that there is some
agreement between the MidYIS assessment and the mathematics curriculum document. Out
of all the sub-tests included in the MidYIS assessment, the mathematics sub-test is the most
curriculum-bound, as internationally, there is convergence in terms of the mathematics
curricula, especially at the Grade 8 level (TIMSS 1999, 2003 are examples of international
studies where this was found). In the mathematics scale, various items are included which
can be linked to learning outcome 1 (numbers, operations and relationships) in terms of
various grade levels from basic number manipulations to more complex calculations all of
which are in line with the curriculum until Grade 8. In the mathematics sub-test, various
measuring units and formulae are used (learning outcome 4: measurement). The type of
items included is grade appropriate in that learners should have been exposed to the skill in
preceding grade levels. Furthermore, learning outcome 2 (patterns, functions and algebra) is
represented in both perceptual speed and pictures sub-tests as these sub-tests include items
where learners need to find or complete the pattern given while the mathematics section
includes algebraic equations, all of which are reasonable for Grade 8. Block counting and
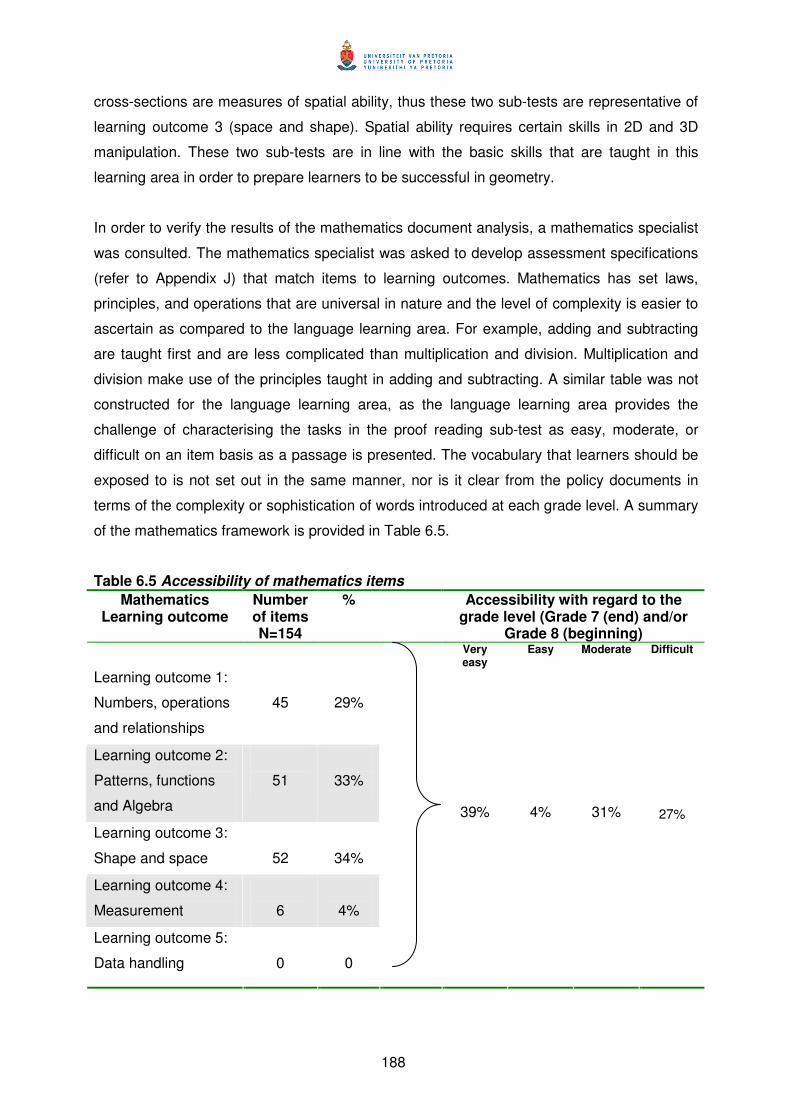
188
cross-sections are measures of spatial ability, thus these two sub-tests are representative of
learning outcome 3 (space and shape). Spatial ability requires certain skills in 2D and 3D
manipulation. These two sub-tests are in line with the basic skills that are taught in this
learning area in order to prepare learners to be successful in geometry.
In order to verify the results of the mathematics document analysis, a mathematics specialist
was consulted. The mathematics specialist was asked to develop assessment specifications
(refer to Appendix J) that match items to learning outcomes. Mathematics has set laws,
principles, and operations that are universal in nature and the level of complexity is easier to
ascertain as compared to the language learning area. For example, adding and subtracting
are taught first and are less complicated than multiplication and division. Multiplication and
division make use of the principles taught in adding and subtracting. A similar table was not
constructed for the language learning area, as the language learning area provides the
challenge of characterising the tasks in the proof reading sub-test as easy, moderate, or
difficult on an item basis as a passage is presented. The vocabulary that learners should be
exposed to is not set out in the same manner, nor is it clear from the policy documents in
terms of the complexity or sophistication of words introduced at each grade level. A summary
of the mathematics framework is provided in Table 6.5.
Table 6.5 Accessibility of mathematics items
Mathematics Learning outcome
Number of items N=154
% Accessibility with regard to the grade level (Grade 7 (end) and/or
Grade 8 (beginning)
Very easy
Easy Moderate Difficult
Learning outcome 1:
Numbers, operations
and relationships
45
29%
Learning outcome 2:
Patterns, functions
and Algebra
51
33%
Learning outcome 3:
Shape and space
52
34%
Learning outcome 4:
Measurement
6
4%
Learning outcome 5:
Data handling
0
0
39%
4%
31%
27%
189
The specialist, however, raised a concern that certain items were excessively easy. However,
the MidYIS assessment is a combination of a speed and power assessment as was
discussed in Chapter 5. The difficulty therefore does not necessarily stem from the item but
the fact that a number of items have to be completed within a time limit. The mathematics
specialist felt that the time allocation was not sufficient and suggested that the time
allocations be revisited. As can be seen from Table 6.5, 43% of the mathematics section was
considered easy by the specialist. What makes the section more difficult is the time allocated
to the section.
The items’ degree of difficulty, according to the specialist, ranged from very easy to difficult
(refer to Table 6.5), which is consistent with sound assessment practices (the item difficulties
will be elaborated on further in Chapter 7). The inclusion of easier items is in line with the
type of assessment where time limits and speed are factors. As the MidYIS assessment is a
combination of a speed and power assessment, as indicated in Chapter 5, more difficult
items have been included. The mathematics specialist also indicated that even though
certain items were not present in the mathematics curriculum they would still be accessible to
an average Grade 8 learner due to general knowledge, experience, and problem solving
strategies.
During the discussion with the mathematics specialist, the results of the document analysis
were presented. The evaluation of the mathematics specialist concurred with the results of
the document analysis (refer to Table 6.6). The mathematics specialist indicated that the
skills needed for four out of the five learning outcomes were represented in MidYIS, namely
learning outcome 1 (numbers, operations and relationships), learning outcome 2 (patterns,
functions and algebra), learning outcome 3 (space and shape) and learning outcome 4
(measurement) (refer to Table 6.6), with no items representative of learning outcome 5 (data
handling).
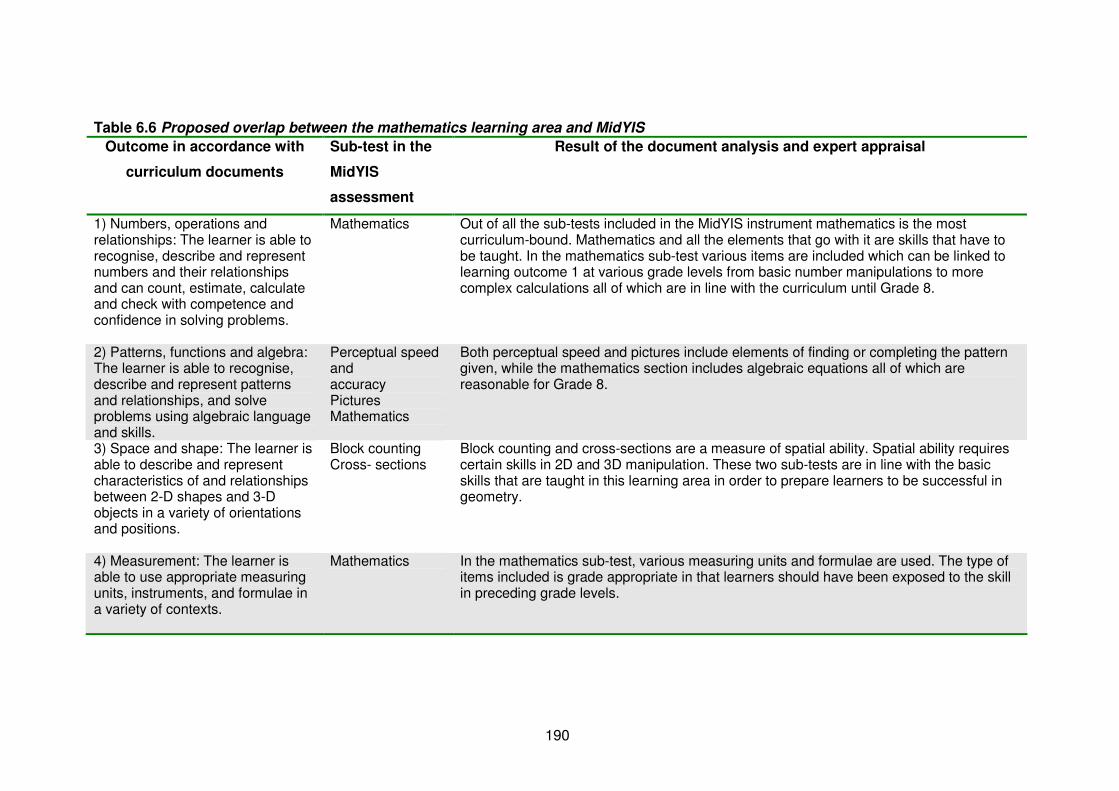
190
Table 6.6 Proposed overlap between the mathematics learning area and MidYIS
Outcome in accordance with
curriculum documents
Sub-test in the
MidYIS
assessment
Result of the document analysis and expert appraisal
1) Numbers, operations and relationships: The learner is able to recognise, describe and represent numbers and their relationships and can count, estimate, calculate and check with competence and confidence in solving problems.
Mathematics Out of all the sub-tests included in the MidYIS instrument mathematics is the most curriculum-bound. Mathematics and all the elements that go with it are skills that have to be taught. In the mathematics sub-test various items are included which can be linked to learning outcome 1 at various grade levels from basic number manipulations to more complex calculations all of which are in line with the curriculum until Grade 8.
2) Patterns, functions and algebra: The learner is able to recognise, describe and represent patterns and relationships, and solve problems using algebraic language and skills.
Perceptual speed and accuracy Pictures Mathematics
Both perceptual speed and pictures include elements of finding or completing the pattern given, while the mathematics section includes algebraic equations all of which are reasonable for Grade 8.
3) Space and shape: The learner is able to describe and represent characteristics of and relationships between 2-D shapes and 3-D objects in a variety of orientations and positions.
Block counting Cross- sections
Block counting and cross-sections are a measure of spatial ability. Spatial ability requires certain skills in 2D and 3D manipulation. These two sub-tests are in line with the basic skills that are taught in this learning area in order to prepare learners to be successful in geometry.
4) Measurement: The learner is able to use appropriate measuring units, instruments, and formulae in a variety of contexts.
Mathematics In the mathematics sub-test, various measuring units and formulae are used. The type of items included is grade appropriate in that learners should have been exposed to the skill in preceding grade levels.
191
From the preceding section, it is clear that there is overlap between the MidYIS assessment
and the curriculum. However, learning outcome 5 (data handling) is not represented at all.
This raises some doubt about the extent of the curriculum validity of MidYIS in terms of the
mathematics learning area. However, validity cannot be thought of in absolute terms.
Instead, validity is best thought of in terms of a continuum ranging from high to low (see
Chapter 5). In any assessment, the challenge remains to cover a range of skills, given
practical considerations, such as time. Even though learning outcome 5 is not represented in
MidYIS, the basic skills needed to succeed in data handling are found in the other four
learning outcomes. Furthermore, inferences drawn in terms of the curriculum validity of the
MidYIS assessment are strengthened if the correlations between the MidYIS assessment
and academic performance in mathematics are high (the predictive validity of the MidYIS
assessment will be addressed in Chapter 7).
Based on the results of the document analysis and evaluation report from the mathematics
specialist, it would appear that MidYIS does have a degree of curriculum validity. Items that
are easy, moderate, and difficult should however cover all learning outcomes. If MidYIS is to
include items completely representative of the skills included in the curriculum, then items
related to data handling (learning outcome 5) should be included in future versions of the
South African adaptation of MidYIS.
6.2.4 Exploring possible suggestions for the revision of MidYIS
In 6.2.2 and 6.2.3, the curriculum validity of MidYIS was explored. Clearly, there is overlap
between the skills taught in the curriculum and the skills assessed in MidYIS. Suggestions
can be put forward to adapt MidYIS to the South African context. These suggestions draw on
the document analysis and evaluations from the specialists (both language and
mathematics). The adaptations relate to items, administration procedures, and format. Items
for example could be either rewritten or added in accordance with learning outcomes not
covered in MidYIS. The adaptations discussed in this session are related to the discussion in
Chapter 4, Section 4.6 as well as the specific research question 1.3 (as described in Chapter
5) what adaptations are needed to transform MidYIS into SASSIS, a monitoring system
for the South African context. The specific adaptations suggested are represented under
the sub-research questions identified. Each sub-question focuses on an important
adaptation. These include administration procedures, level of language, format of the
assessment and time allocations. Under each of the sub-questions the adaptations are
described for each of the areas identified.
192
1.3.1 To what extent are the administration procedures appropriate and if not,
how can these be adjusted?
The expert evaluation reports from the language specialists indicated that the
instructions could be ambiguous and difficult to follow. The instructions were
therefore rewritten so that learners could better understand what was expected of
them. The modifications were based on the suggestions given by the language
specialists.
The mathematics specialist indicated that the instructions for some sections were
ambiguous, specifically citing cross-sections and block counting.
The instructions were modified in collaboration with the mathematics and
language specialists. The modified instructions were translated and back
translated to ensure accuracy and congruence between translated versions.
The second area of adaptation refers specifically to the level of language used in
the assessment.
1.3.2 To what extent is the content in MidYIS appropriate for second language
learners?
The language specialists indicated that the more complex words would not be
accessible to second language learners, especially items in the vocabulary
section. The specialist felt that certain words in the vocabulary section were
ambiguous and that the way in which the words were presented was not in line
with how vocabulary was taught. As a result, the vocabulary sub-test was revised
on the basis of the suggestions provided by the language specialists. The
specialists provided options for replacing problematic or ambiguous words. The
core word for which a synonym had to found was placed within the context of a
sentence. One of the language specialists provided the context sentences. The
sentences provided were then reviewed to ensure that they were valid, specifically
whether the sentences included any gender and cultural bias.
It is suspected that the as a result, the items may be easier but more accessible to
second language learners (the difficulty of the items is reported on in Chapter 7).
Furthermore, when data from the pre-pilot is reviewed in conjunction with
performance on the reviewed vocabulary items it was found that the mean score
was 40% as compared to 47%.
193
The mathematics specialist felt that some items might be inaccessible for some
second language speakers because of the length and level of written language
included. The items flagged were discussed and the suggested changes effected
in collaboration with the specialist.
The third area of adaptation refers to whether the format of the assessment was
appropriate.
1.3.3 To what extent is the format of the assessment appropriate and if not, how
can it be changed?
The language specialists pointed out that learners, when unsure of what to do,
would have to page to the beginning of the sub-test in order to reread the
instructions. This would waste time. For this reason, the instructions were
included at the top of the page, at the suggestion of the specialists, throughout
MidYIS so that learners if uncertain could reread the instructions.
The fourth area of adaptation refers to whether the time allocations were
appropriate.
1.3.4 To what extent are the time allocations appropriate and if not, what
adjustments are needed?
The language specialists were not satisfied with the time limits allocated for
various sections of MidYIS. The time allocated to each sub-test was therefore
increased so as to allow the majority of the learners to complete or almost
complete the sub-test. Time limits were decided upon in collaboration with the
language specialists. A key consideration was the nature of MidYIS, which is a
combination of a speed and power assessment. The assessment was
administered during a formal school day. This meant that the allocated time had to
fit into the school’s timetable so as to not overly impose on teaching time.
Time was a major issue for the mathematics specialist. He felt that some learners
would not be able to finish (or nearly finish) certain sections, among them
mathematics, cross-sections and block counting. The time allocations were
discussed with the mathematics specialist and the same procedure applied as
with the language specialists. It was agreed that the time allocations would be
adjusted so that learners would have at least 30 seconds to complete an item.
194
6.3 Exploring the content validity of the MidYIS assessment
In Chapter 5, the concept of validity was addressed as opposed to different types of validity.
The facets are the traditional terms of content validity, face validity and construct validity.
Acknowledging the view that validity is a unitary concept, it is for conceptual and analytical
reasons easier to separate it into facets and to address these individually. Content-related
validity issues are addressed from a curriculum perspective and explored from a
psychometric perspective. It is thought that this approach would add depth to inferences
drawn because the exploration would not only be from a curriculum perspective but would
also draw on the theory base related to ability testing. Content-related validity issues from a
psychometric perspective addresses the sub-research question (question 1.2.3 as described
in Chapter 5) to what extent are the items in MidYIS in agreement with the domain of
ability testing and applicable for South Africa.
MidYIS is a developed abilities assessment. Developed abilities are the common ground
between intelligence, aptitude, and achievement and reflect the effects of experience and
learning (Reschly, 1990). Developed abilities can also be thought of in terms of skills or
competencies (Merriam-Webster, 2006). Competence, according to Kouwenhoven (2003, p.
43,), is the “state of being competent”, “the capability [ability] to choose and use (apply) an
integrated combination of knowledge, skills and attitudes” (Kouwenhoven, 2003, p. 71).
Ability may refer to cognitive traits used when solving problems where cognitive refers to
information processing. If it is said that an assessment is the measuring of developed abilities
then aspects of developed abilities are covered (Kline, 2000). From a curriculum perspective,
it means that the skills taught in the curriculum are included in MidYIS. From a psychometric
perspective, this means that the abilities or skills to be assessed are covered in the field of
ability testing.
The systems developed by the CEM centre all have these characteristics in common (see
Chapter 4) and stem from the need to have an assessment that could predict future
performance but which was not curriculum-based. At the time when the first system, the
Advanced Level Information System (Alis), was being developed, the publishing of league-
tables had started to take effect (Fitz-Gibbon, 1996). There was a need to have an alternative
assessment apart from the Key Stage examinations on which the league-tables were based.
The Key Stage examinations are curriculum-driven, thus a developed abilities assessment
was used. Developed abilities, although not strictly curriculum-based, do provide a measure
of proficiency in basic skills needed to succeed academically (refer to Chapter 2).
195
In a developed abilities assessment, both generic competencies as well as domain specific
competencies are assessed. Generic competencies are skills, which are transferable to other
situations whereas domain-specific skills are skills associated with a specific content domain
(Kouwenhoven, 2003). For example, in MidYIS the mathematics sub-test is specific to the
mathematics domain, i.e. domain specific, while perceptual speed and accuracy may be
used in mathematics to find a mistake in an equation and in geography to find a location on a
map.
It is important to explore whether the sub-tests in MidYIS are comparable to sub-tests of
other ability assessments (refer to Chapter 5). Researchers using factor analysis in an effort
to understand the “nature of human abilities” (Kline, 2000, p. 69) have identified key ability
factors. Table 6.6 provides a summary of the various ability factors (Cooper, 1999; Hunt,
1985; Kline, 1993, 2000; Sternberg, 1985). For the purposes of this discussion, only the
factors which are assessed in current ability, aptitude assessments, and MidYIS are included
in Table 6.7 (see Appendix K for a comprehensive list of ability factors).
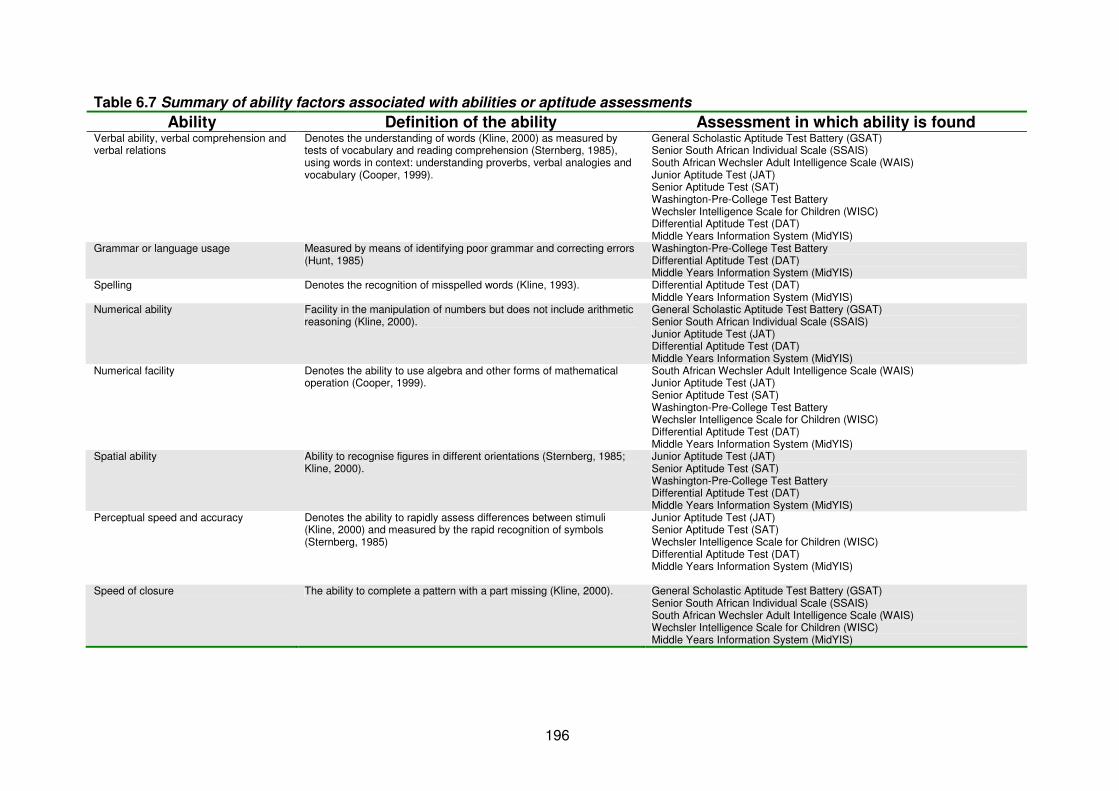
196
Table 6.7 Summary of ability factors associated with abilities or aptitude assessments
Ability Definition of the ability Assessment in which ability is found Verbal ability, verbal comprehension and verbal relations
Denotes the understanding of words (Kline, 2000) as measured by tests of vocabulary and reading comprehension (Sternberg, 1985), using words in context: understanding proverbs, verbal analogies and vocabulary (Cooper, 1999).
General Scholastic Aptitude Test Battery (GSAT) Senior South African Individual Scale (SSAIS) South African Wechsler Adult Intelligence Scale (WAIS) Junior Aptitude Test (JAT) Senior Aptitude Test (SAT) Washington-Pre-College Test Battery Wechsler Intelligence Scale for Children (WISC) Differential Aptitude Test (DAT) Middle Years Information System (MidYIS)
Grammar or language usage Measured by means of identifying poor grammar and correcting errors (Hunt, 1985)
Washington-Pre-College Test Battery Differential Aptitude Test (DAT) Middle Years Information System (MidYIS)
Spelling Denotes the recognition of misspelled words (Kline, 1993).
Differential Aptitude Test (DAT) Middle Years Information System (MidYIS)
Numerical ability Facility in the manipulation of numbers but does not include arithmetic reasoning (Kline, 2000).
General Scholastic Aptitude Test Battery (GSAT) Senior South African Individual Scale (SSAIS) Junior Aptitude Test (JAT) Differential Aptitude Test (DAT) Middle Years Information System (MidYIS)
Numerical facility Denotes the ability to use algebra and other forms of mathematical operation (Cooper, 1999).
South African Wechsler Adult Intelligence Scale (WAIS) Junior Aptitude Test (JAT) Senior Aptitude Test (SAT) Washington-Pre-College Test Battery Wechsler Intelligence Scale for Children (WISC) Differential Aptitude Test (DAT) Middle Years Information System (MidYIS)
Spatial ability Ability to recognise figures in different orientations (Sternberg, 1985; Kline, 2000).
Junior Aptitude Test (JAT) Senior Aptitude Test (SAT) Washington-Pre-College Test Battery Differential Aptitude Test (DAT) Middle Years Information System (MidYIS)
Perceptual speed and accuracy Denotes the ability to rapidly assess differences between stimuli (Kline, 2000) and measured by the rapid recognition of symbols (Sternberg, 1985)
Junior Aptitude Test (JAT) Senior Aptitude Test (SAT) Wechsler Intelligence Scale for Children (WISC) Differential Aptitude Test (DAT) Middle Years Information System (MidYIS)
Speed of closure The ability to complete a pattern with a part missing (Kline, 2000). General Scholastic Aptitude Test Battery (GSAT) Senior South African Individual Scale (SSAIS) South African Wechsler Adult Intelligence Scale (WAIS) Wechsler Intelligence Scale for Children (WISC) Middle Years Information System (MidYIS)
197
Table 6.7 provides a summary of the various types of ability factors prominent in ability or
aptitude assessments. In order to make inferences of the content-validity from a
psychometric perspective, specialists in the field of psychology were asked to evaluate
MidYIS. An educational psychologist as well as two research psychologists formally reviewed
the MidYIS instrument. The brief was to review MidYIS for content-related validity specifically
in terms of intelligence or ability theory. Whether MidYIS was similar to other developed
abilities assessment such the as the Wechsler Intelligence Scale for Children (WISC) or
Differential Aptitude Test (DAT) had to be evaluated, also whether the language was
appropriate and any biases were obvious in terms of gender or race. The outcome of the
reviews indicated that the sections represented in the MidYIS assessment do correspond
with the domain of items found in ability assessments; specifically the ability factors of verbal
ability, comprehension and relations, spatial ability, grammar or language usage, perceptual
speed and accuracy and numerical ability and facility (see Table 6.7). The psychologists
indicated that the items were not biased in terms of language or gender. However, the
psychologists pointed out that they could not comment on the difficulty of the vocabulary and
mathematics sections specifically as they were not content specialists.
6.4 Conclusion
The aim of this chapter was to address issues associated with the content-related validity of
the MidYIS assessment. The content-related validity of MidYIS can be evaluated from two
perspectives namely a curriculum perspective and a psychometric perspective. Although
these two perspectives are addressed separately, there is an apparent link between the two.
From a psychometric perspective, MidYIS is a developed abilities assessment. Ability is a
competence in, a skill or an aptitude. The current curriculum has its roots in competency-
based education (Kraak, 1998). Competence can refer to general intelligence or aptitude, as
motivation or as a set of key competencies or skills (Kouwenhoven, 2003). Due to the nature
of the relationship between MidYIS as a developed abilities assessment and the curriculum
with its roots in competency-based education, both aspects had to be explored. The
curriculum perspective is reflected in the sub-question to what extent are the skills tested
by MidYIS valid for the South African curriculum while the psychometric perspective is
reflected in the sub-question to what extent are the items in MidYIS in agreement with
the domain of ability testing and applicable for South Africa.
The sub-question to what extent are the skills tested by MidYIS valid for the South
African curriculum was explored by means of curriculum document analysis and specialist
evaluations, while background information was provided by the National and Provincial
198
Department of Education. The clear message from the National and Provincial Departments
of Education was that assessment used in a school setting must be aligned with the
curriculum. In order to explore the alignment of the MidYIS assessment with the South
African curriculum, document analysis was undertaken and specialists consulted. Two
learning areas were selected namely language and mathematics as the fundamental skills
assessed in MidYIS corresponded with these two learning areas (refer to Chapter 5).
For the language learning area three of the six outcomes were represented in the MidYIS
assessment indicating a moderate alignment between MidYIS and the curriculum. However,
the skills assessed in the MidYIS assessment which can be found in the curriculum refer to
the basic skills needed for example vocabulary. Teal (2003) is of the opinion that vocabulary
knowledge is one of the best predictors of reading comprehension. Vocabulary knowledge
provides a source of prior knowledge and word meaning that can be used to enhance
reading comprehension. In addition, word recognition is considered an essential goal (Artley,
1996), as well as reading comprehension, decoding and language comprehension
(Aarnoutse & Brand-Gruwel, 1997). Word recognition and comprehension are important
because if a learner becomes better at reading, s/he will be able to read more difficult texts
resulting in a larger vocabulary and syntactic knowledge that in turn positively affects
language ability (Aarnoutse & Brand-Gruwel, 1997). It is clear that even though the MidYIS
assessment does not directly include three of the six learning outcomes, what it does include
is the basic skill that is needed to succeed in the other learning outcomes. However, it is
possible to construct additional scales that do directly relate to the other learning outcomes,
such as reading a passage and answering questions relating to the passage. The act of
reading helps to increase the learner’s vocabulary and also his/her awareness of language
and structure of text (McFarlane, 1997). By including an additional section, learner reading
skills and comprehension can be directly assessed.
Inferences in terms of curriculum validity for the mathematics learning area are substantially
stronger because four of the five learning outcomes are represented in MidYIS. The
acquisition of mathematical problem-solving and reasoning skills in addition to the ability to
apply the skills to mathematical situations and real-life situations constitutes a major goal or
objective of mathematics education (Verschaffel, 1999). A primary goal of mathematics
education is to enable learners to apply their knowledge of facts, concepts, formulas, and
procedures in order to solve problems in a variety of learning situations (Muth, 1997). Solving
mathematics problems requires learning of domain-specific knowledge that is well structured
and flexible, including content, procedures and reflective knowledge, in order to be able to
199
solve the given problem (Nelissen, 1999). In order to solve problems, learners need to have
basic mathematical skills and be able to observe, relate, question, and infer. To solve
mathematical problems learners must be able to reason about ideas, see the relationships
and connections, and be able to make sense of mathematics. Learners should be able to
draw conclusions, induce patterns, and deduce ideas resulting in learners having the ability
to use models and mathematical ideas to explain thinking (Holmes, 1995). In order to be able
to explain thinking learners should have basic mathematical skills that can be built upon
(Cathcart, Pothier, Vance & Bezuk, 2003). It would appear from the document analysis and
specialist evaluation that MidYIS has a reasonable degree of curriculum validity. However,
the proposal for additional items pertaining to the outcome currently not represented would
make inferences drawn that much stronger.
The second sub-question addressed relating to content-related validity is to what extent are
the items in MidYIS in agreement with the domain of ability testing and applicable for
South Africa. The evaluations from the psychologists indicate that the items in the MidYIS
are in agreement with the ability domain. Furthermore, MidYIS is comparable to other ability
assessments currently used in South Africa such as the Differential Aptitude Test (DAT) and
is not biased in terms of gender or race.
Finally, it is clear that adaptations had to be made to MidYIS to make it relevant for South
Africa. Some of the adaptations are easier to effect than others. Adaptations that are needed,
range from allocating more time per sub-test to possibly including additional sub-tests. To
answer the sub-question of what adaptations are needed to transform MidYIS into
SASSIS, a monitoring system for the South African context the following suggestions
have been made:
1.3.1 To what extent are administration procedures appropriate and if not how
can they be adjusted?
The expert evaluation reports indicated that the instructions could be ambiguous
and difficult to follow. Thus the instructions were revised, on the basis of the
suggestions provided by the specialists, so that learners would understand what
was expected of them but that the rewritten version would still be comparable to
the original.
200
1.3.2 To what extent is the content in MidYIS appropriate for second language
learners?
The specialists indicated that a number of items would not be accessible to
second language learners. The specialists identified items and provided feasible
alternatives. The changes suggested by the specialists were effected.
1.3.3 To what extent is the format of the assessment appropriate and if not, how
can it be changed?
Overall the format of MidYIS was acceptable However, the specialists indicated
that when unsure of what to do, learners would have to page to the beginning of
the sub-test in order to reread the instructions. This would waste time. The
instructions were therefore included at the top of the page throughout MidYIS, as
suggested by the specialists, so that learners could reread the instructions without
wasting time.
1.3.4 To what extent are the time allocations appropriate and if not, what
adjustments are needed?
The specialists were not satisfied with the time limits allocated to various sections
of MidYIS. Therefore, the time allocated to each sub-test was increased, using the
recommendations of the specialists so that the majority of the learners would be
able to complete or almost complete sub-test. This is also in accordance with the
type of assessment, as MidYIS is a combination of a speed and power test as
was discussed in Chapter 5.
201
CHAPTER 7CHAPTER 7CHAPTER 7CHAPTER 7
THE THE THE THE CONCONCONCONSSSSTRUCTTRUCTTRUCTTRUCT----RELATED VALIDITY AND RELATED VALIDITY AND RELATED VALIDITY AND RELATED VALIDITY AND RELIABILITY OF THE MIDYIS ASSESSMENTRELIABILITY OF THE MIDYIS ASSESSMENTRELIABILITY OF THE MIDYIS ASSESSMENTRELIABILITY OF THE MIDYIS ASSESSMENT
This chapter details the investigation into the construct-related validity and
reliability of the MidYIS assessment. Several analytical strategies are
included that address sub-questions related to the specific research
question how valid and reliable are the data generated by the MidYIS
monitoring system for South Africa? These strategies were designed to
answer whether the data support the MidYIS scales, whether the results of
the assessment are reliable and whether the results could be used to
predict future performance. In order to explore the data structure Rasch
analysis were used. Reliability analysis was undertaken to investigate the
consistency of results while correlation analysis was used as a preliminary
step in investigating the possibility of using the results of the MidYIS
assessment to predict academic performance.
7.1 Introduction
This chapter represents the second of the results chapters and portrays the outcome of the
reliability and validation strategies relating to the first main research question how
appropriate is the Middle Years Information System (MidYIS) as a monitoring system
in the South African context. More specifically the chapter addresses the specific research
question 1.2 (as discussed in Chapter 5) how valid and reliable are the data generated by
the MidYIS monitoring system for South Africa? In Chapter 3, the main research question
and the specific research questions were discussed in terms of criteria for evaluating the
quality of measurements and how one would collect information in order to make inferences
related to the quality of measurements (specifically that of validity and reliability; see Figure
3.3). In Chapter 5, the figure presented in Chapter 3 (3.5) was elaborated upon.
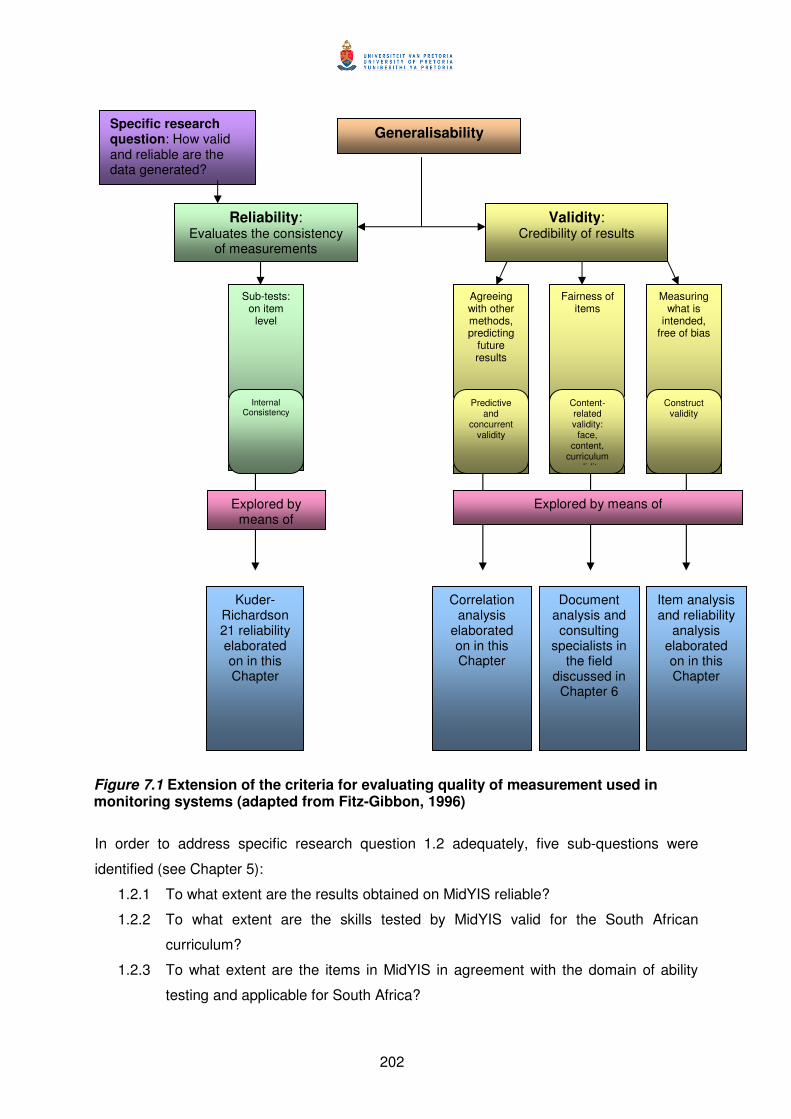
202
Figure 7.1 Extension of the criteria for evaluating quality of measurement used in monitoring systems (adapted from Fitz-Gibbon, 1996)
In order to address specific research question 1.2 adequately, five sub-questions were
identified (see Chapter 5):
1.2.1 To what extent are the results obtained on MidYIS reliable?
1.2.2 To what extent are the skills tested by MidYIS valid for the South African
curriculum?
1.2.3 To what extent are the items in MidYIS in agreement with the domain of ability
testing and applicable for South Africa?
Explored by means of Explored by means of
Correlation analysis
elaborated on in this Chapter
Document analysis and consulting
specialists in the field
discussed in Chapter 6
Item analysis and reliability
analysis elaborated on in this Chapter
Kuder-Richardson 21 reliability elaborated on in this Chapter
Generalisability
Validity: Credibility of results
Agreeing with other methods, predicting
future results
Fairness of items
Measuring what is
intended, free of bias
Predictive and
concurrent validity
Content-related validity:
face, content,
curriculum validity
Construct validity
Specific research question: How valid and reliable are the data generated?
Reliability: Evaluates the consistency
of measurements
Sub-tests: on item
level
Internal Consistency
203
1.2.4 How well do the items per sub-test function and do they form well-defined
constructs?
1.2.5 To what extent could the data predict future achievement?
The two sub-research questions 1.2.2 and 1.2.3 were addressed in Chapter 6. The focus of
this chapter is on the empirical analysis associated with the validation strategies and
reliability analysis (sub-questions 1.2.1, 1.2.4, and 1.2.5).
Validity is seen as a unitary concept as described in Chapter 5. Validity is, in the words of
Messick (1989, p. 5), “…an integrated evaluative judgment of the degree to which empirical
evidence and rationales support the adequacy and appropriateness of inferences and actions
based on test scores or other modes of assessment”.
All instruments or measures are faced with the challenge of establishing validity. This is
reflected in the “theoretical value, empirical value or applied value” as stated by Greenwald,
Nosek and Sriram (2006, p. 56). It seldom occurs that an instrument will have no validity or
100% validity. Rather, the idea here is to make inferences based on a continuum. Thus an
instrument or measure may provide some evidence about a person’s level on a construct but
may not necessarily represent everything included in the definition of the construct (Reckase,
1998).
In order to make sound judgments regarding validity more generally, both statistical and
judgmental analyses are required (Sireci, 1998). For this reason, the current research
included investigations into the content-related validity of the assessment, as was discussed
in Chapter 6, as well as statistical or more “empirical” analyses that are presented in this
chapter. Specifically, construct validity in terms of empirical evidence and predictive validity
are discussed in this chapter. These are discussed separately, as a distinction can be drawn
between the facets of validity as was explained in Chapter 5, under the banner construct-
related validity (5.3.3). This also provides a way of addressing conceptual aspects of validity
(Messick, 1989). It has to be understood, however, that (Messick, 1998, p. 37):
All validity is of one kind…Other so-called separate types of validity – whether
labeled content validity, criterion-related validity, consequential validity, or
whatever – cannot stand alone in validity arguments. Rather, these so-called
validity types refer to complementary forms of evidence to be integrated into an
overall judgment…What needs to be valid are the inferences made about score
meaning, namely, the score interpretation and its action implications for test use.
204
For the purposes of this research, construct validity is viewed as the extent to which an
assessment measures a particular construct which is inferred from theory (Huysamen, 1996).
An assessment intends to measure predefined constructs. However, it has to be established
whether the items are functioning as they should. MidYIS was designed to measure seven
constructs, each forming the sub-tests of the assessment, namely vocabulary, mathematics,
proof reading, perceptual speed and accuracy, cross-sections, block counting and pictures
(see Chapter 4). Whether the items in each of the sub-tests measure the same trait in South
Africa has to be established. Thus Rasch analysis was used for this purpose.
In addition to construct validity, predictive validity was explored, specifically whether the
South African data can be used to predict future academic performance. In the United
Kingdom, MidYIS is used to predict future achievement, in addition to calculating the value
the school has added to learners (see Chapter 4). Statistical procedures such as correlation
analyses and ordinary least squares analyses (also referred to as regression analysis), have
been undertaken by the CEM centre. The same procedures have to be undertaken in the
South African context, if the assessment is to be used in the same way.
The first step was to explore whether there are any correlations between the MidYIS scores
and academic performance (Kline, 1993; Huysamen, 1996). According to Huysamen (1996,
p. 33) “this correlation tells us how accurately ultimate success” can be predicted. The
second step was to draw a nationally representative sample, administer the assessment and
then correlate the data with academic performance as defined by national written
examinations. The South African data is not used to predict performance as this is beyond
the scope of this thesis. However, initial groundwork is presented here in an effort to
establish whether relationships exist between the MidYIS scores and academic performance
as obtained from the schools.
The concept of reliability is also addressed in this chapter and is viewed in terms of the
consistency of results, and was detailed in Chapter 5. Reliability analysis can also be used
the strengthen inferences pertaining to construct validity (Gronlund, 1998), as the analysis
identifies items which appear to be measuring a different trait. Many factors may improve the
reliability of an assessment, such as the test length, item type, assessment administration
procedures and time limits (Traub & Rowley, 1991). However, before issues of validity and
reliability are addressed, the participants are described in terms of age, gender and
population group (7.2). How well the items are functioning for each sub-test is addressed in
7.3, while reliability is explored in 7.4. Whether the MidYIS scores can be used for prediction
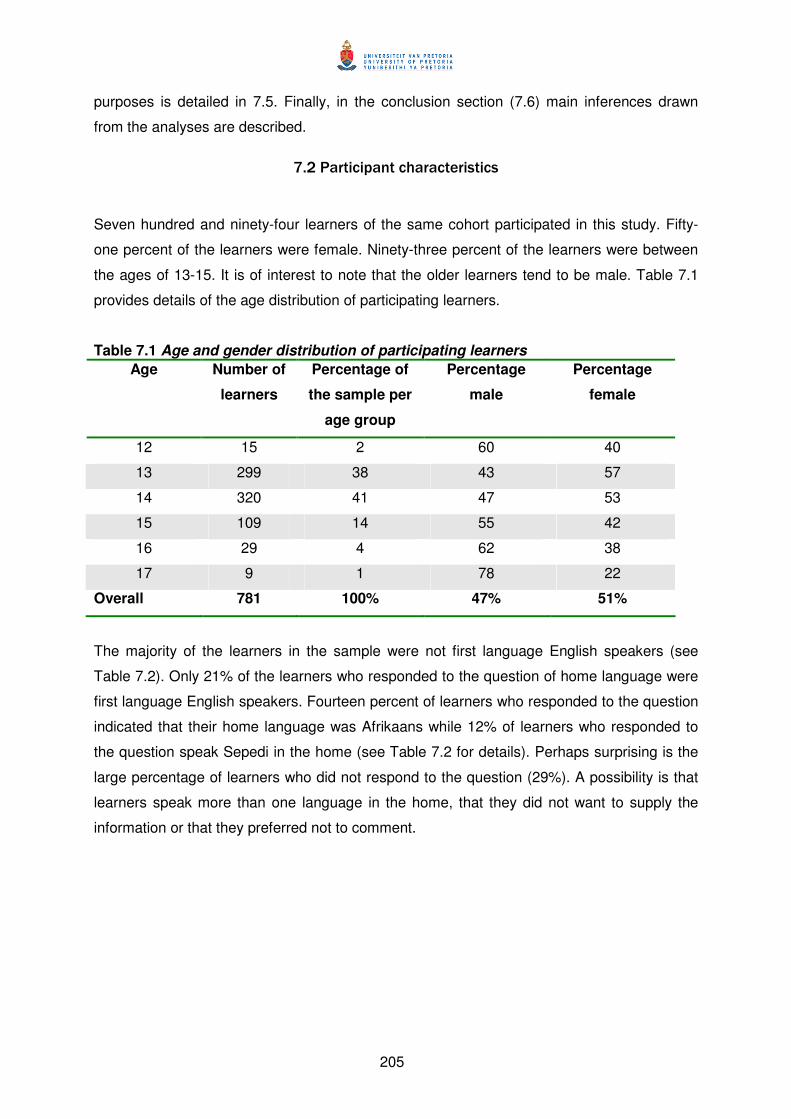
205
purposes is detailed in 7.5. Finally, in the conclusion section (7.6) main inferences drawn
from the analyses are described.
7.2 Participant characteristics
Seven hundred and ninety-four learners of the same cohort participated in this study. Fifty-
one percent of the learners were female. Ninety-three percent of the learners were between
the ages of 13-15. It is of interest to note that the older learners tend to be male. Table 7.1
provides details of the age distribution of participating learners.
Table 7.1 Age and gender distribution of participating learners
Age Number of
learners
Percentage of
the sample per
age group
Percentage
male
Percentage
female
12 15 2 60 40
13 299 38 43 57
14 320 41 47 53
15 109 14 55 42
16 29 4 62 38
17 9 1 78 22
Overall 781 100% 47% 51%
The majority of the learners in the sample were not first language English speakers (see
Table 7.2). Only 21% of the learners who responded to the question of home language were
first language English speakers. Fourteen percent of learners who responded to the question
indicated that their home language was Afrikaans while 12% of learners who responded to
the question speak Sepedi in the home (see Table 7.2 for details). Perhaps surprising is the
large percentage of learners who did not respond to the question (29%). A possibility is that
learners speak more than one language in the home, that they did not want to supply the
information or that they preferred not to comment.
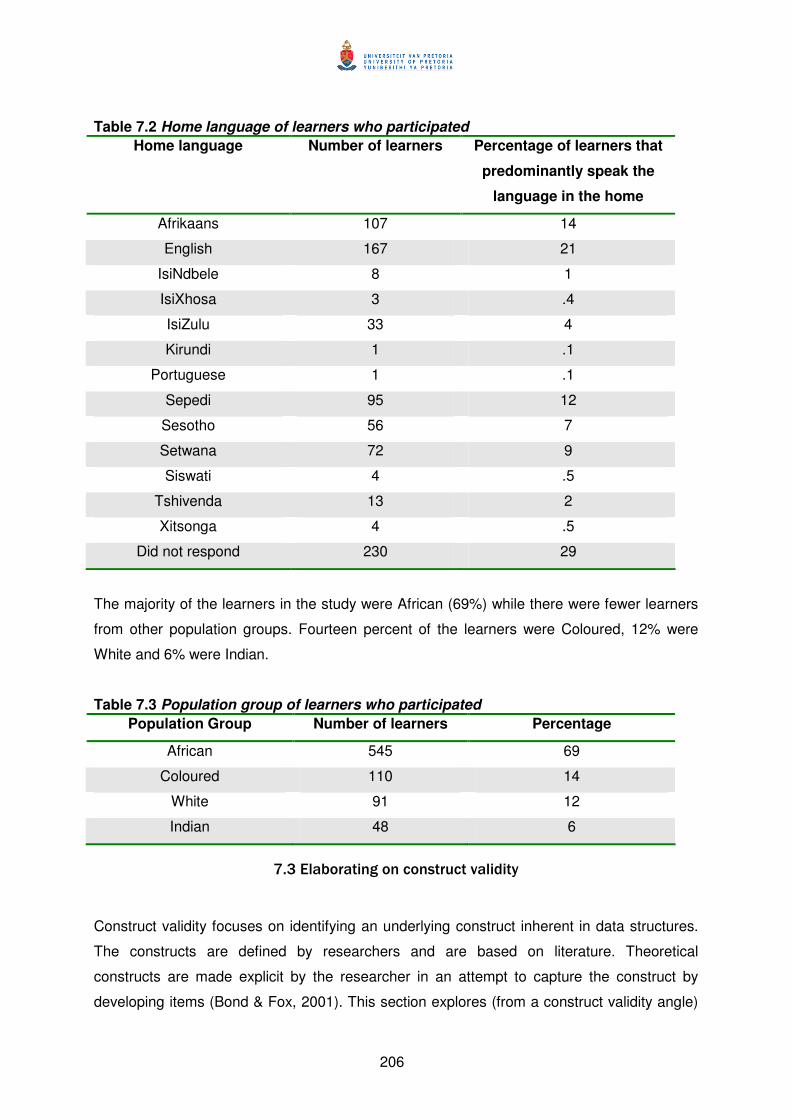
206
Table 7.2 Home language of learners who participated
Home language Number of learners Percentage of learners that
predominantly speak the
language in the home
Afrikaans 107 14
English 167 21
IsiNdbele 8 1
IsiXhosa 3 .4
IsiZulu 33 4
Kirundi 1 .1
Portuguese 1 .1
Sepedi 95 12
Sesotho 56 7
Setwana 72 9
Siswati 4 .5
Tshivenda 13 2
Xitsonga 4 .5
Did not respond 230 29
The majority of the learners in the study were African (69%) while there were fewer learners
from other population groups. Fourteen percent of the learners were Coloured, 12% were
White and 6% were Indian.
Table 7.3 Population group of learners who participated
Population Group Number of learners Percentage
African 545 69
Coloured 110 14
White 91 12
Indian 48 6
7.3 Elaborating on construct validity
Construct validity focuses on identifying an underlying construct inherent in data structures.
The constructs are defined by researchers and are based on literature. Theoretical
constructs are made explicit by the researcher in an attempt to capture the construct by
developing items (Bond & Fox, 2001). This section explores (from a construct validity angle)
207
how well the items included in the assessment are functioning. This was done by means of
Rasch modeling. The Rasch model not only contributes to inferences made about construct
validity but also provides “indicators of how well each item fits within the underlying construct”
(Bond & Fox, 2001, p. 26). This is an essential first step and forms the building blocks in
which the sub-tests are combined into the theoretical scales as identified by the CEM centre.
MidYIS has seven sub-tests, which were described in Chapter 4. The seven sub-tests are
combined to form four scales and an overall score. In the section to follow, the items are first
explored per sub-test as explained previously. Rasch analysis can be used to explore the
extent to which items form defined constructs. The sub-tests can then be combined into
scales based on the theoretical definitions identified in literature as well as the common skills
assessed. The theoretical combination of the sub-tests is akin to the idea on content-related
validity where the idea of test quality defined by content-related validity refers to some kind of
“domain definition, domain relevance, domain representation, and appropriate test
construction procedures” (Sireci, 1998, p. 101).
7.3.1 Investigating construct validity by means of Rasch analysis
The approach to the Rasch analysis was discussed in Chapter 5. For the purposes of the
analysis, a dichotomous Rasch model was used. The mean was used to centre item difficulty
estimates at zero, with a standard deviation of 1. Once the item difficulties were calibrated,
the initial person abilities were derived. The real person and real item separation was
evaluated to the estimated standard errors of measurement that were adjusted for any misfit
in the data. In addition, the real person and real item separation reliabilities were scrutinised
(Smith, 2003). The separation reliabilities are similar to measures of internal consistency in
that a value between 0 and 1 is obtained. The interpretation of the reliabilities is the same, in
that a higher value is advantageous (Andrich, 1982).
As described in Chapter 5, the INFIT and OUTFIT statistics were considered. For the
purposes of this analysis, values of 0.7 to 1.3 for the mean squares were considered
adequate (Bond & Fox, 2001; Barnard, 2004). The aim was to identify and retain the best
core items, thus, criteria that are more stringent were used. Also, Z-values derived from more
than 300 observations tend to be very sensitive in which items that should not misfit do
(Linacre, 2005).
The item number and the logit values were displayed on a continuum (Schumacker, 2004) in
order to evaluate items and odd ratios (also named odds). The odds in Rasch measurement
refers to the probability of successfully answering an item correctly divided by the probability
208
of answering the item incorrectly. The natural logarithm of the odd ratio is called natural log-
odds, which in turn are referred to as logits. In terms of items, the item difficulty in logits is the
natural log-odds of failure, where positive values indicate items that are more difficult and
negative values indicate less difficult items. The logit for person measures, on the other
hand, is the natural log-odds of success on items included in the scale or variable. A positive
value here indicates more ability, while a negative value indicates less ability. If however,
both an item and a person share the same logit location on the scale, then the person has a
50% chance of answering the item correctly (Schumacker, 2004).
The main purpose of undertaking Rasch analysis was to explore the performance of items.
Hence, the aim is to identify good items which contribute to the sub-test and poor items in the
sense that they do not contribute to the sub-test or possibly measure another trait contrary to
the trait under exploration (Barnard, 2004). The way in which good and poor items are
identified is by means of fit or misfit. An explanatory note of the fitting or misfitting of items or
persons is needed in order to provide background information on how to interpret fit and
misfit. In Rasch analysis, fit is not interpreted in the same way as in the world of
measurement where one would state that the model fits the data. Rather, fit statistics are
used to detect discrepancies between the Rasch model prescriptions and the data (Bond &
Fox, 2001). Thus when one speaks of misfitting persons this is the degree to which the
response pattern of the individual is more haphazard than the Rasch model would have
expected and therefore would be unexpected. The unexpected response pattern could
indicate more or less variation than expected. The aim is to ensure the Rasch model
expectations are met in the data, especially as it is only possible to add the equal intervals
measures together if the specifications have been met (Bond & Fox, 2001).
7.3.1.1 Vocabulary sub-test
Forty items were included in the initial analysis (for details on item level refer to Appendix L).
For both the persons and items the INFIT and OUTFIT mean squares (MNSQ) are close to 1
(refer to table 7.4 for details). The mean square statistics are used to check the compatibility
of the data with the model (Bond & Fox, 2001). The person separation reliability is .83, which
indicates that the scale does discriminate between persons while the item separation
reliability is 0.99 indicating that the items do create a well-defined variable.
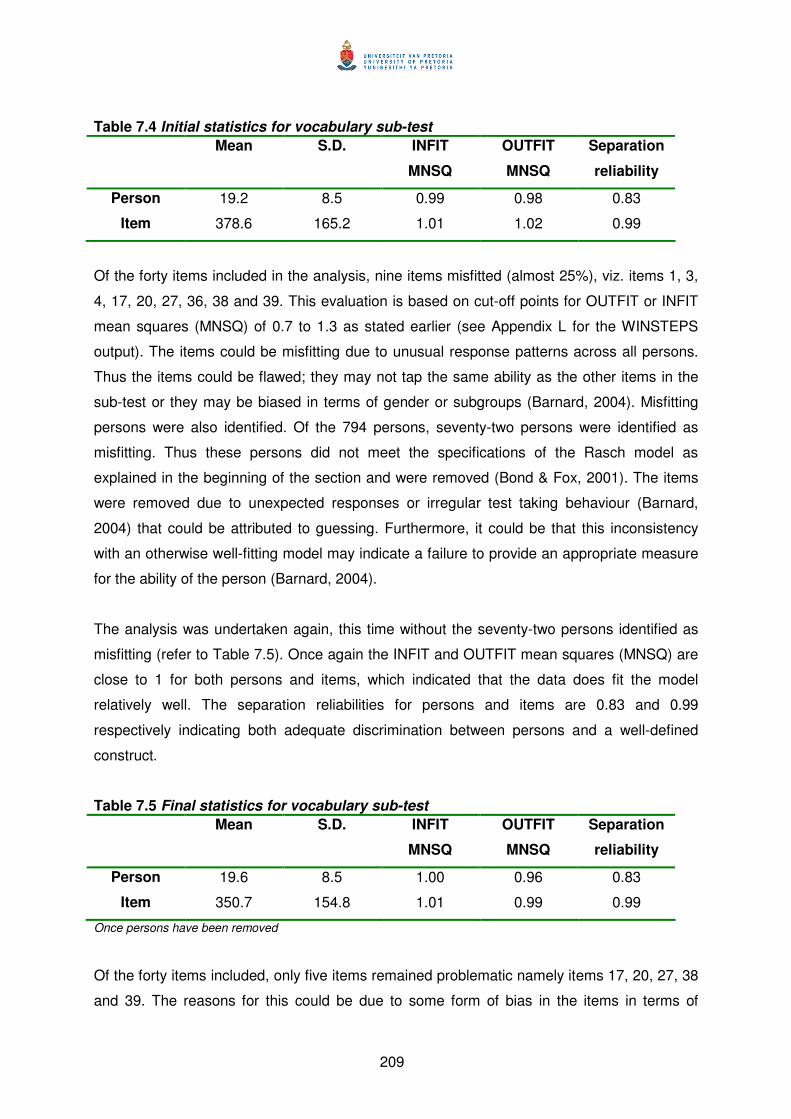
209
Table 7.4 Initial statistics for vocabulary sub-test
Mean S.D. INFIT
MNSQ
OUTFIT
MNSQ
Separation
reliability
Person 19.2 8.5 0.99 0.98 0.83
Item 378.6 165.2 1.01 1.02 0.99
Of the forty items included in the analysis, nine items misfitted (almost 25%), viz. items 1, 3,
4, 17, 20, 27, 36, 38 and 39. This evaluation is based on cut-off points for OUTFIT or INFIT
mean squares (MNSQ) of 0.7 to 1.3 as stated earlier (see Appendix L for the WINSTEPS
output). The items could be misfitting due to unusual response patterns across all persons.
Thus the items could be flawed; they may not tap the same ability as the other items in the
sub-test or they may be biased in terms of gender or subgroups (Barnard, 2004). Misfitting
persons were also identified. Of the 794 persons, seventy-two persons were identified as
misfitting. Thus these persons did not meet the specifications of the Rasch model as
explained in the beginning of the section and were removed (Bond & Fox, 2001). The items
were removed due to unexpected responses or irregular test taking behaviour (Barnard,
2004) that could be attributed to guessing. Furthermore, it could be that this inconsistency
with an otherwise well-fitting model may indicate a failure to provide an appropriate measure
for the ability of the person (Barnard, 2004).
The analysis was undertaken again, this time without the seventy-two persons identified as
misfitting (refer to Table 7.5). Once again the INFIT and OUTFIT mean squares (MNSQ) are
close to 1 for both persons and items, which indicated that the data does fit the model
relatively well. The separation reliabilities for persons and items are 0.83 and 0.99
respectively indicating both adequate discrimination between persons and a well-defined
construct.
Table 7.5 Final statistics for vocabulary sub-test
Mean S.D. INFIT
MNSQ
OUTFIT
MNSQ
Separation
reliability
Person 19.6 8.5 1.00 0.96 0.83
Item 350.7 154.8 1.01 0.99 0.99
Once persons have been removed
Of the forty items included, only five items remained problematic namely items 17, 20, 27, 38
and 39. The reasons for this could be due to some form of bias in the items in terms of
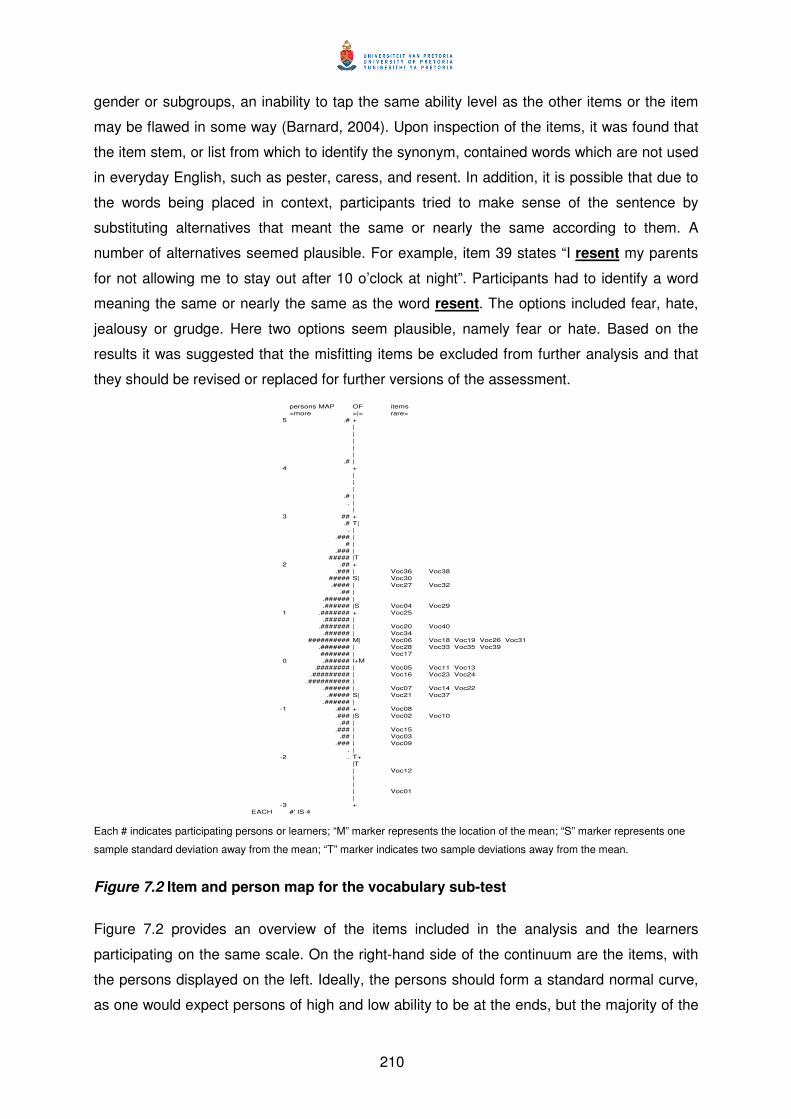
210
gender or subgroups, an inability to tap the same ability level as the other items or the item
may be flawed in some way (Barnard, 2004). Upon inspection of the items, it was found that
the item stem, or list from which to identify the synonym, contained words which are not used
in everyday English, such as pester, caress, and resent. In addition, it is possible that due to
the words being placed in context, participants tried to make sense of the sentence by
substituting alternatives that meant the same or nearly the same according to them. A
number of alternatives seemed plausible. For example, item 39 states “I resent my parents
for not allowing me to stay out after 10 o’clock at night”. Participants had to identify a word
meaning the same or nearly the same as the word resent. The options included fear, hate,
jealousy or grudge. Here two options seem plausible, namely fear or hate. Based on the
results it was suggested that the misfitting items be excluded from further analysis and that
they should be revised or replaced for further versions of the assessment.
persons MAP OF items
<more >|< rare>
5 .# +
|
|
|
|
|
.# |
4 +
|
|
|
.# |
. |
|
3 ## +
.# T|
. |
.### |
# |
.### |
##### |T
2 .## +
.### | Voc36 Voc38
##### S| Voc30
.#### | Voc27 Voc32
.## |
.###### |
.###### |S Voc04 Voc29
1 .####### + Voc25
.###### |
.####### | Voc20 Voc40
.###### | Voc34
########## M| Voc06 Voc18 Voc19 Voc26 Voc31
.####### | Voc28 Voc33 Voc35 Voc39
####### | Voc17
0 .###### l+M
.######## | Voc05 Voc11 Voc13
.######### | Voc16 Voc23 Voc24
.########## |
.###### | Voc07 Voc14 Voc22
.##### S| Voc21 Voc37
.###### |
-1 .### + Voc08
.### |S Voc02 Voc10
.## |
.### | Voc15
.## | Voc03
.### | Voc09
. |
-2 . T+
|T
| Voc12
|
|
| Voc01
|
-3 +
EACH #' IS 4
Each # indicates participating persons or learners; “M” marker represents the location of the mean; “S” marker represents one
sample standard deviation away from the mean; “T” marker indicates two sample deviations away from the mean.
Figure 7.2 Item and person map for the vocabulary sub-test
Figure 7.2 provides an overview of the items included in the analysis and the learners
participating on the same scale. On the right-hand side of the continuum are the items, with
the persons displayed on the left. Ideally, the persons should form a standard normal curve,
as one would expect persons of high and low ability to be at the ends, but the majority of the
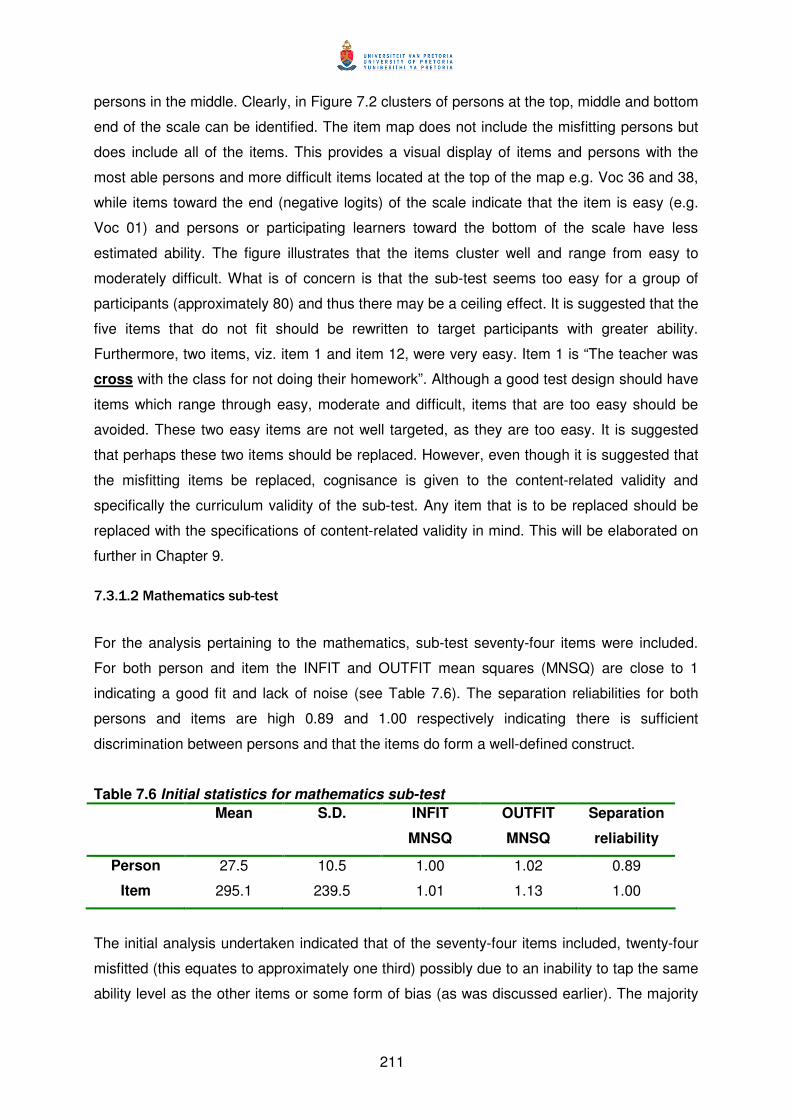
211
persons in the middle. Clearly, in Figure 7.2 clusters of persons at the top, middle and bottom
end of the scale can be identified. The item map does not include the misfitting persons but
does include all of the items. This provides a visual display of items and persons with the
most able persons and more difficult items located at the top of the map e.g. Voc 36 and 38,
while items toward the end (negative logits) of the scale indicate that the item is easy (e.g.
Voc 01) and persons or participating learners toward the bottom of the scale have less
estimated ability. The figure illustrates that the items cluster well and range from easy to
moderately difficult. What is of concern is that the sub-test seems too easy for a group of
participants (approximately 80) and thus there may be a ceiling effect. It is suggested that the
five items that do not fit should be rewritten to target participants with greater ability.
Furthermore, two items, viz. item 1 and item 12, were very easy. Item 1 is “The teacher was
cross with the class for not doing their homework”. Although a good test design should have
items which range through easy, moderate and difficult, items that are too easy should be
avoided. These two easy items are not well targeted, as they are too easy. It is suggested
that perhaps these two items should be replaced. However, even though it is suggested that
the misfitting items be replaced, cognisance is given to the content-related validity and
specifically the curriculum validity of the sub-test. Any item that is to be replaced should be
replaced with the specifications of content-related validity in mind. This will be elaborated on
further in Chapter 9.
7.3.1.2 Mathematics sub-test
For the analysis pertaining to the mathematics, sub-test seventy-four items were included.
For both person and item the INFIT and OUTFIT mean squares (MNSQ) are close to 1
indicating a good fit and lack of noise (see Table 7.6). The separation reliabilities for both
persons and items are high 0.89 and 1.00 respectively indicating there is sufficient
discrimination between persons and that the items do form a well-defined construct.
Table 7.6 Initial statistics for mathematics sub-test
Mean S.D. INFIT
MNSQ
OUTFIT
MNSQ
Separation
reliability
Person 27.5 10.5 1.00 1.02 0.89
Item 295.1 239.5 1.01 1.13 1.00
The initial analysis undertaken indicated that of the seventy-four items included, twenty-four
misfitted (this equates to approximately one third) possibly due to an inability to tap the same
ability level as the other items or some form of bias (as was discussed earlier). The majority
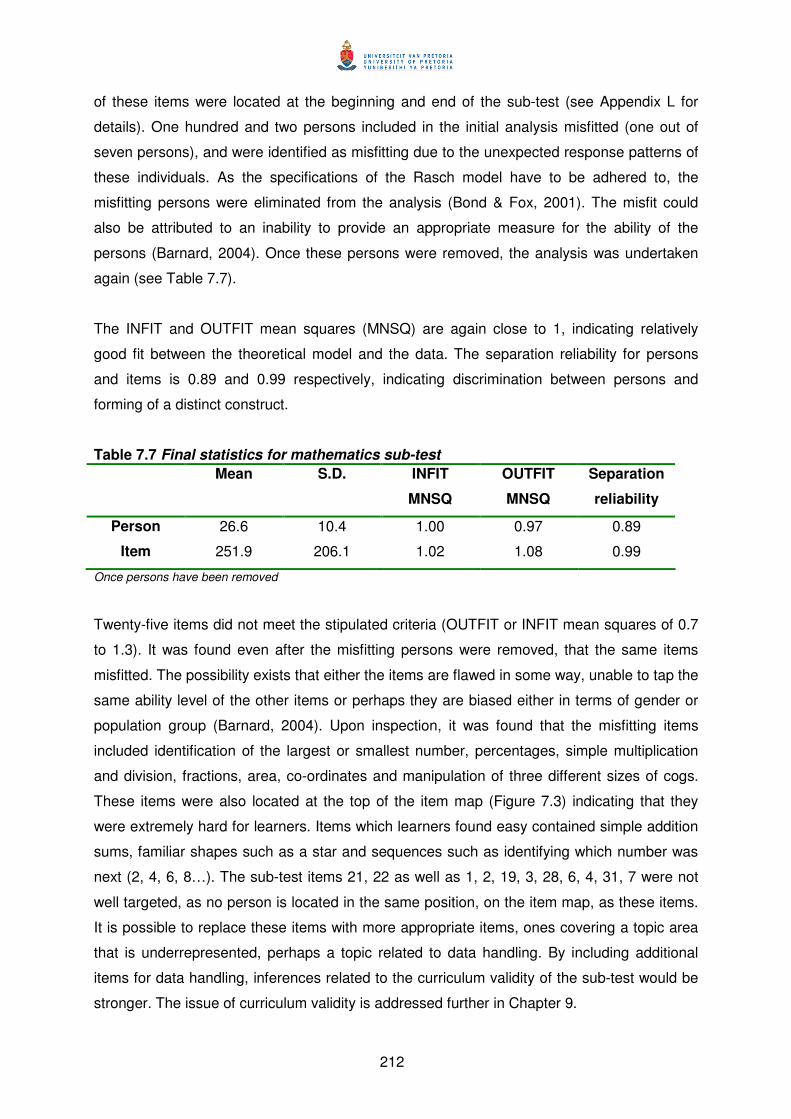
212
of these items were located at the beginning and end of the sub-test (see Appendix L for
details). One hundred and two persons included in the initial analysis misfitted (one out of
seven persons), and were identified as misfitting due to the unexpected response patterns of
these individuals. As the specifications of the Rasch model have to be adhered to, the
misfitting persons were eliminated from the analysis (Bond & Fox, 2001). The misfit could
also be attributed to an inability to provide an appropriate measure for the ability of the
persons (Barnard, 2004). Once these persons were removed, the analysis was undertaken
again (see Table 7.7).
The INFIT and OUTFIT mean squares (MNSQ) are again close to 1, indicating relatively
good fit between the theoretical model and the data. The separation reliability for persons
and items is 0.89 and 0.99 respectively, indicating discrimination between persons and
forming of a distinct construct.
Table 7.7 Final statistics for mathematics sub-test
Mean S.D. INFIT
MNSQ
OUTFIT
MNSQ
Separation
reliability
Person 26.6 10.4 1.00 0.97 0.89
Item 251.9 206.1 1.02 1.08 0.99
Once persons have been removed
Twenty-five items did not meet the stipulated criteria (OUTFIT or INFIT mean squares of 0.7
to 1.3). It was found even after the misfitting persons were removed, that the same items
misfitted. The possibility exists that either the items are flawed in some way, unable to tap the
same ability level of the other items or perhaps they are biased either in terms of gender or
population group (Barnard, 2004). Upon inspection, it was found that the misfitting items
included identification of the largest or smallest number, percentages, simple multiplication
and division, fractions, area, co-ordinates and manipulation of three different sizes of cogs.
These items were also located at the top of the item map (Figure 7.3) indicating that they
were extremely hard for learners. Items which learners found easy contained simple addition
sums, familiar shapes such as a star and sequences such as identifying which number was
next (2, 4, 6, 8…). The sub-test items 21, 22 as well as 1, 2, 19, 3, 28, 6, 4, 31, 7 were not
well targeted, as no person is located in the same position, on the item map, as these items.
It is possible to replace these items with more appropriate items, ones covering a topic area
that is underrepresented, perhaps a topic related to data handling. By including additional
items for data handling, inferences related to the curriculum validity of the sub-test would be
stronger. The issue of curriculum validity is addressed further in Chapter 9.
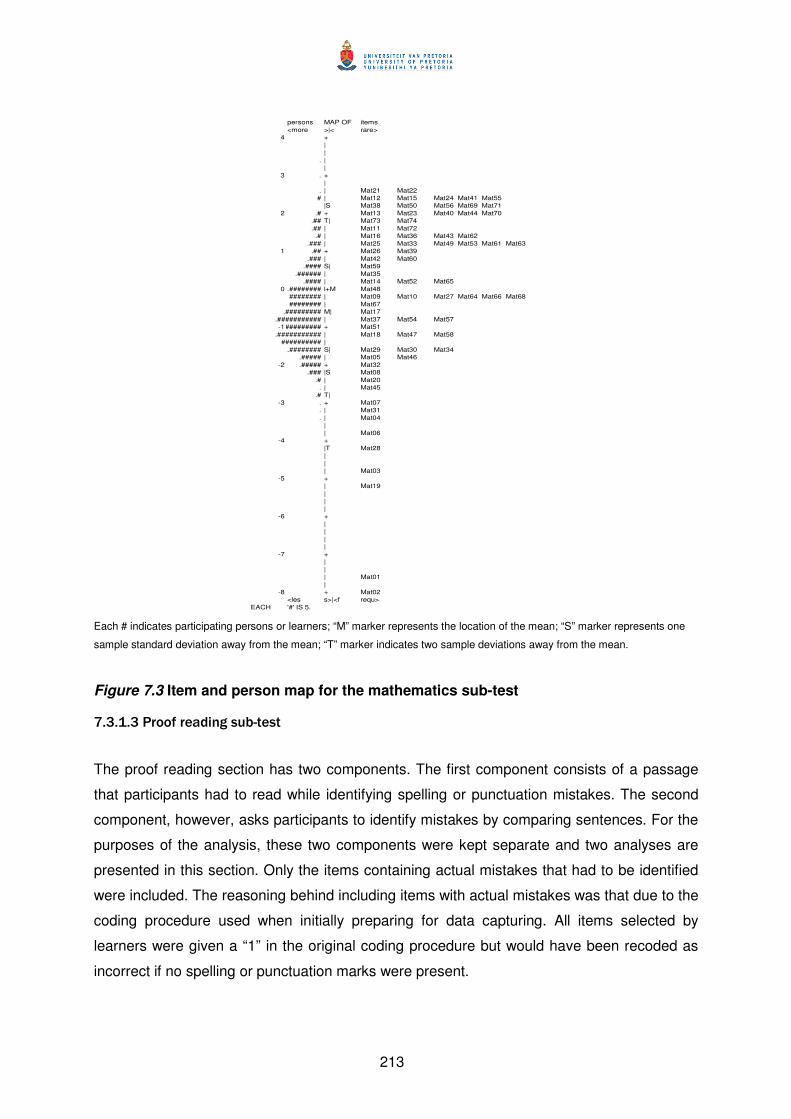
213
persons MAP OF items
<more >|< rare>
4 +
|
|
. |
|
3 . +
|
. | Mat21 Mat22
# | Mat12 Mat15 Mat24 Mat41 Mat55
|S Mat38 Mat50 Mat56 Mat69 Mat71
2 .# + Mat13 Mat23 Mat40 Mat44 Mat70
.## T| Mat73 Mat74
.## | Mat11 Mat72
.# | Mat16 Mat36 Mat43 Mat62
.### | Mat25 Mat33 Mat49 Mat53 Mat61 Mat63
1 .## + Mat26 Mat39
.### | Mat42 Mat60
.#### S| Mat59
.###### | Mat35
.#### | Mat14 Mat52 Mat65
0 .######## l+M Mat48
######## | Mat09 Mat10 Mat27 Mat64 Mat66 Mat68
######## | Mat67
.######### M| Mat17
.########### | Mat37 Mat54 Mat57
-1########## + Mat51
.########### | Mat18 Mat47 Mat58
########## |
.######## S| Mat29 Mat30 Mat34
.##### | Mat05 Mat46
-2 .##### + Mat32
.### |S Mat08
.# | Mat20
. | Mat45
.# T|
-3 . + Mat07
. | Mat31
. | Mat04
|
| Mat06
-4 +
|T Mat28
|
|
| Mat03
-5 +
| Mat19
|
|
|
-6 +
|
|
|
|
-7 +
|
|
| Mat01
|
-8 + Mat02
<les s>|<f requ>
EACH '#' IS 5.
Each # indicates participating persons or learners; “M” marker represents the location of the mean; “S” marker represents one
sample standard deviation away from the mean; “T” marker indicates two sample deviations away from the mean.
Figure 7.3 Item and person map for the mathematics sub-test
7.3.1.3 Proof reading sub-test
The proof reading section has two components. The first component consists of a passage
that participants had to read while identifying spelling or punctuation mistakes. The second
component, however, asks participants to identify mistakes by comparing sentences. For the
purposes of the analysis, these two components were kept separate and two analyses are
presented in this section. Only the items containing actual mistakes that had to be identified
were included. The reasoning behind including items with actual mistakes was that due to the
coding procedure used when initially preparing for data capturing. All items selected by
learners were given a “1” in the original coding procedure but would have been recoded as
incorrect if no spelling or punctuation marks were present.
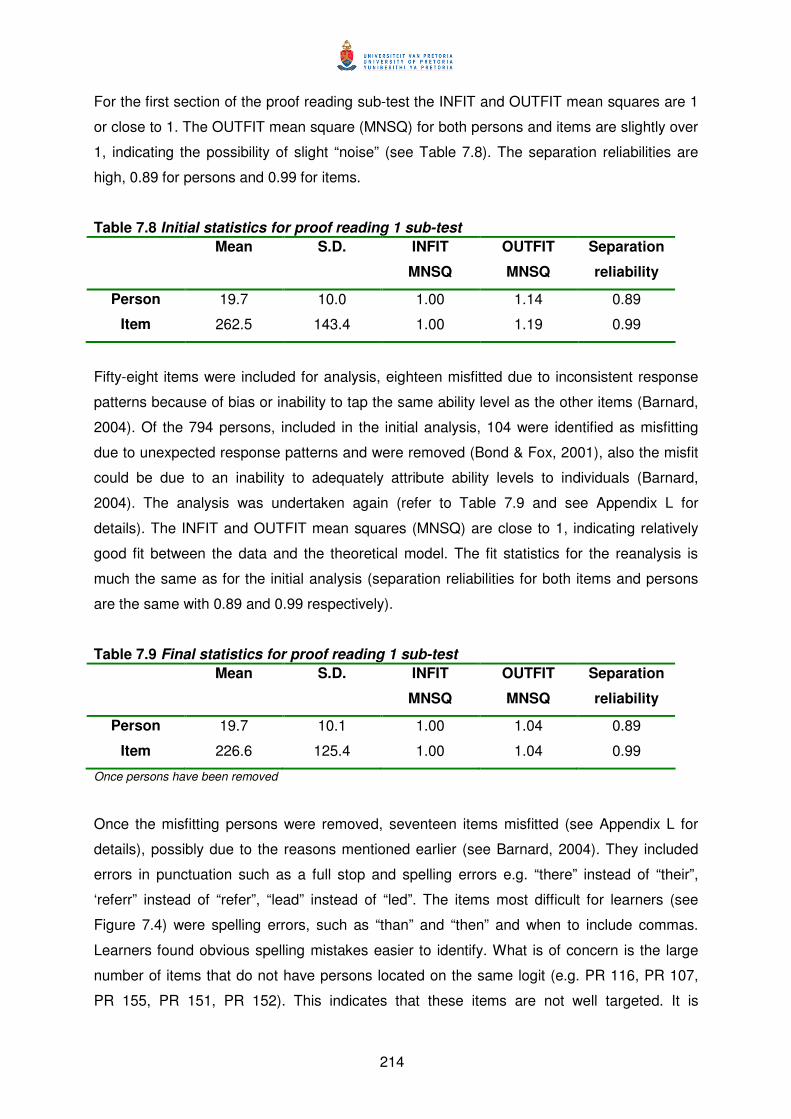
214
For the first section of the proof reading sub-test the INFIT and OUTFIT mean squares are 1
or close to 1. The OUTFIT mean square (MNSQ) for both persons and items are slightly over
1, indicating the possibility of slight “noise” (see Table 7.8). The separation reliabilities are
high, 0.89 for persons and 0.99 for items.
Table 7.8 Initial statistics for proof reading 1 sub-test
Mean S.D. INFIT
MNSQ
OUTFIT
MNSQ
Separation
reliability
Person 19.7 10.0 1.00 1.14 0.89
Item 262.5 143.4 1.00 1.19 0.99
Fifty-eight items were included for analysis, eighteen misfitted due to inconsistent response
patterns because of bias or inability to tap the same ability level as the other items (Barnard,
2004). Of the 794 persons, included in the initial analysis, 104 were identified as misfitting
due to unexpected response patterns and were removed (Bond & Fox, 2001), also the misfit
could be due to an inability to adequately attribute ability levels to individuals (Barnard,
2004). The analysis was undertaken again (refer to Table 7.9 and see Appendix L for
details). The INFIT and OUTFIT mean squares (MNSQ) are close to 1, indicating relatively
good fit between the data and the theoretical model. The fit statistics for the reanalysis is
much the same as for the initial analysis (separation reliabilities for both items and persons
are the same with 0.89 and 0.99 respectively).
Table 7.9 Final statistics for proof reading 1 sub-test
Mean S.D. INFIT
MNSQ
OUTFIT
MNSQ
Separation
reliability
Person 19.7 10.1 1.00 1.04 0.89
Item 226.6 125.4 1.00 1.04 0.99
Once persons have been removed
Once the misfitting persons were removed, seventeen items misfitted (see Appendix L for
details), possibly due to the reasons mentioned earlier (see Barnard, 2004). They included
errors in punctuation such as a full stop and spelling errors e.g. “there” instead of “their”,
‘referr” instead of “refer”, “lead” instead of “led”. The items most difficult for learners (see
Figure 7.4) were spelling errors, such as “than” and “then” and when to include commas.
Learners found obvious spelling mistakes easier to identify. What is of concern is the large
number of items that do not have persons located on the same logit (e.g. PR 116, PR 107,
PR 155, PR 151, PR 152). This indicates that these items are not well targeted. It is
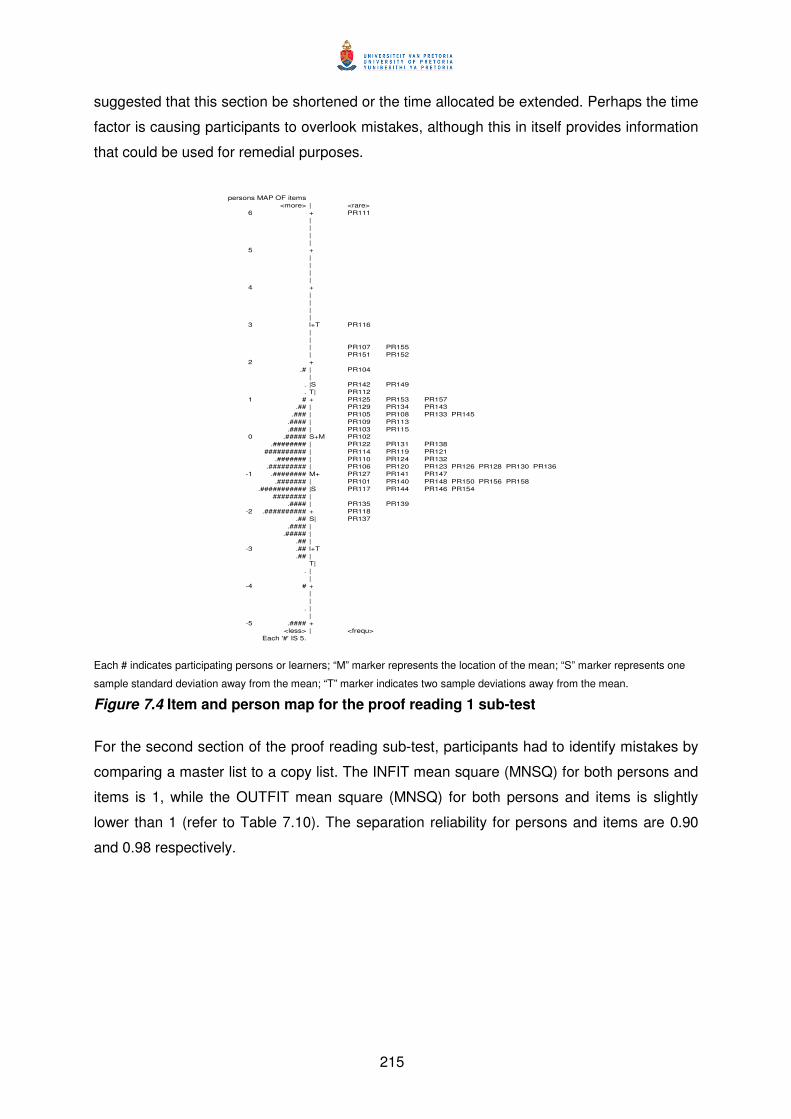
215
suggested that this section be shortened or the time allocated be extended. Perhaps the time
factor is causing participants to overlook mistakes, although this in itself provides information
that could be used for remedial purposes.
persons MAP OF items
<more> | <rare>
6 + PR111
|
|
|
|
5 +
|
|
|
|
4 +
|
|
|
|
3 l+T PR116
|
|
| PR107 PR155
| PR151 PR152
2 +
.# | PR104
|
. |S PR142 PR149
. T| PR112
1 # + PR125 PR153 PR157
.## | PR129 PR134 PR143
.### | PR105 PR108 PR133 PR145
.#### | PR109 PR113
.#### | PR103 PR115
0 .##### S+M PR102
.######## | PR122 PR131 PR138
########## | PR114 PR119 PR121
.####### | PR110 PR124 PR132
.######### | PR106 PR120 PR123 PR126 PR128 PR130 PR136
-1 .######## M+ PR127 PR141 PR147
.####### | PR101 PR140 PR148 PR150 PR156 PR158
.########### |S PR117 PR144 PR146 PR154
######## |
.#### | PR135 PR139
-2 .########## + PR118
.## S| PR137
.#### |
.##### |
.## |
-3 .## l+T
.## |
T|
. |
|
-4 # +
|
|
. |
|
-5 .#### +
<less> | <frequ>
Each '#' IS 5.
Each # indicates participating persons or learners; “M” marker represents the location of the mean; “S” marker represents one
sample standard deviation away from the mean; “T” marker indicates two sample deviations away from the mean.
Figure 7.4 Item and person map for the proof reading 1 sub-test
For the second section of the proof reading sub-test, participants had to identify mistakes by
comparing a master list to a copy list. The INFIT mean square (MNSQ) for both persons and
items is 1, while the OUTFIT mean square (MNSQ) for both persons and items is slightly
lower than 1 (refer to Table 7.10). The separation reliability for persons and items are 0.90
and 0.98 respectively.
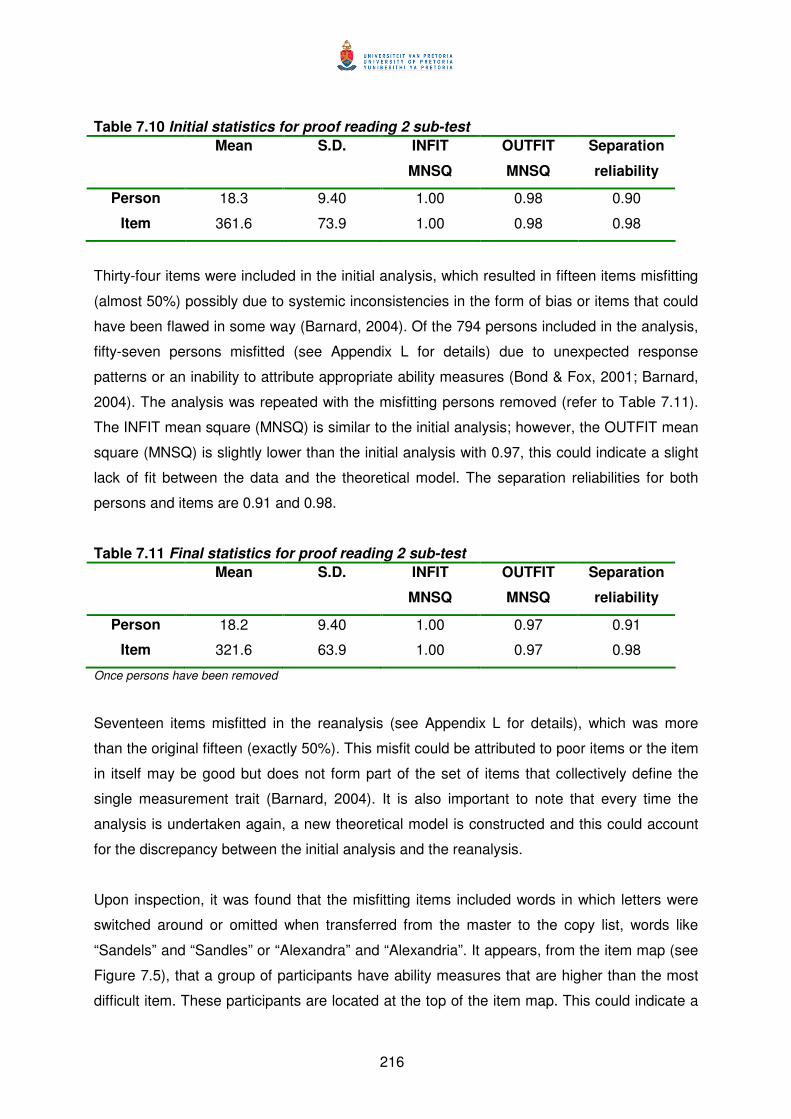
216
Table 7.10 Initial statistics for proof reading 2 sub-test
Mean S.D. INFIT
MNSQ
OUTFIT
MNSQ
Separation
reliability
Person 18.3 9.40 1.00 0.98 0.90
Item 361.6 73.9 1.00 0.98 0.98
Thirty-four items were included in the initial analysis, which resulted in fifteen items misfitting
(almost 50%) possibly due to systemic inconsistencies in the form of bias or items that could
have been flawed in some way (Barnard, 2004). Of the 794 persons included in the analysis,
fifty-seven persons misfitted (see Appendix L for details) due to unexpected response
patterns or an inability to attribute appropriate ability measures (Bond & Fox, 2001; Barnard,
2004). The analysis was repeated with the misfitting persons removed (refer to Table 7.11).
The INFIT mean square (MNSQ) is similar to the initial analysis; however, the OUTFIT mean
square (MNSQ) is slightly lower than the initial analysis with 0.97, this could indicate a slight
lack of fit between the data and the theoretical model. The separation reliabilities for both
persons and items are 0.91 and 0.98.
Table 7.11 Final statistics for proof reading 2 sub-test
Mean S.D. INFIT
MNSQ
OUTFIT
MNSQ
Separation
reliability
Person 18.2 9.40 1.00 0.97 0.91
Item 321.6 63.9 1.00 0.97 0.98
Once persons have been removed
Seventeen items misfitted in the reanalysis (see Appendix L for details), which was more
than the original fifteen (exactly 50%). This misfit could be attributed to poor items or the item
in itself may be good but does not form part of the set of items that collectively define the
single measurement trait (Barnard, 2004). It is also important to note that every time the
analysis is undertaken again, a new theoretical model is constructed and this could account
for the discrepancy between the initial analysis and the reanalysis.
Upon inspection, it was found that the misfitting items included words in which letters were
switched around or omitted when transferred from the master to the copy list, words like
“Sandels” and “Sandles” or “Alexandra” and “Alexandria”. It appears, from the item map (see
Figure 7.5), that a group of participants have ability measures that are higher than the most
difficult item. These participants are located at the top of the item map. This could indicate a
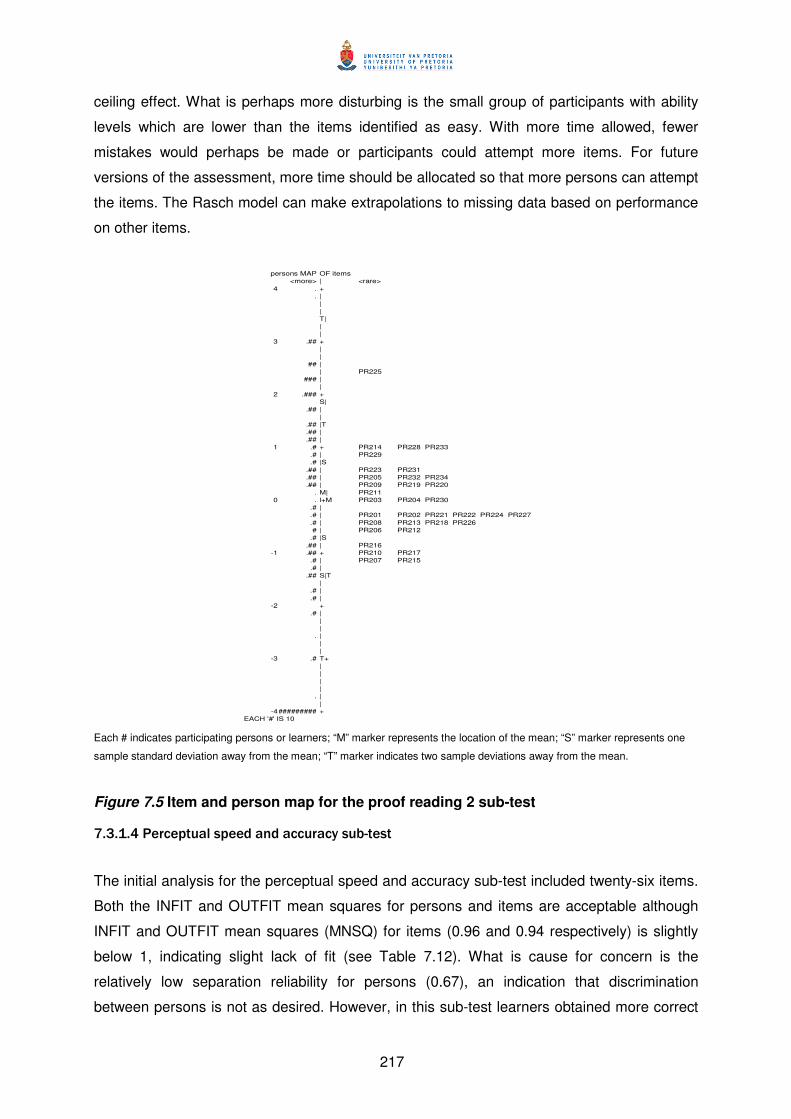
217
ceiling effect. What is perhaps more disturbing is the small group of participants with ability
levels which are lower than the items identified as easy. With more time allowed, fewer
mistakes would perhaps be made or participants could attempt more items. For future
versions of the assessment, more time should be allocated so that more persons can attempt
the items. The Rasch model can make extrapolations to missing data based on performance
on other items.
persons MAP OF items
<more> | <rare>
4 . +
. |
|
|
T|
|
|
3 .## +
|
|
## |
| PR225
### |
|
2 .### +
S|
.## |
|
.## |T
.## |
.## |
1 .# + PR214 PR228 PR233
.# | PR229
.# |S
.## | PR223 PR231
.## | PR205 PR232 PR234
.## | PR209 PR219 PR220
. M| PR211
0 . l+M PR203 PR204 PR230
.# |
.# | PR201 PR202 PR221 PR222 PR224 PR227
.# | PR208 PR213 PR218 PR226
# | PR206 PR212
.# |S
.## | PR216
-1 .## + PR210 PR217
.# | PR207 PR215
.# |
.## S|T
|
.# |
.# |
-2 +
.# |
|
|
. |
|
|
-3 .# T+
|
|
|
|
. |
|
-4############ +
EACH '#' IS 10
Each # indicates participating persons or learners; “M” marker represents the location of the mean; “S” marker represents one
sample standard deviation away from the mean; “T” marker indicates two sample deviations away from the mean.
Figure 7.5 Item and person map for the proof reading 2 sub-test
7.3.1.4 Perceptual speed and accuracy sub-test
The initial analysis for the perceptual speed and accuracy sub-test included twenty-six items.
Both the INFIT and OUTFIT mean squares for persons and items are acceptable although
INFIT and OUTFIT mean squares (MNSQ) for items (0.96 and 0.94 respectively) is slightly
below 1, indicating slight lack of fit (see Table 7.12). What is cause for concern is the
relatively low separation reliability for persons (0.67), an indication that discrimination
between persons is not as desired. However, in this sub-test learners obtained more correct
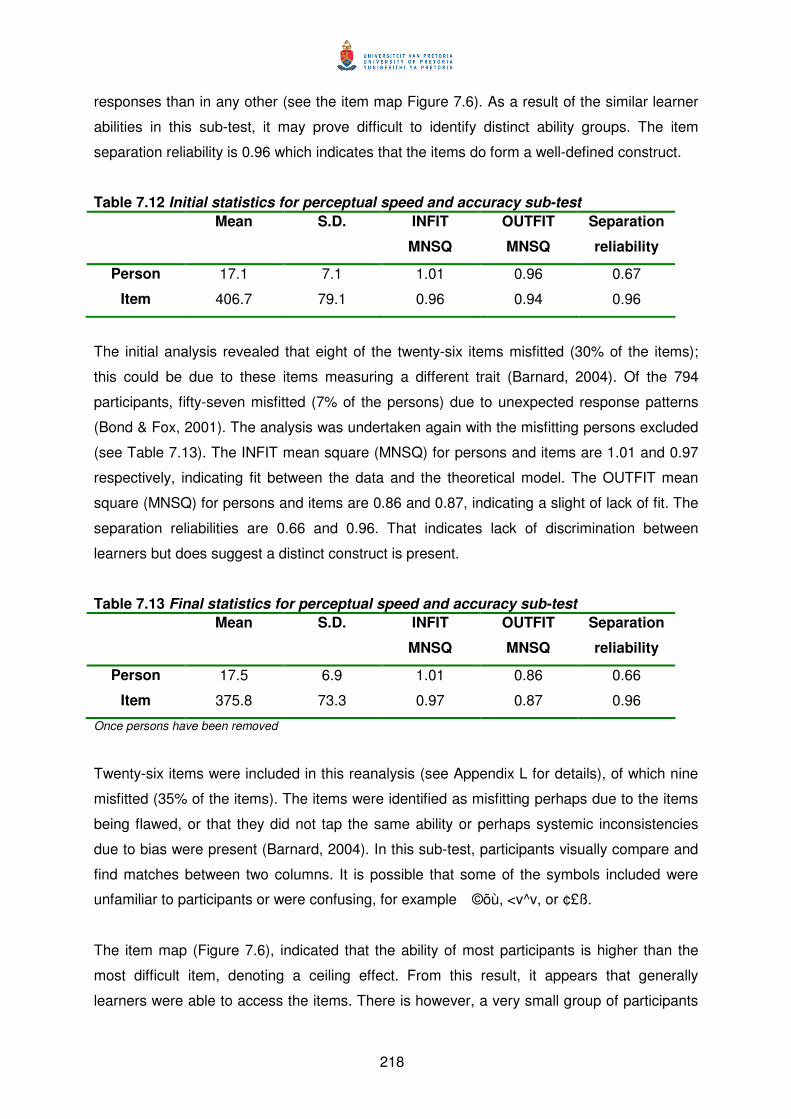
218
responses than in any other (see the item map Figure 7.6). As a result of the similar learner
abilities in this sub-test, it may prove difficult to identify distinct ability groups. The item
separation reliability is 0.96 which indicates that the items do form a well-defined construct.
Table 7.12 Initial statistics for perceptual speed and accuracy sub-test
Mean S.D. INFIT
MNSQ
OUTFIT
MNSQ
Separation
reliability
Person 17.1 7.1 1.01 0.96 0.67
Item 406.7 79.1 0.96 0.94 0.96
The initial analysis revealed that eight of the twenty-six items misfitted (30% of the items);
this could be due to these items measuring a different trait (Barnard, 2004). Of the 794
participants, fifty-seven misfitted (7% of the persons) due to unexpected response patterns
(Bond & Fox, 2001). The analysis was undertaken again with the misfitting persons excluded
(see Table 7.13). The INFIT mean square (MNSQ) for persons and items are 1.01 and 0.97
respectively, indicating fit between the data and the theoretical model. The OUTFIT mean
square (MNSQ) for persons and items are 0.86 and 0.87, indicating a slight of lack of fit. The
separation reliabilities are 0.66 and 0.96. That indicates lack of discrimination between
learners but does suggest a distinct construct is present.
Table 7.13 Final statistics for perceptual speed and accuracy sub-test
Mean S.D. INFIT
MNSQ
OUTFIT
MNSQ
Separation
reliability
Person 17.5 6.9 1.01 0.86 0.66
Item 375.8 73.3 0.97 0.87 0.96
Once persons have been removed
Twenty-six items were included in this reanalysis (see Appendix L for details), of which nine
misfitted (35% of the items). The items were identified as misfitting perhaps due to the items
being flawed, or that they did not tap the same ability or perhaps systemic inconsistencies
due to bias were present (Barnard, 2004). In this sub-test, participants visually compare and
find matches between two columns. It is possible that some of the symbols included were
unfamiliar to participants or were confusing, for example �©õù, <v^v, or ¢£ß.
The item map (Figure 7.6), indicated that the ability of most participants is higher than the
most difficult item, denoting a ceiling effect. From this result, it appears that generally
learners were able to access the items. There is however, a very small group of participants
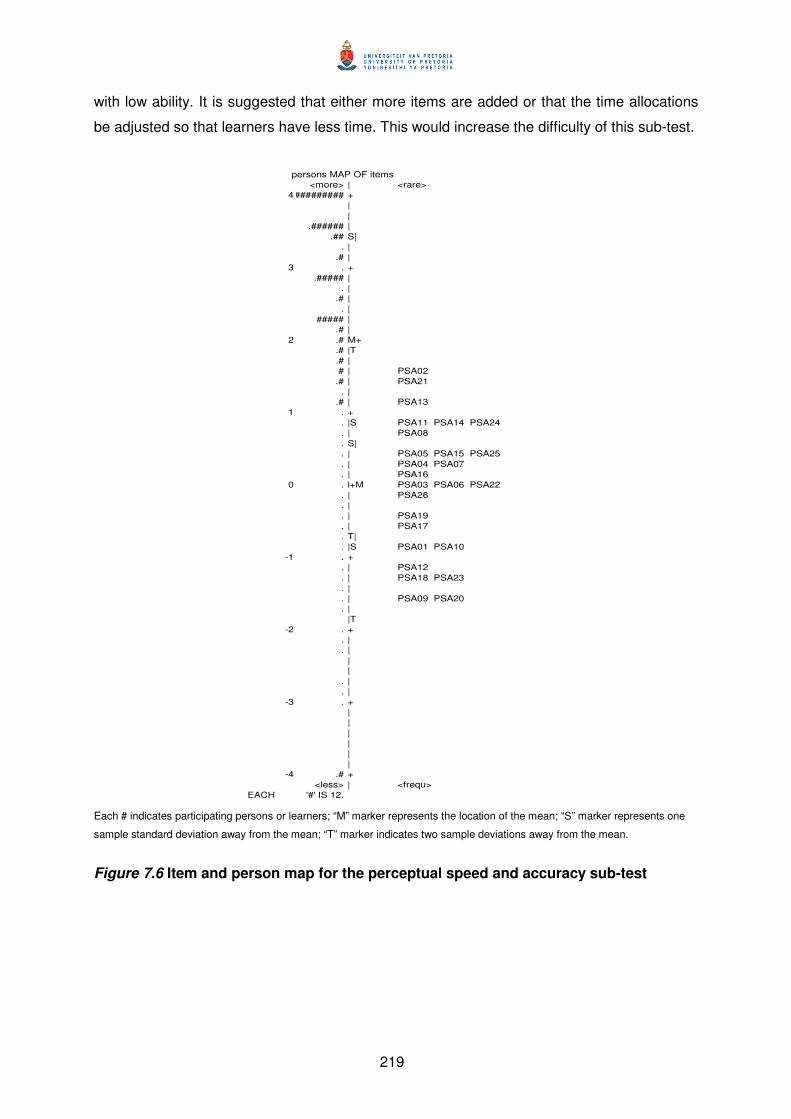
219
with low ability. It is suggested that either more items are added or that the time allocations
be adjusted so that learners have less time. This would increase the difficulty of this sub-test.
persons MAP OF items
<more> | <rare>
4.############ +
|
|
.###### |
.## S|
. |
.# |
3 . +
.##### |
. |
.# |
. |
##### |
.# |
2 .# M+
.# |T
.# |
# | PSA02
.# | PSA21
. |
.# | PSA13
1 . +
. |S PSA11 PSA14 PSA24
. | PSA08
. S|
. | PSA05 PSA15 PSA25
. | PSA04 PSA07
. | PSA16
0 . l+M PSA03 PSA06 PSA22
. | PSA26
. |
. | PSA19
. | PSA17
. T|
. |S PSA01 PSA10
-1 . +
. | PSA12
. | PSA18 PSA23
. |
. | PSA09 PSA20
. |
|T
-2 . +
. |
. |
|
|
. |
. |
-3 . +
|
|
|
|
|
|
-4 .# +
<less> | <frequ>
EACH '#' IS 12.
Each # indicates participating persons or learners; “M” marker represents the location of the mean; “S” marker represents one
sample standard deviation away from the mean; “T” marker indicates two sample deviations away from the mean.
Figure 7.6 Item and person map for the perceptual speed and accuracy sub-test
220
7.3.1.5 Cross-sections sub-test
Sixteen items are included in the cross-sections sub-test of the assessment. As with the
other sub-tests, the INFIT and OUTFIT mean squares (MNSQ) are close to 1, indicating good
fit and lack of noise (see Table 7.14). The separation reliability for items is excellent, 0.99,
indicating a well-defined construct. The separation reliability for persons, however, is
relatively low at 0.54, especially in comparison with other sub-tests, which indicates that the
discrimination between persons is not what it should be. Learners did not fare well in this
particular sub-test and it is likely that clearly defined ability groups would be difficult to
identify.
Table 7.14 Initial statistics for cross-sections sub-test
Mean S.D. INFIT
MNSQ
OUTFIT
MNSQ
Separation
reliability
Person 7.5 2.8 0.99 1.09 0.54
Item 360.2 157.4 0.99 1.09 0.99
In the cross-sections sub-test, participants are requested to identify the 2D shape that would
result if a 3D shape were cut through. Of the sixteen items, only two misfitted (see Appendix
L for details) which could indicate a flaw in the items (Barnard, 2004). Eighty-one persons
misfitted, due to unexpected response patterns because of either too little variation or too
much variation in responses (Bond & Fox, 2001). The analysis was undertaken again without
these persons (refer to Table 7.15). The INFIT and OUTFIT mean squares (MNSQ) are close
to 1, indicating good fit between the theoretical model and the data. The separation
reliabilities for persons and items are 0.50 and 0.99 respectively, indicating lack of
discrimination between participants even though the construct itself appears sound. It is
possible that the person separation is affected, as 10% of the total sample was removed due
to unexpected response patterns. However, these persons had to be removed, as they did
not adhere to the specifications of the model.
Table 7.15 Final statistics for cross-sections sub-test
Mean S.D. INFIT
MNSQ
OUTFIT
MNSQ
Separation
reliability
Person 7.5 2.87 1.01 0.98 0.50
Item 323.6 147.5 0.99 0.98 0.99
Once persons have been removed
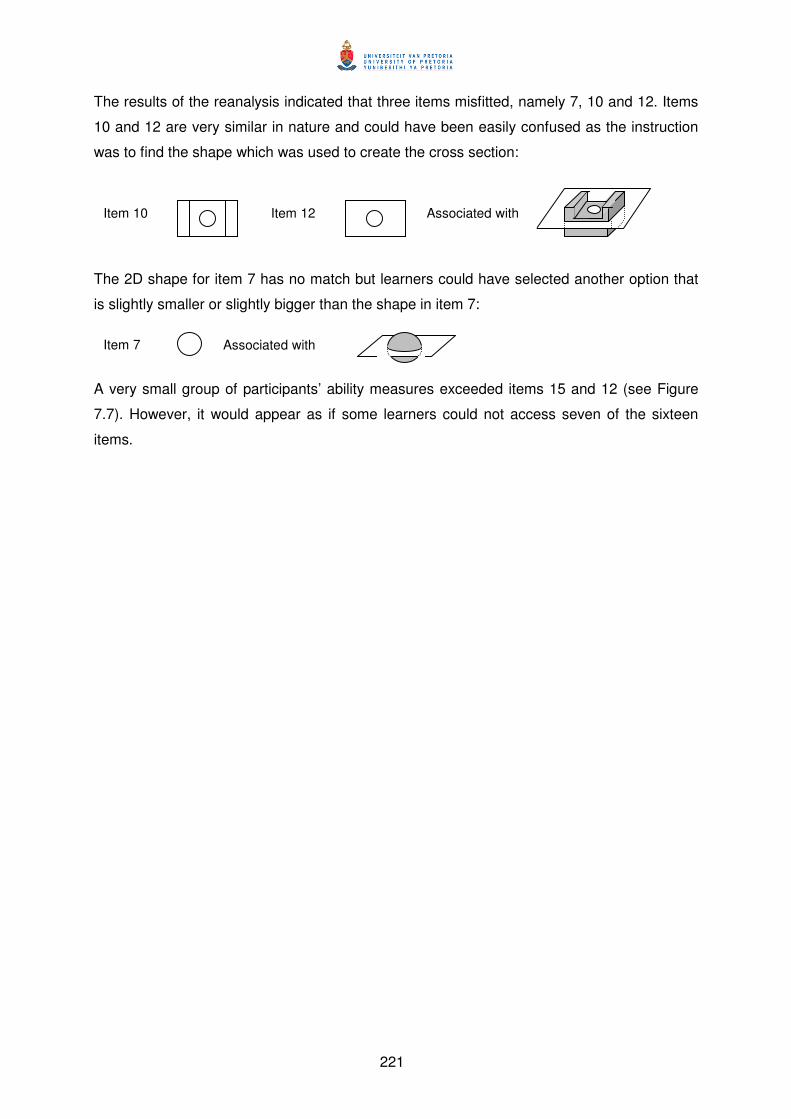
221
The results of the reanalysis indicated that three items misfitted, namely 7, 10 and 12. Items
10 and 12 are very similar in nature and could have been easily confused as the instruction
was to find the shape which was used to create the cross section:
The 2D shape for item 7 has no match but learners could have selected another option that
is slightly smaller or slightly bigger than the shape in item 7:
A very small group of participants’ ability measures exceeded items 15 and 12 (see Figure
7.7). However, it would appear as if some learners could not access seven of the sixteen
items.
Item 12 Item 10
Associated with
Item 7 Associated with
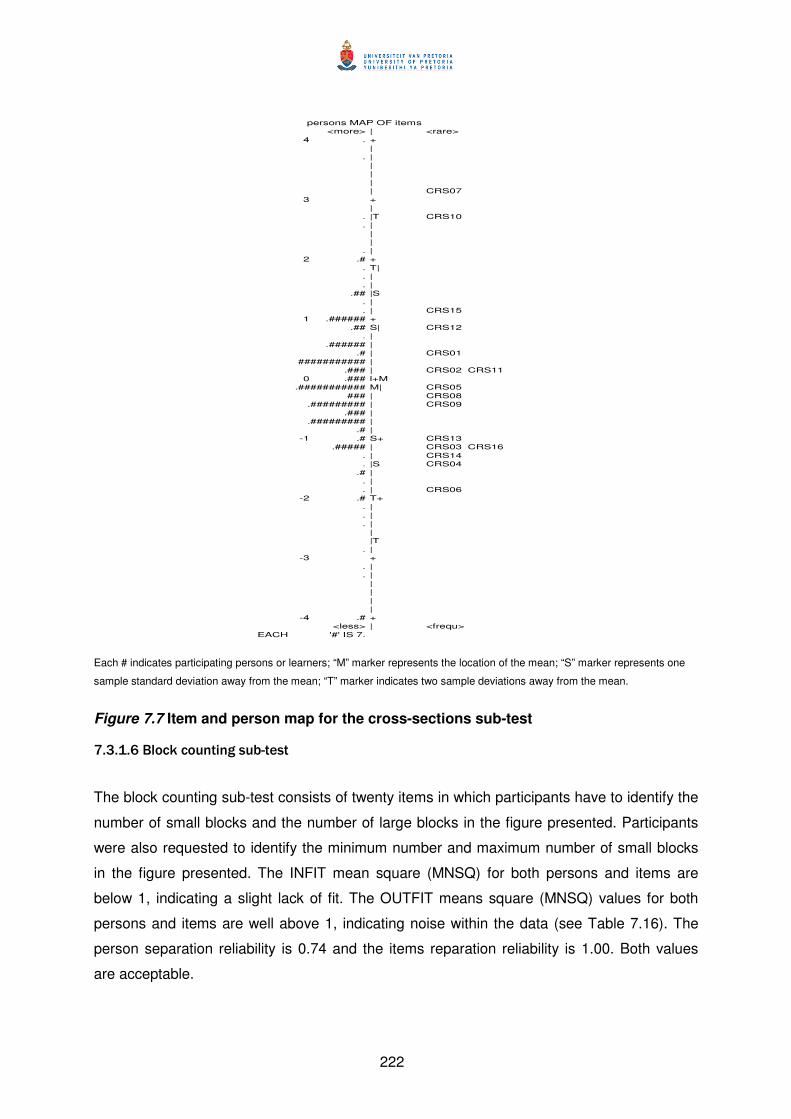
222
persons MAP OF items
<more> | <rare>
4 . +
|
. |
|
|
|
| CRS07
3 +
|
. |T CRS10
. |
|
|
. |
2 .# +
. T|
. |
. |
.## |S
. |
. | CRS15
1 .###### +
.## S| CRS12
. |
.###### |
.# | CRS01
########### |
.### | CRS02 CRS11
0 .### l+M
.########### M| CRS05
### | CRS08
.######### | CRS09
.### |
.######### |
.# |
-1 .# S+ CRS13
.##### | CRS03 CRS16
. | CRS14
. |S CRS04
.# |
. |
. | CRS06
-2 .# T+
. |
. |
. |
|
|T
. |
-3 +
. |
. |
|
|
|
|
-4 .# +
<less> | <frequ>
EACH '#' IS 7.
Each # indicates participating persons or learners; “M” marker represents the location of the mean; “S” marker represents one
sample standard deviation away from the mean; “T” marker indicates two sample deviations away from the mean.
Figure 7.7 Item and person map for the cross-sections sub-test
7.3.1.6 Block counting sub-test
The block counting sub-test consists of twenty items in which participants have to identify the
number of small blocks and the number of large blocks in the figure presented. Participants
were also requested to identify the minimum number and maximum number of small blocks
in the figure presented. The INFIT mean square (MNSQ) for both persons and items are
below 1, indicating a slight lack of fit. The OUTFIT means square (MNSQ) values for both
persons and items are well above 1, indicating noise within the data (see Table 7.16). The
person separation reliability is 0.74 and the items reparation reliability is 1.00. Both values
are acceptable.
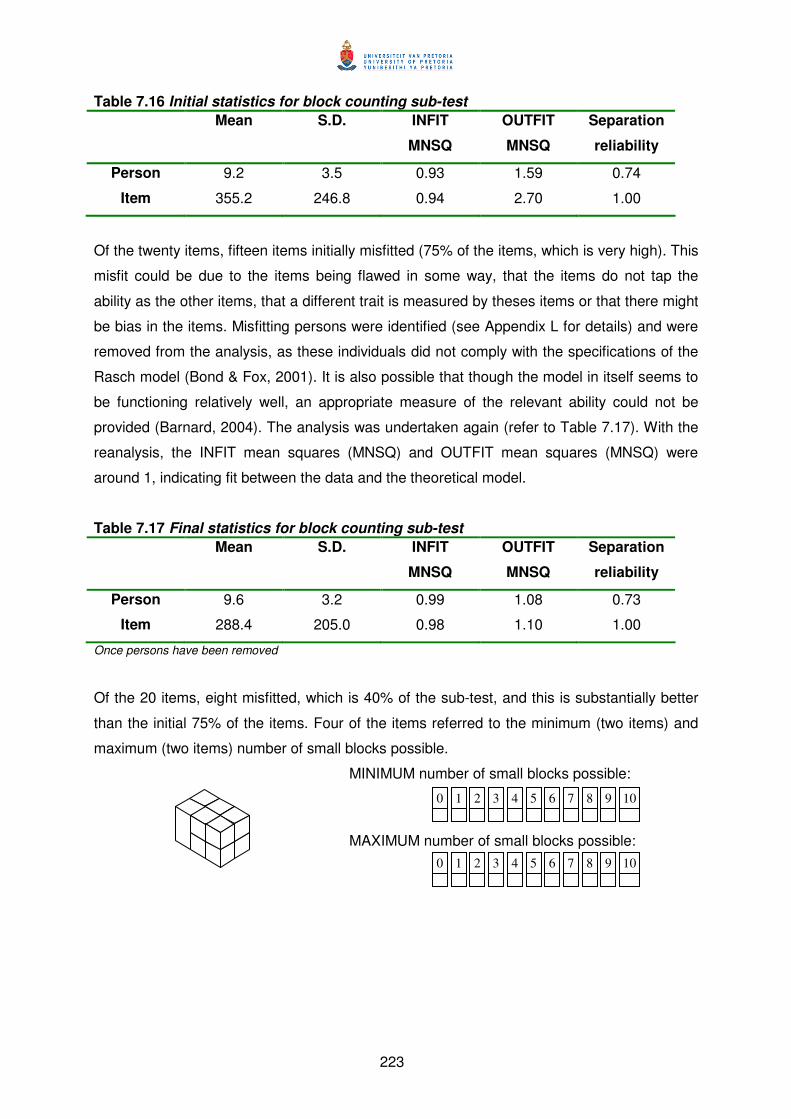
223
Table 7.16 Initial statistics for block counting sub-test
Mean S.D. INFIT
MNSQ
OUTFIT
MNSQ
Separation
reliability
Person 9.2 3.5 0.93 1.59 0.74
Item 355.2 246.8 0.94 2.70 1.00
Of the twenty items, fifteen items initially misfitted (75% of the items, which is very high). This
misfit could be due to the items being flawed in some way, that the items do not tap the
ability as the other items, that a different trait is measured by theses items or that there might
be bias in the items. Misfitting persons were identified (see Appendix L for details) and were
removed from the analysis, as these individuals did not comply with the specifications of the
Rasch model (Bond & Fox, 2001). It is also possible that though the model in itself seems to
be functioning relatively well, an appropriate measure of the relevant ability could not be
provided (Barnard, 2004). The analysis was undertaken again (refer to Table 7.17). With the
reanalysis, the INFIT mean squares (MNSQ) and OUTFIT mean squares (MNSQ) were
around 1, indicating fit between the data and the theoretical model.
Table 7.17 Final statistics for block counting sub-test
Mean S.D. INFIT
MNSQ
OUTFIT
MNSQ
Separation
reliability
Person 9.6 3.2 0.99 1.08 0.73
Item 288.4 205.0 0.98 1.10 1.00
Once persons have been removed
Of the 20 items, eight misfitted, which is 40% of the sub-test, and this is substantially better
than the initial 75% of the items. Four of the items referred to the minimum (two items) and
maximum (two items) number of small blocks possible.
MINIMUM number of small blocks possible:
MAXIMUM number of small blocks possible:
1
2
3
4
5
6
7
8
9
0
10
1
2
3
4
5
6
7
8
9
0
10
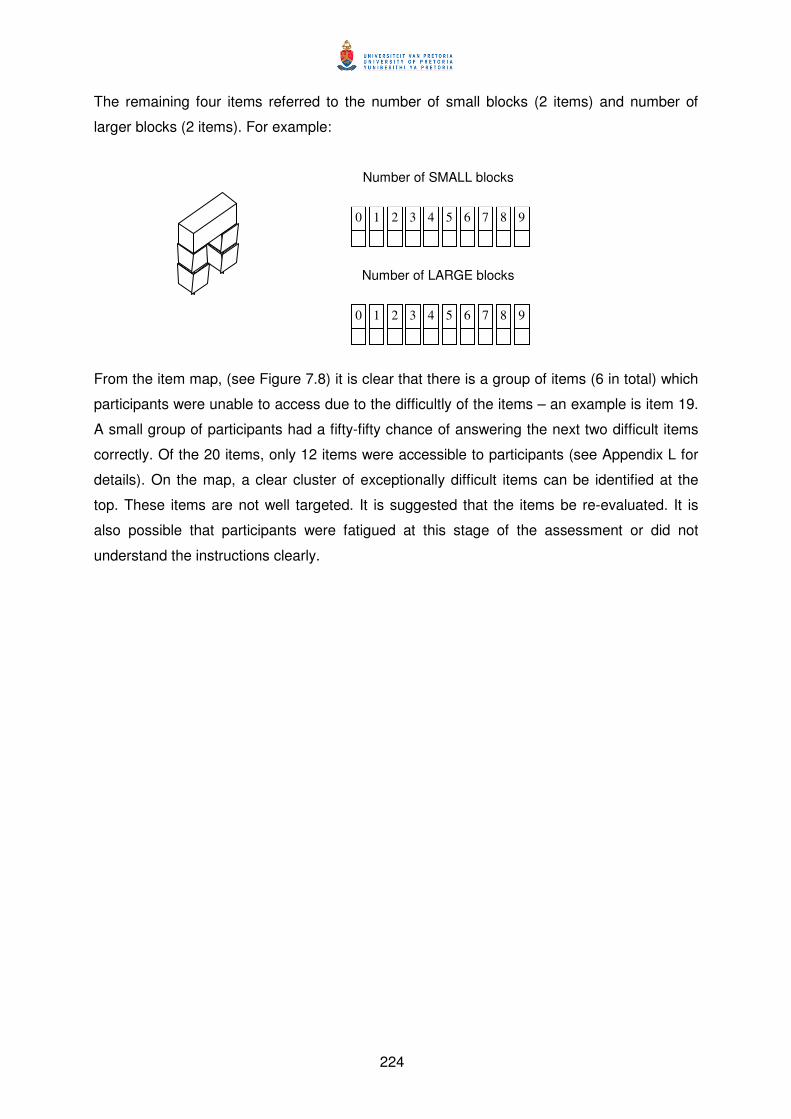
224
The remaining four items referred to the number of small blocks (2 items) and number of
larger blocks (2 items). For example:
From the item map, (see Figure 7.8) it is clear that there is a group of items (6 in total) which
participants were unable to access due to the difficultly of the items – an example is item 19.
A small group of participants had a fifty-fifty chance of answering the next two difficult items
correctly. Of the 20 items, only 12 items were accessible to participants (see Appendix L for
details). On the map, a clear cluster of exceptionally difficult items can be identified at the
top. These items are not well targeted. It is suggested that the items be re-evaluated. It is
also possible that participants were fatigued at this stage of the assessment or did not
understand the instructions clearly.
1
2
3
4
5
6
7
8
9
0
1
2
3
4
5
6
7
8
9
0
Number of SMALL blocks
Number of LARGE blocks
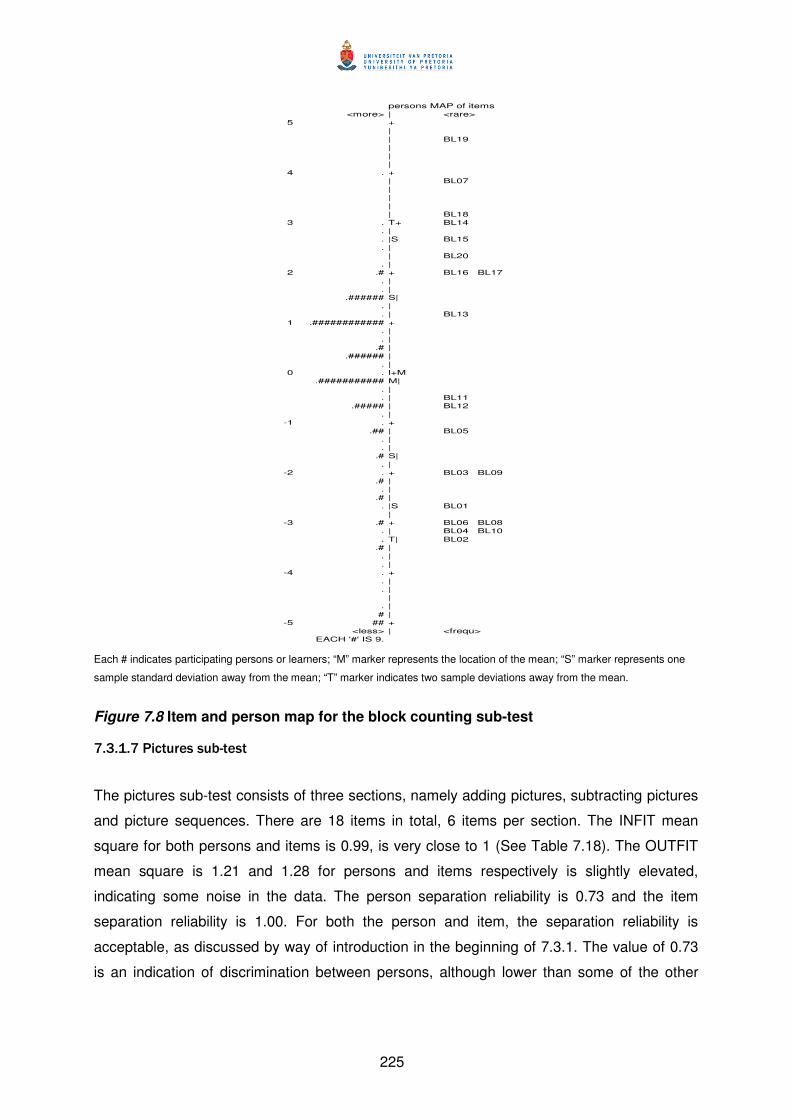
225
persons MAP of items
<more> | <rare>
5 +
|
| BL19
|
|
|
4 . +
| BL07
|
|
|
| BL18
3 . T+ BL14
. |
. |S BL15
. |
| BL20
. |
2 .# + BL16 BL17
. |
. |
.###### S|
. |
. | BL13
1 .############ +
. |
. |
.# |
.###### |
. |
0 . l+M
.########### M|
. |
. | BL11
.##### | BL12
. |
-1 . +
.## | BL05
. |
. |
.# S|
. |
-2 . + BL03 BL09
.# |
. |
.# |
. |S BL01
|
-3 .# + BL06 BL08
. | BL04 BL10
. T| BL02
.# |
. |
. |
-4 . +
. |
. |
|
. |
# |
-5 ## +
<less> | <frequ>
EACH '#' IS 9.
Each # indicates participating persons or learners; “M” marker represents the location of the mean; “S” marker represents one
sample standard deviation away from the mean; “T” marker indicates two sample deviations away from the mean.
Figure 7.8 Item and person map for the block counting sub-test
7.3.1.7 Pictures sub-test
The pictures sub-test consists of three sections, namely adding pictures, subtracting pictures
and picture sequences. There are 18 items in total, 6 items per section. The INFIT mean
square for both persons and items is 0.99, is very close to 1 (See Table 7.18). The OUTFIT
mean square is 1.21 and 1.28 for persons and items respectively is slightly elevated,
indicating some noise in the data. The person separation reliability is 0.73 and the item
separation reliability is 1.00. For both the person and item, the separation reliability is
acceptable, as discussed by way of introduction in the beginning of 7.3.1. The value of 0.73
is an indication of discrimination between persons, although lower than some of the other
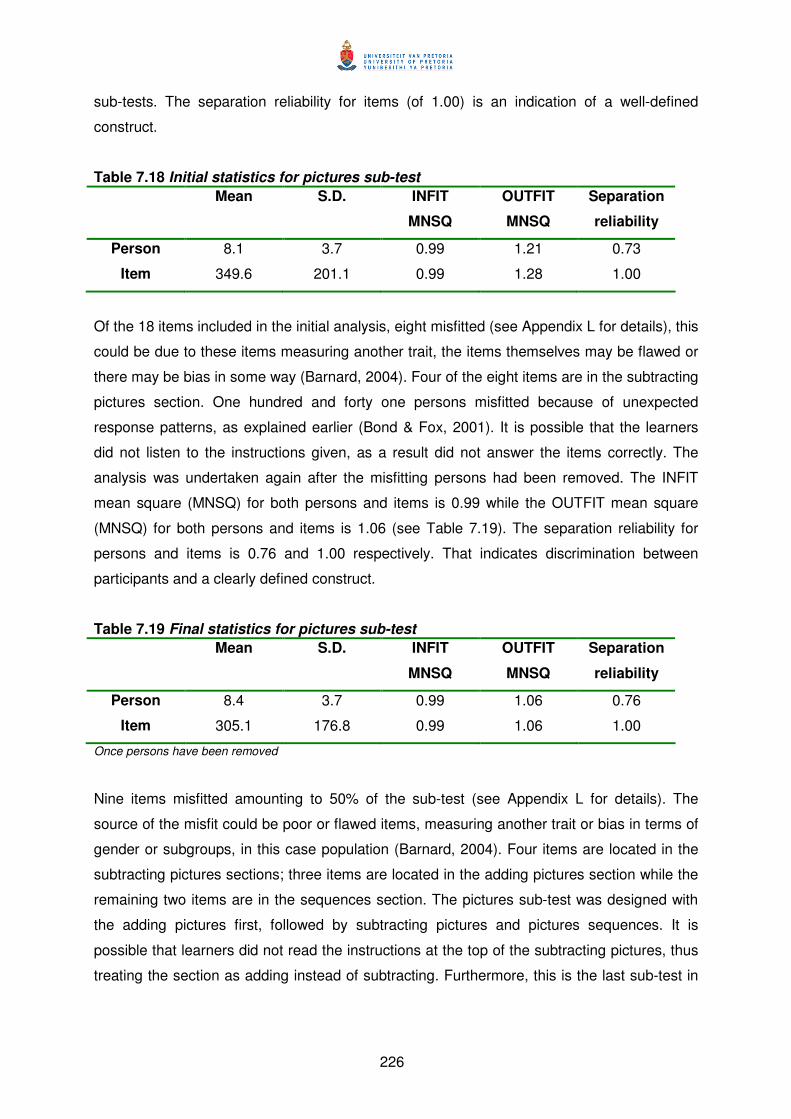
226
sub-tests. The separation reliability for items (of 1.00) is an indication of a well-defined
construct.
Table 7.18 Initial statistics for pictures sub-test
Mean S.D. INFIT
MNSQ
OUTFIT
MNSQ
Separation
reliability
Person 8.1 3.7 0.99 1.21 0.73
Item 349.6 201.1 0.99 1.28 1.00
Of the 18 items included in the initial analysis, eight misfitted (see Appendix L for details), this
could be due to these items measuring another trait, the items themselves may be flawed or
there may be bias in some way (Barnard, 2004). Four of the eight items are in the subtracting
pictures section. One hundred and forty one persons misfitted because of unexpected
response patterns, as explained earlier (Bond & Fox, 2001). It is possible that the learners
did not listen to the instructions given, as a result did not answer the items correctly. The
analysis was undertaken again after the misfitting persons had been removed. The INFIT
mean square (MNSQ) for both persons and items is 0.99 while the OUTFIT mean square
(MNSQ) for both persons and items is 1.06 (see Table 7.19). The separation reliability for
persons and items is 0.76 and 1.00 respectively. That indicates discrimination between
participants and a clearly defined construct.
Table 7.19 Final statistics for pictures sub-test
Mean S.D. INFIT
MNSQ
OUTFIT
MNSQ
Separation
reliability
Person 8.4 3.7 0.99 1.06 0.76
Item 305.1 176.8 0.99 1.06 1.00
Once persons have been removed
Nine items misfitted amounting to 50% of the sub-test (see Appendix L for details). The
source of the misfit could be poor or flawed items, measuring another trait or bias in terms of
gender or subgroups, in this case population (Barnard, 2004). Four items are located in the
subtracting pictures sections; three items are located in the adding pictures section while the
remaining two items are in the sequences section. The pictures sub-test was designed with
the adding pictures first, followed by subtracting pictures and pictures sequences. It is
possible that learners did not read the instructions at the top of the subtracting pictures, thus
treating the section as adding instead of subtracting. Furthermore, this is the last sub-test in
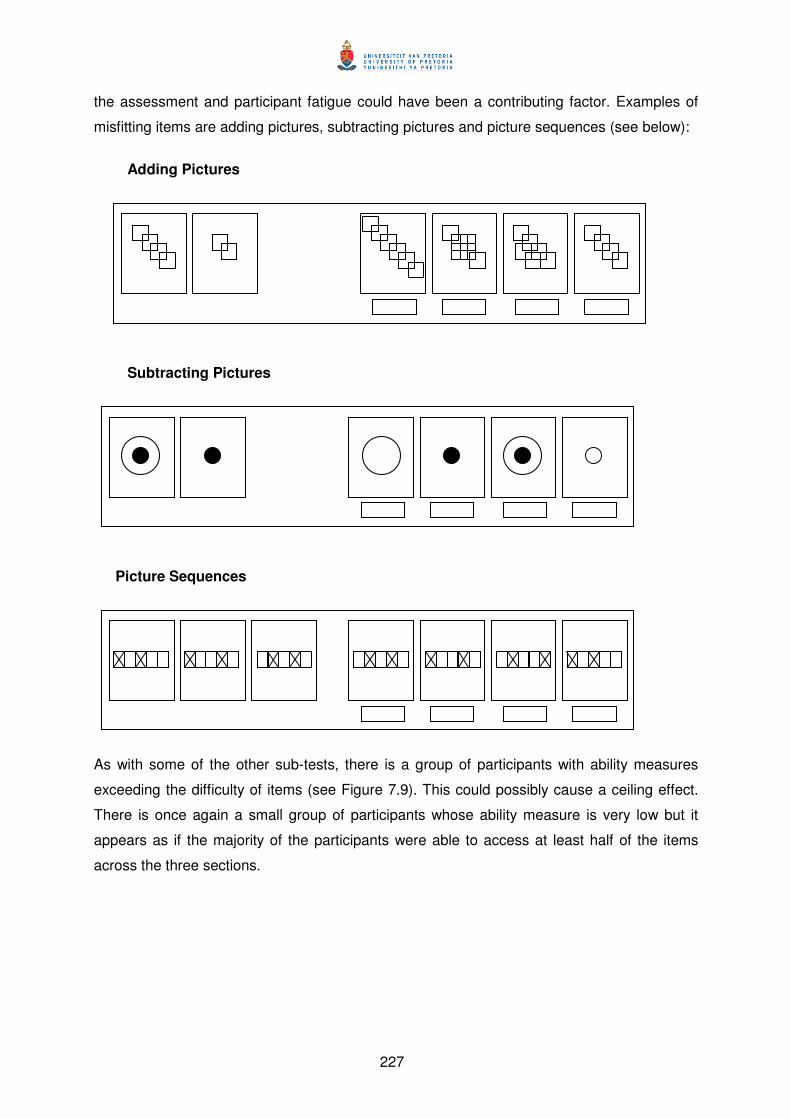
227
the assessment and participant fatigue could have been a contributing factor. Examples of
misfitting items are adding pictures, subtracting pictures and picture sequences (see below):
As with some of the other sub-tests, there is a group of participants with ability measures
exceeding the difficulty of items (see Figure 7.9). This could possibly cause a ceiling effect.
There is once again a small group of participants whose ability measure is very low but it
appears as if the majority of the participants were able to access at least half of the items
across the three sections.
Subtracting Pictures
Picture Sequences
Adding Pictures
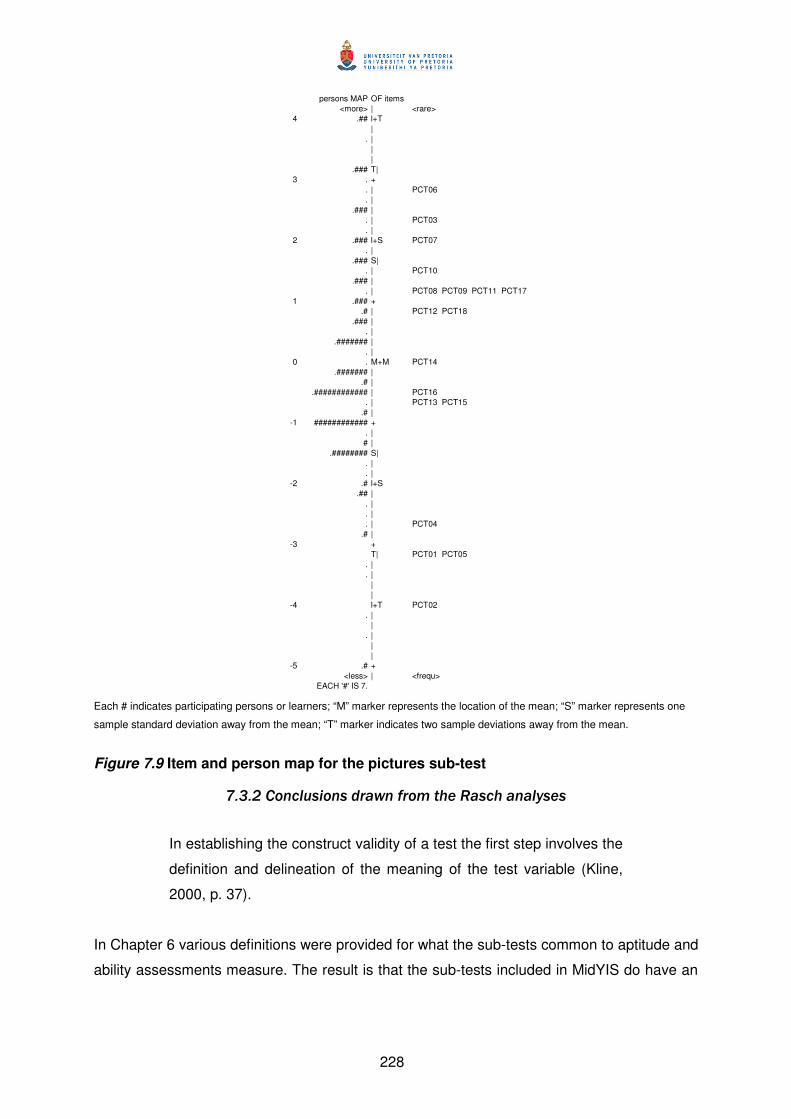
228
persons MAP OF items
<more> | <rare>
4 .## l+T
|
. |
|
|
.### T|
3 . +
. | PCT06
. |
.### |
. | PCT03
. |
2 .### l+S PCT07
. |
.### S|
. | PCT10
.### |
. | PCT08 PCT09 PCT11 PCT17
1 .### +
.# | PCT12 PCT18
.### |
. |
.####### |
. |
0 . M+M PCT14
.####### |
.# |
.############ | PCT16
. | PCT13 PCT15
.# |
-1 ############ +
. |
# |
.######## S|
. |
. |
-2 .# l+S
.## |
. |
. |
. | PCT04
.# |
-3 +
T| PCT01 PCT05
. |
. |
|
|
-4 l+T PCT02
. |
|
. |
|
|
-5 .# +
<less> | <frequ>
EACH '#' IS 7.
Each # indicates participating persons or learners; “M” marker represents the location of the mean; “S” marker represents one
sample standard deviation away from the mean; “T” marker indicates two sample deviations away from the mean.
Figure 7.9 Item and person map for the pictures sub-test
7.3.2 Conclusions drawn from the Rasch analyses
In establishing the construct validity of a test the first step involves the
definition and delineation of the meaning of the test variable (Kline,
2000, p. 37).
In Chapter 6 various definitions were provided for what the sub-tests common to aptitude and
ability assessments measure. The result is that the sub-tests included in MidYIS do have an

229
empirical base. The question now remains to what extent the items included in the sub-tests
measure the same concept.
The aim of the Rasch analysis was to identify the items included in the various sub-tests
which were unidimensional or which measure the same construct or concept. This was the
first step in finding answers for the sub-research question 1.2.4 how well do the items per
sub-test function and do they form well-defined constructs. In the Rasch analysis the
smallest unit was used, namely the items, which are included to form a set of items
associated with the various sub-tests. The objective was to determine which core items best
measure the theoretical concept underpinning the sub-test.
It is clear that there are a number of items per sub-test which are unidimensional and do
measure the theoretical concept that they were intended to measure. However, there were
items that misfitted. The source of the misfit could be attributed to (Barnard, 2004):
� Flawed or poorly written items;
� Items not measuring the same trait;
� Some form of bias in terms of gender or subgroups.
These items would need to be revised or if revision were not possible, additional items would
have to be generated. However, items would have to be revised or rewritten with content-
related validity in mind. The resulting misfitting items necessitate improving the sub-tests for
the South African context not only from a curriculum perspective but also from a
psychometric perspective. These “new” items would also need to complement the other
items in the sub-test and for this reason it is suggested that any development work be
undertaken in conjunction with a set assessment framework.
The question remains how well do the items per sub-test function and do they form
well-defined constructs. What does emerge out of the Rasch analyses is that there are
core items that can be included in sub-tests and these do form well-defined constructs. This
result can be taken in conjunction with the results of evaluation of the items in terms of the
domain they represent (as was described in Chapter 6). As a result of this analysis in
conjunction with the results presented in Chapter 6, it is possible to suggest that not only do
the sets of items cohere to form the constructs measured in each of the sub-tests but that the
sub-tests themselves could be combined to form the scales as developed by the CEM
centre.
230
This is in line with Messick (1981) who suggests that the relevance of a construct should be
evaluated in light of a particular applied purpose. Here issues of content are associated with
judgments of relevance, where relevance is seen as whether the sample of items under
investigation can be aligned to the content domain. Sireci (1998) elaborates on content
relevance to include the “congruence between the test content and the purpose of testing” (p.
99).
If it is said, that for reporting purposes it may be easier to combine sub-tests into scales, then
the next step would be to ascertain whether there is any congruence between the underlying
skills assessed by the seven sub-tests. If this line of thought is followed, then it is possible to
combine the perceptual speed and accuracy with the proof reading sections as both sub-
tests are designed to measure fluency and speed in finding patterns as well as spotting
mistakes. So, theoretically this would be a sound argument to make.
The same line of reasoning can be used when considering whether block counting, cross-
sections and pictures should be combined. Once again a set of common skills can be
identified, namely that these sub-tests attempt to measure 2-D and 3-D visualisation, spatial
aptitude, pattern recognition, and logical thinking. According to Anastasi and Urbina (1997),
non-verbal assessments typically do not include language that participants have to read in
order to answer items. Rather, pictures are used for this purpose. If this definition were used
as an underpinning rationale, then it would make sense to combine these three sub-tests as
pictures are used instead of written items, which have to be read.
In the words of Messick (1981, p. 11), “we must go beyond judgments of content consistency
to an assessment of response consistency”. In the section to follow, the consistency of
responses is explored. This is done by means of reliability analysis, in which the theoretical
argument that sets of items associated with sub-tests can be incorporated into the scales as
identified by the CEM centre is empirically tested.
7.4 Exploring the reliability of the MidYIS assessment
A test cannot correlate with anything more highly than it does itself…it
is a peculiar measuring instrument if different parts of it are measuring
different variables, as must be the case with low reliability…low
internal consistency implies considerable error of measurement
(Kline, 2000, p. 29).
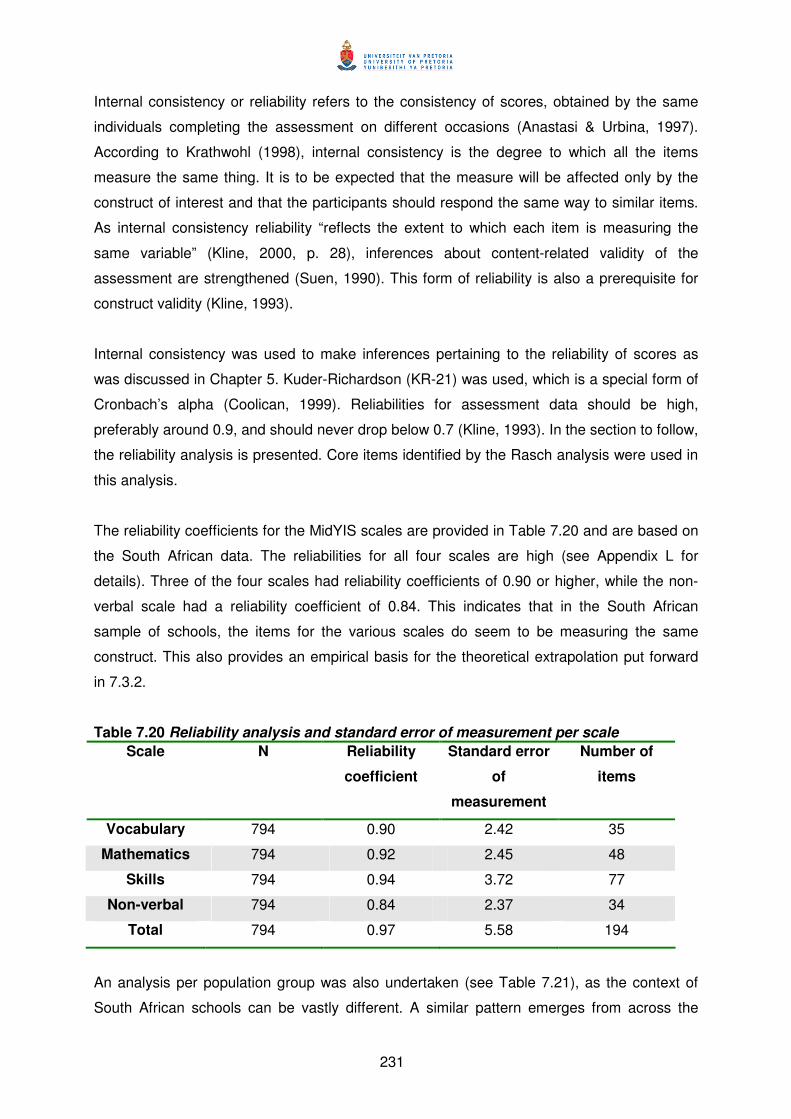
231
Internal consistency or reliability refers to the consistency of scores, obtained by the same
individuals completing the assessment on different occasions (Anastasi & Urbina, 1997).
According to Krathwohl (1998), internal consistency is the degree to which all the items
measure the same thing. It is to be expected that the measure will be affected only by the
construct of interest and that the participants should respond the same way to similar items.
As internal consistency reliability “reflects the extent to which each item is measuring the
same variable” (Kline, 2000, p. 28), inferences about content-related validity of the
assessment are strengthened (Suen, 1990). This form of reliability is also a prerequisite for
construct validity (Kline, 1993).
Internal consistency was used to make inferences pertaining to the reliability of scores as
was discussed in Chapter 5. Kuder-Richardson (KR-21) was used, which is a special form of
Cronbach’s alpha (Coolican, 1999). Reliabilities for assessment data should be high,
preferably around 0.9, and should never drop below 0.7 (Kline, 1993). In the section to follow,
the reliability analysis is presented. Core items identified by the Rasch analysis were used in
this analysis.
The reliability coefficients for the MidYIS scales are provided in Table 7.20 and are based on
the South African data. The reliabilities for all four scales are high (see Appendix L for
details). Three of the four scales had reliability coefficients of 0.90 or higher, while the non-
verbal scale had a reliability coefficient of 0.84. This indicates that in the South African
sample of schools, the items for the various scales do seem to be measuring the same
construct. This also provides an empirical basis for the theoretical extrapolation put forward
in 7.3.2.
Table 7.20 Reliability analysis and standard error of measurement per scale
Scale N Reliability
coefficient
Standard error
of
measurement
Number of
items
Vocabulary 794 0.90 2.42 35
Mathematics 794 0.92 2.45 48
Skills 794 0.94 3.72 77
Non-verbal 794 0.84 2.37 34
Total 794 0.97 5.58 194
An analysis per population group was also undertaken (see Table 7.21), as the context of
South African schools can be vastly different. A similar pattern emerges from across the
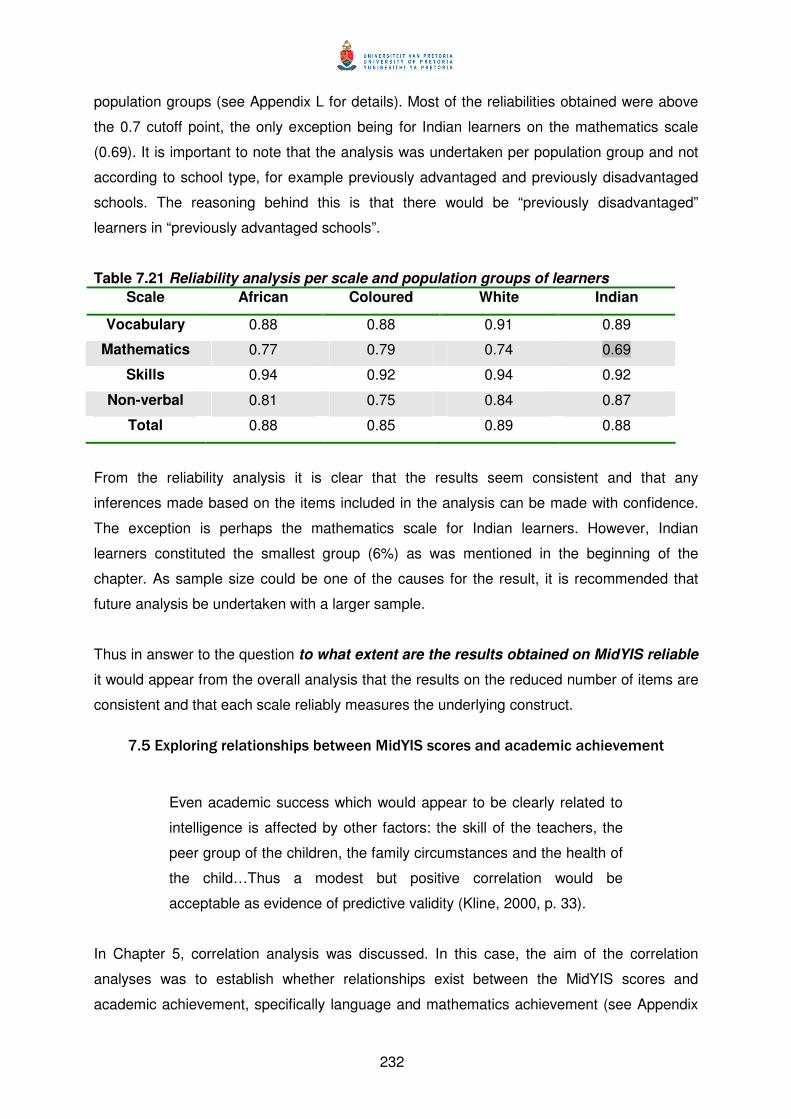
232
population groups (see Appendix L for details). Most of the reliabilities obtained were above
the 0.7 cutoff point, the only exception being for Indian learners on the mathematics scale
(0.69). It is important to note that the analysis was undertaken per population group and not
according to school type, for example previously advantaged and previously disadvantaged
schools. The reasoning behind this is that there would be “previously disadvantaged”
learners in “previously advantaged schools”.
Table 7.21 Reliability analysis per scale and population groups of learners
Scale African Coloured White Indian
Vocabulary 0.88 0.88 0.91 0.89
Mathematics 0.77 0.79 0.74 0.69
Skills 0.94 0.92 0.94 0.92
Non-verbal 0.81 0.75 0.84 0.87
Total 0.88 0.85 0.89 0.88
From the reliability analysis it is clear that the results seem consistent and that any
inferences made based on the items included in the analysis can be made with confidence.
The exception is perhaps the mathematics scale for Indian learners. However, Indian
learners constituted the smallest group (6%) as was mentioned in the beginning of the
chapter. As sample size could be one of the causes for the result, it is recommended that
future analysis be undertaken with a larger sample.
Thus in answer to the question to what extent are the results obtained on MidYIS reliable
it would appear from the overall analysis that the results on the reduced number of items are
consistent and that each scale reliably measures the underlying construct.
7.5 Exploring relationships between MidYIS scores and academic achievement
Even academic success which would appear to be clearly related to
intelligence is affected by other factors: the skill of the teachers, the
peer group of the children, the family circumstances and the health of
the child…Thus a modest but positive correlation would be
acceptable as evidence of predictive validity (Kline, 2000, p. 33).
In Chapter 5, correlation analysis was discussed. In this case, the aim of the correlation
analyses was to establish whether relationships exist between the MidYIS scores and
academic achievement, specifically language and mathematics achievement (see Appendix
233
L for details). This is the first step toward determining whether MidYIS would be able to
predict future achievement of South African learners. Correlation analyses was undertaken
using the MidYIS scale scores, resulting from the Rasch analyses, and English and
mathematics final marks as received from the schools. Of the 11 schools that participated in
the study, nine schools provided information pertaining to the final year results in English and
mathematics of the learners who participated in the study. Although repeated attempts were
made to obtain results from all the participating schools, two schools did not feel comfortable
providing the information. The final marks obtained from the schools comprised a
combination of a continuous assessment mark and a final examination mark. The MidYIS
scale scores and the English and mathematics marks were also explored in order to
ascertain whether any assumptions underlying correlation analysis was not violated.
Table 7.22 details the results of the relationships between the various MidYIS scales and the
mathematics results obtained from schools while Table 7.23 provides the results of the
analysis for English (refer to Appendix L). All of the MidYIS scales were included in the
analysis and not just scales directly relevant to mathematics and English. The reason behind
including all the scales in both analyses is the interrelated nature of the skills assessed. In
mathematics for example, language proficiency is an important criterion for success (see
Howie, 2002).
Correlations of above 0.3 (Kline 1993) for the MidYIS scales and the mathematics and
English marks are considered indicative of a positive relationship, but, in addition to the
positive correlations, the variance explained also has to be considered. The variance
explained is calculated by squaring the correlation (Kline, 2000).
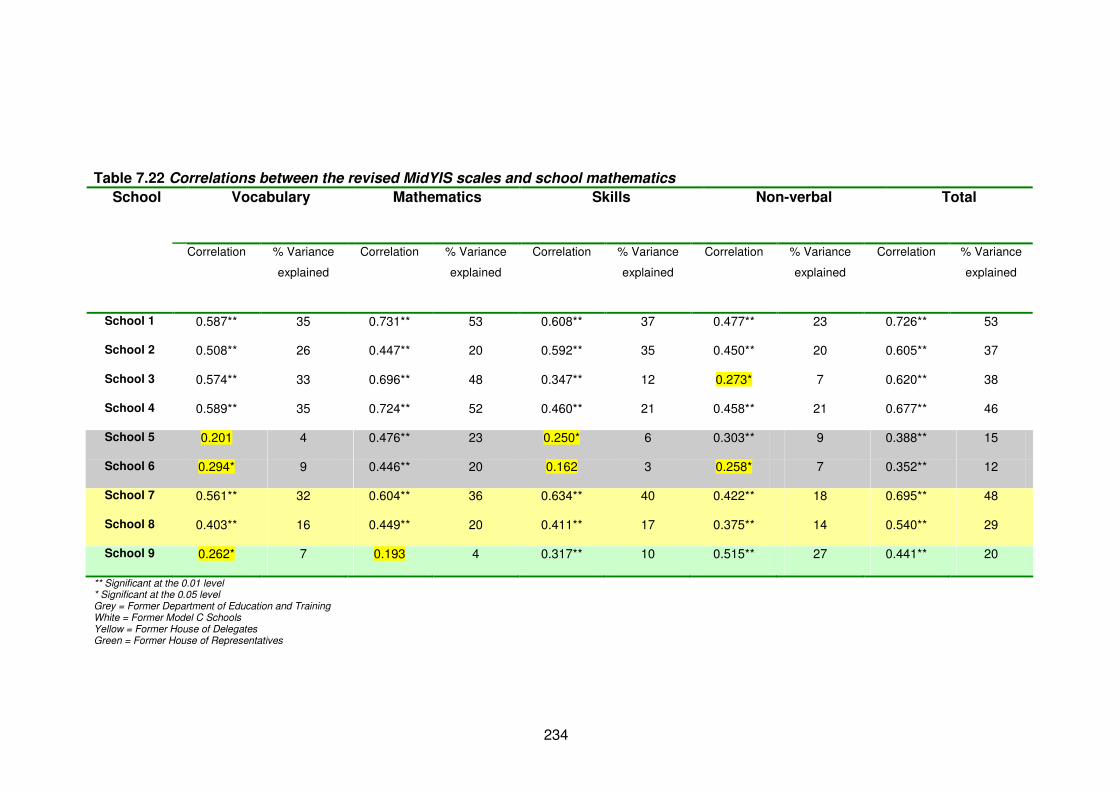
234
Table 7.22 Correlations between the revised MidYIS scales and school mathematics
School Vocabulary Mathematics Skills Non-verbal Total
Correlation % Variance
explained
Correlation % Variance
explained
Correlation % Variance
explained
Correlation % Variance
explained
Correlation % Variance
explained
School 1 0.587** 35 0.731** 53 0.608** 37 0.477** 23 0.726** 53
School 2 0.508** 26 0.447** 20 0.592** 35 0.450** 20 0.605** 37
School 3 0.574** 33 0.696** 48 0.347** 12 0.273* 7 0.620** 38
School 4 0.589** 35 0.724** 52 0.460** 21 0.458** 21 0.677** 46
School 5 0.201 4 0.476** 23 0.250* 6 0.303** 9 0.388** 15
School 6 0.294* 9 0.446** 20 0.162 3 0.258* 7 0.352** 12
School 7 0.561** 32 0.604** 36 0.634** 40 0.422** 18 0.695** 48
School 8 0.403** 16 0.449** 20 0.411** 17 0.375** 14 0.540** 29
School 9 0.262* 7 0.193 4 0.317** 10 0.515** 27 0.441** 20
** Significant at the 0.01 level * Significant at the 0.05 level Grey = Former Department of Education and Training White = Former Model C Schools Yellow = Former House of Delegates Green = Former House of Representatives
235
From the results, it seems as if positive relationships exist between the MidYIS scales and
the mathematics marks (see Table 7.22). The exception would be for vocabulary in which
weak relationships exist for schools 5, 6 and 9. This may be explained by the difference in
mathematics and vocabulary (language) as well as that very often learners are more
proficient in one than the other. It is possible that language could be a factor in addition to the
nature of marks received from the school, as these are not standardised results. Interestingly
the mathematics scale does not correlate with the mathematics mark for school 8, but as can
be expected, high correlations can be found between mathematics and the MidYIS
mathematics scale for the other schools. The non-verbal scale presents interesting results.
The non-verbal scale includes 2D and 3D shapes that have to be manipulated. The ability to
use 2D and 3D shapes cannot be underestimated as this forms the basis for geometry.
However, in schools 3 and 6 the correlation between non-verbal and mathematics is less
than 0.3. Two schools obtained results lower than 0.3 for the skills scale, namely school 5
and school 6.
What is noteworthy is the percentage of variance that MidYIS explains in terms of
mathematics academic achievement. For the former Model C schools the percentage of
variance explained ranges from 26% to 33% on the vocabulary scale. However, percentages
as low as 4% (school 5), 7% (school 9) and 9% (school 6) are recorded. A similar result is
obtained for the skills and the non-verbal scales as with the vocabulary scale. The
percentage of variance explained in terms of academic success for mathematics is better
than the other scales. However, in school 9 as little as 4% of the variance can be accounted
for. This means that abilities alone explain little in school’s variation in terms of performance,
even though the scales can be related to the domain of mathematics. Thus other factors
possibly on a learner, classroom or school-level must be considered, for instance, language
spoken in the home of the learner, age of the learner, socio-economic status of the learner,
gender of the learner or educator, language of teaching and learning, teaching style of the
educator or principal management style.
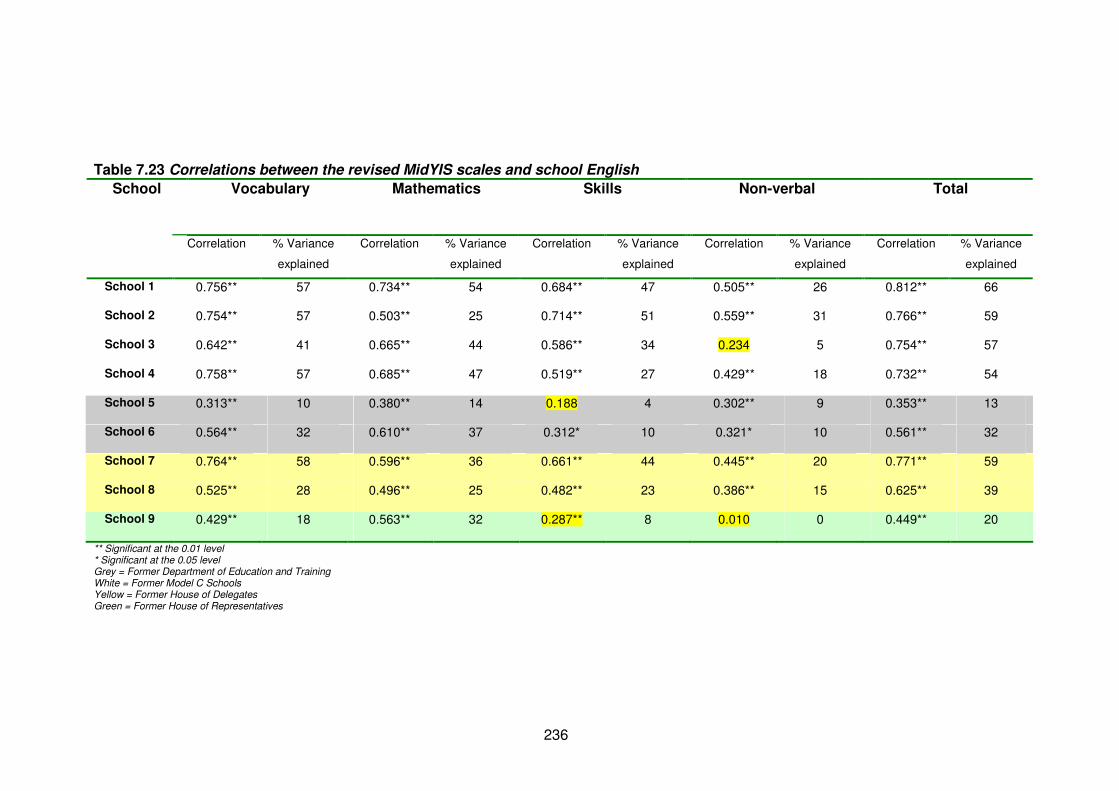
236
Table 7.23 Correlations between the revised MidYIS scales and school English
School Vocabulary Mathematics Skills Non-verbal Total
Correlation % Variance
explained
Correlation % Variance
explained
Correlation % Variance
explained
Correlation % Variance
explained
Correlation % Variance
explained
School 1 0.756** 57 0.734** 54 0.684** 47 0.505** 26 0.812** 66
School 2 0.754** 57 0.503** 25 0.714** 51 0.559** 31 0.766** 59
School 3 0.642** 41 0.665** 44 0.586** 34 0.234 5 0.754** 57
School 4 0.758** 57 0.685** 47 0.519** 27 0.429** 18 0.732** 54
School 5 0.313** 10 0.380** 14 0.188 4 0.302** 9 0.353** 13
School 6 0.564** 32 0.610** 37 0.312* 10 0.321* 10 0.561** 32
School 7 0.764** 58 0.596** 36 0.661** 44 0.445** 20 0.771** 59
School 8 0.525** 28 0.496** 25 0.482** 23 0.386** 15 0.625** 39
School 9 0.429** 18 0.563** 32 0.287** 8 0.010 0 0.449** 20
** Significant at the 0.01 level * Significant at the 0.05 level Grey = Former Department of Education and Training White = Former Model C Schools Yellow = Former House of Delegates Green = Former House of Representatives
237
As might have been expected, the correlations between vocabulary and the English mark in
most of the schools exceeded 0.3 and were significant at the 0.01 level (see Table 7.23).
Strong correlations were found between the mathematics scale and the English marks. Less
substantial correlations were found between non-verbal and the English mark with weak
correlations for school 3 and 9. One might have expected a slightly higher correlation
between the skills scale and the English mark as proof reading is language-bound. Although
the majority of the correlations for the schools were above 0.3, the correlations were lower
than the correlation between vocabulary and the English mark. A very weak relationship was
found between skills and English for school 5. Of the four scales, non-verbal had the lowest
correlations; this in itself is perhaps not surprising as non-verbal scales should not be as
language bound as some of the other scales, vocabulary for example.
The emerging picture for the English marks and MidYIS in terms of the percentage of
variance explained is similar to the one for mathematics marks and MidYIS. For vocabulary a
large percentage of variance can be explained up to 57% (school 1 and 2) in some schools
and as low as 10% in other schools (school 5). For Mathematics up to 54% (school 1) and as
low as 14% (school 5) can be explained, a similar picture emerges for skills and non-verbal.
It is suggested that MidYIS could be used for prediction purposes; in answer to the question
to what extent does the data predict future achievement? This was an initial first step in
order to ascertain whether the MidYIS assessment could be used for prediction purposes.
However, further analysis is needed with a larger sample (including rural schools and schools
from other provinces) using a standardised school-based examination before definite
inferences related to predictive validity can be made. Performance on its own can only
account for so much variance. Other factors have to be considered as the quote in the
beginning of the section suggests. It is proposed that a multilevel model be used in which
other factors can be included in addition to ordinary least squares models which can be used
to determine the value the school has added. It is important to consider that the results for
mathematics and English are not standardised across the schools but rather a reflection of
the assessment within the school. This could partly explain the fluctuations in correlations
and in the percentage of variance. As a result, the exploration of predictive validity should be
undertaken again, using standardised school scores.
238
7.6 Conclusion
…validity of a test is not clear-cut, as was [is} the case with reliability.
There is no single validity coefficient (Kline, 2000, p. 38).
The aim of Chapter 6 and of this chapter was to address the specific research question how
valid and reliable the data generated by the MidYIS monitoring system are for South
Africa? Different strategies for making inferences related to validity were presented, ranging
from conceptual considerations as in the case of content-related validity (presented in
Chapter 6) to empirical considerations as in the case of construct-related validity and
predictive validity (presented in this chapter).
Three sub-questions were addressed in this chapter; two questions are associated with
construct and predictive validity while the other is related to reliability. The sub-questions
addressed in this chapter are (see Chapter 5 for a detailed discussion):
1.2.1 To what extent are the results obtained on MidYIS reliable?
1.2.4 How well do the items per sub-test function and do they form well-defined
constructs?
1.2.5 To what extent does the data predict future achievement?
Sub-question 1.2.4 how well do the items per sub-test function and do they form well-
defined constructs was addressed by means of item (Rasch analysis) and scale analysis
(reliability analysis). What emerges from the Rasch analyses is that there are core items
associated with sub-tests and that the sub-tests can be combined into scales, as was
originally designed by CEM. However, there are items that seem to measure constructs other
than the constructs they were designed to measure, and these were removed from further
analyses. Thus the items which were identified, as misfitting should be revised or rewritten,
based on an assessment framework for the assessment as a whole. The assessment
framework should be developed both from a curriculum and psychometric perspective, thus
satisfying conditions for conceptual forms of validity.
Sub-question 1.2.1 is related to the reliability of the MidYIS results (to what extent are the
results obtained on MidYIS reliable?). The analyses were undertaken with the whole
sample in addition to the different population groups. The results of the analyses indicate
internal consistency of the set of items per scale and as a result, the items per scale seem to
be measuring the same construct. It is suggested that in future larger samples for sub-
239
population groups should be included if inferences per population group are to be made with
confidence.
The third sub-question addressed is related to the predictive validity of the assessment (to
what extent does the data predict future achievement?). The analysis was undertaken
per school and not across schools. The results indicated that the scales do correlate with the
results obtained from schools for mathematics and English. Therefore, MidYIS could possibly
be used for prediction purposes, although more analytic work is needed in this area before
definitive statements can be made (including a larger sample from other provinces and
contexts). What does seem to emerge is that MidYIS on its own can only account for so
much variation in performance. Other factors on the learner, classroom and school-level
have to be taken into account. Thus a multilevel model should be used in addition to ordinary
least squares models that can be used to determine the value the school has added. For
trustworthy inferences to be made in terms of predictive validity, standardised academic
results should be used, such as the Grade 9 exit-level examinations.
To conclude, Sicoly (2002, p. 174) encapsulates the aim of the first specific research
question (how valid and reliable the data generated by the MidYIS monitoring system
are for South Africa):
Assessment results are expected to improve student performance by
improving educational practices. The feedback provided by
assessment results may be used to guide school wide planning, to
adjust teaching practices, and to focus staff development efforts. If
schools are to use assessment data as a basis for planning and
decision making, we must satisfy the highest standards. Poor quality
assessment results will only lead to misdirection and confusion
instead of providing an opportunity for improving schools
effectiveness.
240
CHAPTER 8CHAPTER 8CHAPTER 8CHAPTER 8
FACTORSFACTORSFACTORSFACTORS THAT THAT THAT THAT INFLUENCE INFLUENCE INFLUENCE INFLUENCE PERFORMANCE PERFORMANCE PERFORMANCE PERFORMANCE ON ON ON ON
MIDYISMIDYISMIDYISMIDYIS
The school system can be described as a nested system in which learners
are situated within classes and classes within schools. Each level - learner,
classroom, and school - interacts with each other in a way that results in a
set of outcomes, in this case performance on the MidYIS assessment. This
chapter provides an indication of the results of multilevel analyses
undertaken. The aim is to explore which factors on a learner, classroom,
and school-level influence the performance on the MidYIS assessment.
Multilevel analysis was undertaken to shed light on which factors influences
the performance of learners on the MidYIS assessment.
8.1 Introduction
Even academic success which would appear to be clearly related to
intelligence is affected by other factors: the skill of the teachers, the
peer group of the children, the family circumstances and the health of
the child (Kline, 2000, p. 33).
In Chapter 7 the relationship between MidYIS and academic achievement was explored. The
results of the analyses show that a number of observations can be made about the variance
explained across different schools. Although in some cases the percentage variance
explained in MidYIS scale scores and the overall score is quite large, in the case of School 1,
66% of the variance in the total MidYIS score could be explained by achievement in English
and 53% in mathematics (see Table 7.22 and Table 7.23). However, in other cases the
percentage variance is small; for example in School 5 where 13% of the variance in the total
MidYIS scores could be explained by achievement in English and 15% by achievement in
mathematics. This leads one to the conclusion that aptitude or ability alone cannot account
for the variance in academic achievement. According to Kline (2000), there is a correlation
between ability, intelligence or aptitude and achievement due to common content of the
241
assessments and common skills they attempt to measure. However, this argument may be
difficult to sustain in light of the nature of aptitude tests. Perhaps the answer lies in defining
aptitude more generally as the ability to reason, as the ability to reason may be attributed to
an inherited trait. Clearly other factors also play a part “…biometric research
…demonstrate[s] that intelligence test scores are highly heritable… [but] not all variance is
accounted for. What the environmental determinants are has yet to be determined
empirically” (Kline, 2000, p. 82).
If the environmental determinants have not yet been empirically determined and if ability and
skills can be taught, then the question is which school determinants may explain some of the
variance unaccounted for? Learning and the development of skill take place within a school
context and the context cannot be ignored (Luke, 2004). In education, learners are grouped
together to form classes and classes collectively make up the learner body in a school. Thus
the education system has a nested structure.
As was discussed in Chapter 2 and Chapter 3, school effectiveness models used to explore
the effects of contextual factors at various levels of the system, are multilevel models. In a
developing world context however, studies of school effectiveness seldom made use of the
advanced statistical analyses such as multilevel analysis (Riddell, 1997). Not using this type
of statistical analyses means that there is the risk of drawing inferences that are based on
wrong assumptions, e.g. that effects at group level hold true for individuals (ecological
fallacy) or that effects at the individual level hold true for the group level as well (atomistic
fallacy) (Hox, 2002; Luke, 2004).
The aim of the present chapter is to explore factors on a learner, classroom, and school-level
that have an effect on the overall performance on MidYIS, as was described in Chapter 5.
The second main research question addressed by this exploration is which factors could
have an effect on learner performance and therefore inform the design of the
monitoring system? This broad research question comprises four specific research
questions, as was discussed in Chapter 5:
2.1 What factors on a school-level affect the performance of learners on the
assessment?
2.2 What factors on a classroom-level affect the performance of learners on the
assessment?
2.3 What factors on a learner-level affect performance of learners on the assessment?
2.4 How can the identified factors be included in the design of the monitoring system?
242
Multilevel analysis is deemed appropriate to address these questions as it takes into account
the nested structure of the education system. The variability in the upper levels of the nested
system is also taken into consideration as the levels have an influence on each other.
Additionally, the conceptual framework (see Chapter 3) underpinning this study consists of
constructs operating at multiple levels within the school context (Luke, 2004).
Several issues pertaining to the multilevel analyses undertaken are addressed in this
chapter. The data preparation, approach to model building, and the identification of possible
factors to be included for analysis as was introduced in Chapter 5 are elaborated on in 8.2.
This is followed by a discussion on the multilevel analysis undertaken (8.3). The null model is
addressed first (8.3.1) followed by a discussion on the multilevel analysis using learner data,
educator data and principal data (8.3.2). Concluding observations can be found in 8.4 of how
the analyses address the four specific research questions in order to provide insights into the
second main research question which factors could have an effect on learner
performance and therefore inform the design of the monitoring system?
8.2 Preparation for model building
Before applying multilevel analyses several steps must be taken, as was described in
Chapter 5 (5.3.5.5). The data was first explored to ensure that assumptions underlying
multilevel analysis was not violated, in particular multicollinearity. Multicollinearity exists when
strong correlations (above 0.8) exist between two or more predictors in the model (Field,
2005). For the purposes of this exploration learners were linked to classes and classes to
schools. In the section to follow the way in which variables were identified is elaborated on
(8.2.1). This is followed by an overview of the approach to model building (8.2.2).
8.2.1 Identifying variables to be explored with multilevel analyses
Within the field of school effectiveness (see Chapter 2), factors associated with achievement
are both broad and divergent, as the factors are operationalised differently across studies
(Fertig, 2000). The contexts in which these studies took place also differ in terms of
developing world contexts and developed world contexts. Studies from the developing world
are characterised by large between school variation (Fertig, 2000) and challenges of studying
classroom-level processes (Fertig, 2000; Scheerens, 2001a, 2001b), which is not necessarily
the case with the developed world. In addition, research indicates stronger effects of material
and human resource input factors in developing countries than in developed countries
(Scheerens, 2001a).
243
In order to identify variables on the learner, classroom and school-level relationships were
explored by means of correlation analyses between variables as taken from the
questionnaires and the total score on MidYIS (see Table 8.1). It was found that the data was
appropriate and that multicollinearity was not present (refer to Appendix L). In certain
instances a variable was constructed out of a number of items - for example resources in the
home corresponding with possible possessions in the home such as electricity, radio and
television. However, in certain instances and based on literature, single items were used as a
variable, such as level of education of mothers and fathers. In order to identify variables for
further exploration all items, and where possible indicators based on a logical combination of
items, were analysed. The criterion for inclusion for further analyses was based on the
strength of the correlations (above 0.2) and their significance (0.99 confidence interval). The
correlation analyses identified several moderate but significant relationships. In total six
learner-level variables, six classroom-level variables and three school-level variables were
identified. However, small sample sizes at the classroom and school-level was a concern and
therefore only a limited number of variables could be included in the model, even though
more variables were identified. A general rule of thumb of at least 10 observations per
variable was used for analysis purposes (Field, 2005). The variables identified for inclusion
were guided by prevalence in literature as well the strength and significance of correlations
between the variables and the total score on the MidYIS assessment. Thus variables that
were prevalent in literature and that had the strongest correlations were included.
Table 8.1 provides an overview of the factors at learner, classroom, and school-level
included for further exploration.
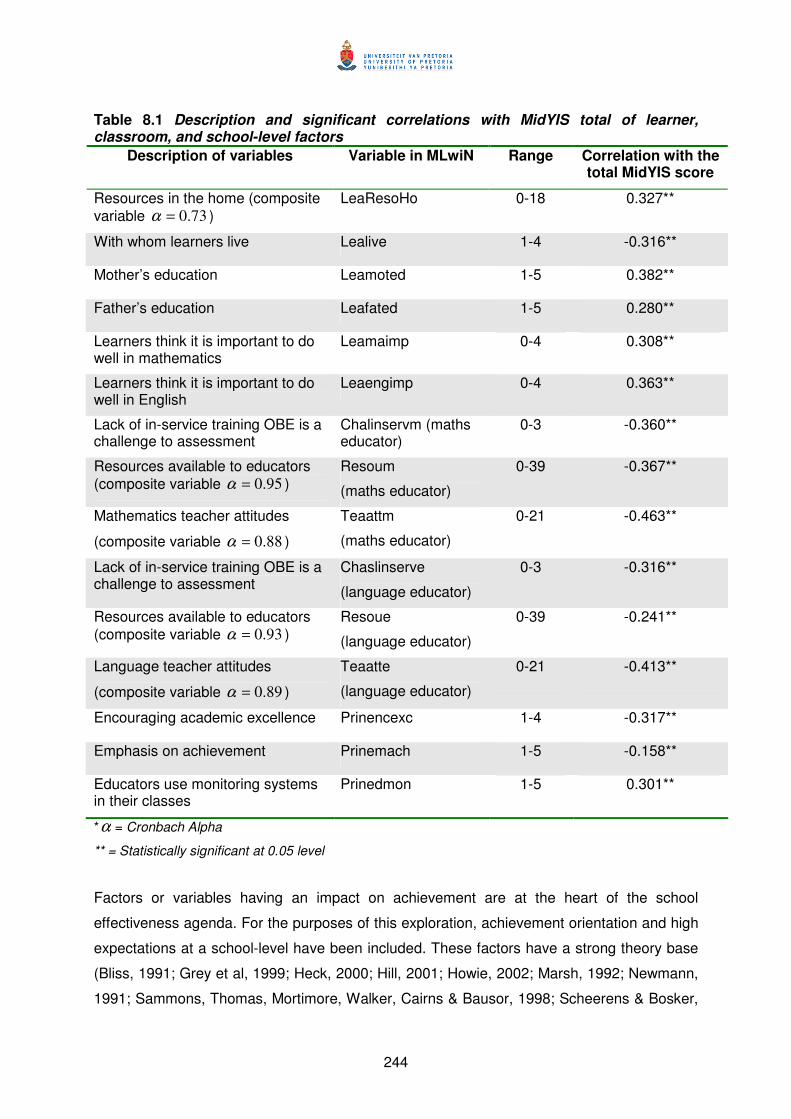
244
Table 8.1 Description and significant correlations with MidYIS total of learner, classroom, and school-level factors
Description of variables Variable in MLwiN Range Correlation with the total MidYIS score
Resources in the home (composite
variable 73.0=α )
LeaResoHo 0-18 0.327**
With whom learners live Lealive 1-4 -0.316**
Mother’s education Leamoted 1-5 0.382**
Father’s education Leafated 1-5 0.280**
Learners think it is important to do well in mathematics
Leamaimp 0-4 0.308**
Learners think it is important to do well in English
Leaengimp 0-4 0.363**
Lack of in-service training OBE is a challenge to assessment
Chalinservm (maths educator)
0-3 -0.360**
Resources available to educators
(composite variable 95.0=α )
Resoum
(maths educator)
0-39 -0.367**
Mathematics teacher attitudes
(composite variable 88.0=α )
Teaattm
(maths educator)
0-21 -0.463**
Lack of in-service training OBE is a challenge to assessment
Chaslinserve
(language educator)
0-3 -0.316**
Resources available to educators
(composite variable 93.0=α )
Resoue
(language educator)
0-39 -0.241**
Language teacher attitudes
(composite variable 89.0=α )
Teaatte
(language educator)
0-21 -0.413**
Encouraging academic excellence Prinencexc 1-4 -0.317**
Emphasis on achievement Prinemach 1-5 -0.158**
Educators use monitoring systems in their classes
Prinedmon 1-5 0.301**
*α = Cronbach Alpha
** = Statistically significant at 0.05 level
Factors or variables having an impact on achievement are at the heart of the school
effectiveness agenda. For the purposes of this exploration, achievement orientation and high
expectations at a school-level have been included. These factors have a strong theory base
(Bliss, 1991; Grey et al, 1999; Heck, 2000; Hill, 2001; Howie, 2002; Marsh, 1992; Newmann,
1991; Sammons, Thomas, Mortimore, Walker, Cairns & Bausor, 1998; Scheerens & Bosker,
245
1997; Scheerens, 1990, 1992, 2001a; Teddlie, 1994a, 1994c; Wills & Somers, 2001) and can
be defined as having a clear focus on achievement and the mastering of subjects at a basic
level in addition to encouraging high performance.
On a classroom-level, staff development or professional development has been identified as
an important factor (Howie, 2002; Muijs, Harris & Chapman, 2004; Sammons, 1999; Teddlie,
1994b). The focus is on in-service training aimed at professional development in order to
improve teaching practices (Halloway, 2003; Hirsh, 2005). Other factors included are
resources available (Schereens, 2001a; 2001b) and educator attitudes.
Learner-level factors or variables include learner attitudes (Howie, 2002; Mortimore, 1998;
Sammons, 1999), specifically towards English and mathematics. Depending on whether
attitudes are positive or negative, behaviour may be promoted or inhibited in the classroom
and at home (Anderson, 1994). Learner background characteristics are also included. The
person(s) with whom the learner lives and the education of the mother provide some insight
into the home environment of the learner and studies have linked these two factors to
performance (Hortacsu, 1995; Milne & Plourde, 2006).
From the factors identified in Table 8.1 and the theoretical justification provided above, it is
possible to construct a hypothetical model to be tested during the multilevel analyses. Figure
8.1 provides the proposed model. Three levels were identified. The school-level impacts on
the classroom-level. The factors on the classroom-level as identified in Figure 8.1 impact the
factors on the learner-level. However, it is also possible to assumed that perhaps the learner-
level has a direct effect on the classroom-level and indirect effect on the school-level via the
classroom-level while the classroom has a direct effect on the school-level.
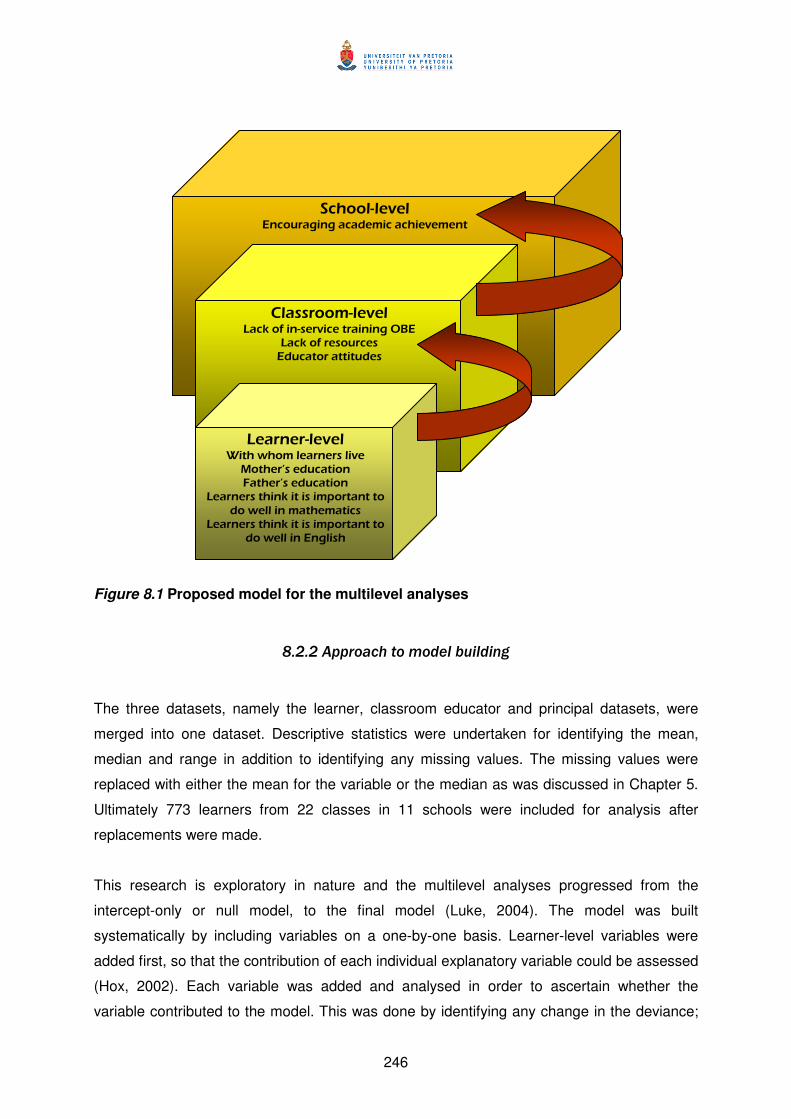
246
Figure 8.1 Proposed model for the multilevel analyses
8.2.2 Approach to model building
The three datasets, namely the learner, classroom educator and principal datasets, were
merged into one dataset. Descriptive statistics were undertaken for identifying the mean,
median and range in addition to identifying any missing values. The missing values were
replaced with either the mean for the variable or the median as was discussed in Chapter 5.
Ultimately 773 learners from 22 classes in 11 schools were included for analysis after
replacements were made.
This research is exploratory in nature and the multilevel analyses progressed from the
intercept-only or null model, to the final model (Luke, 2004). The model was built
systematically by including variables on a one-by-one basis. Learner-level variables were
added first, so that the contribution of each individual explanatory variable could be assessed
(Hox, 2002). Each variable was added and analysed in order to ascertain whether the
variable contributed to the model. This was done by identifying any change in the deviance;
School-level Encouraging academic achievement
Classroom-level Lack of in-service training OBE
Lack of resources Educator attitudes
Learner-level With whom learners live Mother’s education Father’s education
Learners think it is important to do well in mathematics
Learners think it is important to do well in English
247
here deviance refers to how well the model fits the data as was discussed in Chapter 5.
Furthermore, whether the parameters were significant was also calculated by means of the
Z-test, also known as the Wald test (Hox, 1995).
The intercept-only model gives an estimate for the intra-class correlation but also provides a
measure of the degree of misfit in the model (Hox, 1995). After the intercept model had been
examined and the intra-class correlations calculated, the first level or learner-level
explanatory variables were added.
The parameters were fixed so that the contribution of each explanatory variable could be
assessed. Here fixed means that the corresponding variance components of the slopes were
set at zero (Hox, 1995). Full Maximum Likelihood (FML) estimation was used. This estimation
method provides the opportunity to test the improvement of every consecutive model (Hox,
2002). This was done by means of computing the difference (chi-square variant) of the
deviance from the model under investigation to the intercept-only model (Hox, 1995).
The second-level or classroom-level explanatory variables were then added and were
evaluated. The classroom-level variables were explored in terms of random variance
components. However, once random components had been introduced into the model non-
convergence occurred. According to Hox (2002), the result of non-convergence is often an
indication that random components can be omitted. Furthermore, sample size plays a large
role as the sample size for this study was relatively small on the school and classroom-level
(11 schools and 22 classes). The general rule of thumb is 30 groups and at least 30
individuals per group (Hox, 2002). Issues about sampling were elaborated on in Chapter 5.
However, clearly due to the small sample sizes, methodological constraints were imposed,
such as only including fixed parameters. Once significant variables were identified, chi-
square analysis was undertaken in order to test whether the model in this step fits better than
the previous model.
The third-level explanatory variables or school-level variables were added and the model
examined to determine whether there were variables explaining between group variation
(Hox, 2002; Luke, 2004). Once again only fixed parameters were included. Finally, cross-
level interactions between explanatory group level variables and the individual level
explanatory variables were explored. (Hox, 1995; Luke, 2004). However, for accurate and
significant estimations, the number of groups should be larger than the number of individuals.
Hox (2002) suggests that at least 50 groups with 20 individuals per group are needed (see
248
Chapter 5 for more details). Thus even though cross-level interactions were explored, the
results were not significant.
8.3 The results of the multilevel analyses
Several models were run (see Appendix M for details). However for discussion purposes only
the final models are presented in this section. The null model is discussed in 8.3.1. As was
indicated in 8.2.2 this model contains no explanatory variables. Three models are discussed
in 8.3.2. The models are the final models for the inclusion of explanatory variables at each
level namely the learner-level, the learner and classroom-level and finally the learner,
classroom and school-level.
8.3.1 The null model
The null model, or the intercept-only model, is the first step in building a multilevel model and
does not contain any explanatory variables (Luke, 2004):
ijkjkijk etotalper += 0β
Where jkkjk uv 0000 ++= ββ
As was discussed in 8.2.3, the null model is an essential first step in the model building
process as it provides a base from which consecutive models can be evaluated. The null
model for this exploration (refer to Table 8.2) has an intercept of 47.995 (3.429) which is very
similar to the overall mean for the sample (46.7%).
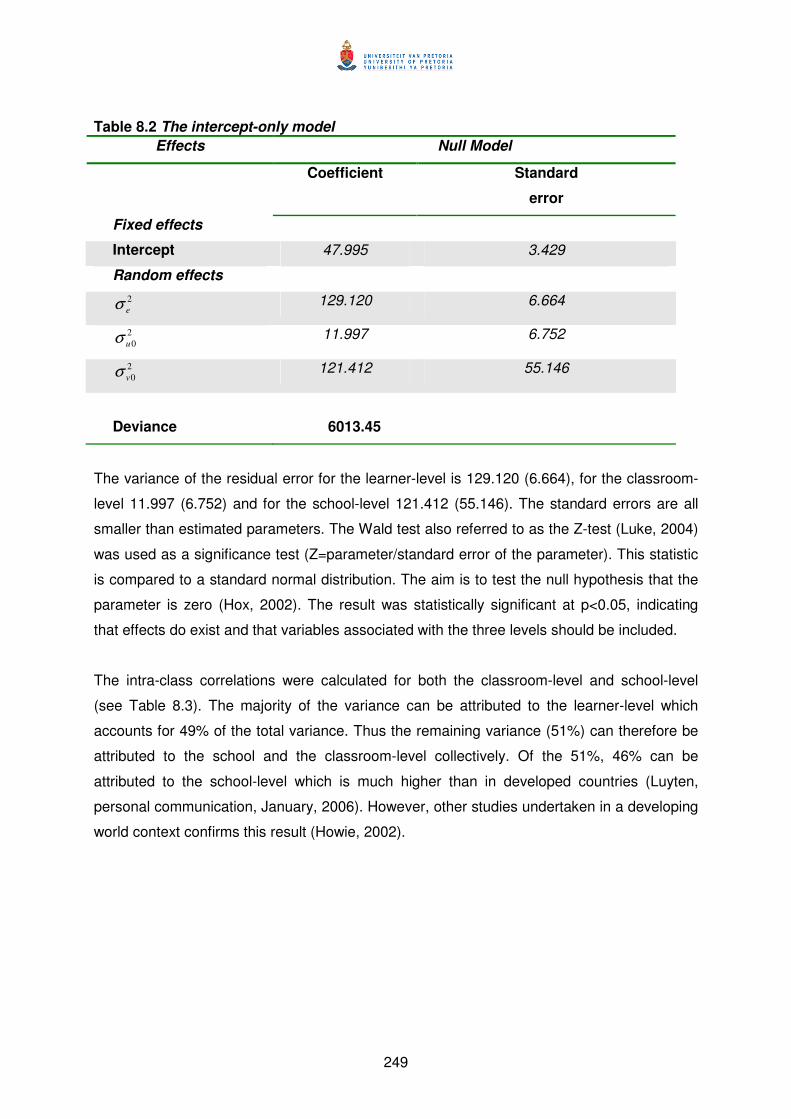
249
Table 8.2 The intercept-only model
Effects Null Model
Coefficient Standard
error
Fixed effects
Intercept 47.995 3.429
Random effects
2
eσ 129.120 6.664
2
0uσ 11.997 6.752
2
0vσ 121.412 55.146
Deviance 6013.45
The variance of the residual error for the learner-level is 129.120 (6.664), for the classroom-
level 11.997 (6.752) and for the school-level 121.412 (55.146). The standard errors are all
smaller than estimated parameters. The Wald test also referred to as the Z-test (Luke, 2004)
was used as a significance test (Z=parameter/standard error of the parameter). This statistic
is compared to a standard normal distribution. The aim is to test the null hypothesis that the
parameter is zero (Hox, 2002). The result was statistically significant at p<0.05, indicating
that effects do exist and that variables associated with the three levels should be included.
The intra-class correlations were calculated for both the classroom-level and school-level
(see Table 8.3). The majority of the variance can be attributed to the learner-level which
accounts for 49% of the total variance. Thus the remaining variance (51%) can therefore be
attributed to the school and the classroom-level collectively. Of the 51%, 46% can be
attributed to the school-level which is much higher than in developed countries (Luyten,
personal communication, January, 2006). However, other studies undertaken in a developing
world context confirms this result (Howie, 2002).
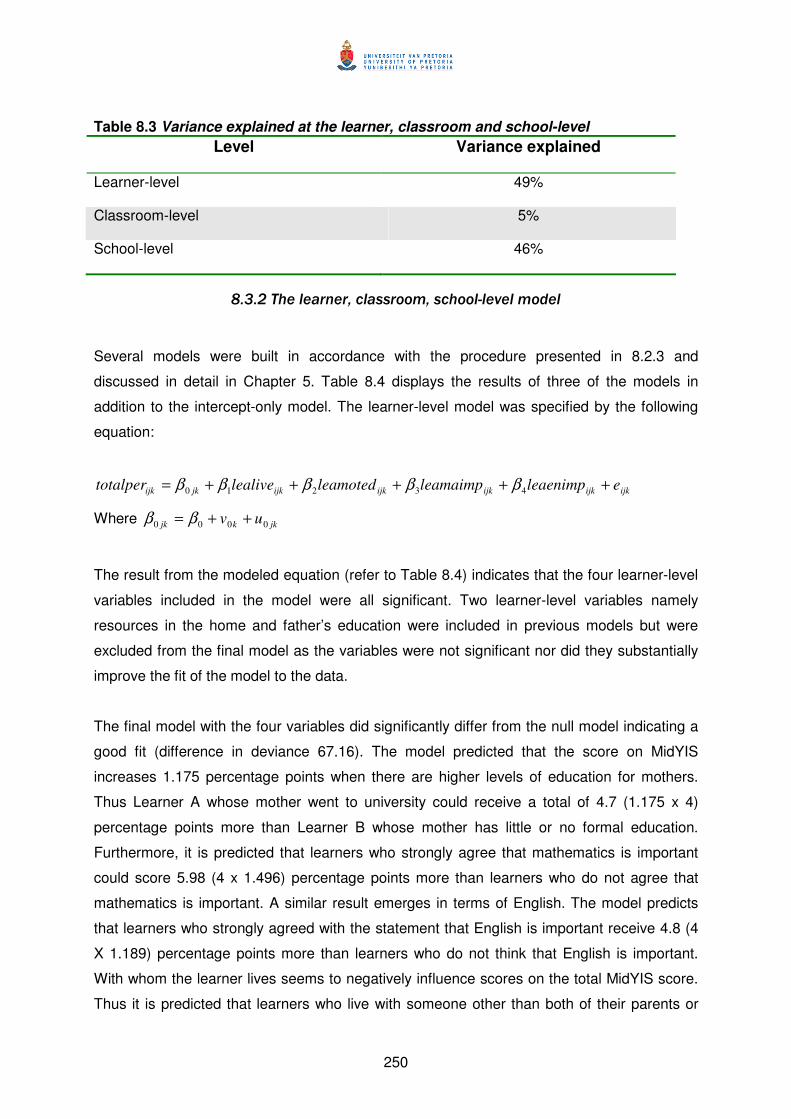
250
Table 8.3 Variance explained at the learner, classroom and school-level
Level Variance explained
Learner-level 49%
Classroom-level 5%
School-level 46%
8.3.2 The learner, classroom, school-level model
Several models were built in accordance with the procedure presented in 8.2.3 and
discussed in detail in Chapter 5. Table 8.4 displays the results of three of the models in
addition to the intercept-only model. The learner-level model was specified by the following
equation:
ijkijkijkijkijkjkijk eleaenimpleamaimpleamotedlealivetotalper +++++= 43210 βββββ
Where jkkjk uv 0000 ++= ββ
The result from the modeled equation (refer to Table 8.4) indicates that the four learner-level
variables included in the model were all significant. Two learner-level variables namely
resources in the home and father’s education were included in previous models but were
excluded from the final model as the variables were not significant nor did they substantially
improve the fit of the model to the data.
The final model with the four variables did significantly differ from the null model indicating a
good fit (difference in deviance 67.16). The model predicted that the score on MidYIS
increases 1.175 percentage points when there are higher levels of education for mothers.
Thus Learner A whose mother went to university could receive a total of 4.7 (1.175 x 4)
percentage points more than Learner B whose mother has little or no formal education.
Furthermore, it is predicted that learners who strongly agree that mathematics is important
could score 5.98 (4 x 1.496) percentage points more than learners who do not agree that
mathematics is important. A similar result emerges in terms of English. The model predicts
that learners who strongly agreed with the statement that English is important receive 4.8 (4
X 1.189) percentage points more than learners who do not think that English is important.
With whom the learner lives seems to negatively influence scores on the total MidYIS score.
Thus it is predicted that learners who live with someone other than both of their parents or
251
guardians would score 4.11 (-1.371 x 3) less than learners who live with either their parents
or guardians.
For the learner and classroom-level model, four learner-level explanatory variables and one
classroom-level explanatory variable were included (refer to Table 8.4) in the final model for
these two levels. In previously modeled equations resources and teacher attitudes for both
mathematics educators and language educators in addition to challenge to assessment due
to in-service training for language educators were included. However, these variables were
not significant, had standard errors substantially larger than the estimated parameters and
did not substantially improve the fit of the model (see Appendix M for examples). The final
two-level model was specified by the following equation:
ijkjkijkijkijkijkjkijk emchalinservleaenimpleamaimpleamotedlealivetotalper ++++++= 543210 ββββββ
where jkkjk uv 0000 ++= ββ
The picture that emerged for the learner-level is very similar to what was described when the
learner-level only model was discussed. Thus learners who live with either their parents or
guardians scored 4 (1.349 x 3) more than learners who live with relative or some other
arrangement. Similarly, learners whose mothers have higher levels of education scored 4.7
(1.186 x 4) percentage points more than learners whose mothers have lower-levels of
education. In terms of the importance of mathematics and English, learners who agree that
mathematics 5.97 (1.492 x 4) and 4.7 (1.176 x4) percentage points higher than learners who
do not agree that mathematics, whilst for the importance of English the percentage points is
4.7 (1.176). Furthermore, learners who are taught by educators who feel that due to a lack of
in-service training they are not able to use a variety of teaching and assessment methods as
stipulated by OBE scored 8.23 (-2.745 x 3) percentage points less than learners who are
taught by educators who feel that they are able to cope with OBE. However, with a standard
error as large as the standard error for chalinservm (1.255) the result should be interpreted
with caution (chalinservm - lack of in-service training OBE is a challenge to assessment for
mathematics).
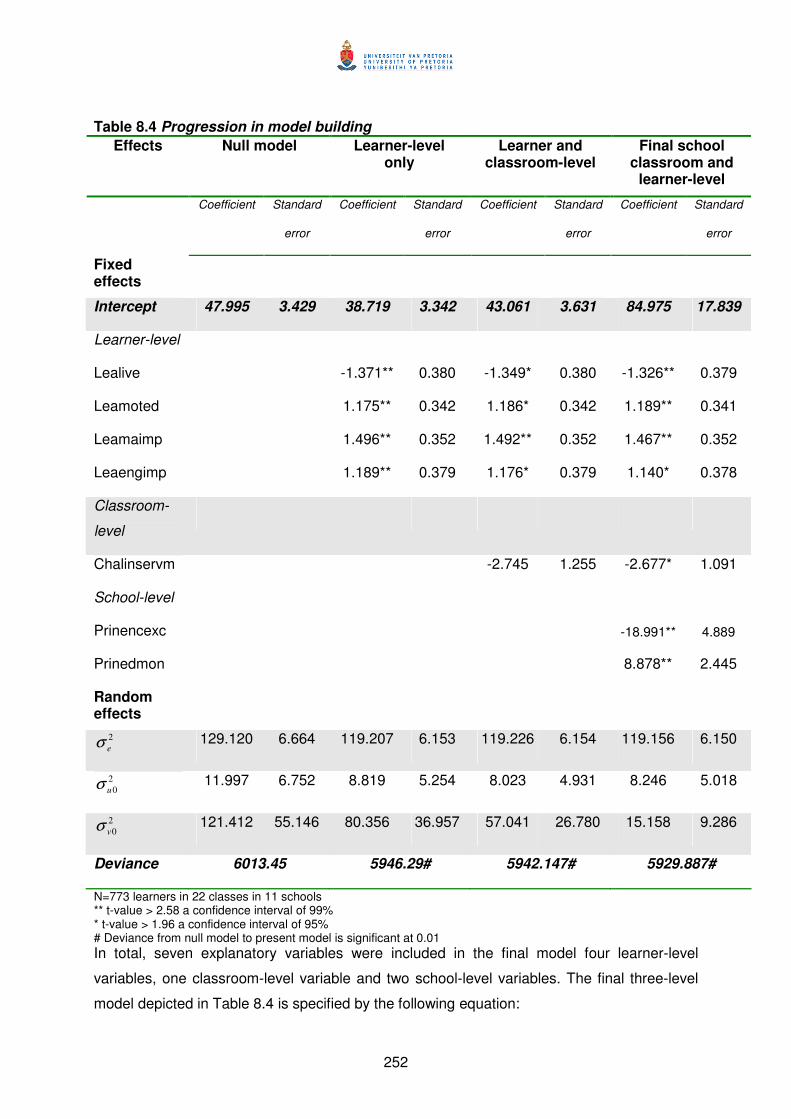
252
Table 8.4 Progression in model building
Effects Null model Learner-level only
Learner and classroom-level
Final school classroom and
learner-level
Coefficient Standard
error
Coefficient Standard
error
Coefficient Standard
error
Coefficient Standard
error
Fixed effects
Intercept 47.995 3.429 38.719 3.342 43.061 3.631 84.975 17.839
Learner-level
Lealive -1.371** 0.380 -1.349* 0.380 -1.326** 0.379
Leamoted 1.175** 0.342 1.186* 0.342 1.189** 0.341
Leamaimp 1.496** 0.352 1.492** 0.352 1.467** 0.352
Leaengimp 1.189** 0.379 1.176* 0.379 1.140* 0.378
Classroom-
level
Chalinservm -2.745 1.255 -2.677* 1.091
School-level
Prinencexc -18.991** 4.889
Prinedmon 8.878** 2.445
Random effects
2
eσ 129.120 6.664 119.207 6.153 119.226 6.154 119.156 6.150
2
0uσ 11.997 6.752 8.819 5.254 8.023 4.931 8.246 5.018
2
0vσ 121.412 55.146 80.356 36.957 57.041 26.780 15.158 9.286
Deviance 6013.45 5946.29# 5942.147# 5929.887#
N=773 learners in 22 classes in 11 schools ** t-value > 2.58 a confidence interval of 99% * t-value > 1.96 a confidence interval of 95% # Deviance from null model to present model is significant at 0.01
In total, seven explanatory variables were included in the final model four learner-level
variables, one classroom-level variable and two school-level variables. The final three-level
model depicted in Table 8.4 is specified by the following equation:
253
ijk
jkijkijkijkijkjkijk
eprinedmonprinencexc
mchalinservleaenimpleamaimpleamotedlealivetotalper
+++
+++++=
76
543210
ββ
ββββββ
Where jkkjk uv 0000 ++= ββ
The final model (refer to Table 8.4) is the best of the three models as it fits the data better, as
indicated by the deviance, which is lowest of all the models. The model illustrates that if
learners think that mathematics and English are important, live with either their parents or
guardians and whose mothers have a higher level of education tend to score more
percentage points. On the other hand, the result for learners who do not think mathematics
and English are important, and/or do not live with either their parents or guardians and/or
whose mother has little or no formal education is substantially lower. In terms of the second-
level or classroom-level variable learners who are taught by educators who feel that their
teaching practice is negatively affected by the lack of in-service training tend to score up to 8
(-2.677 x 3) percentage points less than learners who are taught by educators who do not
share this view. Finally, it appears as if in schools where the principal does encourage
academic excellence, learners tend to fare worse. It is possible that strategies and
programmes are not put in place to add action to the vision of academic excellence.
Alternatively it is possible that due to low morale among educators and learners academic
excellence is not claimed as their own but rather externally enforced with little effect. In
schools where principals indicated that educators do make use of monitoring systems,
learners tended to fare better. Interestingly enough, when monitoring at the educator level is
left out then emphasis on academic achievement is no longer significant. This indicates a
relationship between these two variables.
Proportion of variance explained by consecutive models
An important statistic…is the multiple correlation R, or the squared
multiple correlation R² which is interpreted as the proportion of
variance modeled by the explanatory variables (Hox, 2002, p. 63)
The proportion of variance modeled can be calculated by means of using the residual error
variance, namely2
eσ , 2
0uσ and2
0vσ , and the intercept-only model as a baseline (Hox, 2002).
In addition to calculating the proportion of variance explained (Table 8.5); the Akaike
Information Criterion (AIC) was also calculated. The AIC is a fit statistic based on the
deviance (Table 8.4) but also includes the number of parameters added (Luke, 2004). The
254
AIC was calculated by adding the deviance and twice the number of parameters. As with the
deviance, the lower the AIC the better the model (Luke, 2004).
In the final model depicted in Table 8.5 the school-level variance is estimated at 87.5%, while
on the classroom-level 31% is estimated with 7.7% estimated at the learner-level. Thus there
is a higher proportion of variance explained between schools than within schools. When the
learner-level model is considered 33.8% of the variance is explained between schools while
only 7.7% can be attributed to the learner-level. As can be seen from the succession of each
model the learner-level variance remains the same, which is to be expected. An interesting
observation for the final model is that 87.5% of the variance is explained on the school-level.
This is quite high, however the result may be explained by the fact that the schools were
chosen according to maximum variation sampling (see Chapter 5) and there are only a small
number of schools (eleven schools). However, clearly there are additional factors that would
need to be explored at all levels to account for the unexplained variance.
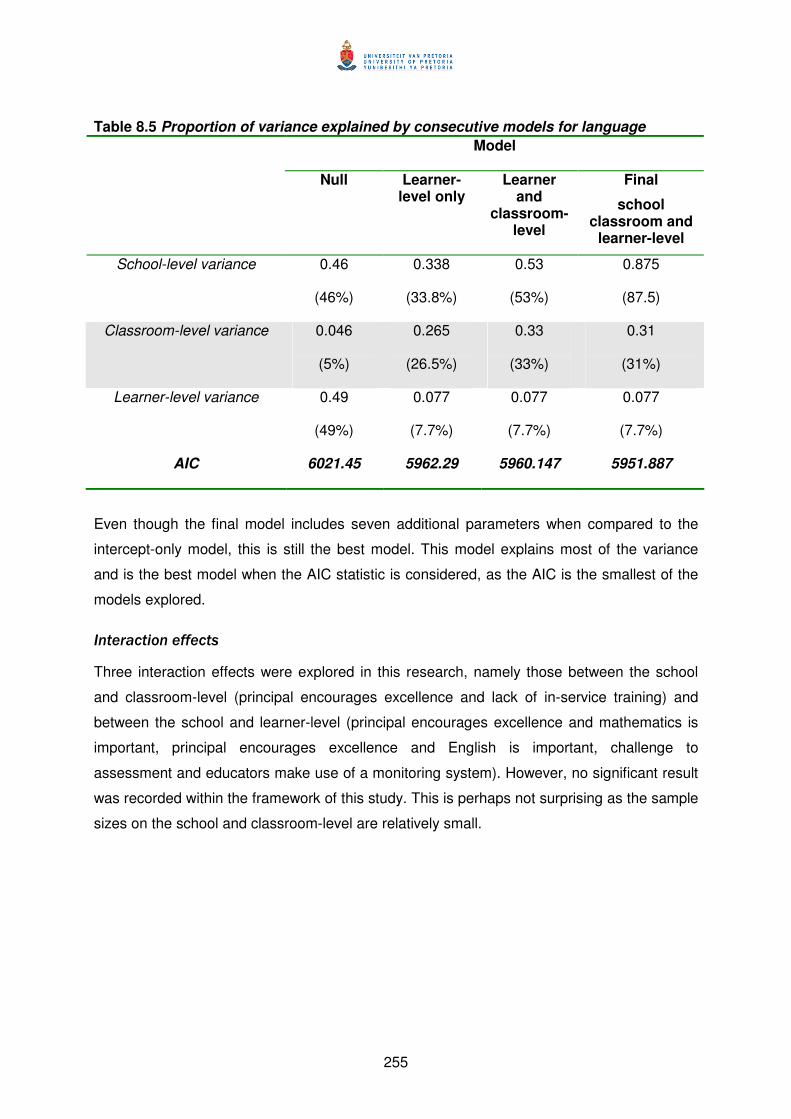
255
Table 8.5 Proportion of variance explained by consecutive models for language
Model
Null Learner-level only
Learner and
classroom-level
Final
school classroom and
learner-level
School-level variance 0.46
(46%)
0.338
(33.8%)
0.53
(53%)
0.875
(87.5)
Classroom-level variance 0.046
(5%)
0.265
(26.5%)
0.33
(33%)
0.31
(31%)
Learner-level variance 0.49
(49%)
0.077
(7.7%)
0.077
(7.7%)
0.077
(7.7%)
AIC 6021.45 5962.29 5960.147 5951.887
Even though the final model includes seven additional parameters when compared to the
intercept-only model, this is still the best model. This model explains most of the variance
and is the best model when the AIC statistic is considered, as the AIC is the smallest of the
models explored.
Interaction effects
Three interaction effects were explored in this research, namely those between the school
and classroom-level (principal encourages excellence and lack of in-service training) and
between the school and learner-level (principal encourages excellence and mathematics is
important, principal encourages excellence and English is important, challenge to
assessment and educators make use of a monitoring system). However, no significant result
was recorded within the framework of this study. This is perhaps not surprising as the sample
sizes on the school and classroom-level are relatively small.
256
8.4 Conclusion
Learning can be influenced by a number of factors some of which are school and classroom
related while others are not, for example, the environment in the home. However, if learning
and achievement based on learning is to be understood, attempts should be made to explore
the factors which impact on achievement. In this chapter, an attempt has been made to
identify some of the factors which could have influenced the overall result on the MidYIS
assessment. This influence, however, is not causal in nature but rather identifies tendencies.
The exploration was guided by the main research question which factors could have an
effect on learner performance and therefore inform the design of the monitoring
system? This broad research question comprises four specific research questions. Each of
the specific research questions are discussed separately in light of the findings presented in
this chapter.
2.1 What factors on a school-level affect the performance of learners on the
assessment?
Eighty-seven point five percent of the variance can be attributed to the school-level. This
result is perhaps not surprising as other research from the developing world (Howie, 2002)
has shown similar outcomes in terms of the large percentage of variance found at the school-
level. It has to be kept in mind that the schools were selected by means of maximum
variation sampling so schools which were vastly different were purposively selected and this
could also account for the large percentage of variance. Two factors, of the three factors, on
the school-level were included in this exploration, namely encouraging academic excellence
and educators making use of monitoring systems. Academic expectations have to be
translated into school policies and goals. Murphy (1988) reports that raising expectations and
following this through with support programmes and staff development can increase the
achievement of learners. Furthermore, in a study comparing high impact schools with
average impact schools, it was found that high impact schools had a culture of high
expectations. This culture of academic achievement was expressed in school policy
documents and school practices focused on preparing learners for further education and the
world of work (Perkins-Gough, 2006). Perhaps Murphy, Weil, Hallinger & Mitman, (1982, p.
24) said it the best “…schools that promote academic achievement have clearly defined
goals based on academic matters.”
Furthermore, monitoring of learner progress and indeed making use of monitoring systems
has an affect on learner performance as substantiated in literature (Heck, 2000; Marsh, 1992;
257
Mortimore, 1998; Scheerens & Bosker, 1997; Scheerens & Creemers, 1999; Scheerens,
1992, 2001a; Teddlie, 1994a). A similar result was found in this study. This is elaborated on
further in Chapter 9.
2.2 What factors on a classroom-level affect the performance of learners on the
assessment?
Very often the aim of policy-makers and school management is to find the most effective
remedy which will take the least amount of time to implement and which will be cost-effective.
From a management perspective this makes sense but this does not make sense when
whole generations of children are left behind because they cannot cope academically.
Educators or teachers are essential if the success of learning and achievement as an
outcome is to be ascertained, as stated by Bafumo (2005, p. 8) ”… factors at the school,
teacher and student level all impact on learning, but teachers are key to student
achievement”.
Six factors were identified to be included for exploration, namely resources, educator
attitudes and challenge to assessment due to a lack of in-service training for both
mathematics and language educators. Of the factors only one factor, namely challenge to
assessment due to a lack of in-service training for mathematics educators, was included in
the final model. Hirsh (2005, p. 38) concludes based on his research:
…no single ingredient has greater impact on student achievement
than the quality of the teacher in the classroom… not all teachers are
adequately prepared to meet the diverse needs of today’s students…
Quality professional development employs these strategies, improves
teaching, and closes achievement gaps.
Based on the quotation above, it may not be surprising that the issue of in-service training or
rather the lack of in-service training is a prominent factor. If performance data is to be used
by educators to focus on the specific needs of learners (Holloway, 2003), then educators
need to know how to design effective assessments and use the information to guide their
teaching practice. Furthermore, this factor alone accounted for most of the variance
attributed to the classroom-level; this is discussed further in Chapter 9.
258
2.3 What factors on a learner-level affect performance of learners on the
assessment?
Originally six factors were identified for exploration namely resources in the home, with whom
the learners live, mother’s education, father’s education and the importance of mathematics
and English. Of the six factors only four namely with whom the learners live, mother’s
education and the importance of mathematics and English, were significant. These four
factors accounted for 7.7% of the variance. What seems to be clear is that the home
environment of the learners has an effect on achievement. This result has been found
elsewhere (such as the Coleman report released in 1966). For example in Nigeria
specifically, the level of parental education, occupations of parents and size of family were
correlated to achievement (Bolarin, 1992). More specifically perhaps, as in a study
undertaken in Turkey, it was found that the mothers’ level of education had a direct effect on
learner performance (Hortacsu, 1995; Milne & Plourde, 2006). While the home environment
seems to play an important role, learner attitudes and motivation seems to be important
factors as well (Halawah, 2006; Howie, 2002).
2.4 How can the identified factors be included in the design of the monitoring
system?
Education is important. Educational policies need to be found that are
effective and cost-effective. To achieve this demands that policies are
based on sound evidence (Fitz-Gibbon, 2003, p. 313).
Clearly it is important to include the factors discussed in this exploration in a monitoring
system using MidYIS. MidYIS was designed as a learner-level monitoring system. Thus it
would seem plausible to include learner-level contextual factors. However, learning does not
take place in a vacuum and as school effectiveness research has shown, factors on a
classroom and school-level do have an effect on performance. For this reason, a monitoring
system focusing on a single level has limitations. Perhaps a battery of instruments is
required, in which instruments are associated with each level of the school system.
Furthermore, in the context of South Africa and in light of the Integrated Quality Management
System (IQMS) (as was discussed in Chapter 1) additional factors should be included so that
schools can undertake self-evaluations. This is discussed in more detail in Chapter 9.
As has been illustrated in this chapter, factors at all three levels do account for the
percentage of variance attributed to each level. However, there is still variance unaccounted

259
for in the models presented in this chapter, indicating that additional factors should be
considered. Due to the practical constraint of sample size, it was not possible to do so. This
does not mean that this is the end of the story. The exploration does lay the foundation for
further analytical work to be undertaken. If the core factors based on sound empirical work
can be identified then policy development and reform can take place. Furthermore, the value-
added nature of the assessment when taken in conjunction with exit-level examinations
provides additional information for use in self-evaluation exercises undertaken by schools.
260
CHAPTER 9CHAPTER 9CHAPTER 9CHAPTER 9
CONCLUSIONS AND RECOMMENDATIONSCONCLUSIONS AND RECOMMENDATIONSCONCLUSIONS AND RECOMMENDATIONSCONCLUSIONS AND RECOMMENDATIONS
As the final chapter of the dissertation, this chapter includes a
summary and reflection on the findings. This is followed by reflections
on the process, specifically in terms of the methodology used,
situating this research within the field of school effectiveness and the
contribution made to the broader body of knowledge. The reflections
lead to a number of recommendations of what constitutes a suitable
monitoring system for South Africa, how policy can be informed and
what further research is needed. The chapter concludes with a
discussion on the vital role feedback and intervention based on
feedback plays in the utilisation of monitoring data.
9.1 Introduction
Learners may fail to reach their potential for a number of reasons that can be attributed to a
range of social, school-based, and home-based factors. These may include large classes,
inadequately trained educators, unsupportive educators and a school ethos based on
academic competitiveness. For some learners, low levels of parental literacy may provide an
additional barrier. In cases where parents are unable to give education-related help to their
children at home, they may also lack confidence to approach the school should their children
experience difficulties. Such parents are unlikely to provide a home environment to their
children where literacy is valued (Hartley, 1990).
In order to be able to say anything about the performance of learners, the quality of the
instrument used has to be considered (Luyten, Visscher & Witziers, 2005) and whether the
instrument is fair to all learners has to be explored (Pelgrum, 1989). The aim of this research
was to explore the possibility of using a monitoring system developed in the United Kingdom
in the context of South Africa. What follows in this chapter is a reflection on the results of this
research in an attempt to put forward recommendations on the use of monitoring systems for
261
practitioners and policy-makers alike. However, before presenting the recommendations, a
summary of the results according to the research questions is given (9.2). This is followed by
a discussion on and consideration of (9.3) the methodology used (9.3.1), reflections in light of
school effectiveness research (9.3.2) and with how this research contributes to the body of
knowledge in the domain of education (9.3.3). Recommendations are discussed in 9.4,
specifically with regard to monitoring systems for South Africa (9.4.1), policy issues (9.4.2)
and further research (9.4.3). The chapter is brought to a close by a discussion of the role of
feedback and interventions in the utilisation of performance data received from monitoring
systems (9.5).
9.2 Summary of the research
The issue of quality education is a topic of discussion, with South Africa facing the challenge
of trying to implement policy on monitoring education. According to Pelgrum (1989),
discussions about the quality of education occur in many societies with the aim to determine
what learners learn when they are at school. Muller (2004, p. 221) states that assessment “is
the most important system for signalling systemic efficiency and accountability”. In South
Africa, the use of assessment as an instrument to ascertain the efficiency of the education
system began to enter into the “policy discourse” in the late 1990’s (Muller, 2004, p. 224) and
individual processes of evaluation were put in place (Muller, 2004). As was discussed in
Chapter 1 the main policy foci were:
� Systemic Evaluation;
� Whole School Evaluation and more broadly perhaps;
� The Integrated Quality Management System.
What is clear is that there is a move to put policies in place to address issues of quality,
equity, and redress. According to Muller (2004, p. 239)
…we see a discernible move since 1994 away from an underdeveloped systemic
policy (Grade 12 external assessment only) towards a marked progressive
preference for formative, process, and integrative kinds of assessment with little
real progress towards comprehensive systemic assessment.
Mechanisms for ascertaining the quality of education, in South Africa, are not functioning
optimally in secondary schools, with the Department of Education mostly focusing its
energies on the primary schools. What is clear is that without the necessary data provided by
valid and reliable assessment instruments the “learning gaps in the system can’t be known”
262
(Muller, 2004, p. 240). Without this information, informed decisions on interventions and
indeed funding cannot be made (Muller, 2004).
The current research takes place against the backdrop of monitoring secondary education in
order to ascertain the quality of teaching and learning. Monitoring, in this research, entails
“not only the measurement of the output of a system, but also the evaluation of the measure”
(Pelgrum, 1989, p. 8). This is by no means a small issue, as in the words of Sammons (2006,
p. 2) “raising standards of achievement is seen as fundamental to economic performance
and promotion of democratic engagement”.
This research project is undertaken in collaboration with the Curriculum, Evaluation, and
Management Centre (CEM) at Durham University in the United Kingdom and is funded by
the South African National Research Foundation. The Middle Years Information System
(MidYIS) project was originally developed by CEM with the aim of providing schools with
information on how learners would perform at the end of two national examinations, namely
Key Stage 3 and General Certificate in Secondary Education, in addition to providing value-
added information. MidYIS makes use of a developed abilities assessment (see Chapter 4
for details). The assessment itself includes seven sub-tests that are combined to form four
scales, namely:
1) Vocabulary scale
� Vocabulary sub-test
2) Mathematics scale
� Mathematics sub-test
3) Skills scale
� Proof reading sub-test
� Perceptual speed and accuracy sub-test
4) Non-verbal scale
� Cross-sections sub-test
� Block counting sub-test
� Pictures sub-test
This research draws heavily on school effectiveness and school improvement literature as
well as literature regarding the use of developed ability assessments (see Chapter 2). The
central theme in school effectiveness research is the idea that schools do matter. The aim is
263
to disentangle the complex mix of learner characteristics and the educational experiences
and to investigate how these interact to influence the development, progress and
performance of learners (Sammons, 2006). The conceptual framework for this study drew on
the work of Scheerens (1990). Scheerens (1990) developed an input-process-output model
incorporating factors on the school and classroom-levels. This model was adapted and
extended by means of including a learner-level and also by adding factors, which literature
suggested as important for a developing world context.
Two main research questions were identified which can be divided into specific research
questions and sub-research questions (see Chapter 3). These can be depicted graphically
(refer to Figure 9.1).
The first research main research question guiding the study is how appropriate is the
Middle Years Information System (MidYIS) as a monitoring system in the South African
context. Here the word appropriate implies how suitable the MidYIS system would be for
South Africa, looking specifically at issues related to how the MidYIS system compares with
other monitoring systems, validity, reliability and what suggestions could be put forward so
that MidYIS would be suitable for South Africa. Various facets of validity were investigated. In
particular content-related validity (including curriculum validity), construct-related validity, and
predictive validity were examined while inferences drawn with regard to reliability were done
by means of internal consistency reliability. The first main research question has been
operationalised by means of three specific research questions namely:
1.1. How does the Middle Years Information System (MidYIS) compare to
other monitoring systems?
1.2. How valid and reliable are the data generated by the MidYIS monitoring
system for South Africa?
1.3. What adaptations are needed to turn MidYIS into a monitoring system for
the South African context
The second main research question extends the first research question. If MidYIS is valid,
with South African adaptations, and reliable then what factors on a school, classroom, and
learner-level could have an effect on learner performance. Thus the second main research
question is which factors could have an effect on learner performance and therefore
inform the design of the monitoring system. This research question has been
operationalised by means of four specific research questions namely:
264
2.1. What factors on a school-level affect performance of learners on the
assessment?
2.2. What factors on a classroom-level affect performance of learners on the
assessment?
2.3. What factors on a learner-level affect performance of learners on the
assessment?
2.4. How can the factors identified be included in the monitoring system?
A non-experimental pragmatic approach was adopted in this research (see Chapter 5). For
pragmatism, both the meaning and the truth of any idea are functions of its practical outcome
(Maxcy, 2003). It is the problem, which is of importance and not a preoccupation with
methods (Creswell, 2003). Outcomes are what counts and not necessarily prior knowledge
claims, laws or even what is true (Maxcy, 2003). Subjective and objective perspectives in
addition to methods should be used in order to achieve the desired outcome. This integration
of methods from the different paradigms is a powerful way of enhancing the credibility of
findings (Petter & Gallivan, 2004). The view is held that there are similarities in the
fundamental values between quantitative and qualitative approaches. These beliefs include
the value-ladeness of inquiry, theory-ladeness of facts, that reality is multiple and constructed
as well as that knowledge is fallible (Tashakkori & Teddlie, 1998).
Pragmatism lends itself to the use of mixed methods, which provides the researcher with the
opportunity to answer the research questions adequately (Teddlie & Tashakkori, 2003). By
using mixed methods, one may come to a more comprehensive understanding of the
phenomena under investigation as this way one may develop a more complete portrayal of
the social world as well as gain fresh perspectives and new ideas. The account of research
using mixed methods is also more defensible as there is less bias as the one method
compensates for the other method. Thus one is able to develop stronger knowledge claims
(Greene, 2005). Mixed methods intentionally combine different tools and techniques to
gather, structure, analyse and interpret quantitative and qualitative data (Williams, 1999).
Various typologies can be identified under the banner mixed methods.
The typology used for this research is a concurrent nested strategy (refer to Chapter 5 for
more detail). A concurrent nested strategy implies that there is a dominant method that
guides the research. In the case of this research, a quantitative approach. The qualitative
component was given lesser priority but was nested within the quantitative approach. The
qualitative approach was embedded in the quantitative approach as the method addresses a
different aspect of the question and seeks information from a different level. While the

265
quantitative approach in this study makes use of information at the school, classroom, and
learner-level, the qualitative approach makes use of information at the provincial and
national-levels.
Different data collection strategies were used in this research. In order to adequately address
the research questions the following strategies were used (see Chapter 5):
� Curriculum document analysis (language and mathematics) was undertaken;
� Evaluation reports;
� Interview schedules were used;
� Questionnaires for the provincial officials, principals, educators and learners were
utilised;
� A developed abilities assessment.
National Department of Education as well as Provincial Department of Education officials
participated in this research. National officials in the field of assessment and curriculum were
interviewed while the provincial officials in the fields of language and mathematics were
asked to complete a questionnaire. One of the provincial officials was contacted
telephonically and asked to elaborate on some of the answers provided in the questionnaire
(refer to Chapter 5 and Chapter 6 for elaboration).
Apart from contacting Department of Education officials (both nationally and provincially), the
assessment instrument was also sent for review. This review process fulfilled two purposes.
Firstly, to ascertain what the overlap between the language and mathematics curriculum and
skills assessed in the instrument would be. Secondly, to ascertain the correspondence of the
sub-tests included in the MidYIS instrument and that of other developed abilities or aptitude
tests. The review was undertaken by language and mathematics specialists as well as
educational and research psychologists. By undertaking a thorough analysis of the language
and mathematics curriculum documents, depth was added to the evaluation process (refer to
Chapter 5 and Chapter 6 for further elaboration).
In addition to the Department of Education officials and specialists in the field of psychology
and education, eleven secondary schools in the Pretoria area also participated in this
research. The Department of Education officials were purposefully selected. The eleven
schools were sampled by means of maximum variation sampling so that schools selected
would be representative of the different types of schools across South Africa. Two Grade 8
classes were randomly selected from each of the schools. The principal of each of the
266
schools as well as the language and mathematics educators of the two classes selected
were asked to completed questionnaires (refer to Chapters 5, 7 and 8).
Figure 9.1 provides a diagrammatic view of the research questions used to guide this
research.
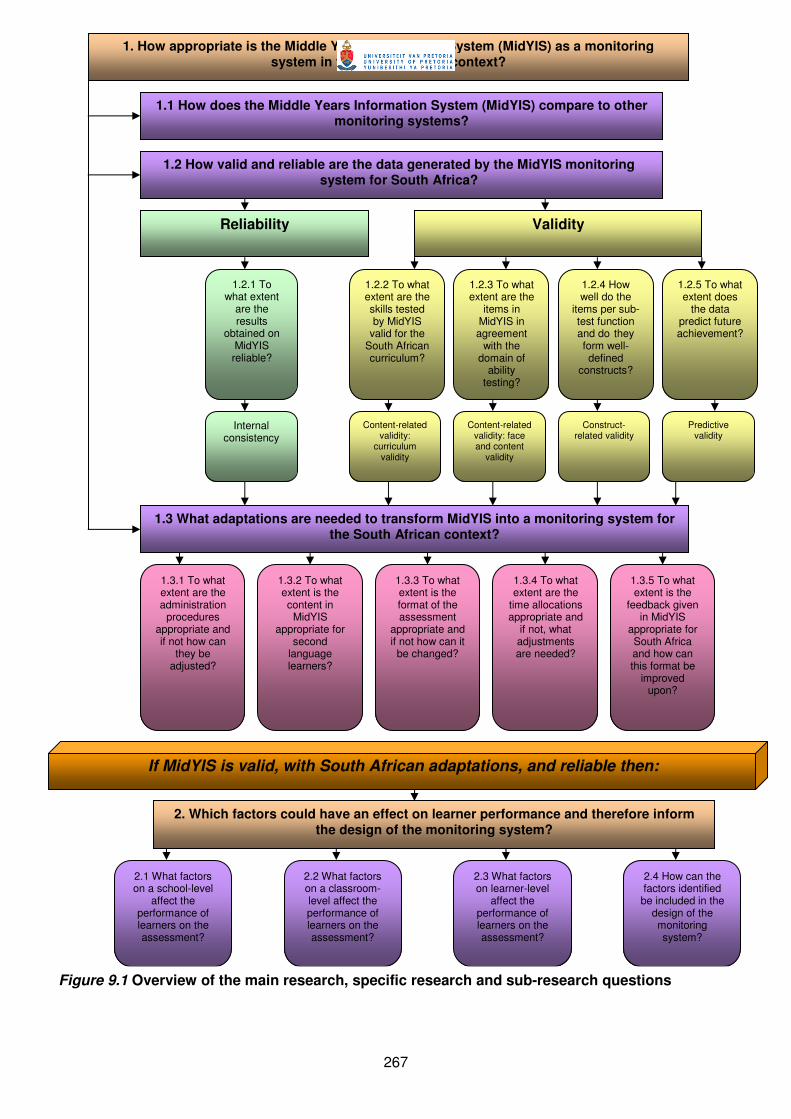
267
1. How appropriate is the Middle Years Information System (MidYIS) as a monitoring system in the South African context?
2. Which factors could have an effect on learner performance and therefore inform the design of the monitoring system?
1.1 How does the Middle Years Information System (MidYIS) compare to other monitoring systems?
1.3 What adaptations are needed to transform MidYIS into a monitoring system for the South African context?
1.2 How valid and reliable are the data generated by the MidYIS monitoring system for South Africa?
Validity
Content-related validity:
curriculum validity
Reliability
1.2.1 To what extent
are the results
obtained on MidYIS reliable?
Internal consistency
1.2.2 To what extent are the skills tested by MidYIS
valid for the South African curriculum?
1.2.4 How well do the
items per sub-test function and do they form well-defined
constructs?
1.2.3 To what extent are the
items in MidYIS in agreement
with the domain of
ability testing?
1.2.5 To what extent does
the data predict future achievement?
Content-related validity: face and content
validity
Construct-related validity
Predictive validity
1.3.1 To what extent are the administration
procedures appropriate and if not how can
they be adjusted?
1.3.2 To what extent is the content in
MidYIS appropriate for
second language learners?
1.3.3 To what extent is the format of the assessment
appropriate and if not how can it
be changed?
1.3.4 To what extent are the
time allocations appropriate and
if not, what adjustments are needed?
1.3.5 To what extent is the
feedback given in MidYIS
appropriate for South Africa and how can this format be
improved upon?
2.1 What factors on a school-level
affect the performance of learners on the assessment?
2.2 What factors on a classroom-level affect the performance of learners on the assessment?
2.3 What factors on learner-level
affect the performance of learners on the assessment?
2.4 How can the factors identified be included in the
design of the monitoring system?
If MidYIS is valid, with South African adaptations, and reliable then:
Figure 9.1 Overview of the main research, specific research and sub-research questions

268
The first specific question identified for the first main research question is how does the
Middle Years Information System (MidYIS) compare to other monitoring systems? This
question was addressed in Chapter 2 and Chapter 4 and is a reflection on insights drawn
from the literature review. Table 9.1 provides an overview of three monitoring systems that
were reviewed in conjunction with MidYIS, namely the ZEBO-project, the VCE data project,
and the ABC+ model. What is striking from this comparison is that MidYIS essentially only
includes the learner-level while the other systems include at least two levels (learner and
classroom or learner and school). Furthermore, while MidYIS does perform a monitoring
function, its main aim is to provide schools with value-added information on performance and
the schools decide how to use the information. CEM processes the information and
distributes the data in user-friendly form for the school managers and educators to analyse
further. Although summaries are provided by CEM, the schools are responsible for
interpreting the data and undertaking additional analysis. This seems to be a key point of all
the systems included in Table 9.1 in addition to the idea that the systems should not be too
intrusive on school time. A divergent point, however, is the inclusion and use of behavioural
components such as learner attitudes. In MidYIS this is available but schools decide whether
they want this additional information. While it would appear that the other systems include
behavioural information as an integral part of the monitoring system, and not an additional
component as with MidYIS.
The MidYIS system as discussed in Chapter 4 makes use of an abilities assessment and not
a curriculum-based assessment. The ZEBO-project in the Netherlands comprises a
curriculum assessment, abilities assessment and background questionnaires. This is similar
to the VCE data project where both curriculum-based and abilities assessments are used.
For South Africa it may be beneficial to include under the banner of South African Secondary
School Information System (SASSIS) a suite of instruments. On a learner-level a curriculum-
based assessment and an abilities assessment should be included in addition to a
questionnaire which would provide background and attitudinal information. This would be in
line with monitoring systems in the developed world. Furthermore, a national examination
should also be used in order to provide additional value-added information and to explore
predictive validity. In this regard, exit-level examinations at Grade 9 and Grade 12 would be
appropriate. A questionnaire, classroom observations using defined protocols and perhaps
follow-up interviews would be appropriate for the classroom-level while on the school-level a
questionnaire and follow-up interview could be included.
What the monitoring projects indicated in Table 9.1 do not include are levels other than those
directly related to the school. For South Africa it would be beneficial if the district and

269
provincial levels were included in a newly developed monitoring system. On the one hand
additional information relating to the support given to schools can be ascertained. On the
other hand the data collected on the school-level can be processed in a manner which would
facilitate the development and implementation of additional intervention programmes at the
school, district and/or provincial-level if needed. The support from the district-level given to
schools in addition to intervention programmes developed by the educators within the
schools could potentially be the difference of success or failure of the intervention
programme.
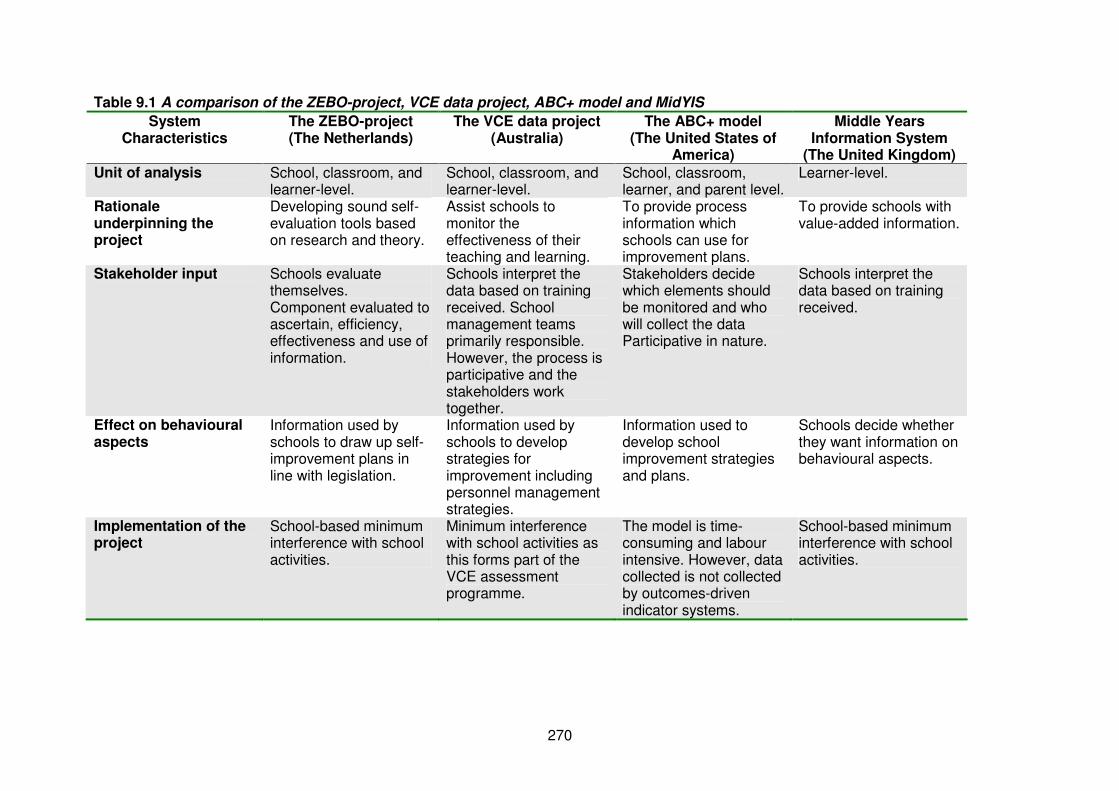
270
Table 9.1 A comparison of the ZEBO-project, VCE data project, ABC+ model and MidYIS
System Characteristics
The ZEBO-project (The Netherlands)
The VCE data project (Australia)
The ABC+ model (The United States of
America)
Middle Years Information System
(The United Kingdom)
Unit of analysis School, classroom, and learner-level.
School, classroom, and learner-level.
School, classroom, learner, and parent level.
Learner-level.
Rationale underpinning the project
Developing sound self-evaluation tools based on research and theory.
Assist schools to monitor the effectiveness of their teaching and learning.
To provide process information which schools can use for improvement plans.
To provide schools with value-added information.
Stakeholder input Schools evaluate themselves. Component evaluated to ascertain, efficiency, effectiveness and use of information.
Schools interpret the data based on training received. School management teams primarily responsible. However, the process is participative and the stakeholders work together.
Stakeholders decide which elements should be monitored and who will collect the data Participative in nature.
Schools interpret the data based on training received.
Effect on behavioural aspects
Information used by schools to draw up self-improvement plans in line with legislation.
Information used by schools to develop strategies for improvement including personnel management strategies.
Information used to develop school improvement strategies and plans.
Schools decide whether they want information on behavioural aspects.
Implementation of the project
School-based minimum interference with school activities.
Minimum interference with school activities as this forms part of the VCE assessment programme.
The model is time-consuming and labour intensive. However, data collected is not collected by outcomes-driven indicator systems.
School-based minimum interference with school activities.
271
The second specific question for the first main research question was how valid and reliable
are the data generated by the MidYIS monitoring system for South Africa?
This specific research question comprised several sub-questions:
1.2.1. To what extent are the results obtained on MidYIS reliable?
1.2.2. To what extent are the skills tested by MidYIS valid for the South
African curriculum?
1.2.3. To what extent are the items in MidYIS in agreement with the domain
of ability testing?
1.2.4. How well do the items per sub-test function and do they form well-
defined constructs?
1.2.5. To what extent does the data predict future achievement?
Different strategies for making inferences related to validity were presented in Chapter 5
ranging from conceptual considerations as is the case with content-related validity,
(presented in Chapter 6), to empirical considerations as is the case on construct-related
validity and predictive validity (presented Chapter 7).
The sub-question 1.2.1 is related to the reliability of the MidYIS results namely to what
extent are the results obtained on MidYIS reliable? The reliability of the assessment
instrument is addressed in Chapter 7. The analysis was undertaken with the whole sample
and with learners from different population groups. Although initial results indicate internal
consistency and that items do measure the same construct, larger samples than those
included in this study for sub-population groups would be required if inferences per
population group were to be made with more confidence.
Chapter 6 of the dissertation focused on issues associated with the content-related validity of
the MidYIS assessment, namely sub-questions 1.2.2 and 1.2.3. As deduced from the two
sub-research questions, the content-related validity of MidYIS can be evaluated from two
perspectives, namely a curriculum perspective and a psychometric perspective. Although
these two perspectives are addressed separately, there is an apparent link between them.
From a psychometric perspective, MidYIS is a developed abilities assessment. Ability is a
competence, a skill or an aptitude and the curriculum can have its roots in competency-
based education, as is the case in South Africa. Due to this interrelatedness of MidYIS as a
developed abilities assessment and the South African curriculum with its roots in
competency-based education, both aspects had to be explored.
272
The sub-question 1.2.2 or to what extent are the skills tested by MidYIS valid for the
South African curriculum was explored by means of curriculum document analysis and
specialist evaluations, while background information was provided by the National and
Provincial Department of Education. The clear message from the National and Provincial
Departments of Education was that any assessment used in a school setting must be aligned
to the curriculum. In order to explore the alignment of the MidYIS assessment with the South
African curriculum, document analysis was undertaken and specialists consulted. Two
learning areas were selected, namely language and mathematics, as the fundamental skills
assessed in MidYIS corresponded with these two learning areas (refer to Chapter 5).
Three of the six outcomes in the language learning area were represented in the MidYIS
assessment indicating a moderate alignment between MidYIS and the South African
curriculum (refer to Chapter 6). For the language learning area three of the six outcomes are
not represented. However, the skills assessed in the MidYIS assessment which can be found
in the curriculum refer to the basic skills needed, for example skimming, scanning,
punctuation and vocabulary. It is clear that even though the MidYIS assessment does not
directly include three of the six learning outcomes, what it does include is the basic skill that
is needed to succeed in the other learning outcomes included in the language learning area.
However, it is possible to construct additional scales that directly relate to the other learning
outcomes, such as reading a passage and answering questions related to the passage. By
means of including an additional section, learner reading skills and comprehension can be
directly assessed.
Inferences, in terms of curriculum validity for the mathematics learning area, are substantially
stronger; as four of the five learning outcomes are represented in MidYIS (refer to Chapter
6). It would appear from the document analysis and specialist evaluation that MidYIS has a
high degree of curriculum validity, especially for mathematics. However, additional items
pertaining to the outcome currently not represented, namely data handling, may make
inferences stronger.
The sub-question 1.2.3 focuses on content-related validity was to what extent are the items
in MidYIS in agreement with the domain of ability testing and applicable for South
Africa. This question was addressed via expert appraisal. The experts were selected from
fields of educational and research psychology. The evaluations from the psychologists
indicate that the items in the MidYIS are in agreement with the ability domain. Furthermore,
MidYIS is comparable to other ability assessments currently used in South Africa such as the
273
Differential Aptitude Test (DAT) and is not biased in terms of gender or race (refer to Chapter
7).
The sub-question (1.2.4) how well do the items per sub-test function and do they form
well-defined constructs was addressed by means of item and scale analyses (as described
in Chapter 7), specifically Rasch analysis for item level analysis. What emerges from the
Rasch analysis is that there are core items associated with sub-tests and that the sub-tests
can be integrated into scales, as was originally designed by CEM. However, there are items
which seem to be measuring constructs other than those they were intended to measure
(see Chapter 7 for details). Thus the items which were identified as misfitting should be
revised or rewritten based on an assessment framework for the assessment as a whole. The
assessment framework should be developed from both a curriculum and psychometric
perspective. An explanatory note of the fitting or rather misfitting of items or persons is
needed. In Rasch analysis, fit is not interpreted in the same way as in the world of
measurement where one would state that the model fits the data. Rather, fit statistics are
used to detect discrepancies between the Rasch model prescriptions and the data (Bond &
Fox, 2001). Misfitting persons, in Rasch analysis, represents the degree to which the
response pattern of the individual is more haphazard than the Rasch model would have
expected. The unexpected response pattern could indicate more or less variation than
expected.
The sub-question 1.2.5 is related to the predictive validity of the assessment, namely to what
extent does the data predict future achievement? The analyses were undertaken per
school and not across schools as standardized national examination or other assessment
results were not available and therefore school-based results were used. The results
indicated that the scales as constructed using the Rasch analysis do correlate with the
results obtained from schools, with most of the correlations above the 0.3 criterion stipulated
by Kline (1993). So MidYIS could possibly be used for prediction purposes in the context of
South Africa. However, further analytic work is needed before definite inferences can be
drawn. It would be appropriate to increase the sample to included schools from different
provinces (including rural schools) as well as to use a standardised national school-based
assessment in this regard. What seems to emerge is that MidYIS on its own can only
account for a certain amount of variance and there are other factors on the learner,
classroom and school-level that have to taken into account (see Chapter 7 for details).
It was clear that adaptations had to be made to MidYIS to make it relevant for South Africa
(see Chapter 6). Some of the adaptations were easier to effect than others. The adaptations
needed to range from allocating more time per sub-test to possibly including new items to
274
existing sub-tests or adding additional sub-tests to the assessment. The specific research
question of what adaptations are needed to transform MidYIS into a monitoring system
for the South African context (1.3) was addressed based on the reports of specialists in the
fields of language and mathematics. The specialists in the fields of language and
mathematics suggested that the administration procedures be reviewed, the appropriateness
for second language learners be established, the format be reviewed, the time limits be
evaluated, and the way in which feedback is given through to schools be assessed.
Sub-research question 1.3.1 to what extent are the administration procedures
appropriate and if not, how can they be adjusted was explored by means of expert
appraisal. The expert evaluation reports indicated that the instructions were ambiguous and
could be difficult to follow. Thus the instructions were revised, based on the suggestions
provided by the specialists, so that learners would understand what was expected of them
but so that the revised version would still be comparable to the original (refer to Chapter 6 for
details).
In answer to sub-research question 1.3.2 to what extent is the content in MidYIS
appropriate for second language learners, the experts indicated that a number of items
would not be accessible for second language learners. The specialists identified these items
and also provided feasible alternatives. The changes suggested by the specialists were
effected (see Chapter 6).
Sub-question 1.3.3 to what extent is the format of the assessment appropriate and if
not, how can it be changed was also explored by expert appraisal. Overall the format of
MidYIS was acceptable. However, the specialists indicated that should a learner be unsure of
what to do they would have to page to the beginning of the sub-test in order to reread the
instructions. This wastes time. Therefore, the instructions were included at the top of the
page throughout MidYIS, as suggested by the specialists, so that learners if uncertain could
reread the instructions without wasting time (refer to Chapter 6).
To what extent are the time allocations appropriate and if not, what adjustments are
needed is sub-research question 1.3.4. The experts were not happy with the time limits
allocated for various sections of MidYIS. Therefore, the time allocated for each sub-test was
increased based on the recommendations of the specialists so that the majority of the
learners would be able to complete or almost complete the sub-test. This is also in
accordance with the type of assessment, as MidYIS is a combination of a speed and power
test as was discussed in Chapter 5 (see Chapter 6 for an elaboration).

275
The final sub-question 1.3.5 is to what extent is the feedback given in MidYIS appropriate
for South Africa and how can this format be improved upon? Although this question was
not directly addressed in this research, recommendations can be made on the basis of
literature. The ultimate use of assessment information is that it is elicited with the goal of
improving teaching and learning. According to Van Petegem, Vanhoof, Daems and Mahieu
(2005) there are four reasons to gather performance data, namely for information needs, for
accountability purposes, creating marketing mechanisms or to stimulate discussions on
quality in education. An essential component in all of these reasons is the way in which the
performance information is provided (Vanhoof & Van Petegem, 2005, p. 206):
More recent is the attention that is given to the feedback of indicators to individual
schools. More and more stakeholders become convinced of the fact that a better
use of the indicators could lead to powerful opportunities for individual schools to
analyse and improve their quality of education.
Feedback, according to Black and Wiliam (1998), should be about particular qualities of
learners and learners’ work and how the learner can improve. If monitoring systems are to
provide the information needed to assist schools then the research agenda has to be guided
by the following questions (Luyten, et al., 2005):
� How can the feedback be made accessible? Currently, the MidYIS system provides
the minimum information to schools and the information is illustrated in the form of
tables and graphs. School management teams are provided with training that equips
them to undertake further analysis of the data. In South Africa the approach used by
CEM, although cost efficient, would not work, as there are not many schools in a
position to pay for the services of the CEA. Educators and schools need to have the
information presented to them in a way that is easy to understand and
recommendations given should be based on the results. Not only should the feedback
be made easily accessible, it should be followed up by a support component.
� What information is deemed credible by schools? Schools should provide an
indication of what type of information is needed. For example, it is plausible that
schools may be more interested in academic achievement than the learners’
perception of school climate. A collaborative partnership between the schools and
CEA should be developed in order to ascertain what information is needed.
� What type of feedback is most accessible and easy to understand? Do educators and
school managers prefer graphical representations, narrative descriptions or tables?
School managers and educators are the experts in their fields and should not be
276
patronised. Therefore, the form of the feedback should be formulated by the
stakeholders. This means the schools would be more likely to use the information if it
is presented in a manner recommended by them.
� How can feedback systems be used to detect problems and find solutions? The type
of feedback given should provide an overview in addition to potential diagnostic
information. The aim of any monitoring system is to identify problem areas and to
develop an intervention to address the problems. This should be done in collaboration
with the stakeholders to ensure that ownership of the process is taken.
� What strategies for change are most effective? This is an important component and
addresses the question of what worked and what did not.
Learning can be influenced by a number of factors, some of which are school related and
others are not. However, if learning and achievement based on learning is to be understood,
attempts should be made to explore the factors, which impact, on achievement. In Chapter 8,
an attempt was made to identify some of the factors, which could have influenced the overall
result on the MidYIS assessment. The exploration was guided by the second main research
question which factors could have an effect on learner performance and therefore
inform the design of the monitoring system? This broad research question comprised
four specific research questions. Each of the specific research questions is discussed
separately in light of the findings presented in Chapter 8. This is an extension of the first main
research question (how appropriate is the Middle Years Information System (MidYIS) as
a monitoring system in the South African context) and makes use of a multilevel model in
order to provide some insights into the specific research questions (see Chapter 8). The data
were explored to ensure that the assumptions of the statistical analysis were not violated.
Specifically, mulitcollinearity was investigated. It was found that no assumptions were
violated.
The first specific research question (2.1) is what factors on a school-level affect the
performance of learners on the assessment? The multilevel analysis showed that 85.7
percent of the variance could be attributed to the school-level. This result is perhaps not
surprising as other research from the developing world (Howie, 2002) has shown similar
outcomes in terms of the large percentage of variance found at the school-level. Two factors
(of the three factors) on the school-level were significant, namely encouraging academic
excellence (negative effect) and educators make use of monitoring systems (positive effect).
Academic expectations have to be translated into policies and goals. Perhaps Murphy et al.
(1982, p. 24) capture this idea the best when they say “…schools that promote academic
achievement have clearly defined goals based on academic matters”. The negative effect of
277
academic performance is a surprising result. It is possible that although the principals
indicated that they do encourage academic achievement something else is happening in the
school or home environment that is not translated into the results that the school would want.
The second specific research question (2.2) is what factors on a classroom-level affect
the performance of learners on the assessment? Six factors were identified for
exploration (three for the language educator and three for the mathematics educator),
namely resources, educator attitudes and challenge to assessment due to a lack of in-service
training. Of the factors only one factor namely, challenges to assessment due to a lack of in-
service training (negative effect) for the mathematics educator was included in the final
model. This factor alone accounted for 31% of the variance for the classroom-level. This
could be a consequence of small sample sizes but the result is significant nonetheless. This
is perhaps not surprising because if performance data is to be used by educators to focus on
the specific needs of learners (Holloway, 2003) then educators need to know how to design
effective assessments and use the information to guide their teaching practice.
The third specific research question (2.3) what factors on a learner-level affect
performance of learners on the assessment? Originally six factors were identified for
exploration namely resources in the home, with whom the learners live, mother’s education,
father’s education and the importance of mathematics and English. Only four of the six
factors were significant, namely with whom the learners live (negative effect), mother’s
education (positive effect) and the importance of mathematics and English (positive effect).
These four factors accounted for 7.7% of the variance. Although these four factors combined
accounted for only a small percentage of variance, their inclusion dramatically improved the
fit of the model to the data.
The final specific research question (2.4) is how can the factors identified be included in
the design of the monitoring system? Clearly the factors, in this exploration, are important
to include as part of a monitoring system using MidYIS. MidYIS was designed as a learner-
level monitoring system. Thus it would seem plausible to include learner-level contextual
factors. However, learning does not take place in a vacuum and as school effectiveness
research has shown a number of factors on a classroom and school-level do have an effect
on performance (Sammons, 2006). Monitoring systems generally do include at least two
levels as was discussed in Chapter 2. A monitoring system focusing on a single level may
have some drawbacks such as not targeting higher-level variables to monitor change,
although the system itself is less complex. It has been suggested that a battery of
instruments should be called for. This implies that instruments are associated with each level
of the school system. This is discussed further in the recommendation section to follow.
278
However, the choice of which level to target or which levels to include will be determined by
educational policy makers and practitioners. It may be that policy-makers or practitioners may
be interested in only one level. So it may be that only learner performance and limited
number background indicators are of importance. At the same time, it may be of interest to
include indicators on the classroom or school-level in order to obtain a complete picture that
could be targeted by intervention programmes.
9.3 Discussion and reflection
There are several areas of reflection which are worth discussing. These reflections are
elaborated on in the section to follow and centre on methodological reflections (9.3.1), the
field of school effectiveness research (9.3.2), and finally how this research contributes to the
body of knowledge, practical and scientific (9.3.3).
9.3.1 Methodological reflections
In this research, mixed methods were applied. A continuing issue in the mixed methods
discourse, however, is the manner in which paradigms are used in the development of the
mixed methods as a field (Teddlie & Tashakkori, 2003). Based on the pragmatic paradigm
the use of mixed methods is appropriate in the case of this research and the use of the
methods is seen as being complementary (Morse, 2003), as one method is only a partial
snapshot of the phenomenon and the use of both methods provides a more complete picture
(Greene & Caracelli, 2003). Much work needs to be done in the area of mixed methods
research regarding its philosophical underpinnings, designs and data analysis, validity
strategies as well as rationale for mixing and integrating procedures (Johnson &
Onwuegbuzie, 2004).
This research was primarily exploratory in nature as is reflected in the research design, such
as the sample of respondents, selection of data collection methods and analysis techniques.
The first main research question how appropriate is the Middle Years Information System
(MidYIS) as a monitoring system in the South African context does provide insights into
the type of monitoring systems which would be suited to the context of South Africa. The
research has shown that a value-added monitoring system can be valid and reliable.
However, there is room for improvement:
� The sample was restrictive not only in terms of size but also the demographic
characteristics of schools which exist in South Africa. In this sample only urban and
279
peri-urban schools from one province were included. Urban, peri-urban and rural
schools in other provinces were not included and this is seen as a limitation.
� The evaluation process, in which specialists in the field of education and psychology
are consulted, could be extended to suggestions on what could be included in order
to make inferences in terms of curriculum validity and content-related validity
stronger. Here the selection of the specialists or the way in which the specialists are
sampled will have to be done with care and with a specific purpose in mind.
� Follow-up interviews with National Department of Education officials could be
undertaken in order to ensure that the specifications of the monitoring envisaged
would comply with policies on a national-level. Furthermore, units directly involved in
the implementation of the Systemic Evaluation and Integrated Quality Management
System (which includes Whole School Evaluation) should also be included in order to
add additional depth to the research.
� In addition to officials in the Provincial Department of Education it may have been
beneficial to include officials working on the district-level as these officials would have
more grass roots knowledge and potentially could provide valuable insights into how
the envisaged monitoring system could be used in the varying schools contexts.
� The Rasch analyses could be extended to include equating items from different
assessments and exploring the differential item functioning. Essentially, equating
draws on item response theory where equating items from different grade
assessments means that the items are linked. The difficulty of the items and the
ability of the learners can then be put on the same scale (as was discussed in
Chapter 5 and Chapter 7). By means of this analysis, potentially weak items can be
identified and the ability of the learners ascertained. The results could then feed
directly into topics for intervention programmes. The differential item functioning on
the other hand, would detect bias in the items, specifically with regard to gender and
cultural groups. The analysis of how items are performing for boys and girls and
across racial groups would strengthen claims of cultural validity and would identify
items which are not working well for the different groups. If these items were
identified, changed or removed, then the assessment would be better in the long run
and would result in an assessment which could be used in all contexts.
� The analysis of missing data. Although beyond the scope of this dissertation it would
have been interesting to draw a distinction in the data between missing in terms of not
reached and missing in terms of had an opportunity but did not answer. This could
provide important information in terms of what learners can do and what they
preferred not to do possibly due to time constraints but also due to their inability.
280
This research was essentially exploratory in nature and the sample sizes chosen were
adequate for the nature of the research, but additional sampling for the qualitative component
would have been beneficial in adding depth to the insights already gained. Challenges were
also encountered in the analysis undertaken for the second main research question as was
addressed in Chapter 8. The second main research question which factors could have an
effect on learner performance and therefore inform the design of the monitoring
system was essentially addressed by means of multilevel analysis. The following insights
can be mentioned:
� Multilevel analysis should include as few variables as possible that explain the most
variance especially on the school and classroom-level. However, a limited number of
possible variables could be explored in this research, due to limited number at the
upper levels. The limited number at the upper levels also made the investigation of
random components impossible.
� The multilevel nature of school effects focuses on the interaction between the school
and classroom-level. The possibility also exists to explore the link between the school
and other levels such as the district and Provincial Education Departments.
� Only direct effects are taken into account, which leaves the researcher to hypothesise
the indirect effects. Perhaps structural equation modelling would have been
appropriate as an initial departure point for identifying factors on one level (in
conjunction with correlation analysis) before including these variables in a multilevel
model. Multilevel analysis is ideal when cross-level interactions and direct effects are
of interest. However, the indirect effects of variables may provide valuable information
which could inform the development of the monitoring system for the context of South
Africa.
9.3.2 Reflection on this research in of light school effectiveness research
The use of school performance data has great potential to contribute to improvement efforts
in education but at the same time, if handled ineptly, the research could prove to be irrelevant
or create a situation which would have been better avoided altogether (Wyatt, 1996).
Nevertheless, it could be said that the quality of learning is determined by the quality of
education provided by schools, especially what learners do in the classroom. Teaching and
learning should be an interactive process. Schools need to know how their learners are
progressing and the difficulties that are experienced with regard to learning so that the needs
of the learners can be met (Black & Wiliam, 1998). Adequate monitoring systems could be of
use in this regard.
281
Monitoring in education is important, as it is a way in which to formally regulate levels of
quality in education, it provides a mechanism to hold stakeholders accountable and it
provides the impetus for ongoing improvement in education (Scheerens et al., 2003).
Furthermore, given the amount of financial and human resources, which is put into
education, the effects of education should be considered (Sammons, 2006). If it is said that
education should prepare learners for the world of work and if the resources are allocated to
this, then this implies a holistic view in terms of personal development, citizenship and indeed
the necessary skills needed to succeed in the labour market (Luyten et al., 2005). Thus the
resources allocated by government would show some return. If this is the case, as is in many
countries around the world, then assessing the extent to which these goals are met is
essential. The use of and distribution of resources are also linked to the relevance of
educational objectives and whether these objectives are in reality attained. Also, the fair
distribution of resources, especially in South Africa, is paramount likewise how these
resources are translated into economic benefit (Scheerens et al., 2003).
The main aim of using school effectiveness research as a departure point was to contribute
to the discourse of school effectiveness in a developing world context as opposed to a
developed world context. Different types of monitoring systems have been discussed, namely
the ZEBO-project in the Netherlands, the VCE data project in Australia, and the ABC+ model
in the United States (Chapter 2). The need for projects such as these arose out of policy
initiatives undertaken by local and national governments. The aim of these projects was to
develop tools which schools could use for self-evaluation purposes so that adequate
interventions could be put in place if need be. These projects were all initiated in the
developed world context and indeed provide valuable information on how a monitoring
system based on sound research should be approached. However, according to Doran and
Lockwood (2006, p. 205) school effectiveness “decisions have hinged upon levels and
changes over time in aggregated achievement measures for successive cohorts of different
students and ranks of schools based on these measures.”
School effectiveness research has been criticised in the past and the use of value-added
monitoring systems has been suggested to counter some of the critisms - MidYIS is an
example of this. By means of making use of value-added results, fair comparisons can be
made as low ability learners are compared with low ability learners (CEM, 2002m). The way
in which value-added measures are used in order to produce the necessary information is of
vital importance in order to find measures, which would best suit the South African context.
Moreover, different approaches can be applied in order to develop a system that is focused
on the improvement of learners and quality of education by raising expectations regardless of
282
background characteristics. Two approaches have been discussed in Chapter 2, namely a
curriculum-based approach and a developed abilities approach. Both approaches yield
important information. The curriculum-based approach makes use of assessments that are
grounded in the curriculum and are administered on an annual basis so that progress from
one grade to another can be ascertained. A developed abilities assessment on the other
hand can provide baseline information of skills, which the learners have already developed.
These skills then form part of the cross-curricular skills that can be used to predict future
performance. Regardless of which approach is preferable, measurement error, and low
reliability may produce findings that are biased (Luyten et al., 2005). Thus it was of
importance to base inferences about the sustainability of the monitoring system on sound
psychometric theory.
One of the main concerns and indeed the motivation to undertake this research was the
issue of quality education. If inferences are made by practitioners and policy-makers about
quality education, some form of monitoring is needed. In the context of South Africa, a
situation arises where secondary schools need information on the basic skills learners have
upon entry into secondary school. These skills can be built upon, whilst problematic areas
should be identified, and strategies developed to focus on identified areas. The lack of
performance in international content-based or curriculum-based assessments as well as
national content-based or curriculum-based assessments is a case in point.
South Africa has not performed well in international comparative assessments like the TIMSS
studies in 2003, 1999 and 1995 (HSRC, 2006, Howie 1997, 2001) as well as the SACMEQ
study (Moloi & Strauss, 2005) where South African learners performed well below the
international averages and below those of many countries. Likewise, the South African
learners performed well below expectation in the Systemic Evaluation in Grades 3 and 6.
These results although disappointing could provide valuable insights, especially if the
assessments used have a high degree of curriculum validity. The results could be due to
learners being ill prepared in terms of the content areas in addition to being unable to
achieve the expected assessment standards (National Department of Education, 2005b).
Monitoring systems do provide a vehicle in which key concerns arising from poor
performance can be addressed by means of intervention programmes based on feedback.
Furthermore, by means of making use of a developed abilities assessment, which has
shown, to have curriculum relevance, basic skills in key learning areas can be assessed. It is
accepted that “being effective is not the same as staying effective” (Luyten et al, 2005, p.
264) but in a country like South Africa an important starting point would be to draw on school

283
effectiveness literature in order to identify possible variables which are vital if the monitoring
system is to work.
9.3.3 Contribution to scientific and practical knowledge
South Africa is a developing world, although it has been described as a curious mix of
developed and developing worlds. However, the challenges facing South Africa are very
similar to our African counterparts, especially in terms of education. Equity and redress has
been the driving force behind educational reforms. The education reforms themselves have
at times been met with extreme opposition on grass roots level. The change in curriculum
from a content-driven curriculum to an outcomes-based curriculum is a case in point.
Monitoring the quality of education is another point of contention, as was discussed in
Chapter 1. However, monitoring of a system is an important means of assessing the
effectiveness or health of a system. This is always a means to the end of identifying
components that need to be improved upon.
According to Frederiksen and Collins (1989, p. 27):
There are enormous stakes placed on students’ performance on educational
tests. And there are consequently enormous pressures on school districts, school
administrators, teachers and students to improve on tests.
If it is said that there are pressures on the stakeholders to improve test scores then it makes
sense that the system in which the stakeholders play a part will adjust curriculum and
instructional practices to maximize the scores achieved (Frederiksen & Collins, 1989). If this
is true, then a valid and reliable monitoring system can do much to assist in the process of
effecting the necessary changes.
Porter (1991) is of the opinion that there are three reasons why a system of indicators would
be used to evaluate school processes:
� Purely a descriptive function to direct school policy;
� To serve as an evaluative instrument which will perform a monitoring function;
� To provide explanatory information when goals are not reached.
The aim of this research was to explore monitoring systems based on sound indicators that
would serve as an evaluative instrument so that schools would have the necessary
information to effect changes. The aim was to explore a system which would provide

284
systemic and comprehensive information (Porter, 1991) and would be flexible enough to
adapt to the context of the school in which it would be implemented (Bryk & Hermanson,
1993). The idea was to explore a system which would provide accurate, valid and reliable
information to schools, a system in which the “pulse of academic outcomes” (Bryk &
Hermanson, 1993, p. 460) as well as “key inputs and processes” (Bryk & Hermanson, 1993,
p. 460) are monitored.
The suggestion has been put forward that a suite of instruments under the banner South
African Secondary School Information System (SASSIS) should be developed. This would
ensure that the monitoring system rooted in sound indicators “can be used instrumentally at
any level (Bryk & Hermanson, 1993, p. 460). Although this research only focused on the
learner, classroom and school-level this could be extended to the district, province and
national-levels as well in that the data can be aggregated to be used at higher levels of the
education system.
The aim and rationale of the monitoring system is that the quality of education has to be
monitored in order to identify areas of strength as well as areas which could be strengthened.
If this monitoring system is to be successful then the CEA, schools and education officials
should form a collaborative partnership. If schools and education officials are to be
empowered then they have to feel that they are an important part of the process. Although
this research did not explore the use of intervention programmes, what does come out is the
issue of how the schools are going to use the information which is provided by the system.
Are the schools in a position to design and develop intervention programmes which will assist
learners to grow academically? Furthermore, what role will the CEA or any other agency
involved in serving schools and districts with this type of monitoring play in providing the
information and facilitation of the development of intervention programmes based on the
information received? Clearly, if the intervention programmes are to be implemented then the
schools and education officials have to be part of the development process. Otherwise this
becomes similar to many Government initiatives which are prescriptive rather then
participative.
An important aspect is that although achievement is an important component of the
monitoring system it is not the only component. Various other components are also
important, such as learner motivation to achieve and to study further (as was seen in Chapter
2). Thus attitudinal information should also be collected, analysed and feedback given. In
school effectiveness research it is accepted that non-cognitive variables can be just as
important as cognitive variables (Luyten, et al., 2005; Van Damme, Opdenakker, Van

285
Landeghen, De Fraine, Pustjens and Van de gaer, 2006). In this regard this research does
contribute in providing the initial ground work to include non-cognitive variables (see Figure
9.2).
Another area in which this research contributes to the field is in terms of implementation. If
the system is to work then there should be minimal effect on school and education officials’
activities. Time is an important component. Schools have set yearly plans and goals which
have to be met and education officials have their duties to attend to.
This research has also made explicit how indicators of effectiveness have been chosen and
that the feedback given should result in positive action being taken. The monitoring system
explored in this research has shown potential as functioning in a similar way in all contexts
present in South Africa. Due to the disparities present in South Africa it had to be shown that
the instruments can be used across contexts.
Furthermore, in this study a conceptual framework was developed which draws on the work
of Scheerens (1990) and includes literature from the developing world (see Chapter 3 and
Figure 9.2 in this Chapter). The main idea is that the road to school improvement can be built
on school effectiveness research. Scheerens (1998) states that monitoring and feedback,
based on school effectiveness factors, are of key importance for improvement purposes.
Here the emphasis is on providing good quality information upon which self-evaluations on
the learner, classroom and school-level can be based. Furthermore, poor performing schools
would want to improve but even schools that are performing well should seek to find avenues
of improvement. West (1998, p. 769) is of the opinion that no school, no matter how effective,
should be “satisfied with its current provision - even the most successful of our schools could,
indeed must, continually seek out ways to improve quality of outcomes and the experience of
its students”.
Very often, the educator is overlooked in models of school effectiveness only including two
levels namely the school and the learner. Very few studies include the educator as an
additional source of variation (Luyten et al., 2005). In this research, an attempt was made to
construct a three-level model based on literature, including the classroom-level (see Chapter
3 and Chapter 8 as well as Figure 9.2). Not only is the classroom-level seen as an additional
source of variation, it is accepted that there are indirect influences of the classroom-level on
school-level factors via educator behaviour (Luyten et al., 2005).
Quantitative methods are used almost exclusively (Luyten et al., 2005) in school
effectiveness research. In this research, an attempt was made to include both qualitative and

286
quantitative approaches. Although these approaches were linked to specific questions, they
can be extended especially if the classroom-level is to be included. Here interviews and
observations can be used to deepen arguments and add substance to recommendations. By
purposefully mixing and/or combining qualitative and quantitative methods (Johnson &
Christensen, 2004) stronger inferences can be drawn. Here the aim would be to further
identify what educator characteristics and instructional practices are associated with effective
schools or educators (Doran & Lockwood, 2006).
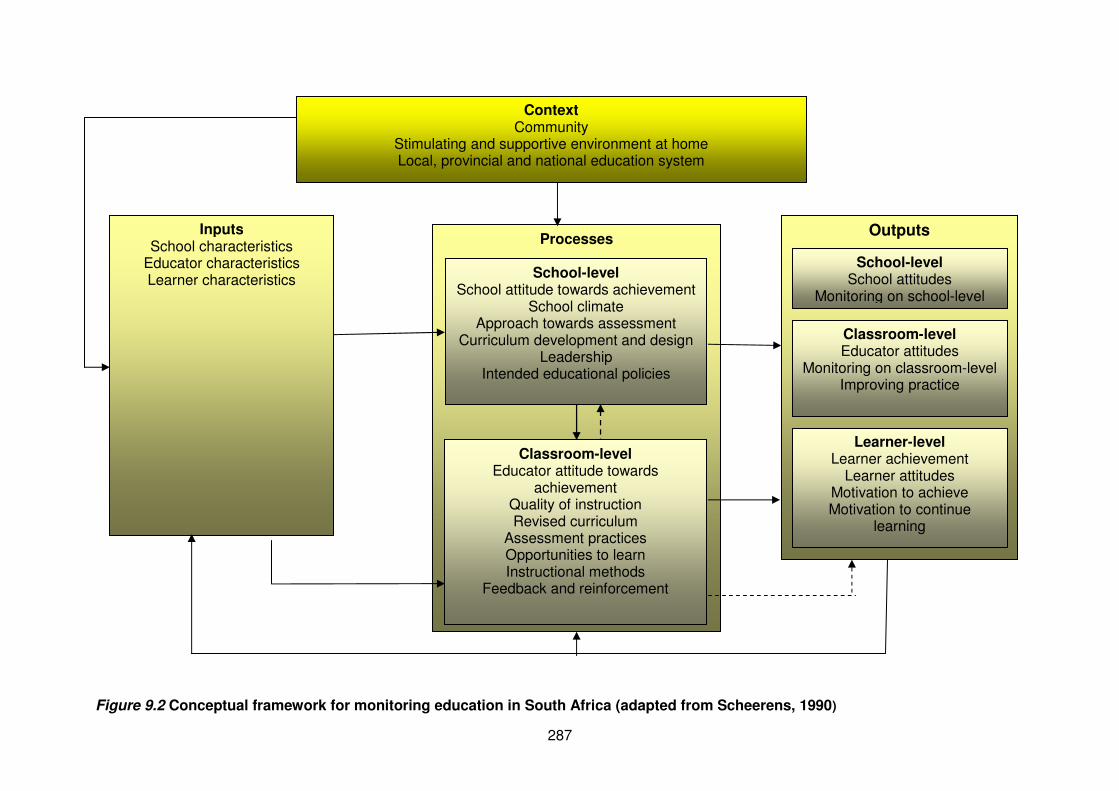
287
Context Community
Stimulating and supportive environment at home Local, provincial and national education system
Inputs School characteristics
Educator characteristics Learner characteristics
Processes
School-level School attitude towards achievement
School climate Approach towards assessment
Curriculum development and design Leadership
Intended educational policies
Classroom-level Educator attitude towards
achievement Quality of instruction Revised curriculum
Assessment practices Opportunities to learn Instructional methods
Feedback and reinforcement
Outputs
Figure 9.2 Conceptual framework for monitoring education in South Africa (adapted from Scheerens, 1990)
Learner-level Learner achievement
Learner attitudes Motivation to achieve Motivation to continue
learning
Classroom-level Educator attitudes
Monitoring on classroom-level Improving practice
School-level School attitudes
Monitoring on school-level
288
9.4 Recommendations
…evidence, like the truth, has many faces (Jansen, 2006, p. 35).
Jansen (2006) makes a compelling argument that evidence and indeed evidence-based
research can be attainable by means of various methods. Policy should be informed by
sound research practices but it should be acknowledged that the context in which decisions
are made are not neutral and are often influenced by a number of factors. There will always
be factors involved in making decisions. Recommendations related to monitoring systems
are discussed in 9.4.1, while 9.4.2 elaborates on possible policy recommendations. The
section concludes with recommendations regarding further research (9.4.3).
9.4.1 Recommendations and issues regarding monitoring systems
In this section only recommendations relating to the monitoring system will be put forward
and discussed. Some of the recommendations put forward are not directly related to the
findings in this research, but are extrapolations based on the research process.
Recommendation 1: Inclusion in monitoring systems of various levels
Monitoring involves the assessment of educational processes at various levels of the system.
In this research only the school, classroom and learner-level were focused on. However, the
aim of the assessment is to ascertain what needs to change and when it needs to change
(Howie & Plomp, 2005). Throughout this research the idea of the nested nature of the
education system has been emphasized. However, if the demands for quality education are
to be met, then districts and provinces should also be included.
Recommendation 2: Design of a suite of instruments with a clear rationale linked to
indicators
Monitoring the quality of education is a key focus point of this research, specifically ways in
which the quality of education can be ascertained and observed over time. As the education
system is a nested structure occurrences on one level of the system have an impact on the
other levels. In order to design a comprehensive system, a suite of instruments (each
targeting different levels and different sub-groups) is called for so that the data can provide
valuable information and insights on each level. However, care must be taken that not too
many instruments are developed resulting in an overly complex monitoring system, which
would be difficult to manage.
289
Recommendation 3: Strong partnerships with and active collaboration by school
leadership and educators
If the monitoring system is to be successful then the “buy in” of the various stakeholders,
such as the CEA (or other agencies working with monitoring systems), school leadership and
educators is of outmost importance. The stakeholders will need to know what the monitoring
system is about and perhaps more importantly what is expected of them. If the monitoring
system is essentially about school improvement then the schools will have to be empowered.
A strong collaborative partnership between the CEA (and/or similar agencies) and will be
needed.
Recommendation 4: Designing a system of reporting data that can be manipulated
using aggregated and disaggregated data
The monitoring system should make provision for reporting data on various levels. On the
classroom and school-level, individual learner performance may be of importance. However,
it is plausible that on a provincial-level aggregated data is of more importance.
9.4.2 Recommendations and issues regarding policy
In the section to follow recommendations regarding policy will be addressed. The
recommendations suggested flow from the research presented here but may not be directly
related to the findings.
Recommendation 5: Systems should be identified which will assist schools in the
process of self-evaluation
In South Africa the Integrated Quality Management System comprises Systemic Evaluation
and Whole School Evaluation amongst others as was discussed in Chapter 1. As part of the
Whole School Evaluation schools have to evaluate themselves on a yearly basis. Currently,
in South Africa, monitoring systems aimed at assisting schools with the self-evaluation
process do not exist. Thus it is recommended that the Government identifies systems which
can be made available to schools. What is of importance is to be able to link self-evaluation
data to performance data as this would provide schools with information as to how
interventions, on a school and classroom-level, are impacting on learner performance.
Furthermore, standardised forms of data collected on a school-level should complement the
systemic evaluation process. A system such as the one under investigation in this research is
such a possibility although further development and research is needed.

290
Recommendation 6: Government subsidies for development of valid and reliable
systems to undertake self-evaluations
Currently in South Africa there is a lack of reliable indicators of quality education (Howie,
2002). The Systemic Evaluation component of IQMS is still in its infancy and is currently only
available at primary school-level. For secondary education the Grade 12 exit examinations
could be a possibility. It is recommended that Government subsidise the development of
reliable monitoring systems at the lower secondary level as is the case in other countries
such as the Netherlands. It is not possible to expect schools to design and implement
monitoring systems as they simply do not have the capacity to do so. However, by means of
Government subsidising the development of monitoring systems, schools will inevitably
benefit.
Recommendation 7: Schools need to make policies regarding monitoring explicit
The type of monitoring that schools have in place could potentially be of benefit in terms of
the self-evaluations that schools need to undertake. However, there is a lack of capacity at
the school-level in terms of implementation. If Government is to institute the type of
monitoring needed in order to adhere to the Whole School Evaluations then schools could
possibly have a better idea of what is expected of them and what areas with the school
system should be monitored. Furthermore, as long as the Whole School Evaluation process
is linked to money which schools receive and not necessarily to an increase of the quality of
education and facilitation of learner progress, this system will be problematic. The type of
monitoring system envisaged is focused on determining the quality of education and the
strengths as well as weaknesses of the school system.
9.4.3 Recommendations for further research
The section to follow includes recommendations for further research. Although the initial
groundwork has been laid in this research, there are important considerations if the
monitoring system explored is to be implemented on a wider scale.
Recommendation 8: Follow-up research activities should take place for the
development of valid norms tables
If the SASSIS monitoring system is to be implemented across the country then research is
needed for standardisation purposes, ensuring that it is working in the same way in the
different provinces. Once the assessment is standardised then follow-up research should
focus on developing valid norm tables which may serve as a guide to developing intervention
programmes.
291
Recommendation 9: Interventions in line with taxonomies should be developed
By means of linking skills to a taxonomy such as the Anderson-Krathwohl taxonomy (also
known as the revised Bloom taxonomy) targeted intervention programmes can be developed.
This taxonomy includes cognitive processes as well as knowledge dimensions, which could
serve as a guide for intervention programmes. Additionally this taxonomy allows for the
inclusion of a third dimension, namely quality of the assessment (Killen, 2004).
Recommendation 10: Evidence-based intervention programmes should be explored
The design and development of the intervention programmes should draw heavily on the
feedback that schools receive. Evidence suggests that feedback can be as harmful almost as
often as it improves a situation. When designing and implementing feedback systems a
number of cycles of evaluation and improvement may be needed. Under the right conditions
feedback can have a substantial effect on the improvement of task performance (Coe, 2002).
The aim of including feedback as a key area is to identify ways in which to maintain and
improve the quality of schools. This aim arises out of the conviction that feedback is essential
to learn in order to produce change (Coe & Visscher, 2002).
There are two additional recommendations. However, these pertain specifically to research
design issues relevant to the current research.
Recommendation 11: The sample sizes at all levels should be increased
As this research was exploratory in nature the sample size (experts, schools, classes and
learners) was appropriate. However, if inferences are to be made as to how the assessment
is working across contexts then the full population of South African schools has to be
included and the sample size as well as type of schools has to increase substantially.
Furthermore, the sample sizes of the classroom and school-level have to substantially
increase if reliable estimates of factors related to achievement are to be ascertained.
Recommendation 12: Existing national examinations should be incorporated as a data
source
This research has shown that MidYIS, with adaptations, is valid and reliable for the South
African context. However, in order to further elaborate on the predictive validity of the
assessment, academic results attained from a common assessment are needed. It is
possible to use the results of the Grade 9 and Grade 12 exit level examinations. In this
research mathematics and English results were requested from the schools. The result was
that the MidYIS assessment does explain some of the variation in the academic results.
However, the amount of variation accounted for differed drastically between different
292
classifications of schools. By using a common assessment across schools, inferences based
on predictive validity would be stronger.
9.5 The role of feedback and intervention
Value-added systems much like the systems used by CEM qualify as a performance
feedback system in that:
…a basic truism of learning implies that an individual student, not a student group, has
increased in knowledge and skills during a specific period of time. As such, analytical
methods concerned with student learning should reasonably reflect this basic principle
and consider individual students as the unit of analysis with their growth trajectories
employed as outcomes (Doran & Lockwood, 2006, p. 205).
The feedback used in these systems can be academic or non-academic or ideally both,
which will assist schools to detect problems in functioning (Luyten, et al., 2005) If school
performance feedback systems are to provide the information needed to assist schools then
the research agenda could be guided by the following questions (Luyten et al., 2005):
1) How can the feedback be made accessible?
2) What information is deemed credible by schools?
3) What type of feedback is most accessible and easy to understand?
4) How can feedback systems be used to detect problems and find solutions?
5) What strategies for change are most effective?
Reflecting on the school as a system, perhaps the intervention based on feedback should
also be conceptualized in terms of a hierarchical system. The ecology theory of human
development elaborated on by Bronfenbrenner could be used. Bronfenbrenner’s theory is
comprehensive in nature and provides explanations of competence (Sontag, 1996).
According to Bronfenbrenner (1975, p. 439) “an ecological perspective focuses attention on
development as a function of interaction between the developing organism and the enduring
environments or contexts”. Furthermore, the ecological structure of the educational
environment comprises various levels. If the intervention is to be effective then behavioural
change should be viewed as being nested within a number of developmental contexts
(Ramono, Tremblay, Boulerice & Swisher, 2005). How learners learn, according to
Bronfenbrenner (1976), in educational settings is a result of two forces. The first is in the
relationship between learners and their surroundings and the second includes the
interconnections between the different environments. For Bronfenbrenner (1976, p. 5-6), the
environment is a nested arrangement of structures comprising four levels:
293
i) The micro-system which is the immediate setting of the learner such as home or
the classroom.
ii) The meso-system comprises the interrelations of the settings such as the school.
iii) The exo-system is an extension of the meso-system in which formal and informal
social structures are included such as the community.
iv) The macro-system comprises overarching institutions of culture, typically the
educational, legal and political system in which the micro-, meso- and exo-
systems are the concrete manifestations.
If however, intervention strategies are designed from an ecological perspective then it may
be beneficial to include as the first level the individual learner or a nano-level as Van den
Akker (2003) calls it.
The interventions should engage the learner in a manner that will inspire skills which will be
used in life and not merely skills as narrowly defined by the curriculum. This implies seeing
learning “not simply as a high score on a test or assignment, but should involve increasing
possibilities for action in the world” (Barb & Roth, 2006, p. 11). This is also in line with many
education systems around the world where schooling is seen as a training ground for the
world of work. The ecological view of learning is therefore useful in that it allows the
developing of content that has “cross-textual value” (Barb & Roth, 2006, p. 3).
The conceptual model used in this research (Figure 9.3) can be viewed from the perspective
of a monitoring system on a national-level. The indicators included in the model can be
relevant for the various school contexts which exist in South Africa. How the schools respond
to the data they receive is something different all together as some indicators may be more
important than others. Thus a school-based model for improvement, reflecting the school
context, can be developed which draws on the monitoring data received (see Figure 9.4).
Data are collected and processed by an external agency such as the CEA. Based on the
data feedback on key indicators is given. This would create some pressure for the school to
try and improve performance on the indicators. This pressure could culminate in the
development of intervention programmes targeting key indicators on which schools (or a
particular school) need to improve upon. The intervention programmes are developed and
implemented over time. Data can be then collected again and processed by an external
agency resulting in and feedback to the school(s).
294
Thus the school can monitor and evaluate whether the intervention programmes initiated
made a difference i.e. undertaking a self-evaluation. For this purpose an evaluation model
can be developed (see Figure 9.5). The evaluation model includes intended inputs,
processes and outputs in addition to actual inputs, processes and outputs. The school would
then be in a position to assess whether what was planned materialised. Furthermore, this
would provide additional information on how intervention programmes can be improved upon
for future use.
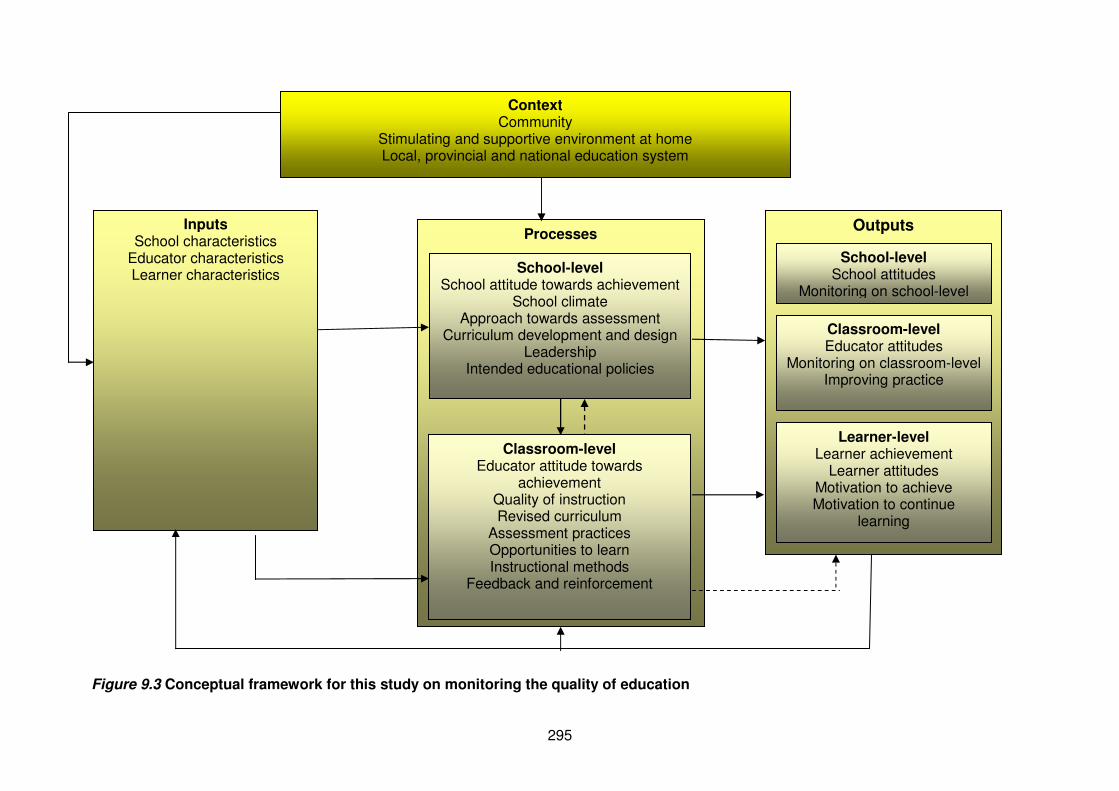
295
Context Community
Stimulating and supportive environment at home Local, provincial and national education system
Inputs School characteristics
Educator characteristics Learner characteristics
Processes
School-level School attitude towards achievement
School climate Approach towards assessment
Curriculum development and design Leadership
Intended educational policies
Classroom-level Educator attitude towards
achievement Quality of instruction Revised curriculum
Assessment practices Opportunities to learn Instructional methods
Feedback and reinforcement
Outputs
Learner-level Learner achievement
Learner attitudes Motivation to achieve Motivation to continue
learning
Classroom-level Educator attitudes
Monitoring on classroom-level Improving practice
School-level School attitudes
Monitoring on school-level
Figure 9.3 Conceptual framework for this study on monitoring the quality of education
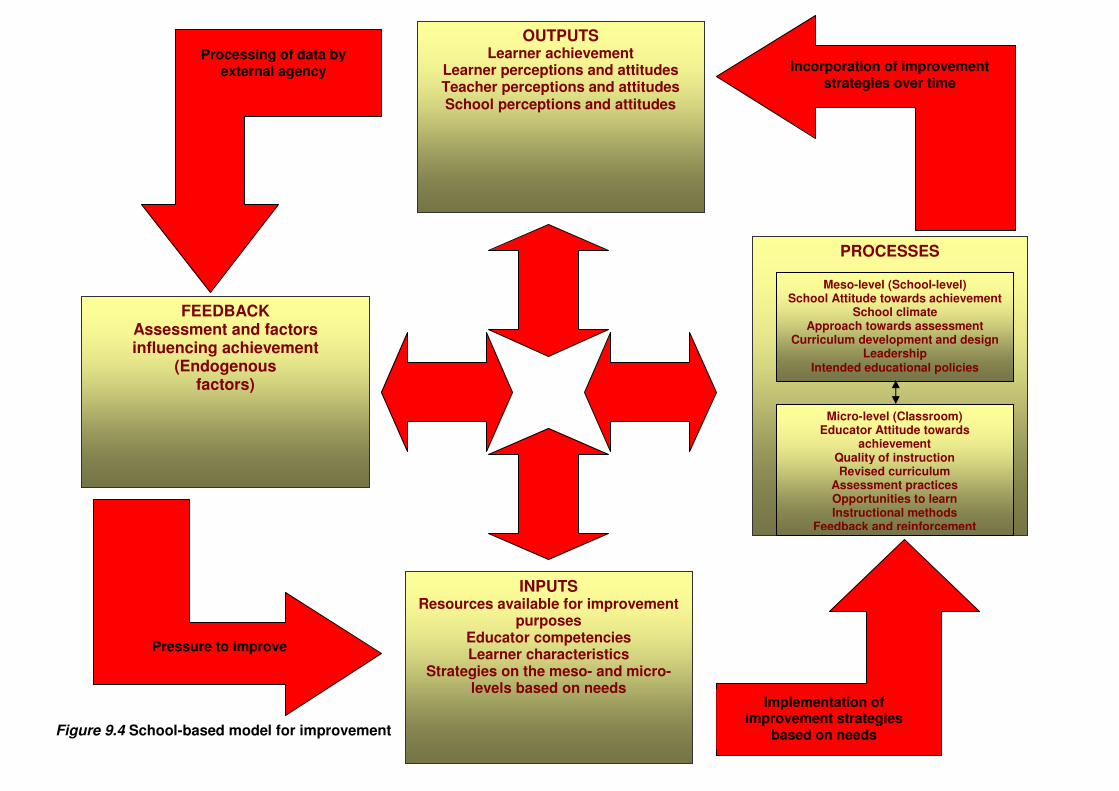
296
Implementation of improvement strategies
based on needs
Incorporation of improvement strategies over time
Processing of data by external agency
Pressure to improve
Figure 9.4 School-based model for improvement
OUTPUTS Learner achievement
Learner perceptions and attitudes Teacher perceptions and attitudes School perceptions and attitudes
INPUTS Resources available for improvement
purposes Educator competencies Learner characteristics
Strategies on the meso- and micro-levels based on needs
FEEDBACK Assessment and factors influencing achievement
(Endogenous factors)
PROCESSES
Meso-level (School-level) School Attitude towards achievement
School climate Approach towards assessment
Curriculum development and design Leadership
Intended educational policies
Micro-level (Classroom) Educator Attitude towards
achievement Quality of instruction Revised curriculum
Assessment practices Opportunities to learn Instructional methods
Feedback and reinforcement
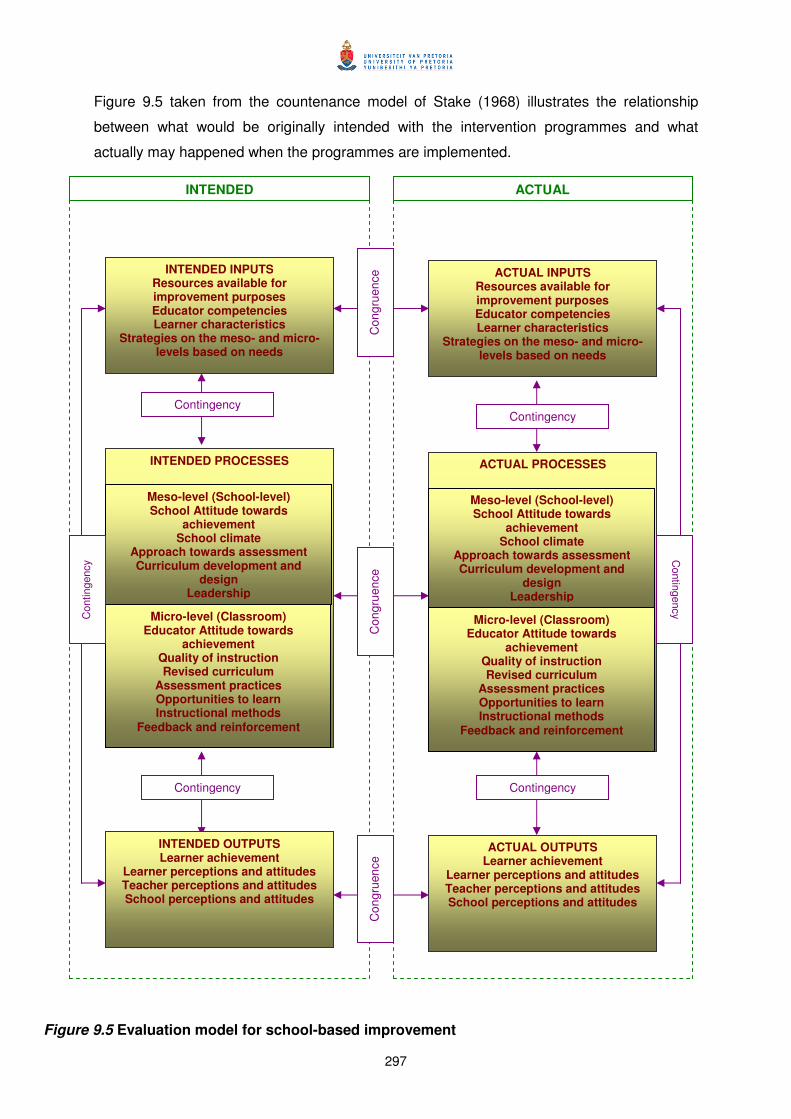
297
Figure 9.5 taken from the countenance model of Stake (1968) illustrates the relationship
between what would be originally intended with the intervention programmes and what
actually may happened when the programmes are implemented.
Contingency
Figure 9.5 Evaluation model for school-based improvement
INTENDED INPUTS Resources available for improvement purposes Educator competencies Learner characteristics
Strategies on the meso- and micro-levels based on needs
INTENDED PROCESSES
Meso-level (School-level) School Attitude towards
achievement School climate
Approach towards assessment Curriculum development and
design Leadership
Micro-level (Classroom) Educator Attitude towards
achievement Quality of instruction Revised curriculum
Assessment practices Opportunities to learn Instructional methods
Feedback and reinforcement
ACTUAL INPUTS Resources available for improvement purposes Educator competencies Learner characteristics
Strategies on the meso- and micro-levels based on needs
ACTUAL PROCESSES
Meso-level (School-level) School Attitude towards
achievement School climate
Approach towards assessment Curriculum development and
design Leadership
Micro-level (Classroom) Educator Attitude towards
achievement Quality of instruction Revised curriculum
Assessment practices Opportunities to learn Instructional methods
Feedback and reinforcement
INTENDED OUTPUTS Learner achievement
Learner perceptions and attitudes Teacher perceptions and attitudes School perceptions and attitudes
ACTUAL OUTPUTS Learner achievement
Learner perceptions and attitudes Teacher perceptions and attitudes School perceptions and attitudes
INTENDED ACTUAL
Contingency
Contingency Contingency
Co
ng
ruen
ce
C
on
gru
en
ce
C
on
gru
en
ce
Contingency C
ontin
gency
298
Stake (1968) uses antecedents to indicate what goes into the system or, as in Figure 9.5,
inputs. He specifically refers to antecedents as background information. However this can be
modified for the purpose of this research: what goes into the system goes through processes
of teaching and learning and results in a number of outcomes. Instructional transactions form
part of the processes, while outcomes specifically refer to what is achieved. Congruence in
Figure 9.5 refers to whether what was intended actually occurred. Thus to be congruent the
intended inputs, processes and outputs would have to come to pass (Stake, 1968).
Contingency refers to the relationships among the variables characterised under inputs,
processes and outcomes (Stufflebeam & Shinkfield, 1984).
Stake’s thinking is important as the intervention programme will have intended outcomes
which are based on assumptions about certain inputs and processes. There is a relationship
between the inputs and processes and the processes and outcomes. These have to be
identified and recognised if the intervention programme is to be a success. Ideally there
would be an orderly cyclic process of developing effective education and, in the case of
remediation, an effective intervention programme. Designing and developing an effective
monitoring system or intervention programme is never achieved in one try. Rather, the
development activity takes the form of a cyclic approach, in which development is
undertaken. This is implemented followed by evaluation which results in revision and further
development work. This is in essence the approach applied in design research. According to
Van den Akker, Gravemeijer, McKenney and Nieveen (2006, p. 2):
By carefully studying progressive approximations of ideal interventions in their
target settings, researchers and practitioners construct increasingly workable and
effective interventions, with improved articulation of principles that underpin their
impact.
Design research aims to develop theories based on empirical evidence through the process
of learning as well as the vehicle used to support the process of learning (Van den Akker et
al., 2006). The process underlying design research can be characterized as follows (Edelson,
2006):
1) It is research driven and thus draws on prior research.
2) The research process is systematically documented.
3) The design is developed based on research and knowledge of the context is
implemented.
4) The implementation is followed by formative evaluation in order to identify any
weaknesses in problem analysis, design solutions or design procedure.

299
5) There are iterative cycles of design, implementation and evaluation.
6) Generalisations can be made in the form of theories, design frameworks or design
methodologies.
9.6 Conclusion
The shortest distance between two points is still under construction –
Noelie Altito (Genn, 2007).
The aim of this PhD research was to explore the feasibility of using a value-added monitoring
system for education developed in the United Kingdom. As the research continued the
possibilities of what such a system could mean for South Africa presented themselves. Thus
this was the first step in what appears to be the beginning of a very exciting journey.
A national monitoring system is proposed, a system which is not managed at the national-
level, but possibly subsidised by the Department of Education to meet the goals of education
that the government has identified. However, if the monitoring system is to work then the
correct foundation has to be provided. In order to have, in the end, a system of high
standards and quality, the following should be carefully considered and reported
(Posthethwaite, 2004):
� The aims of the system should be explicated stated and ideally should be relevant
to theory and policy. The aims of the system should be operationalised into good
research questions;
� Descriptions of the target population should be elaborated on in terms of defined
population, desired population and results for exclusions given;
� The sample should be specified as well as methods of sampling employed.
Sampling weights should be used in order to correct for disproportionality among
sampling strata. Sampling error and response rates should be reported;
� Translations of instruments have to be verified and the process adequately
described;
� The assessments should be appropriate and domains clearly defined. The validity
and reliability strategies should be reported;
� If questionnaires are included, the items should adequately cover the research
questions and the variables be defined. The questionnaires should be piloted as an
additional stage of refining;
300
� How the data were collected is of utmost importance and descriptions should be
given in terms of the manuals used, tracking forms used, missing data and quality
control mechanisms;
� The quality of the data should be described, i.e. the data entry program should be
described and consistency checks elaborated on;
� The analysis techniques used should be appropriate and standard errors reported;
� The reports written should be clear and the relevant issues should be adequately
addressed.
In conclusion
As the number of school aged children has grown rapidly world-wide
and the demand for the provision of both primary and secondary
school has increases at an even greater rate, it has gradually become
essential to monitor educational standards.
(Keeves, Lietz, Gregory & Darmawan, 2006, p. 110)
In this context, the research presented in this book is just the first stage of a long route South
African education has to travel in order to reach world-class quality.
301
References
Aarnoutse, C.; & Brand-Gruwel, S. (1997). Improving reading comprehension strategies
through listening. Educational Studies, 23(2), 209-228.
About South Africa. (2006). The languages of South Africa. Retrieved January 5, 2007, from
http://www.southafrica.info/ess_info/sa_glance/demographics/language.htm.
Adewuyi, D. A. (2002). Comparison between school effectiveness characteristics and
classroom instruction strategies in the United States and Nigeria. African Development
XXVII (1&2), 263-287.
Anastasi, A., & Urbina, S. (1997). Psychological testing (7th ed.). New Jersey: Prentice Hall.
Anderson, L W. (1988). Attitude and there measures. In T. Husen & T. N. Postlethwaite
(Eds.), The international encyclopaedia of education (pp. 352 -358). Oxford: Pergamon
Press.
Anderson, L W. (1994). Attitude and there measures. In T. Husen & T. N Postlethwaite
(Eds.), The international encyclopaedia of education (2nd ed.) (pp. 3051-3055). Oxford:
Pergamon Press.
Andrich, D. (1982). An index of person separation in latent trait theory, the traditional KR. 20
index, and the Guttman scale response pattern. Education Research and Perspectives,
9, 95-104.
Andrich, D. (2006). Lecture 9: Fit of the responses to the model. EDU 435/635 Instrument
design with IRT & data analysis 1 Unit materials.
Arkin, A. (1997). Measuring the difference a school makes. Times Educational Supplement
14/11/1997.
Aron, A., & Aron, E. N. (1997). Statistics for the behavioural and social sciences: A brief
course. New Jersey: Prentice Hall.
302
Artley. A.S. (1996). Controversial issues relating to word perception. The Reading Teacher,
50(1), 10-13.
Asmal, K. (2001). Department of Education Annual Report: 2000/2001. Retrieved July 19,
2005, from http://education.pwv.gov.za.
Asmal, K. (2003). Speech by the Minister of Education at the colloquium marking the launch
of the Foundation Phase Systemic Evaluation. Retrieved July 17, 2005, from
http://education.pwv.gov.za.
Atherton. J. S. (2003) Doceo: Competence, proficiency and beyond. Retrieved November 13,
2006, from http://www.doceo.co.uk/background/expertise.htm.
Babbie, E., & Mouton, J. (2001). The practice of social research. Cape Town: Oxford
University Press.
Bafumo, M. E. (2005). Professional development best practices: Impacting achievement.
Retrieved September 13, 2006, from: www.TeachingK-8.com.
Baker, F.B. (2001). The basic of item response theory (2nd ed.). Retrieved November 15,
2004, from http://ericae.net/.
Ballou, D. (2005). Value-added assessment: Lessons from Tennessee. In R. Lissitz (Ed.),
Value-added models in education: Theory and application (pp. 19-39). Maple Grove:
JAM Press.
Barb, S. A., & Roth, W. M. (2006). Curriculum-based ecosystems: Supporting knowing from
an ecological perspective. Educational Researcher, 35(5), 3-13.
Barnard, J. (2004). Item Response Theory Workshop: An Introduction to Measurement Theory
and Models. University of Pretoria. 23 – 27 August 2004.
Barry, C. A. (1998). Choosing Qualitative Data Analysis Software: Atlas.ti and Nudist
Compared. Retrieved June 21, 2006, from
http://www.socresonline.org.uk/socresonline/3/3/4.html.
303
Bellis, I. (1999). Outcomes-based education: Issues of competence and equity in curriculum
and assessment. In J. D. Jansen & P. Christie (Eds.), Changing curriculum: Studies on
outcomes-based education in South Africa (pp. 219 – 230). Kenwyn: Juta and Co.
Berg, B. L. (1998). Qualitative research methods for the social sciences (3rd ed.). Boston:
Allyn and Bacon.
Bianchi, A. B. (2003). A new look at accountability: “Value-added” assessment. Forecast:
Emerging issues in Public Education, 1(1).
Black, P., & Wiliam, D. (1998). Inside the black box: Raising standards through classroom
assessment. Retrieved June 7, 2004, from http://www.pdkintl.org/kappan/kbla9810.htm.
Blaikie, N. (2003). Analysing quantitative data. London: Sage publications
Bliss, J. R. (1991). Strategic and holistic images of effective schools. In J. R. Bliss, W. A.
Firestone & C. E. Richards (Eds.), Rethinking effective schools: research and practice
(pp. 43-57). New Jersey: Prentice Hall.
Bolarin, T. A. (1992). Support at home and academic achievement of Nigerian pupils. The
Journal of Social Psychology 132(5), 685-686.
Bond, T. G., & Fox, C. M. (2001). Applying the Rasch model: Fundamental measurement in
the human sciences. London: Lawrence Erlbaum Associates.
Bosker, R. J & Visscher, A. J. (1999). Linking school management theory to school
effectiveness research. In A. J. Visscher (Ed.), Managing schools towards high
performance: Linking school management theory to the school effectiveness knowledge
base (pp. 291 – 322). Lisse: Swets & Zeitlinger.
Bottani, TN, & Tuinjman, A. (1994).The design of indicator systems. In A. C. Tuijnman & T. N.
Postelethwaite (Eds.), Monitoring standards of education: Papers in honour of John. P.
Keeves (pp. 47-77). Oxford: Pergamon Press.
Bronfenbrenner, U. (1976). The experimental ecology of education. Educational Researcher,
5(9), 5-15.
304
Bryk, A. S., Hermanson, K. L. (1993). Educational indicator systems: Observation on their
structure, interpretation, and use. Review of Research in Education, 19, 451-484.
Cantrell, C. E. (1997). Item response theory: Understanding the one-parameter model Rasch
model. Paper presented at the Annual Meeting of the Southwest Educational Research
Association, United States of America.
Carrol, J. B. (1997). Psychometrics, intelligence, and public perception. Intelligence, 24(1),
25-52.
Cathcart, W.G.; Pothier, Y.M.; Vance, J.H.; & Bezuk, N.S. (2003). Learning mathematics in
elementary and middle school. New Jersey: Prentice Hall.
Claassen, N. C. W., van Heerden, J. S., Vosloo, H. N., & Wheeler, J. J. (2000). Manual for
the differential aptitude tests form-r (DAT-R). Human Sciences Research Council:
Pretoria.
Coe, R. (2002). Evidence on the role and impact of performance feedback in schools. In A. J.
Visscher and R. Coe (Eds.), School improvement through performance feedback (pp.
3–26). Lisse: Swets & Zeitlinger Publishers.
Coe, R., & Visscher, A. J. (2002). Introduction. In A. J. Visscher & R. Coe (Eds.), School
improvement through performance feedback (pp. 1-3). Lisse: Swets & Zeitlinger
Publishers.
Cohen, L., Manion, L., & Morrison, K. (2004). Research methods in education (5th ed.).
London: Routledge Falmer.
Cohen, M. P. (1998). Determining sample sizes for surveys with data analysed by
hierarchical linear models. Journal of Official Statistics, 14(3), 267-275.
Colom, R., Abad, F. J., García, L. F., & Jaun-Espinosa, M. (2002). Education, Wechsler’s full
scale IQ, and g. Intelligence, 30, 449-462.
Coolican, H. (1999). Research methods and statistics in Psychology (3rd ed.). London:
Hodder & Stoughton.
305
Cooper, C. (1999). Intelligence and abilities. London: Routledge.
Cotton, K. (2001). Monitoring student learning in the classroom. Retrieved May 23, 2001,
from http://www.nwrel.org/scpd/sirs/2/cu4.html.
Creemers, B. P. M. (1994). The history, value and purpose of school effectiveness studies. In
D. Reynolds, B. P. M. Creemers, P. S. Nesselrodt, E. C. Schaffer & C. Teddlie (Eds.),
Advances in school effectiveness research and practice (pp. 9 – 23). Oxford:
Pergamon.
Creemers, B. P. M. (1994). Effective instruction: an empirical basis for a theory of
educational effectiveness. In D. Reynolds, B. P. M. Creemers, P. S. Nesselrodt, E. C.
Schaffer & C. Teddlie (Eds.), Advances in school effectiveness research and practice
(pp. 189 - 205). Oxford: Pergamon.
Creswell, J. W. (2003). Research design: Qualitative, quantitative and mixed method
approaches (2nd ed.). London: Sage Publications.
Creswell, J. W., Plano Clark, V. L., Gutman, M. L., & Hanson, W. E. (2003). Advanced mixed
methods research designs. In A. Tashakkori & C. Teddlie (Eds.), The handbook of
mixed methods in the social and behavioural research (pp. 209 – 240). London: Sage
Publications.
Crocker, L., & Algina, J. (1986). Introduction to classical and modern test theory. United
Kingdom: Wadsworth Thomson Learning.
Curriculum, Evaluation and Management Centre (CEM). (2002a).Introduction to the MidYIS
Project. Retrieved May 17, 2002, from
http://midyis.cem.dur.ac.za.uk/default.asp.
Curriculum, Evaluation and Management Centre (CEM). (2002b). Project overview. Retrieved
May 17, 2002, from
http://midyis.cem.dur.ac.uk/overview.asp.
Curriculum, Evaluation and Management Centre (CEM). (2002c). What is value-added.
Retrieved December 3, 2002, from
http://cem.dur.ac.uk/frameset.asp?choice=secondary.
306
Curriculum, Evaluation and Management Centre (CEM). (2002d). Reliabilities. Retrieved
December 3, 2002, from http://www.midyisproject.org/reliabilities.asp.
Curriculum, Evaluation and Management Centre (CEM). (2002e). The MidYIS baseline tests.
Retrieved December 3, 2002, from http://www.midyisproject.org/thetests.asp.
Curriculum, Evaluation and Management Centre (CEM). (2002f). The MidYIS additional
project. Retrieved December 3, 2002, from
http://www.midyisproject.org/additionaloverview.asp.
Curriculum, Evaluation and Management Centre (CEM). (2002g). PIPS Home Page.
Retrieved December 3, 2002, from http://www.pipsproject.org/.
Curriculum, Evaluation and Management Centre (CEM). (2002h). Example feedback:
Nationally standardised. Retrieved December 3, 2002, from
http://www.midyisproject.org/natstand.asp.
Curriculum, Evaluation and Management Centre (CEM). (2002i). Predictions to GCSE.
Retrieved December 3, 2002, from http://www.midyisproject.org/predgcse.asp.
Curriculum, Evaluation and Management Centre (CEM). (2002j). Paris software overview.
Retrieved December 3, 2002, from http://midyis.cem.dur.ac.uk/parisoverview.asp.
Curriculum, Evaluation and Management Centre (CEM). (2002k). Information sheet:
Individual pupil record sheets academic year 2002/2003. CEM Centre: University of
Durham.
Curriculum, Evaluation and Management Centre (CEM). (2002l). MidYIS guide to predicted
grades based on Year 7 MidYIS test academic year 2002/2003. CEM Centre:
University of Durham.
Curriculum, Evaluation and Management Centre (CEM). (2002m). The concept of value-
added. CEM Centre: University of Durham.
Curriculum, Evaluation and Management Centre (CEM). (2005). About the CEM Centre.
Retrieved July 15, 2005, from http://www.cemcentre.org/about/default.asp.
307
Curriculum, Evaluation and Management Centre (CEM). (2006a). Predictive validity.
Retrieved February 15, 2006, from http://www.midyisproject.org/predictivevalidity.asp.
Curriculum, Evaluation and Management Centre (CEM). (2006b). Value-added feedback.
Retrieved February 15, 2006, from http://www.midyisproject.org/vagcse.asp.
Curriculum, Evaluation and Management Centre (CEM). (2006c). Extended MidYIS.
Retrieved February 15, 2006, from http://intu.cem.dur.ac.uk/extended/extended.asp.
Curriculum, Evaluation and Management Centre (CEM). (2006d). Student attitudes
information system. Retrieved February 15, 2006, from
http://www.cem.canterbury.ac.nz/satis.shtml.
Curriculum, Evaluation and Management Centre (CEM). (2006e). Alis home page. Retrieved
January 5, 2006, from http://www.alisproject.org.
Curriculum, Evaluation and Management Centre (CEM). (2006f). Alis value-added feedback.
Retrieved January 5, 2006, from http://www.alisproject.org/Theproject/vafeedback.
Curriculum, Evaluation and Management Centre (CEM). (2006g). Alis basic questionnaire.
Retrieved January 5, 2006, from
http://www.alisproject.org/TheProject/basicquestionnaire/default.asp.
Day, H. A. (1988). Motivation. In T. Husen & T. N. Postlethwaite (Eds.), The international
encyclopaedia of education (pp. 3425-3430). Oxford: Pergamon Press.
De Haan, D.M. (1992). Measuring test-curriculum overlap. Published PhD dissertation:
University of Twente.
Doran, H. C., & Fleischman, S. (2005). Research matters. Educational Leadership, 63(3) 85-
87.
Doran, H. C., & Lockwood, J. R. (2006). Fitting value-added models in R. Journal of
Educational and Behavioural Statistics, 31, 205–230.
Drury, D., & Doran, H. (2003). The value of value-added analysis. Policy News Brief, 3(1), 1-
4.
308
Edelson, D. (2006). What we learn when we engage in design: Implications for assessing
design research. In J. Van den Akker, K. Gravemeijer, S. Mckenney & N. Nieveen
(Eds.), Educational design research (pp. 129 - 138). Oxfordshire: Taylor and Francis
Ltd.
Espin, C. A., Shin, J., & Busch, T. W. (2005). Curriculum-based measurement in content
areas: Vocabulary matching as an indicator of progress social studies learning. Journal
of Learning Disabilities, 38(4), 353-363.
Expers, N. Pragmatism. Retrieved March 17, 2003, from
http://angelfire.com/az/experiment/pragmatism.html.
Facon, B. (2004). Are correlations between cognitive abilities highest in low IQ groups during
childhood? Intelligence, 32, 391-401.
Falk, B. (2000). The heart of the matter. Portsmouth: Heinneman.
Fertig, M. (2000). Old wine in new bottles. School Effectives and School Improvement, 11(3),
385-403.
Field, A. (2000). Discovering statistics using SPSS for windows. London: Sage Publications.
Fitz-Gibbon, C. T. (1992). Empower and monitor: The EM algorithm for the creation of
effective schools. In J. Bashi & Z. Sass (Eds.), School effectiveness and improvement:
Proceedings of the Third International Congress for School Effectiveness. Jerusalem:
Magnes Press.
Fitz-Gibbon, C.T. (1996). Monitoring education: Indicators, quality and effectiveness. London:
Cassell.
Fitz-Gibbon, C. T. (2002). A typology of indicators. In A. J. Visscher & R Coe (Eds.), School
improvement through performance feedback (pp. 27–39). Lisse: Swets & Zeitlinger
Publishers.
Fitz-Gibbon, C. T. (2003). Milestones en route to evidence-based policies. Research Papers
in Education, 18(4), 313-329.
309
Fitz-Gibbon, C. T., & Tymms, P. (2002). Technical and ethical issues in indicator systems:
Doing things right and doing things wrong. Educational Policy Analysis Archives, 10(6).
Retrieved December 2, 2002, from http://epaa.asu.edu/epaa/v10n6/.
Frederiksen, J. R., & Collins, A. (1989). A systems approach to educational testing.
Educational Researcher, 18(9), 27-32.
Frisbie, D.A. (1988). Reliability of scores from teacher made tests. Educational
measurement: Issues and practices, 7(1), 25-35.
Fuchs, L. S. & Fuchs, D. (1991). Curriculum-based measurements. Preventing School
Failure, 35(3), 6-12.
Fuller, B., & Clarke, P. (1994). Raising school effects while ignoring culture? Local conditions
and the influence of classroom tools, rules, and pedagogy. Review of Educational
Research, 64(1), 119-157.
Gagné, F., & St Père, F. (2001). When IQ is controlled, does motivation still predict
achievement? Intelligence, 30(1), 71-100.
Gardner, J. (2006). Assessment and learning. California: Sage Publications.
Garson, P. (2005). South Africa education at a glance. Retrieved July 22, 2005, from
http://www.southafrica.info/ess_info/sa_glance/education/education.htm.
Gawe, N., & Heyns, R. (2004). Quality assurance. In J.G. Maree & W.J. Fraser (Eds.),
Outcomes-based assessment (pp.159-184). Sandown: Heinemann Publishers.
Gay, L. R., & Airasian, P. (2003). Educational Research: Competencies for analysis and
application (7th ed.). New Jersey: Merrill Prentice Hall.
GDE Circular. (2002). Guidelines for outcomes-based assessment in all grades in
foundation, intermediate and senior phases implementing OBE. Johannesburg:
Gauteng Education Department.
Genn, R. (2007). Construction art quotations. Retrieved January 2, 2007, from
http://quote.robertgenn.com/getquotes.php?catid=58.
310
George, D., & Mallery, P. (2001). SPSS for windows step by step. Boston: Allyn and Bacon.
Goldstein, H. (1997). Methods in school effectiveness research. School Effectiveness and
School Improvement, 8(4), 369-395.
Gottfredson, L. S. (1997a). Mainstream science on intelligence: An editorial with 52
signatories, history, and bibliography. Intelligence, 24(1), 13-23.
Gottfredson, L. S. (1997b). Why g matters: The complexity of everyday life. Intelligence,
24(1), 79-132.
Gottfredson, L. S. (1997c). Foreword to “intelligence and social policy”. Intelligence, 24(1), 1-
12.
Graham-Jolly, M. (2003). The nature of curriculum. In M. Coleman, M. Graham-Jolly & D.
Middlewood (Eds.), Managing curriculum in South African schools (pp. 3-16). London:
Commonwealth Secretariat.
Gray, J. (2002). Jolts and reactions: Two decades of feeding back information on schools’
performance. In A. J. Visscher & R. Coe (Eds.), School improvement through
performance feedback (pp. 143–162). Lisse: Swets & Zeitlinger Publishers.
Gray, J., Hopkins, D., Reynolds, D., Wilcox, B., Farrell, S., & Jesson, D. (1999). Improving
schools performance and potential. Buckingham: Open University Press.
Greaney, V., & Kellaghan, T. (1996). Monitoring the learning outcomes of educational
systems. Washington DC: The World Bank.
Greene, J. C. (2005). Mixing methods in evaluation workshop notes. Centurion Country Club,
Gauteng. 23-24 June 2005.
Greene, J. C., & Caracelli, V. J. (2003). Making pragmatic sense of mixed methods practice.
In A. Tashakkori & C. Teddlie (Eds.), The handbook of mixed methods in the social and
behavioural research (pp. 91-110). London: Sage Publications.
Greenwald, R., Hedges, L. V., & Laine, R. D. (1996). The effect of school resources on
student achievement. Review of Educational Research, 66(3), 361-396.
311
Greenwald, A. G., Nosek, B. A., & Sriram, N. (2006). Consequential validity of the implicit
association test. American Psychologist, 61(1), 56-61.
Grobler, A. C., Grobler, A. A., & Esterhuyse, K. G. F. (2001).Some predicators of
mathematics achievement among black secondary school learners. South African
Journal of Psychology, 31(4), 48-55.
Gronlund, N. E. (1998). Assessment of student achievement (6th ed.). Boston: Allyn and
Bacon.
Gultig, J. (2003). Outcomes-based education and its implications for teachers. In M.
Coleman, M. Graham-Jolly & M. Middlewood (Eds.), Managing the curriculum in South
African schools (pp. 171-194). London: The Commonwealth Secretariat.
Hager, K.D., & Slocum, T.A. (2005). Using alternative assessment to improve educational
outcomes. Rural Special Education Quarterly, 24(1), 54-59.
Halawah, I. (2006). The effects of motivation, family environment, and student characteristics
on academic achievement. Journal of Instructional Psychology, 33(2), 91-99.
Hambleton R. K., Swaminathan, H., & Rogers, H. J. (1991). Fundamentals of item response
theory. Newbury Park, CA: Sage Publication.
Hamers, J.H.M., & Csapó, B. (1999). Teaching thinking. In: J.H.M Hamers, J.E.H Hamers &
B. Csapó (Eds.), Teaching and learning thinking skills (pp. 11- 36). Lisse: Swets &
Zeitlinger Publishers.
Hanushek, E. A. (1997). Assessing the effects of school resources on student performance:
An update. Educational Evaluation and Policy Analysis, 19(2), 141-164.
Harker, R. (2003). “School effects”, “value-added” and all that. Retrieved April 11, 2003, from
http://www.qpec.org.nz/resour…/01_School_Effects,_Value_Added_and_All_That.htm.
Hartley, R. (1990). The social and economic costs of low levels of literacy. APLIS, 3(3), 143-
149.
312
Heck, R. H. (2000). Examining the impact of school quality on school outcomes and
improvement: A value-added approach. Educational Administration Quarterly, 36(4),
513-552.
Heck, R. H., & Thomas, S. L. (2000). An introduction to multilevel modelling techniques. New
Jersey: Lawrence Erlbaum Associates.
Hendriks, M. A., Doolaard, S., & Bosker, R. J. (2001). School self-evaluation in the
Netherlands: Development of the ZEBO-instrumentation. Prospects XXXI(4), 503 –
518.
Hendriks, M. A., Doolaard, S., & Bosker, R. J. (2002). Using school effectiveness as a
knowledge base for self-evaluation in Dutch schools: the ZEBO-project. In A. J.
Visscher & R. Coe (Eds.), School improvement through performance feedback (pp.
115–142). Lisse: Swets & Zeitlinger Publishers.
Henning, E with van Rensburg W, & Smit, B. (2004). Finding your way in qualitative
research. Pretoria: van Schaik.
Henson, R. K. (1999). Understanding the one-parameter Rasch model of item response
theory. Paper presented at the Annual Meeting of the Southwest Educational Research
Association, United States of America.
Hill, P. (2001). Perspectives on education: Teaching and school effectiveness. Victoria:
Victorian Department of Education.
Hirsh, S. (2005). Professional development and closing the achievement gap. Theory into
Practice, 44(1), 38-44.
Holloway, J. H. (2003). Linking professional development to student learning. Educational
Leadership, 62(3), 85-87.
Holmes. E. E. (1995). New directions in elementary school mathematics. New Jersey:
Prentice-Hall.
Hortacsu, N. (1995). Parents’ educational levels, parents’ beliefs and child outcomes. The
Journal of Genetic Psychology, 156(3), 373-383.
313
Howie, S. (1997). Mathematics and science performance in the middle school years in
South Africa: A summary report on the performance of South African students in the
Third International Mathematics and Science Study. Pretoria: Human Sciences
Research Council.
Howie, S. (2001). Mathematics and science performance in Grade 8 in South Africa
1998/1999: TIMSS-R 1999 South Africa. Pretoria: Human Sciences Research Council.
Howie, S. J. (2002). English language proficiency and contextual factors influencing
Mathematics achievement of secondary school pupils in South Africa. Published PhD
thesis: University of Twente.
Howie, S.J. (2003). Renewal of secondary education curricula and assessment in South
Africa. In The renewal of secondary education in Africa (pp. 305-321). Dakar: UNESCO
Publishing.
Howie, S. J., & Plomp, T. P. (2005). International comparative studies of education and large-
scale change. In N. Bascia, A. Cumming, A. Datnow, K. Leithwood & D. Livingstone
(Eds.), International handbook of educational policy (pp. 75-99). Dordrecht: Springer.
Lens, W. (1994). Motivation and learning. In T. Husen and T. N. Postlethwaite, International
encyclopaedia of educational research (2nd ed.) (pp. 3936-3942). Oxford: Pergamon
Press.
Hox, J. J. (1995). Applied multilevel analysis. Retrieved April 30, 2002 from
http://www.fss.uu.nl/ms/jh/publist/amaboek.pdf.
Hox, J. J. (1998). Multilevel modeling: when and why. In I. Balderjahn, R. Mathar, M. Schader
(Eds.), Classification, data analysis, and data highways (pp. 147–154). New York:
Springer.
Hox, J. J. (2002). Multilevel analysis: Techniques and applications. London: Lawrence
Erlbaum Associates.
Human Sciences Research Council (HSRC). (2006). Fact Sheet: Comparing South African
performance TIMSS 1999 to TIMSS 2003. Retrieved February 15, 2006, from
http://www.hsrc.ac.za/research/programmes/ESSD/timss2003/factSheet3.html.
314
Hunt, E. (1985). In R. J. Sternberg (Ed.), Human abilities: An information-processing
approach (pp. 31-58). New York: W. H. Freeman and Company.
Husén, T., & Tuinjman, A. (1994). Monitoring standards in education: Why and how it came
about. In A. C. Tuijnman & T. N. Postelethwaite (Eds.), Monitoring standards of
education: Papers in honour of John. P. Keeves (pp. 1-21). New York: Pergamon.
Huysamen, G. K. (1996). Psychological measurement: An introduction with South African
examples. Pretoria: van Schaik.
Jansen, J. (2006). Is evidence overrated? Quest, 2(3), 33-35.
Jansen, J.D. (2004.) Autonomy and accountability in regulation of the teaching profession: A
South African case study. Research Papers in Education, 19(1), 51-66.
Johnson, R. B., & Onwuegbuzie, A. J. (2004). Mixed methods research: A research paradigm
whose time has come. Educational Researcher, 33(7), 14-26.
JUTA. (2003). Curriculum 2005 and outcomes-based education. Retrieved May 9, 2003, from
http://www.juta.co.za/academic/Schools/Copy/obe.htm.
Keeves, J. P., Lietz, P., Gregory, K., & Darmawan, G. N. (2006). Some problems in the
analysis of cross-national survey data. International Education Journal, 7(2), 110-126.
Kendall, I. M., Verster, M. A., & von Mollendorf, J. W. (1988). Test performance of blacks in
Southern Africa. In S. H Irvine & J. W. Berry (Eds.), Human abilities in cultural context
(pp. 299-339). New York: Cambridge University Press.
Killen, R. (2000). Teaching strategies for outcomes-based education. Lansdowne: Juta & Co.
Killen, R. L. (1999). Outcomes-based education: some issues to consider in the South
African context. Unpublished paper.
Kline, P. (1993). The handbook of psychological testing. Routledge: London.
Kline, P. (2000). A psychometric primer. London: Free Association Books.
315
Koshan, S., Tashakorri, A., & Teddlie, C. (1996). You can’t judge a high school by
achievement alone: Preliminary findings from the construction of a behavioural indicator
of high school effectiveness. Paper presented at the annual meeting of the American
Educational Research Association, New York, United States.
Kotzé, G. S. (2002). Issues related to adapting assessment practices. South African Journal
of Education, 22(1), 76-80.
Kraak, A. (1998). Competing education and training policies: A systemic vs. unit standards
approach. Pretoria: Human Sciences Research Council.
Krathwohl, D. R. (1998). Methods of educational & social science research: An integrated
approach (2nd ed.). New York: Longman.
Kupermintz, H. (2003). Value-added assessment of teachers: Empirical evidence. Retrieved
August 22, 2003, from
http://www.asuedu/educ/educ/espl/epru/documents/epru%202002-101/chapter%2011-
kupermintz-final.rtf
Kyriakides, L. (2002). A research-based model for the development of policy on baseline
assessment. British Educational Research Journal, 28(4), 805-826.
le Grange, L. (2004). Assessment in science and technology education. In J. G. Maree & W.
J. Fraser (Eds.), Outcomes-based assessment (pp.185-197). Sandown: Heinemann
Publishers.
Legres, K. S. (2000). Topic 1 – Assessments – Highlights of the Tennessee Value
Assessment Program. Memorandum to the Special Committee on Preschool and K-12
Matters.
Linacre, J. M. (2005). A user’s guide to Winsteps. Retrieved January 10, 2005 from
http://www.winsteps.com.
Lincoln, Y. S., & Guba, E. G. (1985). Naturalistic inquiry. London: Sage Publications.
Linn, R. L., & Gronlund, N. E. (2000). Measurement and assessment in teaching (8th ed.).
New Jersey: Prentice Hall.
316
Lockheed, M.E. (1996). International context for assessments. In P. Murphy, V. Greaney, M.
E. Lockheed & C. Rojas (Eds.), National assessments: Testing the system (pp. 9-20).
Washington DC: The World Bank.
Lockheed, ME., & Murphy, P. (1996). Introduction. In P. Murphy, V. Greaney, M. E.
Lockheed & C. Rojas (Eds.), National assessments: Testing the system (pp. 1-8).
Washington DC: The World Bank.
Luke, D. A. (2004). Multilevel modeling. London: Sage Publications.
Luyten, H., Visscher, A., & Witziers, B. (2005). School effectiveness research: From a review
of criticism to recommendations for further development. School Effectiveness and
School Improvement, 16(3), 249-279.
Maas, C. J. M., & Hox, J. J. (2002). Sample sizes for multilevel modeling. In J. Blasius, J.
Hox, E. de Leeuw & P. Schmidt (Eds.), Social science methodology in the new
millennium. Proceedings of the Fifth International Conference on Logic and
Methodology.
Maas, C. J. M., & Hox, J. J. (2004). Robustness issues in multilevel regression analysis.
Statistica Neerlandica, 58(2), 127 – 137.
Marsh, C. J. (1992). Key concepts for understanding curriculum. New York: The Falmer
Press.
Marsh, C. J., & Willis, G. (2003). Curriculum: Alternatives approaches, ongoing issues (3rd
ed.). New Jersey: Merrill.
Marshall, J. (1986). Exploring the experiences of women managers: Towards rigour in
qualitative methods. In S. Wilkinson (Ed.), Feminist social psychology: Developing
theory and practice (pp. 193-209). Milton Keynes: Open University Press.
Masters, G. N. (1988). Item discrimination: when more is worse. Journal of Educational
Measurement, 25, 15-29.
317
Maxcy, S. J. (2003). Pragmatic thread in mixed methods research in the social sciences: The
search for multiple modes of inquiry and the end of the philosophy of formalism. In A.
Tashakkori & C. Teddlie (Eds.), The handbook of mixed methods in the social and
behavioural research (pp. 51–110). London: Sage Publications.
Maxwell, J. A. (1996). Qualitative research design: An interactive approach. Thousand Oaks:
Sage Publications.
McBurney, D. H. (1994). Research methods (3rd ed.). Pacific Grove: Brooks/Cole Publishing
Company.
McCamey, R. (2002). A primer for the one-parameter Rasch model. Paper presented at the
Annual Meeting of the Southwest Educational Research Association, United States of
America.
McDouall, B. (1998). Proposals for the use of value-added measures in English schools
foundations. Retrieved May 17, 2002, from http://www.englishschoolsfoundation.e.
McFarlane, A. (1997). Information technology and authentic learning in the primary school.
Retrieved April 6, 2005 from http://www.tess.dk/socroadl/course98/odl/m6-kt1.htm.
McMillian, J. H. (2001). Essential assessment concepts for teachers and administrators.
California: Corwin Press.
McRoy, R. G. (n.d.) Qualitative research. Retrieved November 18, 2003 from
http://www.uncp.edu/home/marson/qualitative_research.html.
Merriam-Webster Dictionary Online. (2005). Retrieved December 5, 2005, from
http://webster.com.
Messick, S. (1981). Evidence and ethics in evaluation of tests. Educational Researcher,
10(9), 9-20.
Messick, S. (1989).Meaning and values in test validation: The science and ethics of
assessment. Educational Researcher, 18(2), 5-11.
318
Messick, S. (1998). Test validity: A matter of consequence. Social Indicators Research, 45,
35-44.
Milne, M., & Plourde, L. E. (2006). Factors of a low-ses household: What aids academic
achievement. Journal of Instructional Psychology, 33(3), 183-193.
Mohamed, N. (2001).Transforming education and training in the post-Apartheid period:
Revisiting the education, training and labour axis. In E. Motala & J. Pampallis (Eds.),
Education and equity (pp. 105-138). Sandown: Heinemann Publishers.
Mok, M. (1995). Sample size requirements for 2-level designs in educational research.
Multilevel Modelling Newsletter, 7(2), 11-15.
Moloi, M., & Strauss, J. (2005). The SACMEQ II Project in South Africa: A study of the
condition of schooling and the quality of education. Harare: SACMEQ.
Morse, J. (2003). Principles of mixed methods and multimethod research design. In A.
Tashakkori & C. Teddlie (Eds.), The handbook of mixed methods in the social and
behavioural research (pp. 189-208). London: Sage Publications.
Mortimore, P. (1998). The road to improvement: Reflections on school effectiveness. Lisse:
Swets & Zeitlinger Publishers.
Mortimore, P., & Sammons, P. (1994). School effectiveness and value-added measures.
Assessment in Education, 1(1), 315-333.
Muijs, D., Harris, A., & Chapman, C. (2004). Improving schools in socioeconomically
disadvantaged areas – A review of research evidence. School Effectiveness and
School Improvement 15(2), 149-175.
Muller, J. (2004). Assessment, qualifications and the NQF in South African school. In L
Chisholm (Ed.), Changing class: Education and social change in post-apartheid South
Africa (pp. 221-246). Cape Town: HSRC Press.
Murphy, J. A. (1988). Improving the achievement of minority students. Educational
Leadership, 46(2), 41-42.
319
Murphy, J. F., Weil, M., Hallinger, P., & Mitman, A. (1982). Academic press: Translating high
expectations into school policies and classroom practices. Educational Leadership,
40(3), 22-26.
Murphy, K. R., & Davidshofer, C. O. (1994). Psychological testing: Principles and
applications. New Jersey: Prentice-Hall International.
Muth, D.K. (1997). Using cooperative learning to improve reading and writing in mathematical
problem solving. Reading and Writing Quarterly, 13(1), 71-73.
National Department of Education. (1998). Assessment Policy in the general education and
training band, Grades R to 9 and ABET. Government Gazette, 6397. Pretoria:
Government Publisher.
National Department of Education. (2001). Brochure for the 2000 school register of needs
report. Retrieved June 2, 2003, from
http://education.pwv.gov.za/Policies%20and%20Reports/2001_Report/SRN/srn.htm.
National Department of Education. (2002a). Revised National Curriculum Statement Grades
R-9: Overview. Pretoria: Department of Education.
National Department of Education. (2002b). Revised National Curriculum Statement Grades
R-9: English Home Language. Pretoria: Department of Education.
National Department of Education. (2002c). Revised National Curriculum Statement Grades
R-9: English Second Additional Language. Pretoria: Department of Education.
National Department of Education. (2002d). Revised National Curriculum Statement Grades
R-9: Mathematics. Pretoria: Department of Education.
National Department of Education. (2003a). Framework for systemic evaluation. Pretoria:
Government Publishers.
National Department of Education. (2003b). Plan of action: Improving access to free and
quality basic education for all. Pretoria: Government Publishers.
320
National Department of Education. (2005a). Education statistics in South Africa at a glance.
Pretoria: Department of Education.
National Department of Education. (2005b). Grade 6 intermediate phase systemic evaluation
report. Pretoria: Department of Education.
National Foundation for Educational Research. (2003). Value-added testing. Retrieved June
7, 2004, from http://www.nfer.ac.uk/aboutus/amd13.asp.
National Research Council. (2001). Knowing what students know: The science and design of
educational assessment. Washington, DC: National Academy Press.
National Union for Educators. (2005). Integrated quality management system. Retrieved July
26, 2005, from http://www.nue.org.za/documents/iqms.html.
Nelissen, J.M.C. (1999). Thinking skills in realistic mathematics. In J. H. M. Hamers, J. E. H.
Hamers & B. Csapó (Eds.), Teaching and learning thinking skills (pp. 189- 213). Lisse:
Swets & Zeitlinger Publishers.
Neuman, W.L. (1997). Social research methods: Qualitative and quantitative approaches.
Boston: Allyn and Bacon.
Newman, I., & Benz, C. R. (1998). Qualitative-quantitative research methodology: Exploring
the interactive continuum. Illinois: Southern Illinois University Press.
Newmann, F. M. (1991). Strategic and holistic images of effective schools. In J. R. Bliss, W.
A. Firestone & C. E. Richards (Eds.), Rethinking effective schools: research and
practice (pp. 43-57). New Jersey: Prentice Hall.
Newton, I., Ridenour, C. S., Newman, C., & DeMarco, G. M. P. (2003). A typology of
research purposes and its relationship to mixed methods. In A. Tashakkori & C. Teddlie
(Eds.), The handbook of mixed methods in the social and behavioural research (pp.
167-188). London: Sage Publications.
Newton, R.R.; Rudestam, K.E. 1999. Your statistical consultant. London: SAGE Publications.
321
Nisan, M. (1988). Motivation: Academic. In T. Husen & T. N. Postlethwaite, The international
encyclopaedia of education (pp. 3430-3434). Oxford: Pergamon Press.
Niss, M. (1996). Goals of mathematics teaching. In A.J. Bishop (Ed.), International handbook
of mathematics education (pp. 11-47). Dordrecht: Kluwer Academic.
Nkhoma, P. M. (2002). What successful black South African students consider as factors of
their success. Educational Studies in Mathematics 50, 103-113.
Nuttall, D. L. (1994). Monitoring national standards: United Kingdom. In T Husen & T. N
Postlethwaite (Eds.), The international encyclopaedia of education (2nd ed.) (pp. 3906 -
3912). Oxford: Pergamon.
Olivier, C. (1998). How to educate and train outcomes-based. Pretoria: Van Schaik
Publishers.
Olson, L. (2002). Education scholars finding new value in student test data. Education Week
22(12), 1-2.
Onwuegbuzie, A. J., & Teddlie, C. (2003). A framework for analysing data in mixed methods
research. In A. Tashakkori & C. Teddlie (Eds.), The handbook of mixed methods in the
social and behavioural research (pp. 351-383). London: Sage Publications.
Organisation for Economic Co-operation and Development (OECD). (2005). School factors
related to quality and equity: Results from PISA 2000. Retrieved July 26, 2005, from
http://www.oecd.org/dataoecd/15/20/34668095.pdf.
Pampallis, J. (2004). A critical perspective on the GDE’s performance over the last ten years.
Retrieved July 24, 2005, from
http://www.education.gpg.gov.za/publications/paperrelease.htm.
Patton, M. Q. (2002). Qualitative research and evaluation methods (3rd ed.). London: Sage
Publications.
Pelgrum, W. J. (1989). Educational assessment: Monitoring, evaluation and the curriculum.
De Lier: Academisch Boeken Centrum.
322
Perkins-Gough, D. (2006). Accelerating the learning of low achievers. Educational
Leadership, 63(5), 88-89.
Perlman, M. D., & Kaufman, A. S. (1990). Assessment of child intelligence. In G. Goldstein &
M. Hersen (Eds.), Handbook of psychological assessment (2nd ed.) (pp. 59-78). New
York: Pergamon Press.
Petter, S. C., & Gallivan, M. J. (2004). Toward a framework for classifying and guiding mixed
method research in information systems. Paper presented at the 37th Hawaii
International Conference on System Science, Hawaii, United States.
Pickering, J. W., & Bowers, J. C. (1990). Assessing value-added outcomes assessment.
Measurement & Evaluation in Counselling and Development, 22(4), 215 – 221.
Plomp, T. P. (2004). Quality assurance in Netherlands education. Workshop held at the
University of Pretoria, 5 August.
Porter, A. C. (1991). Creating a system of school process indicators. Educational Evaluation
and Policy Analysis, 13(1), 13-29.
Posner, G. J & Rudnitsky, A. N. (1997). Course design (5th ed.). New York: Longman.
Posthethwaite, T. N. (2004). Ten questions by which to judge the soundness of educational
achievement surveys. In S. Alagumalai, M. Thompson, J. A. Gibbons and A. Dutney
(Eds.), The seeker (pp. 41-58). Adelaide: Flinders University Institute of International
Education.
Pullin, D. C. (1994). Learning to work: The impact of curriculum and assessment standards
on educational opportunity. Harvard Educational Review, 64(1), 31-54.
Punch, K. (1995). Introduction to social research: Quantitative and qualitative approaches.
London: Sage Publications.
Raffan, J., & Ruthen, K. (2003). Monitoring and assessment. In J Beck & M Earl (Eds.), Key
issues in secondary education: Introductory readings (pp. 28-40). New York:
Continuum.
323
Ramono, E., Tremblay, R, E., Boulerice, B., & Swisher, R. (2005). Multilevel correlates of
childhood physical aggression and prosocial behaviour. Journal of Abnormal Child
Psychology, 33 (5), 565-578.
Rasbash, J., Browne, W., Goldstein, H., Yang, M., Plewis, I., Healy, M., Woodhouse, G.,
Draper, D., Lanford, I., & Lewis, T. (2001). A user’s guide to MLwiN. Centre for
Multilevel Modelling: University of London.
Rault-Smith, J. (2001). Developing quality assessment practices. Johannesburg: Gauteng
Department of Education.
Reading Today. (2005). UNESCO Report spotlights issue of education quality. Reading
Today, 22(4), 23.
Reckase, M. D. (1998). The interaction of values and validity assessment: does a test’s level
of validity depend on a researcher’s values. Social Indicators Research, 45, 45-54.
Reeves, T. (1996). Educational paradigms. Retrieved April 30, 2003, from
http://www.educationau.edu.au/archives/CP/REFS/reeves_paradigms.htm.
Reddy, C. (2004). Assessment principles and approaches. In J. G. Maree & W. J. Fraser
(Eds.), Outcomes-based assessment (pp. 29-44). Sandown: Heinemann Publishers.
Reschly, D. J. (1990). Aptitude tests in educational classification and placement. In G.
Goldstein & M. Hersen (Eds.), Handbook of psychological assessment (2nd ed.) (pp.
148-172). New York: Pergamon Press.
Riddell, A. R. (1997). Assessing designs for school effectiveness and school improvement in
developing countries. Comparative Education Review, 41(1), 178-204.
Rowe, K. J. (1999). Assessment, performance indicators, league-tables, value-added
measures and school effectiveness? Consider the issues and let’s get real! Paper
presented at Australian Association for Research in Education. Retrieved July 5, 2005,
from http://www.aare.edu.au/99pap/row99656.htm.
324
Rowe, K. J., Turner, R., & Lane, K. (1999). A method for estimating the reliability of
assessments that involve combinations of school assessed tasks and external
examinations. Paper presented at Australian Association for Research in Education.
Retrieved July 5, 2005, from http://www.aare.edu.au/99pap/row99126.htm.
Rowe, K. J., Turner, R., & Lane, K. (2002). Performance feedback to schools of students’
year 12 assessments. The VCE data project. In A. J. Visscher & R Coe (Eds.), School
improvement through performance feedback (pp. 163–190). Lisse: Swets & Zeitlinger
Publishers.
Rowe. D. C. (1997). A place at the policy table? Behaviour genetics and estimates of family
environmental effects on IQ. Intelligence 24(1), 133-158.
Rushton, J. P., Skuy, M., & Fridjhon, P. (2003). Performance on the raven’s advanced
progressive matrices by African, East Indian, and White engineering students in South
Africa. Intelligence 31, 123-137.
Safer, N., & Fleischman, S. (2005). How student progress monitoring improves instruction.
Educational Leadership, 62(5), 81-83.
Sammons, P. (1999). School effectiveness: Coming of age in the twenty-first century. Lisse:
Swets & Zeitlinger Publishers.
Sammons, P., Thomas, S., Mortimore, P., Walker, A., Cairns, R., & Bausor, J. (1998).
Understanding differences in academic effectiveness: Practitioners’ view. School
Effectiveness and School Improvement, 9(3), 286-309.
Sammons, P. (2006). School effectiveness and equity: Making connections. Keynote
presented at the International Congress for School Effectiveness and Improvement
(ICSEI), Fort Lauderdale, United States of America.
Sanders, W. L. (1998). Value-added assessment: a method for measuring the effects of the
system, school and teacher on the rate of student academic progress. The School
Administrator Web Addition. Retrieved April 11, 2003, from
http://www.aasa.org/publictaions/sa/1998_12/sanders.htm.
325
Sanders, W. L., & Horn, S. (1998). Research findings from the Tennessee Value-Added
Assessment System (TVAAS) database: Implications for educational evaluation
research. Journal of Personnel Evaluation in Education, 12(3), 247 – 256.
Sanders, W. L., & Horn, S. (2003). An overview of the Tennessee Value – Added
Assessment System (TVAAS): with answers to frequently asked questions. Retrieved
August 22, 2003, from http://www.mdk12.org/instruction/ensure/tva/tva_1.html.
Sanders, W. L., Wright, S. P., Ross, S. M., & Wang, L. W. (2000). Value-added achievement
results for three cohorts of roots and wings schools in Memphis: 1995-1999 outcomes.
Retrieved July 20, 2004, from http://www3.sas.com/govedu/edu/research.html.
Saunders, L. (1999). A brief history of Educational “value-added”: How did we get to where
we are? School Effectiveness and School Improvement, 10(2), 233-256.
Saunders, L. (2000). Understanding schools’ use of ‘value-added’ data: The psychology and
sociology of numbers. Research papers in Education, 15(3), 241-258.
Saunders, L. (2001). The use of value-added measures in school evaluation: A view from
England. Prospects, XXXI (4), 489-502.
Saunders, L. (2002). Accountability mechanisms and processes: ‘Value added’: Telling the
truth about schools performance. Retrieved May 17, 2002, from
http://www1.worldbank.org/education/e...
Saunders, L., & Rudd, P. (1999). Schools’ use of ‘value-added’ data: A science in the service
of an art. Paper presented at the British Educational Research Association Conference,
Sussex, United Kingdom.
Schagen, I. (1996). QUASE: Quantitative analysis for self-evaluation technical report:
Analysis of GCSE cohorts 1993 to 1995. Slough: National Foundation for Educational
Research.
Schagen, I. (2004). Weighing the baby or fattening it? The use of data to inform school
evaluation. Paper presented at the NFER/ConfEd Annual Research Conference
October 2004. Retrieved December 5, 2005, from
http://www.confed.org.uk/08%2010%2004%20IS.doc
326
Scheerens, J. (1990). School effectiveness and the development of process indicators of
school functioning. School effectiveness and School improvement, 1, 61-80.
Scheerens, J. (1992). Effective schooling: Research, theory and practice. London: Cassell.
Scheerens, J. (1999). Concepts and theories of school effectiveness. In A. J. Visscher (Ed.),
Managing schools towards high performance: Linking school management theory to the
school effectiveness knowledge base (pp. 37-70). Lisse: Swets & Zeitlinger.
Scheerens, J. (2000). Improving school effectiveness. Paris: UNESCO.
Scheerens, J. (2001a). Monitoring school effectiveness in developing countries. School
Effectiveness and School Improvement, 12(4), 359-384.
Scheerens, J. (2001b). Introduction: School effectiveness in developing countries. School
Effectiveness and School Improvement, 12(4), 353-358.
Scheerens, J., & Bosker, R. (1997). The foundations of educational effectiveness. Oxford:
Pergamon.
Scheerens, J., & Creemers, B. P. M. (1999). Review and prospects of educational
effectiveness research in the Netherlands. In R. J. Bosker, B. P. M. Creemers & S.
Stringfield (Eds.), Enhancing educational excellence, equity and efficiency (pp. 197-
221). Dordrecht: Kluwer Academic Publishers.
Scheerens, J., & Hendricks, M. (2002). School self-evaluation in the Netherlands. In D. Nevo
(Ed.), School-based evaluation: An international perspective (pp. 113-143). Amsterdam:
JAI Elsevier Science.
Scheerens, J., Glas, C., & Thomas, S.M. (2003). Educational evaluation, assessment and
monitoring: A systemic approach. Lisse: Swets & Zeitlinger Publishers.
School Directors Handbook. (2003). Student Assessment. Retrieved August 22, 2003, from
http://www.effwa.org/pdfs/education_directors_handbook6.pdf.
327
Schumacker, R. E. (2004). Rasch measurement: The dichotomous model. In E. V. Smith &
R. M. Smith (Eds.), Introduction to Rasch measurement (pp. 226 – 257). Maple Grove:
JAM Press.
Siebörger, R., & Macintosh, H. (1998). Transforming assessment: A guide for South African
teachers. Cape Town: Juta.
Siebörger, R., & Macintosh, H. (2004). Transforming assessment: A guide for South African
teachers (2nd ed.). Cape Town: Juta.
Sireci, S. G. (1998). The construction of content validity. Social Indicators Research, 45, 83-
117.
Smith, R. M. (2003). Rasch measurement models: Interpreting WINSTEPS and FACETS
outputs. Maple Grove: JAM Press.
Smith, W. J., & Ngoma-Maema, W. Y. (2003). Education for all in South Africa: Developing a
national system for quality assurance. Comparative Education, 39(3), 245-365.
Snijders, T., & Bosker, R. (1993). Standard errors and sample sizes for two-level research.
Journal of Educational Statistics, 18(3), 237-259.
Snijders, T., & Bosker, R. (1999). Multilevel analysis: An introduction to basic and advanced
multilevel modelling. London: Sage Publications.
Snow, R. E. Abilities as aptitudes and achievements in learning situations. In J. J. Mc Ardle &
R. W. Woodcock (Eds.), Human cognitive abilities in theory and practice (pp. 93-112).
New Jersey: Lawrence Erlbaum Associates.
Sontag, J. C. (1996). Toward a comprehensive theoretical framework for disability research:
Bronfenbrenner revisited. The Journal of Special Education, 30(3), 319-344.
South Africa Yearbook 2003/2004. (2003). Education. Pretoria: Government
Communications.
Spearritt, D. (1996). Carroll’s model of cognitive abilities: Educational implications.
International Journal of Educational Research, 25(2), 107-198.
328
Stake, R. E. (1968). The countenance of educational evaluation. Retrieved September 13,
2006, from http://www.ed.uiuc.edu/circe/Publications/Countenance.pdf.
Stand, S. (1998). A ‘value-added analysis of the 1996 primary school performance tables.
Educational Research, 40(2), 123 – 137.
Sternberg, R. J. (1985). In R. J. Sternberg (Ed.), Human abilities: An information-processing
approach (pp 5-29). New York: W. H. Freeman and Company.
Stringfield, S. (1994).A model of elementary schools effects. In D. Reynolds, B. P. M
Creemers, P. S. Nesselrodt, E. C. Schaffer & C Teddlie (Eds.), Advances in school
effectiveness research and practice (pp. 153 – 187). Oxford: Pergamon.
Stufflebeam, D. L. & Shinkfied, A. J. (1984). Systematic evaluation: A self-instructional guide
to theory and practice. Dordrecht: Kluwer Publishing.
Suen, H. K. (1990). Principle of test theories. New Jersey: Lawrence Erlbaum Associates.
Taggart, B., & Sammons, P. (1999). Evaluating the impact of a raising school standard
initiative. In R. J. Bosker, B. P. M. Creemers & S. Stringfield (Eds.), Enhancing
educational excellence, equity and efficiency: Evidence from evaluations of systems
and school change (pp.137-165). Dordrecht: Kluwer Academic Publishers.
Tashakkori, A., & Teddlie, C. (1998). Mixed methodology: Combining qualitative and
quantitative approaches. London: Sage Publications.
Taylor, C., Fitz, J., Gorard, S. (2005). Diversity, specialisation and equity in education. Oxford
Review of Education, 31(1), 47 – 69.
Taylor, N. C. & Prinsloo, C. (2005). The quality learning project lessons for high school
improvement in South Africa. Retrieved October 10, 2006, from
http://www.jet.org.za/documents/TaylorandPrinsloo.pdf.
Taylor, N., Muller, J., & Vinjevold, P. (2003). Getting schools working together. Cape Town:
Pearson Education South Africa.
329
Teal, T. (2003). Strategies to enhance vocabulary development. Retrieved April 6, 2005, from
http://www.eric.ed.gov/.
Teddlie, C. (1994a). Context in school effects research. In D. Reynolds, B. P. M Creemers, P.
S. Nesselrodt, E. C. Schaffer & C. Teddlie (Eds.), Advances in school effectiveness
research and practice (pp. 85 – 110). Oxford: Pergamon.
Teddlie, C. (1994b). Classroom and school process data. In D. Reynolds, B. P. M Creemers,
P. S. Nesselrodt, E. C. Schaffer & C. Teddlie (Eds.), Advances in school effectiveness
research and practice (pp. 111 – 132). Oxford: Pergamon.
Teddlie, C. (1994c). Effective instruction. In D. Reynolds, B. P. M Creemers, P. S.
Nesselrodt, E. C. Schaffer & C. Teddlie (Eds.), Advances in school effectiveness
research and practice (pp. 189 – 205). Oxford: Pergamon.
Teddlie, C., & Tashakkori, A. (2003). Major issues and controversies in the use of mixed
methods in the social and behavioural science. In A. Tashakkori & C. Teddlie (Eds.),
The handbook of mixed methods in the social and behavioural research (pp. 3-50).
London: Sage Publications.
Teddlie, C., Kochan, S., & Taylor, D. (2002). The ABC+ model for school diagnosis, feedback
and improvement. In A. J. Visscher & R. Coe (Eds.), School improvement through
performance feedback (pp. 75-114). Lisse: Swets & Zeitlinger Publishers.
The Chalk Face. (1999). Transformational OBE: What is it? Retrieved from January 23,
2003, from http://hagar.up.ac.za/catts/learner/1999/moore_aj/e-
cv/portfolio/projects/tech/newsletters/obe1.doc.
The Radical Academy. (2002). American pragmatism – 1. Retrieved March 17, 2003, from
http://www.radicalacademy.com/amphilosophy7.htm.
Thorndike, R. M. (1997). Measurement and evaluation in psychology and education (6th ed.).
New Jersey: Prentice Hall.
Tindall, C. (1990). Issues of evaluation. In P. Banister, E. Burman, I. Parker, M. Taylor and C.
Tindall (Eds.), Qualitative methods in psychology: A researchers guide (pp. 142-159).
London: Sage Publishers.
330
Torrance, H. (2003). Assessment of the national curriculum in England. In T. Kellaghan, D. L.
Stuffelbeam & L. A. Wingate (Eds.), International handbook of educational evaluation
(pp. 905-928). Dordrecht: Kluwer Academic Publishers.
Traub, R.E. & Rowley, G.L. (1991). Understanding reliability. Educational Measurement:
Issues and. Practice, 10(1), 37-45.
Travers, K. J., & Westbury, I. (Eds.) (1989). The IEA study of mathematics I: Analysis of
mathematics curricula. Oxford: Pergamon Press.
Trochim, W. M. K. (2001). Qualitative research. Retrieved June 11, 2001, from
http://trochim.human.cornell.edu/kb/qualval.htm.
Tymms, P. (1999). Baseline assessment and monitoring in primary schools. London: Fulton
Publishers.
Tymms, P. (2000). Baseline assessment and monitoring in primary schools: Achievement,
attitudes and value-added indicators. London: David Fulton Publishers.
Tymms, P., & Coe, R. (2003). Celebration of the success of the distributed research with
schools: the CEM centre, Durham. British Educational Research Journal, 29(5), 639-
653.
United Nations Educational Scientific and Cultural Organisation (UNESCO). (2005).
Education for all: Global monitoring report. Retrieved June 3, 2005, from
http://www.unesco.org/education/efa.
Urbina, S. (2004). Essentials of psychological testing. New Jersey: John Wiley and Sons.
Van Damme, J., Opdenakker, M. C., Van Landeghen, G., De Fraine, B., Pustjens, H., & Van
de gaer. (2006). Educational effectiveness: An introduction to international and Flemish
research on schools, teachers and classes. Leuven: ACCO.
Van den Akker, J. (2003). Curriculum perspectives: An introduction. In J. Van den Akker, U.
Hameyer & W. Kuiper (Eds.), Curriculum landscapes and trends (pp 1 - 10). Dordrecht:
Kluwer Academic Publishers.
331
Van den Akker, J. Gravemeijer, K., McKenney, S., & Nieveen, N. (2006). Introduction to
educational design research. In J. Van den Akker, K. Gravemeijer, S. Mckenney & N.
Nieveen (Eds.), Educational design research (pp. 1-8). Oxfordshire: Taylor and Francis
Ltd.
van der Linden, W. J., & Hambleton, R. K. (1997). Item response theory: Brief history,
common models, and extensions. In W. J. van der Linden & R. K. Hambleton (Eds.),
Handbook of item response theory (pp. 1-28). New York: Springer.
Van der Wagen, L., & Ridley, B. (2001). Your guide to training and assessment in the
national qualifications framework. Pretoria: Kagiso Publishers.
van der Werf, G., Creemers, B., & Guldmond, H. (2001). Improving parental involvement in
primary education in Indonesia: Implications, effects and costs. School Effectiveness
and School Improvement, 12(4), 447-466.
van der Werf, G.P.C., Brandsma, H.P., Cremers-van Wees, L.M.C.M., & Lubbers, M.J.
(1999). Quality and Opportunities in Secondary Education: Implementation and Effects
of the Common Core Curriculum. In R. J. Bosker, B. P. M. Creemers & S. Stringfield
(Eds.), Enhancing educational excellence, equity and efficiency (pp. 113 - 136).
Dordrecht: Kluwer Academic Publishers.
Vanhoof, J., & Van Petegem, P. (2005). Feedback of performance indicators as a strategic
instrument for school improvement. Revista Eletronca Iberoamericana sobre Calidad,
Eficacia y Cambio en EducaciÓn, 3(1), 206-221. Retrieved January 30, 2007, from
http://www.ice.deusto.es/rinace/reice/vol3n1_e/VanhoofVanPetegem.pdf.
Van Petegem, P., Vanhoof, J., Daems, F., & Mahieu, P. (2005). Publishing information on
individual schools. Educational Research and Evaluation, 11(1), 45-60.
Verschaffel, L. (1999). Realistic mathematics modelling and problem solving in the upper
elementary school: analysis and improvement. In J. H. M. Hamers, J. E. H. Hamers &
B. Csapó (Eds.), Teaching and learning thinking skills (pp. 216- 239). Lisse: Swets &
Zeitlinger Publishers.
Walhberg, H. J. (1984). Improving the productivity of America’s schools. Educational
Leadership, 41(8), 19 – 28.
332
Waugh, R. F. (2001). Creating a scale to measure motivation to achieve academically:
Linking attitudes and behaviours using Rasch measurement. Paper presented at the
Australian Association for Research in Education. Retrieved May 17, 2005, from
http://www.aare.edu.au/01pap/wau01047.htm.
Weber, R. P. (1985). Basic content analysis. London: Sage Publications.
West, A. (2000). Publishing school examination results in England: Incentives and
consequences. Educational Studies, 26(4), 422 – 436.
Wilkinson, S. (1988). The role of reflexivity in feminist psychology. Women’s Studies
International Forum, 11(5), 493-502.
Williams, K. (1999). Mixed quantitative and qualitative evaluation tools: A pragmatic
approach. Retrieved March 17, 2003, from
http://www.cemcentre.org/Documents/CEM%20Extra/EBE/EBE1999/Kevin%20Williams
.pdf.
Willms, J. D., & Somers, M. A. (2001).Family, classroom, and school effects on children’s
educational outcome in Latin America. School Effectiveness and School Improvement,
12(4), 409 - 445.
WINSTEPS. (n.d.). Winsteps. Retrieved January 23, 2005, from
www.winsteps.com/winsteps.htm.
Winter, G. (2000). A comparative discussion of the notion of ‘validity’ in qualitative and
quantitative research. The Qualitative Report 4 (3&4). Retrieved October 25, 2000, from
http://www.nova.edu/ssss/QR/QR4-3/winter.html.
Wood, R. (1987). Measurement and assessment in education and psychology. London:
Falmer Press.
World Bank Education Profile. (2002). Summary Education Profile: South Africa. Retrieved
June 6, 2004, from
http://devdata.worldbank.org/edstats/SummaryEducationProfiles/CountryData/GetShow
Data.asp?sCtry=ZAF,South%20Africa.
333
Worthen, B. R., Sanders, J. R., & Fitzpatrick, J. L. (1987). Program evaluation: alternative
approaches and practical guidelines. New York: Longman.
Wyatt, T. (1996). School effectiveness research: Dead end, damp squib or smouldering fuse.
Issues in Educational Research, 6(1), 79-112.
Yaffee, R. A. (2003). Common correlation and reliability analysis with SPSS for Windows.
Retrieved September 17, 2005, from http://www.nyu.edu/its/socsci/Docs/correlate.html.
Yang, M. (2006). Review of HLM 5.04 for Windows. Retrieved September 21, 2006, from
http://www.mlwin.com/softrev/reviewhlm.pdf.
Zurawsky, C. (2004). Teachers matter: evidence from value-added assessments. Research
Points, 2(2), 1-4.
334
Appendix A: Description of the MidYIS sub-tests
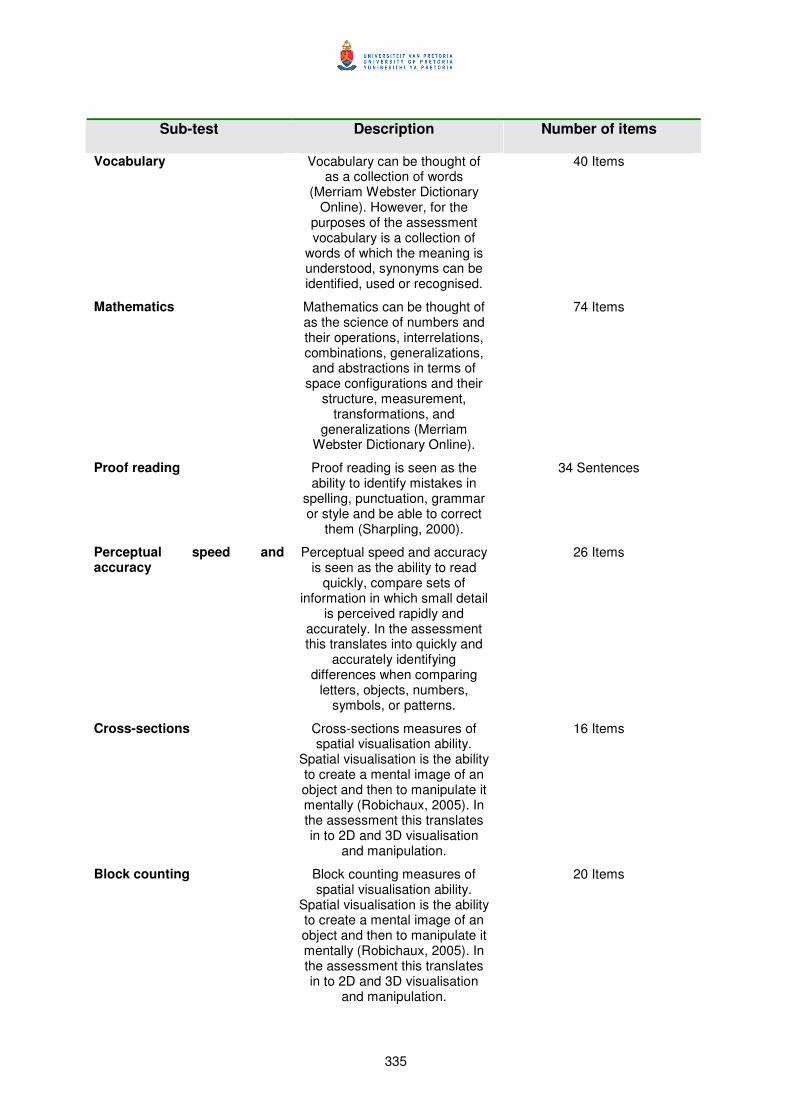
335
Sub-test Description Number of items
Vocabulary Vocabulary can be thought of as a collection of words
(Merriam Webster Dictionary Online). However, for the
purposes of the assessment vocabulary is a collection of
words of which the meaning is understood, synonyms can be identified, used or recognised.
40 Items
Mathematics Mathematics can be thought of as the science of numbers and their operations, interrelations, combinations, generalizations,
and abstractions in terms of space configurations and their
structure, measurement, transformations, and
generalizations (Merriam Webster Dictionary Online).
74 Items
Proof reading Proof reading is seen as the ability to identify mistakes in
spelling, punctuation, grammar or style and be able to correct
them (Sharpling, 2000).
34 Sentences
Perceptual speed and accuracy
Perceptual speed and accuracy is seen as the ability to read
quickly, compare sets of information in which small detail
is perceived rapidly and accurately. In the assessment this translates into quickly and
accurately identifying differences when comparing
letters, objects, numbers, symbols, or patterns.
26 Items
Cross-sections Cross-sections measures of spatial visualisation ability.
Spatial visualisation is the ability to create a mental image of an object and then to manipulate it mentally (Robichaux, 2005). In the assessment this translates in to 2D and 3D visualisation
and manipulation.
16 Items
Block counting Block counting measures of spatial visualisation ability.
Spatial visualisation is the ability to create a mental image of an object and then to manipulate it mentally (Robichaux, 2005). In the assessment this translates in to 2D and 3D visualisation
and manipulation.
20 Items
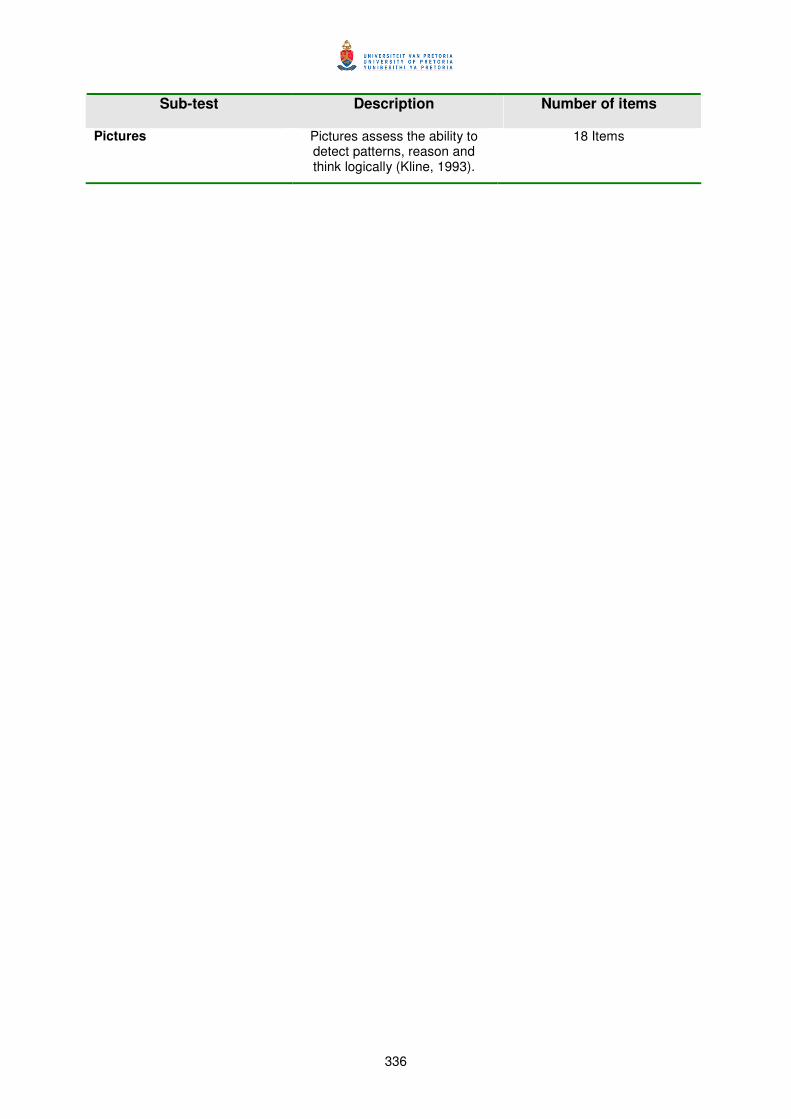
336
Sub-test Description Number of items
Pictures Pictures assess the ability to detect patterns, reason and think logically (Kline, 1993).
18 Items
337
Appendix B: Description of constructs included in the
learner questionnaire
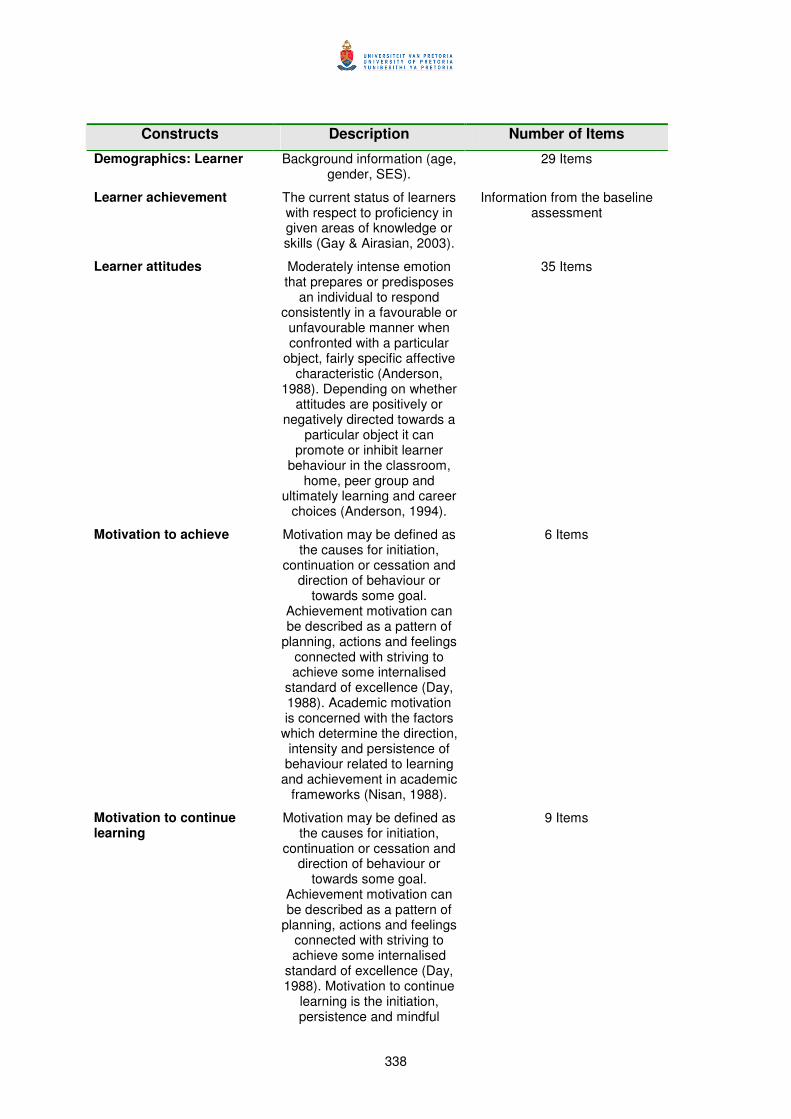
338
Constructs Description Number of Items
Demographics: Learner Background information (age, gender, SES).
29 Items
Learner achievement The current status of learners with respect to proficiency in given areas of knowledge or skills (Gay & Airasian, 2003).
Information from the baseline assessment
Learner attitudes Moderately intense emotion that prepares or predisposes
an individual to respond consistently in a favourable or unfavourable manner when confronted with a particular
object, fairly specific affective characteristic (Anderson,
1988). Depending on whether attitudes are positively or
negatively directed towards a particular object it can
promote or inhibit learner behaviour in the classroom,
home, peer group and ultimately learning and career
choices (Anderson, 1994).
35 Items
Motivation to achieve Motivation may be defined as the causes for initiation,
continuation or cessation and direction of behaviour or
towards some goal. Achievement motivation can be described as a pattern of
planning, actions and feelings connected with striving to achieve some internalised
standard of excellence (Day, 1988). Academic motivation is concerned with the factors
which determine the direction, intensity and persistence of behaviour related to learning
and achievement in academic frameworks (Nisan, 1988).
6 Items
Motivation to continue learning
Motivation may be defined as the causes for initiation,
continuation or cessation and direction of behaviour or
towards some goal. Achievement motivation can be described as a pattern of
planning, actions and feelings connected with striving to achieve some internalised
standard of excellence (Day, 1988). Motivation to continue
learning is the initiation, persistence and mindful
9 Items
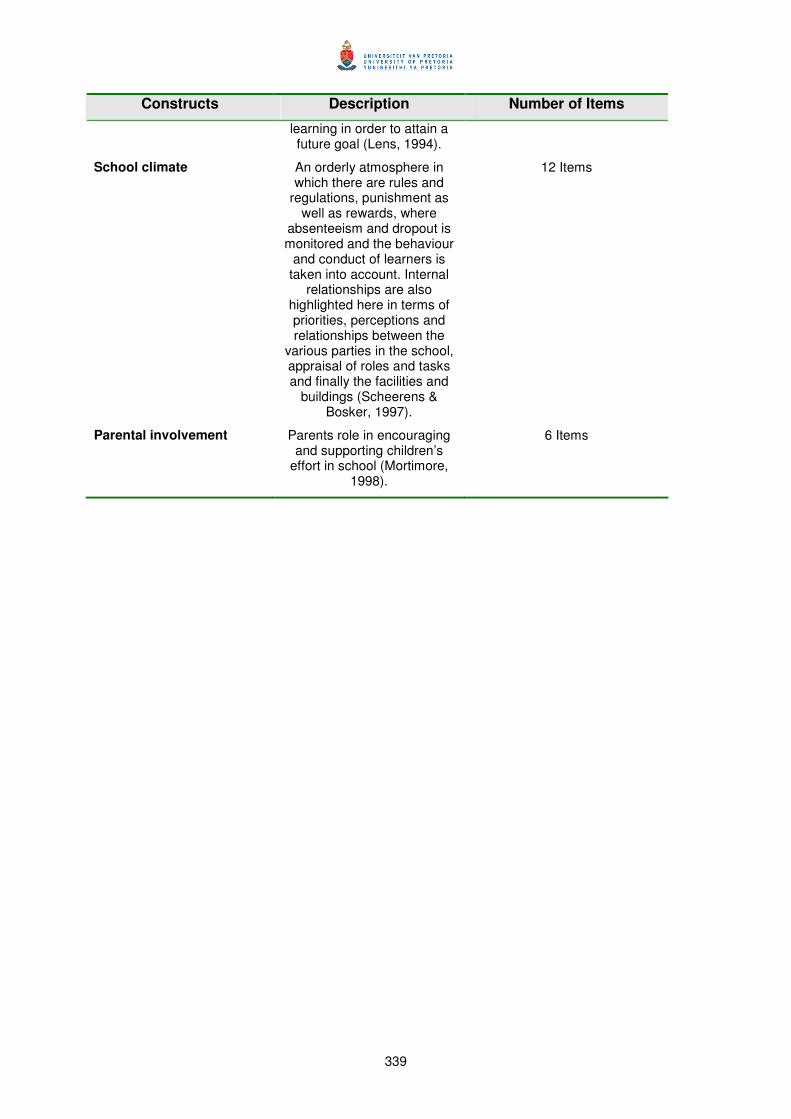
339
Constructs Description Number of Items
learning in order to attain a future goal (Lens, 1994).
School climate An orderly atmosphere in which there are rules and
regulations, punishment as well as rewards, where
absenteeism and dropout is monitored and the behaviour
and conduct of learners is taken into account. Internal
relationships are also highlighted here in terms of priorities, perceptions and relationships between the
various parties in the school, appraisal of roles and tasks and finally the facilities and
buildings (Scheerens & Bosker, 1997).
12 Items
Parental involvement Parents role in encouraging and supporting children’s
effort in school (Mortimore, 1998).
6 Items
340
Appendix C: Description of constructs included in the
educator questionnaire
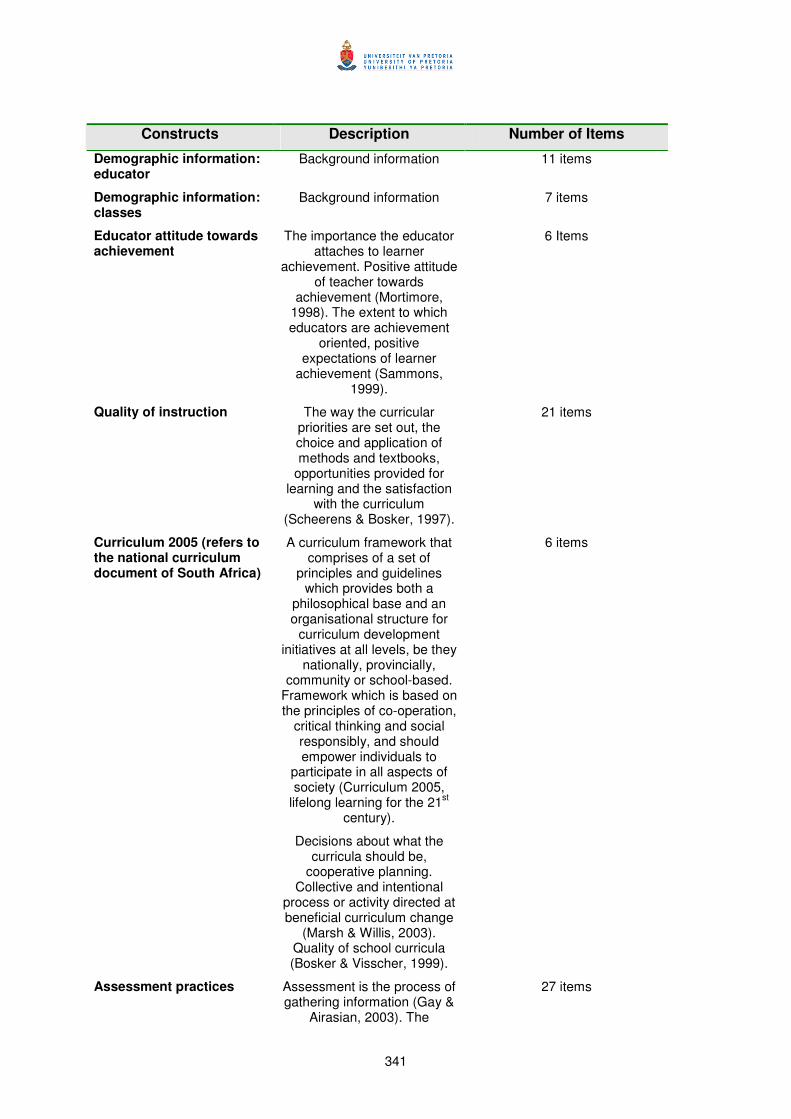
341
Constructs Description Number of Items
Demographic information: educator
Background information 11 items
Demographic information: classes
Background information 7 items
Educator attitude towards achievement
The importance the educator attaches to learner
achievement. Positive attitude of teacher towards
achievement (Mortimore, 1998). The extent to which educators are achievement
oriented, positive expectations of learner
achievement (Sammons, 1999).
6 Items
Quality of instruction The way the curricular priorities are set out, the choice and application of methods and textbooks,
opportunities provided for learning and the satisfaction
with the curriculum (Scheerens & Bosker, 1997).
21 items
Curriculum 2005 (refers to the national curriculum document of South Africa)
A curriculum framework that comprises of a set of
principles and guidelines which provides both a
philosophical base and an organisational structure for
curriculum development initiatives at all levels, be they
nationally, provincially, community or school-based.
Framework which is based on the principles of co-operation,
critical thinking and social responsibly, and should empower individuals to
participate in all aspects of society (Curriculum 2005,
lifelong learning for the 21st
century).
Decisions about what the curricula should be,
cooperative planning. Collective and intentional
process or activity directed at beneficial curriculum change
(Marsh & Willis, 2003). Quality of school curricula (Bosker & Visscher, 1999).
6 items
Assessment practices Assessment is the process of gathering information (Gay &
Airasian, 2003). The
27 items
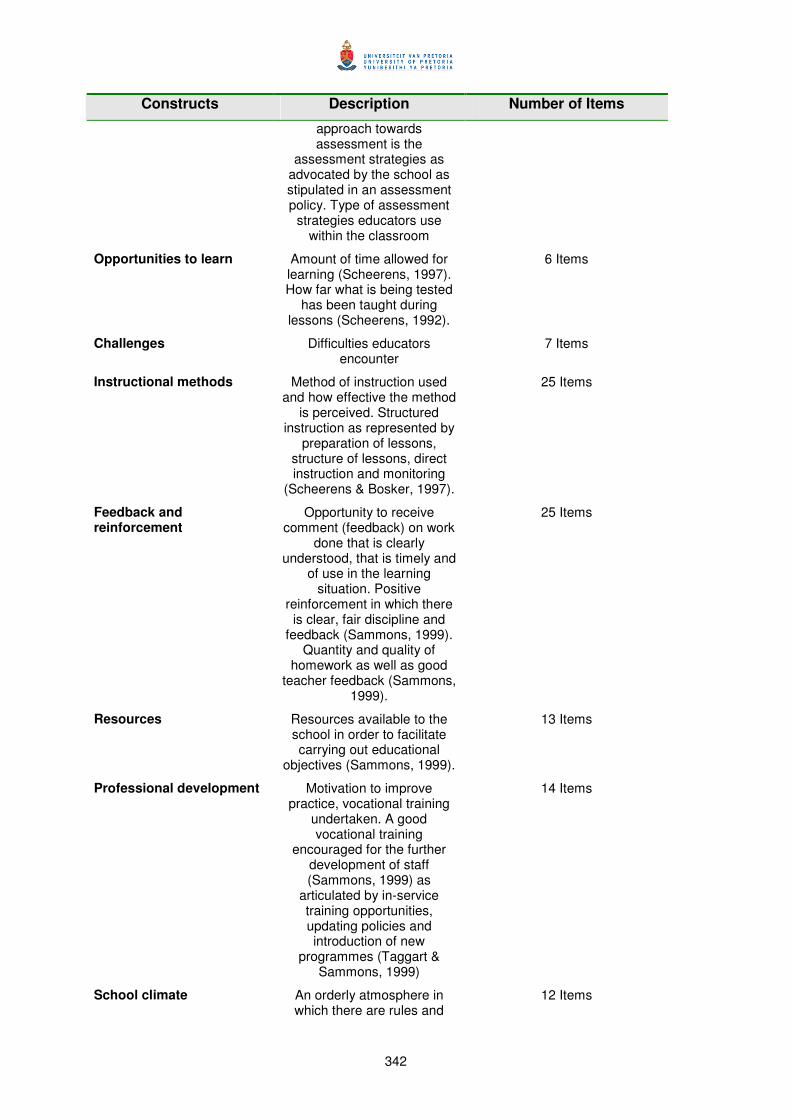
342
Constructs Description Number of Items
approach towards assessment is the
assessment strategies as advocated by the school as stipulated in an assessment policy. Type of assessment
strategies educators use within the classroom
Opportunities to learn Amount of time allowed for learning (Scheerens, 1997). How far what is being tested
has been taught during lessons (Scheerens, 1992).
6 Items
Challenges Difficulties educators encounter
7 Items
Instructional methods Method of instruction used and how effective the method
is perceived. Structured instruction as represented by
preparation of lessons, structure of lessons, direct instruction and monitoring
(Scheerens & Bosker, 1997).
25 Items
Feedback and reinforcement
Opportunity to receive comment (feedback) on work
done that is clearly understood, that is timely and
of use in the learning situation. Positive
reinforcement in which there is clear, fair discipline and
feedback (Sammons, 1999). Quantity and quality of
homework as well as good teacher feedback (Sammons,
1999).
25 Items
Resources Resources available to the school in order to facilitate carrying out educational
objectives (Sammons, 1999).
13 Items
Professional development Motivation to improve practice, vocational training
undertaken. A good vocational training
encouraged for the further development of staff (Sammons, 1999) as
articulated by in-service training opportunities, updating policies and introduction of new
programmes (Taggart & Sammons, 1999)
14 Items
School climate An orderly atmosphere in which there are rules and
12 Items
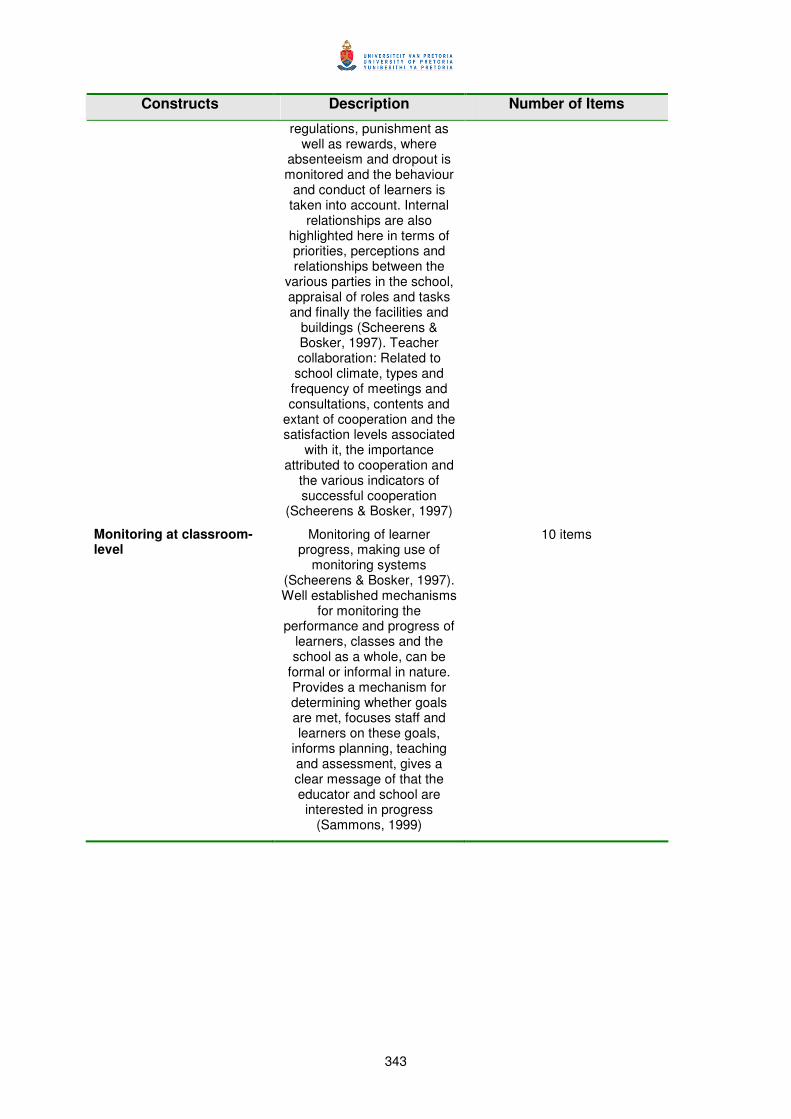
343
Constructs Description Number of Items
regulations, punishment as well as rewards, where
absenteeism and dropout is monitored and the behaviour
and conduct of learners is taken into account. Internal
relationships are also highlighted here in terms of priorities, perceptions and relationships between the
various parties in the school, appraisal of roles and tasks and finally the facilities and
buildings (Scheerens & Bosker, 1997). Teacher collaboration: Related to school climate, types and frequency of meetings and consultations, contents and
extant of cooperation and the satisfaction levels associated
with it, the importance attributed to cooperation and
the various indicators of successful cooperation
(Scheerens & Bosker, 1997)
Monitoring at classroom-level
Monitoring of learner progress, making use of
monitoring systems (Scheerens & Bosker, 1997). Well established mechanisms
for monitoring the performance and progress of
learners, classes and the school as a whole, can be
formal or informal in nature. Provides a mechanism for determining whether goals are met, focuses staff and learners on these goals,
informs planning, teaching and assessment, gives a clear message of that the educator and school are interested in progress
(Sammons, 1999)
10 items
344
Appendix D: Description of the constructs in the
principal questionnaire
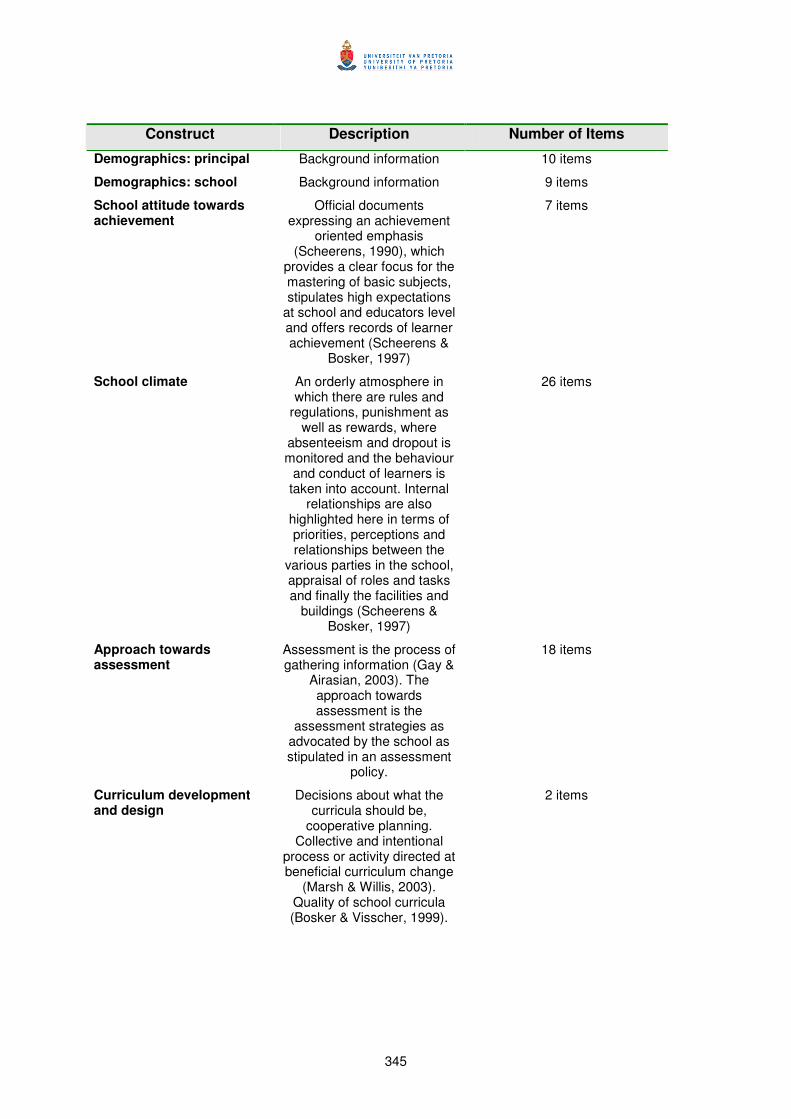
345
Construct Description Number of Items
Demographics: principal Background information 10 items
Demographics: school Background information 9 items
School attitude towards achievement
Official documents expressing an achievement
oriented emphasis (Scheerens, 1990), which
provides a clear focus for the mastering of basic subjects, stipulates high expectations
at school and educators level and offers records of learner achievement (Scheerens &
Bosker, 1997)
7 items
School climate An orderly atmosphere in which there are rules and
regulations, punishment as well as rewards, where
absenteeism and dropout is monitored and the behaviour
and conduct of learners is taken into account. Internal
relationships are also highlighted here in terms of priorities, perceptions and relationships between the
various parties in the school, appraisal of roles and tasks and finally the facilities and
buildings (Scheerens & Bosker, 1997)
26 items
Approach towards assessment
Assessment is the process of gathering information (Gay &
Airasian, 2003). The approach towards assessment is the
assessment strategies as advocated by the school as stipulated in an assessment
policy.
18 items
Curriculum development and design
Decisions about what the curricula should be,
cooperative planning. Collective and intentional
process or activity directed at beneficial curriculum change
(Marsh & Willis, 2003). Quality of school curricula (Bosker & Visscher, 1999).
2 items
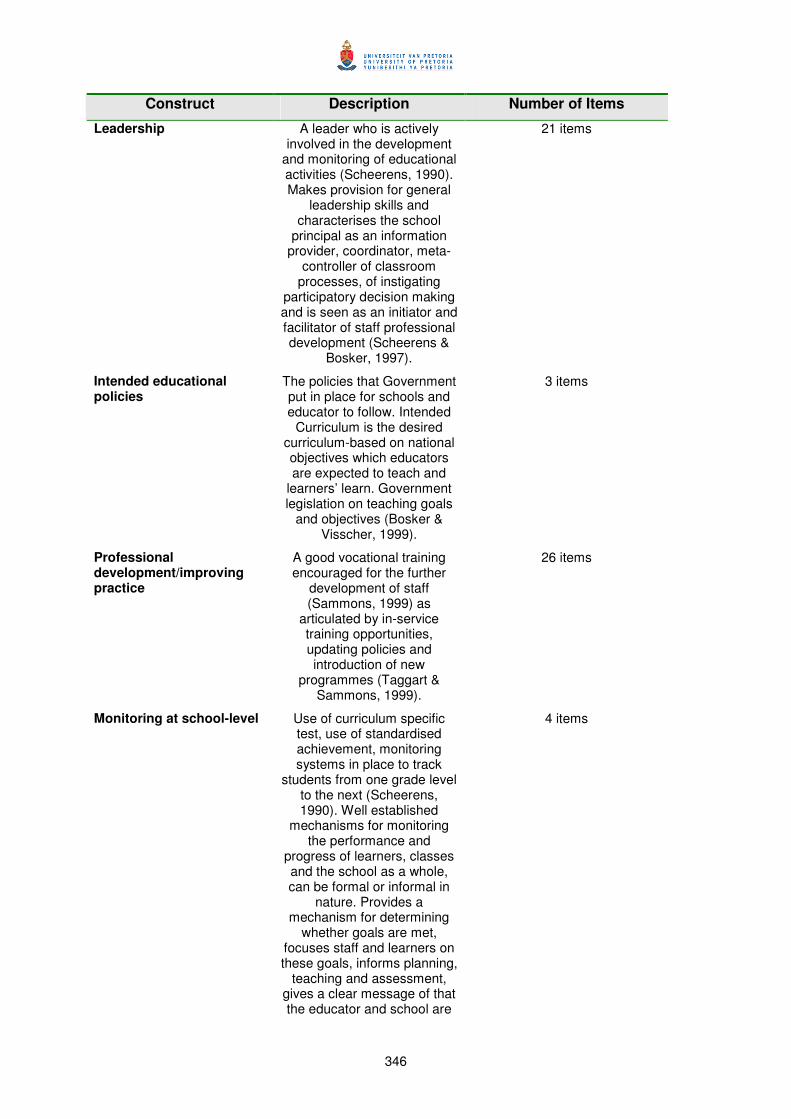
346
Construct Description Number of Items
Leadership A leader who is actively involved in the development
and monitoring of educational activities (Scheerens, 1990). Makes provision for general
leadership skills and characterises the school
principal as an information provider, coordinator, meta-
controller of classroom processes, of instigating
participatory decision making and is seen as an initiator and facilitator of staff professional development (Scheerens &
Bosker, 1997).
21 items
Intended educational policies
The policies that Government put in place for schools and educator to follow. Intended
Curriculum is the desired curriculum-based on national objectives which educators are expected to teach and
learners’ learn. Government legislation on teaching goals
and objectives (Bosker & Visscher, 1999).
3 items
Professional development/improving practice
A good vocational training encouraged for the further
development of staff (Sammons, 1999) as
articulated by in-service training opportunities, updating policies and introduction of new
programmes (Taggart & Sammons, 1999).
26 items
Monitoring at school-level Use of curriculum specific test, use of standardised achievement, monitoring systems in place to track
students from one grade level to the next (Scheerens, 1990). Well established
mechanisms for monitoring the performance and
progress of learners, classes and the school as a whole, can be formal or informal in
nature. Provides a mechanism for determining
whether goals are met, focuses staff and learners on these goals, informs planning,
teaching and assessment, gives a clear message of that the educator and school are
4 items
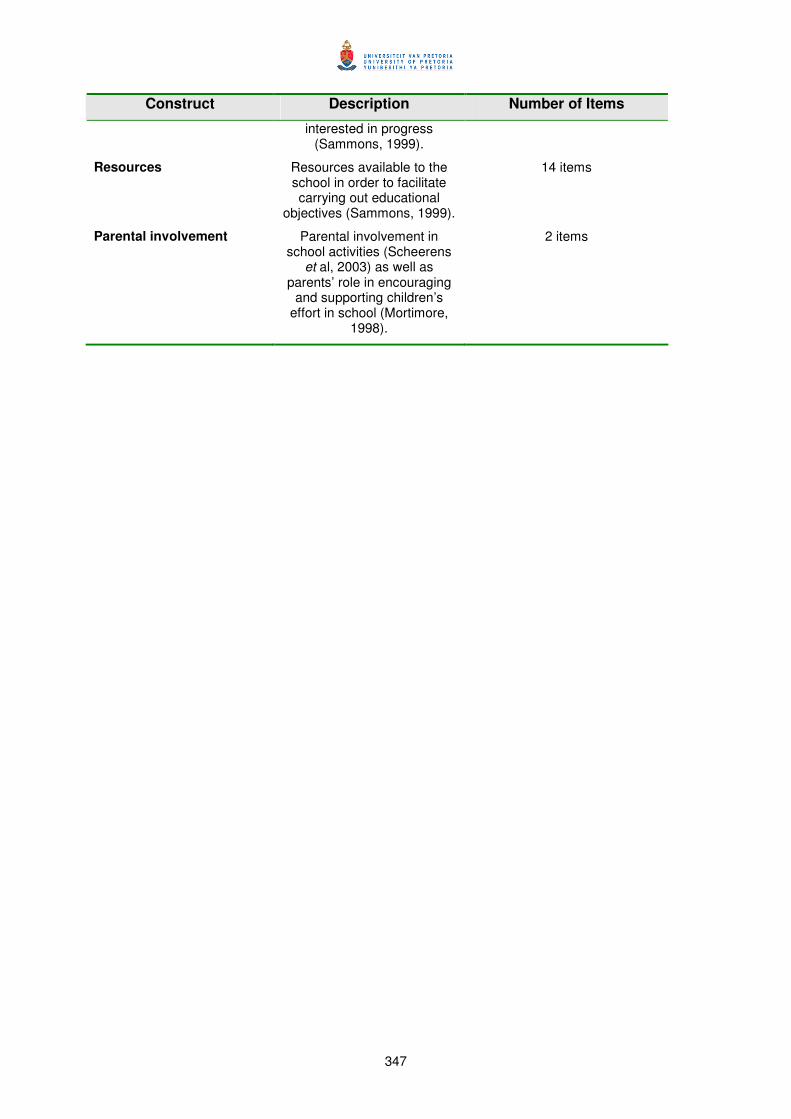
347
Construct Description Number of Items
interested in progress (Sammons, 1999).
Resources Resources available to the school in order to facilitate carrying out educational
objectives (Sammons, 1999).
14 items
Parental involvement Parental involvement in school activities (Scheerens
et al, 2003) as well as parents’ role in encouraging
and supporting children’s effort in school (Mortimore,
1998).
2 items

348
Appendix E: Audit trail documents

349
350
Appendix F: Evaluation report guidelines
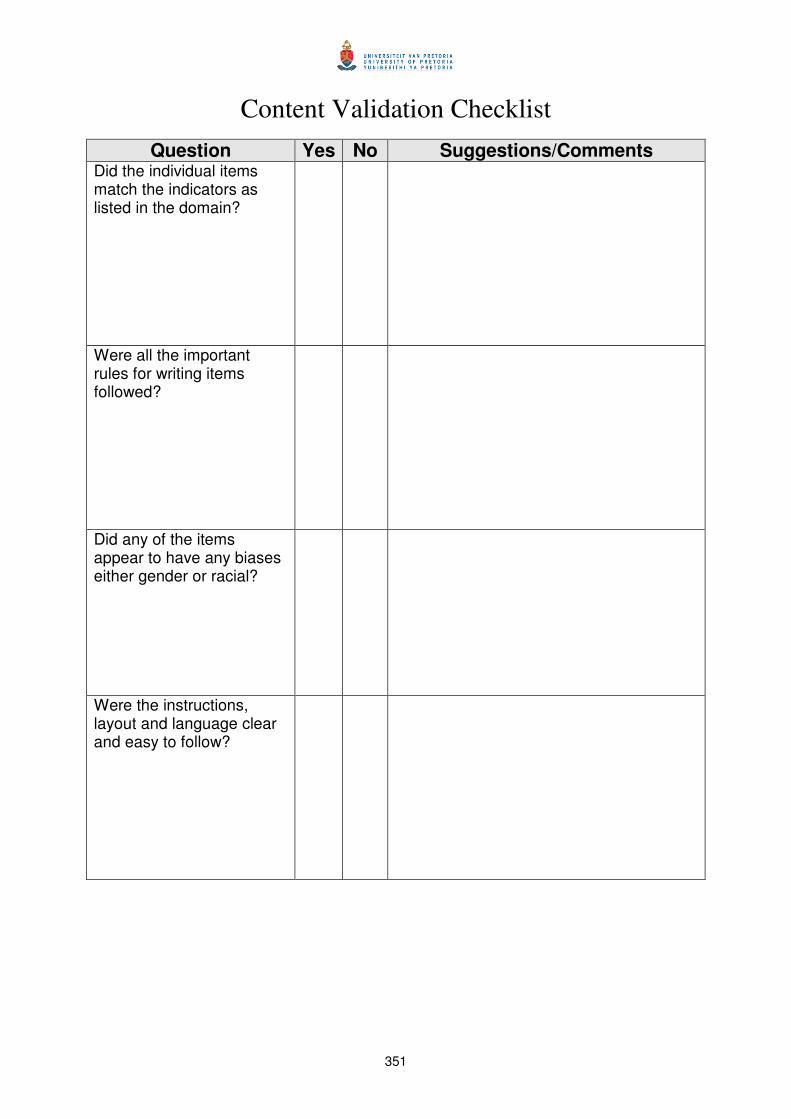
351
Content Validation Checklist
Question Yes No Suggestions/Comments Did the individual items match the indicators as listed in the domain?
Were all the important rules for writing items followed?
Did any of the items appear to have any biases either gender or racial?
Were the instructions, layout and language clear and easy to follow?
352
Appendix G: Summary of reports from the language and mathematics specialists
353
GENERAL COMMENTS:
• Very little language testing although following the instructions accurately in each section implies language proficiency. Language items (vocabulary and proofreading) are very difficult for ESL learners and even L1 speakers of that age.
• The tasks ought to be contextualised for young learners using language and situations familiar to them e.g. proof reading is not a common activity but correcting the mistakes in your friend’s book may be.
• A fairly lengthy introductory explanation with several practice examples needs to be included in order for listeners to attune their ears before actually starting with the test.
• My past secondary school teaching experience makes me think that these various spatial tests are rather culture bound and would need to be piloted with a sample for the target audience i.e. African learners in rural and township schools. I doubt whether they will fare well in the first round, as they are not being taught as this test aims to establish. Some questions might be inaccessible for some second language speakers because of the language level (length and level of written language).
• Clear and well set out
• Thorough and easy to follow instructions
• Graphics are clear and will appeal to young learners
• Language is age appropriate
• There is no bias in the items of gender or race in the items
• 15% of the Mathematics questions is not in the Grade 7 (or previous) curriculum, of which all will be accessible to an average Grade 7 learner because of general knowledge and experience and problem solving strategies.
• Time is a big issue which might cause learners not to finish (or nearly finish) some sections, e.g. Cross-sections and Block counting.
• The following outcomes are covered: o Language CO 1: Identify and solve problems in which responses display that
responsible decisions using critical and creative thinking have been made. o Language CO 5: Communicate effectively using visual, mathematical and/or
language skills in the modes of oral and/or written presentation. o Language LO 5: Thinking and reasoning: The Learner will be able to use language
to think and reason, and access, process and use information for learning. o Language LO 6: Language structure and use: The learner is able to use the
sounds, words and grammar of the language to create and interpret texts. o Mathematics LO 1: Numbers, operations and relationships is over represented o Mathematics LO 5: Data handling is not represented at all. Note: This is not
necessarily bad, as long as it is according to the design of the test.
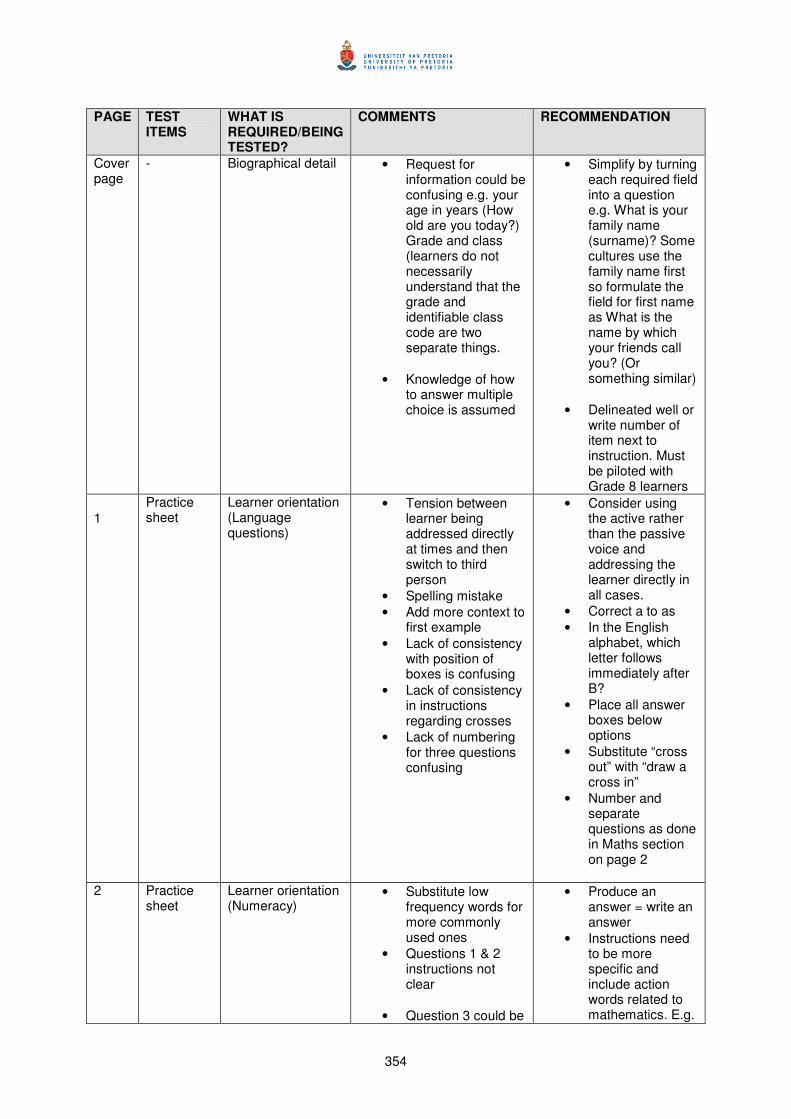
354
PAGE TEST
ITEMS WHAT IS REQUIRED/BEING TESTED?
COMMENTS RECOMMENDATION
Cover page
- Biographical detail • Request for information could be confusing e.g. your age in years (How old are you today?) Grade and class (learners do not necessarily understand that the grade and identifiable class code are two separate things.
• Knowledge of how to answer multiple choice is assumed
• Simplify by turning each required field into a question e.g. What is your family name (surname)? Some cultures use the family name first so formulate the field for first name as What is the name by which your friends call you? (Or something similar)
• Delineated well or write number of item next to instruction. Must be piloted with Grade 8 learners
1
Practice sheet
Learner orientation (Language questions)
• Tension between learner being addressed directly at times and then switch to third person
• Spelling mistake
• Add more context to first example
• Lack of consistency with position of boxes is confusing
• Lack of consistency in instructions regarding crosses
• Lack of numbering for three questions confusing
• Consider using the active rather than the passive voice and addressing the learner directly in all cases.
• Correct a to as
• In the English alphabet, which letter follows immediately after B?
• Place all answer boxes below options
• Substitute “cross out” with “draw a cross in”
• Number and separate questions as done in Maths section on page 2
2 Practice sheet
Learner orientation (Numeracy)
• Substitute low frequency words for more commonly used ones
• Questions 1 & 2 instructions not clear
• Question 3 could be
• Produce an answer = write an answer
• Instructions need to be more specific and include action words related to mathematics. E.g.
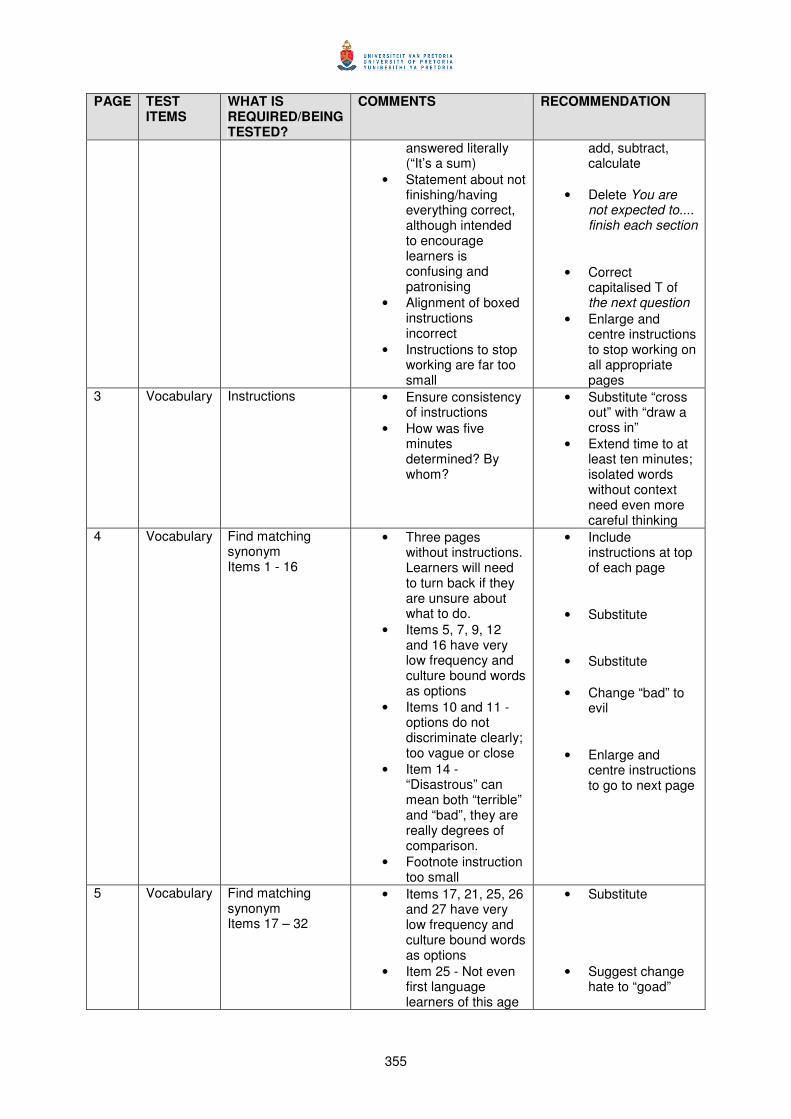
355
PAGE TEST ITEMS
WHAT IS REQUIRED/BEING TESTED?
COMMENTS RECOMMENDATION
answered literally (“It’s a sum)
• Statement about not finishing/having everything correct, although intended to encourage learners is confusing and patronising
• Alignment of boxed instructions incorrect
• Instructions to stop working are far too small
add, subtract, calculate
• Delete You are not expected to.... finish each section
• Correct capitalised T of the next question
• Enlarge and centre instructions to stop working on all appropriate pages
3 Vocabulary Instructions • Ensure consistency of instructions
• How was five minutes determined? By whom?
• Substitute “cross out” with “draw a cross in”
• Extend time to at least ten minutes; isolated words without context need even more careful thinking
4 Vocabulary Find matching synonym Items 1 - 16
• Three pages without instructions. Learners will need to turn back if they are unsure about what to do.
• Items 5, 7, 9, 12 and 16 have very low frequency and culture bound words as options
• Items 10 and 11 - options do not discriminate clearly; too vague or close
• Item 14 - “Disastrous” can mean both “terrible” and “bad”, they are really degrees of comparison.
• Footnote instruction too small
• Include instructions at top of each page
• Substitute
• Substitute
• Change “bad” to evil
• Enlarge and centre instructions to go to next page
5 Vocabulary Find matching synonym Items 17 – 32
• Items 17, 21, 25, 26 and 27 have very low frequency and culture bound words as options
• Item 25 - Not even first language learners of this age
• Substitute
• Suggest change hate to “goad”
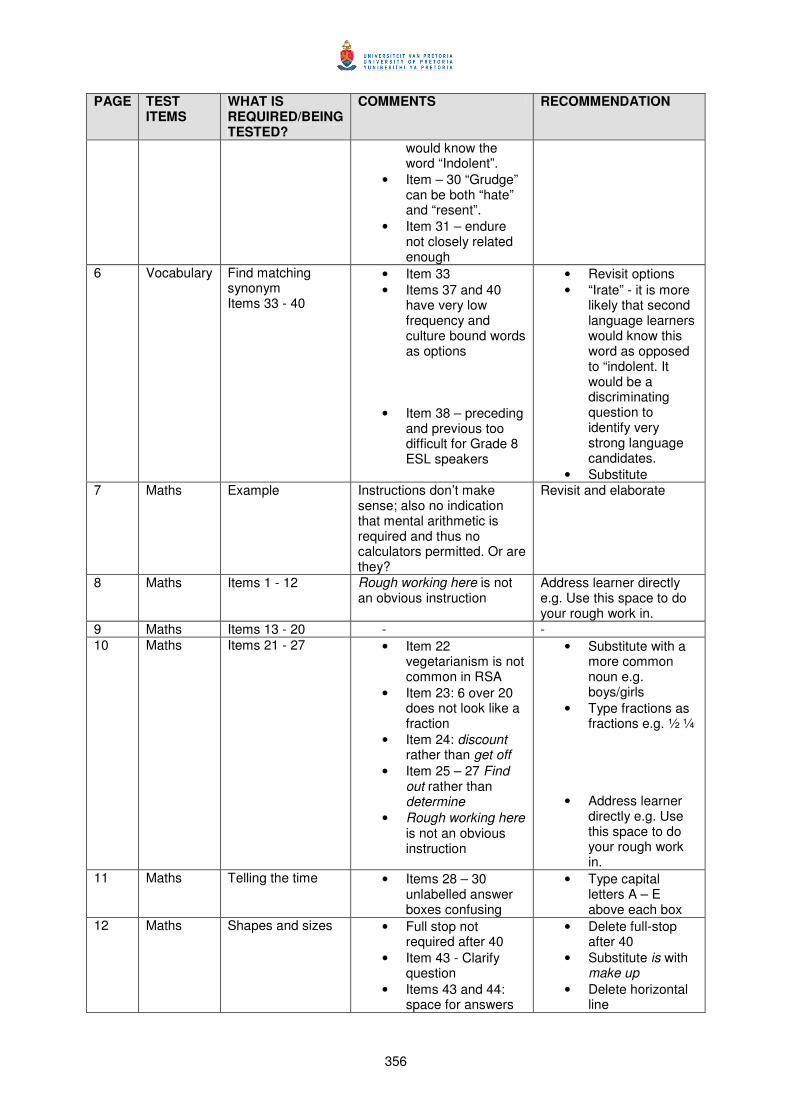
356
PAGE TEST ITEMS
WHAT IS REQUIRED/BEING TESTED?
COMMENTS RECOMMENDATION
would know the word “Indolent”.
• Item – 30 “Grudge” can be both “hate” and “resent”.
• Item 31 – endure not closely related enough
6 Vocabulary Find matching synonym Items 33 - 40
• Item 33
• Items 37 and 40 have very low frequency and culture bound words as options
• Item 38 – preceding and previous too difficult for Grade 8 ESL speakers
• Revisit options
• “Irate” - it is more likely that second language learners would know this word as opposed to “indolent. It would be a discriminating question to identify very strong language candidates.
• Substitute 7 Maths Example Instructions don’t make
sense; also no indication that mental arithmetic is required and thus no calculators permitted. Or are they?
Revisit and elaborate
8 Maths Items 1 - 12 Rough working here is not an obvious instruction
Address learner directly e.g. Use this space to do your rough work in.
9 Maths Items 13 - 20 - -
10 Maths Items 21 - 27 • Item 22 vegetarianism is not common in RSA
• Item 23: 6 over 20 does not look like a fraction
• Item 24: discount rather than get off
• Item 25 – 27 Find out rather than determine
• Rough working here is not an obvious instruction
• Substitute with a more common noun e.g. boys/girls
• Type fractions as fractions e.g. ½ ¼
• Address learner directly e.g. Use this space to do your rough work in.
11 Maths Telling the time • Items 28 – 30 unlabelled answer boxes confusing
• Type capital letters A – E above each box
12 Maths Shapes and sizes • Full stop not required after 40
• Item 43 - Clarify question
• Items 43 and 44: space for answers
• Delete full-stop after 40
• Substitute is with make up
• Delete horizontal line
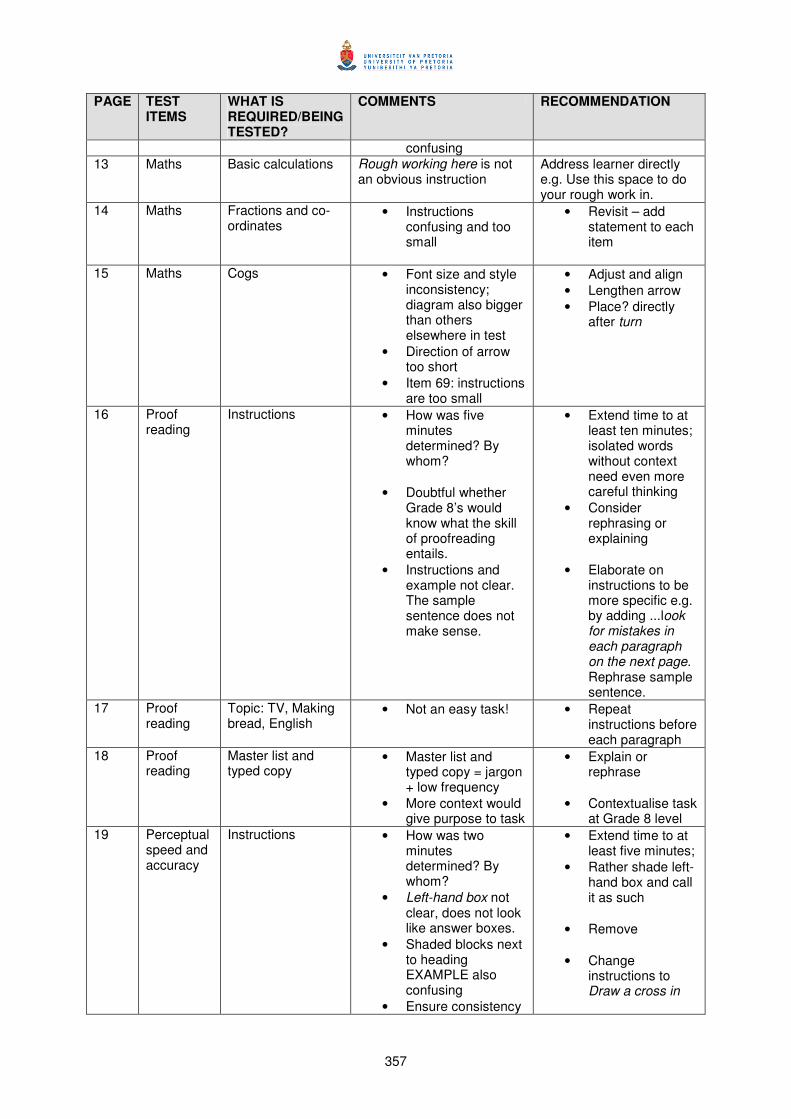
357
PAGE TEST ITEMS
WHAT IS REQUIRED/BEING TESTED?
COMMENTS RECOMMENDATION
confusing
13 Maths Basic calculations Rough working here is not an obvious instruction
Address learner directly e.g. Use this space to do your rough work in.
14 Maths Fractions and co-ordinates
• Instructions confusing and too small
• Revisit – add statement to each item
15 Maths Cogs • Font size and style inconsistency; diagram also bigger than others elsewhere in test
• Direction of arrow too short
• Item 69: instructions are too small
• Adjust and align
• Lengthen arrow
• Place? directly after turn
16 Proof reading
Instructions • How was five minutes determined? By whom?
• Doubtful whether Grade 8’s would know what the skill of proofreading entails.
• Instructions and example not clear. The sample sentence does not make sense.
• Extend time to at least ten minutes; isolated words without context need even more careful thinking
• Consider rephrasing or explaining
• Elaborate on instructions to be more specific e.g. by adding ...look for mistakes in each paragraph on the next page. Rephrase sample sentence.
17 Proof reading
Topic: TV, Making bread, English
• Not an easy task!
• Repeat instructions before each paragraph
18 Proof reading
Master list and typed copy
• Master list and typed copy = jargon + low frequency
• More context would give purpose to task
• Explain or rephrase
• Contextualise task at Grade 8 level
19 Perceptual speed and accuracy
Instructions • How was two minutes determined? By whom?
• Left-hand box not clear, does not look like answer boxes.
• Shaded blocks next to heading EXAMPLE also confusing
• Ensure consistency
• Extend time to at least five minutes;
• Rather shade left-hand box and call it as such
• Remove
• Change instructions to Draw a cross in
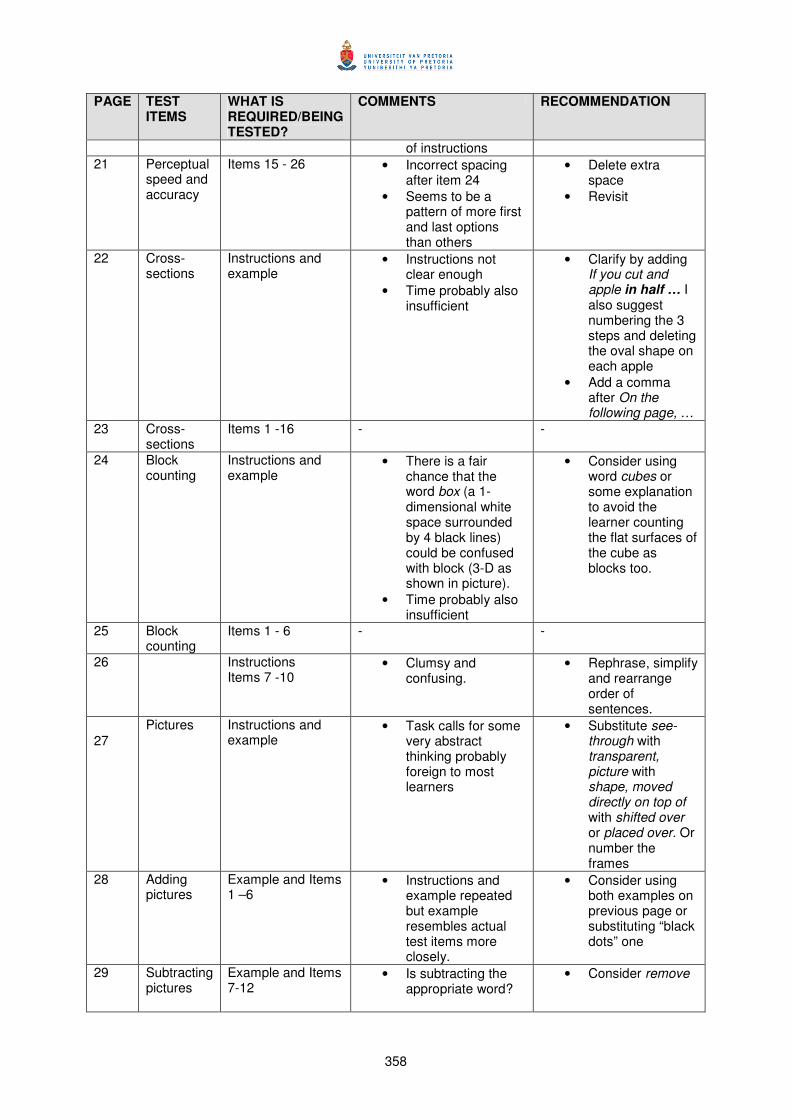
358
PAGE TEST ITEMS
WHAT IS REQUIRED/BEING TESTED?
COMMENTS RECOMMENDATION
of instructions
21 Perceptual speed and accuracy
Items 15 - 26 • Incorrect spacing after item 24
• Seems to be a pattern of more first and last options than others
• Delete extra space
• Revisit
22 Cross-sections
Instructions and example
• Instructions not clear enough
• Time probably also insufficient
• Clarify by adding If you cut and apple in half … I also suggest numbering the 3 steps and deleting the oval shape on each apple
• Add a comma after On the following page, …
23 Cross-sections
Items 1 -16 - -
24 Block counting
Instructions and example
• There is a fair chance that the word box (a 1-dimensional white space surrounded by 4 black lines) could be confused with block (3-D as shown in picture).
• Time probably also insufficient
• Consider using word cubes or some explanation to avoid the learner counting the flat surfaces of the cube as blocks too.
25 Block counting
Items 1 - 6 - -
26 Instructions Items 7 -10
• Clumsy and confusing.
• Rephrase, simplify and rearrange order of sentences.
27
Pictures Instructions and example
• Task calls for some very abstract thinking probably foreign to most learners
• Substitute see-through with transparent, picture with shape, moved directly on top of with shifted over or placed over. Or number the frames
28 Adding pictures
Example and Items 1 –6
• Instructions and example repeated but example resembles actual test items more closely.
• Consider using both examples on previous page or substituting “black dots” one
29 Subtracting pictures
Example and Items 7-12
• Is subtracting the appropriate word?
• Consider remove
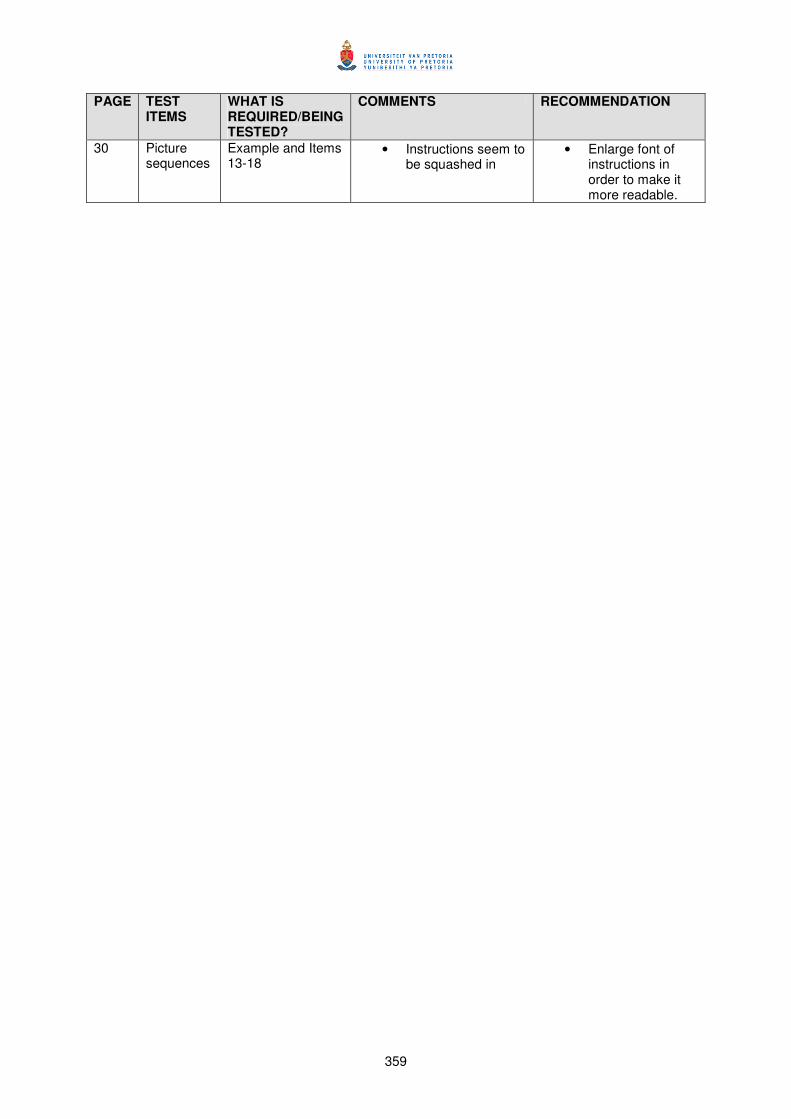
359
PAGE TEST ITEMS
WHAT IS REQUIRED/BEING TESTED?
COMMENTS RECOMMENDATION
30 Picture sequences
Example and Items 13-18
• Instructions seem to be squashed in
• Enlarge font of instructions in order to make it more readable.
360
Appendix H: Diagramatic representation of the research procedures undertaken
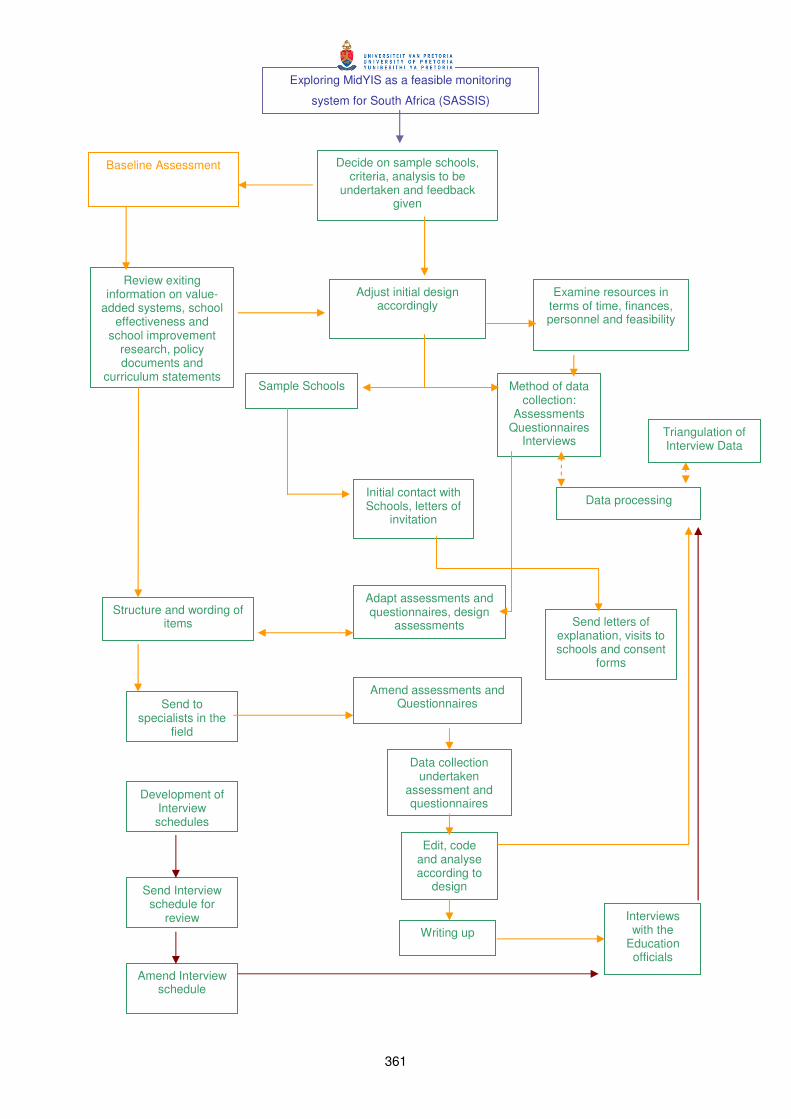
361
Exploring MidYIS as a feasible monitoring
system for South Africa (SASSIS)
Decide on sample schools, criteria, analysis to be
undertaken and feedback given
Review exiting information on value-
added systems, school effectiveness and
school improvement research, policy documents and
curriculum statements
Examine resources in terms of time, finances, personnel and feasibility
Sample Schools Method of data collection:
Assessments Questionnaires
Interviews
Structure and wording of items
Adapt assessments and questionnaires, design
assessments
Data processing
Amend assessments and Questionnaires
Send letters of explanation, visits to schools and consent
forms
Data collection undertaken
assessment and questionnaires
Edit, code and analyse according to
design
Writing up
Send to specialists in the
field
Adjust initial design accordingly
Initial contact with Schools, letters of
invitation
Interviews with the
Education officials
Baseline Assessment
Development of Interview schedules
Triangulation of Interview Data
Send Interview schedule for
review
Amend Interview schedule

362
Appendix I: Letters of consent

363
I. 1: Letter to Department of Eduaction officials
Dear <Official>
Through this letter I am requesting that you kindly fill in a short questionnaire about the implementation
of the OBE curriculum in schools as a contribution to my research.
My name is Vanessa Scherman and I am a Lecturer/Researcher at the Centre for Evaluation and
Assessment at the University of Pretoria, Faculty of Education. The Centre for Evaluation and
Assessment (CEA) is currently involved in a research project, which is funded by the National
Research Foundation. The research is being conducted in collaboration with the Curriculum,
Evaluation and Management (CEM) Centre at the University of Durham, England.
The aims of the project are:
1. to investigate appropriate assessment methods that may assist schools, educators and
communities to ascertain the "real" contribution of the school to an individual learner's learning taking
into account the background of the learner (the so-called value added approach).
2. to develop appropriate value-added assessment measures specifically for South African primary
and secondary schools.
3. to develop appropriate ways to report the results of these assessment methods in a comprehensible
and useful way for schools.
This research project consists of two components namely on a primary school-level and on a
secondary school-level. I am responsible for the secondary school component. In brief, the value-
added assessment measures evaluates the contribution or value that schools add to their learners'
learning in any given school by considering the background of the learner. Value-added measures
provide the school with a starting point for monitoring learners’ performance taking into account the
intake factors which are largely outside the control of the school, but which may have a considerable
impact on the learners’ performance.
Value-added measures have been designed and developed for primary school and secondary school
and the CEA has been working on contextualising the instruments, which were originally developed in
England, to the South African context. An important part of the research is to ascertain curriculum
validity, specifically for languages and mathematics, and you are requested to contribute to that part by
responding to the questionnaire attached.
It is for this reason that I am contacting you and kindly request that you complete the attached
questionnaire as your knowledge in the fields of assessment and curriculum will add a great deal to

364
this project. The questionnaire should take approximately 15 minutes to complete and once completed
can be emailed back to me.
Thanking you in advance,
Kind regards,

365
I. 2: Letter to the principals of participating schools
Dear <Principal’s Name>,
RE: National Research Foundation Value Added Project
Dear <Principal’s Name>,
The Centre for Evaluation and Assessment (CEA) at the University of Pretoria has embarked on an
international project namely the NRF Value-Added project. For the first year of the project we chose
three primary schools and three secondary schools in Gauteng to participate in this project in order to
contextualise the instruments for our context. Since then we have increased our sample to seven
primary schools and eleven secondary schools. However, we would like to increase the number of
schools. Your school has been selected to participate in this project and we would greatly appreciate it
if you would be willing to participate in the project next year. As per regulations we have approached
the Provincial Government for permission to conduct research in schools and permission has been
granted.
The aims of the project are to:
1. Investigate appropriate assessment methods that may assist schools, educators and
communities to ascertain the “real” contribution of the school to an individual learner’s
learning (the so-called value added approach) taking into account the background of the
learner.
2. To develop appropriate value-added assessment measures specifically for South African
Primary and Secondary schools.
3. To develop appropriate ways to report the results of these assessment methods in a
comprehensible and useful way for schools.
The CEA is working with the Curriculum, Evaluation and Management (CEM) Centre at the University
of Durham, England, which developed a value-added approach that is currently running in more than 5
000 schools in England, and nearly 1 000 schools in New Zealand and Australia. In brief, the value-
added assessment measures and evaluates the contribution or value that schools add to their
learners’ learning by considering the background of the learner (their parent’s educational background
and resources in the home for example). Value-added measures provide the school with a starting
point for evaluating performance taking into account the intake factors which are largely outside the
control of the school, but which may have a considerable impact on the learner’s performance.
Value-added measures have been designed and developed for primary school and secondary school
and the CEA would like to pilot the assessments developed for primary school and secondary school,

366
which have been translated and/or contextualised for South African schools. The Secondary school
component is called SASSIS (South African Secondary School Information System).
The participation of your school, principal, educators and learners is crucial to realise the project.
Therefore we sincerely hope that your school will be interested in participating collaboratively with the
CEA and CEM this year. Furthermore, principals and educators of participating schools will be invited
to a seminar where we will share more about the value-added approach and some preliminary results.
Ultimately, the intention is to implement the project in 250 schools across the country within the next
two years.
Kind Regards,

367
I. 3: Letter to Parents
To Whom It May Concern: RE: Permission to assess your child Dear Parent/Guardian,
The Centre for Evaluation and Assessment (CEA) at the University of Pretoria has embarked on an
international research project namely the NRF Value-Added project in 2003. For the last four years the
CEA has been working with schools in Gauteng and have been granted permission to conduct
research in schools by the Gauteng Department of Education. We would like to ask your permission to
include your child in this exciting study. We have included a brief description of this study for your
convenience.
The value-added assessment (MidYIS/SASSIS Baseline Assessment) measures and evaluates the
contribution or value that schools add to their learner’s learning in any given school by considering the
background of the learner. Value added measures provide the school with a starting point for
evaluating performance taking into account the intake factors (for instance, the socio-economic status)
which are largely outside the control of the school, but which may have a considerable impact on the
learner’s performance.
Such an assessment could provide the school and parent with invaluable information for every learner.
By carrying out these assessments, the teacher will have a good idea about the strengths and
weaknesses of each learner. Therefore particular weaknesses can be strengthened and built on. The
results of the assessment will be given to parents, with the cooperation of the school.
The participation of the school, principal, educator and learner plays a crucial role in being able to
realise the project. Therefore, we sincerely hope that you will be interested in participating
collaboratively with the CEA in undertaking this new approach to assessment for schools. However,
one important aspect is that of parental consent. Parents need to grant permission and this is required
from each learner.
The information (data) that is gained from the assessment will be used for research purposes of the
CEA; however, all information will be kept confidential. Kindly fill in the Permission form attached
herewith and return the form to the teacher involved.
Yours sincerely,
368
PERMISSION FORM
I do hereby grant permission for my child to participate in the MidYIS/SASSIS project.
Parent/guardian’s name ____________________________
Child’s name _____________________________________
Grade___________________________________________
Teacher’s name___________________________________
Parent/guardian’s signature _________________________
Date ___________________________________________
369
Appendix J: Assessment framework for mathematics
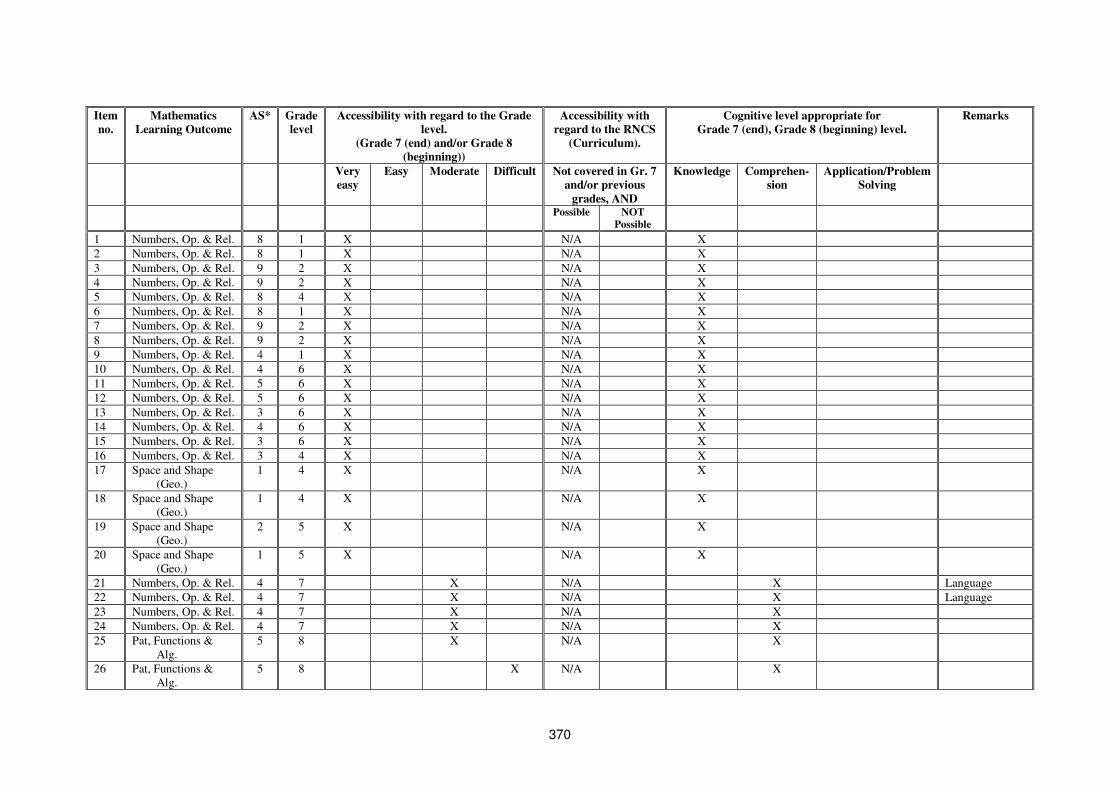
370
Item
no.
Mathematics
Learning Outcome
AS* Grade
level
Accessibility with regard to the Grade
level.
(Grade 7 (end) and/or Grade 8
(beginning))
Accessibility with
regard to the RNCS
(Curriculum).
Cognitive level appropriate for
Grade 7 (end), Grade 8 (beginning) level.
Remarks
Very
easy
Easy Moderate Difficult Not covered in Gr. 7
and/or previous
grades, AND
Knowledge Comprehen-
sion
Application/Problem
Solving
Possible NOT
Possible
1 Numbers, Op. & Rel. 8 1 X N/A X
2 Numbers, Op. & Rel. 8 1 X N/A X
3 Numbers, Op. & Rel. 9 2 X N/A X
4 Numbers, Op. & Rel. 9 2 X N/A X
5 Numbers, Op. & Rel. 8 4 X N/A X
6 Numbers, Op. & Rel. 8 1 X N/A X
7 Numbers, Op. & Rel. 9 2 X N/A X
8 Numbers, Op. & Rel. 9 2 X N/A X
9 Numbers, Op. & Rel. 4 1 X N/A X
10 Numbers, Op. & Rel. 4 6 X N/A X
11 Numbers, Op. & Rel. 5 6 X N/A X
12 Numbers, Op. & Rel. 5 6 X N/A X
13 Numbers, Op. & Rel. 3 6 X N/A X
14 Numbers, Op. & Rel. 4 6 X N/A X
15 Numbers, Op. & Rel. 3 6 X N/A X
16 Numbers, Op. & Rel. 3 4 X N/A X
17 Space and Shape
(Geo.)
1 4 X N/A X
18 Space and Shape
(Geo.)
1 4 X N/A X
19 Space and Shape
(Geo.)
2 5 X N/A X
20 Space and Shape
(Geo.)
1 5 X N/A X
21 Numbers, Op. & Rel. 4 7 X N/A X Language
22 Numbers, Op. & Rel. 4 7 X N/A X Language
23 Numbers, Op. & Rel. 4 7 X N/A X
24 Numbers, Op. & Rel. 4 7 X N/A X
25 Pat, Functions &
Alg.
5 8 X N/A X
26 Pat, Functions &
Alg.
5 8 X N/A X
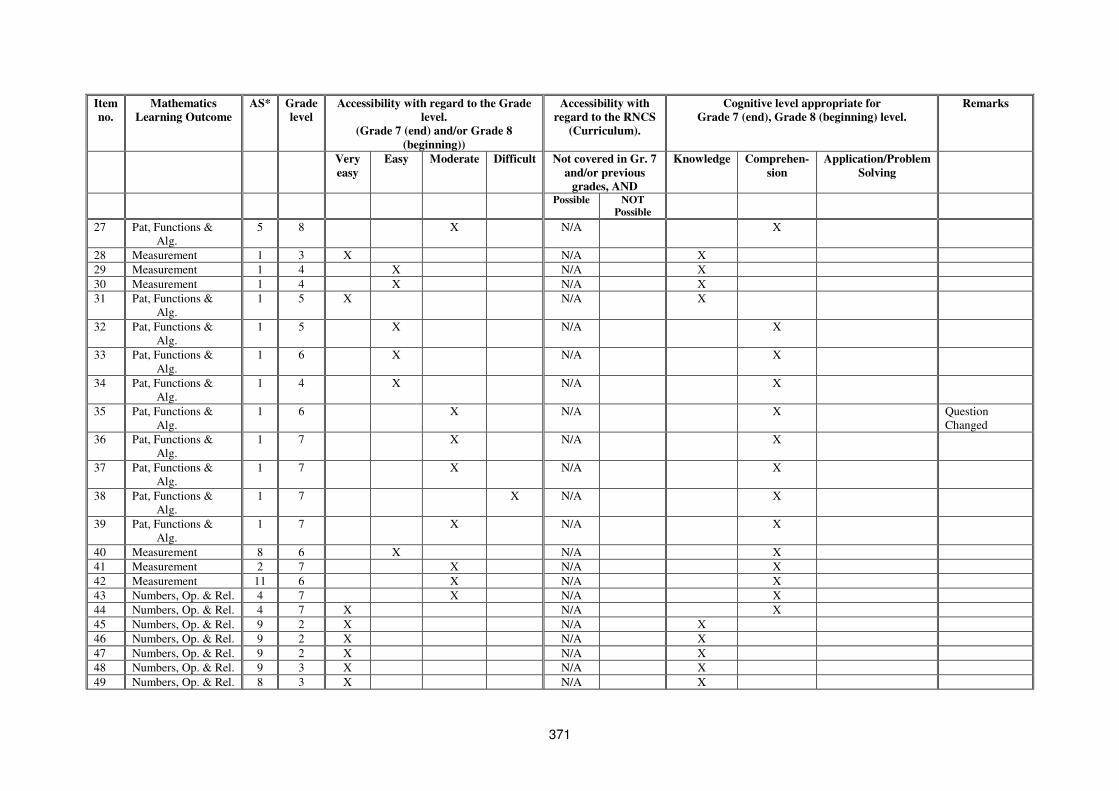
371
Item
no.
Mathematics
Learning Outcome
AS* Grade
level
Accessibility with regard to the Grade
level.
(Grade 7 (end) and/or Grade 8
(beginning))
Accessibility with
regard to the RNCS
(Curriculum).
Cognitive level appropriate for
Grade 7 (end), Grade 8 (beginning) level.
Remarks
Very
easy
Easy Moderate Difficult Not covered in Gr. 7
and/or previous
grades, AND
Knowledge Comprehen-
sion
Application/Problem
Solving
Possible NOT
Possible
27 Pat, Functions &
Alg.
5 8 X N/A X
28 Measurement 1 3 X N/A X
29 Measurement 1 4 X N/A X
30 Measurement 1 4 X N/A X
31 Pat, Functions &
Alg.
1 5 X N/A X
32 Pat, Functions &
Alg.
1 5 X N/A X
33 Pat, Functions &
Alg.
1 6 X N/A X
34 Pat, Functions &
Alg.
1 4 X N/A X
35 Pat, Functions &
Alg.
1 6 X N/A X Question
Changed
36 Pat, Functions &
Alg.
1 7 X N/A X
37 Pat, Functions &
Alg.
1 7 X N/A X
38 Pat, Functions &
Alg.
1 7 X N/A X
39 Pat, Functions &
Alg.
1 7 X N/A X
40 Measurement 8 6 X N/A X
41 Measurement 2 7 X N/A X
42 Measurement 11 6 X N/A X
43 Numbers, Op. & Rel. 4 7 X N/A X
44 Numbers, Op. & Rel. 4 7 X N/A X
45 Numbers, Op. & Rel. 9 2 X N/A X
46 Numbers, Op. & Rel. 9 2 X N/A X
47 Numbers, Op. & Rel. 9 2 X N/A X
48 Numbers, Op. & Rel. 9 3 X N/A X
49 Numbers, Op. & Rel. 8 3 X N/A X
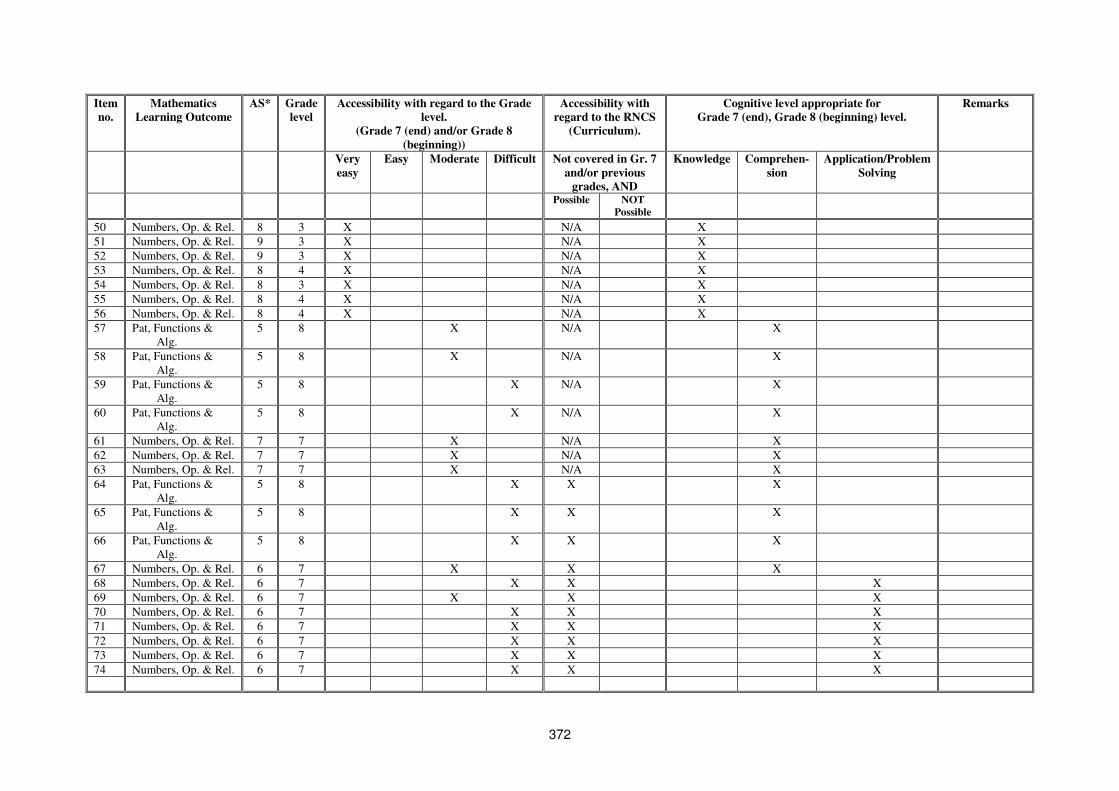
372
Item
no.
Mathematics
Learning Outcome
AS* Grade
level
Accessibility with regard to the Grade
level.
(Grade 7 (end) and/or Grade 8
(beginning))
Accessibility with
regard to the RNCS
(Curriculum).
Cognitive level appropriate for
Grade 7 (end), Grade 8 (beginning) level.
Remarks
Very
easy
Easy Moderate Difficult Not covered in Gr. 7
and/or previous
grades, AND
Knowledge Comprehen-
sion
Application/Problem
Solving
Possible NOT
Possible
50 Numbers, Op. & Rel. 8 3 X N/A X
51 Numbers, Op. & Rel. 9 3 X N/A X
52 Numbers, Op. & Rel. 9 3 X N/A X
53 Numbers, Op. & Rel. 8 4 X N/A X
54 Numbers, Op. & Rel. 8 3 X N/A X
55 Numbers, Op. & Rel. 8 4 X N/A X
56 Numbers, Op. & Rel. 8 4 X N/A X
57 Pat, Functions &
Alg.
5 8 X N/A X
58 Pat, Functions &
Alg.
5 8 X N/A X
59 Pat, Functions &
Alg.
5 8 X N/A X
60 Pat, Functions &
Alg.
5 8 X N/A X
61 Numbers, Op. & Rel. 7 7 X N/A X
62 Numbers, Op. & Rel. 7 7 X N/A X
63 Numbers, Op. & Rel. 7 7 X N/A X
64 Pat, Functions &
Alg.
5 8 X X X
65 Pat, Functions &
Alg.
5 8 X X X
66 Pat, Functions &
Alg.
5 8 X X X
67 Numbers, Op. & Rel. 6 7 X X X
68 Numbers, Op. & Rel. 6 7 X X X
69 Numbers, Op. & Rel. 6 7 X X X
70 Numbers, Op. & Rel. 6 7 X X X
71 Numbers, Op. & Rel. 6 7 X X X
72 Numbers, Op. & Rel. 6 7 X X X
73 Numbers, Op. & Rel. 6 7 X X X
74 Numbers, Op. & Rel. 6 7 X X X
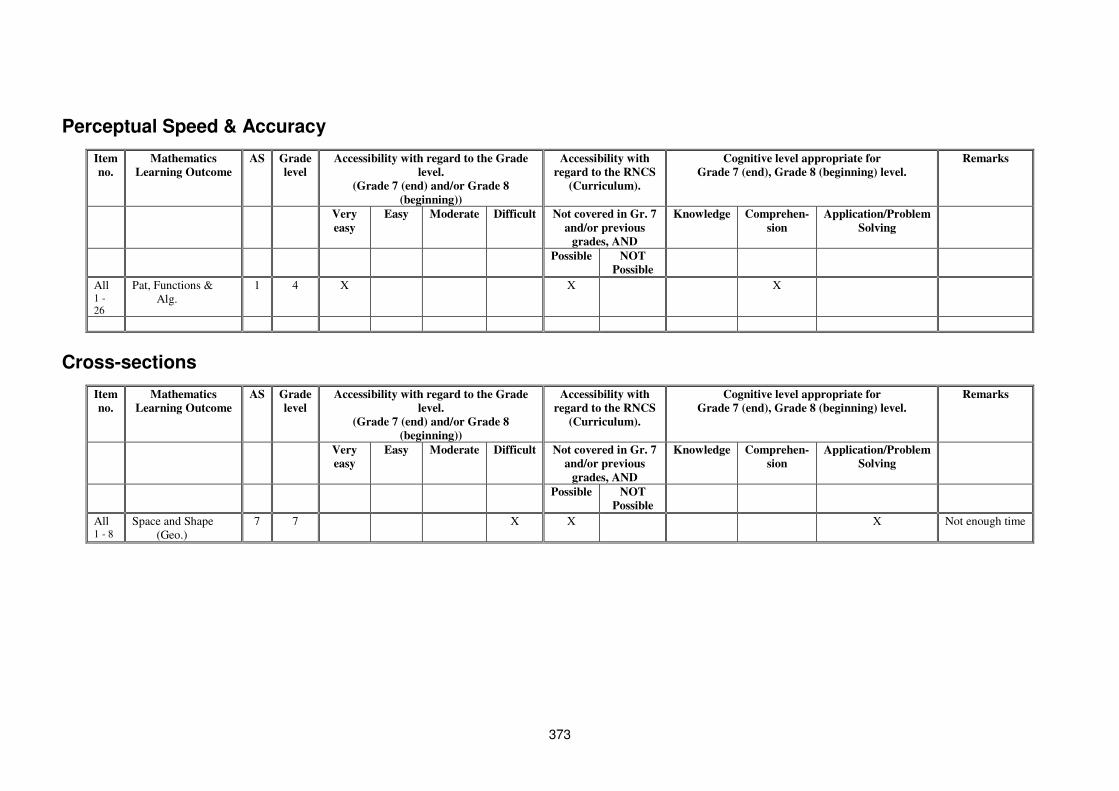
373
Perceptual Speed & Accuracy
Item
no.
Mathematics
Learning Outcome
AS Grade
level
Accessibility with regard to the Grade
level.
(Grade 7 (end) and/or Grade 8
(beginning))
Accessibility with
regard to the RNCS
(Curriculum).
Cognitive level appropriate for
Grade 7 (end), Grade 8 (beginning) level.
Remarks
Very
easy
Easy Moderate Difficult Not covered in Gr. 7
and/or previous
grades, AND
Knowledge Comprehen-
sion
Application/Problem
Solving
Possible NOT
Possible
All 1 -
26
Pat, Functions &
Alg.
1 4 X X X
Cross-sections
Item
no.
Mathematics
Learning Outcome
AS Grade
level
Accessibility with regard to the Grade
level.
(Grade 7 (end) and/or Grade 8
(beginning))
Accessibility with
regard to the RNCS
(Curriculum).
Cognitive level appropriate for
Grade 7 (end), Grade 8 (beginning) level.
Remarks
Very
easy
Easy Moderate Difficult Not covered in Gr. 7
and/or previous
grades, AND
Knowledge Comprehen-
sion
Application/Problem
Solving
Possible NOT
Possible
All 1 - 8
Space and Shape
(Geo.)
7 7 X X X Not enough time
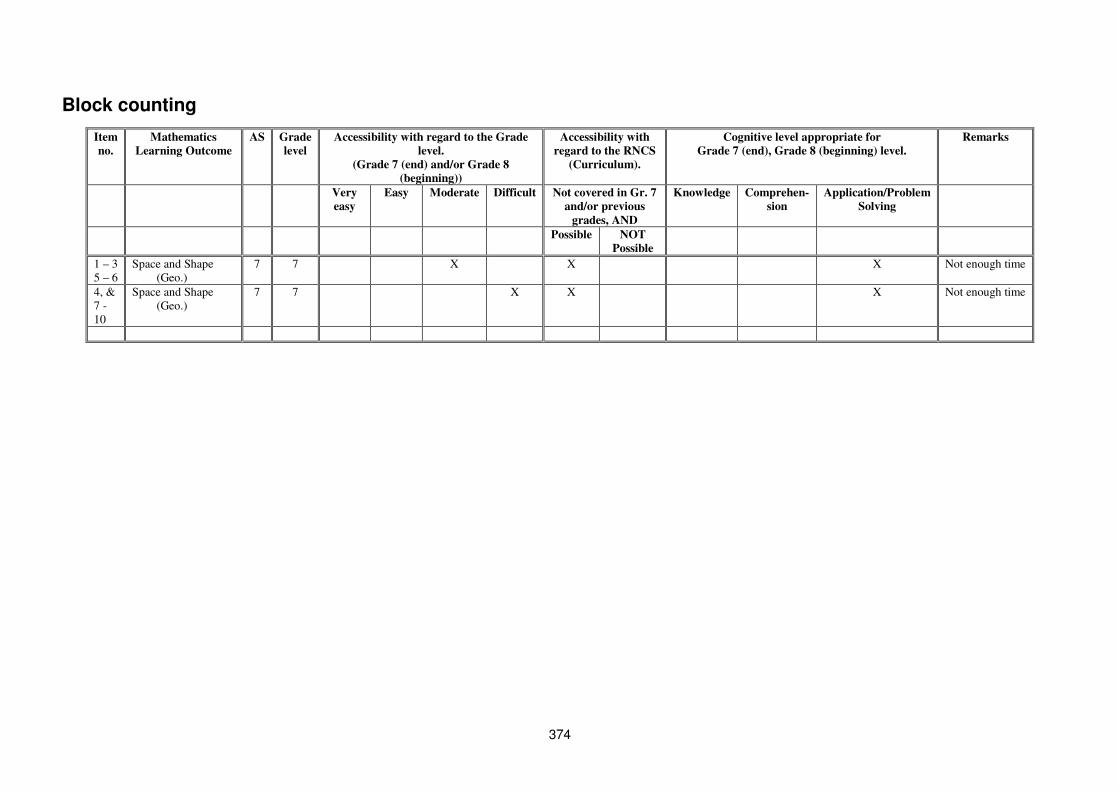
374
Block counting
Item
no.
Mathematics
Learning Outcome
AS
Grade
level
Accessibility with regard to the Grade
level.
(Grade 7 (end) and/or Grade 8
(beginning))
Accessibility with
regard to the RNCS
(Curriculum).
Cognitive level appropriate for
Grade 7 (end), Grade 8 (beginning) level.
Remarks
Very
easy
Easy Moderate Difficult Not covered in Gr. 7
and/or previous
grades, AND
Knowledge Comprehen-
sion
Application/Problem
Solving
Possible NOT
Possible
1 – 3
5 – 6
Space and Shape
(Geo.)
7 7 X X X Not enough time
4, &
7 -
10
Space and Shape
(Geo.)
7 7 X X X Not enough time
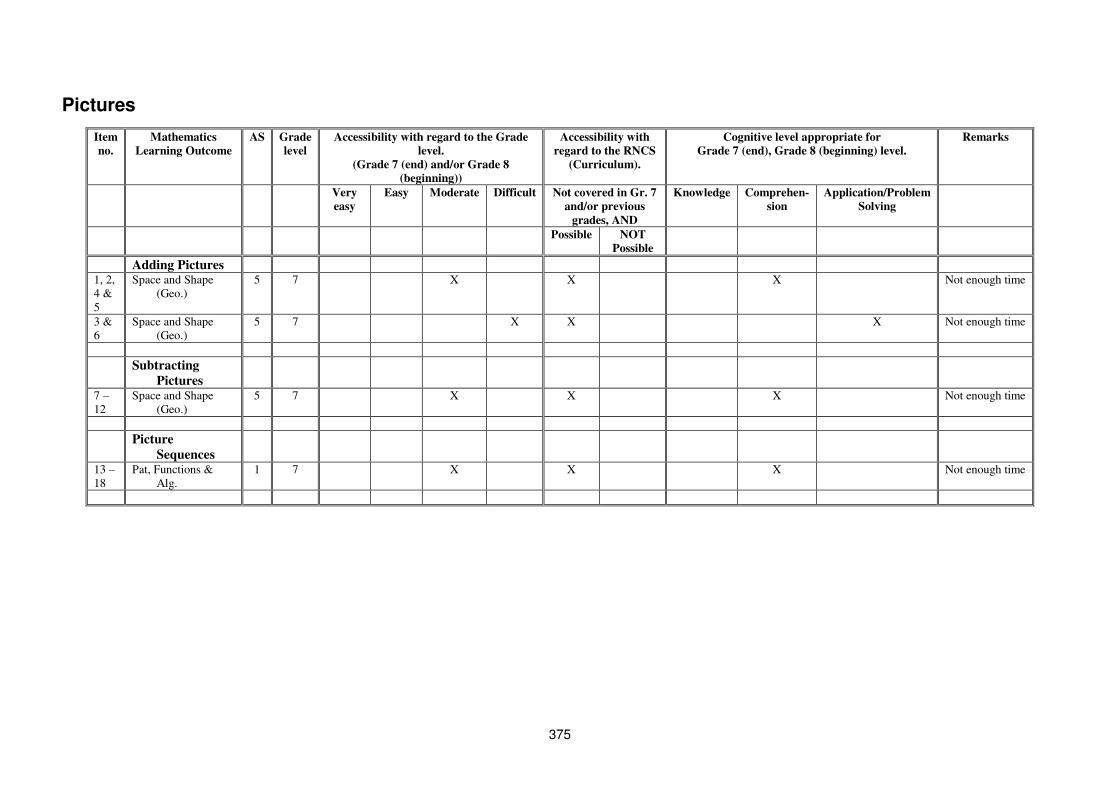
375
Pictures
Item
no.
Mathematics
Learning Outcome
AS
Grade
level
Accessibility with regard to the Grade
level.
(Grade 7 (end) and/or Grade 8
(beginning))
Accessibility with
regard to the RNCS
(Curriculum).
Cognitive level appropriate for
Grade 7 (end), Grade 8 (beginning) level.
Remarks
Very
easy
Easy Moderate Difficult Not covered in Gr. 7
and/or previous
grades, AND
Knowledge Comprehen-
sion
Application/Problem
Solving
Possible NOT
Possible
Adding Pictures
1, 2,
4 &
5
Space and Shape
(Geo.)
5 7 X X X Not enough time
3 &
6
Space and Shape
(Geo.)
5 7 X X X Not enough time
Subtracting
Pictures
7 –
12
Space and Shape
(Geo.)
5 7 X X X Not enough time
Picture
Sequences
13 –
18
Pat, Functions &
Alg.
1 7 X X X Not enough time
376
Appendix K: Complete list of ability factors
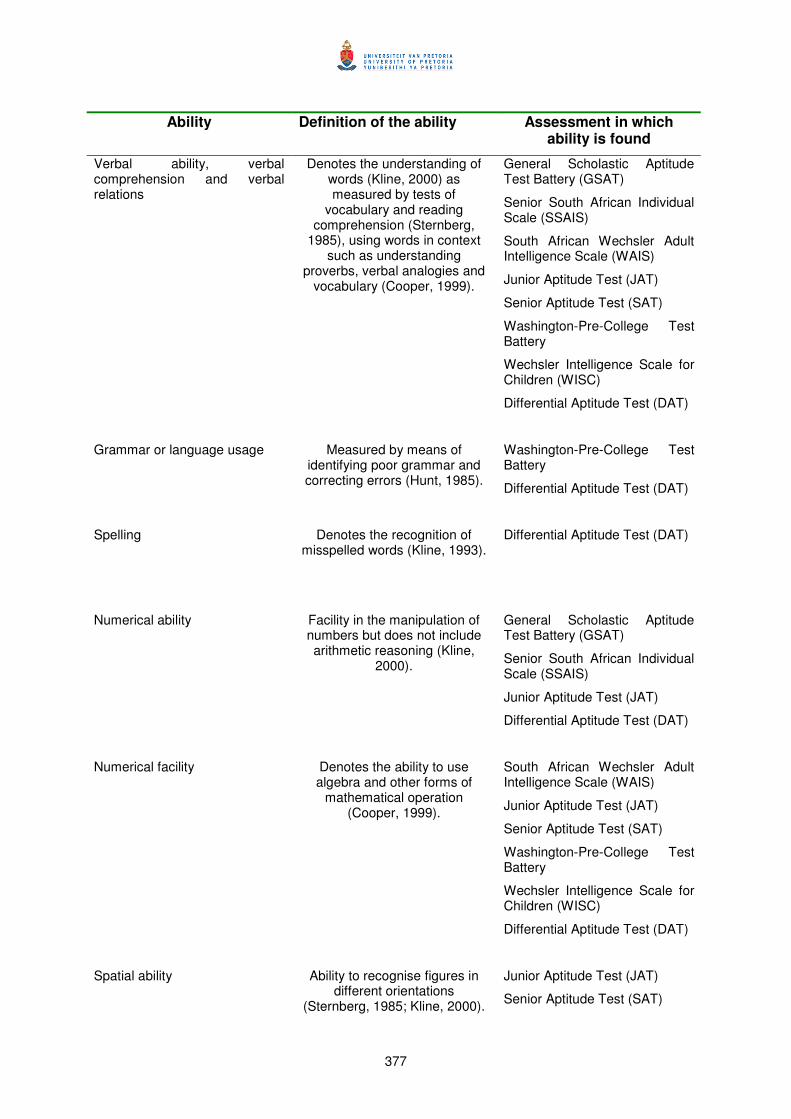
377
Ability Definition of the ability Assessment in which ability is found
Verbal ability, verbal comprehension and verbal relations
Denotes the understanding of words (Kline, 2000) as measured by tests of
vocabulary and reading comprehension (Sternberg,
1985), using words in context such as understanding
proverbs, verbal analogies and vocabulary (Cooper, 1999).
General Scholastic Aptitude Test Battery (GSAT)
Senior South African Individual Scale (SSAIS)
South African Wechsler Adult Intelligence Scale (WAIS)
Junior Aptitude Test (JAT)
Senior Aptitude Test (SAT)
Washington-Pre-College Test Battery
Wechsler Intelligence Scale for Children (WISC)
Differential Aptitude Test (DAT)
Grammar or language usage Measured by means of identifying poor grammar and correcting errors (Hunt, 1985).
Washington-Pre-College Test Battery
Differential Aptitude Test (DAT)
Spelling Denotes the recognition of misspelled words (Kline, 1993).
Differential Aptitude Test (DAT)
Numerical ability Facility in the manipulation of numbers but does not include arithmetic reasoning (Kline,
2000).
General Scholastic Aptitude Test Battery (GSAT)
Senior South African Individual Scale (SSAIS)
Junior Aptitude Test (JAT)
Differential Aptitude Test (DAT)
Numerical facility Denotes the ability to use algebra and other forms of
mathematical operation (Cooper, 1999).
South African Wechsler Adult Intelligence Scale (WAIS)
Junior Aptitude Test (JAT)
Senior Aptitude Test (SAT)
Washington-Pre-College Test Battery
Wechsler Intelligence Scale for Children (WISC)
Differential Aptitude Test (DAT)
Spatial ability Ability to recognise figures in different orientations
(Sternberg, 1985; Kline, 2000).
Junior Aptitude Test (JAT)
Senior Aptitude Test (SAT)
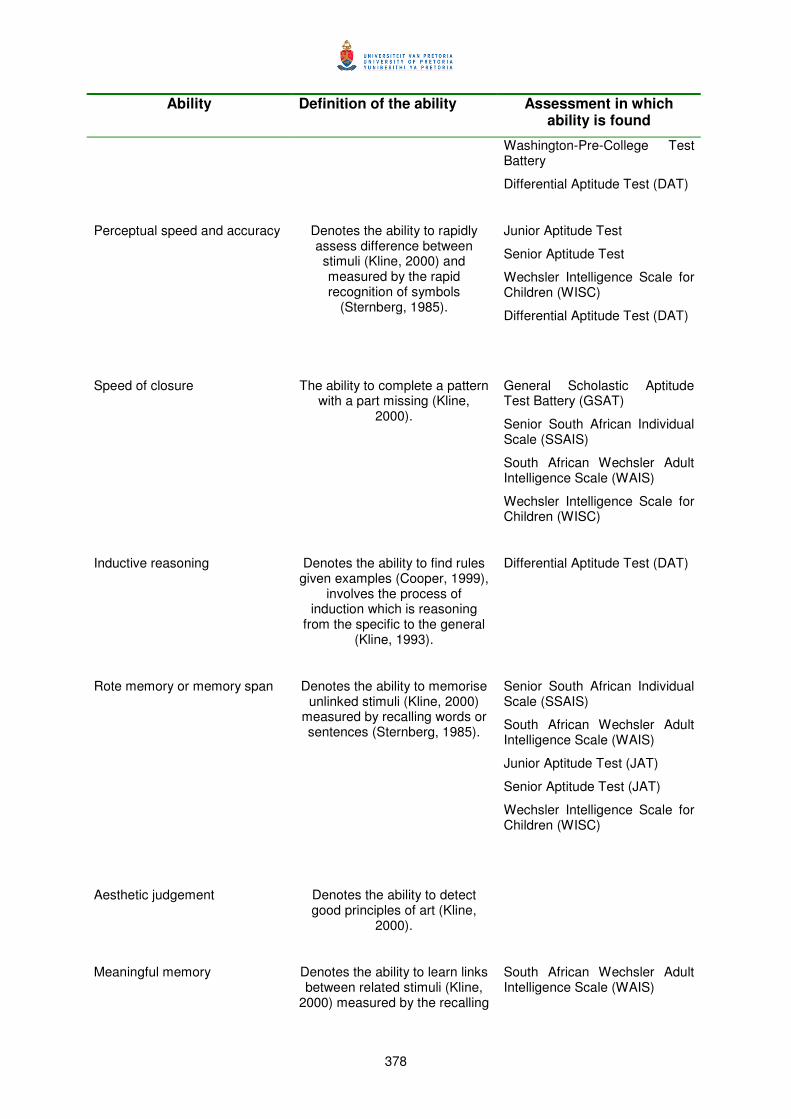
378
Ability Definition of the ability Assessment in which ability is found
Washington-Pre-College Test Battery
Differential Aptitude Test (DAT)
Perceptual speed and accuracy Denotes the ability to rapidly assess difference between stimuli (Kline, 2000) and measured by the rapid recognition of symbols
(Sternberg, 1985).
Junior Aptitude Test
Senior Aptitude Test
Wechsler Intelligence Scale for Children (WISC)
Differential Aptitude Test (DAT)
Speed of closure The ability to complete a pattern with a part missing (Kline,
2000).
General Scholastic Aptitude Test Battery (GSAT)
Senior South African Individual Scale (SSAIS)
South African Wechsler Adult Intelligence Scale (WAIS)
Wechsler Intelligence Scale for Children (WISC)
Inductive reasoning Denotes the ability to find rules given examples (Cooper, 1999),
involves the process of induction which is reasoning
from the specific to the general (Kline, 1993).
Differential Aptitude Test (DAT)
Rote memory or memory span Denotes the ability to memorise unlinked stimuli (Kline, 2000)
measured by recalling words or sentences (Sternberg, 1985).
Senior South African Individual Scale (SSAIS)
South African Wechsler Adult Intelligence Scale (WAIS)
Junior Aptitude Test (JAT)
Senior Aptitude Test (JAT)
Wechsler Intelligence Scale for Children (WISC)
Aesthetic judgement Denotes the ability to detect good principles of art (Kline,
2000).
Meaningful memory Denotes the ability to learn links between related stimuli (Kline,
2000) measured by the recalling
South African Wechsler Adult Intelligence Scale (WAIS)
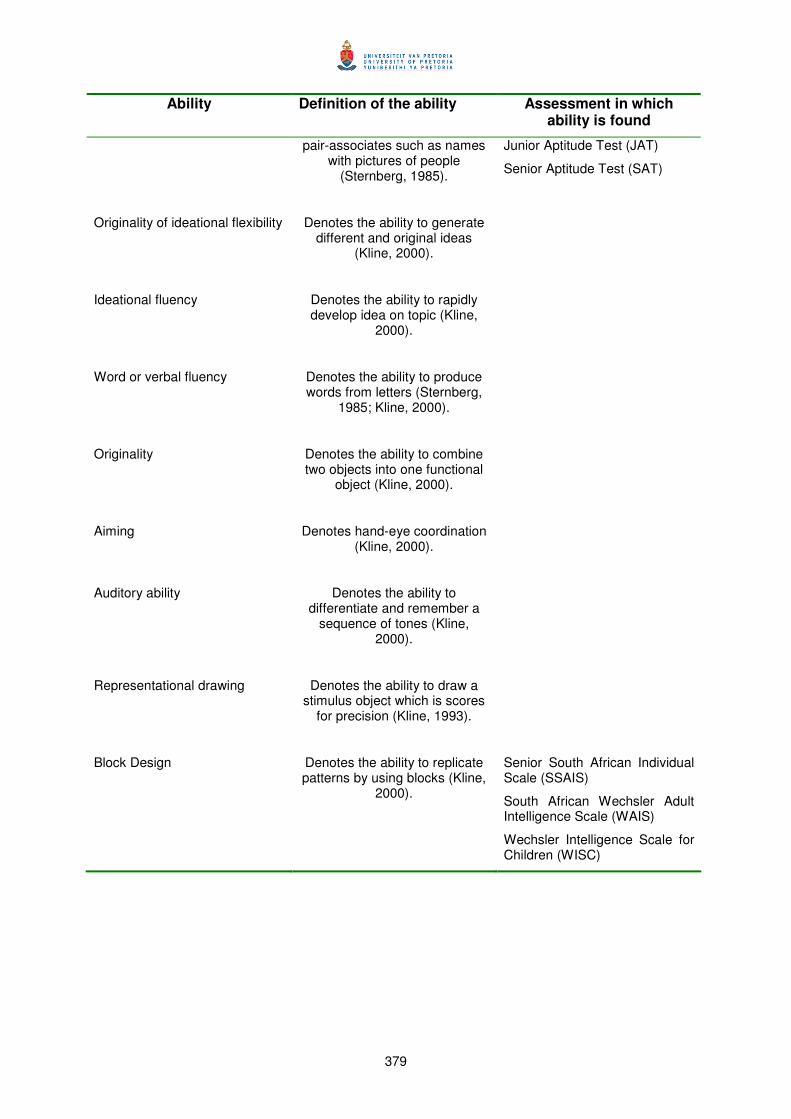
379
Ability Definition of the ability Assessment in which ability is found
pair-associates such as names with pictures of people
(Sternberg, 1985).
Junior Aptitude Test (JAT)
Senior Aptitude Test (SAT)
Originality of ideational flexibility Denotes the ability to generate different and original ideas
(Kline, 2000).
Ideational fluency Denotes the ability to rapidly develop idea on topic (Kline,
2000).
Word or verbal fluency Denotes the ability to produce words from letters (Sternberg,
1985; Kline, 2000).
Originality Denotes the ability to combine two objects into one functional
object (Kline, 2000).
Aiming Denotes hand-eye coordination (Kline, 2000).
Auditory ability Denotes the ability to differentiate and remember a
sequence of tones (Kline, 2000).
Representational drawing Denotes the ability to draw a stimulus object which is scores
for precision (Kline, 1993).
Block Design Denotes the ability to replicate patterns by using blocks (Kline,
2000).
Senior South African Individual Scale (SSAIS)
South African Wechsler Adult Intelligence Scale (WAIS)
Wechsler Intelligence Scale for Children (WISC)
380
Appendix L: Rasch and correlation analyses
382
Appendix M: Multilevel analyses
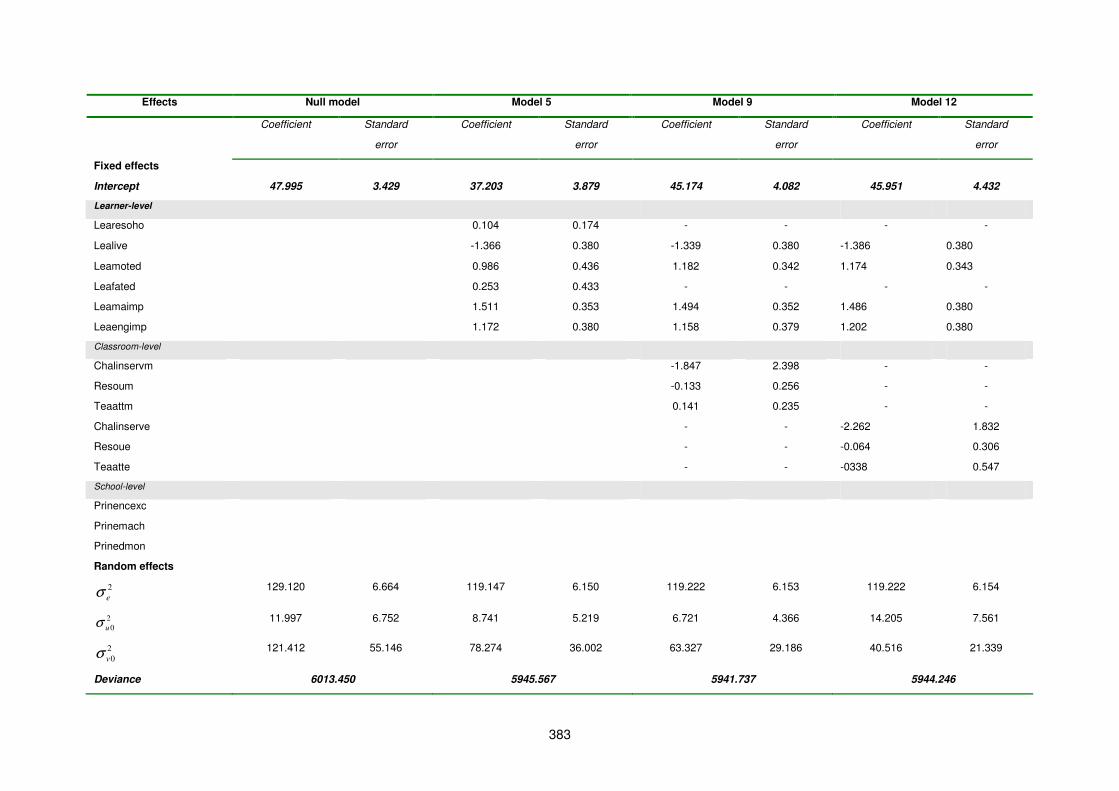
383
Effects Null model Model 5 Model 9 Model 12
Coefficient Standard
error
Coefficient Standard
error
Coefficient Standard
error
Coefficient Standard
error
Fixed effects
Intercept 47.995 3.429 37.203 3.879 45.174 4.082 45.951 4.432
Learner-level
Learesoho 0.104 0.174 - - - -
Lealive -1.366 0.380 -1.339 0.380 -1.386 0.380
Leamoted 0.986 0.436 1.182 0.342 1.174 0.343
Leafated 0.253 0.433 - - - -
Leamaimp 1.511 0.353 1.494 0.352 1.486 0.380
Leaengimp 1.172 0.380 1.158 0.379 1.202 0.380
Classroom-level
Chalinservm -1.847 2.398 - -
Resoum -0.133 0.256 - -
Teaattm 0.141 0.235 - -
Chalinserve - - -2.262 1.832
Resoue - - -0.064 0.306
Teaatte - - -0338 0.547
School-level
Prinencexc
Prinemach
Prinedmon
Random effects
2
eσ 129.120 6.664 119.147 6.150 119.222 6.153 119.222 6.154
2
0uσ 11.997 6.752 8.741 5.219 6.721 4.366 14.205 7.561
2
0vσ 121.412 55.146 78.274 36.002 63.327 29.186 40.516 21.339
Deviance 6013.450 5945.567 5941.737 5944.246
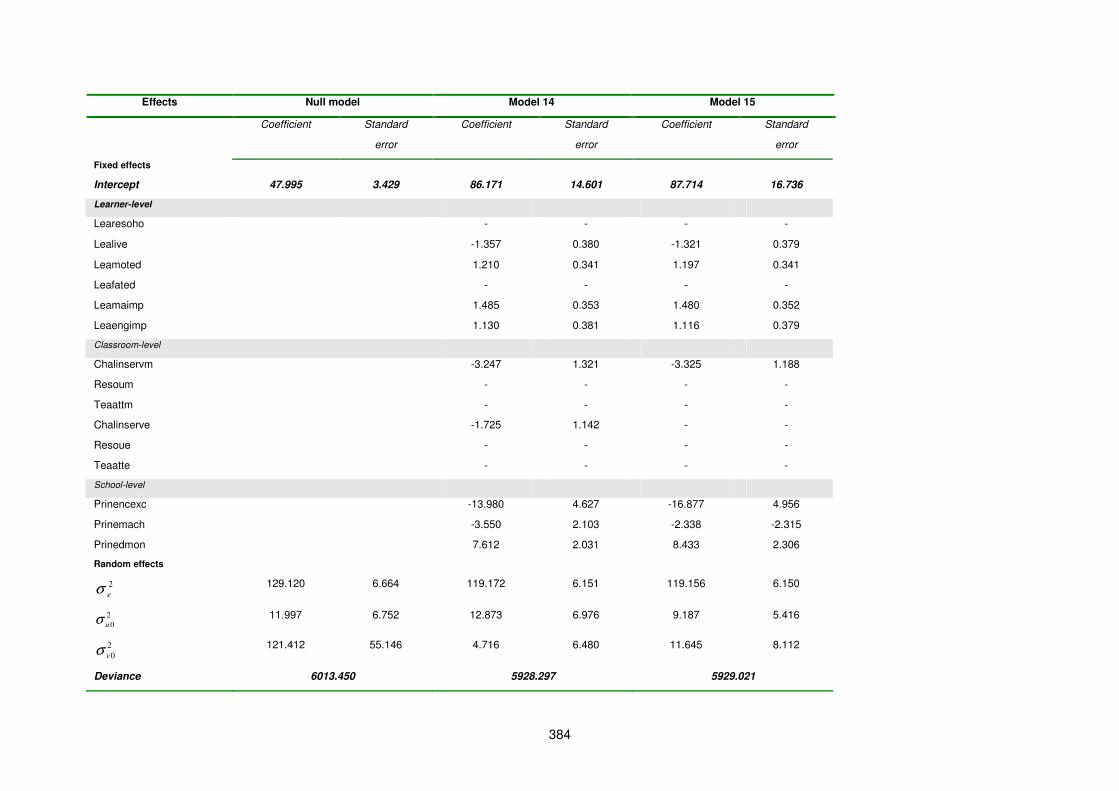
384
Effects Null model Model 14 Model 15
Coefficient Standard
error
Coefficient Standard
error
Coefficient Standard
error
Fixed effects
Intercept 47.995 3.429 86.171 14.601 87.714 16.736
Learner-level
Learesoho - - - -
Lealive -1.357 0.380 -1.321 0.379
Leamoted 1.210 0.341 1.197 0.341
Leafated - - - -
Leamaimp 1.485 0.353 1.480 0.352
Leaengimp 1.130 0.381 1.116 0.379
Classroom-level
Chalinservm -3.247 1.321 -3.325 1.188
Resoum - - - -
Teaattm - - - -
Chalinserve -1.725 1.142 - -
Resoue - - - -
Teaatte - - - -
School-level
Prinencexc -13.980 4.627 -16.877 4.956
Prinemach -3.550 2.103 -2.338 -2.315
Prinedmon 7.612 2.031 8.433 2.306
Random effects
2
eσ 129.120 6.664 119.172 6.151 119.156 6.150
2
0uσ 11.997 6.752 12.873 6.976 9.187 5.416
2
0vσ 121.412 55.146 4.716 6.480 11.645 8.112
Deviance 6013.450 5928.297 5929.021

385
Appendix N: Ethical clearance and language editing
386
N.1: Clearance certificate
387
N.2: Language editing
Recommended


