Time-resolved £uorescence of O-acetylserine sulfhydrylase1
Sara Benci a, Silvia Vaccari a, Andrea Mozzarelli b, Paul F. Cook c;*a Institute of Physical Sciences and Istituto Nazionale per la Fisica della Materia, University of Parma, 43100 Parma, Italy
b Institute of Biochemical Sciences, University of Parma, 43100 Parma, Italyc Department of Chemistry and Biochemistry, University of Oklahoma, 620 Parrington Oval, Norman, OK 73019, USA
Received 18 May 1998; received in revised form 28 September 1998; accepted 29 September 1998
Abstract
Static and time-resolved fluorescence of the internal aldimine of the pyridoxal 5P-phosphate (PLP)-dependent enzymeO-acetylserine sulfhydrylase (OASS) and those of free PLP, and the PLP-L-valine Schiff base have been measured to gaininsight into the photophysics of PLP bound to OASS. Exciting at 330 nm, free coenzyme exhibits a band at 415 nm, whereasPLP-valine and OASS (also when excited at their absorbance maxima) exhibit a structured emission with a peak at 420 nmand shoulders at 490 and 530 nm. The emission bands at 420 and 490 nm are attributed to the enolimine and ketoenaminetautomers of the internal aldimine, respectively, while the 530 nm emission might arise from a dipolar species formed uponproton dissociation in the excited state. Time-resolved fluorescence of OASS (PLP-valine), excited at 412 nm (415 nm) andcollected at Vs 470 nm, indicates the presence of two components characterized by lifetimes (d) of 0.6 (0.08) and 3.8 (1.55) nswith equal fractional intensity (f). In the presence of acetate the slow component dominates OASS emission with f of 0.98.Excitation at 350 nm as a function of emission wavelengths (400^560 nm) shows at least three components. The f of the slowcomponent increases from 400 to 440 nm, then decreases, whereas the f of the intermediate and fast components behave inthe opposite way. Results indicate that: (i) the fast component is associated with the emission at 530 nm; (ii) the slowcomponent is associated with the emission at 420 nm; (iii) a fast additive component, characterized by a very short lifetime, ispresent on the blue side of the emission spectrum; (iv) the intermediate component results from overlapping contributions,including the emission of the band at 490 nm, that could not be resolved; (v) the increased emission at 490 nm, caused byacetate binding, is likely due to the stabilization of the ketoenamine tautomer induced by an increase in polarity of the activesite microenvironment and/or a decrease in proton dissociation in the excited state; (vi) excitation at 330 nm, where theenolimine tautomer absorbs, leads to emission decays typical of the ketoenamine. ß 1999 Elsevier Science B.V. All rightsreserved.
Keywords: Pyridoxal 5P-phosphate; Schi¡ base; Ketoenamine; Enolimine; Time-resolved £uorescence
0167-4838 / 99 / $ ^ see front matter ß 1999 Elsevier Science B.V. All rights reserved.PII: S 0 1 6 7 - 4 8 3 8 ( 9 8 ) 0 0 2 2 9 - 5
Abbreviations: OASS, O-acetylserine sulfhydrylase; PLP, pyridoxal 5P-phosphate; HEPES, 4-(2-hydroxyethyl)-piperazine-1-ethanesulfonic acid; DTT, 1,4-dithiothreitol
* S.B. and P.F.C. are both corresponding authors. Fax: (P.F.C.) +1 (405) 325 7182; E-mail : [email protected];Fax: (S.B.) +39 0521 903712; E-mail : [email protected]
1 A brief report comparing some emission properties of O-acetylserine sulfhydrylase and tryptophan synthase has been presented at the4th International Conference on Methods and Application of Fluorescence Spectroscopy, Cambridge, UK, 1995 [42].
BBAPRO 35793 29-12-98
Biochimica et Biophysica Acta 1429 (1999) 317^330
1. Introduction
Pyridoxal 5P-phosphate (PLP) is the coenzyme ofenzymes catalyzing chemical modi¢cations of aminoacids. Within the active site, PLP is bound via aSchi¡ base linkage to a lysine residue and partici-pates in the catalytic mechanism by forming severalintermediates, characterized by distinct spectralproperties. In order to understand PLP catalysis,chemical and spectroscopic properties of free PLPand PLP-Schi¡ base model compounds have beenextensively studied ([1^3] and references therein, [4^9]). Time-resolved £uorescence is a spectroscopictechnique that provides information on protein-probe dynamics and on probe microenvironment[10^12]. While the £uorescence and phosphorescenceproperties of Trp have been widely used to detectprotein conformational changes, site polarity and lo-cal side chain £exibility [11,13], time-resolved £uores-cence of PLP has rarely been exploited due to thecomplexity of emissions [14^21]. Since protein actiontakes place at the active site where PLP is bound,characterization of emission properties of PLP bystatic and time resolved £uorescence can provide in-sight into the coenzyme-enzyme interactions and onthe e¡ects of ligand binding and catalysis. This ap-proach has previously been applied to the investiga-tion of the tryptophan synthase K2L2 complex fromSalmonella typhimurium [21^23].
O-Acetylserine sulfhydrylase from S. typhimuriumis a dimeric enzyme that catalyzes the formation ofL-cysteine from O-acetyl-L-serine via the L-replace-ment of acetate by sul¢de, a mechanism similar tothat catalyzed by tryptophan synthase. Static Trp£uorescence [24] as well as static and time-resolvedphosphorescence [25] of native OASS and £uores-cence of OASS substituted with cofactor analogs[26] have recently been studied. In this paper, wepresent an extensive investigation of static andtime-resolved £uorescence of the Schi¡ base betweenenzyme and PLP, in the absence and presence ofacetate, a reaction product, by excitation in the330^420 nm region where PLP directly absorbs. Inorder to correlate the emission properties of PLP-enzyme complexes with those of model compounds,static and time-resolved £uorescence of free PLP andthe PLP-valine Schi¡ base were also determined
under the same experimental conditions. Static andtime-resolved £uorescence have previously been usedto characterize the coenzyme in the presence of sub-strate and substrate analogs that form distinct cata-lytic intermediates [27].
2. Materials and methods
2.1. Enzymes
O-Acetylserine sulfhydrylase was prepared fromwild type S. typhimurium LT-2 according to the meth-od of Hara et al. [28], as modi¢ed by Tai et al. [29].
2.2. Chemicals
Sodium acetate, HEPES, DTT (Fluka), L-valine(Calbiochem) and PLP (Boehringer) were obtainedcommercially, were the highest quality available,and were used without further puri¢cation. ThePLP-valine Schi¡ base was prepared by mixing0.5 M L-valine and 28 WM PLP, at pH 7, 100 mMHEPES [6].
2.3. Bu¡ers
Measurements were carried out in a solution con-taining 100 mM Na-HEPES bu¡er, 20³C.
2.4. Absorption, £uorescence and excitation spectra
Absorption spectra were recorded using either aCary 219 interfaced to a computer or a Cecil 3000spectrophotometer (Milton Tech. Center, Cam-bridge, UK). Static £uorescent spectra were collectedusing a phase £uorometer (Model GREG 200, ISSInc., Champaign, IL). The £uorescence intensity ofthe solvent was subtracted. Excitation and emissionslits of the monochromators were 2 mm with a totalbandwidth of 16 nm. The cuvette holders of both thespectrophotometers and the £uorometer were ther-mostatted at 20 þ 0.5³C. The concentration of en-zyme protomers was estimated based on an extinc-tion of coe¤cient 7600 M31 cm31 at 412 nm [30] andwas usually 13 WM in order to maintain an absorp-tion at 412 nm less than 0.1.
BBAPRO 35793 29-12-98
S. Benci et al. / Biochimica et Biophysica Acta 1429 (1999) 317^330318
2.5. Time-resolved £uorescence
Fluorescence decay was measured using the phase-modulation technique [31,32]. The sample is excitedwith light of modulated intensity, and the phase shiftand demodulation of the emitted light are deter-mined as a function of the modulation frequency.Phase (dp) and modulation lifetimes (dm) are calcu-lated according to:
tan Pm � dp �1�
Mm � �1� �gdm�2�31=2 �2�In Eqs. 1 and 2, Pm is the measured phase shift, Mm
is the measured relative modulation ratio, and g isthe modulation angular frequency. The measuredphase and modulation values were analyzed by as-suming a sum of exponential decays. The resultingvalues were compared to the calculated values ofphase and modulation (for any intensity decay) using:
Pc � tan31�S�g�=G�g�� �3�
M2c � S�g�2 � G�g�2 �4�
In Eqs. 3 and 4, S(g) and G(g) have di¡erent ex-pressions depending on the assumed model. For asum of exponentials, S(g) and G(g) are given by:
S�g� � 4i�f igdi=�1� g2d2i �� �5�
G�g� � 4i�f i=�1� g2d2i �� �6�
In Eqs. 5 and 6, the index i depends on the numberof exponentials used for the ¢t, di is the lifetime ofthe ith component, fi is its fractional intensity, andthus 4fi = 1. The `goodness' of the ¢t is determinedby the value of the reduced M2, de¢ned as follows:
M2 � 4��Pc3Pm�cp�2 � ��Mc3Mm�=cm�2�=�2n3F31��7�
In Eq. 7, n is the number of modulation frequencies,F is the number of free parameters, while cp and cm
are the standard deviations of each phase and mod-ulation measurement, respectively.
Variable-frequency phase and modulation datawere measured on an ISS GREG 200 £uorometerusing a reference solution of p-bis[2-(phenoxazoyl)]-benzene (POPOP, d= 1.35 ns) or a glycogen scatter-
ing solution. Excitation was performed either using a300 W xenon lamp with a Yobin Yvon monochro-mator with 16 nm band width, or a dye laser syn-chronously pumped by a Nd-Yag laser (Coherent,model 700). Emission bands were selected usingcut-o¡ ¢lters.
Multiple-wavelength data were obtained using la-ser excitation at 350 nm and selecting nine distinctemission wavelengths with the monochromator(bandwidth, 8 nm) over the wavelength range 400^560 nm. To eliminate polarization artifacts in thedetermination of lifetimes, the excitation beam wasroutinely polarized normal to the laboratory plane(0³) and the emission was collected at the magic an-gle (55³) [33]. Modulation frequency was varied con-tinuously from 2^10 MHz to 250 MHz. A set of 15modulation frequencies was generally used in the fre-quency range most appropriate for the sample underinvestigation. Frequency-independent standard er-rors for phase and modulation were assumed to be0.2³ and 0.004, respectively. Decay data were ¢ttedusing a sum of exponential components, character-ized by a lifetime, d, and a fractional intensity, f,using software provided by ISS. Multiple-wavelengthdecay data were analyzed simultaneously at all emis-sion wavelengths via the Global Unlimited software(Laboratory for Fluorescence Dynamics, Universityof Illinois, Urbana, IL) assuming £uorescence life-times independent of emission wavelength, whiletheir associated fractional intensities were allowedto vary. The ¢tting procedure provides an estimateof the so-called species-associated spectra (SAS) rep-resenting the emission spectrum of a given chemicalspecies when excited state reactions do not occur[34,35]. The multiple-wavelength decays were alsoanalyzed separately at each wavelength assuming amodel based on the sum of three unrelated exponen-tials. Samples were maintained at 20 þ 0.5³C using acirculating water bath and a jacketed cell holder.
3. Results
3.1. Absorption spectra of free PLP, the PLP-valineSchi¡ base, and OASS in the absence andpresence of acetate
Free PLP in HEPES, pH 7, 20³C exhibits an ab-
BBAPRO 35793 29-12-98
S. Benci et al. / Biochimica et Biophysica Acta 1429 (1999) 317^330 319
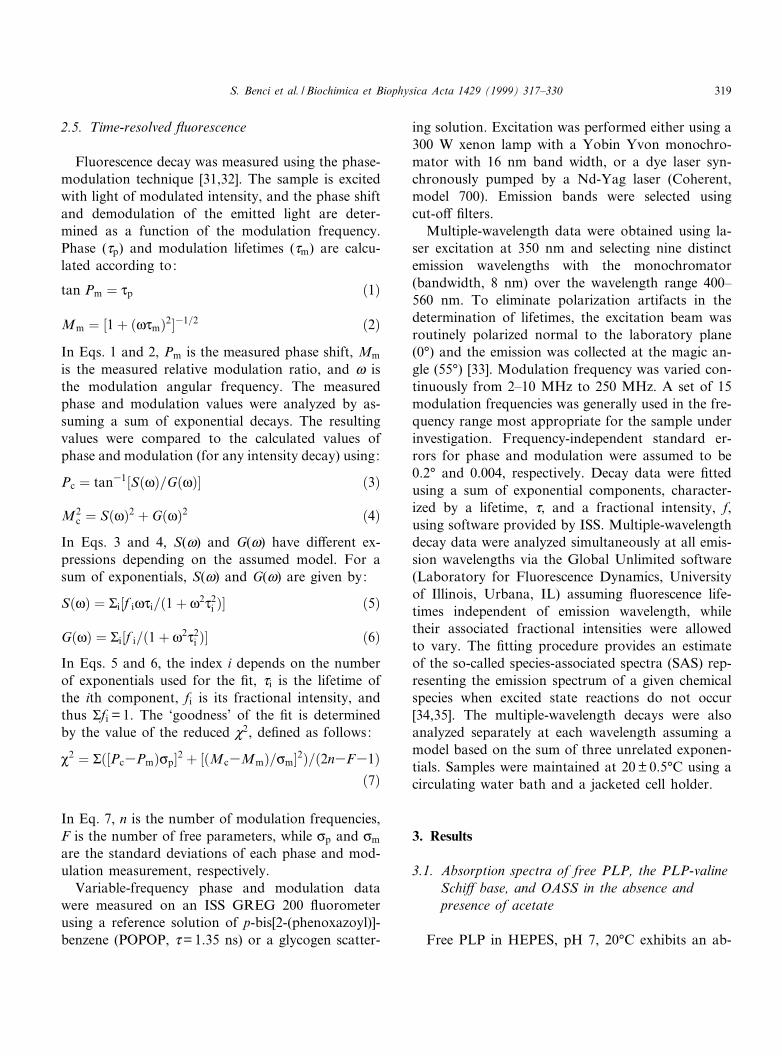
sorption spectrum with a maximum centered at 388nm and a prominent shoulder at about 330 nm (Fig.1a) [3,5]. The PLP-valine Schi¡ base has a maximumat 415 nm, red-shifted compared to PLP, and theshoulder is signi¢cantly reduced in intensity. In addi-tion, a new absorption band is observed at 280 nm(Fig. 1a). The absorption spectrum of the OASS(Fig. 1b) exhibits a band at 412 nm, asymmetric onthe blue side, suggesting the presence of a weak bandat about 330 nm. The band at 280 nm, typical ofaromatic amino acids, is also likely to have a contri-
bution from PLP as judged by the PLP-valine Schi¡base spectrum (Fig. 1b [1]). The OASS spectrum isindependent of pH between 7 and 9 [30], while it isslightly a¡ected by the binding of the reaction prod-uct acetate (Fig. 1b).
3.2. Emission and excitation spectra of PLP,PLP-valine and OASS in the absence andpresence of acetate
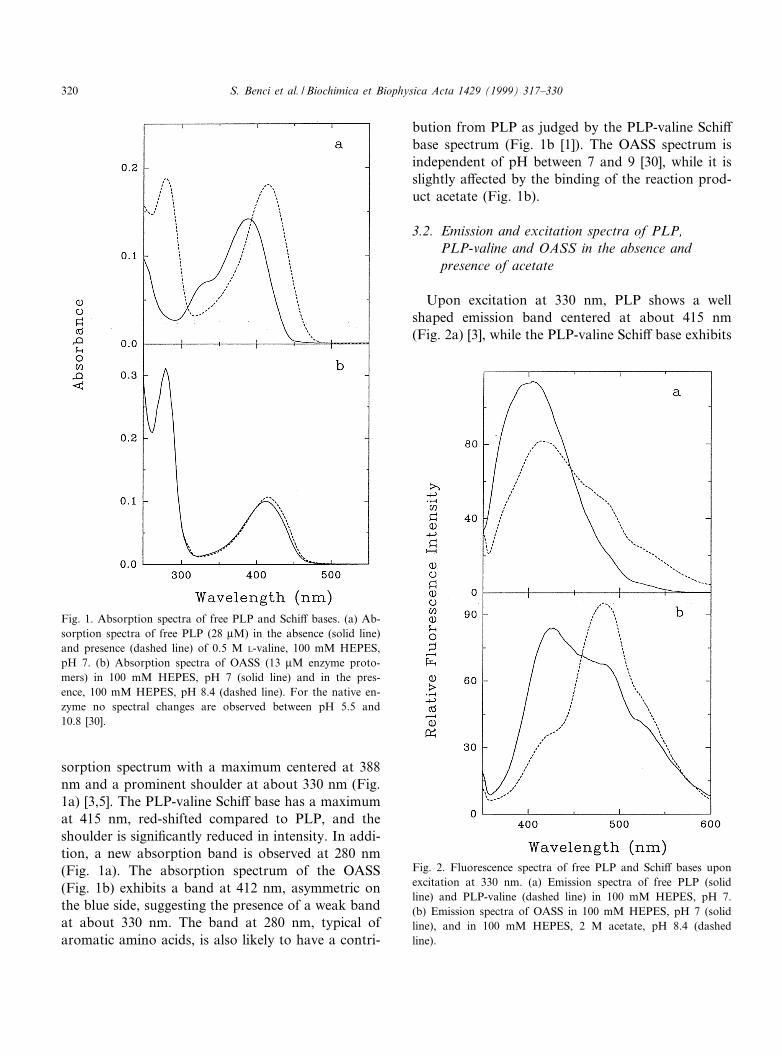
Upon excitation at 330 nm, PLP shows a wellshaped emission band centered at about 415 nm(Fig. 2a) [3], while the PLP-valine Schi¡ base exhibits
Fig. 1. Absorption spectra of free PLP and Schi¡ bases. (a) Ab-sorption spectra of free PLP (28 WM) in the absence (solid line)and presence (dashed line) of 0.5 M L-valine, 100 mM HEPES,pH 7. (b) Absorption spectra of OASS (13 WM enzyme proto-mers) in 100 mM HEPES, pH 7 (solid line) and in the pres-ence, 100 mM HEPES, pH 8.4 (dashed line). For the native en-zyme no spectral changes are observed between pH 5.5 and10.8 [30].
Fig. 2. Fluorescence spectra of free PLP and Schi¡ bases uponexcitation at 330 nm. (a) Emission spectra of free PLP (solidline) and PLP-valine (dashed line) in 100 mM HEPES, pH 7.(b) Emission spectra of OASS in 100 mM HEPES, pH 7 (solidline), and in 100 mM HEPES, 2 M acetate, pH 8.4 (dashedline).
BBAPRO 35793 29-12-98
S. Benci et al. / Biochimica et Biophysica Acta 1429 (1999) 317^330320
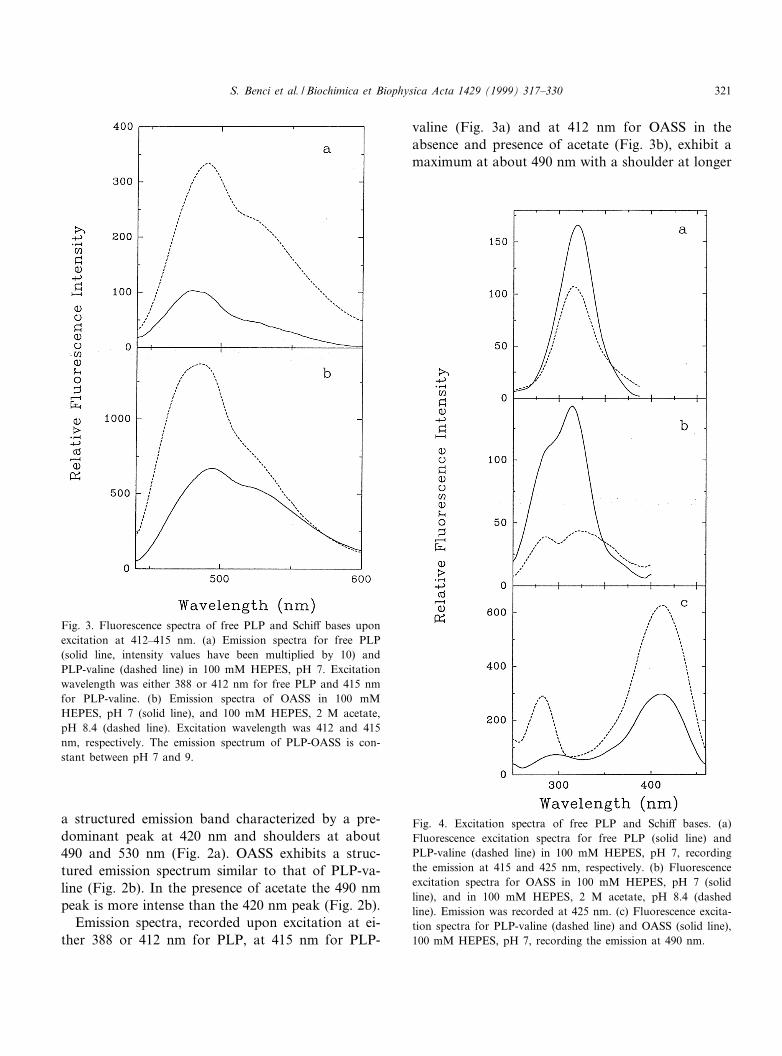
a structured emission band characterized by a pre-dominant peak at 420 nm and shoulders at about490 and 530 nm (Fig. 2a). OASS exhibits a struc-tured emission spectrum similar to that of PLP-va-line (Fig. 2b). In the presence of acetate the 490 nmpeak is more intense than the 420 nm peak (Fig. 2b).
Emission spectra, recorded upon excitation at ei-ther 388 or 412 nm for PLP, at 415 nm for PLP-
valine (Fig. 3a) and at 412 nm for OASS in theabsence and presence of acetate (Fig. 3b), exhibit amaximum at about 490 nm with a shoulder at longer
Fig. 3. Fluorescence spectra of free PLP and Schi¡ bases uponexcitation at 412^415 nm. (a) Emission spectra for free PLP(solid line, intensity values have been multiplied by 10) andPLP-valine (dashed line) in 100 mM HEPES, pH 7. Excitationwavelength was either 388 or 412 nm for free PLP and 415 nmfor PLP-valine. (b) Emission spectra of OASS in 100 mMHEPES, pH 7 (solid line), and 100 mM HEPES, 2 M acetate,pH 8.4 (dashed line). Excitation wavelength was 412 and 415nm, respectively. The emission spectrum of PLP-OASS is con-stant between pH 7 and 9.
Fig. 4. Excitation spectra of free PLP and Schi¡ bases. (a)Fluorescence excitation spectra for free PLP (solid line) andPLP-valine (dashed line) in 100 mM HEPES, pH 7, recordingthe emission at 415 and 425 nm, respectively. (b) Fluorescenceexcitation spectra for OASS in 100 mM HEPES, pH 7 (solidline), and in 100 mM HEPES, 2 M acetate, pH 8.4 (dashedline). Emission was recorded at 425 nm. (c) Fluorescence excita-tion spectra for PLP-valine (dashed line) and OASS (solid line),100 mM HEPES, pH 7, recording the emission at 490 nm.
BBAPRO 35793 29-12-98
S. Benci et al. / Biochimica et Biophysica Acta 1429 (1999) 317^330 321

wavelengths (V530 nm). The emission intensity isvery weak for PLP, while it is signi¢cantly more in-tense for PLP-valine or OASS. Binding of acetate toOASS results in an enhancement of the emission, aspreviously observed [24,25] upon excitation at 298nm, with the 490 nm band increased compared tothe shoulder at 530 nm.
The excitation spectrum of PLP, with the emissionmonochromator set at 415 nm (Fig. 4a), shows aband at 316 nm. When the emission is set at 480nm, a shoulder at 420 nm is also observed in theexcitation spectrum (data not shown). The excitationspectrum of PLP-valine, with emission at 425 nm,gives the band at 316 nm (Fig. 4a), while that ofOASS exhibits the band at 316 nm accompanied bya prominent shoulder at lower wavelengths (Fig. 4b).Moreover, with the emission monochromator at 490or 530 nm, OASS and PLP-valine are excited mainlyat 412 and 280 nm, with a broadening and a red shift
of the 280 nm excitation band for PLP-valine (Fig.4c). In the case of OASS, the above emission proper-ties are independent of pH between 7 and 9 and arenot a¡ected by acetate binding.
3.3. Time-resolved £uorescence of PLP, PLP-valineand OASS in the absence and presence of acetate
Fluorescence decays of PLP-valine and OASS, inthe absence and presence of acetate, upon excitationat 415 and 412 nm, respectively, were monitored atVv470 nm. Free PLP, excited at either 388 or 412nm, is characterized by a low signal that prevents therecording of reliable data. Fluorescence decays forPLP-valine and OASS can best be ¢tted to the sumof two lifetimes (Table 1). The fast component has alifetime of 0.6 ns (f1 = 0.5) for OASS and 0.1 ns(f1 = 0.3) for PLP-valine. The slow component exhib-its a lifetime of 3.8 ns for OASS (f2 = 0.5) and 1.6 ns
Table 1Fluorescence decay parameters for PLP-valine and PLP-OASS (in the absence and presence of acetate) upon excitation at either 412or 415 nma
Sample pH d1 d2 f1 f2 M2
PLP-valineb 7 0.08 þ 0.03 1.55 þ 0.04 0.31 þ 0.01 0.69 þ 0.01 3.70OASSb 7 0.58 þ 0.02 3.77 þ 0.13 0.50 þ 0.01 0.50 þ 0.01 2.00
9 0.65 þ 0.02 3.76 þ 0.13 0.52 þ 0.01 0.48 þ 0.01 3.54OASSc 7 0.55 þ 0.03 3.68 þ 0.20 0.66 þ 0.01 0.34 þ 0.01 4.76OASS+acetateb 8.4 0.85 þ 0.10 5.20 þ 0.06 0.02 þ 0.01 0.98 þ 0.01 1.51ad1 and d2 are distinct lifetimes expressed in ns, with fractional intensities f1 and f2, respectively. Excitation wavelengths for OASS,and for PLP-valine and OASS plus acetate were 412 and 415 nm, respectively. All values are the average of 2^3 measurements.bEmissions were recorded using an Oriel 52095 cut-o¡ ¢lter (Vemv470 nm).cEmissions were recorded using an Oriel 52104 cut-o¡ ¢lter (Vemv550 nm).
Table 2Fluorescence decay parameters for PLP, PLP-valine and OASS upon excitation at 330 nma
Sample pH d1 d2 d3 f1 f2 f3 M2
PLPb 7 0.10 þ 0.02 1.05 þ 0.09 7.00 þ 0.50 0.27 þ 0.02 0.34 þ 0.02 0.39 þ 0.02 6.1PLP-valineb 7 0.09 þ 0.02 1.35 þ 0.08 8.59 þ 0.30 0.10 þ 0.01 0.40 þ 0.01 0.50 þ 0.01 5.2OASSb 7 0.43 þ 0.06 1.55 þ 0.06 6.97 þ 0.20 0.10 þ 0.01 0.32 þ 0.01 0.58 þ 0.01 4.9
9 0.50 þ 0.05 1.60 þ 0.06 6.55 þ 0.20 0.18 þ 0.01 0.27 þ 0.01 0.54 þ 0.01 4.4OASSc 7 0.40 þ 0.03 1.50 þ 0.06 6.87 þ 0.30 0.32 þ 0.01 0.32 þ 0.01 0.36 þ 0.01 6.1
9 0.47 þ 0.03 1.90 þ 0.08 7.21 þ 0.40 0.31 þ 0.01 0.34 þ 0.01 0.35 þ 0.01 7.6OASS+acetateb 8.4 0.55 þ 0.05 4.68 þ 0.06 6.95 þ 0.40 0.07 þ 0.01 0.82 þ 0.01 0.11 þ 0.01 3.1ad1, d2 and d3 are distinct lifetimes expressed in ns, with fractional intensities f1, f2 and f3, respectively. All values are the average of2^3 measurements.bEmissions were recorded using an Oriel 52053 cut-o¡ ¢lter (Vemv370 nm).cEmissions were recorded using an Oriel 52095 cut-o¡ ¢lter (Vemv470 nm).
BBAPRO 35793 29-12-98
S. Benci et al. / Biochimica et Biophysica Acta 1429 (1999) 317^330322
for PLP-valine (f2 = 0.7). When emission is measuredat wavelengths higher than 550 nm, the fast compo-nent of OASS predominates (f1 = 0.66; Table 1). ForOASS in the presence of acetate, the lifetime of the
slow component increases to 5.2 ns with a fractionalintensity of 0.98.
When excitation is at 330 nm and the emission ismonitored at wavelengths higher than 370 nm (Table2), £uorescence decay for all samples is best ¢ttedusing the sum of three lifetimes. For PLP, PLP-va-line, and OASS the fractional intensity of the fastcomponent is lowest, while that of the slower com-ponent is highest. In the presence of acetate, wherethe 420 nm emission decreases (Fig. 2b), the frac-tional intensity of the slower component also de-creases. When the emission of OASS is recorded atwavelengths higher than 470 nm, the fractional in-tensity of the fast component increases and that ofthe slow one correspondingly decreases. Lifetime val-ues are the same and pH-independent between 7 and9.
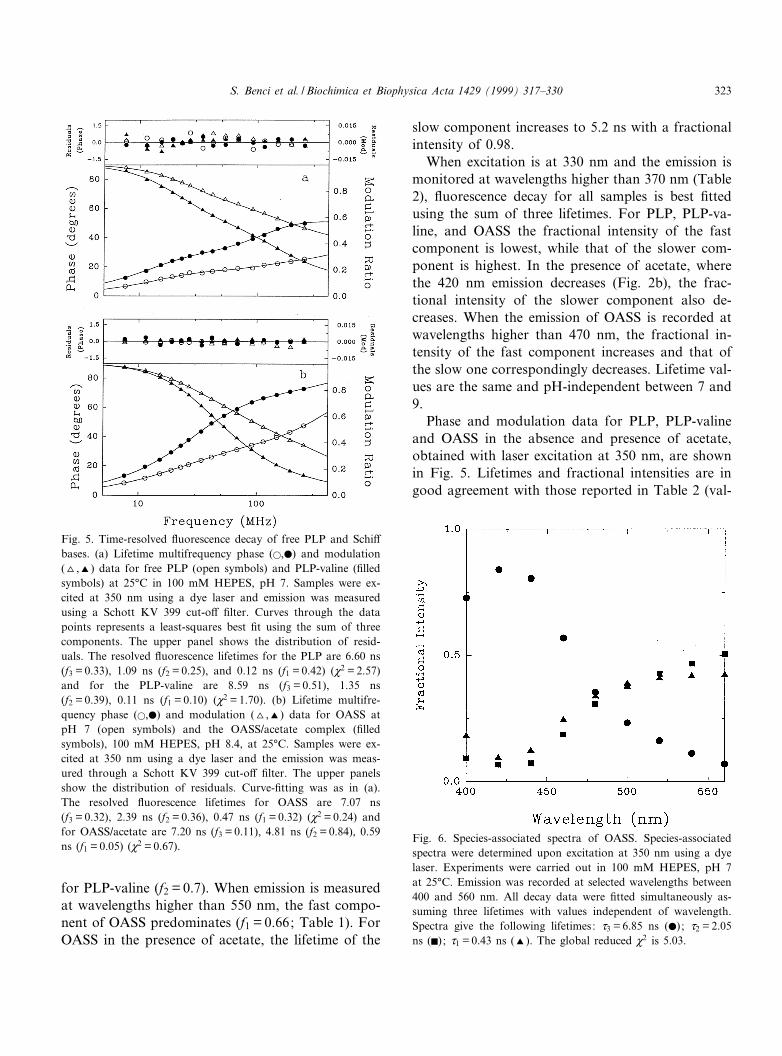
Phase and modulation data for PLP, PLP-valineand OASS in the absence and presence of acetate,obtained with laser excitation at 350 nm, are shownin Fig. 5. Lifetimes and fractional intensities are ingood agreement with those reported in Table 2 (val-
Fig. 5. Time-resolved £uorescence decay of free PLP and Schi¡bases. (a) Lifetime multifrequency phase (a,b) and modulation(O,R) data for free PLP (open symbols) and PLP-valine (¢lledsymbols) at 25³C in 100 mM HEPES, pH 7. Samples were ex-cited at 350 nm using a dye laser and emission was measuredusing a Schott KV 399 cut-o¡ ¢lter. Curves through the datapoints represents a least-squares best ¢t using the sum of threecomponents. The upper panel shows the distribution of resid-uals. The resolved £uorescence lifetimes for the PLP are 6.60 ns(f3 = 0.33), 1.09 ns (f2 = 0.25), and 0.12 ns (f1 = 0.42) (M2 = 2.57)and for the PLP-valine are 8.59 ns (f3 = 0.51), 1.35 ns(f2 = 0.39), 0.11 ns (f1 = 0.10) (M2 = 1.70). (b) Lifetime multifre-quency phase (a,b) and modulation (O,R) data for OASS atpH 7 (open symbols) and the OASS/acetate complex (¢lledsymbols), 100 mM HEPES, pH 8.4, at 25³C. Samples were ex-cited at 350 nm using a dye laser and the emission was meas-ured through a Schott KV 399 cut-o¡ ¢lter. The upper panelsshow the distribution of residuals. Curve-¢tting was as in (a).The resolved £uorescence lifetimes for OASS are 7.07 ns(f3 = 0.32), 2.39 ns (f2 = 0.36), 0.47 ns (f1 = 0.32) (M2 = 0.24) andfor OASS/acetate are 7.20 ns (f3 = 0.11), 4.81 ns (f2 = 0.84), 0.59ns (f1 = 0.05) (M2 = 0.67).
Fig. 6. Species-associated spectra of OASS. Species-associatedspectra were determined upon excitation at 350 nm using a dyelaser. Experiments were carried out in 100 mM HEPES, pH 7at 25³C. Emission was recorded at selected wavelengths between400 and 560 nm. All decay data were ¢tted simultaneously as-suming three lifetimes with values independent of wavelength.Spectra give the following lifetimes: d3 = 6.85 ns (b) ; d2 = 2.05ns (F) ; d1 = 0.43 ns (R). The global reduced M2 is 5.03.
BBAPRO 35793 29-12-98
S. Benci et al. / Biochimica et Biophysica Acta 1429 (1999) 317^330 323
ues averaged over 2^3 measurements with excitationat 330 nm). The upper plots of Fig. 5a,b give theresiduals, indicating the goodness of ¢t of the modelto the data. The striking di¡erences among the ex-perimental curves of the four samples re£ect the var-iation of lifetime values and of the correspondingfractional intensities. The £uorescence decay ofPLP compared to that of PLP-valine exhibits a fastcomponent with a short lifetime value (d1 = 0.12 ns)and a high fractional intensity (f1 = 0.42) (Fig. 5a).Furthermore, the emission decay of OASS plus ace-tate compared to OASS is characterized by a largedecrease in fractional intensity of the fast component(f1 = 0.05 vs. f1 = 0.32) and an increase in the lifetimeand fractional intensity values of the intermediatecomponent (d2 = 4.81 ns and f2 = 0.84 vs. d2 = 2.39ns and f2 = 0.36) (Fig. 5b).
A detailed analysis of £uorescence decay as a func-tion of the emission wavelengths was carried out forPLP-valine and OASS in the presence and absence ofacetate. SAS of OASS, with excitation at 350 nmusing a dye laser, were recorded over the wavelengthrange 400^560 nm (Fig. 6). The fractional intensityof the fast component decreases from 400 to 440 nmand then increases to a higher constant value atwavelengths v550 nm, while the fractional intensityof the slow component exhibits the opposite behav-ior. Results suggest that an additive component,characterized by a short lifetime value, is present inthe emission between 400 and 440 nm and overlapsthe long lifetime emission. A similar behavior is ob-served for the SAS curves of PLP-valine (data not
shown), consistent with the strong similarity in emis-sion spectra of both species when excited at 330 nm.For OASS in the presence of acetate, SAS curvesprovide evidence that the fast lifetime componentin the 400^440 wavelength range overlaps with theslow component (d= 7.2 ns), and the reduced frac-tional intensity agrees with the emission spectrum(Fig. 2b). The existence of a fast component at400^440 nm suggests that the three exponential decaymodel may not be su¤cient for describing the photo-physical properties of PLP emission upon excitationat 330/350 nm. However, ¢tting a model with fourexponential functions provides no evidence for a newcomponent.
A comparison of the lifetime values determinedfrom £uorescence decay with excitation at 330 nmand emission collected at Vs 370 nm (Table 2), com-pared to lifetimes obtained from decay with excita-tion at 412 nm, suggests that only the fast and slowlifetime values, represented by d1 and d3, can be con-sidered intrinsic excited state lifetimes, while the d2
component likely results from overlapping contribu-tions with lifetime values and relative intensities thatcannot be resolved [36].
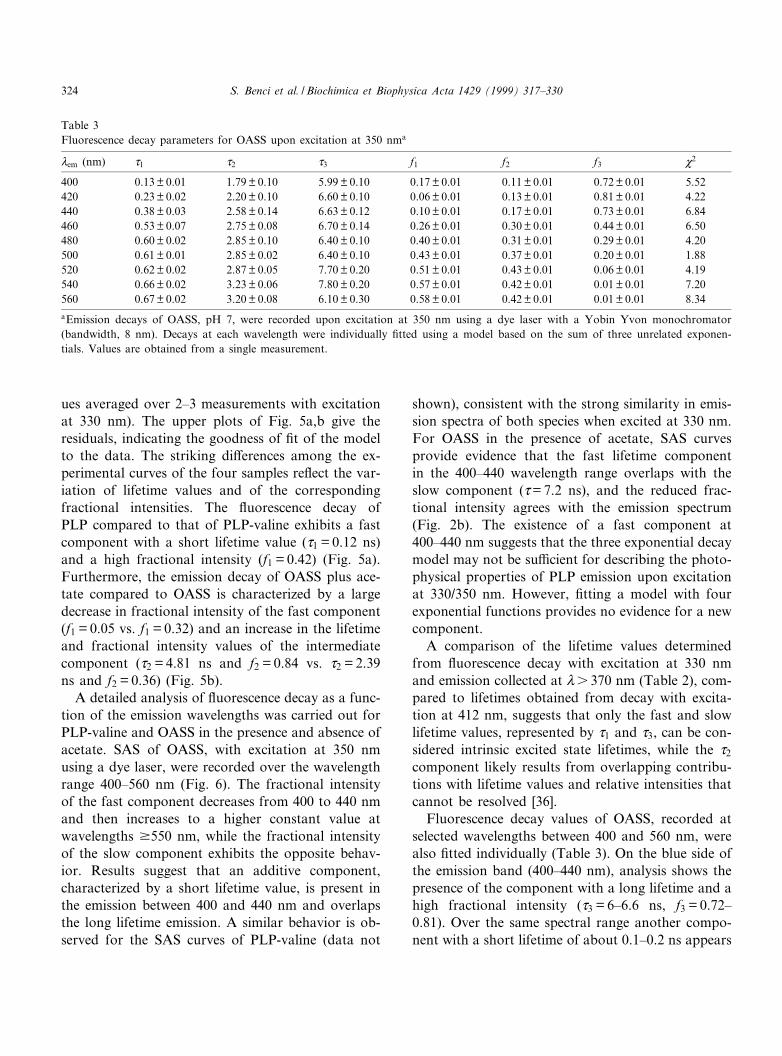
Fluorescence decay values of OASS, recorded atselected wavelengths between 400 and 560 nm, werealso ¢tted individually (Table 3). On the blue side ofthe emission band (400^440 nm), analysis shows thepresence of the component with a long lifetime and ahigh fractional intensity (d3 = 6^6.6 ns, f3 = 0.72^0.81). Over the same spectral range another compo-nent with a short lifetime of about 0.1^0.2 ns appears
Table 3Fluorescence decay parameters for OASS upon excitation at 350 nma
Vem (nm) d1 d2 d3 f1 f2 f3 M2
400 0.13 þ 0.01 1.79 þ 0.10 5.99 þ 0.10 0.17 þ 0.01 0.11 þ 0.01 0.72 þ 0.01 5.52420 0.23 þ 0.02 2.20 þ 0.10 6.60 þ 0.10 0.06 þ 0.01 0.13 þ 0.01 0.81 þ 0.01 4.22440 0.38 þ 0.03 2.58 þ 0.14 6.63 þ 0.12 0.10 þ 0.01 0.17 þ 0.01 0.73 þ 0.01 6.84460 0.53 þ 0.07 2.75 þ 0.08 6.70 þ 0.14 0.26 þ 0.01 0.30 þ 0.01 0.44 þ 0.01 6.50480 0.60 þ 0.02 2.85 þ 0.10 6.40 þ 0.10 0.40 þ 0.01 0.31 þ 0.01 0.29 þ 0.01 4.20500 0.61 þ 0.01 2.85 þ 0.02 6.40 þ 0.10 0.43 þ 0.01 0.37 þ 0.01 0.20 þ 0.01 1.88520 0.62 þ 0.02 2.87 þ 0.05 7.70 þ 0.20 0.51 þ 0.01 0.43 þ 0.01 0.06 þ 0.01 4.19540 0.66 þ 0.02 3.23 þ 0.06 7.80 þ 0.20 0.57 þ 0.01 0.42 þ 0.01 0.01 þ 0.01 7.20560 0.67 þ 0.02 3.20 þ 0.08 6.10 þ 0.30 0.58 þ 0.01 0.42 þ 0.01 0.01 þ 0.01 8.34aEmission decays of OASS, pH 7, were recorded upon excitation at 350 nm using a dye laser with a Yobin Yvon monochromator(bandwidth, 8 nm). Decays at each wavelength were individually ¢tted using a model based on the sum of three unrelated exponen-tials. Values are obtained from a single measurement.
BBAPRO 35793 29-12-98
S. Benci et al. / Biochimica et Biophysica Acta 1429 (1999) 317^330324
to be present and overlaps the slow component. Thefractional intensity of the slow component continu-ally decreases as the emission wavelength increases.On the red side of the spectral range, lifetime andfractional intensity values of the fast component ap-proach values typical of emission upon direct excita-tion at 412 nm. Overall, the slow component exhibitsa wavelength dependence of fractional intensity sim-ilar to that determined by the SAS analysis, while thecomponent with an intermediate lifetime value exhib-its a lifetime (d2) and fractional intensity (f2) thatchange as a function of emission wavelength from1.79 ns and 0.11 at 400 nm to 3.2 ns and 0.42 at540^560 nm, respectively. The results indicate that,on the red side of the emission band, where the emis-sion of species directly excited at 330 nm is not de-tected, the lifetime values are the same as those de-termined upon excitation at 412 nm. On the otherhand, on the blue side of the emission band there aretwo lifetime components, corresponding to two spe-cies with di¡erent £uorescence properties.
4. Discussion
Free PLP and PLP-Schi¡ bases are characterizedby the presence of several protonation and tautome-rization equilibria leading to a distribution of speciesa¡ected by pH, solvent polarity, and, in enzymes, byligand binding. At neutral pH PLP exhibits an ab-sorption band at 388 nm that shifts to 412 nm uponformation of a Schi¡ base with an amino acid. Anincreased stability of PLP-Schi¡ base excited states isindicated by an increase in the emission intensity and£uorescence lifetime values upon excitation at themaximum of the absorption band.
Excitation at 412^415 nm for PLP, PLP-valine andOASS gives rise to a structured emission with a peakat 490 nm and a shoulder at 530 nm, also detected inother PLP-Schi¡ base model compounds [2,3,8,9].The long wavelength emission of free PLP is veryweak and is pH-dependent [3,5]. The long wave-length emission properties of PLP-valine [1,2], PLP-dodecylamine [8] and PLP-isoleucine [9] are also pH-dependent and originate from at least two intercon-verting species [2,3,9]. The species emitting at 490 nmhas been attributed to a ketoenamine tautomer of theSchi¡ base protonated at the imine nitrogen (Scheme
1), [2,3,9]. The species that is weakly £uorescent at530 nm may be a dipolar PLP-Schi¡ base formed byimine proton dissociation in the excited state [2,9]. Infact, the pK* of the imine proton for PLP-isoleucinein the excited state is 8.5, two pK units lower thanthat in the ground state [9]. Thus, PLP-Schi¡ basesundergo an excited state proton dissociated that hasalso been theoretically predicted [3]. Furthermore,the same shape of the excitation spectra is foundrecording emission at either 490 or 530 nm (Fig. 4)for PLP-valine and OASS. The latter ¢nding suggeststhat the deprotonated form of the Schi¡ base is notdirectly excited [9], and can only be observed afterthe dissociation of the imine proton in the excitedstate. In PLP-OASS, the emission is constant be-tween pH 7 and 9. The pH range is limited by en-zyme stability thus preventing the detection of a pK*at higher or lower pH values. However, due to thesimilarity of emission properties between PLP-valineand the PLP-enzyme, we suggest that the ketoen-amine of PLP-enzyme is also involved in a protondissociation in the excited state generating a dipolarSchi¡ base. Further, the ketoenamine tautomer andthe dipolar PLP-Schi¡ base are in equilibrium duringthe lifetime of excited states that range from 0.5 to 5ns (Table 1), since the proton dissociation time isexpected to be 10312 s [37,38]. In the presence ofacetate, the 490/530 nm ratio increases (Fig. 2) sug-gesting that the ketoenamine species is favored, pos-sibly due to an e¡ect of acetate on the dipolar/ke-toenamine ionization equilibrium as suggested bySchnackerz et al. [39]. The time-resolved data indi-cate that the weak emission of the dipolar species at530 nm is associated with a very short lifetime whilethe ketoenamine form emitting at 490 nm is charac-terized by a higher £uorescence intensity, and haslonger lifetime values. These assignments are alsosupported by £uorescence decay, observed by select-ing the emission monochromator to wavelengthshigher than 550 nm where the fractional intensityof the short lifetime component has increased from0.5 to 0.66.
Emission spectra for PLP, upon excitation at 330^350 nm, are similar to those obtained with PLP-va-line and OASS. The £uorescence decay analysis ofthe total emission of PLP, excited at 330 nm, givesthree lifetimes with values slightly lower than thosemeasured for PLP-valine and OASS (Table 2).
BBAPRO 35793 29-12-98
S. Benci et al. / Biochimica et Biophysica Acta 1429 (1999) 317^330 325
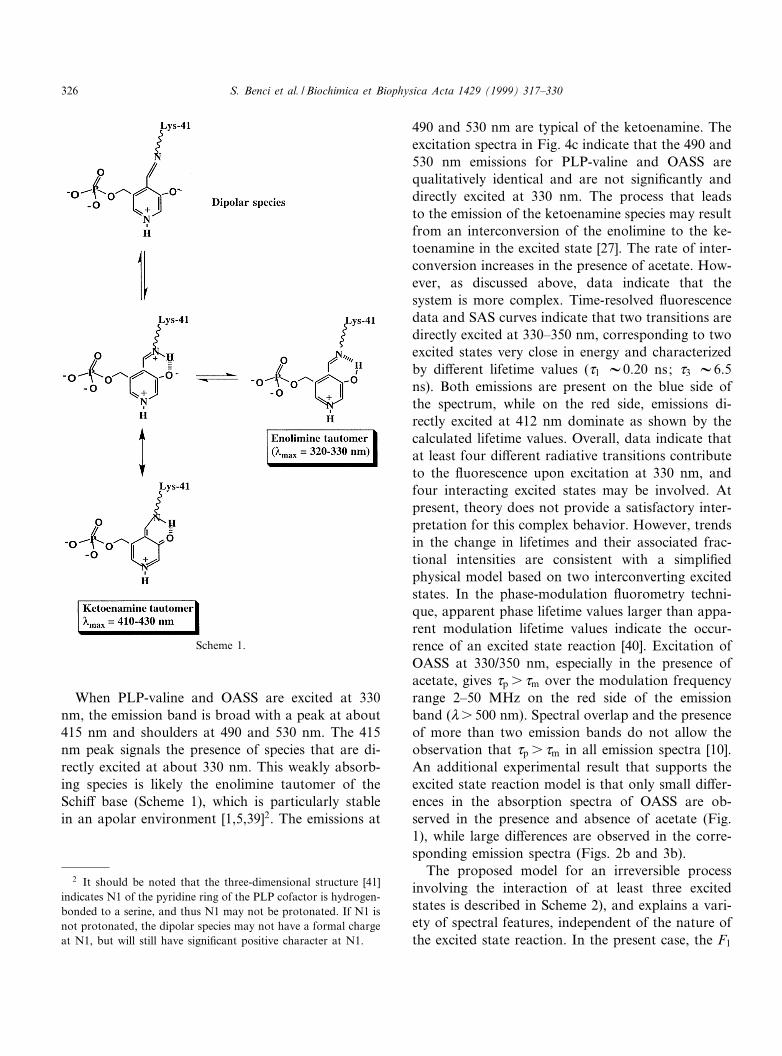
When PLP-valine and OASS are excited at 330nm, the emission band is broad with a peak at about415 nm and shoulders at 490 and 530 nm. The 415nm peak signals the presence of species that are di-rectly excited at about 330 nm. This weakly absorb-ing species is likely the enolimine tautomer of theSchi¡ base (Scheme 1), which is particularly stablein an apolar environment [1,5,39]2. The emissions at
490 and 530 nm are typical of the ketoenamine. Theexcitation spectra in Fig. 4c indicate that the 490 and530 nm emissions for PLP-valine and OASS arequalitatively identical and are not signi¢cantly anddirectly excited at 330 nm. The process that leadsto the emission of the ketoenamine species may resultfrom an interconversion of the enolimine to the ke-toenamine in the excited state [27]. The rate of inter-conversion increases in the presence of acetate. How-ever, as discussed above, data indicate that thesystem is more complex. Time-resolved £uorescencedata and SAS curves indicate that two transitions aredirectly excited at 330^350 nm, corresponding to twoexcited states very close in energy and characterizedby di¡erent lifetime values (d1 V0.20 ns; d3 V6.5ns). Both emissions are present on the blue side ofthe spectrum, while on the red side, emissions di-rectly excited at 412 nm dominate as shown by thecalculated lifetime values. Overall, data indicate thatat least four di¡erent radiative transitions contributeto the £uorescence upon excitation at 330 nm, andfour interacting excited states may be involved. Atpresent, theory does not provide a satisfactory inter-pretation for this complex behavior. However, trendsin the change in lifetimes and their associated frac-tional intensities are consistent with a simpli¢edphysical model based on two interconverting excitedstates. In the phase-modulation £uorometry techni-que, apparent phase lifetime values larger than appa-rent modulation lifetime values indicate the occur-rence of an excited state reaction [40]. Excitation ofOASS at 330/350 nm, especially in the presence ofacetate, gives dp s dm over the modulation frequencyrange 2^50 MHz on the red side of the emissionband (Vs 500 nm). Spectral overlap and the presenceof more than two emission bands do not allow theobservation that dp s dm in all emission spectra [10].An additional experimental result that supports theexcited state reaction model is that only small di¡er-ences in the absorption spectra of OASS are ob-served in the presence and absence of acetate (Fig.1), while large di¡erences are observed in the corre-sponding emission spectra (Figs. 2b and 3b).
The proposed model for an irreversible processinvolving the interaction of at least three excitedstates is described in Scheme 2), and explains a vari-ety of spectral features, independent of the nature ofthe excited state reaction. In the present case, the F1
Scheme 1.
2 It should be noted that the three-dimensional structure [41]indicates N1 of the pyridine ring of the PLP cofactor is hydrogen-bonded to a serine, and thus N1 may not be protonated. If N1 isnot protonated, the dipolar species may not have a formal chargeat N1, but will still have signi¢cant positive character at N1.
BBAPRO 35793 29-12-98
S. Benci et al. / Biochimica et Biophysica Acta 1429 (1999) 317^330326
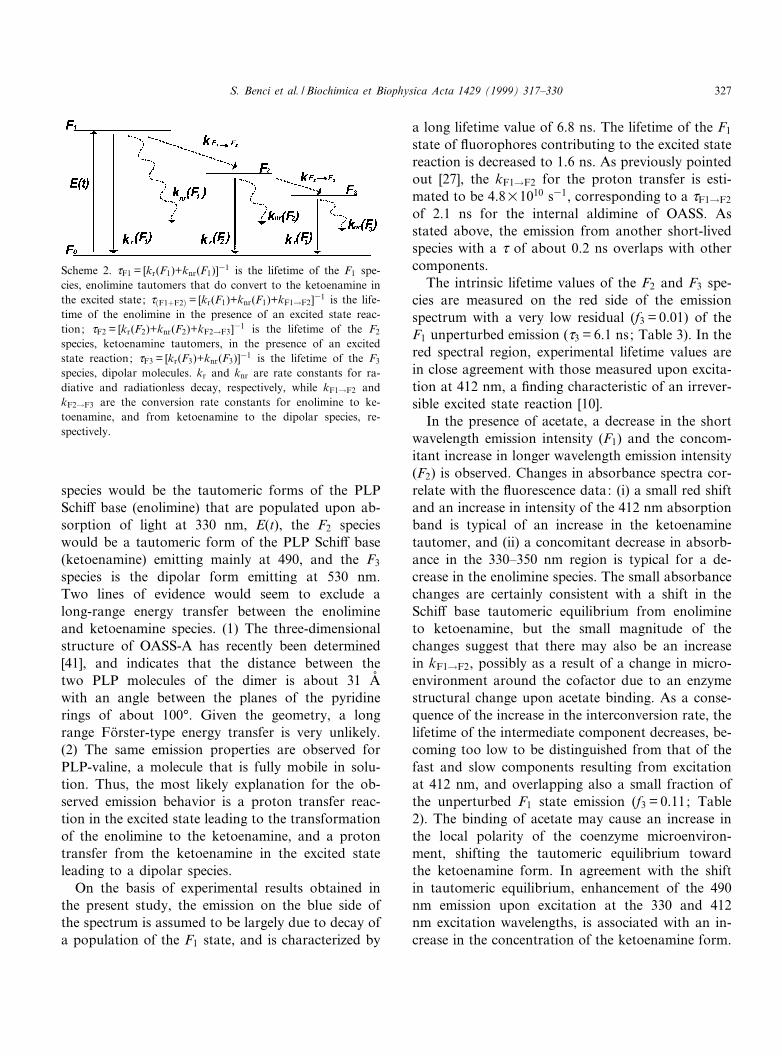
species would be the tautomeric forms of the PLPSchi¡ base (enolimine) that are populated upon ab-sorption of light at 330 nm, E(t), the F2 specieswould be a tautomeric form of the PLP Schi¡ base(ketoenamine) emitting mainly at 490, and the F3
species is the dipolar form emitting at 530 nm.Two lines of evidence would seem to exclude along-range energy transfer between the enolimineand ketoenamine species. (1) The three-dimensionalstructure of OASS-A has recently been determined[41], and indicates that the distance between thetwo PLP molecules of the dimer is about 31 Aî
with an angle between the planes of the pyridinerings of about 100³. Given the geometry, a longrange Fo«rster-type energy transfer is very unlikely.(2) The same emission properties are observed forPLP-valine, a molecule that is fully mobile in solu-tion. Thus, the most likely explanation for the ob-served emission behavior is a proton transfer reac-tion in the excited state leading to the transformationof the enolimine to the ketoenamine, and a protontransfer from the ketoenamine in the excited stateleading to a dipolar species.
On the basis of experimental results obtained inthe present study, the emission on the blue side ofthe spectrum is assumed to be largely due to decay ofa population of the F1 state, and is characterized by
a long lifetime value of 6.8 ns. The lifetime of the F1
state of £uorophores contributing to the excited statereaction is decreased to 1.6 ns. As previously pointedout [27], the kF1!F2 for the proton transfer is esti-mated to be 4.8U1010 s31, corresponding to a dF1!F2
of 2.1 ns for the internal aldimine of OASS. Asstated above, the emission from another short-livedspecies with a d of about 0.2 ns overlaps with othercomponents.
The intrinsic lifetime values of the F2 and F3 spe-cies are measured on the red side of the emissionspectrum with a very low residual (f3 = 0.01) of theF1 unperturbed emission (d3 = 6.1 ns; Table 3). In thered spectral region, experimental lifetime values arein close agreement with those measured upon excita-tion at 412 nm, a ¢nding characteristic of an irrever-sible excited state reaction [10].
In the presence of acetate, a decrease in the shortwavelength emission intensity (F1) and the concom-itant increase in longer wavelength emission intensity(F2) is observed. Changes in absorbance spectra cor-relate with the £uorescence data: (i) a small red shiftand an increase in intensity of the 412 nm absorptionband is typical of an increase in the ketoenaminetautomer, and (ii) a concomitant decrease in absorb-ance in the 330^350 nm region is typical for a de-crease in the enolimine species. The small absorbancechanges are certainly consistent with a shift in theSchi¡ base tautomeric equilibrium from enolimineto ketoenamine, but the small magnitude of thechanges suggest that there may also be an increasein kF1!F2, possibly as a result of a change in micro-environment around the cofactor due to an enzymestructural change upon acetate binding. As a conse-quence of the increase in the interconversion rate, thelifetime of the intermediate component decreases, be-coming too low to be distinguished from that of thefast and slow components resulting from excitationat 412 nm, and overlapping also a small fraction ofthe unperturbed F1 state emission (f3 = 0.11; Table2). The binding of acetate may cause an increase inthe local polarity of the coenzyme microenviron-ment, shifting the tautomeric equilibrium towardthe ketoenamine form. In agreement with the shiftin tautomeric equilibrium, enhancement of the 490nm emission upon excitation at the 330 and 412nm excitation wavelengths, is associated with an in-crease in the concentration of the ketoenamine form.
Scheme 2. dF1 = [kr(F1)+knr(F1)]31 is the lifetime of the F1 spe-cies, enolimine tautomers that do convert to the ketoenamine inthe excited state; d�F1�F2� = [kr(F1)+knr(F1)+kF1!F2]31 is the life-time of the enolimine in the presence of an excited state reac-tion; dF2 = [kr(F2)+knr(F2)+kF2!F3]31 is the lifetime of the F2
species, ketoenamine tautomers, in the presence of an excitedstate reaction; dF3 = [kr(F3)+knr(F3)]31 is the lifetime of the F3
species, dipolar molecules. kr and knr are rate constants for ra-diative and radiationless decay, respectively, while kF1!F2 andkF2!F3 are the conversion rate constants for enolimine to ke-toenamine, and from ketoenamine to the dipolar species, re-spectively.
BBAPRO 35793 29-12-98
S. Benci et al. / Biochimica et Biophysica Acta 1429 (1999) 317^330 327
Recently, the phosphorescence properties of thetwo tryptophans of wild type OASS-A, W51, andof W162, and W162 in the W51Y mutant proteinhave been characterized over the temperature range170^273 K [25]. Phosphorescence is stronglyquenched by PLP, with about 70% reduction in in-tensity and lifetime. In addition, a broad band in the450^550 nm range was observed, and assigned todelayed £uorescence of the ketoenamine tautomerof the internal Schi¡ base, sensitized by triplet-singletenergy transfer from tryptophan to the ketoenaminetautomer. Thus, the ketoenamine tautomer is themore stable species, in agreement with its long £uo-rescence lifetime value.
5. Conclusions
Emission properties of the internal aldimine Schi¡base of OASS have been studied and correlated withthe emission properties of PLP and PLP-valine Schi¡base. Overall, the emission of the PLP bound toOASS originates from the same species present inthe PLP-valine Schi¡ base. However, there is a strik-ing e¡ect of acetate, the ¢rst product of the OASSreaction, on £uorescence emission of the enzyme-bound PLP that can be accounted for by a modula-tion of the equilibrium between the enolimine andketoenamine tautomers of the Schi¡ base in the ex-cited state. (It should be noted that acetate binds notas a product, but as a dead-end inhibitor to the K-carboxylate subsite of the active site of OASS-A, toproduce its modulatory e¡ect on the equilibrium be-tween tautomers.) The resulting PLP-Schi¡ baseadopts a conformation more similar to that observedin the L-serine and L-cysteine external aldimines [27].Therefore, the role of the protein matrix is to allow amodulation of the Schi¡ base tautomeric distributionin the ground and excited states in response to li-gand-binding and catalysis [27].
Acknowledgements
The experiments making use of dye laser excitationwere performed by S.V. at the Laboratory for Fluo-rescence Dynamics (LFD) of the University of Illi-nois at Urbana-Champaign (UIUC). LFD is sup-
ported jointly by UIUC and the Division ofResearch Resources of the National Institutes ofHealth (RR03155-01). We are indebted to Prof. En-rico Gratton and Dr. T. Hazlett, Department ofPhysics, University of Illinois at Urbana, for assis-tance in these measurements. We are also grateful toProf. Klaus Schnackerz, University of Wu«rzburg,Germany, for critical reading of the manuscript.This work was supported by grants to P.F.C. fromthe National Science Foundation (MCB 9405020), agrant to S.B. and A.M. from the Italian NationalResearch Council and the Ministry of Universityand Scienti¢c and Technological Research, andGrant CRG. 900519 from the North Atlantic TreatyOrganization Scienti¢c A¡airs Division to P.F.C.,and Dr. Klaus D. Schnackerz from the Universityof Wu«rzburg, Germany.
References
[1] M. Arrio-Dupont, Etude par £uorescence de bases de Schi¡du pyridoxal, comparaison avec la L-aspartate-aminotrans-ferase, Photochem. Photobiol. 12 (1970) 297^315.
[2] M. Arrio-Dupont, The e¡ect of solvent on the £uorescenceof Schi¡ bases of pyridoxal 5P phosphate, Biochem. Biophys.Res. Commun. 44 (1971) 653^659.
[3] Y.V. Morozov, Spectroscopic properties, electronic struc-ture, and photochemical behavior of vitamin B6 and analogs,in: D. Dolphin, R. Poulson, O. Avramovic (Eds.), Coen-zymes and Cofactors, Vol. 1A, Vitamin B6, Pyridoxal Phos-phate, John Wiley and Sons, New York, 1986, pp. 132^221.
[4] C.M. Metzler, A. Cahill, D.E. Metzler, Equilibria and ab-sorption spectra of Schi¡ bases, J. Am. Chem. Soc. 102(1980) 6075^6082.
[5] R.G. Kallen, T. Korpela, A.E. Martell, Y. Matsushima,C.M. Metzler, D.E. Metzler, Y.V. Morozov, I.M. Ralston,F.A. Savin, Y.M. Torchinsky, H. Ueno, in: P. Christen,D.E. Metzler (Eds.), Transaminases, John Wiley and Sons,New York, 1985, pp. 37^108.
[6] M.J. Benecky, R.A. Copeland, T. Hayas, E.W. Lobenstine,R.P. Rava, R.A. Pascal, T.G. Spiro, Resonance Ramanspectroscopy of pyridoxal Schi¡ bases, J. Biol. Chem. 260(1985) 11663^11670.
[7] M.J. Cortijo, J. Llor, J.M. Sanchez-Ruiz, Thermodynamicconstants for tautomerism, hydration, and ionization of vi-tamin B6 compounds in water/dioxane, J. Biol. Chem. 263(1988) 17960^17969.
[8] M.A. Vazquez, F. Munoz, J. Donoso, F. Garcia Blanco,Spectroscopy study of the Schi¡ bases of dodecylaminewith pyridoxal 5P-phosphate and 5P-deoxypyridoxal, Bio-chem. J. 279 (1991) 759^767.
BBAPRO 35793 29-12-98
S. Benci et al. / Biochimica et Biophysica Acta 1429 (1999) 317^330328
[9] G. Cambron, J.M. Sevilla, T. Pineda, M. Blazquez, Fluores-cence of the Schi¡ bases of pyridoxal and pyridoxal 5P-phos-phate with L-isoleucine in aqueous solutions, J. Fluor. 6(1996) 1^6.
[10] J.R. Lakowicz, Principles of Fluorescence Spectroscopy, Ple-num Press, New York, 1983.
[11] J.M. Beechem, L. Brand, Time-resolved £uorescence decayin proteins, Annu. Rev. Biochem. 54 (1985) 43^71.
[12] F.G. Prendergast, Time-resolved £uorescence techniques:methods and applications in biology, Curr. Opin. Struct.Biol. 1 (1991) 1054^1059.
[13] M. Gonnelli, G.B. Strambini, Phosphorescence lifetime oftryptophan in proteins, Biochemistry 34 (1995) 13847^13857.
[14] J.E. Churchich, 4-Aminobutyrate aminotransferase di¡erentsusceptibility to inhibitors, microenvironment of the cofactorbinding site and distance of the catalytic sites, Eur. J. Bio-chem. 126 (1982) 507^511.
[15] A.N. Lane, The accessibility of the active site and conforma-tion states of the K2 subunit of tryptophan synthase studiedby £uorescence quenching, Eur. J. Biochem. 133 (1983) 531^538.
[16] J. Matko, S. Papp, J. Hevessy, P. Nagy, B. Somogy, Seg-mental mobility in glycogen phosphorylase b, Biochim. Bio-phys. Acta 747 (1983) 42^48.
[17] M. Sassaroli, J. Kowalczyk, E. Bucci, Probe dependence ofcorrelation times in heme-free extrinsically labeled humanhemoglobin, Arch. Biochem. Biophys. 251 (1986) 624^628.
[18] F.T. Greenaway, J.W. Ledbetter, Fluorescence lifetime andpolarization anisotropy studies of membrane surfaces withpyridoxal 5P-phosphate, Biophys. Chem. 28 (1987) 265^271.
[19] N. Rosato, G. Mei, A. Finazzi-Agro© , B. Tancini, C. Borri-Voltattorni, Time-resolved extrinsic £uorescence of aromaticL-amino-acid decarboxylase, Biochim. Biophys. Acta 996(1989) 195^198.
[20] O.S. Kwon, M. Blazquez, J.E. Churchich, Luminescencespectroscopy of pyridoxic acid and pyridoxic bound to pro-tein, Eur. J. Biochem. 219 (1994) 807^812.
[21] S. Vaccari, S. Benci, A. Peracchi, A. Mozzarelli, Time-re-solved £uorescence of pyridoxal 5P-phosphate-containing en-zymes: tryptophan synthase and O-acetylserine sulfhydry-lase, J. Fluor. 7 (1997) 135S^137S.
[22] G.B. Strambini, P. Cioni, A. Peracchi, A. Mozzarelli, Char-acterization of tryptophan and coenzyme luminescence intryptophan synthase from Salmonella typhimurium, Bio-chemistry 31 (1992) 7527^7534.
[23] G.B. Strambini, P. Cioni, A. Peracchi, A. Mozzarelli, Con-formational changes and subunit communication in trypto-phan synthase: e¡ect of substrates and substrate analogs,Biochemistry 31 (1992) 7535^7542.
[24] G.D. McClure, P.F. Cook, Product binding to the K-carbox-yl subsite results in a conformational change at the activesite of O-acetylserine sulfhydrylase: evidence from £uores-cence spectroscopy, Biochemistry 33 (1994) 1674^1683.
[25] G.B. Strambini, P. Cioni, P.F. Cook, Tryptophan lumines-cence as a probe of enzyme conformation along the O-ace-
tylserine sulfhydrylase reaction pathway, Biochemistry 35(1996) 8392^8400.
[26] P.F. Cook, C.-H. Tai, C.-C. Hwang, E.U. Woehl, M.F.Dunn, K.D. Schnackerz, Substitution of pyridoxal 5P-phos-phate in the O-acetylserine sulfhydrylase from Salmonellatyphimurium by cofactor analogs provides a test of the mech-anism proposed for the formation of the K-aminoacrylateintermediate, J. Biol. Chem. 271 (1996) 25842^25849.
[27] S. Benci, S. Vaccari, A. Mozzarelli, P.F. Cook, Time-re-solved £uorescence of O-acetylserine sulfhydrylase catalyticintermediates, Biochemistry 36 (1997) 15419^15427.
[28] S. Hara, M.A. Payne, K.D. Schnackerz, P.F. Cook, A rapidpuri¢cation procedure and computer-assisted sul¢de ionelectrode assay for O-acetylserine sulfhydrylase from Salmo-nella typhimurium, Protein Express. Purif. 1 (1990) 70^90.
[29] C.-H. Tai, S.R. Nalabolu, T.M. Jacobson, D.E. Minter, P.F.Cook, Kinetic mechanisms of the A and B isozymes of O-acetylserine sulfhydrylase from Salmonella typhimurium LT-2using natural and alternative reactants, Biochemistry 32(1993) 6433^6442.
[30] P.F. Cook, S. Hara, S. Nalabolu, K.D. Schnackerz, pH de-pendence of the absorbance and 31P NMR spectra of O-acetylserine sulfhydrylase in the absence and presence ofO-acetyl-L-serine, Biochemistry 31 (1992) 2298^2303.
[31] R.D. Spencer, G. Weber, Measurement of subnanosecond£uorescence lifetimes with a cross-correlation phase £uorom-eter, Ann. NY Acad. Sci. 158 (1969) 361^376.
[32] E. Gratton, M. Limkeman, A continuously variable fre-quency cross-correlation phase £uorometer with picosecondresolution, Biophys. J. 44 (1983) 315^324.
[33] R.D. Spencer, G. Weber, In£uence of Brownian rotationsand energy transfer upon the measurement of £uorescencelifetime, J. Chem. Phys. 52 (1970) 1654^1663.
[34] J.M. Beechem, E. Gratton, Fluorescence spectroscopy dataanalysis environment: a second generation global analysisprogram, SPIE 909 (1988) 70^81.
[35] J.R. Lakowicz, Topics in Fluorescence Spectroscopy, Vol. 2,Plenum Press, New York, 1991.
[36] J.R. Lakowicz, G. Laczko, H. Cherek, E. Gratton, M. Lim-keman, Analysis of £uorescence decay kinetics from varia-ble-frequency phase shift and modulation data, Biophys. J.46 (1984) 463^477.
[37] H.K. Miyasaka, Y. Wada, S. Ojima, N. Mataga, Femtosec-ond-picosecond laser photolysis studies on proton transferprocess of excited 1-pyrenol-triethylamine hydrogen bondingcomplex in solutions, Isr. J. Chem. 33 (1993) 183^192.
[38] R. Knohenmuss, G.R. Holtom, D. Ray, Proton transfer re-action rate as a probe of size-dependent properties of largewater clusters, Chem. Phys. Lett. 215 (1993) 188^192.
[39] K.D. Schnackerz, C.-H. Tai, J.W. Simmons, T.M. JacobsonIII, G.S. Jagannatha Rao, P.F. Cook, Identi¢cation andspectral characterization of the external aldimine of the O-acetylserine sulfhydrylase reaction, Biochemistry 34 (1995)12152^12160.
[40] T.V. Vaselova, L.A. Limareva, A.S. Cherkasov, V.I. Shiro-
BBAPRO 35793 29-12-98
S. Benci et al. / Biochimica et Biophysica Acta 1429 (1999) 317^330 329
kov, Fluorometric study of the e¡ect of solvent on the £uo-rescence spectrum of 3-amino-N-methylphthalimide, Opt.Spectrosc. 19 (1965) 39^43.
[41] P. Burkhard, G.S.J. Rao, E. Hohenester, K.D. Schnackerz,P.F. Cook, J.N. Jansonius, The three dimensional structure
of O-acetylserine sulfhydrylase from Salmonella typhimuriumat 2.2 Aî , J. Mol. Biol. 283 (1998) 111^120.
[42] S. Vaccari, S. Benci, A. Peracchi, A. Mozzarelli, Time-re-solved £uorescence of tryptophan synthase, Biophys.Chem. 61 (1996) 9^22.
BBAPRO 35793 29-12-98
S. Benci et al. / Biochimica et Biophysica Acta 1429 (1999) 317^330330
Recommended


