Delivered by Publishing Technology to: University of New South WalesIP: 149.171.195.19 On: Mon, 03 Mar 2014 23:43:33
Copyright: American Scientific Publishers
Copyright © 2014 American Scientific PublishersAll rights reservedPrinted in the United States of America
ArticleJournal of
Nanoscience and NanotechnologyVol. 14, 4918–4929, 2014
www.aspbs.com/jnn
Tribological Properties of Polypropylene Composites with
Carbon Nanotubes and Sepiolite
Victor H. Orozco1�2, Andres F. Vargas1�2, Witold Brostow1�∗, Tea Datashvili1,Betty L. López2, Kevin Mei1, and Lisa Su1� †
1Laboratory of Advanced Polymers and Optimized Materials (LAPOM), Department of Materials Science and Engineering and
Center for Advanced Research and Technology (CART), University of North Texas, Denton, TX 76207, USA2Grupo Ciencia de los Materiales, Universidad de Antioquia, Antioquía 050010, Calle 62 52 59 Medellín, Colombia
Carbon nanotubes (CNTs) and sepiolite (SEP) were modified in order to improve their compatibilitywith the polypropylene (PP) matrix. Carboxylic groups were introduced into the CNTs through anoxidative treatment and aliphatic chains were incorporated on SEP by ion exchange of a cationicsurfactant. Maleic anhydride grafted polypropylene (PPgMA) was mixed with neat PP to intro-duce polar groups into the polymer matrix. Composites including modified and non-modified fillerswere prepared by melt extrusion. Dispersion and interaction of the CNTs with the PP and PPgMAmatrices were evaluated by Raman spectroscopy while a focused ion beam/scanning electronmicroscopy (FIB/SEM) was used for SEP containing composites. Scratch resistance, microhard-ness, dynamic friction and wear were determined. Raman spectroscopy shows that the introductionof polar groups into PP matrices has a positive effect on the dispersion of modified CNTs. FIB/SEMresults show that the modification of SEP improves its dispersion in the polypropylene matrix; fillerclusters found in the PPgMA matrix are much times smaller than those in the neat PP. Despiteof SEP agglomerates in the composites, a good interaction between both phases is seen; SEPparticles are fully coated and embedded inside the PP matrix. The ‘lack of cooperation’ betweenunmodified PP and its fillers results in nanocomposites with larger residual depths; by contrast,PPgMA does ‘cooperate’ with its fillers so that the nanocomposites in scratch resistance testing havesmaller residual depths Rh than the neat PPgMA. Addition of the fillers to PPgMA also increasesthe hardness. As for wear rates, some our fillers provide higher and some lower wear rates than PP.
Keywords: Polypropylene, Sepiolite, Carbon Nanotubes, Nanohybrids, Scratch Resistance,Wear, Dynamic Friction.
1. INTRODUCTIONPolymers and polymer-based materials (PBMs) have
emerged as a predominant class of materials in a multi-
tude of applications ranging from simple plastic bottles
to great engineering achievements such as space shuttles
and the Boeing 787 Dreamliner. Among PBMs, polypropy-
lene (PP) remains an industrial favorite due to its low
cost and accessibility as well as its high strength and high
modulus.1 PP has applications in a variety of industries,
ranging from automobiles via textiles to medical technolo-
gies. However, PP suffers from low impact resistance and
∗Author to whom correspondence should be addressed.†Present address: Now at Stanford University, Stanford, CA 94305,
USA.
low service temperature range. One possible solution to
compensate for these drawbacks is the use of additives
or reinforcements2 such as fibers or fillers. Properties of
the resulting composites are influenced by the nature of
the components, dispersion and the shape of the filler, the
morphology of the system, and compatibility between the
phases.3–22 In particular, interfaces are important.23–25 Thus
a large variety of properties can be obtained solely by
alteration of one of these factors.
Despite progress made, we need more experimental data
to understand the influence of various fillers on compo-
site properties. While significant effort has already been
expended on mechanical properties, in all cases when
polymeric parts are in motion wear is especially impor-
tant. Rabinowicz26 has argued convincingly about the
4918 J. Nanosci. Nanotechnol. 2014, Vol. 14, No. 7 1533-4880/2014/14/4918/012 doi:10.1166/jnn.2014.8289
Delivered by Publishing Technology to: University of New South WalesIP: 149.171.195.19 On: Mon, 03 Mar 2014 23:43:33
Copyright: American Scientific Publishers
Orozco et al. Tribological Properties of Polypropylene Composites with Carbon Nanotubes and Sepiolite
importance of wear for economic well-being of indus-
trial companies to prevent economic crises in entire
countries.
In this situation we decided to investigate the effects of
two types of nano fillers, namely carbon nanotubes (CNTs)
and sepiolite (SEP) on tribological performance of PP and
PP containing composites.
For development of PP + CNTs and/or PP + SEP
nanohybrids with desirable properties, it is crucial to
improve interfacial bonding. Namely, CNTs and sepiolite
must overcome incompatibility and poor dispersion within
the PP matrix. In order to address these issues we have
used two different approaches. The first was functional-
ization of the fillers, a process by which the nanoparti-
cles undergo surface modification to improve molecular
interactions;14 the second approach consists in blending
bare and functionalized fillers with maleic anhydride mod-
ified PP, obtaining PPgMA.20
2. EXPERIMENTAL PART2.1. MaterialsCommercial grade PP and PPgMA (Epolene G-3003)
with 0.8 wt.% of maleic acid (MA) were received from
Dow Chemical (DOW h777-25R Polypropylene Resin)
and Eastman, respectively. Multi-wall carbon nanotubes
(CNTs) with 90 wt.% purity were obtained from Nanocyl.
The CNTs were approximately 10 nm wide and 0.1–
10 �m in length. Micronized sepiolite (SEP) was pur-
chased from the Spanish company Tolsa while nitric acid
and cethyl trymethyl ammonium bromide (CTABr) were
received from Sigma-Aldrich.
All the chemicals were analytical grades and have been
used as received.
2.2. Characterization Techniques2.2.1. Dynamic Friction from a Pin-on-Disk TribometerDynamic friction has been determined using a Nanovea
pin-on-disk tribometer from Micro Photonics Inc. A pin
applies a vertical force to a material surface, with that
surface moving on a circular disk at a constant angular
speed. The equipment provides also a capability to apply
lubricants but this option was not used. Each test was con-
ducted under 5.0 N, 10.0 N and 15.0 N of normal force, at
21±2 �C, 1 atm. Stainless steel 302 (SS302) and tungsten
carbide (WC) balls were 0.32 mm in diameter. Tungsten
carbide is much harder than steel, hence different behav-
ior of the surfaces investigated with respect to those two
pins was expected. The disk spun at 100 rpm, to cover
a distance of 3000 m in about 23 minutes for a total
of 2300 revolutions. Friction and other tribological tech-
niques applied to polymers have been reviewed before.27–29
2.2.2. WearWe have calculated the wear rates associated with tracks
obtained through tribometry testing. The wear rate W for
each track is calculated as:
W = 2�rA/�Fd� (1)
where r is the track radius, A is the track cross-sectional
area, F is the load and d is the total distance covered
in the tribometry test. The r.h.s. numerator represents the
total volume displaced by the tribometer in the test.
2.2.3. Vickers’ MicrohardnessMicrohardness tests were performed with a Shimadzu
Microhardness Tester to determine the Vickers hardness
number hVickers. Each sample was indented for 10 secconds
under 3 different loads: 100 N, 300 N and 500 N. After
measuring the diameter of the indentation, hVickers was cal-
culated as
hVickers = 1854�4 ·P/d2 (2)
where P is the load and d is the mean diagonal of the
indentation. The data reported represent the averages of
five indentations each.
2.2.4. Thermogravimetric Analysis �TGA�TGA equipment from a TA Instruments Q500 was used
to study the thermal stability of the composites and the
progress of CNTs oxidation process. The samples were
heated from 25 to 800 �C at the heating rate of 10 �C/min.
The technique has been well described by Lucas and her
colleagues,30 Menard,31 and Gedde.32
2.2.5. Fourier Transform Infrared Spectroscopy �FTIR�The FTIR spectra were recorded with a Perkin-Elmer
Spectrum One spectrometer; powdered samples were dis-
persed in KBr and thin disks were prepared and analyzed
in the transmission mode.
2.2.6. Raman SpectroscopyAn Almega XR Raman Spectrometer equipped with a
532 nm laser was used to obtain the Raman spectra of the
samples within the 4000–100 cm−1 range. Collect expo-
sure, preview exposure, and sample exposure times were
respectively 10, 0.5 and 4 seconds.
2.2.7. Scratch ResistanceA Micro-Scratch Tester (MST) from CSM, Peseux,
Switzerland was used. Each sample underwent linearly
progressive scratch testing using the following parame-
ters: initial load 5.0 N, final load 30.0 N, loading rate
10.0 N/min. The conical diamond indenter had a diameter
of 200 �m and a cone angle of 120�. The scratch testing
conditions were identical for all samples. This technique
has been described before.28�29
2.2.8. Focused Ion Beam/Scanning ElectronMicroscope �FIB/SEM�
We have used a technique described before.20�33�34 The FEI
Nova 200 NanoLab (a dual column ultra-high resolution
J. Nanosci. Nanotechnol. 14, 4918–4929, 2014 4919
Delivered by Publishing Technology to: University of New South WalesIP: 149.171.195.19 On: Mon, 03 Mar 2014 23:43:33
Copyright: American Scientific Publishers
Tribological Properties of Polypropylene Composites with Carbon Nanotubes and Sepiolite Orozco et al.
field emission scanning electron microscope (SEM) and
focused ion beam (FIB)) were used to study the morphol-
ogy of the composites. A small fraction of the samples
were mounted on a copper stub and coated with a thin
layer of gold and palladium to avoid electrostatic charging
during examination.
2.3. Treatment of Filler MaterialsWe have used carboxylic groups and alkyl chains of
CTABr to modify the surfaces of CNTs and sepiolite,
respectively.
2.3.1. Oxidation of CNTsCNTs were dispersed in nitric acid via ultrasonic bath in
a weight ratio of 25:300 for 30 min at 80 �C. Afterwards,the CNTs were refluxed over 48 hours. At the end of the
process the oxidized CNTs (CNTOs) were washed several
times until neutral pH was obtained. The CNTOs were
dried in a vacuum oven at 40 �C.
2.3.2. Functionalization of Sepiolite1.1 g of CTABr was dissolved in 450 mL of water and
continuously stirred at 35 �C. After 2 hours of mixing,
30 g of SEP were added into the solution and the mixing
was maintained for one more hour. The slurry was left
overnight, then it was centrifuged and the functionalized
sepiolite (SEPF) was vacuum dried at 40 �C overnight.
2.4. Sample PreparationPrior to processing the composites, we had manually
mixed pelletized PP with pelletized PPgMA and with
either powdered SEP, SEPF, CNTs or CNTOs. Using a co-
rotating intermeshing twin screw extruder (Thermo Haake,
diameter of the screw= 16 mm, length/diameter= L/D=25) at 100 rpm, we melt-extruded the samples while main-
taining temperature of the extruder at 110, 170, 200, 200
and 200 �C in the five zones from hopper to the die. Details
Table I. The sample compositions.
PP PPgMA CNT Sepiolite CNTO Sepiolite
Sample (%) (%) (%) (%) (%) func (%)
PP 100 0 0 0 0 0
PP+PPgMA 90 10 0 0 0 0
PP+CNT 99.25 0 0.75 0 0 0
PP+PPgMA+ 89.25 10 0.75 0 0 0
CNT
PP+SEP 99.25 0 0 0.75 0 0
PP+PPgMA+ 89.25 10 0 0.75 0 0
SEP
PPCNTO 99.25 0 0 0 0.75 0
PP+PPgMA+ 89.25 10 0 0 0.75 0
CNTO
PP+SEPF 99.25 0 0 0 0 0.75
PP+PPgMA+ 89.25 10 0 0 0 0.75
SEPF
have been described by Vargas and coworkers.21 The sam-
ple compositions are listed in Table I.
3. MODIFICATION OF THE CNTs AND SEPThermogravimetric analysis (TGA) and Fourier-transform
infrared (FTIR) techniques have been used to confirm
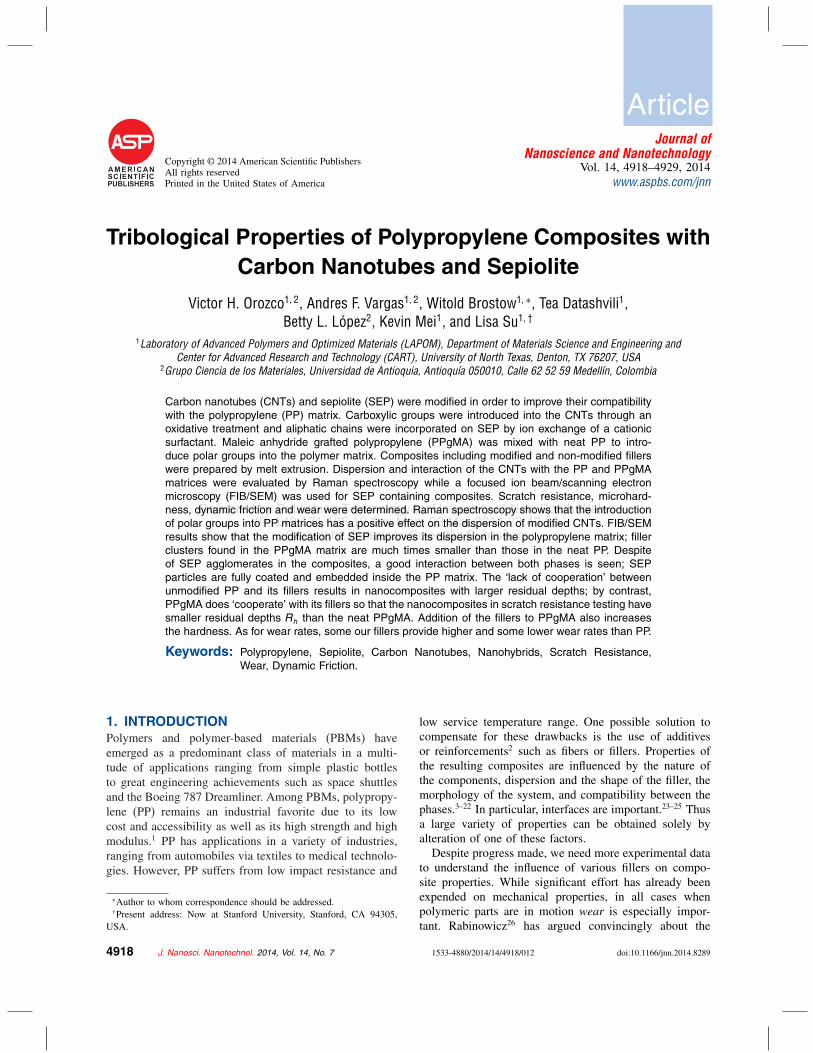
functionalization. For CNTOs, we used TGA to observe
increased water desorption due to formation of hydrophilic
moieties. In Figure 1, CNTOs show strong decomposition
at temperatures much below those at which CNTs decom-
pose, due to oxidative scission and shortening of CNTs.35�36
Thus, oxidation of CNTs decreases thermal stability.
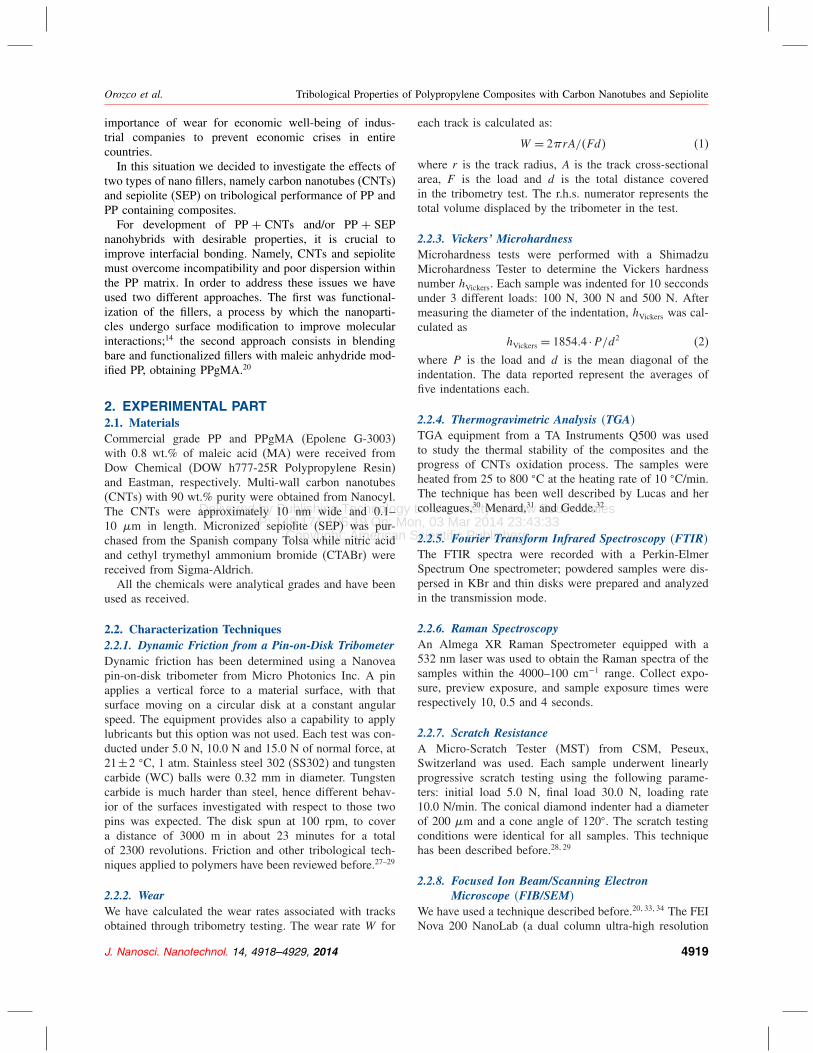
Interactions between the modifier and SEP surfaces
were monitored by FTIR spectroscopy. Figure 2 shows
FTIR spectra of the SEP before and after modification.
SEP is a hydrous magnesium silicate, namely
(Si12Mg8O30�(OH)4(OH2�4 · 8H2O.37 In order to improve
the dispersion of the particles within the hydrophobic poly-
mer matrix, SEP was treated with a cationic surfactant
(CTABr), which has the capability to exchange Mg+2 ions
of the SEP by positively charged amine groups and at the
same time introducing alkyl chains from cethyl group,19
that can enhance the compatibility of SEP with PP.38
As we see in Figure 2, after the cationic exchange treat-
ment two new peaks appeared at 2926 and 2853 cm−1;
they correspond to the C H stretching—what confirms
the successful ionic exchange of CTABr on SEP.
Figure 1. TGA of CNTs before (CNT) and after oxidation (CNO).
Figure 2. FTIR of sepiolite before and after modification.
4920 J. Nanosci. Nanotechnol. 14, 4918–4929, 2014
Delivered by Publishing Technology to: University of New South WalesIP: 149.171.195.19 On: Mon, 03 Mar 2014 23:43:33
Copyright: American Scientific Publishers
Orozco et al. Tribological Properties of Polypropylene Composites with Carbon Nanotubes and Sepiolite
4. FILLER DISPERSION ANALYSIS BYRAMAN SPECTROSCOPY AND FIB/SEM
Raman spectroscopy is a convenient tool for character-
ization of polymer+CNTs nanohybrids. We have used
Raman spectroscopy with OMNIC �s mapping capability
to identify the regions filled with CNTs and to analyze
dispersion of the filler in the polymer matrix.
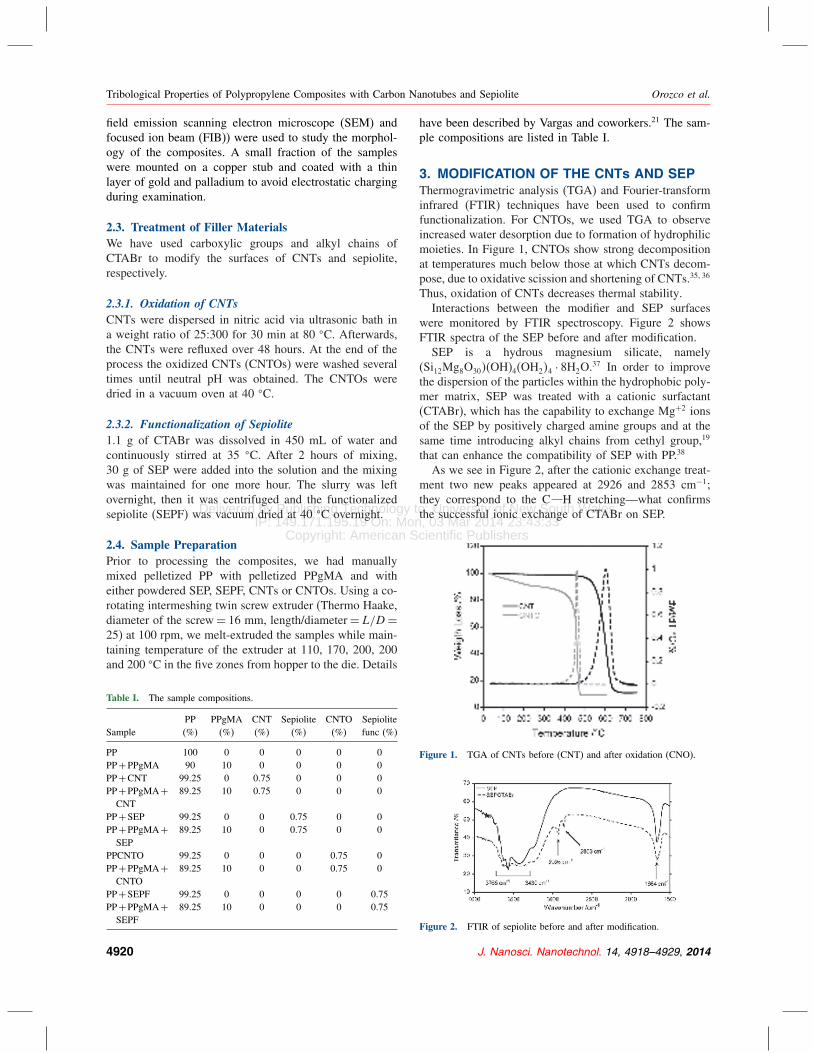
Figure 3 presents the Raman spectra of CNTs, PP,
PPgMA and their composites. In contrast to neat PP and
PPgMA, two new peaks were found for CNTs contain-
ing samples at the spectral range of 1200–1700 cm−1.
A Raman band around 1598 cm−1 is associated with the Gband or tangential mode which corresponds to the C C
stretching mode in the graphitic plane. There is a very
small band at 1300 cm−1 that is associated with the Dband; it is the defect mode that reflects the presence of
disordered graphite structures.
After modification of CNTs, the G band becomes
smaller. Weakening and slight shifting of the band can
be attributed to disentanglement of nanotubes and subse-
quent dispersion in the PP matrix—a consequence of better
polymer penetration into the modified nanotubes bundles
during the melt mixing process.
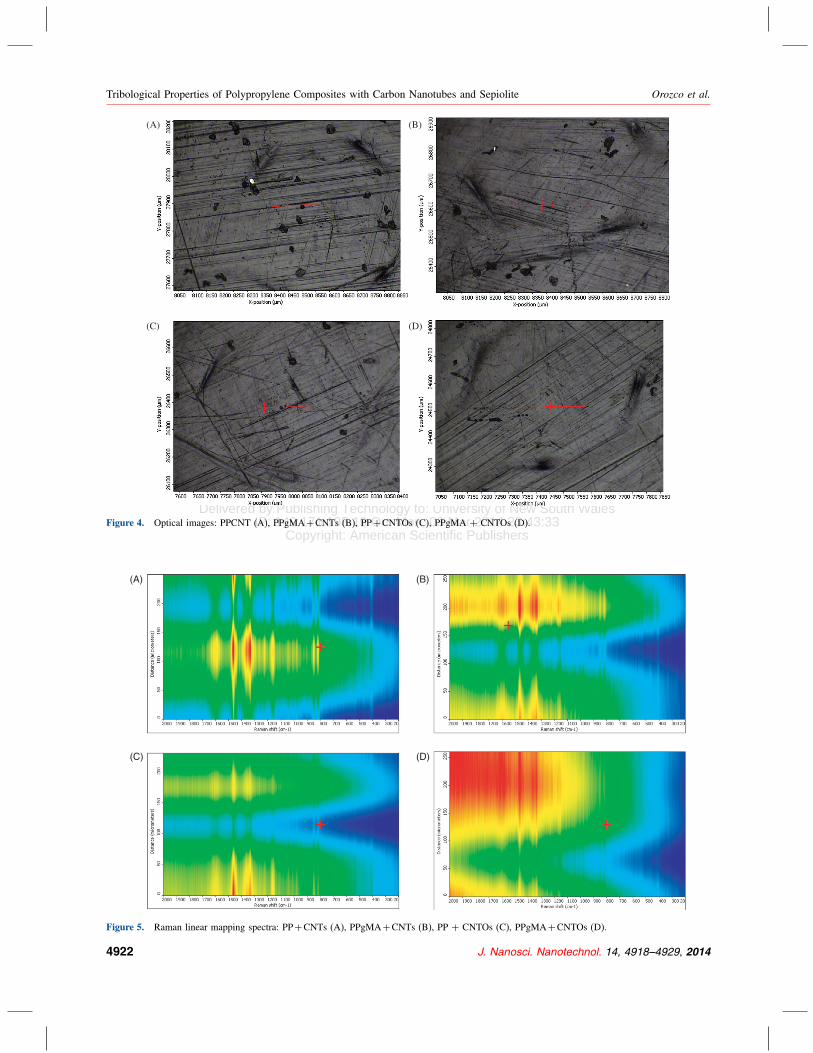
Distribution analysis of the CNTs inside PP and PPgMA
was conducted via Raman mapping. We have also used an
Olympus BX51 microscope to collect the surface images of
the composites during Raman linear mapping; see Figure 4.
In contrast to PP+CNTs samples, we observed less par-
ticles agglomeration for PP and PPgMA composites with
modified CNTs. From 50 �m scale surface image of PP+CNTs band, we see numerous black spots attributed to
4000 3500 3000 2500 2000 1500 1000 500
0
PPPPgMAPPCNTPPgMACNTPPCNTOPPgMACNTO
Raman Shift/(cm–1)
Ram
an In
tens
ity
Figure 3. Raman spectra of PP and nanocomposites.
nanotube agglomerates in Figure 4(A). Microscopic eval-
uation of the composite surfaces shows improved CNTs
dispersion after modification of CNTs and hydrophobic
nature of PP. Overall, the best uniformity of particles dis-
persion is found for the sample based on modified filler
and modified PP. Thus, the introduction of polar groups
into PP matrix has a positive effect on dispersion of CNTs.
Figure 5 presents Raman linear mapping spectra.
The intensity of the Raman band is shown in col-
ors, with red representing the most intense CNTs bands
and blue indicating virtually no spectral intensity for that
Raman band. CNTs dispersion in PP and PPgMA phases
were investigated using linear mapping data. One calcu-
lates a correlation between the sample map spectrum and
a specific reference spectrum. In this case we have used
the ‘naked’ CNTs spectrum as a reference. The composite
with a higher intensity value indicates a greater similarity
to the CNT as a reference spectrum. A correlation value of
1.0 (or a red color) indicates that the spectrum from that
region of the map and the reference spectrum are nearly
identical. Figure 5 shows that the CNTOs are better dis-
persed than non-oxidized ones, although CNTs shows also
good dispersion in the presence of PPgMA.
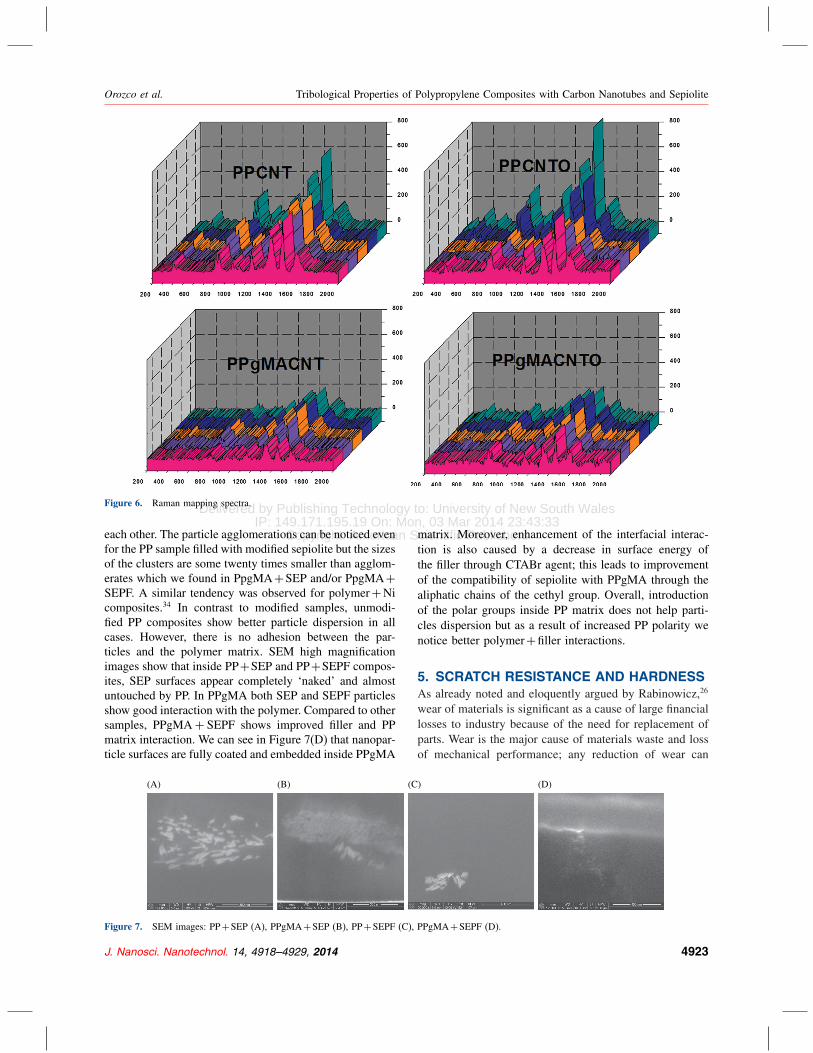
Linear mapping displayed in Figure 6 was performed
using a 532 nm laser with 10 s exposure time per 10 �msize step, with a total of 5 collection points.
From the 3D images of Raman spectra we can observe
changes in intensity of the characteristic C C stretch-
ing modes of the graphitic plane at approximately 1598
cm−1 spectrum range for a total of 5 collection points.
We also see from Figure 6 that the Raman intensity peaks
at ∼1600 cm−1 are quite flat and level with a relatively
small standard deviation of the normalized Raman inten-
sity for the PPgMA+CNTs and PPgMA+CNTOs sam-
ples, indicating that the nanotubes are well distributed in
the PPgMA matrix. In contrast, there are several big peaks
in the Raman map of PP+CNTs, showing that in this
material the nanotubes are poorly dispersed. From Raman
linear mapping we find improved but still not quite uni-
form filler dispersion for unmodified PP samples filled
with oxidized CNTs.
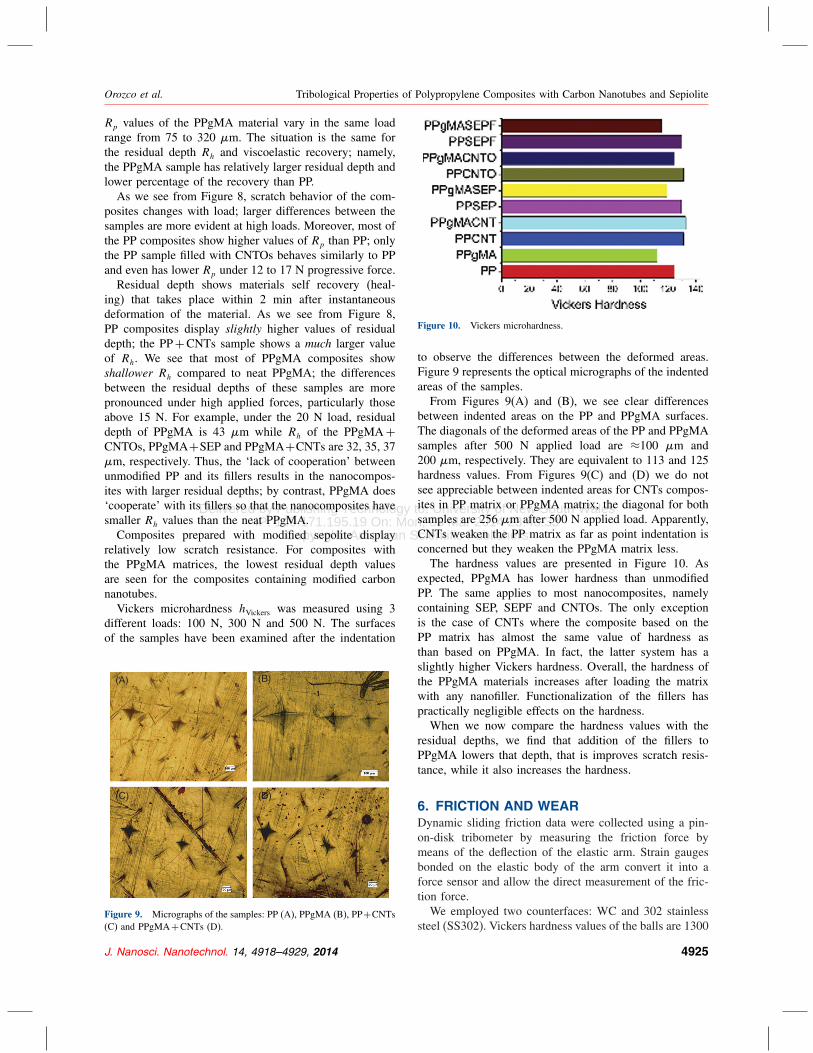
Let us return now to the composites filled with SEP
particles. For these composites we used FIB/SEM to inves-
tigate the dispersion of the filler particles in the PP and
PPgMA phases. SEM images of the composites at a length
scale of 300 and 400 nm are presented in Figure 7.
Figure 7 shows that either SEP particles treatment or PP
phase modification prevents particle agglomeration. Com-
pared to the neat PP matrix, more particle agglomeration is
seen for PPgMA samples. We infer from these micrographs
that the polar groups of the polymer matrix do not promote
uniform SEP particle dispersion in the polymer matrix. For
PPgMA composites we see agglomeration of SEP parti-
cles and formation of ≈ 600 nm size clusters. This while
in PP+SEP composites these particles are separated from
J. Nanosci. Nanotechnol. 14, 4918–4929, 2014 4921
Delivered by Publishing Technology to: University of New South WalesIP: 149.171.195.19 On: Mon, 03 Mar 2014 23:43:33
Copyright: American Scientific Publishers
Tribological Properties of Polypropylene Composites with Carbon Nanotubes and Sepiolite Orozco et al.
(A) (B)
(C) (D)
Figure 4. Optical images: PPCNT (A), PPgMA+CNTs (B), PP+CNTOs (C), PPgMA + CNTOs (D).
(A)
(C) (D)
(B)
Figure 5. Raman linear mapping spectra: PP+CNTs (A), PPgMA+CNTs (B), PP + CNTOs (C), PPgMA+CNTOs (D).
4922 J. Nanosci. Nanotechnol. 14, 4918–4929, 2014
Delivered by Publishing Technology to: University of New South WalesIP: 149.171.195.19 On: Mon, 03 Mar 2014 23:43:33
Copyright: American Scientific Publishers
Orozco et al. Tribological Properties of Polypropylene Composites with Carbon Nanotubes and Sepiolite
Figure 6. Raman mapping spectra.
each other. The particle agglomerations can be noticed even
for the PP sample filled with modified sepiolite but the sizes
of the clusters are some twenty times smaller than agglom-
erates which we found in PpgMA+SEP and/or PpgMA+SEPF. A similar tendency was observed for polymer+Ni
composites.34 In contrast to modified samples, unmodi-
fied PP composites show better particle dispersion in all
cases. However, there is no adhesion between the par-
ticles and the polymer matrix. SEM high magnification
images show that inside PP+SEP and PP+SEPF compos-
ites, SEP surfaces appear completely ‘naked’ and almost
untouched by PP. In PPgMA both SEP and SEPF particles
show good interaction with the polymer. Compared to other
samples, PPgMA+ SEPF shows improved filler and PP
matrix interaction. We can see in Figure 7(D) that nanopar-
ticle surfaces are fully coated and embedded inside PPgMA
(A) (B) (C) (D)
Figure 7. SEM images: PP+SEP (A), PPgMA+SEP (B), PP+SEPF (C), PPgMA+SEPF (D).
matrix. Moreover, enhancement of the interfacial interac-
tion is also caused by a decrease in surface energy of
the filler through CTABr agent; this leads to improvement
of the compatibility of sepiolite with PPgMA through the
aliphatic chains of the cethyl group. Overall, introduction
of the polar groups inside PP matrix does not help parti-
cles dispersion but as a result of increased PP polarity we
notice better polymer+filler interactions.
5. SCRATCH RESISTANCE AND HARDNESS
As already noted and eloquently argued by Rabinowicz,26
wear of materials is significant as a cause of large financial
losses to industry because of the need for replacement of
parts. Wear is the major cause of materials waste and loss
of mechanical performance; any reduction of wear can
J. Nanosci. Nanotechnol. 14, 4918–4929, 2014 4923
Delivered by Publishing Technology to: University of New South WalesIP: 149.171.195.19 On: Mon, 03 Mar 2014 23:43:33
Copyright: American Scientific Publishers
Tribological Properties of Polypropylene Composites with Carbon Nanotubes and Sepiolite Orozco et al.
result in considerable savings. Further, lowering wear will
result in materials and components rejected less frequently
and thus in lower contamination of the environment.
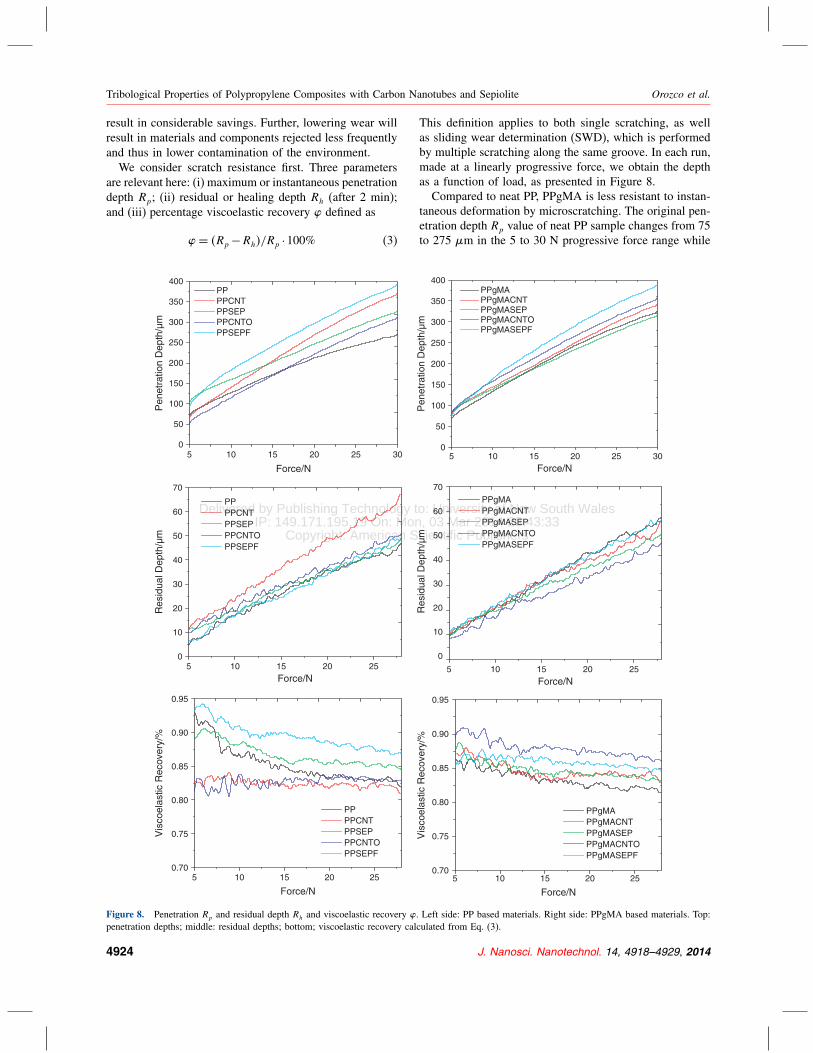
We consider scratch resistance first. Three parameters
are relevant here: (i) maximum or instantaneous penetration
depth Rp; (ii) residual or healing depth Rh (after 2 min);
and (iii) percentage viscoelastic recovery � defined as
� = �Rp−Rh�/Rp ·100% (3)
5 10 15 20 25 300
50
100
150
200
250
300
350
400
Pen
etra
tion
Dep
th/μ
m
Force/N
PPPPCNTPPSEPPPCNTOPPSEPF
5 10 15 20 25 300
50
100
150
200
250
300
350
400
Pen
etra
tion
Dep
th/μ
m
Force/N
PPgMAPPgMACNTPPgMASEPPPgMACNTOPPgMASEPF
5 10 15 20 250
10
20
30
40
50
60
70
Res
idua
l Dep
th/μ
m
Force/N5 10 15 20 25
0
10
20
30
40
50
60
70
Res
idua
l Dep
th/μ
m
Force/N
PPPPCNTPPSEPPPCNTOPPSEPF
PPgMAPPgMACNTPPgMASEPPPgMACNTOPPgMASEPF
5 10 15 20 250.70
0.75
0.80
0.85
0.90
0.95
Vis
coel
astic
Rec
over
y/%
Force/N5 10 15 20 25
Force/N
PPPPCNTPPSEPPPCNTOPPSEPF
0.70
0.75
0.80
0.85
0.90
0.95
Vis
coel
astic
Rec
over
y/%
PPgMAPPgMACNTPPgMASEPPPgMACNTOPPgMASEPF
Figure 8. Penetration Rp and residual depth Rh and viscoelastic recovery �. Left side: PP based materials. Right side: PPgMA based materials. Top:
penetration depths; middle: residual depths; bottom; viscoelastic recovery calculated from Eq. (3).
This definition applies to both single scratching, as well
as sliding wear determination (SWD), which is performed
by multiple scratching along the same groove. In each run,
made at a linearly progressive force, we obtain the depth
as a function of load, as presented in Figure 8.
Compared to neat PP, PPgMA is less resistant to instan-
taneous deformation by microscratching. The original pen-
etration depth Rp value of neat PP sample changes from 75
to 275 �m in the 5 to 30 N progressive force range while
4924 J. Nanosci. Nanotechnol. 14, 4918–4929, 2014
Delivered by Publishing Technology to: University of New South WalesIP: 149.171.195.19 On: Mon, 03 Mar 2014 23:43:33
Copyright: American Scientific Publishers
Orozco et al. Tribological Properties of Polypropylene Composites with Carbon Nanotubes and Sepiolite
Rp values of the PPgMA material vary in the same load
range from 75 to 320 �m. The situation is the same for
the residual depth Rh and viscoelastic recovery; namely,
the PPgMA sample has relatively larger residual depth and
lower percentage of the recovery than PP.
As we see from Figure 8, scratch behavior of the com-
posites changes with load; larger differences between the
samples are more evident at high loads. Moreover, most of
the PP composites show higher values of Rp than PP; only
the PP sample filled with CNTOs behaves similarly to PP
and even has lower Rp under 12 to 17 N progressive force.
Residual depth shows materials self recovery (heal-
ing) that takes place within 2 min after instantaneous
deformation of the material. As we see from Figure 8,
PP composites display slightly higher values of residual
depth; the PP+CNTs sample shows a much larger value
of Rh. We see that most of PPgMA composites show
shallower Rh compared to neat PPgMA; the differences
between the residual depths of these samples are more
pronounced under high applied forces, particularly those
above 15 N. For example, under the 20 N load, residual
depth of PPgMA is 43 �m while Rh of the PPgMA+CNTOs, PPgMA+SEP and PPgMA+CNTs are 32, 35, 37
�m, respectively. Thus, the ‘lack of cooperation’ between
unmodified PP and its fillers results in the nanocompos-
ites with larger residual depths; by contrast, PPgMA does
‘cooperate’ with its fillers so that the nanocomposites have
smaller Rh values than the neat PPgMA.
Composites prepared with modified sepolite display
relatively low scratch resistance. For composites with
the PPgMA matrices, the lowest residual depth values
are seen for the composites containing modified carbon
nanotubes.
Vickers microhardness hVickers was measured using 3
different loads: 100 N, 300 N and 500 N. The surfaces
of the samples have been examined after the indentation
(A) (B)
(C) (D)
Figure 9. Micrographs of the samples: PP (A), PPgMA (B), PP+CNTs
(C) and PPgMA+CNTs (D).
Figure 10. Vickers microhardness.
to observe the differences between the deformed areas.
Figure 9 represents the optical micrographs of the indented
areas of the samples.
From Figures 9(A) and (B), we see clear differences
between indented areas on the PP and PPgMA surfaces.
The diagonals of the deformed areas of the PP and PPgMA
samples after 500 N applied load are ≈100 �m and
200 �m, respectively. They are equivalent to 113 and 125
hardness values. From Figures 9(C) and (D) we do not
see appreciable between indented areas for CNTs compos-
ites in PP matrix or PPgMA matrix; the diagonal for both
samples are 256 �m after 500 N applied load. Apparently,
CNTs weaken the PP matrix as far as point indentation is
concerned but they weaken the PPgMA matrix less.
The hardness values are presented in Figure 10. As
expected, PPgMA has lower hardness than unmodified
PP. The same applies to most nanocomposites, namely
containing SEP, SEPF and CNTOs. The only exception
is the case of CNTs where the composite based on the
PP matrix has almost the same value of hardness as
than based on PPgMA. In fact, the latter system has a
slightly higher Vickers hardness. Overall, the hardness of
the PPgMA materials increases after loading the matrix
with any nanofiller. Functionalization of the fillers has
practically negligible effects on the hardness.
When we now compare the hardness values with the
residual depths, we find that addition of the fillers to
PPgMA lowers that depth, that is improves scratch resis-
tance, while it also increases the hardness.
6. FRICTION AND WEARDynamic sliding friction data were collected using a pin-
on-disk tribometer by measuring the friction force by
means of the deflection of the elastic arm. Strain gauges
bonded on the elastic body of the arm convert it into a
force sensor and allow the direct measurement of the fric-
tion force.
We employed two counterfaces: WC and 302 stainless
steel (SS302). Vickers hardness values of the balls are 1300
J. Nanosci. Nanotechnol. 14, 4918–4929, 2014 4925
Delivered by Publishing Technology to: University of New South WalesIP: 149.171.195.19 On: Mon, 03 Mar 2014 23:43:33
Copyright: American Scientific Publishers
Tribological Properties of Polypropylene Composites with Carbon Nanotubes and Sepiolite Orozco et al.
0 5 10 15 20 25 300.00
0.04
0.08
0.12
0.16
0.20
0.24
0.28
Fric
tion
Distance/m
PP PPCNT PPSEP PPCNTO PPSEPF
0 5 10 15 20 25 300.00
0.04
0.08
0.12
0.16
0.20
0.24
0.28
Fric
tion
Distance/m
PPgMAPPgMACNTPPgMASEPPPgMACNTOPPgMASEPF
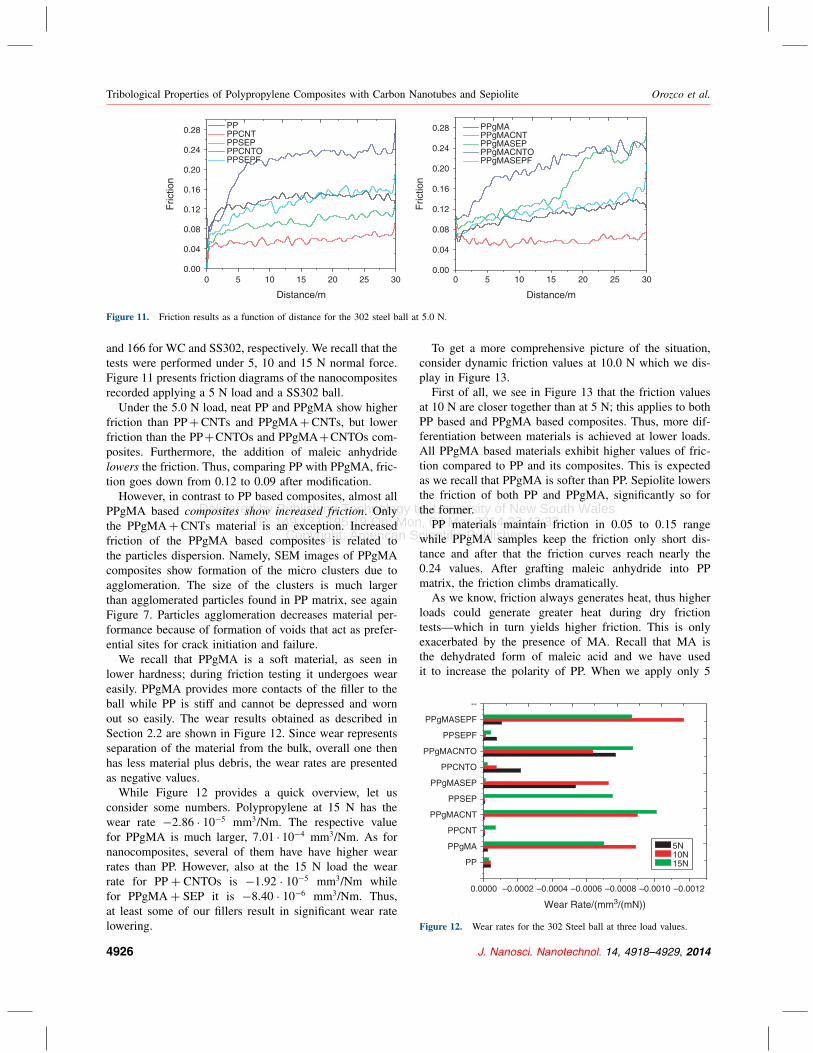
Figure 11. Friction results as a function of distance for the 302 steel ball at 5.0 N.
and 166 for WC and SS302, respectively. We recall that the
tests were performed under 5, 10 and 15 N normal force.
Figure 11 presents friction diagrams of the nanocomposites
recorded applying a 5 N load and a SS302 ball.
Under the 5.0 N load, neat PP and PPgMA show higher
friction than PP+CNTs and PPgMA+CNTs, but lower
friction than the PP+CNTOs and PPgMA+CNTOs com-
posites. Furthermore, the addition of maleic anhydride
lowers the friction. Thus, comparing PP with PPgMA, fric-
tion goes down from 0.12 to 0.09 after modification.
However, in contrast to PP based composites, almost all
PPgMA based composites show increased friction. Onlythe PPgMA+CNTs material is an exception. Increased
friction of the PPgMA based composites is related to
the particles dispersion. Namely, SEM images of PPgMA
composites show formation of the micro clusters due to
agglomeration. The size of the clusters is much larger
than agglomerated particles found in PP matrix, see again
Figure 7. Particles agglomeration decreases material per-
formance because of formation of voids that act as prefer-
ential sites for crack initiation and failure.
We recall that PPgMA is a soft material, as seen in
lower hardness; during friction testing it undergoes wear
easily. PPgMA provides more contacts of the filler to the
ball while PP is stiff and cannot be depressed and worn
out so easily. The wear results obtained as described in
Section 2.2 are shown in Figure 12. Since wear represents
separation of the material from the bulk, overall one then
has less material plus debris, the wear rates are presented
as negative values.
While Figure 12 provides a quick overview, let us
consider some numbers. Polypropylene at 15 N has the
wear rate −2�86 · 10−5 mm3/Nm. The respective value
for PPgMA is much larger, 7�01 · 10−4 mm3/Nm. As for
nanocomposites, several of them have have higher wear
rates than PP. However, also at the 15 N load the wear
rate for PP + CNTOs is −1�92 · 10−5 mm3/Nm while
for PPgMA+ SEP it is −8�40 · 10−6 mm3/Nm. Thus,
at least some of our fillers result in significant wear rate
lowering.
To get a more comprehensive picture of the situation,
consider dynamic friction values at 10.0 N which we dis-
play in Figure 13.
First of all, we see in Figure 13 that the friction values
at 10 N are closer together than at 5 N; this applies to both
PP based and PPgMA based composites. Thus, more dif-
ferentiation between materials is achieved at lower loads.
All PPgMA based materials exhibit higher values of fric-
tion compared to PP and its composites. This is expected
as we recall that PPgMA is softer than PP. Sepiolite lowers
the friction of both PP and PPgMA, significantly so for
the former.
PP materials maintain friction in 0.05 to 0.15 range
while PPgMA samples keep the friction only short dis-
tance and after that the friction curves reach nearly the
0.24 values. After grafting maleic anhydride into PP
matrix, the friction climbs dramatically.
As we know, friction always generates heat, thus higher
loads could generate greater heat during dry friction
tests—which in turn yields higher friction. This is only
exacerbated by the presence of MA. Recall that MA is
the dehydrated form of maleic acid and we have used
it to increase the polarity of PP. When we apply only 5
PP
PPgMA
PPCNT
PPgMACNT
PPSEP
PPgMASEP
PPCNTO
PPgMACNTO
PPSEPF
PPgMASEPF
--
0.0000 –0.0002 –0.0004 –0.0006 –0.0008 –0.0010 –0.0012
Wear Rate/(mm3/(mN))
5N10N15N
Figure 12. Wear rates for the 302 Steel ball at three load values.
4926 J. Nanosci. Nanotechnol. 14, 4918–4929, 2014
Delivered by Publishing Technology to: University of New South WalesIP: 149.171.195.19 On: Mon, 03 Mar 2014 23:43:33
Copyright: American Scientific Publishers
Orozco et al. Tribological Properties of Polypropylene Composites with Carbon Nanotubes and Sepiolite
0 5 10 15 20 25 300.00
0.05
0.10
0.15
0.20
0.25
0.30F
rictio
n
Distance/m
PP PPCNT PPSEP PPCNTO PPSEPF
0 5 10 15 20 25 300.00
0.05
0.10
0.15
0.20
0.25
0.30
Fric
tion
Distance/m
PPgMA PPgMACNT PPgMASEP PPgMACNTO PPgMASEPF
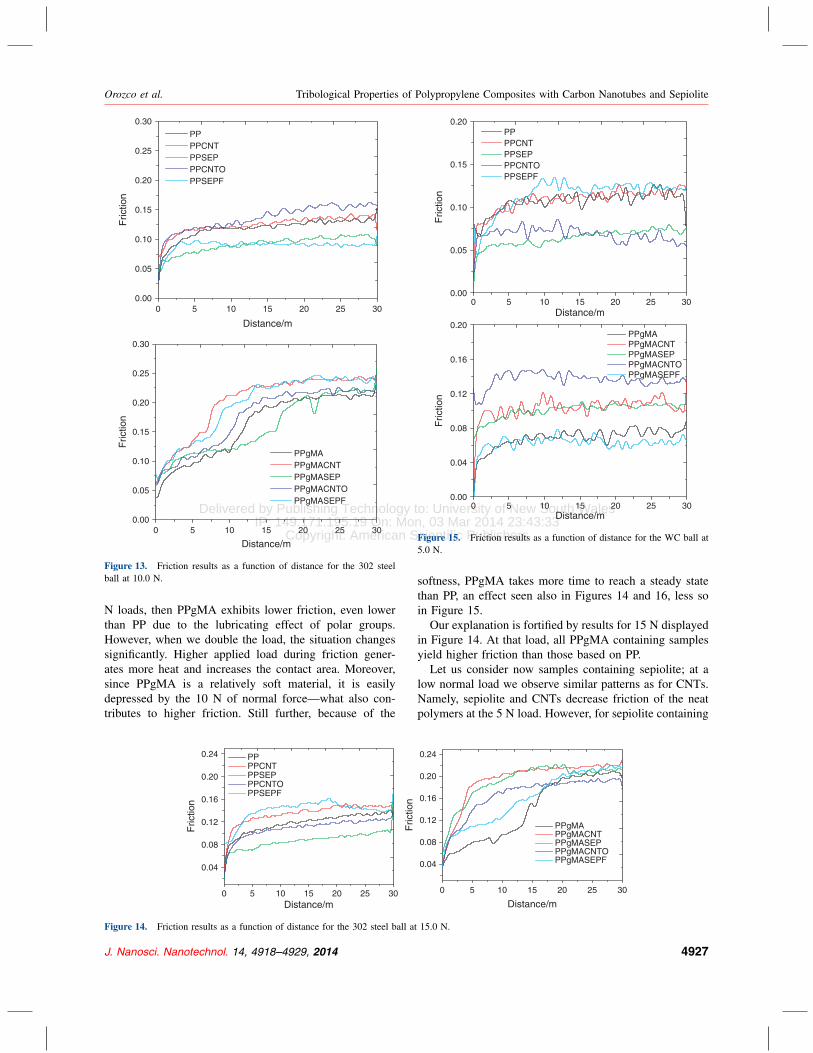
Figure 13. Friction results as a function of distance for the 302 steel
ball at 10.0 N.
N loads, then PPgMA exhibits lower friction, even lower
than PP due to the lubricating effect of polar groups.
However, when we double the load, the situation changes
significantly. Higher applied load during friction gener-
ates more heat and increases the contact area. Moreover,
since PPgMA is a relatively soft material, it is easily
depressed by the 10 N of normal force—what also con-
tributes to higher friction. Still further, because of the
0 5 10 15 20 25 30
0.04
0.08
0.12
0.16
0.20
0.24
Fric
tion
Distance/m
PP PPCNT PPSEP PPCNTO PPSEPF
0 5 10 15 20 25 30
0.04
0.08
0.12
0.16
0.20
0.24
Fric
tion
Distance/m
PPgMA PPgMACNT PPgMASEP PPgMACNTO PPgMASEPF
Figure 14. Friction results as a function of distance for the 302 steel ball at 15.0 N.
0 5 10 15 20 25 300.00
0.05
0.10
0.15
0.20
Fric
tion
Distance/m
PP PPCNT PPSEP PPCNTO PPSEPF
0 5 10 15 20 25 300.00
0.04
0.08
0.12
0.16
0.20
Fric
tion
Distance/m
PPgMA PPgMACNT PPgMASEP PPgMACNTO PPgMASEPF
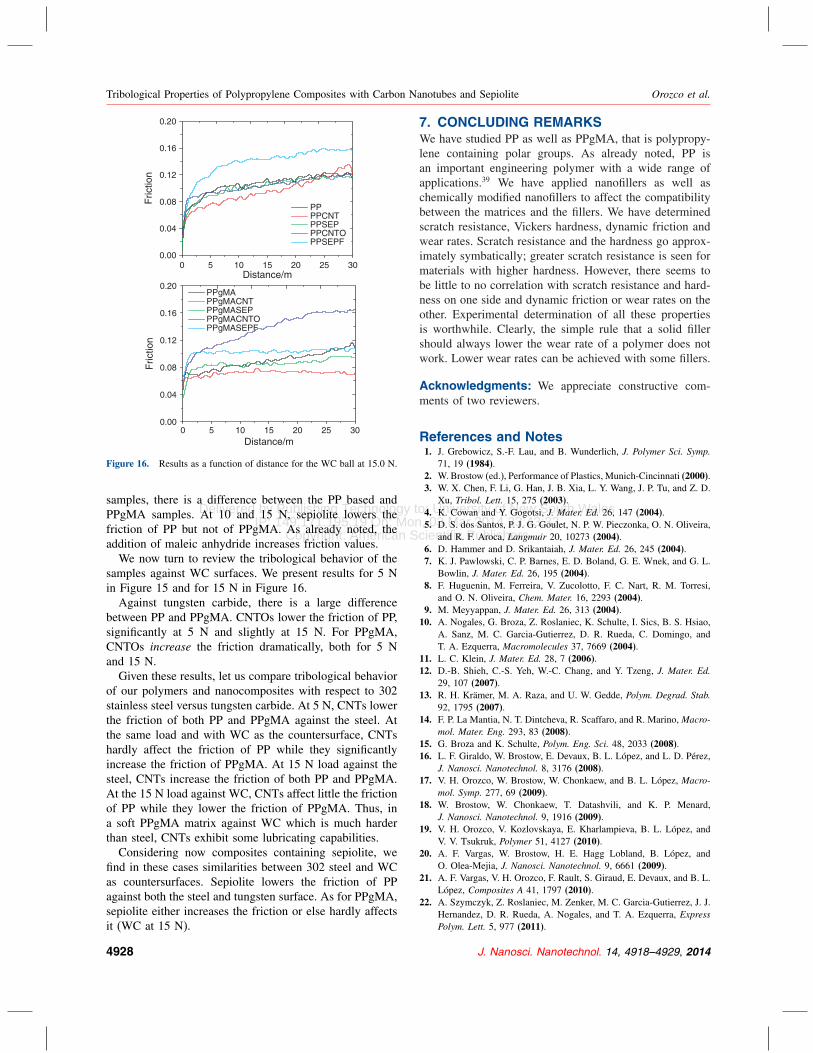
Figure 15. Friction results as a function of distance for the WC ball at
5.0 N.
softness, PPgMA takes more time to reach a steady state
than PP, an effect seen also in Figures 14 and 16, less so
in Figure 15.
Our explanation is fortified by results for 15 N displayed
in Figure 14. At that load, all PPgMA containing samples
yield higher friction than those based on PP.
Let us consider now samples containing sepiolite; at a
low normal load we observe similar patterns as for CNTs.
Namely, sepiolite and CNTs decrease friction of the neat
polymers at the 5 N load. However, for sepiolite containing
J. Nanosci. Nanotechnol. 14, 4918–4929, 2014 4927
Delivered by Publishing Technology to: University of New South WalesIP: 149.171.195.19 On: Mon, 03 Mar 2014 23:43:33
Copyright: American Scientific Publishers
Tribological Properties of Polypropylene Composites with Carbon Nanotubes and Sepiolite Orozco et al.
0 5 10 15 20 25 300.00
0.04
0.08
0.12
0.16
0.20
Fric
tion
Distance/m
PP PPCNT PPSEP PPCNTO PPSEPF
0 5 10 15 20 25 300.00
0.04
0.08
0.12
0.16
0.20
Fric
tion
Distance/m
PPgMA PPgMACNT PPgMASEP PPgMACNTO PPgMASEPF
Figure 16. Results as a function of distance for the WC ball at 15.0 N.
samples, there is a difference between the PP based and
PPgMA samples. At 10 and 15 N, sepiolite lowers the
friction of PP but not of PPgMA. As already noted, the
addition of maleic anhydride increases friction values.
We now turn to review the tribological behavior of the
samples against WC surfaces. We present results for 5 N
in Figure 15 and for 15 N in Figure 16.
Against tungsten carbide, there is a large difference
between PP and PPgMA. CNTOs lower the friction of PP,
significantly at 5 N and slightly at 15 N. For PPgMA,
CNTOs increase the friction dramatically, both for 5 N
and 15 N.
Given these results, let us compare tribological behavior
of our polymers and nanocomposites with respect to 302
stainless steel versus tungsten carbide. At 5 N, CNTs lower
the friction of both PP and PPgMA against the steel. At
the same load and with WC as the countersurface, CNTs
hardly affect the friction of PP while they significantly
increase the friction of PPgMA. At 15 N load against the
steel, CNTs increase the friction of both PP and PPgMA.
At the 15 N load against WC, CNTs affect little the friction
of PP while they lower the friction of PPgMA. Thus, in
a soft PPgMA matrix against WC which is much harder
than steel, CNTs exhibit some lubricating capabilities.
Considering now composites containing sepiolite, we
find in these cases similarities between 302 steel and WC
as countersurfaces. Sepiolite lowers the friction of PP
against both the steel and tungsten surface. As for PPgMA,
sepiolite either increases the friction or else hardly affects
it (WC at 15 N).
7. CONCLUDING REMARKSWe have studied PP as well as PPgMA, that is polypropy-
lene containing polar groups. As already noted, PP is
an important engineering polymer with a wide range of
applications.39 We have applied nanofillers as well as
chemically modified nanofillers to affect the compatibility
between the matrices and the fillers. We have determined
scratch resistance, Vickers hardness, dynamic friction and
wear rates. Scratch resistance and the hardness go approx-
imately symbatically; greater scratch resistance is seen for
materials with higher hardness. However, there seems to
be little to no correlation with scratch resistance and hard-
ness on one side and dynamic friction or wear rates on the
other. Experimental determination of all these properties
is worthwhile. Clearly, the simple rule that a solid filler
should always lower the wear rate of a polymer does not
work. Lower wear rates can be achieved with some fillers.
Acknowledgments: We appreciate constructive com-
ments of two reviewers.
References and Notes1. J. Grebowicz, S.-F. Lau, and B. Wunderlich, J. Polymer Sci. Symp.
71, 19 (1984).2. W. Brostow (ed.), Performance of Plastics, Munich-Cincinnati (2000).3. W. X. Chen, F. Li, G. Han, J. B. Xia, L. Y. Wang, J. P. Tu, and Z. D.
Xu, Tribol. Lett. 15, 275 (2003).4. K. Cowan and Y. Gogotsi, J. Mater. Ed. 26, 147 (2004).5. D. S. dos Santos, P. J. G. Goulet, N. P. W. Pieczonka, O. N. Oliveira,
and R. F. Aroca, Langmuir 20, 10273 (2004).6. D. Hammer and D. Srikantaiah, J. Mater. Ed. 26, 245 (2004).7. K. J. Pawlowski, C. P. Barnes, E. D. Boland, G. E. Wnek, and G. L.
Bowlin, J. Mater. Ed. 26, 195 (2004).8. F. Huguenin, M. Ferreira, V. Zucolotto, F. C. Nart, R. M. Torresi,
and O. N. Oliveira, Chem. Mater. 16, 2293 (2004).9. M. Meyyappan, J. Mater. Ed. 26, 313 (2004).
10. A. Nogales, G. Broza, Z. Roslaniec, K. Schulte, I. Sics, B. S. Hsiao,
A. Sanz, M. C. Garcia-Gutierrez, D. R. Rueda, C. Domingo, and
T. A. Ezquerra, Macromolecules 37, 7669 (2004).11. L. C. Klein, J. Mater. Ed. 28, 7 (2006).12. D.-B. Shieh, C.-S. Yeh, W.-C. Chang, and Y. Tzeng, J. Mater. Ed.
29, 107 (2007).13. R. H. Krämer, M. A. Raza, and U. W. Gedde, Polym. Degrad. Stab.
92, 1795 (2007).14. F. P. La Mantia, N. T. Dintcheva, R. Scaffaro, and R. Marino, Macro-
mol. Mater. Eng. 293, 83 (2008).15. G. Broza and K. Schulte, Polym. Eng. Sci. 48, 2033 (2008).16. L. F. Giraldo, W. Brostow, E. Devaux, B. L. López, and L. D. Pérez,
J. Nanosci. Nanotechnol. 8, 3176 (2008).17. V. H. Orozco, W. Brostow, W. Chonkaew, and B. L. López, Macro-
mol. Symp. 277, 69 (2009).18. W. Brostow, W. Chonkaew, T. Datashvili, and K. P. Menard,
J. Nanosci. Nanotechnol. 9, 1916 (2009).19. V. H. Orozco, V. Kozlovskaya, E. Kharlampieva, B. L. López, and
V. V. Tsukruk, Polymer 51, 4127 (2010).20. A. F. Vargas, W. Brostow, H. E. Hagg Lobland, B. López, and
O. Olea-Mejia, J. Nanosci. Nanotechnol. 9, 6661 (2009).21. A. F. Vargas, V. H. Orozco, F. Rault, S. Giraud, E. Devaux, and B. L.
López, Composites A 41, 1797 (2010).22. A. Szymczyk, Z. Roslaniec, M. Zenker, M. C. Garcia-Gutierrez, J. J.
Hernandez, D. R. Rueda, A. Nogales, and T. A. Ezquerra, ExpressPolym. Lett. 5, 977 (2011).
4928 J. Nanosci. Nanotechnol. 14, 4918–4929, 2014
Delivered by Publishing Technology to: University of New South WalesIP: 149.171.195.19 On: Mon, 03 Mar 2014 23:43:33
Copyright: American Scientific Publishers
Orozco et al. Tribological Properties of Polypropylene Composites with Carbon Nanotubes and Sepiolite
23. A. Kopczynska and G. W. Ehrenstein, J. Mater. Ed. 29, 325 (2007).24. R. C. Desai and R. Kapral, Dynamics of Self-Organized and
Self-Assembled Structures, Cambridge University Press, Cambridge,
New York (2009).25. G. H. Michler and F. J. Balta-Calleja, Nano- and Micromechanics
of Polymers: Structure Modification and Improvement of Properties,
Hanser, Munich, Cincinnati (2012).26. E. Rabinowicz, Friction and Wear of Materials, Wiley, New York
(1995), p. 315.27. N. K. Myshkin, M. I. Petrokovets, and A. V. Kovalev, Tribology
Internat. 38, 910 (2005).28. W. Brostow, J.-L. Deborde, M. Jaklewicz, and P. Olszynski, J. Mater.
Ed. 25, 119 (2003).29. W. Brostow, V. Kovacevic, D. Vrsaljko, and J. Whitworth, J. Mater.
Ed. 32, 273 (2010).30. E. F. Lucas, B. G. Soares, and E. E. D. C. Monteiro, Caracterização
de Polímeros, Determinação de Peso Molecular e Análise Térmica,
e-Papers, Rio de Janeiro (2001), p. 366.
31. K. P. Menard, Thermal transitions and their measurement, Perfor-
mance of Plastics, edited by W. Brostow, Hanser/Gardner Publica-
tions, Cincinnati (2000), p. 147.32. U. W. Gedde, Polymer Physics, Springer-Kluwer, Dordrecht-Boston
(2001), p. 301.33. W. Brostow, B. P. Gorman, and O. Olea-Mejia, Mater. Lett. 61, 1333
(2007).34. W. Brostow, M. Brozynski, T. Datashvili, and O. Olea-Mejía, Polym.
Bull. 59, 1671 (2011).35. W.-M. Chiu and Y.-A. Chang, J. Appl. Polym. Sci. 107, 1655 (2008).36. V. Datsyuk, M. Kalyva, K. Papagelis, J. Parthenios, D. Tasis,
A. Siokou, I. Kallitsis, and C. Galiotis, Carbon 46, 833 (2008).37. G. Sandí, R. E. Winans, S. Seifert, and K. A. Carrado, Chem. Mater.
14, 739 (2002).38. M. Alkan, G. Tekin, and H. Namli, Microporous Mesoporous Mater.
84, 75 (2005).39. J. Karger-Kocsis, Polypropylene—An A–Z Reference, Chapman and
Hall, London (1999).
Received: 2 January 2013. Accepted: 20 April 2013.
J. Nanosci. Nanotechnol. 14, 4918–4929, 2014 4929
Recommended


