Volume 22 Issue 2 Article 3
TRUNCATED MODEL TESTS FOR MOORING LINES OF A SEMI-TRUNCATED MODEL TESTS FOR MOORING LINES OF A SEMI-SUBMERSIBLE PLATFORM AND ITS EQUIVALENT COMPENSATED SUBMERSIBLE PLATFORM AND ITS EQUIVALENT COMPENSATED METHOD METHOD
Dong-Sheng Qiao Deepwater Engineering Research Center, Dalian University of Technology, Dalian, P. R. China, [email protected]
Jin-Ping Ou Deepwater Engineering Research Center, Dalian University of Technology, Dalian, P. R. China. State Key Laboratory of Coastal and Offshore Engineering, Dalian University of Technology, Dalian, P. R. China.
Follow this and additional works at: https://jmstt.ntou.edu.tw/journal
Part of the Ocean Engineering Commons
Recommended Citation Recommended Citation Qiao, Dong-Sheng and Ou, Jin-Ping (2014) "TRUNCATED MODEL TESTS FOR MOORING LINES OF A SEMI-SUBMERSIBLE PLATFORM AND ITS EQUIVALENT COMPENSATED METHOD," Journal of Marine Science and Technology: Vol. 22 : Iss. 2 , Article 3. DOI: 10.6119/JMST-013-0108-1 Available at: https://jmstt.ntou.edu.tw/journal/vol22/iss2/3
This Research Article is brought to you for free and open access by Journal of Marine Science and Technology. It has been accepted for inclusion in Journal of Marine Science and Technology by an authorized editor of Journal of Marine Science and Technology.

TRUNCATED MODEL TESTS FOR MOORING LINES OF A SEMI-SUBMERSIBLE TRUNCATED MODEL TESTS FOR MOORING LINES OF A SEMI-SUBMERSIBLE PLATFORM AND ITS EQUIVALENT COMPENSATED METHOD PLATFORM AND ITS EQUIVALENT COMPENSATED METHOD
Acknowledgements Acknowledgements This paper was financially funded in part by National Basic Research Program of China (Grant NO. 2011CB013702; 2011CB013703), National Natural Science Foundation of China (Grant NO. 51209037), and China Postdoctoral Science Foundation Funded Project (Grant NO. 2012M510811).
This research article is available in Journal of Marine Science and Technology: https://jmstt.ntou.edu.tw/journal/vol22/iss2/3
Journal of Marine Science and Technology, Vol. 22, No. 2, pp. 125-136 (2014) 125 DOI: 10.6119/JMST-013-0108-1
TRUNCATED MODEL TESTS FOR MOORING LINES OF A SEMI-SUBMERSIBLE
PLATFORM AND ITS EQUIVALENT COMPENSATED METHOD
Dong-Sheng Qiao1 and Jin-Ping Ou1, 2
Key words: truncated, model test, viscous damper, semi-submersible platform.
ABSTRACT
This study conducted a model test of 1:100 model scale of a semi-submersible platform with a 1500 m full-depth moor-ing system in the Joint Laboratory of Wind Tunnel & Wave Flume at Harbin Institute of Technology. A truncated mooring system of 400 m water depth was designed based on the static equivalent principle. The semi-submersible platform was tested under regular wave excitation periods that ranged from 10 s to 45 s and one year of irregular wave conditions in the South China Sea. The results validated the feasibility of using numerical simulation in the motions calculation of semi- submersible platform and showed that mooring damping may contribute significantly to the total damping of deepwater floating platform in the low frequency range. The viscous damper was designed to simulate the contribution of mooring damping and added to the numerical simulation of the motion calculation of semi-submersible platform with the truncated mooring line. The numerical simulation results were com-pared with the motion calculation of semi-submersible plat-form with the full-depth mooring line. This method can help solve the differences in the dynamics of truncated model tests that are typically used in ocean engineering.
I. INTRODUCTION
Given that the oil industry has been increasingly its efforts and activities on deeper water, suitable floating platforms such as semi-submersible, tension-leg and Spar platforms are
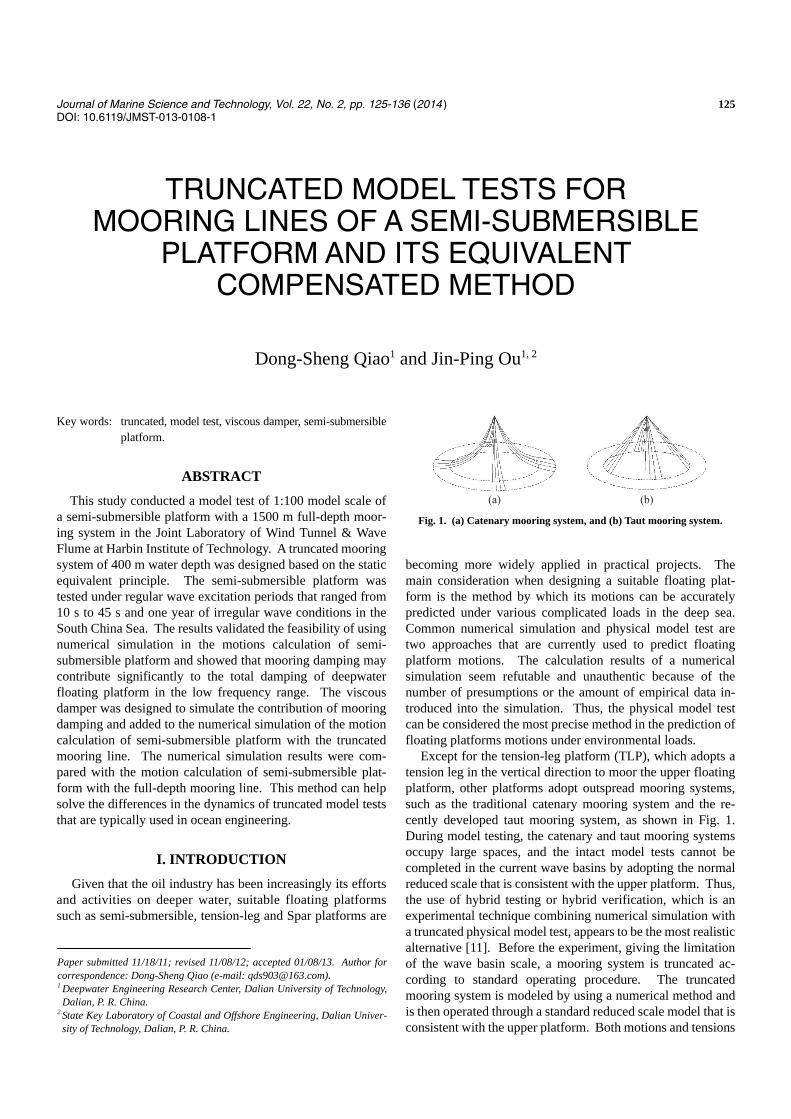
(a) (b) Fig. 1. (a) Catenary mooring system, and (b) Taut mooring system.
becoming more widely applied in practical projects. The main consideration when designing a suitable floating plat-form is the method by which its motions can be accurately predicted under various complicated loads in the deep sea. Common numerical simulation and physical model test are two approaches that are currently used to predict floating platform motions. The calculation results of a numerical simulation seem refutable and unauthentic because of the number of presumptions or the amount of empirical data in-troduced into the simulation. Thus, the physical model test can be considered the most precise method in the prediction of floating platforms motions under environmental loads.
Except for the tension-leg platform (TLP), which adopts a tension leg in the vertical direction to moor the upper floating platform, other platforms adopt outspread mooring systems, such as the traditional catenary mooring system and the re-cently developed taut mooring system, as shown in Fig. 1. During model testing, the catenary and taut mooring systems occupy large spaces, and the intact model tests cannot be completed in the current wave basins by adopting the normal reduced scale that is consistent with the upper platform. Thus, the use of hybrid testing or hybrid verification, which is an experimental technique combining numerical simulation with a truncated physical model test, appears to be the most realistic alternative [11]. Before the experiment, giving the limitation of the wave basin scale, a mooring system is truncated ac-cording to standard operating procedure. The truncated mooring system is modeled by using a numerical method and is then operated through a standard reduced scale model that is consistent with the upper platform. Both motions and tensions
Paper submitted 11/18/11; revised 11/08/12; accepted 01/08/13. Author for correspondence: Dong-Sheng Qiao (e-mail: [email protected]). 1 Deepwater Engineering Research Center, Dalian University of Technology, Dalian, P. R. China.
2 State Key Laboratory of Coastal and Offshore Engineering, Dalian Univer-sity of Technology, Dalian, P. R. China.
126 Journal of Marine Science and Technology, Vol. 22, No. 2 (2014)
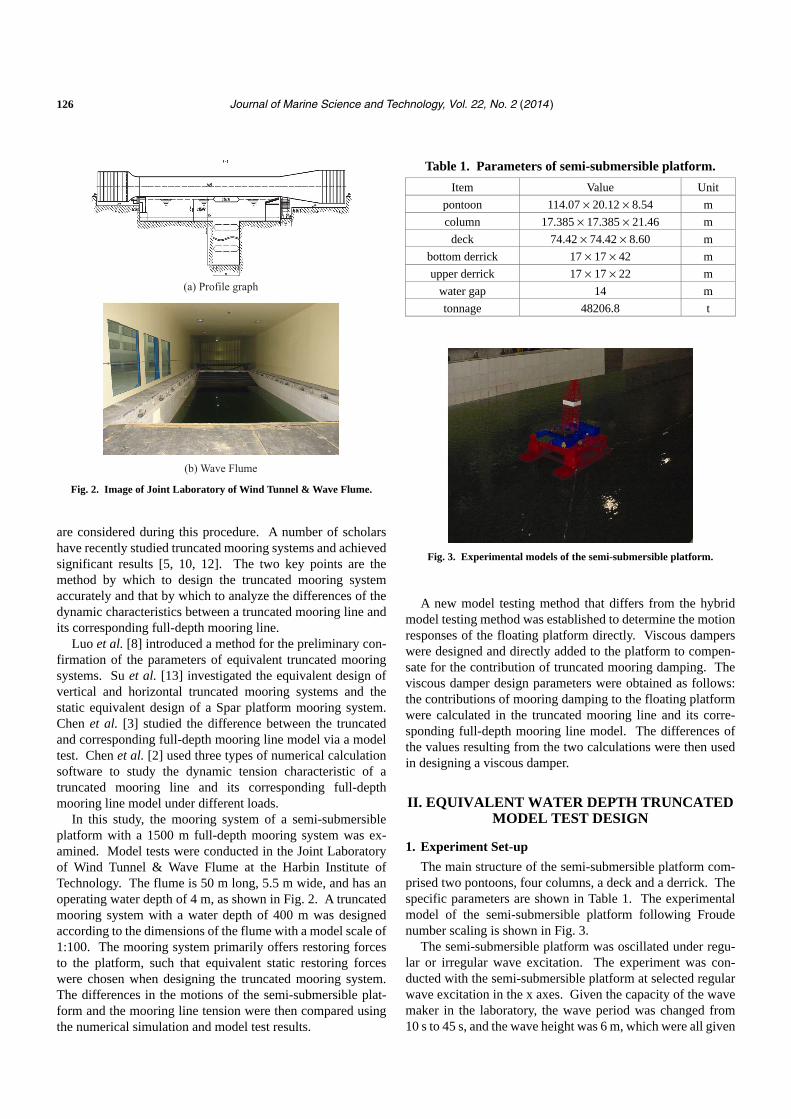
(a) Profile graph
(b) Wave Flume Fig. 2. Image of Joint Laboratory of Wind Tunnel & Wave Flume.
are considered during this procedure. A number of scholars have recently studied truncated mooring systems and achieved significant results [5, 10, 12]. The two key points are the method by which to design the truncated mooring system accurately and that by which to analyze the differences of the dynamic characteristics between a truncated mooring line and its corresponding full-depth mooring line.
Luo et al. [8] introduced a method for the preliminary con-firmation of the parameters of equivalent truncated mooring systems. Su et al. [13] investigated the equivalent design of vertical and horizontal truncated mooring systems and the static equivalent design of a Spar platform mooring system. Chen et al. [3] studied the difference between the truncated and corresponding full-depth mooring line model via a model test. Chen et al. [2] used three types of numerical calculation software to study the dynamic tension characteristic of a truncated mooring line and its corresponding full-depth mooring line model under different loads.
In this study, the mooring system of a semi-submersible platform with a 1500 m full-depth mooring system was ex-amined. Model tests were conducted in the Joint Laboratory of Wind Tunnel & Wave Flume at the Harbin Institute of Technology. The flume is 50 m long, 5.5 m wide, and has an operating water depth of 4 m, as shown in Fig. 2. A truncated mooring system with a water depth of 400 m was designed according to the dimensions of the flume with a model scale of 1:100. The mooring system primarily offers restoring forces to the platform, such that equivalent static restoring forces were chosen when designing the truncated mooring system. The differences in the motions of the semi-submersible plat-form and the mooring line tension were then compared using the numerical simulation and model test results.
Table 1. Parameters of semi-submersible platform.
Item Value Unit
pontoon 114.07 × 20.12 × 8.54 m
column 17.385 × 17.385 × 21.46 m
deck 74.42 × 74.42 × 8.60 m
bottom derrick 17 × 17 × 42 m
upper derrick 17 × 17 × 22 m
water gap 14 m
tonnage 48206.8 t
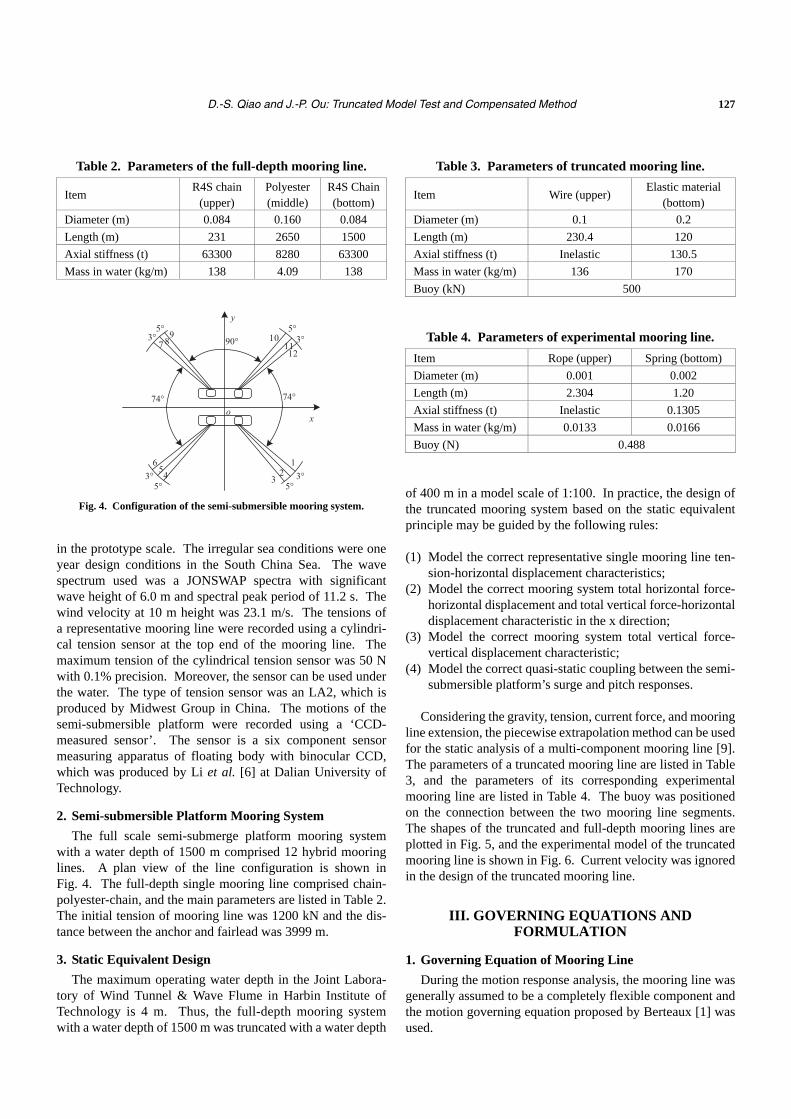
Fig. 3. Experimental models of the semi-submersible platform.
A new model testing method that differs from the hybrid
model testing method was established to determine the motion responses of the floating platform directly. Viscous dampers were designed and directly added to the platform to compen-sate for the contribution of truncated mooring damping. The viscous damper design parameters were obtained as follows: the contributions of mooring damping to the floating platform were calculated in the truncated mooring line and its corre-sponding full-depth mooring line model. The differences of the values resulting from the two calculations were then used in designing a viscous damper.
II. EQUIVALENT WATER DEPTH TRUNCATED MODEL TEST DESIGN
1. Experiment Set-up
The main structure of the semi-submersible platform com- prised two pontoons, four columns, a deck and a derrick. The specific parameters are shown in Table 1. The experimental model of the semi-submersible platform following Froude number scaling is shown in Fig. 3.
The semi-submersible platform was oscillated under regu-lar or irregular wave excitation. The experiment was con-ducted with the semi-submersible platform at selected regular wave excitation in the x axes. Given the capacity of the wave maker in the laboratory, the wave period was changed from 10 s to 45 s, and the wave height was 6 m, which were all given
D.-S. Qiao and J.-P. Ou: Truncated Model Test and Compensated Method 127
Table 2. Parameters of the full-depth mooring line.
Item R4S chain
(upper) Polyester (middle)
R4S Chain (bottom)
Diameter (m) 0.084 0.160 0.084
Length (m) 231 2650 1500
Axial stiffness (t) 63300 8280 63300
Mass in water (kg/m) 138 4.09 138
x
3
y
90°
74°74°
3°5°5°
3°
3°5° 5°
3°
o
1211
10987
654 2
1
Fig. 4. Configuration of the semi-submersible mooring system.
in the prototype scale. The irregular sea conditions were one year design conditions in the South China Sea. The wave spectrum used was a JONSWAP spectra with significant wave height of 6.0 m and spectral peak period of 11.2 s. The wind velocity at 10 m height was 23.1 m/s. The tensions of a representative mooring line were recorded using a cylindri-cal tension sensor at the top end of the mooring line. The maximum tension of the cylindrical tension sensor was 50 N with 0.1% precision. Moreover, the sensor can be used under the water. The type of tension sensor was an LA2, which is produced by Midwest Group in China. The motions of the semi-submersible platform were recorded using a ‘CCD- measured sensor’. The sensor is a six component sensor measuring apparatus of floating body with binocular CCD, which was produced by Li et al. [6] at Dalian University of Technology.
2. Semi-submersible Platform Mooring System
The full scale semi-submerge platform mooring system with a water depth of 1500 m comprised 12 hybrid mooring lines. A plan view of the line configuration is shown in Fig. 4. The full-depth single mooring line comprised chain- polyester-chain, and the main parameters are listed in Table 2. The initial tension of mooring line was 1200 kN and the dis-tance between the anchor and fairlead was 3999 m.
3. Static Equivalent Design
The maximum operating water depth in the Joint Labora-tory of Wind Tunnel & Wave Flume in Harbin Institute of Technology is 4 m. Thus, the full-depth mooring system with a water depth of 1500 m was truncated with a water depth
Table 3. Parameters of truncated mooring line.
Item Wire (upper) Elastic material
(bottom)
Diameter (m) 0.1 0.2
Length (m) 230.4 120
Axial stiffness (t) Inelastic 130.5
Mass in water (kg/m) 136 170
Buoy (kN) 500
Table 4. Parameters of experimental mooring line.
Item Rope (upper) Spring (bottom)
Diameter (m) 0.001 0.002
Length (m) 2.304 1.20
Axial stiffness (t) Inelastic 0.1305
Mass in water (kg/m) 0.0133 0.0166
Buoy (N) 0.488
of 400 m in a model scale of 1:100. In practice, the design of the truncated mooring system based on the static equivalent principle may be guided by the following rules:
(1) Model the correct representative single mooring line ten-
sion-horizontal displacement characteristics; (2) Model the correct mooring system total horizontal force-
horizontal displacement and total vertical force-horizontal displacement characteristic in the x direction;
(3) Model the correct mooring system total vertical force- vertical displacement characteristic;
(4) Model the correct quasi-static coupling between the semi- submersible platform’s surge and pitch responses.
Considering the gravity, tension, current force, and mooring
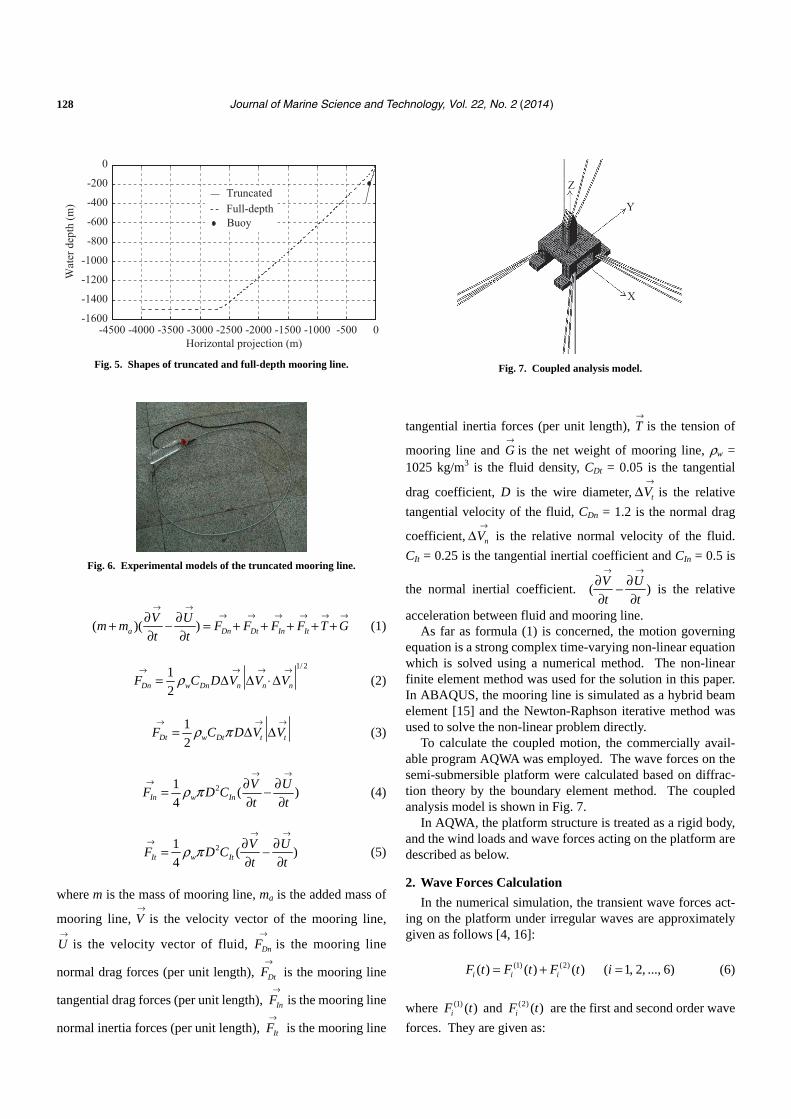
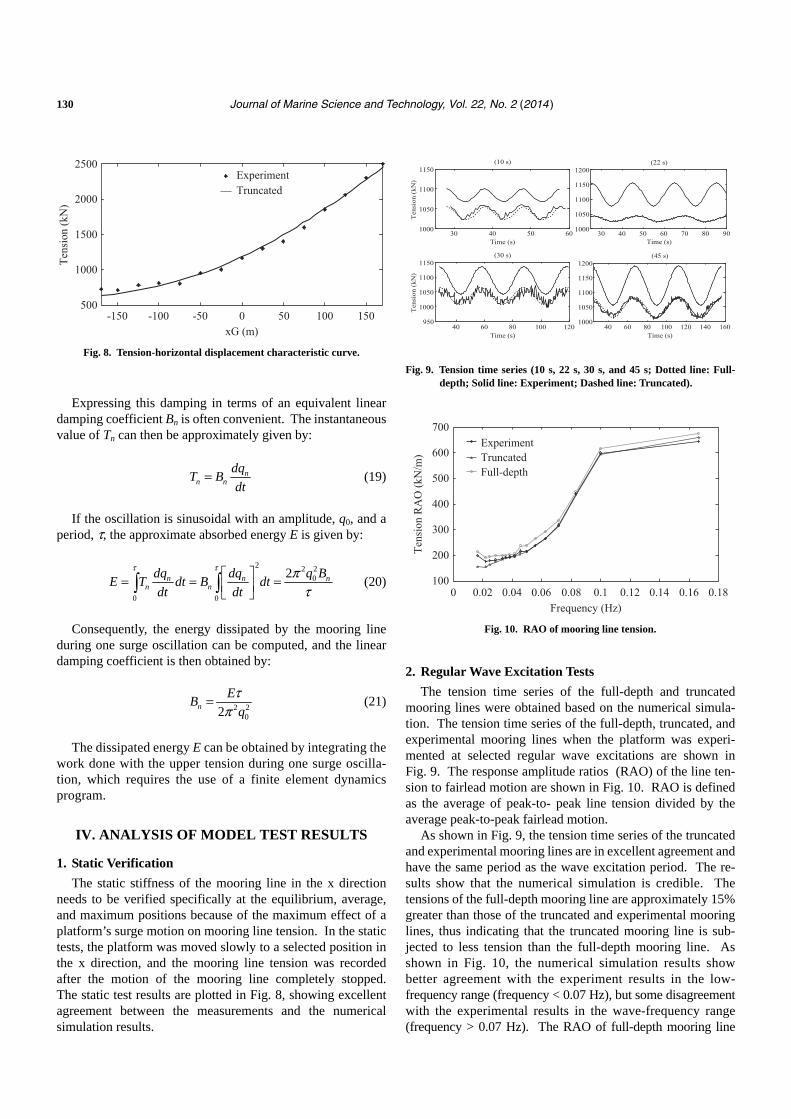
line extension, the piecewise extrapolation method can be used for the static analysis of a multi-component mooring line [9]. The parameters of a truncated mooring line are listed in Table 3, and the parameters of its corresponding experimental mooring line are listed in Table 4. The buoy was positioned on the connection between the two mooring line segments. The shapes of the truncated and full-depth mooring lines are plotted in Fig. 5, and the experimental model of the truncated mooring line is shown in Fig. 6. Current velocity was ignored in the design of the truncated mooring line.
III. GOVERNING EQUATIONS AND FORMULATION
1. Governing Equation of Mooring Line
During the motion response analysis, the mooring line was generally assumed to be a completely flexible component and the motion governing equation proposed by Berteaux [1] was used.
128 Journal of Marine Science and Technology, Vol. 22, No. 2 (2014)
-4500 -4000 -3500 -3000 -2500 -2000 -1500 -1000 -500 0-1600
-1400
-1200
-1000
-800
-600
-400
-200
0
Horizontal projection (m)
Wat
er d
epth
(m)
TruncatedFull-depthBuoy
Fig. 5. Shapes of truncated and full-depth mooring line.
Fig. 6. Experimental models of the truncated mooring line.
( )( )a Dn Dt In It
V Um m F F F F T G
t t
→ →→ → → → → →∂ ∂+ − = + + + + +
∂ ∂ (1)
1/ 2
1
2Dn w Dn n n nF C D V V Vρ→ → → →
= ∆ ∆ ⋅ ∆ (2)
1
2Dt w Dt t tF C D V Vρ π→ → →
= ∆ ∆ (3)
21( )
4In w In
V UF D C
t tρ π
→ →→ ∂ ∂= −
∂ ∂ (4)
21( )
4It w It
V UF D C
t tρ π
→ →→ ∂ ∂= −
∂ ∂ (5)
where m is the mass of mooring line, ma is the added mass of
mooring line, V→
is the velocity vector of the mooring line,
U→
is the velocity vector of fluid, DnF→
is the mooring line
normal drag forces (per unit length), DtF→
is the mooring line
tangential drag forces (per unit length), InF→
is the mooring line
normal inertia forces (per unit length), ItF→
is the mooring line
Z
Y
X
Fig. 7. Coupled analysis model.
tangential inertia forces (per unit length), T→
is the tension of
mooring line and G→
is the net weight of mooring line, ρw = 1025 kg/m3 is the fluid density, CDt = 0.05 is the tangential
drag coefficient, D is the wire diameter, tV→
∆ is the relative
tangential velocity of the fluid, CDn = 1.2 is the normal drag
coefficient, nV→
∆ is the relative normal velocity of the fluid.
CIt = 0.25 is the tangential inertial coefficient and CIn = 0.5 is
the normal inertial coefficient. ( )V U
t t
→ →∂ ∂−∂ ∂
is the relative
acceleration between fluid and mooring line. As far as formula (1) is concerned, the motion governing
equation is a strong complex time-varying non-linear equation which is solved using a numerical method. The non-linear finite element method was used for the solution in this paper. In ABAQUS, the mooring line is simulated as a hybrid beam element [15] and the Newton-Raphson iterative method was used to solve the non-linear problem directly.
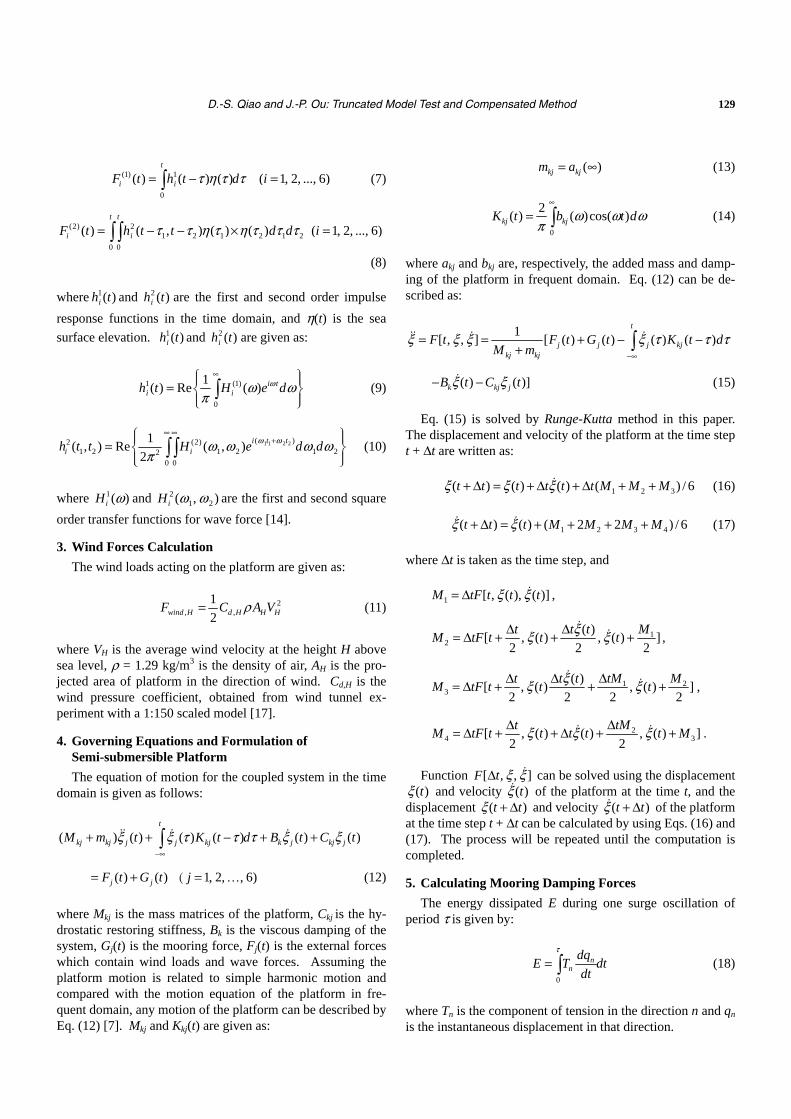
To calculate the coupled motion, the commercially avail-able program AQWA was employed. The wave forces on the semi-submersible platform were calculated based on diffrac-tion theory by the boundary element method. The coupled analysis model is shown in Fig. 7.
In AQWA, the platform structure is treated as a rigid body, and the wind loads and wave forces acting on the platform are described as below.
2. Wave Forces Calculation
In the numerical simulation, the transient wave forces act-ing on the platform under irregular waves are approximately given as follows [4, 16]:
(1) (2)( ) ( ) ( ) ( 1, 2, ..., 6)i i iF t F t F t i= + = (6)
where (1) ( )iF t and (2) ( )iF t are the first and second order wave
forces. They are given as:
D.-S. Qiao and J.-P. Ou: Truncated Model Test and Compensated Method 129
(1) 1
0
( ) ( ) ( ) ( 1, 2, ..., 6)t
i iF t h t d iτ η τ τ= − =∫ (7)
(2) 21 2 1 2 1 2
0 0
( ) ( , ) ( ) ( ) ( 1, 2, ..., 6)t t
i iF t h t t d d iτ τ η τ η τ τ τ= − − × =∫ ∫
(8)
where 1( )ih t and 2 ( )ih t are the first and second order impulse
response functions in the time domain, and η(t) is the sea
surface elevation. 1( )ih t and 2 ( )ih t are given as:
1 (1)
0
1( ) Re ( ) i t
i ih t H e dωω ωπ
∞ = ∫ (9)
1 1 2 2( )2 (2)1 2 1 2 1 22
0 0
1( , ) Re ( , )
2i t t
i ih t t H e d dω ωω ω ω ω
π
∞ ∞+ =
∫ ∫ (10)
where 1( )iH ω and 21 2( , )iH ω ω are the first and second square
order transfer functions for wave force [14].
3. Wind Forces Calculation
The wind loads acting on the platform are given as:
2, ,
1
2wind H d H H HF C A Vρ= (11)
where VH is the average wind velocity at the height H above sea level, ρ = 1.29 kg/m3 is the density of air, AH is the pro-jected area of platform in the direction of wind. Cd,H is the wind pressure coefficient, obtained from wind tunnel ex-periment with a 1:150 scaled model [17].
4. Governing Equations and Formulation of Semi-submersible Platform
The equation of motion for the coupled system in the time domain is given as follows:
( ) ( ) ( ) ( ) ( ) ( )t
kj kj j j kj k j kj jM m t K t d B t C tξ ξ τ τ τ ξ ξ−∞
+ + − + +∫�� � �
( ) ( ) 1, 2, , 6)j jF t G t j= + = … ( (12)
where Mkj is the mass matrices of the platform, Ckj is the hy-drostatic restoring stiffness, Bk is the viscous damping of the system, Gj(t) is the mooring force, Fj(t) is the external forces which contain wind loads and wave forces. Assuming the platform motion is related to simple harmonic motion and compared with the motion equation of the platform in fre- quent domain, any motion of the platform can be described by Eq. (12) [7]. Mkj and Kkj(t) are given as:
( )kj kjm a= ∞ (13)
0
2( ) ( )cos( )kj kjK t b t dω ω ω
π
∞
= ∫ (14)
where akj and bkj are, respectively, the added mass and damp-ing of the platform in frequent domain. Eq. (12) can be de-scribed as:
1[ , , ] [ ( ) ( ) ( ) ( )
t
j j j kjkj kj
F t F t G t K t dM m
ξ ξ ξ ξ τ τ τ−∞
= = + − −+ ∫�� � �
( ) ( )]k kj jB t C tξ ξ− −� (15)
Eq. (15) is solved by Runge-Kutta method in this paper. The displacement and velocity of the platform at the time step t + ∆t are written as:
1 2 3( ) ( ) ( ) ( ) / 6t t t t t t M M Mξ ξ ξ+ ∆ = + ∆ + ∆ + +� (16)
1 2 3 4( ) ( ) ( 2 2 ) / 6t t t M M M Mξ ξ+ ∆ = + + + +� � (17)
where ∆t is taken as the time step, and
1 [ , ( ), ( )]M tF t t tξ ξ= ∆ � ,
12
( )[ , ( ) , ( ) ]
2 2 2
Mt t tM tF t t t
ξξ ξ∆ ∆= ∆ + + +�
� ,
1 23
( )[ , ( ) , ( ) ]
2 2 2 2
tM Mt t tM tF t t t
ξξ ξ∆∆ ∆= ∆ + + +�
� ,
24 3[ , ( ) ( ) , ( ) ]
2 2
tMtM tF t t t t t Mξ ξ ξ∆∆= ∆ + + ∆ + +� � .
Function [ , , ]F t ξ ξ∆ � can be solved using the displacement ( )tξ and velocity ( )tξ� of the platform at the time t, and the
displacement ( )t tξ + ∆ and velocity ( )t tξ + ∆� of the platform at the time step t + ∆t can be calculated by using Eqs. (16) and (17). The process will be repeated until the computation is completed.
5. Calculating Mooring Damping Forces
The energy dissipated E during one surge oscillation of period τ is given by:
0
nn
dqE T dt
dt
τ
= ∫ (18)
where Tn is the component of tension in the direction n and qn is the instantaneous displacement in that direction.
130 Journal of Marine Science and Technology, Vol. 22, No. 2 (2014)
-150 -100 -50 0 50 100 150500
1000
1500
2000
2500
xG (m)
Tens
ion
(kN
)
ExperimentTruncated
Fig. 8. Tension-horizontal displacement characteristic curve.
Expressing this damping in terms of an equivalent linear
damping coefficient Bn is often convenient. The instantaneous value of Tn can then be approximately given by:
nn n
dqT B
dt= (19)
If the oscillation is sinusoidal with an amplitude, q0, and a period, τ, the approximate absorbed energy E is given by:
2 2 2
0
0 0
2n n nn n
dq dq q BE T dt B dt
dt dt
τ τ πτ
= = =
∫ ∫ (20)
Consequently, the energy dissipated by the mooring line during one surge oscillation can be computed, and the linear damping coefficient is then obtained by:
2 202n
EB
q
τπ
= (21)
The dissipated energy E can be obtained by integrating the work done with the upper tension during one surge oscilla-tion, which requires the use of a finite element dynamics program.
IV. ANALYSIS OF MODEL TEST RESULTS
1. Static Verification
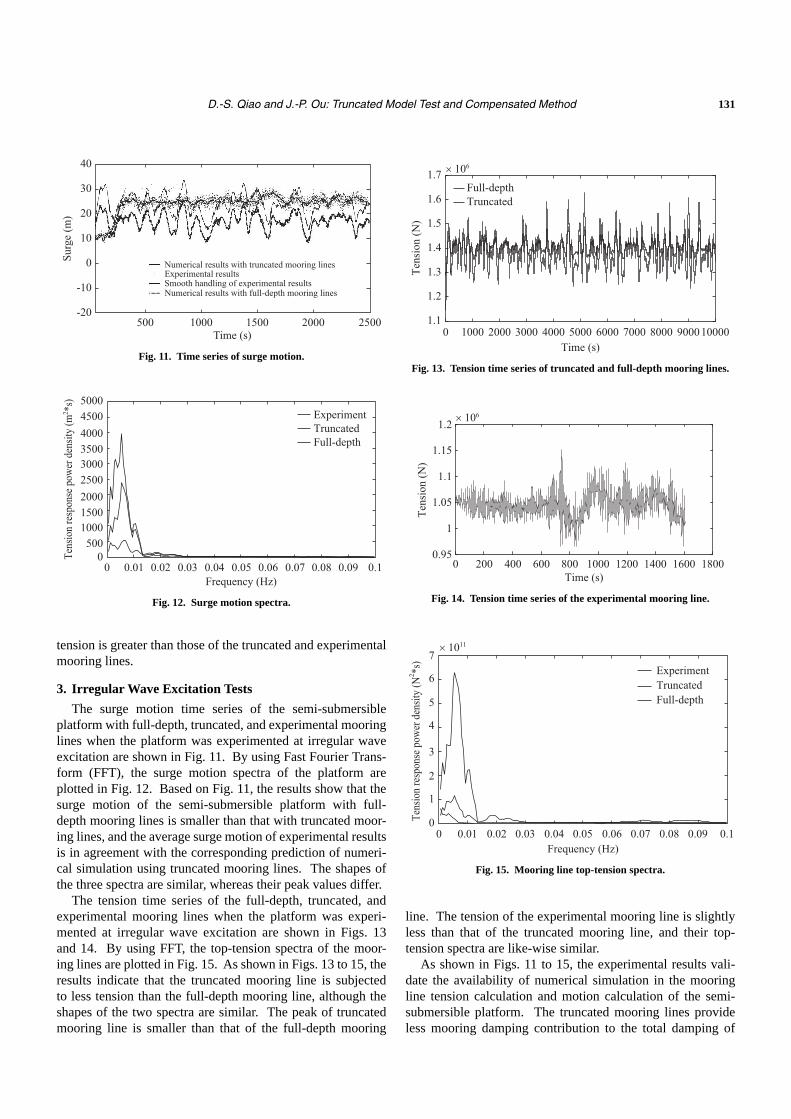
The static stiffness of the mooring line in the x direction needs to be verified specifically at the equilibrium, average, and maximum positions because of the maximum effect of a platform’s surge motion on mooring line tension. In the static tests, the platform was moved slowly to a selected position in the x direction, and the mooring line tension was recorded after the motion of the mooring line completely stopped. The static test results are plotted in Fig. 8, showing excellent agreement between the measurements and the numerical simulation results.
Ten
sion
(kN
)
30 40 50 601000
1050
1100
1150
Time (s)
(10 s)
30 40 50 60 70 80 901000
1050
1100
1150
1200
Time (s)
(22 s)
Ten
sion
(kN
)
40 60 80 100 120950
1000
1050
1100
1150
Time (s)
(30 s)
40 60 80 100 120 140 1601000
1050
1100
1150
1200
Time (s)
(45 s)
Fig. 9. Tension time series (10 s, 22 s, 30 s, and 45 s; Dotted line: Full- depth; Solid line: Experiment; Dashed line: Truncated).
ExperimentTruncatedFull-depth
700
600
500
400
300
200
100
Tens
ion
RA
O (k
N/m
)
0 0.02 0.04 0.06 0.08 0.1 0.12 0.14 0.16 0.18Frequency (Hz)
Fig. 10. RAO of mooring line tension.
2. Regular Wave Excitation Tests
The tension time series of the full-depth and truncated mooring lines were obtained based on the numerical simula-tion. The tension time series of the full-depth, truncated, and experimental mooring lines when the platform was experi-mented at selected regular wave excitations are shown in Fig. 9. The response amplitude ratios (RAO) of the line ten-sion to fairlead motion are shown in Fig. 10. RAO is defined as the average of peak-to- peak line tension divided by the average peak-to-peak fairlead motion.
As shown in Fig. 9, the tension time series of the truncated and experimental mooring lines are in excellent agreement and have the same period as the wave excitation period. The re-sults show that the numerical simulation is credible. The tensions of the full-depth mooring line are approximately 15% greater than those of the truncated and experimental mooring lines, thus indicating that the truncated mooring line is sub-jected to less tension than the full-depth mooring line. As shown in Fig. 10, the numerical simulation results show better agreement with the experiment results in the low- frequency range (frequency < 0.07 Hz), but some disagreement with the experimental results in the wave-frequency range (frequency > 0.07 Hz). The RAO of full-depth mooring line
D.-S. Qiao and J.-P. Ou: Truncated Model Test and Compensated Method 131
Experimental resultsNumerical results with truncated mooring lines
Smooth handling of experimental resultsNumerical results with full-depth mooring lines
40
30
20
10
0
-10
-20
Surg
e (m
)
500 1000Time (s)
1500 2000 2500
Fig. 11. Time series of surge motion.
ExperimentTruncatedFull-depth
500045004000350030002500200015001000
5000Te
nsio
n re
spon
se p
ower
den
sity
(m2 *s
)
0 0.01 0.02 0.03 0.04 0.05Frequency (Hz)
0.06 0.07 0.08 0.09 0.1
Fig. 12. Surge motion spectra.
tension is greater than those of the truncated and experimental mooring lines.
3. Irregular Wave Excitation Tests
The surge motion time series of the semi-submersible platform with full-depth, truncated, and experimental mooring lines when the platform was experimented at irregular wave excitation are shown in Fig. 11. By using Fast Fourier Trans-form (FFT), the surge motion spectra of the platform are plotted in Fig. 12. Based on Fig. 11, the results show that the surge motion of the semi-submersible platform with full- depth mooring lines is smaller than that with truncated moor- ing lines, and the average surge motion of experimental results is in agreement with the corresponding prediction of numeri-cal simulation using truncated mooring lines. The shapes of the three spectra are similar, whereas their peak values differ.
The tension time series of the full-depth, truncated, and experimental mooring lines when the platform was experi-mented at irregular wave excitation are shown in Figs. 13 and 14. By using FFT, the top-tension spectra of the moor- ing lines are plotted in Fig. 15. As shown in Figs. 13 to 15, the results indicate that the truncated mooring line is subjected to less tension than the full-depth mooring line, although the shapes of the two spectra are similar. The peak of truncated mooring line is smaller than that of the full-depth mooring
0 1000 2000 3000 4000 5000 6000 7000 8000 9000100001.1
1.2
1.3
1.4
1.5
1.6
1.7 × 10⁶
Time (s)
Tens
ion
(N)
Full-depthTruncated
Fig. 13. Tension time series of truncated and full-depth mooring lines.
0 200 400 600 800 1000 1200 1400 1600 18000.95
1
1.05
1.1
1.15
1.2 × 10⁶
Time (s)
Tens
ion
(N)
Fig. 14. Tension time series of the experimental mooring line.
ExperimentTruncatedFull-depth
× 1011
7
6
5
4
3
2
1
0Tens
ion
resp
onse
pow
er d
ensit
y (N
2 *s)
0 0.01 0.02 0.03 0.04Frequency (Hz)
0.05 0.06 0.07 0.08 0.09 0.1
Fig. 15. Mooring line top-tension spectra.
line. The tension of the experimental mooring line is slightly less than that of the truncated mooring line, and their top- tension spectra are like-wise similar.
As shown in Figs. 11 to 15, the experimental results vali-date the availability of numerical simulation in the mooring line tension calculation and motion calculation of the semi- submersible platform. The truncated mooring lines provide less mooring damping contribution to the total damping of
132 Journal of Marine Science and Technology, Vol. 22, No. 2 (2014)
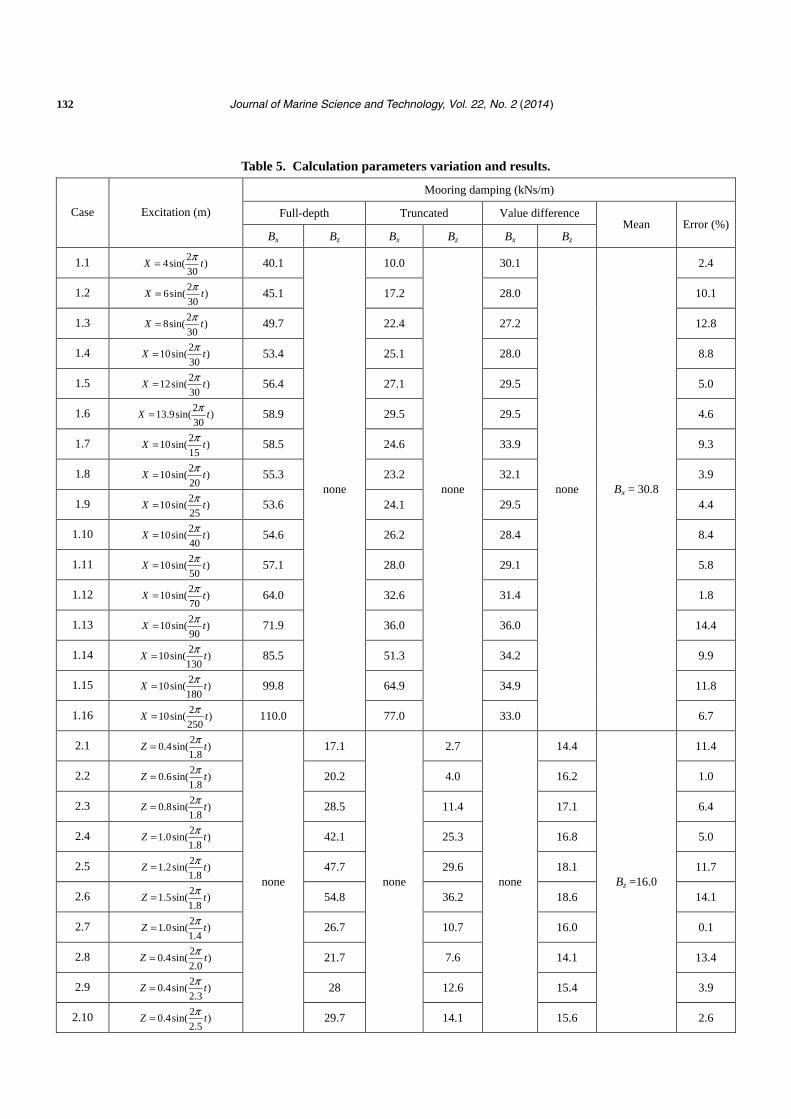
Table 5. Calculation parameters variation and results.
Mooring damping (kNs/m)
Full-depth Truncated Value difference Case Excitation (m)
Bx Bz Bx Bz Bx Bz Mean Error (%)
1.1 24sin( )
30X t
π= 40.1 10.0 30.1 2.4
1.2 26sin( )
30X t
π= 45.1 17.2 28.0 10.1
1.3 28sin( )
30X t
π= 49.7 22.4 27.2 12.8
1.4 210sin( )
30X t
π= 53.4 25.1 28.0 8.8
1.5 212sin( )
30X t
π= 56.4 27.1 29.5 5.0
1.6 213.9sin( )
30X t
π= 58.9 29.5 29.5 4.6
1.7 210sin( )
15X t
π= 58.5 24.6 33.9 9.3
1.8 210sin( )
20X t
π= 55.3 23.2 32.1 3.9
1.9 210sin( )
25X t
π= 53.6 24.1 29.5 4.4
1.10 210sin( )
40X t
π= 54.6 26.2 28.4 8.4
1.11 210sin( )
50X t
π= 57.1 28.0 29.1 5.8
1.12 210sin( )
70X t
π= 64.0 32.6 31.4 1.8
1.13 210sin( )
90X t
π= 71.9 36.0 36.0 14.4
1.14 210sin( )
130X t
π= 85.5 51.3 34.2 9.9
1.15 210sin( )
180X t
π= 99.8 64.9 34.9 11.8
1.16 210sin( )
250X t
π= 110.0
none
77.0
none
33.0
none Bx = 30.8
6.7
2.1 20.4sin( )
1.8Z t
π= 17.1 2.7 14.4 11.4
2.2 20.6sin( )
1.8Z t
π= 20.2 4.0 16.2 1.0
2.3 20.8sin( )
1.8Z t
π= 28.5 11.4 17.1 6.4
2.4 21.0sin( )
1.8Z t
π= 42.1 25.3 16.8 5.0
2.5 21.2sin( )
1.8Z t
π= 47.7 29.6 18.1 11.7
2.6 21.5sin( )
1.8Z t
π= 54.8 36.2 18.6 14.1
2.7 21.0sin( )
1.4Z t
π= 26.7 10.7 16.0 0.1
2.8 20.4sin( )
2.0Z t
π= 21.7 7.6 14.1 13.4
2.9 20.4sin( )
2.3Z t
π= 28 12.6 15.4 3.9
2.10 20.4sin( )
2.5Z t
π=
none
29.7
none
14.1
none
15.6
Bz =16.0
2.6
D.-S. Qiao and J.-P. Ou: Truncated Model Test and Compensated Method 133
0 50 100 150 200 25020
40
60
80
100
120
Period (s)
Dam
ping
(kN
s/m
)
Bx (Full-depth)Bx (Truncated)Bx (Value difference)
1.4 1.6 1.8 2 2.2 2.4
10
20
30
40
Period (s)
Dam
ping
(kN
s/m
)
Bz (Full-depth)Bz (Truncated)Bz (Value difference)
Fig. 16. Effect of the excitation period in the x and z directions.
4 6 8 10 12 14
20
40
60
80
Amplitude (m)
Dam
ping
(kN
s/m
)
Bx (Full-depth)Bx (Truncated)Bx (Value difference)
0.5 1 1.50
20
40
60
Amplitude (m)
Dam
ping
(kN
s/m
)
Bz (Full-depth)Bz (Truncated)Bz (Value difference)
Fig. 17. Effects of the excitation amplitude in the x and z directions.
the deepwater floating platform because of the differences of the dynamics between the truncated and full-depth mooring lines. This inferior mooring damping capability of truncated mooring lines needs to be solved by using other approaches.
V. EQUIVALENT COMPENSATION METHOD USING VISCOUS DAMPER
1. Calculation of the Parameters of Viscous Damper Design
As shown in Fig. 12, the surge response of the semi- submersible platform is mainly in the low-frequency range. The experimental results for the heave motion of the semi- submersible platform is not ideal with those of numerical simulation because of the width limitation of the Joint Labo-ratory of Wind Tunnel & Wave Flume at the Harbin Institute of Technology. The numerical simulation method has been validated via the surge motion. Thus, the numerical simula-tion results for the heave motion of the semi-submersible platform can be used in the succeeding calculations. Conse-quently, the excitations of the mooring line top end are listed in Table 5 (APPENDIXES).
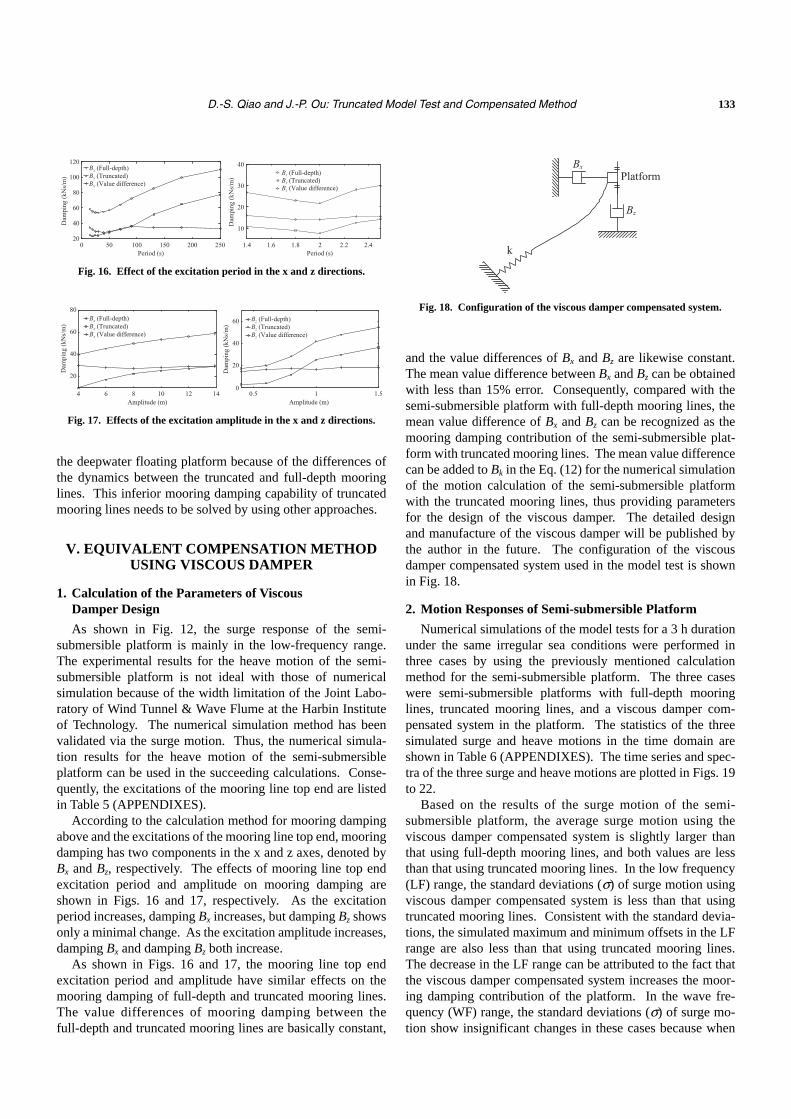
According to the calculation method for mooring damping above and the excitations of the mooring line top end, mooring damping has two components in the x and z axes, denoted by Bx and Bz, respectively. The effects of mooring line top end excitation period and amplitude on mooring damping are shown in Figs. 16 and 17, respectively. As the excitation period increases, damping Bx increases, but damping Bz shows only a minimal change. As the excitation amplitude increases, damping Bx and damping Bz both increase.
As shown in Figs. 16 and 17, the mooring line top end excitation period and amplitude have similar effects on the mooring damping of full-depth and truncated mooring lines. The value differences of mooring damping between the full-depth and truncated mooring lines are basically constant,
k
Bz
BxPlatform
Fig. 18. Configuration of the viscous damper compensated system.
and the value differences of Bx and Bz are likewise constant. The mean value difference between Bx and Bz can be obtained with less than 15% error. Consequently, compared with the semi-submersible platform with full-depth mooring lines, the mean value difference of Bx and Bz can be recognized as the mooring damping contribution of the semi-submersible plat-form with truncated mooring lines. The mean value difference can be added to Bk in the Eq. (12) for the numerical simulation of the motion calculation of the semi-submersible platform with the truncated mooring lines, thus providing parameters for the design of the viscous damper. The detailed design and manufacture of the viscous damper will be published by the author in the future. The configuration of the viscous damper compensated system used in the model test is shown in Fig. 18.
2. Motion Responses of Semi-submersible Platform
Numerical simulations of the model tests for a 3 h duration under the same irregular sea conditions were performed in three cases by using the previously mentioned calculation method for the semi-submersible platform. The three cases were semi-submersible platforms with full-depth mooring lines, truncated mooring lines, and a viscous damper com-pensated system in the platform. The statistics of the three simulated surge and heave motions in the time domain are shown in Table 6 (APPENDIXES). The time series and spec-tra of the three surge and heave motions are plotted in Figs. 19 to 22.
Based on the results of the surge motion of the semi- submersible platform, the average surge motion using the viscous damper compensated system is slightly larger than that using full-depth mooring lines, and both values are less than that using truncated mooring lines. In the low frequency (LF) range, the standard deviations (σ) of surge motion using viscous damper compensated system is less than that using truncated mooring lines. Consistent with the standard devia-tions, the simulated maximum and minimum offsets in the LF range are also less than that using truncated mooring lines. The decrease in the LF range can be attributed to the fact that the viscous damper compensated system increases the moor-ing damping contribution of the platform. In the wave fre-quency (WF) range, the standard deviations (σ) of surge mo-tion show insignificant changes in these cases because when
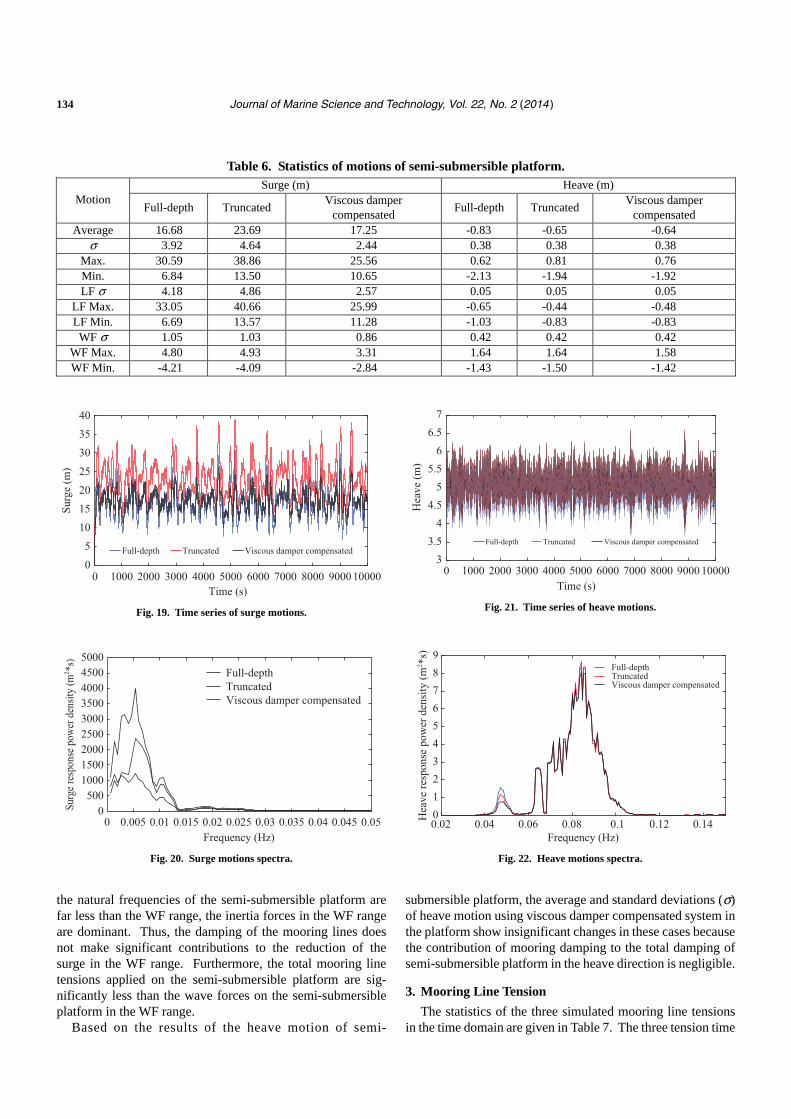
134 Journal of Marine Science and Technology, Vol. 22, No. 2 (2014)
Table 6. Statistics of motions of semi-submersible platform. Surge (m) Heave (m)
Motion Full-depth Truncated
Viscous damper compensated
Full-depth Truncated Viscous damper
compensated Average 16.68 23.69 17.25 -0.83 -0.65 -0.64
σ 3.92 4.64 2.44 0.38 0.38 0.38 Max. 30.59 38.86 25.56 0.62 0.81 0.76 Min. 6.84 13.50 10.65 -2.13 -1.94 -1.92 LF σ 4.18 4.86 2.57 0.05 0.05 0.05
LF Max. 33.05 40.66 25.99 -0.65 -0.44 -0.48 LF Min. 6.69 13.57 11.28 -1.03 -0.83 -0.83 WF σ 1.05 1.03 0.86 0.42 0.42 0.42
WF Max. 4.80 4.93 3.31 1.64 1.64 1.58 WF Min. -4.21 -4.09 -2.84 -1.43 -1.50 -1.42
0 1000 2000 3000 4000 5000 6000 7000 8000 9000 100000
5
10
15
20
25
30
35
40
Time (s)
Surg
e (m
)
Full-depth Truncated Viscous damper compensated
Fig. 19. Time series of surge motions.
Full-depthTruncatedViscous damper compensated
500045004000350030002500200015001000500
0Surg
e res
pons
e pow
er d
ensit
y (m
2 *s)
0 0.005 0.01 0.015 0.02 0.025 0.03 0.035 0.04 0.045 0.05Frequency (Hz)
Fig. 20. Surge motions spectra.
the natural frequencies of the semi-submersible platform are far less than the WF range, the inertia forces in the WF range are dominant. Thus, the damping of the mooring lines does not make significant contributions to the reduction of the surge in the WF range. Furthermore, the total mooring line tensions applied on the semi-submersible platform are sig-nificantly less than the wave forces on the semi-submersible platform in the WF range.
Based on the results of the heave motion of semi-
0 1000 2000 3000 4000 5000 6000 7000 8000 9000 100003
3.54
4.55
5.56
6.57
Time (s)
Hea
ve (m
)
Full-depth Truncated Viscous damper compensated
Fig. 21. Time series of heave motions.
0.02 0.04 0.06 0.08 0.1 0.12 0.140123456789
Frequency (Hz)
Hea
ve re
spon
se p
ower
den
sity
(m2 *s
)
Full-depthTruncatedViscous damper compensated
Fig. 22. Heave motions spectra.
submersible platform, the average and standard deviations (σ) of heave motion using viscous damper compensated system in the platform show insignificant changes in these cases because the contribution of mooring damping to the total damping of semi-submersible platform in the heave direction is negligible.
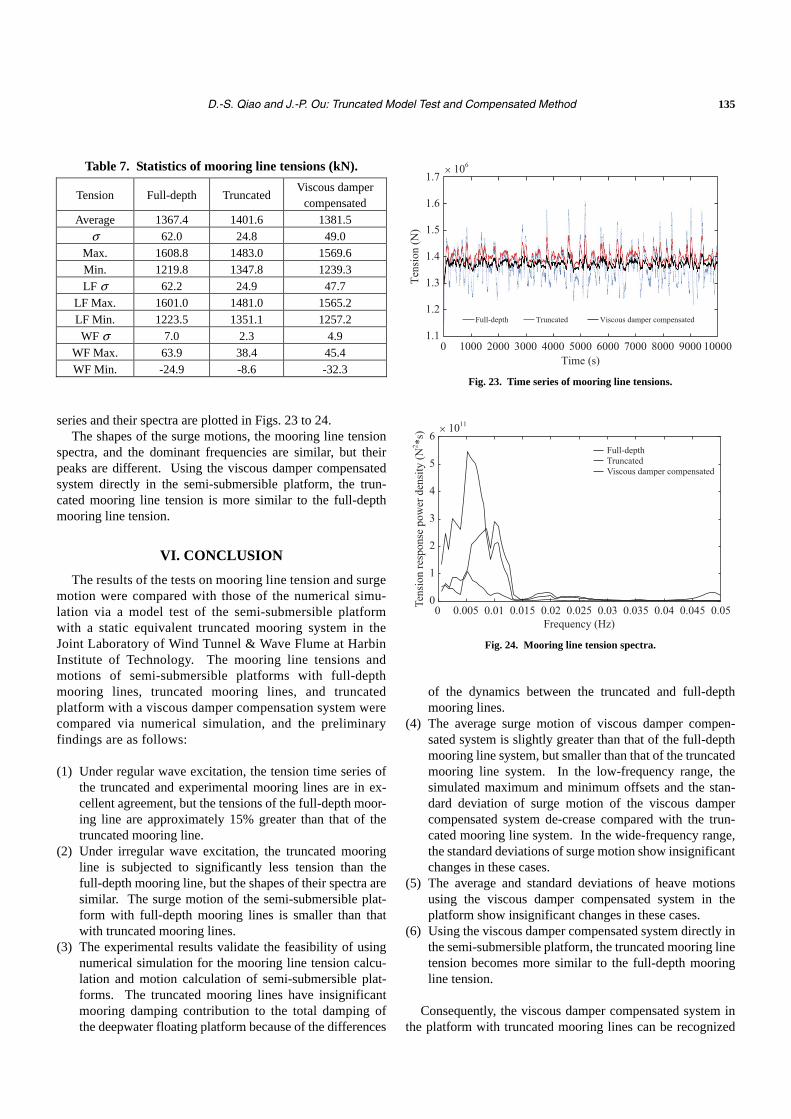
3. Mooring Line Tension
The statistics of the three simulated mooring line tensions in the time domain are given in Table 7. The three tension time
D.-S. Qiao and J.-P. Ou: Truncated Model Test and Compensated Method 135
Table 7. Statistics of mooring line tensions (kN).
Tension Full-depth Truncated Viscous damper
compensated Average 1367.4 1401.6 1381.5
σ 62.0 24.8 49.0 Max. 1608.8 1483.0 1569.6 Min. 1219.8 1347.8 1239.3 LF σ 62.2 24.9 47.7
LF Max. 1601.0 1481.0 1565.2 LF Min. 1223.5 1351.1 1257.2 WF σ 7.0 2.3 4.9
WF Max. 63.9 38.4 45.4 WF Min. -24.9 -8.6 -32.3
series and their spectra are plotted in Figs. 23 to 24. The shapes of the surge motions, the mooring line tension
spectra, and the dominant frequencies are similar, but their peaks are different. Using the viscous damper compensated system directly in the semi-submersible platform, the trun-cated mooring line tension is more similar to the full-depth mooring line tension.
VI. CONCLUSION
The results of the tests on mooring line tension and surge motion were compared with those of the numerical simu-lation via a model test of the semi-submersible platform with a static equivalent truncated mooring system in the Joint Laboratory of Wind Tunnel & Wave Flume at Harbin Institute of Technology. The mooring line tensions and motions of semi-submersible platforms with full-depth mooring lines, truncated mooring lines, and truncated platform with a viscous damper compensation system were compared via numerical simulation, and the preliminary findings are as follows:
(1) Under regular wave excitation, the tension time series of
the truncated and experimental mooring lines are in ex-cellent agreement, but the tensions of the full-depth moor- ing line are approximately 15% greater than that of the truncated mooring line.
(2) Under irregular wave excitation, the truncated mooring line is subjected to significantly less tension than the full-depth mooring line, but the shapes of their spectra are similar. The surge motion of the semi-submersible plat-form with full-depth mooring lines is smaller than that with truncated mooring lines.
(3) The experimental results validate the feasibility of using numerical simulation for the mooring line tension calcu-lation and motion calculation of semi-submersible plat-forms. The truncated mooring lines have insignificant mooring damping contribution to the total damping of the deepwater floating platform because of the differences
Full-depth Truncated Viscous damper compensated
× 106
1.7
1.6
1.5
1.4
1.3
1.2
1.1
Tens
ion
(N)
0 1000 2000 3000 4000 5000Time (s)
6000 7000 8000 9000 10000
Fig. 23. Time series of mooring line tensions.
0 0.005 0.01 0.015 0.025 0.03 0.035 0.04 0.045 0.050.020
1
2
3
4
5
6
Frequency (Hz)
Tens
ion
resp
onse
pow
er d
ensi
ty (N
2 *s)
Full-depthTruncatedViscous damper compensated
× 1011
Fig. 24. Mooring line tension spectra.
of the dynamics between the truncated and full-depth mooring lines.
(4) The average surge motion of viscous damper compen-sated system is slightly greater than that of the full-depth mooring line system, but smaller than that of the truncated mooring line system. In the low-frequency range, the simulated maximum and minimum offsets and the stan-dard deviation of surge motion of the viscous damper compensated system de-crease compared with the trun-cated mooring line system. In the wide-frequency range, the standard deviations of surge motion show insignificant changes in these cases.
(5) The average and standard deviations of heave motions using the viscous damper compensated system in the platform show insignificant changes in these cases.
(6) Using the viscous damper compensated system directly in the semi-submersible platform, the truncated mooring line tension becomes more similar to the full-depth mooring line tension.
Consequently, the viscous damper compensated system in
the platform with truncated mooring lines can be recognized
136 Journal of Marine Science and Technology, Vol. 22, No. 2 (2014)
as an effective method to solve the differences of the dy- namics between truncated and full-depth mooring lines in the model tests.
ACKNOWLEDGMENTS
This paper was financially funded in part by National Basic Research Program of China (Grant NO. 2011CB013702; 2011CB013703), National Natural Science Foundation of China (Grant NO. 51209037), and China Postdoctoral Science Foundation Funded Project (Grant NO. 2012M510811).
REFERENCES
1. Berteaux, H. O., Buoy Engineering, Wiley Interscience Publication, New York, pp. 170-174 (1976).
2. Chen, X. H. and Zhang, J., “Dynamic analysis of mooring lines by using three different methods,” Proceeding of the Eleventh International Off-shore and Polar Engineering Conference, Stavanger, Norway, pp. 635- 642 (2001).
3. Chen, X. H., Zhang, J., Johnson, P., and Irani, M., “Studies on the dy-namics of truncated mooring line,” Proceeding of the Tenth International Offshore and Polar Engineering Conference, Washington, WA, USA, pp. 94-101 (2000).
4. Cummins, W. E., The Impulse Response Function and Ship Motions, Technical Report 1661, David Taylor Model Basin, Washington D.C., USA (1962).
5. Hong, S., Kim, J. H., Hong, S. W., Jalihal, P., and Ravindran, M., “A hybrid model test of a deepwater OTEC mooring system,” Proceeding of the Fourteenth International Offshore and Polar Engineering Conference, Toulon, France, pp. 183-188 (2004).
6. Li, M. G., Han, B., Zhang, Q., and Wang, J., “A six component measuring apparatus for floating body,” China Offshore Platform, Vol. 18, No. 3, pp.
35-46 (2003). 7. Li, Y. C. and Teng, B., Wave Action on Maritime Structures, Second Edi-
tion, Ocean Press, Beijing, pp. 90-95 (2002). 8. Luo, Y. and Baudic, S., “Predicting FPSO responses using model tests and
numerical analysis,” Proceeding of the Thirteenth International Offshore and Polar Engineering Conference, Hawaii, USA, pp. 167-174 (2003).
9. Qiao, D. S. and Ou, J. P., “Static analysis of a deepwater catenary mooring system,” Ship & Ocean Engineering, Vol. 38, No. 2, pp. 120-124 (2009).
10. Rolf, B. and Fabio, G. P., “Hybrid verification of a DICAS moored FPSO,” Proceeding of the Fourteenth International Offshore and Polar Engineering Conference, Toulon, France, pp. 307-314 (2004).
11. Stansberg, C. T., Ormberg, H., and Oritsland, O., “Challenges in deep water experiments: hybrid approach,” Journal of Offshore Mechanics and Arctic Engineering, Vol. 124, No. 2, pp. 90-96 (2002).
12. Stansberg, C. T., Yttervik, R., Oritsland, O., and Kleiven, G., “Hydrody-namic model test verification of a floating platform system in 3000m water depth,” Proceeding of the Nineteenth International Conference of Offshore Mechanics and Arctic Engineering, New Orleans, LA, Paper No. OMAE00-4145 (2000).
13. Su, Y. H., Yang, J. M., and Xiao, L. F., “Research on equivalent design method of deepwater mooring system truncated vertically and horizon-tally,” Ship Building of China, Vol. 47, Special, pp. 286-292 (2006).
14. Teng, B., Li, Y. C., and Dong, G. H., “Second-order wave force on bodies in bi-chromatic waves,” Acta Oceanologica Sinica, Vol. 21, No. 2, pp. 115-123 (1999).
15. Timoshenko, S. P., Strength of Materials, Part III, Advanced Theory and Problems, Third Edition, D. Van Nostrand Company, Princeton, New Jersey, pp. 167-168 (1956).
16. Van Oortmerssen, G., The Motions of a Moored Ship in Waves, Nether-lands Ship Model Basin, Publication No. 510, Wageningen, The Nether-lands (1976).
17. Zhu, H., Ma, Z., Zhai, G. J., Xie, B., Fu, Y. J., and Ou, J. P., “Numerical simulation and wind tunnel tests of wind loads acting on HYSY-981 semi-submersible platform,” Ship & Ocean Engineering, Vol. 38, No. 5, pp. 149-152 (2009).
Recommended