
__________________________ Two-Echelon Vehicle Routing Problem: A Satellite Location Analysis Teodor Gabriel Crainic Guido Perboli Simona Mancini Roberto Tadei
April 2009
CIRRELT-2009-15

Two-Echelon Vehicle Routing Problem: A Satellite Location Analysis
Teodor Gabriel Crainic1,2,*, Guido Perboli1,3, Simona Mancini1,3, Roberto Tadei3
1 Interuniversity Research Centre on Enterprise Networks, Logistics and Transportation (CIRRELT) 2 Department of Management and Technology, Université du Québec à Montréal, C.P. 8888,
succursale Centre-ville, Montréal, Canada H3C 3P8 3 DAUIN, Politecnico di Torino, C.so Duca degli Abruzzi 24, I-10129, Torino, Italy
Abstract. In this paper we address the Two-Echelon Vehicle Routing Problem (2E-VRP),
in which freight is delivered from depots to intermediary satellites, from where it is
delivered to customers. Different from other similar problems, the focus in 2E-VRP is on
the global routing costs of the overall network. 2E-VRP has been recently introduced and,
to our knowledge, there are no studies of the impact of instance parameters on the global
cost. We present a wide set of experimentation, in order to analyze the impact on the total
cost of several parameters including customer distribution, satellites-location rules, depot
location, number of satellites, mean accessibility of the satellites, and mean transportation
cost between the satellites and the customers.
Keywords. City Logistics, two-echelon vehicle routing problem, performance analysis. Acknowledgements. Partial funding for this project has been provided by the Italian
Ministero dell'Università e della Ricerca through “Progetto PRIN 2007 - Problemi Integrati
di Vehicle Routing e Container Packing: Modelli ed Algoritmi”. Funding has also been
provided by the Natural Sciences and Engineering Research Council of Canada
(NSERC), through its Industrial Research Chair and Discovery Grants programs, by the
partners of the Chair, CN, Rona, Alimentation Couche-Tard and the Ministry of
Transportation of Québec, and by the Fonds de recherche sur la nature et les
technologies (FQRNT) through its Team Research Grants program.
Results and views expressed in this publication are the sole responsibility of the authors and do not necessarily reflect those of CIRRELT. Les résultats et opinions contenus dans cette publication ne reflètent pas nécessairement la position du CIRRELT et n'engagent pas sa responsabilité. _____________________________
* Corresponding author: [email protected] Dépôt légal – Bibliothèque nationale du Québec, Bibliothèque nationale du Canada, 2009
© Copyright Crainic, Perboli, Mancini, Tadei and CIRRELT, 2009

INTRODUCTION In Multi-Echelon Vehicle Routing Problems, the delivery from one or more depots to customers is managed by routing and consolidating the freight through intermediate depots called satellites. This family of problems differs from multi-echelon distribution systems present in the literature, which focus on the utilization of facilities and the flow assignment between levels, while the management of the fleet and the global routing of vehicles in the system are key elements in the case we consider. This approach is strongly connected to the design of City Logistics systems for large cities, where it provides the means to efficiently keep big trucks out of the city centre, small and environment-friendly vehicles providing the last leg of distribution activities (Crainic et al., 2009, Benjelloun and Crainic, 2008). In this paper, we address the basic, static version of the problem, denoted the Two-Echelon Vehicle Routing Problem (2E-VRP), characterized by a single depot and a given number of satellites (Perboli et al., 2008). The first level routing problem address the depot-to-satellites delivery, while the satellites-to-customers delivery routes are to be built at the second level. We are given a homogeneous fleet of fixed dimension at each level, first-level vehicles have a larger capacity than second-level ones, and capacity limits exist for vehicles and satellites. The 2E-VRP is quite new and there are not yet studies on the real advantages with respect to more standard distribution systems. In particular, to our knowledge, no study of the relationship between the customer distribution, the system layout, and the associated costs of the distribution system has yet been performed for such systems. Our goal is to address this issue through a comparison of our approach to the single depot VRP strategy, and an analysis that considers the impact of several parameters, directly correlated to the system layout: the number of customers, the number and location of satellites, the customer distribution, and the relation between the first and second level costs. We first present an analysis of the accessibility level and the mean transportation cost of the system. The results of a customer distribution and satellites location analysis on medium-size instances (50-100 customers) are presented next. Finally, we present results obtained on large-size instances (150-200 customers), where we consider variable density customer distributions determining the satellites location. PROBLEM STATEMENT In 2E-VRP the delivery from the depot to the customers is managed by routing and consolidating the freight through intermediate depots called satellites. From a physical point of view, freight in 2E-VRP is delivered as follows: • Freight arrives to the depot, where it is consolidated into the 1st-level vehicles; • Each 1st-level vehicle travels to a subset of satellites, and then returns to the depot; • At each satellite, freight is transferred from 1st-level vehicles to 2nd-level vehicles; • Each 2nd-level vehicle starts from a satellite, performs a route to serve the designated
customers, and then returns to the same satellite for its next cycle.
Two-Echelon Vehicle Routing Problem: A Satellite Location Analysis
CIRRELT-2009-15 1

The goal is to serve customers by minimizing the total transportation cost, and satisfying the capacity constraints of the vehicles and satellites. Vehicles used at a given level have the same capacity. We consider a single depot and a fixed number of capacitated satellites. All customer demands are fixed and known in advance and must be satisfied. No time windows are defined for deliveries or satellites. For the 2nd level, the demand of each customer is smaller than the vehicle capacity and demands cannot be split. For the 1st level, two complementary distribution strategies are considered. In the first case, each satellite is served by just one 1st-level vehicle and the demand passing through the satellite cannot be split into different vehicles. In this case, the capacity of 1st-level vehicles has to be greater than the demand of each satellite. In the second case, a satellite can be served by different 1st-level vehicles, so each satellite demand can be split. This approach is strongly connected to City Logistics for large urban zones (Crainic et al., 2009, Benjelloun and Crainic, 2008). Such two-tier City Logistics systems build on and expand the City Distribution Center (CDC) idea. CDCs form the first level of the system and are located on the outskirts of the urban zone. The second tier of the system is constituted of satellite platforms, where the freight coming from the CDCs and, eventually, other external points may be transferred to and consolidated into vehicles adapted for utilization in dense city zones. In the more advanced systems, satellites do not perform any vehicle-waiting or warehousing activities, vehicle synchronization and transdock transhipment being the operational model. Urban vehicles (e.g., trucks or tramways) move freight to satellites, possibly by using routes specially selected to facilitate access to satellites and reduce the impact on traffic and the environment. They may visit more than one satellite during a trip. Their routes and departures have to be optimized and coordinated with satellite and city-freighter access and availability. City freighters are vehicles of relatively small capacity that can travel along any street in the city to perform the required distribution activities at the second level of the system. The Amsterdam CityCargo system (http://www.citycargo.nl/) belongs to this class. There are still many open issues related to this problem, including most CDC and satellite location ones (see Crainic et al., 2004, for a pioneering but simple contribution). The literature on 2E-VRP is limited. A flow model for the 2E-VRP and some valid inequalities were presented by Gonzalez Feliu et al. (2008) and instances up to 20 customers were solved to the optimum. The model is able to find feasible solutions for instances up to 50 customers. Perboli et al. (2008) introduced two math-heuristics able to address instances up to 50 customers. The fast clustering heuristic of Crainic et al. (2008) provides the means to address larger instances (up to 250 customers). In this method, the first and the second level are considered separately. Customers are first assigned to the nearest available satellite, then the second level problem is split into several single-depot VRPs, one for each satellite, where the satellite is considered as depot and only the customers assigned to that satellite are considered as customers. The second level solution is used as input for the first level problem, which is treated as a split delivery VRP, where the satellites are considered as the customers of the depot. The demand of each satellite is computed as the sum of the demands of the customers assigned to it.
Two-Echelon Vehicle Routing Problem: A Satellite Location Analysis
CIRRELT-2009-15 2

A general time-dependent formulation with fleet synchronization and customer time windows was introduced by Crainic et al. (2009) in the context of two-echelon City Logistics systems. The authors indicated promising algorithmic directions, but no implementation was reported. We used the fast clustering heuristic of Crainic et al. (2008) to perform our experiments. The goal of the experimentation is twofold. First, to perform an analysis of the impact of different customer distributions, satellite-location patterns, and depot locations on algorithmic efficiency and solution quality. Second, to qualify the performances of the heuristic by Crainic et al. (2008) for the the 2E-VRP. Dispatcher, a heuristic-based commercial software developed by ILOG (2005), and a Branch & Cut algorithm (Ralphs et al., 2003) truncated to 10 seconds CPU time were used to address the capacitated VRPs. Notice that on the relatively small instances solved by Branch & Cut, Dispatcher’s solutions displayed an optimality gap of some 1%. We therefore use this method to address larger instances. On the other hand, truncating the Branch & Cut yields a lower bound on the optimal solution value of the capacitated VRP. EXPERIMENTAL FRAMEWORK In this section we define and analyze the accessibility index and the mean normalized transportation cost. A number of experimental results are reported to support this analysis. An accessibility index is defined for each satellite as follows (Hansen, 1959):
2
2 21 ,| |
ki min
max min
c
c cc ci
ki Vc max
dA eV d
β−
−−
∈
= ∑
where di is the demand of customer i, dmax is the maximum demand over all customers, cki, stands for the transportation cost between satellite k and customer i, and are the minimum and maximum values of the 2nd-level transportation costs at the respectively, Vc is the number of customers, and is a parameter to be calibrated representing the traveling impedance (we assumed ). The accessibility index gives a measure of the location of a satellite with respect to the customers distribution. Customers with larger demands have a greater impact on the index value, reflecting their potentially more crucial role in the solution computation and the system performance. A second measure of the location of a satellite is its normalized transportation cost:
where c0k is the transportation cost between the depot and the satellite k, and are the minimum and maximum values of the transportation costs of the 1st-level, respectively. The first set of instances (Gonzalez Feliu et al., 2008) is made out of 66 small-sized instances with 1 depot, 12 customers and 2 satellites sited at customer locations, each instance displaying a different satellite-location combination (such a satellite-location case is quite common in the
2minc 2
maxc
0β >0.1β =
10
1 1100 ,k mink
max min
c ccc c
−=
−1 1 and min maxc c
Two-Echelon Vehicle Routing Problem: A Satellite Location Analysis
CIRRELT-2009-15 3

distribution industry, e.g., grocery distribution). When a node is both a customer and a satellite, the arc cost cki, is set to 0. The number of vehicles for the 1st-level is set to 2 and to 4 for the 2nd-level. The capacity of the 1st-level vehicles is 2.5 times the capacity of the 2nd-level vehicles. The loading/unloading cost is set to 0, while arc costs are equal to their lengths. These instances were solved by the method of Gonzalez Feliu et al. (2008). We solved all the pairs of customers as possible satellite location and contrasted the results with the optimal solution of the original VRP instance (without satellites and with optimum equal to 290). We report in Figure 1 the dispersion of the optima of the 66 instances with respect to the mean transportation cost from the depot to the satellites, and the mean accessibility index of the satellites. The mean transportation costs are grouped into three sets: Low with costs in the [0,50] interval; Medium for [50,67]; and High for [67,100]. The mean transportation costs are plotted on the X axis of the left display of Figure 1, while the ratio between the optima of the 2E-VRP and VRP instances is plotted on Y axis (a ratio greater than 1 means that the optimum of the 2E-VRP instance is worse than that of the VRP one). The graph indicates that the instances with an optimum better than that of the VRP are characterized by a low mean transportation cost from the depot to the satellites. The greater this cost, the less likely to obtain an improved optimum. On the other hand, because it appears possible to obtain a gain even when it is high, the mean transportation cost from the depot to the satellites is not the only parameter to be taken into account. The right display of Figure 1 thus addresses the mean accessibility index of the satellites. Given
and , the satellites are grouped into three sets: Low (L), Medium (M) , and High (H) with mean accessibility in the first, second, and third thirds of the
interval. The X axis displays the mean accessibility index, while the Y axis indicates the same ratio between the optima of the 2E-VRP and VRP instances as before. The display indicates that two-echelon systems tend to gain when the accessibility increases. It also indicates, however, that this is not the only factor explaining the performance of the system. Table 1 presents a summary of the results: the accessibility values are given in the rows and the transportation cost in the columns. Each cell contains the number of instances with an objective function better/worse than the one of the capacitated VRP. These results show that a two-echelon system gives its best results when the mean transportation cost to satellites is less than 50% of the maximum transportation cost (low transportation cost), with the ratio between gain and loss decreasing while the accessibility index decreases. When the mean transportation cost is medium, the costs of using the satellites are lower than for the single-echelon system, which means that the quality of the result is mainly related to the dispersion of the customers, while with a low accessibility it is difficult to obtain a gain on the total costs. With a high mean transportation cost, it becomes hard to obtain a lower transportation cost for the two-echelon system, even in presence of a high accessibility index. This is mainly due to the fact that even if the satellites are placed in the neighbourhood of the customers, they are usually near the border of the customers' area, so the transportation cost paid in the 1st level to reach the satellites is not compensated by the gain due to the proximity of the satellites to the customers and the consequent reduction of the
min { }min k kA A= max { }max k kA A=
[ ]min maxA , A
Two-Echelon Vehicle Routing Problem: A Satellite Location Analysis
CIRRELT-2009-15 4

2nd-level fleet routes. In general, however, this experiment supports the idea of a benefit in using a 2E-VRP distribution model instead of a VRP one.
Figure 1. 12-customers instances: dispersion of traveling costs and accessibility
Accessibility Transportation cost
L M H H 8/10 2/4 0/4 M 15/1 5/0 0/6 L 11/1 3/4 1/1
Table 1. Summary of results for 12-customer instances SATELLITE AND CUSTOMER DISTRIBUTION ANALYSIS The second set of experiments has been effectuated on medium size instances obtained by combining different customer and satellite distributions, and varying the number of satellites. We generated sets of instances with 50 and 100 customers, combining three customer distributions and three satellites location patterns, with 2, 3, and 5 satellites. Two instances were generated for each combination, for a total of 54 instances with 50 customers and the same number with 100 customers. In all cases, the region where customers are located was represented as a square of 100 x 100 space units and the depot was randomly located within a 100 x 50 rectangle placed 50 space units above the customer square. The three customer distribution patterns are: 1. Random to represent a regional distribution. The X and Y coordinates of customers were
randomly chosen with a [0,100] uniform distribution; 2. Centroids to represent downtown and suburb zones in a large city. The downtown zones were
represented as a 40 x 40 square located in the center of the big square standing for the city, while four 20 x 20 squares placed in the corners of the large square represented the suburbs. Six customer centroids were located within the central zone and one for each corner zone. An imaginary circle of 10 space-units radius was drawn around each centroid and a fixed number of customers were randomly located within each. The number of customers around each
Two-Echelon Vehicle Routing Problem: A Satellite Location Analysis
CIRRELT-2009-15 5

centroid depended on the total number of customers and was given by an integer approximation of the ratio customers/number of centroids;
3. Quadrants to simulate the case of small towns located on the side of a river, a major route, or in a valley, where customers are clustered into large zones (e.g., on the sides of the river, etc.). The square standing for the zone of possible customer locations was divided into four quadrants. A customer is randomly located in each quadrant in a position allowing a 20 space-unit-radius circle around it completely within the square. A fixed number of customers given by an integer approximation of the ratio customers/number of quadrants was then randomly located within each of these circles.
Satellite location can be constrained by various geographic, land-use or logistics restraints. To better understand the relations between these conditions and the performance of a two-echelon distribution system, three different satellite location patterns were considered: 1. Random. This pattern simulates a situation without constraints, in which satellites can be
distributed all around the city. The satellites are thus randomly located in a ring 20 space-units thick around the customer location square. This may result in several satellites being located close to one another and a large zone of the city not receiving any satellite, a not so-enviable situation;
2. Sliced. This pattern addresses the location issue identified previously. The ring around the customers is divided into n slices, where n represents the number of satellites, and a satellites is randomly placed inside each slide;
3. Forbidden Zone. Various conditions, e.g., the city is located near the sea or a mountain, may forbid the location of any satellite in given zones of the city. To recreate such cases, an angle Θ in the range [0, 360] is randomly chosen and satellites are not located in the part of the ring defined by that angle.
Figures 2, 3, and 4 illustrate the behaviour of the solution quality with respect to the different customer distributions, satellite-location patterns, and number of satellites, respectively. Each figure reports the instance number on the X axis, while on the Y axis is given the percentage gap of each solution relative to the solution obtained with the best customer distribution, the best satellite location pattern, and the number of satellites minimizing the global cost, respectively. In Figure 4, we also give the result of the classical VRP as a measure of the impact of the satellite introduction on the global transportation costs.
Figure 2. Comparison of results for different customer distributions
Two-Echelon Vehicle Routing Problem: A Satellite Location Analysis
CIRRELT-2009-15 6

The results indicate that random-customer distribution yield worse performances than those obtained with the centroids and quadrants ones, independently of the number of customers and satellites. This was expected because customers are already clustered in the last two cases, which makes their assignment to satellites much easier compared to a completely random distribution. The best satellite location pattern appears to be the random one (Figure 3). This result may appear unexpected but it is not unreasonable. Indeed, the constraints on where one may locate satellites in the other patters, e.g., the obligation to use each slice, may result in a satellite being located in a zone where it is useless. This tendency seems to become stronger when the number of satellites increases. Obviously, however, these results serve only to emphasize the need for a methodology for distribution systems with two-echelon routing to locate satellites according to the respective customer distribution. As illustrated in Figure 4, the use of satellites yields much better results than a standard VRP distribution. Increasing the number of satellites accentuates this result. For five satellites, for example, the cost of the two-echelon system is less than 50% of the cost of the standard approach. Of course, the appropriate number of satellites has to be determined using a formal model, which would balance the customer demand, the cost of transportation, and the costs to establish and operate satellites, but these results emphasize the interest of two-echelon models for situations with more than 50 customers.
Figure 3. Comparison of results for different satellite-location patterns
Figure 4. Comparison of results for different numbers of satellites
Two-Echelon Vehicle Routing Problem: A Satellite Location Analysis
CIRRELT-2009-15 7

VARIABLE-DENSITY CUSTOMER DISTRIBUTION AND SMART SATELLITE LOCATION The third set of experiments addresses large size instances with variable-density customer distribution that influence the satellites locations, more satellites being located near the areas with high customers densities. Problem instances with 150 and 250 customers, 5, 7, and 10 satellites, and different depot locations were generated. Two instances were generated for each combination of parameters, for a total of 24 instances. Instances were generated as follows. The square representing the customer area was split into four quadrants. Defining m = n/10, where n stands for the number of customers, four zones were defined and randomly associated to the quadrants: a high-density zone with 5*m customers, a medium-density zone with 3*m customers, and two low-density zones with m customers each. For instances with 10 satellites, 5 were randomly located in the high-density zone, 3 in the medium one, and 1 in each low-density zone. For each of these instances, corresponding 7 and 5-satellite instances were created closing randomly 3 and 7 satellites, respectively. Three depot-location configurations have been tested. In the first configuration, the depot is located between 50 and 100 units beyond the upper frontier of the square (recall that the square is 100 x 100 units). The depot is located closer to the customers in the second configuration, in a layer between 0 and 20 units beyond the upper frontier of the square. Finally, in the third configuration, the depot is located inside the customer area, ± 25 units from the center of the square.
Figure 5. Comparison of different numbers of satellites and standard VRP Figure 5 reports the results obtained with different number of satellites and with the standard VRP on the 150 and 250 customers instances. The X axis corresponds to the instances, while the Y indicates the gap in percentage gap relative to the best solution. On both set of instances, the standard VRP provides better results on average in the most cases, which recalls that additional operations may increase the cost of distribution. Actually, this average hides the impact of the depot location, analyzed further on. Comparing the performances with varying numbers of satellites, one notices that increasing this number is generally beneficial
Two-Echelon Vehicle Routing Problem: A Satellite Location Analysis
CIRRELT-2009-15 8
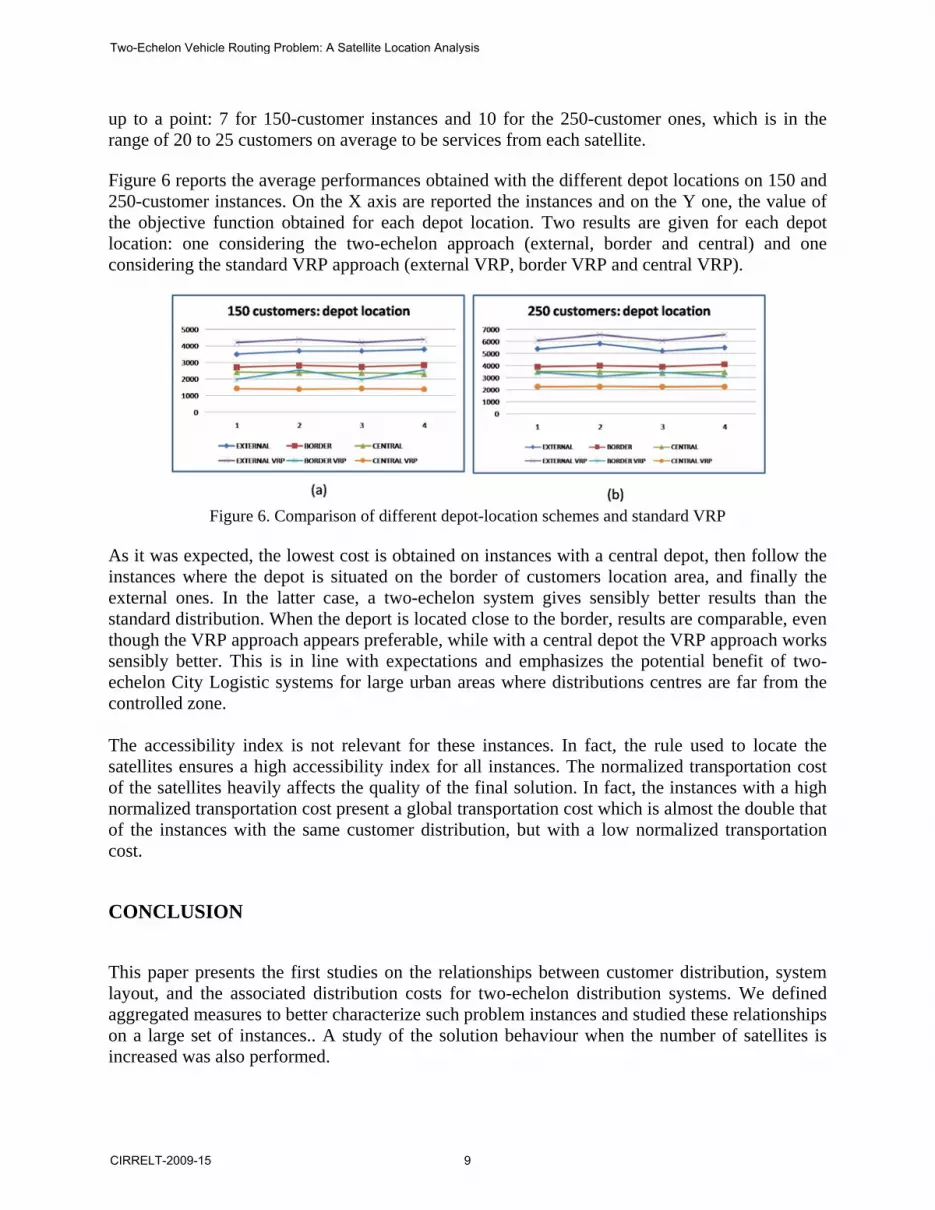
up to a point: 7 for 150-customer instances and 10 for the 250-customer ones, which is in the range of 20 to 25 customers on average to be services from each satellite. Figure 6 reports the average performances obtained with the different depot locations on 150 and 250-customer instances. On the X axis are reported the instances and on the Y one, the value of the objective function obtained for each depot location. Two results are given for each depot location: one considering the two-echelon approach (external, border and central) and one considering the standard VRP approach (external VRP, border VRP and central VRP).
Figure 6. Comparison of different depot-location schemes and standard VRP
As it was expected, the lowest cost is obtained on instances with a central depot, then follow the instances where the depot is situated on the border of customers location area, and finally the external ones. In the latter case, a two-echelon system gives sensibly better results than the standard distribution. When the deport is located close to the border, results are comparable, even though the VRP approach appears preferable, while with a central depot the VRP approach works sensibly better. This is in line with expectations and emphasizes the potential benefit of two-echelon City Logistic systems for large urban areas where distributions centres are far from the controlled zone. The accessibility index is not relevant for these instances. In fact, the rule used to locate the satellites ensures a high accessibility index for all instances. The normalized transportation cost of the satellites heavily affects the quality of the final solution. In fact, the instances with a high normalized transportation cost present a global transportation cost which is almost the double that of the instances with the same customer distribution, but with a low normalized transportation cost. CONCLUSION This paper presents the first studies on the relationships between customer distribution, system layout, and the associated distribution costs for two-echelon distribution systems. We defined aggregated measures to better characterize such problem instances and studied these relationships on a large set of instances.. A study of the solution behaviour when the number of satellites is increased was also performed.
Two-Echelon Vehicle Routing Problem: A Satellite Location Analysis
CIRRELT-2009-15 9

Computational results show that opening satellites reduces the global cost until a minimum cost is reached. After that minimum, adding new satellites will increase the global cost. That minimum is obtained with a number of customers/number of satellites ratio varying in the range (20, 25). The 2E-VRP approach obtains better performances with respect to the classical VRP for instances with a depot located externally with respect to the customer area. This emphasizes the benefit of two-echelon City Logistic systems for large urban areas where distributions centres are far from the controlled zone. This work was exploratory in nature and opens up interesting research directions. A richer set of costs should be studied, including, for example, different transportation costs for the first and the second levels, and satellite opening and managing costs. Extensions to multi-depot and time-dependent problem settings appear both challenging and timely. Similarly, introducing the 2E-VRP methodology into a location-routing framework would pave the way for a comprehensive set of tools to plan efficient City Logistics systems. ACKNOWLEDGMENTS While working on this project, the first author was the NSERC Industrial Research Chair on Logistics Management, ESG UQAM, and Adjunct Professor with the Department of Computer Science and Operations Research, Université de Montréal, and the Department of Economics and Business Administration, Molde University College, Norway. Partial funding for this project has been provided by the Italian Ministero dell'Università e della Ricerca through “Progetto PRIN 2007 - Problemi Integrati di Vehicle Routing e Container Packing: Modelli ed Algoritmi”. Funding has also been provided by the Natural Sciences and Engineering Research Council of Canada (NSERC), through its Industrial Research Chair and Discovery Grants programs, by the partners of the Chair, CN, Rona, Alimentation Couche-Tard and the Ministry of Transportation of Québec, and by the Fonds de recherche sur la nature et les technologies (FQRNT) through its Team Research Grants program. REFERENCES Benjelloun, A. & Crainic, T.G. (2008). Trends, Challenges and perspectives in City Logistics, In
Transportation and Land Use Interaction, Proceedings TRANSLU’08, pp. 269-284. Editura Politecnica Press, Bucharest, Romania.
Crainic, T.G., Mancini, S., Perboli, G. & Tadei, R. (2008). Heuristics for the two-echelon capacitated vehicle routing problem. Publication CIRRELT-2008-46, CIRRELT, Université de Montréal, Canada.
Crainic, T.G., Ricciardi, N. & Storchi, G. (2004). Advanced freight transportation systems for congested urban areas. Transportation Research Part C, Emerging Technologies, 12: 119-137.
Crainic, T.G., Ricciardi, N. & Storchi, G. (2009). Models for evaluating and planning City Logistics systems. Transportation Science.
Two-Echelon Vehicle Routing Problem: A Satellite Location Analysis
CIRRELT-2009-15 10

Gonzalez Feliu, J., Perboli, G. Tadei, R. & Vigo, D. (2008). The two-echelon capacitated vehicle routing problem. Technical Report OR/02/08, Politecnico di Torino.
Hansen, W.G. (1959). How accessibility shapes land use. Journal of the American Institute Planners, 25, 73-76.
ILOG (2005). ILOG Dispatcher 4.1 User's Manual, ILOG.
Perboli, G., Tadei, R., & Vigo, D. (2008). The two-echelon capacitated vehicle routing problem, Publication CIRRELT-2008-55, CIRRELT, Université de Montréal, Canada.
Ralphs, T.K., Kopman, L., Pulleyblank, W.R. & Trotter, L.E. (2003). On the capacitated Vehicle Routing Problem, Mathematical Programming, 94, 343-359.
Two-Echelon Vehicle Routing Problem: A Satellite Location Analysis
CIRRELT-2009-15 11
Recommended


