INSTITUTO NACIONAL DE PESQUISAS DA AMAZÔNIA -INPA
PROGRAMA DE PÓS-GRADUAÇÃO EM GENÉTICA, CONSERVAÇÃO
E BIOLOGIA EVOLUTIVA
Conservação, biogeografia e evolução do jacaré-paguá (Paleosuchus
palpebrosus): um complexo de espécies a ser desvendado
Fábio de Lima Muniz
Manaus
2018
1

Fábio de Lima Muniz
Conservação, biogeografia e evolução do jacaré-paguá (Paleosuchus
palpebrosus): um complexo de espécies a ser desvendado
Orientador: Tomas Hrbek, PhD.
Coorientadoras: Izeni Pires Farias, PhD.
Zilca Campos, PhD (Embrapa Pantanal, MS).
Tese apresentada ao InstitutoNacional de Pesquisas daAmazônia como parte dosrequisitos para obtenção dotítulo de Doutor em Genética,Conservação e BiologiaEvolutiva.
Manaus
2018
2

3III

M966 Muniz, Fábio de LimaConservação, biogeografia e evolução do jacaré-paguá
(Paleosuchus palpebrosus): um complexo de espécies a ser desvendado / Fábio de Lima Muniz. --- Manaus : [s.n.], 2018.
xiv, 146 f. : il. color.
Tese (Doutorado) --- INPA, Manaus, 2018.Orientador : Tomas Hrbek.Coorientadora: Izeni Pires Farias.Área de concentração : Genética, Conservação e Biologia Evolutiva.
1.Jacaré-paguá. 2. Paleosuchus palpebrosus. 3. Hibridização. I. Título.
CDD 597.980415
IV

Dedico esse trabalho à minha família, que considero
o bem mais precioso dessa vida e a todos que
contribuíram para a formação do meu caráter.
VV

AGRADECIMENTOS
Ao meu orientador Tomas Hrbek. Muita gratidão pela oportunidade de compartilhar
conhecimentos e alegrias dos trabalhos realizados. Obrigado também por me instruir
pacientemente nos momentos de dúvidas. Sua dedicação e inteligência me inspiram a procurar
aprender sempre mais.
À minha coorientadora Izeni Farias. Por ser essa mãezona que me acolheu no laboratório há
uns anos atrás e sempre me motiva a ser um pesquisador cada vez melhor. Sinto um carinho
muito grande e adimiro muito como pessoa e pesquisadora.
À minha coorientadora Zilca Campos. Por ser uma amiga/mãe em minha vida. Sem sua
presença minha formação como pessoa e pesquisador deixaria muito a desejar do que é hoje.
Obrigado por compartilhar tantas experiências e amizade ao longo desses anos. Prometo me
dedicar para fazer juz ao grande investimento e confiança depositados em mim.
Ao INPA pela estrutura do curso de pós-graduação e pela estrutura técnico-científica sempre
disponível ao longo desses quatro anos de doutorado.
Ao programa de Pós-graduação em Genética, Conservação e Biologia Evolutiva (PPG
GCBEv) pela estrutura do curso de doutorado e por ter proporcionado disciplinas
fundamentais para desenvolvimento deste trabalho. Em especial, aos professores deste
programa interessados em formar profissionais de qualidade.
Às instituições que apoiaram e financiaram esse trabalho: FAPEAM, CNPq/CT-Amazon,
Embrapa Pantanal (Macroprogram 3), Fundect Fundação O Boticário, Santo Antônio
Energia, Norte Energia, Tractebel, Crocodilian Specialist Group - IUCN.
Aos amigos de laboratório que contribuíram direta e indiretamente para que este trabalho
tenha se concretizado. Em especial ao Érico Polo, Joice Farias, Roberto Zamora e Pedro
Senna por me apoiarem na reta final com análises e comentários que foram essenciais para o
trabalho. Também aos que me apoiaram ao longo da caminhada, ajudando em excursões de
coleta ou no laboratório: Aline Ximenes, Priscila Azarak, Valéria Machado, Luciana Frazão,
Pedro Senna, Mário Nunes, Sandra Hernandez, José Gregório.
VIVI

A todos os companheiros de Laboratório (LEGAL) pelas contribuições sobre o trabalho e
pelas discussões de artigos e trocas de ideias que enriqueceram muito minha formação
acadêmica.
A companheiros valorosos que contribuíram com esforço e dedicação durante as excursões de
coleta: Zilca Campos, Dênis Tilcara, Zairo, Reginei (Ney), Roberto (Potó), Pedro Senna,
Priscila Azarak, Luciana Frazão, João Danilo e tantos ajudantes locais que tivemos durante
essa longa caminhada.
Aos revisores anônimos que deram sugestões e promoveram melhorias nos trabalhos que
foram submetidos, bem como, aos professores que participaram da minha banca de
qualificação (Serginho Borges, Camila Ribas e Maria Doris) e na minha defesa do doutorado
(Camila Ribas, Fernanda Werneck, Marina Anciães, Igor Kaefer e Rafael Leite) e forneceram
contribuições valiosas para que este produto final esteja apresentado de maneira satisfatória.
À minha esposa que me apoiou em todos os momentos, tendo paciência nos momentos
difíceis e me motivando a persistir e a manter o pensamento positivo até o final. Obrigado por
tudo!
Aos meus familiares, que por meio do afeto e dedicação, moldaram minha personalidade e
contribuíram diretamente para que eu alcançasse ess objetivo de vida, em especial: Gracilde
(minha mãe), Flávio Muniz (meu pai), Márcio Júnio (irmão), José Muniz (avô), Ermelinda
Muniz (avó).
Aos cidadãos brasileiros que pagam seus impostos e possibilitam que a ciência permaneça
viva nesse país, apesar de tanta corrupção. Que minha dedicação seja suiciente para fazer
valer a pena o investimento da sociedade, enquanto tantos apenas sobrevivem e nem o básico
possuem.
VIIIVIIVIIIVIIIXVII

“A man who dares to waste one hour of time
has not discovered the value of life.”
Charles Darwin
VIIVIIVIIIVIIIXVIII
RESUMO
A região Neotropical é uma zona biogeográfica hiperdiversa e com diversidade subestimada.
O recente avanço no uso de ferramentas moleculares contribuiu para a descoberta de que,
muitas espécies previamente consideradas com ampla distribuição são, na verdade, complexos
de espécies. As espécies amplamente distribuídas são, em geral, classificadas como de menor
preocupação para a conservação, entretanto, as espécies pouco estudadas e que ocorrem em
uma gama de ambientes heterogêneos e/ou descontínuos são fortes candidatas a abrigar
linhagens evolutivas distintas, possivelmente escondendo linhagens ameaçadas de extinção. O
jacaré-paguá (Paleosuchus palpebrosus), um dos menores crocodilianos existentes, pode ser
considerada uma espécie pouco estudada que possui comportamento críptico e ampla
distribuição na América do Sul, ocorrendo em diferentes biomas e bacias hidrográficas. Nesse
estudo, nós identificamos diversidade críptica em P. palpebrosus, delimitando linhagens
evolutivas independentes, traçamos um modelo biogeográfico e investigamos os processos
evolutivos que atuaram durante o processo de diversificação das linhagens recém-descobertas.
Para isso, fizemos uma densa amostragem por quase toda a distribuição da espécie e
combinamos o uso do tradicional marcador mitocondrial citocromo b com marcadores
genômicos SNPs e ddRADs, obtidos por meio de Next-Generation Sequencing (NGS). Nós
delimitamos três Unidades Evolutivas Significantes (ESUs) e duas Unidades de Manejo
(MUs) e sugerimos que P. palpebrosus é um complexo de espécies. Verificamos que o
rearranjo de drenagem foi o principal promotor da diversificação do complexo P. palpebrosus
no corredor Paraguai-Madeira-Amazônia, então propusemos um modelo de evolução da
paisagem para explicar essa diversificação, discutindo a utilidade desse modelo para outras
espécies aquáticas da região. Além disso, testamos diferentes modelos migração e verificamos
a ocorrência de Transferência Lateral de Genes (LGT) e contato secundário entre linhagens
geograficamente adjacentes.
VIIIVIIVIIIVIIIX

ABSTRACT
The Neotropical region is a hyper-diverse biogeographical zone with an underestimated
diversity. Recent advances in the use of molecular tools has contributed to the discovery of
many species complex in previous broadly distributed species. Broadly distributed species are
generally classified as of Least Concern for conservation, however, species that are poorly
studied and occur in a range of heterogeneous and/or discontinuous environments are strong
candidates to harbor distinct evolutionary lineages, possibly hiding lineages at extinction risk.
The Cuvier´s dwarf caiman (Paleosuchus palpebrosus), one of the smallest living
crocodilians, can be considered a poorly studied species with a cryptic behavior and wide
distribution in South America, occurring in several different biomes and watersheds. In this
study, we identified cryptic diversity in P. palpebrosus, delimiting independent evolutionary
lineages, elaborated a biogeographic model and investigated the evolutionary processes that
acted during the diversification process of the newly discovered lineages. For this, we did
dense sampling along almost the entire distribution of the species and combined the use of the
traditional mitochondrial cytochrome b marker with genomic markers SNPs and ddRADs
obtained by Next Generation Sequencing (NGS). We delimit three Evolutionarily Significant
Units (ESUs) and two Management Units (MUs) and suggest that P. palpebrosus is a species
complex. We verified that the drainage rearrangement was the main promoter of the P.
palpebrosus complex diversification in the Paraguay-Madeira-Amazonia corridor, so we
proposed a landscape evolution model to explain this diversification, discussing the
usefulness of this model for other aquatic species in the region. In addition, we tested different
migration patterns and verified the occurrence of Lateral Gene Transfer (LGT) and secondary
contact between geographically adjacent lineages.
IXVIIVIIIVIIIXX

Sumário
AGRADECIMENTOS.............................................................................................................VI
RESUMO..................................................................................................................................IX
ABSTRACT...............................................................................................................................X
LISTA DE FIGURAS.............................................................................................................XIII
LISTA DE TABELA...............................................................................................................XV
INTRODUÇÃO GERAL............................................................................................................1
OBJETIVOS...............................................................................................................................9
Objetivo Geral........................................................................................................................9
Objetivos Específicos.............................................................................................................9
CAPÍTULO 1............................................................................................................................10
Acknowledgments................................................................................................................13
ABSTRACT.........................................................................................................................14
INTRODUCTION................................................................................................................15
METHODS...........................................................................................................................17
Sample and molecular data collection.............................................................................17
Cyt b and ddRADseq analysis.........................................................................................19
RESULTS.............................................................................................................................22
DISCUSSION......................................................................................................................25
Delimiting Cuvier’s dwarf caiman units for conservation..............................................25
Genetic diversity of mitochondrial lineages....................................................................27
Implications for the conservation of P. palpebrosus........................................................28
REFERENCES.....................................................................................................................33
SUPPLEMENTARY MATERIAL.......................................................................................46
CAPÍTULO 2............................................................................................................................49
ABSTRACT.........................................................................................................................51
INTRODUCTION................................................................................................................53
MATERIAL AND METHODS............................................................................................56
Study area and sample collection....................................................................................56
Molecular data collection................................................................................................56
XVIIVIIIVIIIXXI

Data analyses...................................................................................................................57
RESULTS.............................................................................................................................60
DISCUSSION......................................................................................................................62
Phylogeny and divergence time estimation of lineages...................................................63
Biogeographic model for biological diversification across the Madeira basin...............65
Can this model be applied to other aquatic species?.......................................................68
REFERENCES.....................................................................................................................74
SUPPORTING INFORMATION.........................................................................................85
CAPÍTULO 3............................................................................................................................87
RESUMO.............................................................................................................................89
INTRODUÇÃO....................................................................................................................90
MATERIAL E MÉTODOS..................................................................................................93
Coleta dos dados genéticos..............................................................................................93
Análise dos dados mitocondriais.....................................................................................95
Análise dos dados genômicos..........................................................................................97
RESULTADOS...................................................................................................................102
Estruturação genética e demografia histórica com o gene cyt b....................................102
Filogenômica e hibridização no complexo P. palpebrosus............................................104
DISCUSSÃO......................................................................................................................106
Reconstrução das áreas ancestrais e rota de dispersão..................................................108
Filogenômica de P. palpebrosus....................................................................................109
REFERÊNCIAS.................................................................................................................124
MATERIAL SUPPLEMENTAR........................................................................................129
SÍNTESE GERAL..................................................................................................................131
REFERÊNCIAS BIBLIOGRÁFICAS....................................................................................133
APÊNDICE A.........................................................................................................................138
APÊNDICE B.........................................................................................................................142
XIVIIVIIIVIIIXXII

LISTA DE FIGURAS
CAPÍTULO 1
Figura 1. Mapa com todos os sítios de amostragem, resultados do BAPS e rede de haplótipo
baseada no gene mitocondrial cyt b..........................................................................................43
Figura 2. Árvore baseada no gene cyt b mostrando as relações filogenéticas entre as
linhagens de Paleosuchus palpebrosus.....................................................................................44
Figura 3. Mapa mostrando a distribuição geográfica dos indivíduos analisados com
marcadores ddRAD e resultado do STRUCTURE com correpondência aos clusters de cyt b....45
CAPÍTULO 2
Figura 1. Mantel Test parcial usado para quantificar a contribuição relativa do isolamento por
distância e do isolamento histórico...........................................................................................81
Figura 2. Filogenia calibrada com tempo das linhagens de P. palpebrosus com base no gene
mitocondrial cyt b.....................................................................................................................82
Figura 3. Árvore de espécies calibrada com tempo inferida com base no SNAPP usando 532
SNPs bialélicos não ligados......................................................................................................83
Figura 4. Mudanças geológicas na paisagem Amazônica e do Pantanal durante os últimos
4ma que influenciaram a diferenciação das linhagens de P. palpebrosus.................................84
Figura S1. Redes de haplótipos dos genes Myc, C-Mos e DEN..............................................85
Figura S2. Árvore calibrada com tempo alternativa, usando somente calibração fóssil.........86
CAPÍTULO 3
Figura 1. Distribuição geográfica das localidades amostradas, incluindo a amostragem feita
por Muniz et al. (2018) e gráfico do BAPS mostrando o valor de K mais provável, K = 5.. .115
Figura 2. Parâmetros estimados e modelos de isolamento com migração testados usando o
programa G-PhoCS (Gronau et al., 2011)...............................................................................116
Figura 3. Rede de haplótipos mostrando a relação genealógica entre as linhagens. As cores
correspondem aos grupos detectados na análise do BAPS e mostrados na Figura 1..............117
Figura 4. Demografia histórica de cada uma das linhagens do complexo P. palpebrosus
estimada com base em sequências do gene mitocondrial cyt b..............................................118
XIIVIIVIIIVIIIXXIII

Figura 5. Difusão de Árvore de Espécies no gênero Paleosuchus.........................................119
Figura 6. Reconstrução de áreas ancestrais do gênero Paleosuchus realizadas no
BioGeoBEARS.......................................................................................................................120
Figura 7. Árvores de espécies reconstruídas no programa STARBEAST2 utilizando dois
conjuntos de dados diferentes ................................................................................................121
Figura 8. Árvore de espécies reconstruída no programa ASTRAL-III .................................122
Figura 9. Melhores topologias e modelos de migração estimados no programa G-PhoCS ..123
Figura S1. Árvore filogenética reconstruída com base no cyt b por meio de Inferência
Bayesiana realizada no MrBayes............................................................................................129
Figura S2. Análise de suporte dos nós da árvore de espécies reconstruída no programa
ASTRAL-III feita com o programa Quartet Sampling...........................................................130
XIIIVIIVIIIVIIIXXIV

LISTA DE TABELA
CAPÍTULO 1
Table 1. Pairwise FST between cyt b groups previously established by BAPS cluster analysis
...................................................................................................................................................40
Table 2. Summary of results of the population analysis using cytochrome b gene and ddRADs
genomic marker, the correspondent geographic distribution of each and the type of
evolutionary lineages proposed for geographic groups............................................................41
Table 3. Population parameters and genetic diversity indexes in P. palpebrosus populations
and in other crocodilian species................................................................................................42
Tabela S1. Localidades de estudo mostrando as coordenadas geográficas, o número de
indivíduos utilizados com o gene cyt b e o marcador ddRADseq, bem como a correspondência
com as localidades da Figura 2.................................................................................................47
Tabela S2. Sítios diagnósticos de cada ESU baseado na filosofia de Population Aggregation
Analysis (PAA)..........................................................................................................................48
CAPÍTULO 3
Tabela 1. Sumarização das filtragens realizadas com o banco de dados genômicos.............112
Tabela 2. Comparação entre os valores de log Likelihood para cada modelo do
BioGeoBEARS estimados com base nos dados de cyt b........................................................113
Tabela 3. Parâmetros demográficos estimados com base nos melhores modelos de migração
estimados no program G-PhoCS.............................................................................................114
XIVVIIVIIIVIIIXXV

INTRODUÇÃO GERAL
A região Neotropical é uma zona biogeográfica hiperdiversa que compreende os
principais biomas tropicais. Parte dessa biodiversidade permanece não descrita e
provavelmente é subestimada (Hughes et al., 2013). Desde o último século, biólogos
evolucionistas têm estudado insistentemente a origem de tanta diversidade nas regiões
tropicais e se esforçam para entender os processos biogeográficos e evolutivos que estão por
trás dessa diversificação tão alta (Moritz et al., 2000; Berminghan & Dick, 2005).
Muitas teorias foram desenvolvidas na tentativa de encontrar quais dos eventos
biogeográficos melhor explicariam o padrão atual de distribuição da biodiversidade
neotropical, tais como: “rios como barreiras”, “refúgios”, “arcos estruturais”, entre outras (ver
revisão em Leite & Rogers, 2013). No entanto, segundo Moritz et al. (2000) todas essas
hipóteses podem ser colocadas em duas categorias: as que invocam baixas taxas de extinção
(hipótese dos museus) e as que focam em altas taxas de especiação (hipótese dos distúrbios).
Atualmente é aceito que somente múltiplas causas atuando em conjunto poderiam gerar uma
diversificação de grande magnitude nos trópicos (Bush, 1994; Moritz et al., 2000), em
especial porque as teorias não são mutuamente excludentes e são temporalmente distintas.
A tendência atual da biogeografia é investigar como eventos paleogeográficos,
ocorridos em dado espaço e tempo, afetaram a biota de determinada região, em detrimento da
clássica ideia de elaborar uma hipótese geral capaz de explicar a diversificação de todas as
espécies. Nesse sentido um campo emergente em biogeografia tem sido a filogeografia
comparada, uma subárea da biogeografia que estuda a distribuição geográfica da variação
genética de populações naturais em um contexto histórico e comparativo (ver Avise et al.,
1987; Avise, 2000; Arbogast & Kenagy, 2001; Riddle & Hafner, 2004). Essa ciência baseia-se
1

no princípio de que determinado evento histórico pode ter criado padrões semelhantes de
distribuição da variabilidade genética em espécies coexistentes e com estilos de vida
semelhantes. Em contrapartida, espera-se que espécies que apresentam histórias de vida
diferentes respondam diferentemente ao mesmo evento histórico (Moritz et al., 2000; Henle
et al., 2004; Ewers & Didham, 2006; Prug et al., 2008). Para a filogeografia comparada, tão
importante quanto o estilo de vida é que as espécies a serem comparadas possuam uma
distribuição ancestral semelhante.
Ao testar uma hipótese biogeográfica é importante levar em consideração o estilo de
vida e a capacidade de dispersão que a espécie estudada possui, dentre outros fatores
ecológicos (Dormann et al., 2007; Öckinger et al., 2010). De um modo geral, as hipóteses
biogeográficas têm sido testadas através de espécies cujo estilo de vida é estritamente terrestre
ou estritamente aquático e, portanto, pouco se sabe sobre a biogeografia de espécies com
hábitos semiaquáticos, como é o caso dos crocodilianos. Para dada espécie aquática um
evento de captura de cabeceiras pode proporcionar um contato secundário entre linhagens
previamente isoladas, mas para outra espécie, que estava ausente na bacia adjacente, o mesmo
evento de captura pode favorecer a geodispersão e a ampliação da área de distribuição prévia
da espécie.
Do ponto de vista da conservação, em geral, espécies que são amplamente
distribuídas são classificadas como de baixa prioridade, principalmente porque são
consideradas abundantes e com maiores possibilidades de sobrevivência. No entanto, o
desenvolvimento e ampliação do uso de ferramentas moleculares em espécies não-modelos
tem revelado que muitas das espécies amplamente distribuídas são, na verdade, complexos de
espécies, possivelmente escondendo linhagens que estão sob ameaça de extinção (Frankham
22

et al., 2010).
É fato que o número de espécies ameaçadas ultrapassa, e muito, os recursos
destinados à conservação, gerando a necessidade de se estabelecer prioridades. Portanto,
reconhecer espécies crípticas e linhagens evolutivas independentes é fundamental para
direcionar esses recursos para espécies ou linhagens prioritárias (Moritz, 1994; Crandall et al.,
2000; Allendorf et al., 2013). As linhagens evolutivas mais comumente usadas para fins de
conservação são as Evolutionarily Significant Unit (ESU) e Management Unit (MU). As
ESUs podem ser geneticamente estruturadas em MUs (sensu Moritz, 1994; Funk et al., 2012),
e estas, por sua vez, seriam a unidade lógica para efetuar o monitoramento e o manejo das
populações (Moritz, 1994).
O conceito de ESUs e MUs surgiram justamente com o intuito de estabelecer bases
racionais para definir prioridades para a conservação em nível intraespecífico (Moritz, 1994;
Allendorf & Luikart, 2007). Existe um amplo debate sobre o uso ou não dessas unidades para
a conservação, pois os critérios utilizados para definir ESUs são similares aos utilizados para
delimitar espécies (Roe & Lydeard, 1998), além disso, cada conceito foca em diferentes
etapas de um mesmo processo evolutivo, a especiação (de Queiroz, 2007). Apesar das
controvérsias, biólogos conservacionistas advogam que os esforços para a conservação devem
centrar-se em unidades de variação genética independentes, com potencial adaptativo para
responder aos desafios ecológicos futuros (Fraser & Bernatchez, 2001) independentemente de
serem reconhecidas taxonomicamente como espécies. Eles argumentam que, do ponto de vista
da conservação, é mais importante manter o potencial evolutivo de populações naturais
(Moritz et al., 1995; Waples, 1995), que merecem ser conservadas por possuírem adaptações
locais únicas que seriam perdidas caso elas viessem a ser extintas (Haig, 1998).
3

Fraser & Bernatchez (2001) propuseram um método integrativo que concilia os
diferentes pontos de vistas sobre quais critérios deveriam ser utilizados para delimitar ESUs
(Waples, 1991; Avise, 1994; Moritz, 1994; Crandall et al., 2000), o framework Adaptive
Evolutionary Conservation (AEC). Os autores sugerem utilizar os pontos fortes, sozinhos ou
em conjunto, de cada critério operacional previamente proposto, de modo que, quanto mais
critérios operacionais forem preenchidos maior a evidência de que as populações são
linhagens independentes. De acordo com o AEC framework, os principais critérios
operacionais utilizados para delimitar ESUs são: isolamento reprodutivo (Waples, 1991),
ausência de fluxo gênico (Waples, 1991; Moritz, 1994; Fraser & Bernatchez, 2001), monofilia
recíproca no mtDNA e diferenças significativas nas frequências alélicas de locus nucleares
(Avise, 1994; Moritz, 1994), e ausência de troca genética e ecológica com linhagens irmãs
(Vogler & DeSalle, 1994; Crandall et al., 2000).
Como pode ser observado, muitos desses critérios são essencialmente avaliados por
meio de ferramentas moleculares, que têm um papel fundamental não só no processo de
delimitação de unidades evolutivas, mas também na delimitação de espécies. Há pouco
tempo, as ferramentas moleculares mais utilizadas para diversos fins em genética de
populações (Avise, 2000, 2008), inclusive na identificação de ESUs, eram as sequências do
DNA mitocondrial (mtDNA). Algumas características vantajosas para estudos filogeográficos
tornaram esse marcador popular, tais como: (1) ausência de recombinação, que permite
avaliar a história evolutiva sem o efeito da recombinação e da hibridização; (2) tamanho
efetivo populacional quatro vezes menor que o genoma nuclear, o que permite investigar
eventos demográficos mais recentes; (3) e altas taxas evolutivas quando comparadas às do
genoma nuclear, tornando-o suficientemente polimórfico para estudos intraespecíficos (ver
44

Brown et al., 1982; Meyer, 1993; Li, 1997; Nedbal & Flynn, 1998).
Em contrapartida, algumas desvantagens devem ser levadas em conta, como é o caso
do viés sexual, da impossibilidade de detectar eventos de hibridização e da saturação entre
linhagens filogeneticamente distantes. O viés sexual pode ocorrer quando machos ou fêmeas
do táxon estudado possuem comportamentos filopátricos ou ainda capacidades de dispersão
diferentes (Hudson & Turelli, 2003), e nesses casos a história evolutiva contada pelo
marcador mitocondrial seria referente somente à história das fêmeas. Outro fator importante é
a impossibilidade do mtDNA de detectar hibridização, inclusive em casos de captura do
mtDNA entre espécies próximas, podendo induzir interpretações evolutivas erradas ou
incompletas. A saturação, por sua vez, ocorreria quando são avaliados táxons menos
relacionados filogeneticamente, e a taxa de mutação é tão alta que começam a acontecer
mutações homoplásicas (em sítios que já haviam mutado antes), saturando o sinal evolutivo.
Os resultados obtidos com o uso de um marcador molecular representam apenas a
história evolutiva daquele gene e podem não refletir a história real da espécie (ver revisão em
Nichols, 2001). Na busca por reconstruir árvores de espécies em detrimento de árvores
gênicas, os biólogos evolucionistas passaram a sequenciar também genes nucleares, que em
geral apresentam baixo polimorfismo, e portanto, pouco sinal filogenético em nível
intraespecífico. Nessa abordagem é necessário sequenciar não só uma quantidade razoável de
indivíduos como também de lócus, sendo necessário um alto consumo de tempo e dinheiro
para obtenção desses dados.
A recente revolução tecnológica, com o advento dos sequenciadores de nova geração,
ou Next Generation Sequencing (NGS), possibilitaram o uso de marcadores amplamente
distribuídos no genoma como RADseq (Restriction site Associated DNA sequencing) e SNPs
5

(Single Nucleotide Polymorphism). Tais marcadores estão revolucionando os campos de
Biogeografia e Genética da Conservação, pois permitem a obtenção de uma grande
quantidade de dados representativos do genoma de maneira rápida e custo-efetiva,
possibilitando maior poder estatístico, mais eficácia e maior resolução (Allendorf et al.,
2010). A aplicabilidade dos marcadores genômicos é ampla, possibilitando inclusive a
investigação de processos importantes para desvendar a história evolutiva de espécies não-
modelos, tais como: Incomplete Lineage Sorting (ILS), Lateral Gene Transfer (LGT),
hibridização, demografia histórica, tempos de divergência, para citar alguns (Luikart et al.,
2003; Allendorf et al., 2010), inaugurando assim um novo campo de pesquisas, a
filogenômica.
Nós realizamos um dos primeiros estudos filogenômicos em crocodilianos (Muniz et
al., 2018), grupo aparentemente bem estudado devido ao seu tamanho, valor econômico e
importância ecológica que desempenham (Grigg & Kirshner, 2015). Pesquisas recentes
evidenciam que algumas espécies de crocodilianos com morfologia conservada e ampla
distribuição são um complexo de espécies que contém linhagens evolutivas independentes
(Eaton et al., 2009; Hekkala et al., 2011; Shirley et al., 2014a). De maneira geral, as
principais lacunas do conhecimento sobre o grupo se apresentam em especial nas espécies que
ocorrem na região neotropical.
Na América do Sul, análises genéticas revelaram linhagens evolutivas profundas e
geograficamente estruturadas em Caiman yacare (Godshalk, 2006), Crocodylus acutus (Bloor
et al., 2015) e em Paleosuchus trigonatus (Bittencourt et al., em revisão). Na África, o uso de
ferramentas moleculares revelou que três gêneros de crocodilianos são compostos por
espécies crípticas (Eaton et al., 2009; Hekkala et al., 2011; Shirley et al., 2014a). Tais estudos
6

resultaram em mudanças taxonômicas nesse grupo, como: a retomada de nomes previamente
reconhecidos para as espécies Osteolaemus osborni (Eaton et al., 2009), Crocodylus suchus
(Hekkala et al., 2011) e para o gênero Mecistops (McAliley et al., 2006); a descoberta de
novas espécies Osteolaemus sp. nov. cf. tetraspis (Eaton et al., 2009; Franke et al., 2013;
Shirley et al., 2014b) e Mecistops sp. nov. cf. cataphractus (Shirley et al., 2014a); e a
identificação de duas linhagens evolutivas independentes em Osteolaemus tetraspis (Franke
et al., 2013; Shirley et al., 2014b).
Dentre as novas espécies de crocodilianos recém-descobertas, C. suchus e Mecistops
sp. nov. cf. cataphractus apresentam indícios de que estão muito ameaçadas, devido ao
declínio populacional ou mesmo à extinção em boa parte da sua distribuição, principalmente
devido à caça e perda de habitat em razão de atividades humanas (Hekkala et al., 2011;
Shirley et al., 2014a). Fato semelhante ocorreu com Osteolaemus tetraspis, que mesmo antes
de ser reconhecido como um complexo de espécies crípticas, já era considerado Vulnerável
pela lista vermelha da International Union for Conservation of Nature (IUCN),
principalmente devido à forte pressão de caça e à intensa perda de hábitats em sua distribuição
(Eaton, 2010). Estudos populacionais ainda estão sendo conduzidos para determinar o status e
facilitar a conservação independente dessas novas espécies (Smolensky, 2015), porém, não é
difícil deduzir que as distribuições geográficas mais restritas e os tamanhos efetivos
populacionais menores do que se pensava, colocam-nas em um estado de maior risco de
extinção que antes.
O jacaré-paguá (ou Cuvier’s dwarf caiman, Paleosuchus palpebrosus) é um
crocodiliano amplamente distribuído em 10 países da América do Sul. A IUCN o classifica
como Low Concern, principalmente devido a sua extensa área de distribuição, apesar de
7

admitir se tratar de uma espécie pouco conhecida (Magnusson & Campos, 2010). As
principais ameaças são em decorrência da perda e modificação de seus hábitats, como:
desmatamento, urbanização, poluição e represamento de rios (Campos et al., 1995;
Magnusson & Campos, 2010; Campos et al., 2013; Campos et al., 2015).
P. palpebrosus apresenta várias características comuns às espécies do gênero
Osteolaemus, dentre as quais estão: o pequeno porte, estando entre os menores crocodilianos
viventes (Eaton et al., 2009; Campos et al., 2010); a capacidade de viver em pequenos riachos
de cabeceira, em ambientes florestais; e apresentarem os hábitos mais terrestres dentre os
crocodilianos (Campos et al., 1995; Eaton, 2010; Magnusson & Campos, 2010). Essas
características comuns indicam que ambos podem responder de forma semelhante a eventos
paleogeográficos e que Paleosuchus pode estar tão propenso a cripticidade quanto
Osleolaemus. Essa possibilidade é acentuada pelo fato de P. palpebrosus ter ampla
distribuição e ocorrer em várias bacias hidrográficas (Magnusson & Campos, 2010),
separadas por barreiras ecogeográficas ou biogeográficas reconhecidas para diversas espécies
de vertebrados aquáticos e semi-aquáticos, tais como: peixes, ariranhas, botos e outros
crocodilianos (Hubert & Renno, 2006; Hubert et al., 2007; Hrbek et al., 2008; Pickles et al.,
2011; Gravena et al., 2014, 2015).
A biologia evolutiva de Paleosuchus palpebrosus, permanecia desconhecida até pouco
tempo atrás, quando Muniz (2012) investigou a filogeografia da espécie em parte da
Amazônia e no Pantanal. O estudo utilizou sequências completas do gene citocromo b (cyt b)
e detectou uma estrutura genética profunda na espécie, lançando luz sobre a distribuição de
sua variabilidade genética e levantando muitas outras questões a serem investigadas.
No presente estudo, nós fizemos uso de marcadores amplamente distribuídos no
8

genoma em conjunto com o marcador mitocondrial para investigar a diversidade críptica em
Paleosuchus palpebrosus, produzindo importantes contribuições para a biogeografia,
conservação e biologia evolutiva desse complexo de espécies.
OBJETIVOS
Objetivo Geral
✔ Determinar unidades evolutivas independentes no complexo de espécies Paleosuchus
palpebrosus, avaliando os processos biogeográficos e evolutivos que atuaram na
diversificação dessas linhagens.
Objetivos Específicos
✔ Delimitar Unidades Evolutivas Significantes (ESUs – Evolutionary Significants
Units) e Unidades de Manejo (MUs - Manejament Units) em Paleosuchus
palpebrosus.
✔ Avaliar a estruturação genética entre as linhagens encontradas e inferir os níveis de
diversidade gênica de cada uma delas, bem como examinar as implicações para a
conservação desse complexo de espécies.
✔ Inferir a ocorrência de eventos biogeográficos históricos que contribuíram para moldar
a distribuição atual das ESUs e MUs identificadas.
✔ Propor um cenário hipótetico de evolução da paisagem para explicar a diversificação
de Paleosuchus palpebrosus e de outros taxóns aquáticos ao longo do corredor
Amazônia-Madeira-Paraguai.
✔ Desvendar a história evolutiva do complexo Paleosuchus palpebrosus inferindo a
distribuição ancestral do grupo e a rota de dispersão de cada linhagem evolutiva.
✔ Investigar quais modelos de diversificação das linhagens melhor adequam-se aos
sistemas estudados, discriminando retenção de polimorfismo ancestral e fluxo gênico
atual ou ancestral nas zonas de contato entre as linhagens evolutivas.
9

CAPÍTULO 1
Muniz FL, Campos Z, Hernández Rangel SM,
Martínez JG, Souza BC, De Thoisy B, Botero-
Arias R, Hrbek T, Farias IP (2018) Delimitation
of evolutionary units in Cuvier’s dwarf caiman,
Paleosuchus palpebrosus (Cuvier, 1807): insights
from conservation of a broadly distributed
species. Conservation Genetics, 19 (3): 599-610.
https://doi.org/10.1007/s10592-017-1035-6
10

11

Delimitation of evolutionary units in Cuvier's dwarf caiman,
Paleosuchus palpebrosus (Cuvier, 1807): insights from conservation of
a broadly distributed species
FL Muniz1,2 . Z Campos3 . SM Hernández Rangel1,2 . JG Martínez1,4,5 . BC Souza6 . B De
Thoisy7,8 . R Botero-Arias9,10 . T Hrbek1 . IP Farias1
1Laboratory of Animal Genetics and Evolution (LEGAL), Department of Biology, Federal University of
Amazonas (UFAM), Manaus, Amazonas, Brazil
2National Institute for Amazonian Research (INPA), Graduate Program in Genetics, Conservation and
Evolutionary Biology, Manaus, Amazonas, Brazil
3 Wildlife Laboratory, Brazilian Agricultural Research Corporation (EMBRAPA) Pantanal, Corumbá, Mato
Grosso do Sul, Brazil
4Grupo de Investigación Biociencias, Facultad de Ciencias de la Salud, Institución Universitaria Colegio Mayor
de Antioquia, Medellín, Colombia
5Grupo de Pesquisa em Genética Molecular e Citogenética, Programa de Pós-Graduação em Biotecnologia e
Recursos Naturais (MBT), Escola Superior de Ciências da Saúde, Universidade do Estado do Amazonas,
Manaus, Brazil
6Chico Mendes Institute for Biodiversity Conservation (ICMBio), Boa Vista, Roraima, Brazil
7Institut Pasteur de la Guyane, Cayenne, French Guiana8Association Kwata, Cayenne, French Guiana
9Caiman Research in Conservation and Management Program, Instituto Mamirauá para o Desenvolvimento
Sustentável, Tefé, Amazonas, Brazil
10Department of Wildlife Ecology and Conservation, University of Florida, Gainesville, FL, USA
Keywords: Evolutionarily Significant Unit; Management Unit; genetic diversity; ddRADseq;
cytochrome b; gene flow
12

Corresponding author: Fábio L. Muniz; e-mail: [email protected]; phone number: +55(92)99248-0328
Acknowledgments
This study would have been impossible without the people who helped with the field
collections: Daniel Martins, Dênis Tilcara, Deyla Oliveira, José Augusto da Silva, Manoel
Rodrigues, Pedro Almeida, Tânia Sanaiotti, Valéria Machado and William Vasconcelos; or
without Guto Ruffeil who deposited samples in the CTGA/UFAM tissue collection. We are
also thankful to Mitchell Eaton for additional information about Osteolaemus species. This
project was approved by Embrapa ethics committee under the Permit no. 009/2016 and the
caimans were captured under License no. 13048-1 granted by the Brazilian Institute of
Environment and Renewable Natural Resources (IBAMA). In French Guiana, the species is
not protected and sampling does not require license. This study was financed by the following
grants: CNPq/CT-Amazon Project no. 575603/2008-9 awarded to IPF, CNPq Project no.
482662/2013-1 to TH, and CNPq Project no. 470383/2007-0 and 479179/2014 to ZC. We are
also grateful for the additional financial and logistical support from Embrapa Pantanal
(Macroprogram 3), Instituto Nacional de Pesquisas da Amazônia (INPA), Fundect, O
Boticário Foundation, Instituto Chico Mendes de Conservação da Biodiversidade (ICMBio)
and Santo Antônio Energia. This work is part of FM’s thesis in the Genetics, Conservation
and Evolutionary Biology program of INPA/UFAM. FM is supported by a grant from
FAPEAM, and IPF and TH by a grant from CNPq.
13

ABSTRACT
An important goal of evolutionary and conservation biology is the identification of units
below the species level, such as Evolutionarily Significant Units (ESUs), providing
objectively delimited units for species conservation and management. In this study we tested
the hypothesis that Cuvier's dwarf caiman (Paleosuchus palpebrosus)—a species broadly
distributed across several biomes and watersheds of South America—is comprised of different
ESUs. We analyzed mitochondrial cytochrome b sequences of 206 individuals and 532
unlinked ddRAD loci of 20 individuals chosen from amongst the mitochondrial haplogroups.
Analysis of the cytochrome b sequences revealed four mitochondrial clusters, while
STRUCTURE analysis of ddRAD loci detected three genomic clusters with different levels of
mixture between them. Using the Adaptive Evolutionary Conservation (AEC) framework we
identified three ESUs: “Amazon”, “Madeira-Bolivia” and “Pantanal”; one of them composed
of two different Management Units (MUs), “Madeira” and “Bolivia”. In general, based on the
comparisons with other crocodilian species, genetic diversity of each lineage was moderate
however, the Madeira MU showed fivefold lower genetic diversity than other geographic
groups. Considering the particularities of each Paleosuchus palpebrosus conservation unit, we
recommend that the conservation status of each is evaluated separately. Tropical biodiversity
is largely underestimated and in this context the broadly distributed species are the most likely
candidates to harbor distinct evolutionary lineages. Thus, we suggest that conservation
research should not neglect species that are generally considered of Least Concern by IUCN
due to the taxon’s broad geographic distribution.
14

INTRODUCTION
One of the most important goals of evolutionary and conservation biologists is to
identify units below the species level for conservation purposes. The concept of the
Evolutionarily Significant Unit (ESU) was developed to provide an objective method for
identifying such units. The first formulation of this concept by Ryder (1986) gave rise to an
intense debate and several alternate definitions (Waples 1991; Avise 1994; Moritz 1994;
Crandall et al. 2000; Fraser and Bernatchez 2001). Despite the divergence in operational
criteria to delimit ESUs, the fundamental objective of all ESU definitions is to identify
intraspecific units of genetic variation that have the potential of adaptively responding to
future ecological challenges (Fraser and Bernatchez 2001).
Most of the disagreement between the delimitation of ESUs has its origin in the
species concept debate (Roe and Lydeard 1998), ultimately stemming from focusing on
different emergent properties of species (de Queiroz 2007). Trying to reconcile these differing
viewpoints for the benefit of conservation efforts, Frazer and Bernatchez (2001) proposed the
Adaptive Evolutionary Conservation (AEC) integrative framework that uses the strengths,
either alone or in combination, of various operational criteria for delimiting ESUs. The main
operational criteria used to identify an ESU are thus: reproductive isolation (Waples 1991),
absence of gene flow (Waples 1991; Moritz 1994; Frazer and Bernatchez 2001), reciprocal
monophyly in mitochondrial DNA (mtDNA), significant differences in allele frequencies of
nuclear loci (Avise 1994; Moritz 1994), and ecological and genetic nonexchangeability
(Vogler and DeSalle 1994; Crandall et al. 2000).
The AEC framework allows one to consider both historical isolation and adaptive
divergence which are extremes along the divergence spectrum that gives rise to species
15
(Frazer and Bernatchez 2001). Thus, the definition that best summarizes the common point
among all ESUs, is that ESUs are intraspecific lineages characterized by a highly restricted
gene flow among these lineages.
ESUs can follow semi-independent evolutionary trajectories for different periods of
time, and thus satisfy different criteria used for detecting them (Fraser and Bernatchez 2001).
In some cases, one species can be composed of only a single ESU, whereas in others, a
species can include several ESUs. Furthermore, ESUs may themselves be structured, a
hierarchical level generally recognized as Management Units (MUs; sensu Moritz 1994).
MUs can be logical units for population monitoring and management (Moritz 1994). Overall,
recognizing and subsequently delimiting evolutionary units below species level is an
important step towards maintaining the evolutionary potential of natural populations (Moritz
et al. 1995; Waples 1995).
Cryptic diversity has been discovered recently in crocodilian species both at the
intraspecific (Godshalk 2006; Venegas-Anaya et al. 2008; Hekkala et al. 2010, 2011;
Cunningham et al. 2016) as well as the interspecific level (Eaton et al. 2009; Franke et al.
2013; Shirley et al. 2014a,b). One important question in crocodilian systematics and the main
goal of this study is the mapping of intraspecific genetic diversity of Cuvier’s dwarf caiman
(Paleosuchus palpebrosus). Paleosuchus palpebrosus is one of the smallest of all living
crocodilians (Campos et al. 2010); it is a forest-associated semi-aquatic taxon that occupies a
number of different biomes and watersheds throughout its distribution in northern and central
South America (Magnusson and Campos 2010). All these characteristics make it a promising
species to test the existence of lineages with independent trajectories and significant adaptive
differences.
16

The International Union for the Conservation of Nature (IUCN) assesses the species as
Least Concern (IUCN 2016; last assessment in 1996); however, the Brazilian Chico Mendes
Institute of Biodiversity Conservation (ICMBIO) alerts that this species should be monitored
due to persistent hunting pressure, habitat loss, fragmentation or modification caused by
human activities, including dam construction (Campos et al. 2013). These authors suggested
that the species’ conservation and long-term persistence is dependent on its access to
relatively pristine habitat, located ideally within conservation units.
Given the broad geographic distribution of the species and occurrence in several
independent river basins separated by important biogeographic barriers, we aim to test the
hypothesis that P. palpebrosus is comprised of different ESUs along an environmental
gradient extending from the Pantanal to Amazon and the Guianas. Our objectives were as
follows: (1) delimit ESUs and Management Units (MUs) in P. palpebrosus; (2) evaluate the
genetic diversity of the P. palpebrosus ESUs and MUs found; and (3) examine the
implications of these findings for the conservation of P. palpebrosus.
METHODS
Sample and molecular data collection
We sampled 206 P. palpebrosus individuals from sites throughout its distribution,
including in the Amazon Basin, the Madeira River Basin and the upper Paraguay River Basin
(Fig. 1; Online Resource 1 – Table S1). We located the individuals through active nocturnal
searches and captured them using a noose. We obtained tissue samples by removing a caudal
scute from adults, subadults or one hatchling per clutch. Tissues were stored in cryogenic
17
tubes containing 96% ethanol and deposited in the Animal Genetics Tissue Collection
(CTGA) at the Federal University of Amazonas (UFAM), Amazonas, Brazil. We extracted
whole genomic DNA using a phenol-chloroform protocol (Green and Sambrook 2012).
Subsequently, we amplified the whole cytochrome b (cyt b) gene and sequenced the
amplicons on an ABI 3130xl automated sequencer (Applied Biosystems), according to the
protocol described by Hrbek et al. (2008).
We also obtained reduced representation genomic sequences using the double digest
RAD sequencing protocol (ddRADseq) (Peterson et al. 2012) of five individuals from each
identified cyt b cluster of P. palpebrosus, totaling 20 specimens (Online Resource 1 – Table
S1).
We used an adapted ddRADseq protocol to allow simultaneous digestion and adaptor
ligation, with sequencing carried out on a 318 Ion PGM chip (Life Technologies™) using the
Ion PGM Sequencing 400 kit (Life Technologies™), in the IonTorrent PGM. Briefly, 200 ng
of genomic DNA of each individual was digested with SDAI and CSP6I restriction enzymes
(Fermentas) and the IonTorrent P and A adapters were linked to the digested fragments, all in
one step. The fragments were enriched via PCR. The A adaptor is a “Y divergent” (Coyne et
al. 2004) adaptor which results in enrichment of only those ddRAD fragments that have one
P1 and one A adaptor. Furthermore, the A adaptor contains a unique molecular barcode for
identification of individuals. The fragments were then size selected on Pippin Prep (Sage
Science), and fragments between 320 and 400 bp were used for sequencing. Genome size of
alligatorids is approximately 2.2 x 10^9 bp (based on sequenced genomes of Alligator
mississipiensis and A. sinensis deposited in Genbank), resulting in an expectation of ~ 15,000
ddRAD fragments in the range of 300 to 400 bp. The complete protocol is available on
18
GitHub (https://github.com/legalLab).
We converted the raw IonTorrent sequence reads from BAM to FASTQ format using
SAMtools v1.3.1 (Li et al. 2009). Sequencing reads were then demultiplexed and
assembledinto de novo loci using the PyRAD v3.0.66 pipeline (Eaton 2014). During de novo
assembly, we removed reads with errors in barcodes, required that each base in reads have a
minimum Phred quality score of 20 else be converted to missing, allowing maximum of four
missing nucleotides per read and minor allele frequency greater than 0.01. A minimum read
coverage of 5x is desirable for genotyping-by-sequencing, including ddRADseq assemblies
(Kenny et al. 2011; Peterson et al. 2012), thus we enforced a minimum coverage of 6x.
Sequences were subsequently clustered by similarity at 88% similarity (PyRAD default) using
VSEARCH (Rognes et al. 2016) and aligned using MUSCLE (Edgar 2004). In the final
STRUCTURE (Pritchard et al. 2000) dataset we only included those loci that were present in
at least 50% of the individuals, a cut-off value that appears to maximize phylogenetic
informativeness (Streicher et al. 2015).
Cyt b and ddRADseq analysis
We reconstructed a cyt b haplotype network by first estimating a Maximum
Likelihood (ML) topology in Garli v0.95 (Zwickl 2006) using GTR+G evolutionary model
estimated in jMODELTEST2 (Darriba et al. 2012) and then using HAPLOVIEWER
(Salzburger et al. 2011) to reconstruct the haplotype network.
The cyt b sequences were collapsed into 22 haplotypes, and reciprocal monophyly of
cyt b groups was assessed via ML phylogenetic analysis in Garli v2.01 (Zwickl 2006) and
Bayesian Inference (BI) in MrBayes v3.2.2 (Ronquist et al. 2012). Both analysis were
19

performed using the GTR+G model of molecular evolution, with one sequence of the sister
species Paleosuchus trigonatus, used as outgroup. Two replicate searches using four chains
and default priors were performed on each analysis. Support for clades in the ML analysis was
estimated by 1,000 bootstrap replicates. BI was performed using 106 generations, sampling
every 1,000 generations and discarding the first 25% of the sampled trees. The topologies
were summarized and visualized in FigTree v1.4.2 (Rambaut, 2014).
We also inferred population structure based on nucleotide frequencies of the cyt b gene
using the Bayesian approach for assignment of individuals, implemented in the program
BAPS v6.0 (Corander et al. 2008). The method provides the posterior probabilities for
different numbers of clusters of individuals (K). We performed individual level mixture
analysis for multiple defined clusters (K = 5, 10, 15 or 20 clusters), with 10 independent runs
for each K values. The K with the highest posterior probability was selected as the most likely
data partition.
We delimited mtDNA geographic groups based on haplotype network, phylogenetic
tree and population structure analyses. We assessed the degree of genetic structure and the
isolation between the geographic groups using Analysis of Molecular Variance (AMOVA)
implemented in the program Arlequin v3.5 (Excoffier and Lischer 2010). Significance of the
results was assessed via 10,000 permutations. All above analysis allowed us to evaluate the
absence of historical gene flow, the genetic non-exchangeability and the reciprocal
monophyly between mitochondrial lineages.
In order to verify whether geographical groups show significant differences in allele
frequencies of nuclear loci we performed a STRUCTURE analysis using our ddRAD data.
We used the admixture and correlated allele frequency model of STRUCTURE to infer
20

population structure without conditioning on sampling locality (no location prior). We
collected 110,000 samples from the MCMC chain of which the first 10,000 were discarded as
burn-in and the remaining 100,000 steps were used for this analysis. The number of groups
(K) varied from 1 to 6, with 10 independent runs for each K value. The convergence between
independent runs was assessed via examination of α values and profile of posterior
probabilities. The Q values from each of the 10 independent runs for each K scenario were
extracted using the program STRUCTURE HARVESTER 0.6.92 (Earl and VonHoldt 2012)
and summarized in the program CLUMPP 1.1.2 (Jakobsson and Rosenberg 2007). Results
were visualized in the program DISTRUCT 1.1 (Rosenberg 2004). The most likely number of
genomic clusters (K) was inferred using the method of Evanno et al. (2005).
We used the program MIGRATE v.3.6 (Beerli 2006) to estimate the effective
population size (Ne) of each geographic group and the effective number of migrants (Nm)
between them using both cyt b and ddRAD data. We first estimated the best model of gene
flow for “Madeira” and “Bolivia”, as described below, and then we calculated the Nm. We
filtered loci separately for each geographic group (“Amazon”: 593 loci; “Madeira”: 500 loci;
“Bolivia”: 361 loci; “Pantanal”: 256 loci) in order to obtain more robust estimative of the Ne.
We did not estimate Nm between “Amazon” and “Madeira” or “Pantanal” and “Bolivia”,
since these clusters represent distinct ESUs (see results).
We verified the existence of asymmetric gene flow by testing four different gene flow
models between “Madeira” and “Bolivia” (1- bidirectional gene flow, 2 and 3- unidirectional
gene flow in opposite directions, 4- panmitic population with infinite gene flow). We used the
thermodynamic integration method to obtain the log marginal likelihood (logML) for each
model and the same prior settings for all models. The search strategy for the cyt b dataset used
21

static heating scheme with four chains at different temperatures (1.0, 1.5, 3.0, 100000.0) and
four replicates of one long chain with 40 million generations, discarding a burn-in of 4 million
and sampling every 400 generations. To test the same four gene flow models based on ddRAD
dataset we used 130 loci filtered in the PyRAD that were present in at least four of the five
individuals in both Madeira and Bolivia sampled groups. For this dataset we used a heating
scheme, two replicates of one long chain with 400 million generations, burn-in of 20 million
and sampling every 1000 generations. We recorded the Bezier approximation value for each
model and calculate the posterior probabilities to choose the best model for each dataset.
Considering that genetic diversity is already recognized as important to maintain the
capacity of a species to adapt to a changing environment (Frankham et al. 2004), and thus is
becoming an important parameter to be monitored in conservation biology, we estimated the
genetic diversity based on cyt b dataset for each identified geographic group using Arlequin
(Excoffier and Lischer 2010). The estimators used were: number of haplotypes (Hp),
nucleotide diversity (π), and genetic diversity (Nei, 1987). We also assessed the Tajima's D
(Tajima 1989) and Fu's Fs (Fu 1997) historical demography tests by using the same program.
We compared the values found for each geographic group in P. palpebrosus with those of
other crocodilian species in order to assess the relative levels of genetic diversity of the
species.
RESULTS
The cyt b haplotype network showed three geographically restricted haplogroups with
15 to 18 mutational steps between them (Fig. 1C: haplogroup I, haplogroups II+III and
haplogroup IV). A Population Aggregation Analysis (PAA) depicting diagnostic sites for each
22

cyt b haplogroup is provided in the Online Resource 1 (Table S2). The haplogroup I occupies
the entire Amazon basin, except the Madeira basin, as well as the Maroni and Oiapoque
basins, which drain the Guiana Shield directly into the Atlantic Ocean (Fig. 1A). The
haplogroups II+III occupies the entire Madeira River basin including the Bolivian sub-basin
(Fig. 1A), and the haplogroup IV is restricted to the Pantanal in the upper Paraguai River
basin (Fig. 1A). The haplogroup I is isolated from the haplogroup IV by 18 mutational steps
and from the haplogroups II+III by 15 mutational steps while the haplogroup IV is isolated
from the haplogroups II+III by 16 mutational steps. The haplogroups II and III are
geographically structured (Fig. 1C), so that only three adjacent localities have cyt b
haplotypes from both haplogroups, two of these localities are in the upper Madeira River and
one in the Mamore River (Fig. 1A).
The ML and BI phylogenetic trees show identical topologies and well supported
reciprocal monophyly of the red, green+blue and yellow mitochondrial groups (Fig. 2). The
genetic population structure analysis using the cyt b gene indicated that the optimal number of
clusters was four (K= 4, logML= -670.6851). The BAPS barplot result (Fig.1B) corresponds
to the haplotype network (Fig. 1C) and the geographical distribution of the cyt b clusters were
identical to the geographical distribution of the haplogroups (Fig. 1A).
Based on the above analysis we identified three genetic clusters geographically
partitioned in the Amazon, Madeira-Bolivia and the Pantanal (Fig. 1). Cyt b haplotypes within
the “Madeira-Bolivia” group are non-randomly distributed such that one cluster occurs
predominantly in the Madeira and another predominantly in Bolivia. Thus, an AMOVA
analysis was performed considering four geographic groups, “Amazon”, “Madeira”, “Bolivia”
and “Pantanal”. This analysis revealed strong global genetic structuring (ФST of 0.959, p <
23

0.008) as well as strong pairwise differentiation measured as FST between geographic groups
(Table 1). Even the lowest pairwise FST value found in our study (ФST = 0.769, p < 0.008)
indicates strong population genetic differentiation.
Next generation sequencing produced approximately 3.6 million usable reads after
processing in PyRAD. Between 2000 to 3000 loci per individual with an average coverage
between 7.5-8.5x was obtained before limiting the dataset to those loci that were present in ≥
50% of sampled individuals. A total of 722 loci were sampled in ≥ 50% of sampled
individuals. These 722 loci represented 532 unlinked SNPs. The SNP markers detected
genetic structuring of P. palpebrosus revealing a similar geographical pattern (Fig. 3A) as the
mtDNA data.
The STRUCTURE analysis detected three genomic clusters, two of which were
concordant with cyt b geographic clusters, the "Amazon" and "Pantanal" (Fig. 3B; Table 2).
The third genomic cluster inferred using STRUCTURE occupies the Bolivian basin and the
Madeira River, corresponding to the “Madeira-Bolivia” cyt b cluster; however, it shows a
significant degree of admixture with the “Pantanal” cluster in the geographic region of Bolivia
(Table 2).
Unidirectional gene flow from “Bolivia” to “Madeira” (Nm = 0.97; 95% HDP 0.02 –
3.05) had the highest support (logML = -1574.38) and was the most probable model (52%
probability) based on the cyt b sequence dataset compared to the full model with gene flow in
both directions (logML = -1574.47; 47% probability). In the full migration model, Nm from
“Bolivia” to “Madeira” was 1.08 (95% HPD 0.01 – 5.71) while Nm from “Madeira” to
“Bolivia” was 0.86 (95% HPD 0.00 – 5.34). In contrast, bidirectional gene flow between
“Madeira” and “Bolivia” had the highest support (logML = -64267.32) as was the most
24

probable mode (99% probability) based on analysis of ddRAD dataset, showing a similar
number of effective migrants from “Bolivia” to “Madeira” (Nm = 1.77; 95% HPD 1.28 –
2.33) and from “Madeira” to “Bolivia” (Nm = 1.98; 95% HPD 1.49 – 2.52). The effective
population size (Ne) was estimated based on both the cyt b gene ("Amazon": Ne = 351,000;
"Madeira": Ne = 209,000; "Bolivia": Ne = 185,000; "Pantanal": Ne = 142,000) and ddRAD
data ("Amazon": Ne = 740,740; "Madeira": Ne = 833,333; "Bolivia": Ne = 668,276;
"Pantanal": Ne = 688,405).
In general P. palpebrosus had high levels of genetic diversity, comparable to other
crocodilian species (Table 3). Comparisons between intraspecific clusters revealed that the
“Madeira” cluster had five fold lower genetic diversity (Nei’s haplotype diversity) than the
other clusters (Table 3). Both Tajima's D and Fu's Fs tests indicated recent population
expansion of the “Madeira” geographic cluster (Table 3).
DISCUSSION
Delimiting Cuvier’s dwarf caiman units for conservation
It is important to identify intraspecific units such as ESUs and MUs so that limited
conservation resources can be utilized optimally (Ryder 1986). The lack of gene flow,
reciprocal monophyly, and high estimates of pairwise FST using cyt b sequence data, suggest
long-term isolation between clusters of P. palpebrosus. The ddRAD data show a similar
pattern in the geographic distribution due significant differences in the allele frequencies. This
population structure allowed for the identification of three genetic clusters isolated in the
Amazon, Madeira-Bolivia basin and the Pantanal, which are sufficiently differentiated to be
considered ESUs according the multiple criteria summarized by the AEC framework (Frazer
25

and Bernatchez 2001).
The “Amazon” and “Pantanal” ESUs form reciprocally monophyletic mitochondrial
groups (Fig. 2), and display no evidence of admixture with another genetic deme. Based on
cyt b analysis, the “Madeira-Bolivia” ESU is comprised of two geographically structured
subgroups, “Madeira” and “Bolivia” (FST = 0.769), with a contact zone in the upper Madeira
River (haplotype sharing at three localities). These two groups are connected by restricted
gene flow with approximately 1 effective individual per generation migrating in either
direction (Nm ~ 1). These results together with the analysis of genomic data in STRUCTURE
indicates that individuals from the Madeira River and the Bolivian basin comprise just one
biological group; however, this “Madeira-Bolivia” ESU is best viewed as comprising two
MUs, “Madeira” and “Bolivia”, according to the original definition of Moritz (1994). The
boundary between “Madeira” and “Bolivia” MUs is not sharp, with a transition zone between
these two MUs occurring in the region of the Madeira River rapids. Therefore, we propose
that the “Madeira” and “Bolivia” MUs occur downstream and upstream of the Madeira River
rapids, respectively.
Dwarf caimans from the Bolivian basin also showed evidence of substantial nuclear
admixture with individuals from the Pantanal, while dwarf caimans from the Madeira River
showed small amount of nuclear admixture with individuals from the Pantanal and Amazon
(Fig. 3). In general the Ne estimated using ddRAD was at least twice that estimated using cyt
b gene. The difference in the magnitude of the estimated Ne is possibly a result of the
difference in inheritance that the cyt b and ddRAD markers have, maternal and biparental,
respectively. Thus, mating system, imbalance in sex ratio, sex biased dispersal or other
biological characteristic of the species may have been the promoters of the observed
26

differences in the estimated Ne. Moreover, the high levels of admixture found between
“Madeira-Bolivia” and adjacent ESUs may have contributed to elevated Ne estimate the
"Madeira" and "Bolivia" MUs.
In addition to our genetic data, Campos et al. (2015a) also found an ecological
difference between Amazon and Pantanal P. palpebrosus populations, which may indicate
ecological isolation between them. The authors observed that breeding season of P.
palpebrosus from the Amazon begins in September (dry season) while that P. palpebrosus
from the Pantanal begins in November (wet season). The reproductive period of P.
palpebrosus from the Madeira River initiates in June/July, thus earlier than that of the
“Amazon” ESU (ZC, unpublished data). This difference in the breeding season occurs even
though the rainy season regime, which is thought to regulate reproduction of the crocodilians
(Campos et al., 2015a), is identical. Campos et al. (2015a) suggest other environmental
variables such as differences in vegetation, the intensity and the daily-minimum temperatures
during the dry-season, and not just the rainy season regime are potential limiting factors
causing differences in breeding regimes. Whatever the proximal cause, the reproductive
periods of P. palpebrosus from the Amazon, the Pantanal and the Madeira are distinct, and
may limit gene flow between these two lineages.
Genetic diversity of mitochondrial lineages
Paleosuchus palpebrosus has high level of genetic diversity if treated as only one
panmictic group, and this diversity is comparable with that of other crocodilian species (Table
2). However, species structured into ESUs and MUs, such as the case of P. palpebrosus,
necessitate separate monitoring and/or management of each unit (Frankham et al. 2004).
27

ESUs and MUs are the logical units for species monitoring since preserving the genetic
diversity of each unit will also conserve genetic diversity and evolutionary potential of the
species as a whole (Moritz 1994). Ignoring independent evolutionary lineages could lead to
the incorrect inference about a species’ resilience and adaptive potential in a changing
environment by implicitly or explicitly assuming the functional and evolutionary equivalence
of these lineages.
Analyzing the genetic diversity of each lineage separately, the “Amazon” and
“Pantanal” ESUs, and the “Bolivia” MU have moderate levels of genetic diversity based on
the comparisons with other crocodilians (Table 2). However, the “Madeira” MU, the most
well sampled group, has a fivefold lower genetic diversity than the other P. palpebrosus
groups. The low genetic diversity may have resulted from a founder effect followed by
population expansion, as suggested by the Tajima's D (Tajima 1989) and Fu's Fs (Fu 1997)
tests (Table 2). This expansion may have occurred because the "Madeira" group probably
originated via a founder effect from "Bolivia" group during the formation of the Madeira
River. Irrespective of how this MU originated, the “Madeira” MU has the smallest
geographical distribution, occurs in a very anthropogenically perturbed area, has the lowest
genetic diversity, and is therefore at greatest demographic and genetic risk of extinction.
Implications for the conservation of P. palpebrosus
Conservation efforts must focus on evolutionary lineages as they are a manifestation
of evolutionary history, reflecting current and past adaptive responses to environmental
challenges as well as neutral divergences. Conservation recommendations and actions based
solely on nominal species (named taxonomic entities) will lead us to the false sense of
28

conservation health of that nominal species, while in reality many lineages of that species may
be threatened and may be in a need to lineage-specific conservation measures. ESUs and MUs
are increasingly being recognized as appropriate units of conservation (see Guia and Saitoh
2007). Their identification takes into account the evolutionary history and potential of the
species, helping to prioritize conservation efforts (Frankham et al. 2004). ESUs often
represent lineages adapted to local environmental conditions (Funk et al. 2012) that once
extinct may not be replaced by emigrants. The three ESUs of the broadly distributed P.
palpebrosus are each subject to different and distinct threats stemming from differences
between the area occupied by each lineage and levels of habitat degradation within these
areas; therefore, they are natural candidates for differentially optimized management
strategies.
Based on IUCN criteria used for the evaluation of extinction risk, the main threats for
P. palpebrosus as a whole are habitat destruction, local subsistence hunting, dams,
urbanization and pollution (Magnusson and Campos 2010). Nevertheless this species is
classified as “Least Concern”, mainly due to its large distribution and local abundance in
some areas (IUCN 2016; last assessment in 1996). Paleosuchus palpebrosus “Amazon” ESU
occupies broad geographical distribution including much of the Amazon basin and non-
Amazonian drainage basins such as the Maroni and Oiapoque River basins, which flow
directly into the Atlantic. From a conservation perspective, the “Amazon” ESU possesses
relatively high levels of genetic diversity indicating that the population does not require
immediate conservation attention. In addition, the Amazon basin has many available pristine
habitats for the species to occupy, many of them within federal and state conservation units
and Amerindian reservations, as well as relatively small anthropogenic impact compared to
29

the areas of occurrence of the other ESUs.
In contrast, the “Madeira-Bolivia” and “Pantanal” ESUs are exposed to ever
increasing anthropogenic pressure and the “Madeira-Bolivia” ESU is genetically depauperate.
In particular the "Madeira" MU is genetically the most vulnerable of all P. palpebrosus
lineages as it has a very low genetic diversity and the most restricted geographic distribution.
The upstream located “Bolivia” MU has higher levels of genetic diversity and may contribute,
in part, to maintaining the diversity for the “Madeira” MU. In the future, it may also be an
important source population for the active management of the “Madeira” MU, if necessary.
The Madeira River is one of the most important tributaries of the Amazon basin
formed from the confluence of Bolivian rivers that arise in the Andean piedmonts and on the
Brazilian Shield. Historically, a set of 18 waterfalls and rapids on the upper Madeira River
marked the transition between the Bolivian basin and the Madeira River (Cella-Ribeiro et al.
2013). Most of the waterfalls and rapids have now been submerged by the holding dams of
the Jirau and Santo Antonio hydroelectric power plants. This region represents an important
historical barrier to gene flow in different aquatic and semi-aquatic Amazonian taxa including
fishes, the giant river otter, the pink river dolphin and caimans (e.g. Hubert and Renno 2006;
Hubert et al. 2007; Hrbek et al. 2008; Pickles et al. 2011; Gravena et al. 2014, 2015). We
found that this region is also a transition zone between two P. palpebrosus MUs. Flooding of
this area resulting from the construction of the Santo Antonio and the Jirau hydroelectric
power plants resulted in the loss of areas suitable for reproduction (Campos and Magnusson
2016) and other important habitat for the species (Campos et al. 2013). This, in turn,
effectively isolated the “Bolivia” and “Madeira” MUs, augmenting extinction risk of the
“Madeira” MU due to its increased isolation coupled with greater anthropogenic impact being
30

experienced by the Madeira River basin.
The “Pantanal” ESU shows levels of genetic diversity equivalent to the “Amazon”
ESU. Its geographic distribution in the Paraguay River basin is restricted to areas surrounding
the Pantanal wetland (Campos et al. 1995; Campos and Mourão 2006; Campos et al. 2013).
Although the genetic diversity of “Pantanal” ESU is on par with other ESUs of P. palpebrosus
and crocodilians in general, it is affected by a combination of anthropogenic threats, such as
the removal of riparian forests, alteration of springs, pollution, poaching, intense human
occupation and above all the installation of hydroelectric power plants (Campos and Mourão
2006; Campos et al. 2013; Campos et al. 2015b). There are already 178 hydroelectric dams
installed or planed in the upper Paraguay River (available on
http://sigel.aneel.gov.br/sigel.html). The principal problem of dam construction in these
urbanized or agriculturally intensive regions is the complete loss of riparian habitat resulting
from the flooding of remnants of riparian vegetation, and consequently the elimination of
nesting in addition to foraging habitat.
It is possible that these three independent lineages currently recognized as a single
widely distributed P. palpebrosus represent in reality a complex of cryptic species. The type
locality of P. palpebrosus is Cayenne in French Guiana (Magnusson 1992). According to our
analysis, individuals from French Guiana belong to the “Amazon” ESU which would then be
the nominal species. Therefore, additional studies examining the “Madeira-Bolivia” and
“Pantanal” ESUs as candidate species using the integrative taxonomy framework (Padial et al.
2010) would be welcome. Potential available epithets for the non-“Amazon” ESUs are the
two junior synonyms Jacaretinga moschifer Spix 1825:1 and Champsa gibbiceps Natterer,
1841:324.
31

This study highlights the importance of understanding the spatial patterns of genetic
variation for improving conservation and management of broadly distributed species,
especially in tropical regions where biodiversity is largely underestimated. In such a context,
broadly distributed species are the most likely candidates to harbor distinct evolutionary
lineages (Scheffers et al. 2012). Recent studies have inferred extensive population structuring
in broadly distributed mammals as well – e.g. African elephants (Rohland et al. 2010),
giraffes (Brown et al. 2007; Fennessy et al. 2016), orangutan (Nater et al. 2017), river
dolphins (Hrbek et al. 2014), and whales (Jackson et al. 2014) as well as in broadly
distributed crocodilian species (Eaton et al. 2009; Hekkala et al. 2010, 2011; Franke et al.
2013; Shirley et al. 2014a,b; Cunningham et al. 2016; Milián-García et al., in press). In all of
these cases, just like in P. palpebrosus, the nominal species were not just broadly distributed
in the tropical regions, but also spanned a range of environments and/or discontinuous
habitats. It would thus appear that broadly distributed species, in particular, need to be subject
to population and conservation genetic analysis. Thus, we suggest that conservation research
should not neglect species that are generally considered of Least Concern by IUCN criteria.
32

REFERENCES
Avise JC (1994) Molecular Markers, Natural History, and Evolution. New York, Chapman &
Hall
Beerli P (2006) Comparison of Bayesian and maximum-likelihood inference of population
genetic parameters. Bioinformatics 22:341-345. doi:10.1093/bioinformatics/bti803
Brown DM, Brenneman RA, Koepfli KP, Pollinger JP, Milá B, Georgiadis NJ et al. (2007).
Extensive population genetic structure in the giraffe. BMC biol. 5:57 doi:10.1186/1741-
7007-5-57
Campos Z, Coutinho M, Abercrombie C (1995) Size structure and sex ratio of dwarf caiman
in the Serra Amolar, Pantanal, Brazil. Herpetological Journal 5:321-322
Campos Z, Magnusson WE (2016) Density and Biomass Estimates by Removal for an
Amazonian Crocodilian, Paleosuchus palpebrosus. PLoS One
doi:10.1371/journal.pone.0156406
Campos Z, Marioni B, Farias IP, Verdade LM, Bassetti L, Coutinho ME et al. (2013)
Avaliação do risco de extinçao do jacaré-paguá Paleosuchus palpebrosus (Cuvier, 1807)
no Brasil. Biodiversidade Brasileira 3:40-47.
Campos Z, Mourão G (2006) Conservation status of the dwarf caiman, Paleosuchus
palpebrosus, in the region surrounding Pantanal. Crocodile Specialist Group Newsletter
25:9-10
Campos Z, Muniz FL, Farias IP, Hrbek T (2015b) Conservation status of the dwarf caiman
Paleosuchus palpebrosus in the region of the Araguaia-Tocantins basin, Brazil.
Crocodile Specialist Group Newsletter 34:4-8
Campos Z, Sanaiotti T, Magnusson W (2010) Maximum size of dwarf caiman, Paleosuchus
palpebrosus (Cuvier, 1807), in the Amazon and habitats surrounding the Pantanal,
Brazil. Amphib-reptil 31:439-442. doi:10.1163/156853810791769392
Campos Z, Sanaiotti T, Marques V, Magnusson WE (2015a) Geographic Variation in Clutch
Size and Reproductive Season of the Dwarf Caiman, Paleosuchus palpebrosus, in
Brazil. J Herpetol 49:95-98. doi:10.1670/11-224
Cella-Ribeiro A, Torrente-Vilara G, Hungria DB, Oliveira M (2013) As corredeiras do Rio
Madeira. In: Queiroz LJ, Torrente-Vilara G, Ohara WM, Pires T, Zuanon J, Doria CRC
33

(eds) Peixes do Rio Madeira, 1st edn. Dialeto Latin American Documentary, São Paulo,
pp 56-63
Corander J, Marttinen P, Sirén J, Tang J (2008) Enhanced Bayesian modelling in BAPS
software for learning genetic structures of populations. BMC Bioinformatics 9:539. doi:
10.1186/1471-2105-9-539
Coyne KJ, Burkholder JM, Feldman RA, Hutchins DA, Cary SC (2004) Modified serial
analysis of gene expression method for construction of gene expression profiles of
microbial eukaryotic species. Appl Environ Microbiol 70:5298-5304.
doi:10.1128/AEM.70.9.5298
Crandall KA, Bininda-Emonds ORP, Mace GM, Wayne RK (2000) Considering evolutionary
processes in conservation biology. Trends Ecol Evol 15:290-295. doi:10.1016/S0169-
5347(00)01876-0
Cunningham SW, Shirley MH, Hekkala ER (2016) Fine scale patterns of genetic partitioning
in the rediscovered African crocodile, Crocodylus suchus (Saint-Hilaire 1807). PeerJ
4:e1901:1-20. doi: 10.7717/peerj.1901
Darriba D, Taboada GL, Doallo R, Posada D (2012) jModelTest 2: more models, new
heuristics and parallel computing. Nat Methods 9:772. doi:10.1038/nmeth.2109
Earl DA, VonHoldt BM (2012) STRUCTURE HARVESTER: a website and program for
visualizing STRUCTURE output and implementing the Evanno method. Conserv Genet
Resour 4:359-361. doi:10.1007/s12686-011-9548-7
Eaton DAR (2014) PyRAD: assembly of de novo RADseq loci for phylogenetic analysis.
Bioinformatics 30:1844-1849. doi: 10.1093/bioinformatics/btu121
Eaton MJ, Martin A, Thorbjarnarson J, Amato G (2009) Species-level diversification of
African dwarf crocodiles (Genus Osteolaemus): a geographic and phylogenetic
perspective. Mol Phylogenet Evol 50:496-506. doi:10.1016/j.ympev.2008.11.009
Edgar RC (2004) MUSCLE: multiple sequence alignment with high accuracy and high
throughput. Nucleic Acids Research 32:1792-1797. doi:10.1093/nar/gkh340
Evanno G, Regnaut S, Goudet J (2005) Detecting the number of clusters of individuals using
the software structure: a simulation study. Mol. Ecol. 14:2611-2620. doi:10.1111/j.1365-
294X.2005.02553.x
Excoffier L, Lischer HEL (2010) Arlequin suite ver 3.5: A new series of programs to perform
34

population genetics analyses under Linux and Windows. Mol Ecol Resour 10:564-567.
doi:10.1111/j.1755-0998.2010.02847.x
Farias IP, Silveira R, Thoisy B, Monjeló LA, Thorbjarnarson J, Hrbek T (2004) Genetic
diversity and population structure of Amazonian crocodilians. Anim Conserv 7:265-272.
doi:10.1017/S136794300400143X
Fennessy J, Bidon T, Reuss F, Kumar V, Elkan P, Nilsson MA et al. (2016) Multi-locus
analyses reveal four giraffe species instead of one. Curr. Biol. 26:2543-2549. doi:
10.1016/j.cub.2016.07.036
Franke FA, Schmidt F, Borgwardt C, Bernhard D, Bleidorn C, Engelmann WE, Schlegel M
(2013) Genetic differentiation of the African dwarf crocodile Osteolaemus tetraspis
Cope, 1861 (Crocodylia: Crocodylidae) and consequences for European zoos. Org
Divers Evol 13:255-266. doi:10.1007/s13127-012-0107-1
Frankham R, Ballou JD, Briscoe DA (2004) A Primer of Conservation Genetics. Cambridge
University Press, New York
Fraser DJ, Bernatchez L (2001) Adaptive evolutionary conservation: towards a unified
concept for defining conservation units. Mol Ecol 10:2741-2752. doi:10.1046/j.1365-
294X.2001.t01-1-01411.x
Fu YX (1997) Statistical tests of neutrality of mutations against population growth,
hitchhiking and background selection. Genetics 147:915-925
Funk WC, McKay JK, Hohenlohe PA, Allendorf FW (2012) Harnessing genomics for
delineating conservation units. Trends Ecol Evol 27:489-496.
doi:10.1016/j.tree.2012.05.012
Godshalk R (2006) Phylogeography and conservation genetics of the yacare caiman (Caiman
yacare) of South America. PhD thesis, University of Florida at Gainesville
Gravena W, Farias IP, Da Silva MNF, Da Silva VMF, Hrbek T (2014) Looking to the past and
the future: Were the Madeira River rapids a geographical barrier to the boto (Cetacea:
Iniidae)? Conserv Genet 15:619-629. doi:10.1007/s10592-014-0565-4
Gravena W, da Silva VMF, da Silva MNF, Farias IP, Hrbek T (2015) Living between rapids:
genetic structure and hybridization in botos (Cetacea: Iniidae: Inia spp.) of the Madeira
River, Brazil. Biol J Linn Soc 114:764-777. doi:10.1111/bij.12463
Green MR, Sambrook J (2012) Molecular Cloning: A Laboratory Manual: Three-volume set,
35

4th ed. Cold Spring Harbor Laboratory Press, New YorkGuia APO, Saitoh T (2007) The gap between the concept and definitions in the Evolutionarily
Significant Unit: The need to integrate neutral genetic variation and adaptive variation.
Ecol Res 22:604-612. doi:10.1007/s11284-006-0059-z
Hekkala ER, Amato G, DeSalle R, Blum MJ (2010) Molecular assessment of population
differentiation and individual assignment potential of Nile crocodile (Crocodylus
niloticus) populations. Conserv Genet 11:1435-1443. doi:10.1007/s10592-009-9970-5
Hekkala ER, Shirley MH, Amato G, Austin JD, Charter S, Thorbjarnarson J et al. (2011) An
ancient icon reveals new mysteries: mummy DNA resurrects a cryptic species within the
Nile crocodile. Mol Ecol 20:4199-4215. doi:10.1111/j.1365-294X.2011.05245.x
Hrbek T, Silva VMF, Dutra N, Gravena W, Martin AR, Farias IP (2014) A new species of river
dolphin from Brazil or: how little do we know our biodiversity. PLoS One 9:e0083623.
doi:10.1371/journal.pone.0083623
Hrbek T, Vasconcelos WR, Rebêlo GH, Farias IP (2008) Phylogenetic relationships of south
american alligatorids and the caiman of Madeira River. J Exp Zool A Ecol Genet
Physiol 309:588-599. doi:10.1002/jez.430
Hubert N, Duponchelle F, Nuñes J, Garcia-Davila C, Paugy D, Renno JF (2007)
Phylogeography of the piranha genera Serrasalmus and Pygocentrus: implications for
the diversification of the Neotropical ichthyofauna. Mol Ecol 16:2115-2136.
doi:10.1111/j.1365-294X.2007.03267.x
Hubert N, Renno JF (2006) Historical biogeography of South American freshwater fishes. J
Biogeogr 33:1414-1436. doi:10.1111/j.1365-2699.2006.01518.x
IUCN (2016) The IUCN red list of threatened species. Version 2016.3.
http://www.iucnredlist.org. Accessed 20 December 2016
Jackson JA, Steel DJ, Beerli P, Congdon BC, Olavarría C, Leslie MS et al. (2014) Global
diversity and oceanic divergence of humpback whales (Megaptera novaeangliae). In
Proc R Soc B 281:20133222. doi:10.1098/rspb.2013.3222
Jakobsson M, Rosenberg NA (2007) CLUMPP: a cluster matching and permutation program
for dealing with label switching and multimodality in analysis of population structure.
Bioinformatics 23:1801-1806. doi:10.1093/bioinformatics/btm233
Kenny EM, Cormican P, Gilks WP, Gates AS, O’Dushlaine CT, et al. (2011) Multiplex target
36

enrichment using DNA indexing for ultra-high throughput SNP detection. DNA
Research 18:31-38. doi:10.1093/dnares/dsq029
Li H, Handsaker B, Wysoker A, Fennell T, Ruan J, Homer N, Marth G, Abecasis G, Durbin R,
1000 Genome Project Data Processing Subgroup (2009) The Sequence alignment/map
(SAM) format and SAMtools. Bioinformatics 25:2078-2079.
doi:10.1093/bioinformatics/btp352
Magnusson WE (1992) Paleosuchus palpebrosus. Cat Am Amphib Rept 554.1-554.2.
Magnusson WE, Campos Z (2010) Cuvier’s Smooth-fronted Caiman Paleosuchus
palpebrosus. In: Manolis SC, Stevenson C (eds). Crocodiles: Status Survey and
Conservation Action Plan, 3rd edn. Crocodile Specialist Group, Darwin, pp 40-42
Milián-García Y, Castellanos-Labarcena J, Russello M A, Amato G (2018) Mitogenomic
investigation reveals a cryptic lineage of Crocodylus in Cuba. Bull Mar Sci 94: (in
press). doi: 10.5343/bms.2016.1134
Moritz C (1994) Defining “Evolutionarily Significant Units” for conservation. Trends Ecol
Evol 9:373-375. doi:10.1016/0169-5347(94)90057-4
Moritz C, Lavery S, Slade R (1995) Using allele frequency and phylogeny to define units for
conservation and management. In: Nielsen JL, Powers GA (eds) Evolution and the
Aquatic Ecosystem: Defining Unique Units in Population Conservation, Symposium.
American Fisheries Society, Maryland, pp 249-262
Nater A, Mattle-Greminger MP, Nurcahyo A, Nowak MG, Manuel M de, Desai T, et al.
(2017) Morphometric, Behavioral, and Genomic Evidence for a New Orangutan
Species. Curr Biol 27: 3487-3498. doi:10.1016/j.cub.2017.09.047
Nei M (1987) Molecular evolutionary genetics. Columbia University Press, New York
Padial JM, Miralles A, De la Riva I, Vences M (2010) The integrative future of taxonomy.
Front Zool 7:16. doi:10.1186/1742-9994-7-16
Peterson BK, Weber JN, Kay EH, Fisher HS, Hoekstra HE (2012) Double digest RADseq: An
inexpensive method for de novo SNP discovery and genotyping in model and non-
model species. PLoS One 7:e37135. doi:10.1371/journal.pone.0037135
Pickles RSA, Groombridge JJ, Zambrana VDR, Van Damme P, Gottelli D, Kundu S (2011)
Evolutionary history and identification of conservation units in the giant otter,
Pteronura brasiliensis. Mol Phylogenet Evol 61:616-627.
37

doi:10.1016/j.ympev.2011.08.017
Pritchard JK, Stephens M, Donnelly P (2000) Inference of population structure using
multilocus genotype data. Genetics 155:945-959. doi:10.1111/j.1471-
8286.2007.01758.x
de Queiroz K (2007) Species concepts and species delimitation. Syst Biol 56:879-886.
doi:10.1080/10635150701701083
Rambaut A (2014) Figtree 1.4. 2 software. http://tree.bio.ed.ac.uk/software/figtree
Roe KJ, Lydeard C (1998) Species Delineation and the Identification of Evolutionarily
Significant Units : Lessons from the Freshwater Mussel Genus Potamilus (Bivalvia :
Unionidae). J Shellfish Res 17:1359-1363
Rognes T, Flouri T, Nichols B, Quince C, Mahé F (2016) VSEARCH: a versatile open source
tool for metagenomics. PeerJ 4:e2584. doi:10.7717/peerj.2584
Rohland N, Reich D, Mallick S, Meyer M, Green RE Georgiadis NJ et al. (2010) Genomic
DNA Sequences from Mastodon and Woolly Mammoth Reveal Deep Speciation of
Forest and Savanna Elephants. PLOS Biol 8:e1000564.
doi:10.1371/journal.pbio.1000564
Ronquist F, Teslenko M, van der Mark P, Ayres DL, Darling A, Hohna S et al. (2012)
MrBayes 3.2: efficient Bayesian phylogenetic inference and model choice across a large
model space. Syst Biol 61:539-554. doi:10.1093/sysbio/sys029
Rosenberg NA (2004) DISTRUCT: a program for the graphical display of population
structure. Mol Ecol Notes 4:137-138. doi:10.1046/j.1471-8286.2003.00566.x
Ryder OA (1986) Species conservation and systematics: the dilemma of subspecies. Trends
Ecol Evol 1:9-10. doi:10.1016/0169-5347(86)90059-5
Salzburger W, Ewing GB, Von Haeseler A (2011) The performance of phylogenetic
algorithms in estimating haplotype genealogies with migration. Mol Ecol 20:1952-1963.
doi:10.1111/j.1365-294X.2011.05066.x
Scheffers BR, Joppa LN, Pimm SL, Laurance WF (2012) What we know and don’t know
about Earth's missing biodiversity. Trends Ecol Evol 27:501-510.
doi:10.1016/j.tree.2012.05.008
Shirley MH, Villanova VL, Vliet KA, Austin JD (2014b) Genetic barcoding facilitates captiveand wild management of three cryptic African crocodile species complexes. Anim
38
Conserv 18:322-330. doi:10.1111/acv.12176Shirley MH, Vliet KA, Carr AN, Austin JD (2014a) Rigorous approaches to species
delimitation have significant implications for African crocodilian systematics and
conservation. Proc R Soc B 281:20132483. doi:10.1098/rspb.2013.2483
Streicher JW, Schulte II JA, Wiens JJ (2016) How should genes and taxa be sampled for
phylogenomic analyses with missing data? An empirical study in iguanian lizards. Syst
Biol 65:128-145. doi:10.1093/sysbio/syv058
Tajima F (1989) Statistical method for testing the neutral mutation hypothesis by DNA
polymorphism. Genetics 123:585-595
Vasconcelos WR, Hrbek T, Da Silveira R, De Thoisy B, Marioni B, Farias IP (2006)
Population genetic analysis of Caiman crocodilus (Linnaeus, 1758) from South
America. Genet Mol Biol 29:220-230. doi:10.1590/S1415-47572006000200006
Vasconcelos WR, Hrbek T, Da Silveira R, De Thoisy B, Ruffeil LAAS, Farias IP (2008)
Phylogeographic and Conservation Genetic Analysis of the Black Caiman
(Melanosuchus niger). J Exp Zool Part A Ecol Genet Physiol 309A:600-613.
doi:10.1002/jez.452
Venegas-Anaya M, Crawford AJ, Galván AHE, Sanjur OI, Densmore III LD, Bermingham E
(2008) Mitochondrial DNA phylogeography of Caiman crocodilus in Mesoamerica and
South America. J Exp Zool 309A:614-627. doi:10.1002/jez.502
Vogler AP, Desalle ROB (1994) Diagnosing Units of Conservation Management. Conserv.
Biol. 8:354-363. doi:10.1046/j.1523-1739.1994.08020354.x
Waples RS (1991) Pacific salmon, Oncorynchus spp. & the definition of “species” under the Endangered Species Act. Mar Fish Rev 53:11-22
Waples RS (1995) Evolutionarily significant units and the conservation of biological diversity
under the Endangered Species Act. In: Nielsen JL, Powers GA (eds) Evolution and the
Aquatic Ecosystem: Defining Unique Units in Population Conservation. American
Fisheries Society, Maryland, pp 17:8-27
Zwickl DJ (2006) Genetic algorithm approaches for the phylogenetic analysis of large
biological sequence datasets under the maximum likelihood criterion. Dissertation, The
University of Texas, Austin.
39

Table 1. Pairwise FST between cyt b groups previously established by BAPS cluster analysis.
All values are significant at the p < 0.008 level after Bonferroni correction.
Pairwise FST Amazon Madeira Bolivia Pantanal
Amazon ----
Madeira 0.972 ----
Bolivia 0.929 0.769 ----
Pantanal 0.957 0.981 0.952 ----
40
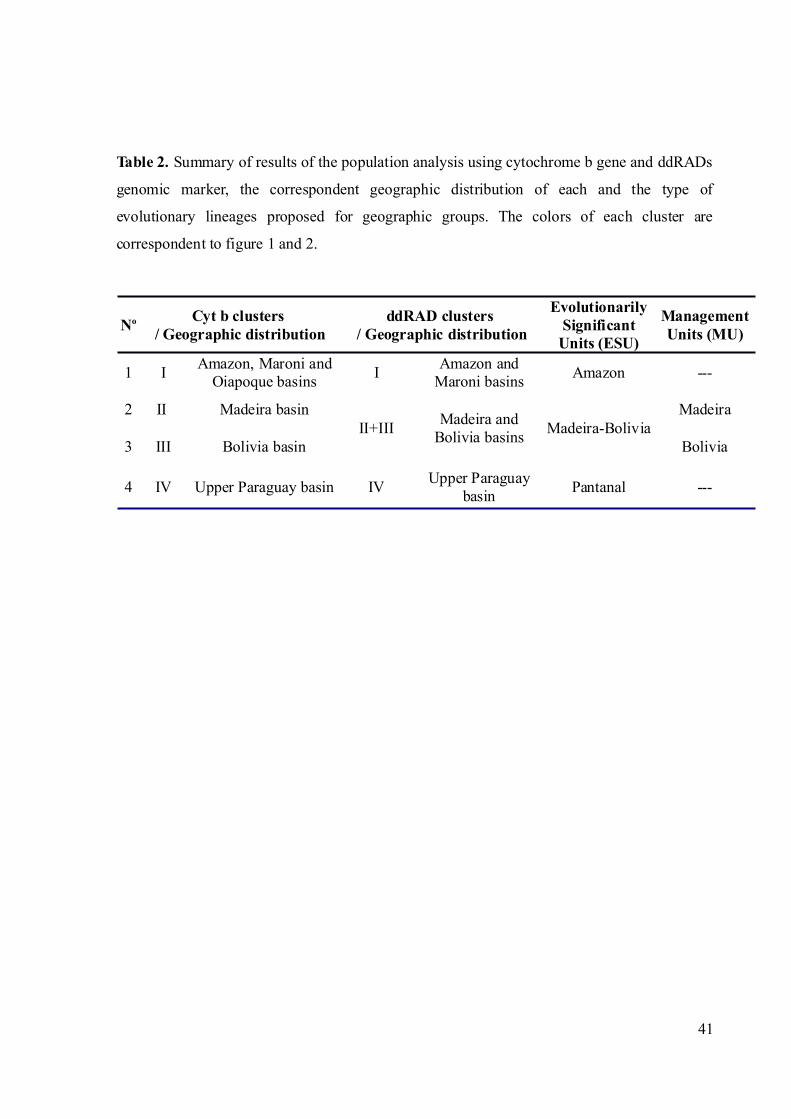
Table 2. Summary of results of the population analysis using cytochrome b gene and ddRADs
genomic marker, the correspondent geographic distribution of each and the type of
evolutionary lineages proposed for geographic groups. The colors of each cluster are
correspondent to figure 1 and 2.
No Cyt b clusters / Geographic distribution
ddRAD clusters / Geographic distribution
EvolutionarilySignificant
Units (ESU)
ManagementUnits (MU)
1 IAmazon, Maroni and
Oiapoque basinsI
Amazon andMaroni basins
Amazon ---
2 II Madeira basinII+III
Madeira andBolivia basins
Madeira-BoliviaMadeira
3 III Bolivia basin Bolivia
4 IV Upper Paraguay basin IV Upper Paraguay
basinPantanal ---
41

Table 3. Population parameters and genetic diversity indexes in P. palpebrosus populations
and in other crocodilian species. N: number of samples; Hp: number of unique haplotypes; cyt
b: number of sequenced base pairs (bp) of cyt b gene; π: Nei’s nucleotide diversity and
standard deviation (SD); Nei’s gene diversity (1987) and standard deviation (SD); and
Tajima’s D (1989) and Fu’s Fs (1997) neutrality tests. (*) Indicates significant p values
(<0.05).
Species Population N Hpcyt b(bp)
π ± SDNei’s gene
diversity ± SDTajima’s D (p) Fu’s Fs (p) Reference
Paleosuchus
palpebrosus
Amazon 47 08 1,102 0.0007 ±0.0006
0.544 ± 0.093 -1.155 (0.117) -1.966 (0.081) This study
Madeira 77 05 1,1020.0001 ±0.0002 0.101 ± 0.047 -1.943 (0.001)* -5.881 (0.000)* This study
Bolivia 32 06 1,1020.0010 ±0.0007 0.518 ± 0.100 -0.680 (0.264) -1.200 (0.231) This study
Pantanal 50 05 1,102 0.0006 ±0.0005 0.494 ± 0.080 -0.449 (0.380) -1.020 (0.258) This study
ALL 206 22 1,102 0.0101 ±0.0051
0.791 ± 0.021 1.651 (0.957) 6.914 (0.922) This study
Caiman
crocodilus
Amazon + Fr.Guiana
32 09 1,142 --- 0.692 ± 0.079 -1.612 -4.885 Farias et al. (2004)
Amazon + Fr.Guiana
125 38 1,085 0.0011 ±0.0008 0.733 ± 0.042 -2.568* −28.829*
Vasconcelos et al.(2006)
Melanosuchus
niger
Amazon + Fr.Guiana
47 10 1,142 --- 0.715 ± 0.049 -0.449* −1.330* Farias et al. (2004)
Amazon + Fr.Guiana
130 39 1,0270.0017 ±0.0011 0.911 ± 0.023 -2.523* −27.602*
Vasconcelos et al.(2008)
Caiman yacare
Bolivianbasin
143 16 1,143 0.0017 ±0.0010 0.573 ± 0.033 -0.956 -4.638 Godshalk (2006)
Pantanal 65 9 1,1430.0013 ±0.0009 0.778 ± 0.031 -1.089 -1.714 Godshalk (2006)
Osteolaemus
osborniCongo Basin 24 1 781
0.0000 ±0.0000 0.000 ± 0.000 0.000 0.000 Eaton et al. (2009)
Osteolaemus
tetraspis
OgooueBasin
46 7 7810.0014 ±0.00103 0.515 ± 0.077 -1.335 -1.879 Eaton et al. (2009)
West Africa 10 7 7810.0048 ±0.0029 0.866 ± 0.107 -0.229 -1.494 Eaton et al. (2009)
Mecistops
cataphractus
CentralAfrica
92 7 9350.00042 ±0.00045
0.295 ± 0.061 -1.721* -5.091* Shirley et al. (2014a)
West Africa 13 5 9350.0023 ±0.0015
0.782 ± 0.079 -0.637 0.116 Shirley et al. (2014a)
42

Fig. 1 a Map showing all the sites sampled in this study, b results of the BAPS analysis and c
haplotype network based on the mitochondrial cyt b gene. The colors in the BAPS graph,
haplotype network and at every point on the map represent the cluster to which the analyzed
individuals belong based on BAPS assignments. The points with two colors on the map
indicate the sites where haplotypes assigned to different groups were found. Each group is
also highlighted in the haplotype network, indicating which type of conservation unit it
represents, i.e., Evolutionarily Signifcant Unit or Management Unit. These assignments also
took into account the results of the STRUCTURE analysis of ddRAD data. The doted lines
delimit distribution of the P. palpebrosus based on IUCN. The map was constructed in QGIS
program and fnal graphic artwork was made in Inkscape
43

Fig. 2 Phylogenetic tree reconstructed by Bayesian Inference (BI) approach depicting the
relationships among the P. palpebrosus from Amazon, Madeira, Bolivia and Pantanal,
estimated from 1102 bp of cyt b gene sequence data (mtDNA). Terminals are individuals with
representative sequence of each cyt b haplotype found, named according with tissue collection
number and their locality of origin. Colors indicate to which evolutionary lineage each
individual has been assigned. Maximum-likelihood (ML) tree showed similar topology and
equivalent node supports to BI and so was not presented
44

Fig. 3 (A) Map showing the geographic distribution of the individuals analyzed and (B) the
results of STRUCTURE analysis using ddRAD data as well as correspondence with the cyt b
clusters shown in the figure 1. Each location shown in the figure is represented by only one
individual. In the results of STRUCTURE and at every point on the map, the colors represent
the groups to which each analyzed individual belongs. The points with two colors on the map
indicate individuals with genomic composition of two different groups and therefore the result
of admixed ancestry. The proportion of colors represents the proportion of SNPs in each
group contained in the interbred individual. The doted lines delimit distribution of the P.
palpebrosus based on IUCN. The map was constructed in QGIS program and final graphic
artwork was made in Inkscape
45

SUPPLEMENTARY MATERIAL
Delimitation of evolutionary units in Cuvier's dwarf caiman, Paleosuchus
palpebrosus (Cuvier, 1807): insights from conservation of a broadly
distributed species
Conservation Genetics
FL Muniz1,2 . Z Campos3 . SM Hernández Rangel1,2 . JG Martínez1,4,5 . BC Souza6 . B De Thoisy7,8 .
R Botero-Arias9,10 . T Hrbek1 . IP Farias1
1Laboratory of Animal Genetics and Evolution (LEGAL), Department of Biology, Federal University of Amazonas (UFAM), Manaus, Amazonas, Brazil2National Institute for Amazonian Research (INPA), Graduate Program in Genetics, Conservation and Evolutionary Biology, Manaus, Amazonas, Brazil3 Wildlife Laboratory, Brazilian Agricultural Research Corporation (EMBRAPA) Pantanal, Corumbá, Mato Grosso do Sul, Brazil4Grupo de Investigación Biociencias, Facultad de Ciencias de la Salud, Institución Universitaria Colegio Mayor de Antioquia, Medellín, Colombia5Grupo de Pesquisa em Genética Molecular e Citogenética, Programa de Pós-Graduação em Biotecnologia e Recursos Naturais (MBT), Escola Superior de Ciências da Saúde, Universidade do Estado do Amazonas, Manaus, Brazil6Chico Mendes Institute for Biodiversity Conservation (ICMBio), Boa Vista, Roraima, Brazil7Institut Pasteur de la Guyane, Cayenne, French Guiana8Association Kwata, Cayenne, French Guiana9Caiman Research in Conservation and Management Program, Instituto Mamirauá para o Desenvolvimento Sustentável, Tefé, Amazonas, Brazil10Department of Wildlife Ecology and Conservation, University of Florida, Gainesville, FL, USA
Corresponding author: Fábio de Lima Muniz . e-mail: [email protected]
46

Table S1 Study sites in the Brazilian Amazon, Guiana Shield and Pantanal biome. All sample
locations were in Brazil less one (*) that was colected in French Guyana. In the table are
shown the coordinate for samples, the number of individuals used in the analysis with cyt b
gene and ddRADseq as well as the correspondence of the localities with the figure 2
Locality Coordinates cyt b ddRADseqCorrespond to
figure 21. Japura River 1°50'00.01"S 69°02'00.02"W 1 0 -2. Maracá Island 3°26'53.11"N 61°48'38.54"W 6 1 13. Mucajaí 2°28'20.87"N 60°55'42.12"W 2 0 -4. Tanpok River* 2°55'26.43"N 53°38'50.32"W 1 1 25. Uaçá River 3°45'56.06"N 51°36'56.19"W 1 0 -6. Careiro da Várzea 3°18'35.00"S 59°52'26.67"W 7 1 37. Cururu lake 3°30'46.40"S 60°41'18.78"W 13 1 48. Caapiranga 3°17'02.76"S 61°13'07.67"W 8 0 -9. Purus River 5°04'17.82"S 62°58'00.02"W 7 1 510. Autazes 3°36'14.06"S 59°09'01.13"W 1 0 -11. Nova Olinda do Norte 3°43'26.03"S 59°04'00.75"W 12 1 612. Novo Aripuanã 5°19'25.80"S 60°38'27.89"W 10 1 713. Manicoré 5°59'20.55"S 61°29'20.32"W 12 1 814. Humaitá, BR-319, km 57 7°22'28.37"S 63°12'36.42"W 8 1 915. Humaitá, BR-230, km 20 7°35'15.51"S 63°09'09.51"W 12 1 1016. Porto Velho 8°47'28.37"S 63°56'36.42"W 11 0 -17. Among rapids 9°38'14.51"S 64°55'57.89"W 12 0 -18. Guajará-Mirim 10°48'08.35"S 65°19'52.60"W 7 1 1119. Surpresa 11°51'55.97"S 65° 2'53.70"W 3 1 1220. Costa Marques 12°24'23.27"S 64°12'14.42"W 4 0 -21. Pimenteiras do Oeste 13°30'53.27"S 61° 5'09.80"W 9 1 1322. Vila Bella da Santíssima Trindade 15°01'07.92"S 59°56'52.24"W 9 1 1423. Pontes e Lacerda 15°12'13.87"S 59°21'18.56"W 0 1 1524. Tangará da Serra 14°30'16.65"S 57°34'59.04"W 2 1 1625. Barra do Brugres 15°04'0.12"S 57°04'42.33"W 6 1 1726. Serra das Araras 15°37'36.29"S 57°12'5.97"W 11 1 1827. Rondonópolis 16°28'12.64"S 54°37'57.63"W 9 1 1928. Coxim 18°31'02.39"S 54°44'24.13"W 11 1 2029. Serra do Amolar 17°52'38.86"S 57°36'5.94"W 5 0 -30. Serra do Urucum 19°11'43.34"S 57°36'45.45"W 6 0 -
TOTAL 206 20
47

Table S2 Diagnostic sites for each Evolutionarily Significant Unit (ESU) based on Population
Aggregation Analysis (PAA) phylosophy. The position of each cytochrome b site fixed for at
least one Evolutionarily Significant Unit (22 sites) and the number of individuals sharing
these sites (N) are shown
ESU Nucleotide position N0
0
0
8
0
0
7
4
0
0
7
7
0
1
4
9
0
2
2
1
0
3
0
2
0
3
0
9
0
3
2
9
0
5
1
5
0
5
6
6
0
5
6
9
0
6
4
4
0
6
7
1
0
6
7
4
0
7
1
0
0
7
2
2
0
8
6
7
0
8
7
3
0
8
9
6
0
9
7
4
1
0
3
9
1
0
8
9Amazon C G C A A A A A G G G T A A C C G G G G C T 47Madeira-Bolivia A G A A C G A A A G G C A G C T A G A A C A 111Pantanal A A C G C G G G A A A T G A T C G A G A T A 50
48

CAPÍTULO 2
Muniz FL, Campos Z, Farias IP, Hrbek T (2018)
What drives diversification along the Amazon–
Paraguay basin transition? A biogeographic model
for semi-aquatic and aquatic taxa. In prep. to
Journal of Biogeography.
49
Original Article
What drives diversification along the Amazon–Paraguay basin transition? A
biogeographic model for semi-aquatic and aquatic taxa
Muniz, Fábio1,2; Campos, Zilca3; Farias, Izeni Pires2,4; Hrbek, Tomas2,4
1National Institute for Amazonian Research (INPA), Graduate Program in Genetics, Conservation and
Evolutionary Biology, Manaus, Amazonas, Brazil
2Laboratório de Evolução e Genética Animal, Departamento de Genética, Instituto de Ciências Biológicas,
Universidade Federal do Amazonas, Manaus, AM, Brazil
3Empresa Brasileira de Pesquisa Agropecuária (Embrapa) Pantanal, Corumbá, MS, Brazil
4Brigham Young University, Provo, UT
*Correspondence: Tomas Hrbek, e-mail: [email protected]
Keywords: South America, Evolutionary Significant Units, dwarf caiman, Madeira River, Fitzcarrald
Arch
RH: Divergence and hybridization in the Madeira basin
50
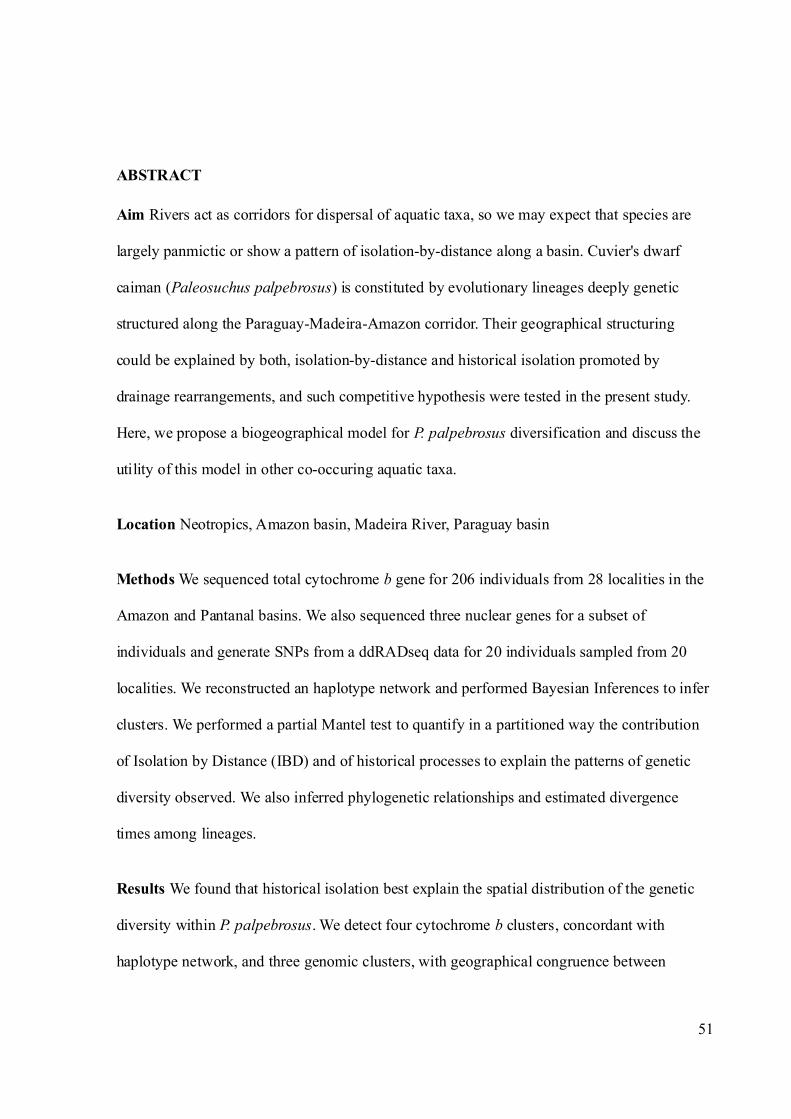
ABSTRACT
Aim Rivers act as corridors for dispersal of aquatic taxa, so we may expect that species are
largely panmictic or show a pattern of isolation-by-distance along a basin. Cuvier's dwarf
caiman (Paleosuchus palpebrosus) is constituted by evolutionary lineages deeply genetic
structured along the Paraguay-Madeira-Amazon corridor. Their geographical structuring
could be explained by both, isolation-by-distance and historical isolation promoted by
drainage rearrangements, and such competitive hypothesis were tested in the present study.
Here, we propose a biogeographical model for P. palpebrosus diversification and discuss the
utility of this model in other co-occuring aquatic taxa.
Location Neotropics, Amazon basin, Madeira River, Paraguay basin
Methods We sequenced total cytochrome b gene for 206 individuals from 28 localities in the
Amazon and Pantanal basins. We also sequenced three nuclear genes for a subset of
individuals and generate SNPs from a ddRADseq data for 20 individuals sampled from 20
localities. We reconstructed an haplotype network and performed Bayesian Inferences to infer
clusters. We performed a partial Mantel test to quantify in a partitioned way the contribution
of Isolation by Distance (IBD) and of historical processes to explain the patterns of genetic
diversity observed. We also inferred phylogenetic relationships and estimated divergence
times among lineages.
Results We found that historical isolation best explain the spatial distribution of the genetic
diversity within P. palpebrosus. We detect four cytochrome b clusters, concordant with
haplotype network, and three genomic clusters, with geographical congruence between
51

markers. However, we found incongruences in the phylogenetic relationships and in the
divergence time estimates using these markers, indicating that historical mixture events may
have occurred.
Main conclusions We propose a biogeographic model that can be summarized as follows: 1)
isolation of the Bolivian sub-basin and the Pantanal from the Amazon basin 3-2 mya by the
rise of the Fitzcarald Arch; 2) isolation of the Bolivian basin from the Pantanal by the
compression event along the Andean belt 2.5 mya; 3) formation of the current course of the
Madeira River when it began to drain the Bolivian basin and connecting itself to the lower
course of the Aripuana River at 1-2 mya; 4) previously allopatric populations that come into
secondary contact in the Madeira River hybridize and 5) the upper Madeira rapids restrict
gene flow or delimit species distributions. Finally, we discuss that the diversification of some
co-occurring aquatic vertebrate species (e.g. Caiman crocodilus and C. yacare, lineages in
Pteronura brasiliensis, Inea geoffrensis and I. boliviensis) should be explained in light of the
biogeographical model we proposed.
52

INTRODUCTION
The origin of Neotropical biodiversity and the biogeography of South American fauna
have fascinated biologists since Wallace's expedition to the Amazon and Negro river basins.
Many hypotheses have been proposed, and it is clear that many different processes have
contributed to the origin of this biodiversity (Leite & Rogers, 2013; Pyron & Wiens, 2013).
The River barrier hypothesis, proposed by Wallace (1852), is one of the most frequently
invoked theory to explain this high biodiversity, especially in the Amazon, so that formation
of rivers will lead to vicariant speciation in terrestrial taxa (e.g. Pounds & Jackson, 1981;
Ribas et al., 2012; Boubli et al., 2014; Oliveira et al., 2016). Rivers also play an important, if
different role for aquatic taxa and taxa associated with aquatic environments. They act as
corridors for the dispersal of species (e.g. Pounds & Jackson, 1981; Barthem & Goulding,
1997; Fernandes, 1997; Hrbek et al., 2005; Santos et al., 2007), so we may expect that aquatic
species are largely panmictic or show a pattern of isolation-by-distance along the length of
their distributions.
On the other hand, the current configuration of most river networks themselves were
geologically assembled in stages (Latrubesse & Franzinelli, 2005), resulting in structuring of
species occupying them (e.g. Schneider et al., 2012). In general, historical events of landscape
changes result in drainage rearrangements or headwater captures, which may promote
dispersion of aquatic-dependent taxa to an area beyond its original distribution (geodispersal)
or even a secondary contact between previously isolated populations (Albert & Carvalho,
2011; Crampton, 2011). Furthermore, such rearrangements are expected to have affected
several species with similar life histories at the same time frame and in a similar way,
producing congruent spatial-temporal distribution patterns that can be used to make
53

biogeographic inferences (Avise, 2000; Smith et al., 2014).
Multiple geological rearrangements occurred in the contact zone between Amazon and
Paraguay river basins, promoting headwaters capture events and consequently aquatic fauna
exchange between these basins (Carvalho & Albert, 2011). The last headwater capture event
that occurred between these basins was due the compression event along the Andean belt
(~2,5 Ma) which gave rise to the modern Pantanal wetland (Assine, 2004). One of the most
important transition zone between aquatic vertebrates occupying both Amazon and Pantanal
River basins is represented by the entire Madeira River sub-basin. Understanding what led to
the structuring of species and species groups of the Madeira River sub-basin is particularly
challenging, mainly because the observed pattern of spatial structure can be explained by both
ecological or vicariant speciation processes.
The Madeira River sub-basin is characterized by gradients in vegetational
communities (Schietti et al., 2016; Ortiz et al., 2018); it also is a transitional zone between the
Amazonian rainforest, and the drier biomes to the south of it including the Cerrado, the Beni
savanna and the Chaco plain, thus clinal divergences may be important, especially to
terrestrial taxa. In the case of caimans, which despite being a semi-aquatic species uses the
terrestrial habitat to forage and build their nests, we may expect a pattern of isolation-by-
distance. In contrast, the Madeira River sub-basin would have undergone drainage
rearrangements due to the uplift of the Fitzcarrald Arch, which would have isolated
populations that were later reconnected with the rest of Amazon basin. If this isolation of
Madeira sub-basin has lasted long enough, we may expect that aquatic-dependent species
show a pattern of genetic structure incompatible with isolation-by-distance
scenario in the Madeira River, thus reinforce the historical isolation scenario.
54

There are few aquatic taxa that occur in the Madeira basin and also in the Paraguay
and the rest of Amazon basin, and thus Cuvier's smooth-fronted caiman (Paleosuchus
palpebrosus), the smallest Neotropical Alligatoridae (Campos et al., 2010), would represent
an ideal systems to test such diversification scenarious. Paleosuchus palpebrosus is semi-
aquatic and can be found in flooded forests surrounding small tributary rivers and lakes of the
Amazon basin (Campos et al., 2010); however, it also occurs in the upper Paraguay basin
where it is restricted to small rivers at high elevations before they enter the Pantanal
floodplain (Campos & Mourão, 2006).
Muniz et al. (2018) delimited evolutionary lineages deeply genetic structured along
the Paraguay-Madeira-Amazon River, that were hidden in the nominal species Paleosuchus
palpebrosus. Given the congruence between genetic structuring and geographical distribution,
the authors have named such lineages as ESUs (Evolutionary Significant Units) and MUs
(Management Units) as follows: ESU "Amazon", ESU "Madeira-Bolivia" (subdivided into
MU "Madeira" and MU "Bolivia") and ESU "Pantanal". The pattern of geographical
structuring these authors found could be explained for both, isolation-by-distance and
historical isolation, and such competitive hypothesis were tested in the present study.
The aim of this study was to test the role of the drainage rearrangements along the
Paraguay-Madeira-Amazon River corridor for the structuring of the P. palpebrosus. We
further propose a biogeographical model to explain the diversification of P. palpebrosus
lineages along these areas and discuss the utility of this model for other co-occurring aquatic
and semi-aquatic taxa.
55

MATERIAL AND METHODS
Study area and sample collection
The sample strategy used in this study is the same we used in Muniz et al. (2018;
thesis chaper 1). We sampled individuals along a transect starting in the upper Paraguay basin
(19°11' S and 57°36' W) and continuing through the Bolivian sub-basin to the mouth of the
Madeira River (03°43' S and 59°04' W). Additionally we sampled individuals from the central
Amazon, the lower Madeira-Purus interfluve, the upper Japura River and the Guiana Shield.
In total, we sampled 206 individuals from 28 localities (Fig. 1a). Number of individuals per
locality ranged from one to 14. Samples were obtained by removing one or more scutes from
adults, sub-adults or juveniles during standard field marking procedures. Individuals were
captured at night, and collected scutes were stored in 95% ethanol and deposited at the
Animal Genetics Tissue Collection (CTGA) of the Federal University of Amazonas (UFAM),
Brazil. Caimans were captured under license #13048-1/IBAMA Brazil.
Molecular data collection
Total DNA was isolated using a standard proteinase K/phenol-chloroform extraction
protocol (Sambrook et al., 1989). The mitochondrial cytochrome b gene (1102 bp) and the
nuclear MYC (myelocitomatosis, 966pb), DEN (dentin, 570pb) and MOS (c-mos, 520pb)
genes were amplified and sequenced following the protocol of Hrbek et al. (2008). The
generated sequences were assembled, edited and aligned in the software Geneious 6.1.8
(Drummond et al., 2014).
We also generated a reduced representation library of 20 individuals of P. palpebrosus,
five individuals from each of the mitochondrial groups (see below), and five individuals of P.
56

trigonatus. Library preparation followed in spirit the protocol of Peterson et al. (2012), but
included modifications such that sample digestion and linker ligation was done
simultaneously. From each individual, 200 ng of genomic DNA was digested with SdaI and
Csp6I restriction enzymes (Fermentas), and the P and A linker were ligated to the fragments.
The number of expected fragments in the tight range of fragments selected was estimated
based on genomes of Alligator mississipiensis and A. sinensis deposited in Genbank
(approximately 2.2 × 10 × 9 bp). Following PCR enrichment and size selection of fragments
between 320 and 400 bp (producing ~ 15,000 fragments) in the PippinPrep (Sage Science), all
sampled were pooled at equimolar quantities, and sequenced on an IonTorrent PGM using the
400 bp sequencing chemistry and the 318 chip. The complete protocol is available on GitHub
(https://github.com/legalLab). Reads were processed in the pyRAD v3.0.5 pipeline (Eaton,
2014) and were used to generate a matrix of unlinked SNPs and of concatenated sequences.
All alleles had to have minimum coverage of 5x to be called, and in the final datasets, a locus
had to be present in at least 50% of the individuals to be included.
Data analyses
We evaluate hypothesis of isolation-by-distance and historical isolation by testing if
the current patterns of genetic diversity are explained by an equilibrium between gene flow
and genetic drift among the sampled localities of the transect, or if additional historical
processes are necessary to explain the patterns of distribution of genetic diversity. For this we
carried out both a simple and a multiple matrix regression (partial Mantel test). For the
traditional Mantel test, we analyzed two matrices: 1) genetic distance matrix (mtDNA data),
based on pair-wise ФST between localities; 2) matrix of geographical distances between
57

localities following the course of rivers, except in the Pantanal where P. palpebrosus is
restricted to the periphery of the basin. For the partial Mantel test, in addition to the two
matrices above, we included a binary matrix representing biological groups/phylogenetic
lineages. The binary matrix was derived from the evolutionary lineages identified in the
program BAPS representing connectivity (1) or lack there off (0) between individuals (Sokal et
al., 1997). Linear regressions and correlations between the matrices were carried out in
Spacial Analysis in Macroecology (SAM) software (Rangel et al., 2010) with statistical
significance being assessed via 5000 permutations.
In order to estimate gene flow, and its historical components, between geographically
adjacent populations, we analyzed the mtDNA data within the IMA2 framework (Hey &
Nielsen, 2007). Each population pair we ran 15 independent chains with heating and chain-
swapping following an exponential probability. Following a burn-in of 10 thousand
topologies, we generated 30 million topologies, sampling each 10th topology for a total of 300
thousand topologies.
We used the program BEAST v2.3.2 (Bouckaert et al., 2014) to generate a time
calibrated mtDNA phylogenetic hypothesis of the divergence of the main lineages of P.
palpebrosus. We used one sequence from the most frequent haplotype of each of the four
mtDNA haplogroup, as well as one sequence of P. trigonatus from genbank (EU161679.1) as
outgroup (Hrbek et al., 2008). We fixed the topology (Amazon(Pantanal(Madeira, Bolivia)))
to correspond the well supported Bayesian inference using 22 individuals representative of all
haplotypes (see Muniz et al., 2018; thesis chaper 1). We also considered the divergence time
of P. palpebrosus and P. trigonatus (mean = 9.53 my; 95% HPD = 7.54–11.31 my), based on
species tree estimated by Oaks (2011), as a secondary calibration point. An alternative cyt b
58

time-calibrated tree was generated using only fossil records following Oaks (2011) with an
additional calibration point at ~12 mya, corresponding to the first non-ambiguous
Paleosuchus fossil (Salas-Gismondi et al., 2015).
The sampling strategy consisted of 10 million generations with topologies sampled
every thousands generation, starting from a random tree. The Birth-Death process was applied
on all the uncalibrated divergence times (Gernhard, 2008) and default values for remaining
priors. We also used a lognormal relaxed-clock, that assumes independent rates of substitution
on each branch of the tree (Drummond et al., 2006). To improve the accuracy of phylogenetic
reconstruction (Castoe et al., 2004) we partitioned the data a priori by codon position. The
topologies were used to calculate posterior clade probabilities and divergence times.
Convergence of all parameters was assessed by inspection in the program TRACER (Drummond
et al., 2012). Estimates of parameter values were based on an effective sample size (ESS) of at
least 200. Of the 1000 topologies, the first 50 were discarded as burn-in, and the remaining
tree were summarized in TREEANNOTATOR – component of the BEAST package. The resulting
temporally calibrated topology was visualized in FIGTREE v1.4.2 (Rambaut, 2014).
To reconstruct phylogenetic relationships using the nuDNA (ddRADseq) data, and to
test for concordance in phylogenetic relationships based on the mtDNA and nuDNA data, we
ran an analysis on SNAPP (Bryant et al., 2012) under the default priors (λ = 1/X; μ = 1/X; ν = 1/
X; snapprior = γ with parameter values determined empirically). The analysis consisted of 10
million generations with topologies sampled every thousands generation. Divergence time
calibrations were also based on the species tree divergence estimate of P. palpebrosus and P.
trigonatus (Oaks, 2011).
59

RESULTS
Of the four genes analyzed, the mitochondrial cytochrome b gene had the most
phylogenetic information. In a total of 1102 bp, sequenced in 206 individuals, we observed 42
variable sites of which 37 were parsimony informative. The three nuclear genes contained at
most two alleles and thus were not used in subsequent analyses (see supplementary material,
Figure S1).
Next generation sequencing produced approximately 3.6 million usable reads after
processing in PYRAD (Eaton, 2014). On average, between 17 to 21 thousand unique loci with
an average coverage of 3.5x were observed in each individual in the 300-400 bp range.
Filtering loci to a minimal of 5x coverage, on average 2-3 thousand loci per individual with an
average coverage of 7.5-8.5x coverage were retained. In the final dataset, where a locus had to
be present in at least 50% of the individuals, 722 loci were retained. These 722 loci
represented 532 unlinked SNPs.
We investigated the pattern of geographical structuring in the Amazon-Madeira-
Paraguay corridor, using both simple and multiple Mantel tests. The traditional Mantel test
analysis between genetic and geographic distances indicated that the two matrices are
correlated (r = 0.621; p < 0.001), showing that 38.6% of the variation in genetic distance is
explained by geographic distance between pairs of adjacent localities. The partial Mantel test
allowed us to evaluate the contribution of each predictive variable, historical divergence
(History) between groups and isolation-by-distance (IBD), for the observed patterns of
population structuring of genetic diversity (Fig. 1). The binary matrix containing information
about whether pairs of individuals belong to the same or different biological groups obtained
from BAPS was significantly correlated with the genetic distance matrix (r = 0.906; p <
60

0.001) such that historical processes explained 82.0% (a+b, Fig. 1) and isolation-by-distance
38.6% (b+c, Fig. 1) of the variation in the distribution of genetic diversity along the transect.
However, while 44.7% (a, Fig. 1) of the total variation is explained exclusively by historical
differentiation, only 1.3% (c, Fig. 1) of the total variation is explained by ongoing restricted
gene flow (isolation-by-distance). As expected, it was not possible to completely separate
historical from ongoing components given that the binary matrix is also spatially structured,
i.e. correlated with the geographic distance matrix. Thus 37.3% (b, Fig. 1) of the total
variation could be explained by either historical or current processes.
The IMA2 analyzes based on cyt b dataset showed absence of gene flow between pairs
of populations: Amazon / Madeira-Bolivia / Pantanal. However, non-zero gene flow was
observed between Madeira and Bolivia mitochondrial clusters, likely restrictely in the
localities downstream and upstream of the Teotônio rapids. The rate of gene flow was low in
both directions, however, slightly greater in the direction of Bolivia to Madeira (2Nm = 1.655
individuals per generation) than in the opposite direction (2Nm = 0.629 individuals /
generation).
Using cytb data we estimated the age of the first split within P. palpebrosus species
complex at 1.36 mya (95% HPD, 0.48 – 3.15 mya), when the “Amazon” diverged from the
others. The divergence time between “Pantanal” and “Madeira+Bolivia” was 1.06 mya (95%
HPD, 0.33 – 2.26 mya), while the divergence found between the populations of “Madeira”
and “Bolivia” was 0.13 mya (95% HPD, 0.01 – 0.44 mya; see Fig. 2). Using SNAPP analysis
with genomic dataset we estimated the age of the root of P. palpebrosus species complex at
3.49 mya (95% HPD, 3.08 – 4.03 mya). The first diverging lineage was the genomic cluster
from the Pantanal, with divergence time estimated at 2.79 mya (95% HPD, 2.57 – 3.18 mya).
61

Geographic regions were not monophyletic, and individuals from the “Amazon” were nested
within the “Madeira+Bolivia” genomic clusters. The age of the root of the “Amazon” plus
“Madeira+Bolivia” clade was estimated at 1.55 mya (95% HPD, 1.28 – 1.95 mya; see Fig. 3).
An alternative time-tree estimated with fossil record calibration points only are provided in
the supplementary material (Fig. S2).
DISCUSSION
Before we discuss some aspects of our results it is important to know the current
macro-geographic features of the Amazon-Madeira-Pantanal corridor. These regions consists
of river basins and sub-basins separated by well-defined geological features, with the
exception of the Amazon macro-geographic region (occupied by the Amazon group/cluster)
which is not separated by any evident physical barrier from the Madeira River macro-
geographic region (occupied by the Madeira and Bolivian group/cluster). Further south, the
Madeira River is separated by a 290 km stretch of rapids and waterfalls (Cella-Ribeiro et al.,
2013) from the Bolivian basin macro-region (occupied by the Madeira and Bolivian
group/cluster) which in turn is separated by the Parecis mountains from the Pantanal macro-
region (occupied by the Pantanal group/cluster); the Pantanal encompasses the headwaters of
the Paraguay River basin while the Bolivian basin encompasses the headwaters of the
Madeira River basin.
Muniz et al. (2018) noticed that the spatial distribution of genetic structure they found
in P. palpebrosus is congruent with the geological features described above. The authors
argued that P. palpebrosus is clearly comprised of at least three distinct evolutionary lineages
along the transect from the Pantanal to the Amazon. Such pattern of geographical structuring
62

would be explained by both, isolation-by-distance (IBD) and historical isolation, and we
tested these competitive hypothesis in the present study. We found significant correlation
between genetic and geographical distances using traditional Mantel test, that not necessarily
should be interpreted as IBD, because historical events are also spatial autocorrelated (see
Diniz-Filho et al., 2009; Legendre & Legendre, 2012). We applied a Partial Mantel test to
quantify the relative contribution of both current isolation and deep historical events to
explain the observed genetic patterns. We found that historical isolation best explain the
spatial distribution of the genetic diversity within P. palpebrosus (see Fig. 1).
Phylogeny and divergence time estimation of lineages
Muniz et al. (2018) found a geographical congruence between mitochondrial and
genomic clusters using population genetic structure analyses. However, the phylogenetic
reconstruction using SNPs dataset was different from that made with the mitochondrial
marker. The SNAPP reconstruction indicated that "Pantanal" was the sister group of the other
lineages within P. palpebrosus instead of "Amazon", whose samples were phylogenetically
nested within the “Madeira” and “Bolivia” (Fig. 3).
We also found subtle incongruities in the divergence times estimated by the different
markers. Analysis of the mtDNA data suggests that the oldest divergence dated at 1.36 mya
(95% HPD, 0.48 – 3.15 mya) is between individuals from the Amazon and all other
individuals. This split was followed by the divergence of the “Pantanal” lineage from the
“Madeira+Bolivia” lineage at 1.06 mya (95% HPD, 0.33 – 2.26 mya). Older divergence times
were observed in SNAPP analyses of the ddRADseq SNP data, the root of the SNAPP
topology was dated at 3.49 mya (95% HPD, 3.08 – 4.03 mya). Given that individuals from
63

other localities are phylogenetically nested within the Pantanal group, the coalescent event
directly preceding allopatric divergence between the Pantanal and the other samples, was
dated at 2.79 mya (95% HPD, 2.57 – 3.18 mya). Despite the subtle incongruities on time of
divergence between markers the confidence intervals from basal diversification overlaps and
are compatible with the biogeographic model we proposed bellow.
Such incongruities between mtDNA and nuclear data indicate that historical mixture
events could have occurred between “Amazon” and “Bolivia” via Madeira River. This
mixture would have been maintained for an extended period until reproductive isolation
mechanisms were established, producing a current preferential mating even in the absence of
an explicit geographical barrier. This hypothesis would plausibly explain how the allele
frequencies of “Amazon” and “Madeira+Bolivia” were maintained different in the
STRUCTURE results (k = 3; Muniz et al., 2018), despite individuals from "Amazon" were
phylogenetically nested within the “Madeira+Bolivia” in the SNAPP reconstruction (Fig. 3).
Furthermore, the STRUCTURE analysis evidenced an unidirectional introgression of
"Pantanal" to "Bolivia" as result of a male mediated dispersion, since "Pantanal" remains
monophyletic in mtDNA (maternally inherited) and with differentiated allele frequencies in
nuclear genome. Interesting that an individual in the Guaporé River that has mtDNA of
"Bolivia" was included in the ddRadseq data and showed > 90% of the genome from
"Pantanal" (Muniz et al., 2018), representing certainly a hybrid. This individual from Bolivian
basin was nested within "Pantanal" clade in the SNAPP reconstruction, thus corroborating the
hybrid condition.
The multispecies coalescent analysis on SNAPP incorporates the effect of Incomplete
Lineage Sorting (ILS) but not of Lateral Gene Transfer (LGT), so that the presence of LGT
64

violates one of the SNAPP assumptions (Bryant et al., 2012). The LGT would produce a
reticulation of character states incompatible with Hennignian cladistic inferences and
consequently produce an unreliable estimate of the phylogeny. Since the mtDNA marker is
free of the effect of hybridization we believe that its topology better represents the
phylogenetic relationships within P. palpebrosus and thus the biogeographic model we will
propose bellow is based on that topology. It is important to highlight that the mtDNA and
nuclear markers show complementary histories and thus our ddRadseq data will be useful to
investigate the evolutionary processes such as ILS, LGT, gene flow and demographic changes
that occurred along the diversification of P. palpebrosus.
Biogeographic model for biological diversification across the Madeira basin
The Amazon River is formed by the confluence of the Ucayali and Marañon Rivers
and has the Madeira River its main tributary, both in volume and sediment delivery. The
current pattern of the Amazon River running into the Atlantic, and the formation of the
Madeira River drainage as we know it today occurred after the breach of the Purus Arch.
Theories explaining the evolution of the drainage in the Amazonian landscape divide
scientists depending on whether data sets (marine- or land-derived) or the type of analytic
methods (stratigraphic, geochemistry, sedimentology or phylogeography) are used (Hoorn et
al., 2017). Two alternative time frames are debated to the transcontinental origin of Amazon
River: A Late Miocene hypothesis (Hoorn et al., 1995, 2010; Figueiredo et al., 2009; Antoine
et al., 2016) and a Plio-Pleistocene hypothesis (Campbell et al., 2006, 2010; Latrubesse et al.,
2010; Ribas et al., 2012). However, all authors agree that the Bolivian basin was continuous
with the western Amazon basin before the formation of the transcontinental Amazon River. As
65

these competitive hypotheses for the current conformation of the Amazon River predate our
biogeographic model we could use any of them. So we chose the map proposed by Hoorn et
al. (2010) to represent the landscape before the divergence of P. palpebrosus (Fig. 6A).
The Paraguay and Amazon basins were primarily isolated because of the formation of
Chapare Buttress, a structural divide between paleo-Amazonas-Orinoco and Paraguay basins
by about 30-20 mya (Lundberg et al., 1998). The first event of capture of headwaters
happened 11.8-10 mya when the boundary between these basins moved south to the
Michicola Arch and headwaters of Upper Paraguay basin were captured by Amazon basin
(Lundberg et al., 1998). Subsequently, many headwater capture events happened and the
precise limits of the two watersheds have shifted numerous times (Wilkinson et al., 2006).
The uplift of the Fitzcarrald Arch in early middle Pliocene commenced to isolate
the Bolivian basin (southern Amazonian foreland basin sensu Espurt et al. 2007) from
the Amazon basin (northern Amazonian foreland and eastern Amazon basin sensu
Espurt et al. 2007) no earlier than 4 mya (Espurt et al., 2007, 2010). This uplift was gradual
and continuous until the principal outflow of the Bolivian basin, the proto-Purus River, was
severed (probably 3-2 mya), resulting in major remodeling of drainage patterns within the
Bolivian basin, turning the Bolivian basin into an endorheic basin (Menezes, 1988) dominated
by swamps and lakes (Fig. 4B). Headwater capture events may have allowed faunal exchange
between the Bolivian endorheic basin and Pantanal at this time.
The formation of the modern Pantanal wetland occurred in the Late Pliocene (~2.5
Ma) following the orogenesis of the Parecis mountains (Ussami et al., 1999) and the last
compression event along the Andean belt (Assine, 2004) which also represents the last major
headwater capture event (Fig. 4C). This headwater capture would have continuously
66

distributed species, which posteriorly would have undergone vicariant divergence. Currently,
the divide between these basins is not noticeable, encompassing several large fluvial fans
(megafans) and lowland divide that provide a suitable landscape for movement of aquatic taxa
across basins (Carvalho & Albert, 2011), that is, currently the basins are partially connected.
For about 1,400 years the Parapetí River (in the headwater of Mamoré River) flows into the
Izozog swamp and eventually exchanges water with the Timané River (a tributary of the
Paraguay River), during the rainy season (Iriondo, 1993), thus allowing for faunal interchange
between these basins and possibly promoting a secondary contact between deeply diverged
lineages.
Subsequent to the separation of the Paraguay basin, the Bolivian endorheic basin
channeled through the escarpment of the Brazilian Shield, creating a series of rapids now
characteristic of the upper Madeira River. Eventually the outflow from the Bolivian basin
connected with the lower portion of the Aripuana River, creating the current Madeira River
(Räsänen et al., 1987; Hoorn et al., 1995; Campbell et al., 2001), and reconnecting the aquatic
fauna of the Bolivian basin with that of the Amazon basin (Fig. 4D). The age of the Madeira
River is supported by the divergence of sister lineages of trumpeter birds of the genus
Psophia (Ribas et al., 2012) and the antibirds of the genus Rhegmatorhina (Ribas et al.,
2018).
This sequence of events had important consequences for the Madeira basin fauna
evolution. First, it would have transported Bolivian fauna down the Madeira River until its
encounter with the Aripuanã River. Second, this fauna would have come into secondary
contact with allopatrically diverged fauna of the Amazon basin. Third, the descend of the
67

Madeira River over the Brazilian Shield resulted in the formation of the upper Madeira River
rapids which subsequently partially or completely limited bidirectional gene flow.
The model can thus be summarized this way: 1) isolation of the Bolivian basin and the
Pantanal from the Amazon basin 3-2 mya by the rise of the Fitzcarald Arch (Fig. 4B); 2)
isolation of the Bolivian basin from the Pantanal by the compression event along the Andean
belt 2.5 mya (Fig. 4C); 3) formation of the current course of the Madeira River when it began
to drain the Bolivian basin, transcending the Brazilian shield at the region of the upper
Madeira rapids, and connecting itself to the lower course of the Aripuana River at 1-2 mya
(Fig. 4D); 4) previously allopatric populations that come into secondary contact in the
Madeira River hybridize (Fig. 4D); 5) the upper Madeira rapids restrict gene flow or delimit
species distributions (Fig. 4D).
Can this model be applied to other aquatic species?
Drainage rearrangements are expected to produce a congruent spatial-temporal
distribution in aquatic species, that can be used to make biogeographic inferences. Species
with different dispersal capacity and ancestral distribution can respond differently to the same
historical event, thus producing a spatial-temporal distribution partially inconsistent, that not
necessarily invalidate the model. Here we discuss some examples of aquatic vertebrates
whose diversification could be explained in light of the biogeographical model we proposed.
Pickels et al. (2011), using mitochondrial marker, found a spatial-temporal pattern in
the semi-aquatic giant otter (Pteronura brasiliensis), very similar to what we find in P.
palpebrosus using the same molecular marker. The authors found four deeply structured
phylogroups distributed in “Amazon+Orinoco+Guianas”, “Madeira+Madre de Dios”,
68

“Itenez” (or Guaporé River corresponding to our denomination of “Bolivia”) and “Pantanal”;
thus showing an entirely congruent spatial pattern with P. palpebrosus diversification. Despite
the relationships between these phylogroups are uncertain due to the low support of the nodes,
the divergence time of the basal split at 1.24–1.69 mya (0.72–3.1 mya 95% HPD) and
subsequent divergence at 0.88 mya (0.2–1.6 mya 95% HPD) also demonstrate a temporal
congruence with P. palpebrosus.
The uplift of the Fitzcarrald Arch, and thus the isolation of the western Amazon basin
from the Bolivian basin would have led to the vicariant divergence of many of the species
previously shared between them. This event corresponds not only to the split between P.
palpebrosus lineages from the Amazon and the Bolivian-Pantanal basin, but is also reflected
in the sister taxon relationships of caimans (Caiman crocodilus and C. yacare), dolphins (Inia
geoffrensis and I. boliviensis), frogs (Allobates femoralis and A. hodli), and fishes (Cichla
monoculus and C. pleiozona). Divergence of the caiman was estimated at 3.28 mya (2.09–
4.79 mya 95% HPD, species tree) (Oaks, 2011), of the dolphins at 2.87 mya (1.31–4.90 mya
95% HPD) (Hrbek et al., 2014), the frogs at 2.8 mya (1.4–4.3 mya 95% HPD) (Simões, 2010)
and the fishes at 10% pair-wise divergence in the mtDNA control region suggesting
approximately 2-3 my divergence (Willis et al., 2012).
Multiple headwater capture events occurred between Pantanal and the Bolivian basin,
so it is observed in the divergence of the “Pantanal” and “Madeira+Bolivia” lineages of
Paleosuchus palpebrosus and the deep phylogenetic divergence of Caiman yacare lineages (~
1.5 mya) reported by Godshalk (2006). While no species of Inia occurs in the Paraguay basin,
iniid dolphins (Inia congenerics) occurred in the Paraguay basin until at least the late Miocene
(Gutstein et al., 2014). Fish genera that are widespread in the Paraná-Paraguay basin, but with
69

only one species with restricted distribution in the Amazon, support the headwater capture as
a promoter of aquatic fauna exchange between them (e.g. Menezes, 1988; Wimberger et al.
1998; Kullander, 2003; Bockmann & Miquelarena, 2008). Other case, involve fish species
that occur in both basins and are restricted to high elevations, as Cetopsis starnesi and the
Ixinandria steinbachi (see Vari et al., 2005; Rodriguez et al. 2008, respectively). In these
cases, the dispersal through megafan dynamics seems unlikely and stream capture in the Sub-
Andean region is the plausible explanation. More recently Tagliacollo et al. (2015) used a
species-dense time-calibrated phylogeny to investigate the pimelodid catfishes and found
biogeographical signature of river capture in the spatial and phylogenetic distributions of
these taxa. Characiform taxa of the genera Prochilodus (Sivasundar et al., 2001), and
Serrasalmus and Pygocentrus (Hubert et al., 2007) occurring on either side of the Parecis
mountains are estimated to have diverged 4.1–2.3 mya, 1.76 ± 0.2 mya and 1.77 ± 0.3 mya,
respectively. All these divergence times were related to events of headwater capture.
Downstream of the confluence of the Madeira and Aripuana rivers, one observes the
substitution of lineages of dolphins of the genus Inia (Gravena et al., 2014), lineages of the
clade B of peacock cichlids (Willis et al., 2012), as well as several terrestrial taxa (Geurgas &
Rodrigues, 2010; Simões et al., 2013; Ortiz et al., 2018). Additionally, in this region, there is
an abrupt change in fish communities, one characteristic of the middle and upper Madeira
River, and the other of the Amazon basin (Torrente-Vilara & Zuanon, pers. com.). Upstream
of this contact zone, a discordance in the mtDNA and nuDNA phylogenies of Paleosuchus
palpebrosus is observed. This is best explained by hybridization of the “Bolivian+Madeira”
lineage with the Amazon lineage resulting in the replacement of the former by the later’s
nuDNA. The same pattern of hybridization between and replacement of Inia boliviensis
70

nuDNA by I. geoffrensis nuDNA is observed in Inia river dolphins (Gravena et al., 2015), and
in the clade B of the peacock cichlids (Willis et al., 2012).
In Paleosuchus palpebrosus (Fig. 3), and in the clade B of the peacock cichlids (Willis
et al., 2012) this discordance is observed throughout the Madeira River and the Bolivian
basin, while in the Inia dolphins it only reaches the first set of major rapids on the upper
Madeira River. Being fully aquatic, the Teotônio waterfalls are an unsurmountable barrier in
the upstream direction for Inia dolphins, while the forested banks of the Madeira River act as
a dispersal corridor to dispersal for P. palpebrosus. The effect of the Teotônio waterfalls on
structuring mtDNA of both Paleosuchus palpebrosus and Inia boliviensis is the same,
however. Gene flow is primarily, or in the case of Inia boliviensis exclusively in the
downstream direction (Gravena et al., 2015), with an estimated 0.13 my divergence (0.01–
0.44 mya 95% HPD) observed in P. palpebrosus and a similar divergence age of 0.12 mya
(0.03–0.28 mya 95% HPD) of Inia boliviensis groups upstream and downstream of the rapids
(Gravena et al., 2014).
Although our model explains why hybridization occurs in the Madeira River, it does
not explain why discordances in mitochondrial and nuclear DNA patterns persist. It is
intriguing to observe concordance in the discordance of mitochondrial and nuclear DNA
patterns across multiple taxa occupying the Madeira River basin, which leads us to suspect
that the commonly invoked explanation of female phylopatry is unlikely mechanism in
maintaining this pattern. Thus, future studies evaluating such question will be welcome.
71

Biosketch. F.M. is a PhD student using field and laboratory based approaches to study the
evolution of Paleosuchus crocodilians. All authors have had long term research interest in
South American crocodilian taxa, and use these taxa to understand evolutionary processes that
generate observed biodiversity patterns in crocodilian and other Amazonian taxa. All authors
are also avid field biologists and seek to contribute to the conservation of these enigmatic
species. Laboratory website is at http://evoamazon.net.
Authors’ contributions. F.M., I.P.F. and T.H. conceived the study; All contributed in the
design of this study; F.M. and Z.C. collected samples; F.M. and T.H. collected sequence data;
F.M., I.P.F. and T.H. participated in data analysis and all authors drafted and gave final
approval for publication.
Competing interests. We declare that we have no competing interests.
Funding. Financial support was provided by grants CNPq/CT-Amazon 575603/2008-9 to IPF,
CNPq 482662/2013-1 to TH and CNPq 470383/2007-0 to ZC. We thank Embrapa Pantanal
(Macroprograma 3), Fundect, Fundação O Boticário and Santo Antônio Energia for providing
additional financial support. This work forms a portion of FM’s PhD thesis at the Genetics,
Conservation and Evolutionary Biology program of INPA/UFAM. FM is supported by a
fellowship from FAPEAM, and IPF and TH by a CNPq fellowship.
Acknowledgments. This study would not have been possible without the many colleagues
who partook in fieldwork and contributed with samples, members of the LEGAL lab who
72

help optimize the ddRAD protocol and Sandra Hernandez who helped generate the
ddRADseq data. We thank Jack Sites, and members of the Sites lab for helpful comments on
earlier versions of this MS.
73

REFERENCES
Antoine, P. O., Abello, M. A., Adnet, S., Ali, J. A. S., Patrice, B., …. Salas-Gismondi, R.
(2016). A 60-million-year Cenozoic history of western Amazonian ecosystems in Contamana, eastern Peru. Gondwana Research, 31, 30–59.
Assine, M. L. (2004). A bacia sedimentar do Pantanal Mato-Grossense. In V. Mantesso-Neto,
A. Bartorelli, C.D.R. Carneiro, & B.B. Brito-Neves (Eds.), Geologia do Continente Sul-
Americano - Evolução da Obra de Fernando Flávio Marques de Almeida (pp. 61–74). Beca, São Paulo.
Avise, J. C. (2000). Phylogeography: the history and formation of species. Harvard university
press, Cambridge, MA.
Barthem, R. B., & Goulding, M. J. (1997). The catfish connection: ecology, migration, and
conservation of Amazon predators. Columbia University Press, New York.
Bockmann, F. A. & Miquelarena, A. M. (2008). Anatomy and phylogenetic relationships of a
new catfish species from northeastern Argentina with comments on the phylogenetic
relationships of the genus Rhamdella Eigenmann and Eigenmann 1888 (Siluriformes,
Heptapteridae). Zootaxa, 54, 1-54.
Boubli, J. P., Ribas, C. C., Lynch-Alfaro, J. W., Alfaro, M. E., da Silva, M. N. F., Pinho, G.M.,
& Farias, I. P. (2014). Spatial and temporal patterns of diversification on the Amazon: A
test of the riverine hypothesis for all diurnal primates of Rio Negro and Rio Branco in
Brazil. Molecular Phylogenetics and Evolution, 82, 400–412.
Bouckaert, R. R., Heled, J., Kühnert, D., Vaughan, T., Wu, C. H., Xie, D., Suchard, M. A.,
Rambaut, A., & Drummond, A. J. (2014). BEAST 2: A software platform for Bayesian
evolutionary analysis. PLoS Computational Biology, 10, e1003537.
Bryant, D., Bouckaert, R. R., Felsenstein, J., Rosenberg, N. A., & Roychoudhury, A. K.
(2012). Inferring species trees directly from biallelic genetic markers: Bypassing gene
trees in a full coalescent analysis. Molecular Biology and Evolution, 29, 1917-1932.
Campbell, Jr. K. E., Frailey, C. D., & Romero Pittman, L. (2006). The Pan-Amazonian
Ucayali Peneplain, late Neogene sedimentation in Amazonia, and the birth of the modern
Amazon River system. Palaeogeography, Palaeoclimatology, Palaeoecology, 239, 166–
219.
Campbell, Jr. K. E., Heizler, M., Frailey, C. D., Romero Pittman, L., & Prothero, D. R.
(2001). Upper Cenozoic chronostratigraphy of the southwestern Amazon Basin.
Geology, 29, 595-598.
74

Campos, Z., & Mourão, M. P. G. (2006). Conservation status of the dwarf caiman,
Paleosuchus palpebrosus, in the region surrounding Pantanal. Crocodile Specialist
Group Newsletter, 25, 9–10.
Campos, Z., Sanaiotti, T. M., & Magnusson, W. E. (2010). Maximum size of dwarf caiman,
Paleosuchus palpebrosus (Cuvier, 1807), in the Amazon and habitats surrounding the
Pantanal, Brazil. Amphibia-Reptilia, 31, 439-442.
Carvalho, T. P. & Albert, J. S. (2011). The Amazon-Paraguay Divide. In J. S. Albert & R. E.
Reis (Eds.), Historical Biogeography of Neotropical Freshwater Fishes (pp. 192-202).
University of California Press, Los Angeles.
Castoe, T. A., Doan, T. M., & Parkinson, C. L. (2004). Data partitions and complex models in
Bayesian analysis: The phylogeny of gymnophthalmid lizards. Systematic Biology, 53,
448-469.
Cella-Ribeiro, A., Torrente-Vilara, G., Hungria, D. B., & Oliveira, M. de (2013). As
corredeiras do Rio Madeira. In L. J. de Queiroz, G. Torrente-Vilara, W. M. Ohara, T. H.
S. Pires, J. Zuanon, & C. R. C. Doria (Eds.), Peixes do Rio Madeira (pp. 47–53). Santo
Antonio Energia.
Crampton, W. G. R. (2011). An Ecological Perspective on Diversity and Distributions. In J. S.
Albert & R. E. Reis (Eds.), Historical Biogeography of Neotropical Freshwater Fishes
(pp. 165–189). University of California Press, Los Angeles.
Diniz-Filho, J. A. F., Nabout, J. C., Telles, M. P. C., Soares, T. N., & Rangel, T. F. L. V. B. (2009). A review of techniques for spatial modeling in geographical, conservation and
landscape genetics. Genetics and Molecular Biology, 32, 203-211.
Drummond, A.J., Ashton, B., Buxton, S., Cheung, M., Cooper, A., Duran, C., Field, M.,
Heled, J., Kearse, M., Markowitz, S., Moir, R., Stones-Havas, S., Sturrock, S., Thierer,
T., & Wilson, A.C. (2014). Geneious v6.1.8. available at http://www.geneious.com/.
Drummond, A. J., Ho, S. Y. W., Phillips, M. J., & Rambaut, A. (2006). Relaxed phylogenetics
and dating with confidence. PLoS Biology, 4, e88.
Drummond, A. J., Suchard, M. A., Xie, D., & Rambaut, A. (2012). Bayesian phylogenetics
with BEAUti and the BEAST 1.7. Molecular Biology and Evolution, 29, 1969-1973.
Eaton, D. A. R. (2014). PyRAD: assembly of de novo RADseq loci for phylogenetic analyses.
Bioinformatics, 30, 1844-1849.
Espurt, N., Baby, P., Brusset, S., Roddaz, M., Hermoza, W., & Barbarand, J. (2010). The
Nazca Ridge and uplift of the Fitzcarrald Arch: implications for regional geology in
northern South America. In C. Hoorn & F.P. Wesselingh (Eds.), Amazonia: Landscape
75

and Species Evolution: A Look into the Past (pp. 89–100). Wiley-Blackwell.
Espurt, N., Baby, P., Brusset, S., Roddaz, M., Hermoza, W., Regard, V., Antoine, P. O., Salas-
Gismondi, R., & Bolaños, R. (2007). How does the Nazca Ridge subduction influence
the modern Amazonian foreland basin? Geology, 35, 515-518.
Fernandes, C. C. (1997). Lateral migration of fishes in Amazon floodplains. Ecology of
Freshwater Fish, 6, 36–44.
Figueiredo, J. P., Hoorn, C., van der Ven, P., & Soares, E. C. (2009). Late Miocene onset of
the Amazon River and the Amazon deep-sea fan: Evidence from the Foz do Amazonas
Basin. Geology, 37, 619-622.
Gernhard, T. (2008). The conditioned reconstructed process. Journal of Theoretical Biology,
253, 769-778.
Geurgas, S. R. & Rodrigues, M. T. U. (2010). The hidden diversity of Coleodactylus
amazonicus (Sphaerodactylinae, Gekkota) revealed by molecular data. Molecular
Phylogenetics and Evolution, 54, 583-593.
Godshalk, R. (2006). Phylogeography and conservation genetics of the yacare caiman
(Caiman yacare) of South America. Ph.D. thesis, University of Florida, Gainesville, FL.
Gravena, W., Farias, I. P., da Silva, M. N. F., da Silva, V. M. F., & Hrbek, T. (2014). Looking
to the past and the future: were the Madeira River rapids a geographic barrier to the boto
(Cetacea: Iniidae)? Conservation Genetics, 15, 619-629.
Gravena, W., da Silva, V. M. F., da Silva, M. N. F., Farias, I. P., & Hrbek, T. (2015). Living
between rapids: Genetic structure and hybridization in botos (Cetacea: Iniidae: Inia spp.)
of the Madeira River, Brazil. Biological Journal of the Linnean Society, 114, 764-777.
Gutstein, C. S., Cozzuol, M. A., & Pyenson, N. D. (2014). The antiquity of riverine
adaptations in Iniidae (Cetacea, Odontoceti) documented by a humerus from the Late
Miocene of the Ituzaingó Formation, Argentina. Anatomical Record, 297, 1096-1102.
Hey, J. & Nielsen, R. (2007). Integration within the Felsenstein equation for improved
Markov chain Monte Carlo methods in population genetics. Proceedings of the National
Academy of Sciences, 104, 2785-2790.
Hoorn, C., Bogotá-A, G. R., Romero-Baez, M., Lammertsma, E. I., Flantua, S. G. A., Dantas,
E. L., Dino, R., do Carmo, D. A., & Chemale, F. (2017). The Amazon at sea: Onset and
stages of the Amazon River from a marine record, with special reference to Neogene
plant turnover in the drainage basin. Global and Planetary Change, 153, 51-65.
Hoorn, C., Guerrero, J., Sarmiento, G. A., & Lorente, M. A. (1995). Andean tectonics as a
cause for changing drainage patterns in Miocene northern South America. Geology, 23,
76

237-240.
Hoorn, C., Wesselingh, F. P., ter Steege, H., Bermudez, M. A., Mora, A., Sevink, J.,
Sanmartín, I., Sanchez-Meseguer, A., Anderson, C. L., Figueiredo, J. P., Jaramillo, C.,
Riff, D., Negri, F. R., Hooghiemstra, H., Lundberg, J. G., Stadler, T., Särkinen, T., &
Antonelli, A. (2010). Amazonia through time: Andean uplift, climate change, landscape
evolution, and biodiversity. Science, 330, 927-931.
Hrbek, T., Farias, I. P., Crossa, M., Sampaio, I., Porto, J. I. R., & Meyer, A. (2005). Population
genetic analysis of Arapaima gigas, one of the largest freshwater fishes of the Amazon
basin: implications for its conservation. Animal Conservation, 8, 297-308.
Hrbek, T., da Silva, V. M. F., Dutra, N., Gravena, W., Martin, A. R., & Farias, I. P. (2014). A
new species of river dolphin from Brazil or: how little do we know our biodiversity.
PLoS ONE, 9, e0083623.
Hrbek, T., Vasconcelos, W. R., Rebêlo, G. H., & Farias, I. P. (2008). Phylogenetic
relationships of South American alligatorids and the Caiman of Madeira River. Journal
of Experimental Zoology Part A: Ecological Genetics and Physiology, 309A, 588-599.
Hubert, N., Duponchelle, F., Nuñes, J., Garcia Davila, C., Pauly, D., & Renno, J. F. (2007). Phylogeography of the piranha genera Serrasalmus and Pygocentrus: implications for
the diversification of the Neotropical ichthyofauna. Molecular Ecology, 16, 2115-2136.
Iriondo, M. (1993). Geomorphology and late Quaternary of the Chaco (South America).
Geomorphology, 7, 289–303.
Kullander, S. O. (2003). Family Cichlidae. In R. E. Reis, S. O. Kullander, & C. J. Ferraris
(Eds.). Check list of the freshwater fishes of South and Central America (pp. 605-654).
Edipucrs: Porto Alegre.
Latrubesse, E. M., Cozzuol, M. A., da Silva-Caminha, S. A. F., Rigsby, C. A., Absy, M. L., &
Jaramillo, C. (2010). The Late Miocene paleogeography of the Amazon Basin and the
evolution of the Amazon River system. Earth Science Reviews, 99, 99-124.
Latrubesse, E. M. & Franzinelli, E. (2005). The late Quaternary evolution of the Negro River,
Amazon, Brazil: Implications for island and floodplain formation in large anabranching
tropical systems. Geomorphology, 70, 372-397.
Legendre, P. & Legendre, L. F. J. (2012). Numerical ecology. Elsevier, Oxford, UK.
Leite, R. N., & Rogers, D. S. (2013). Revisiting Amazonian phylogeography: insights into
diversification hypotheses and novel perspectives. Organisms Diversity & Evolution, 13,
639-664.
Lundberg, J. G., Marshall, L. G., Guerrero, J., Horton, B., Malabarba, M. C. S. L., &
77

Wesselingh, F. P. (1998). The stage for Neotropical fish diversification: a history of
tropical South American rivers. In L. R. Malabarba, R. E. Reis, R. P. Vari, Z. M. S.
Lucena, & C. A. S. Lucena (Eds.), Phylogeny and Classification of Neotropical Fishes
(pp. 13–48). Edipucrs: Porto Alegre, Brazil.
Menezes, N. A. (1988). Implications of the distribution patterns of the species of Oligosarcus
(Teleostei, Characidae) from central and southern South America. Proceedings of a
Workshop on Neotropical Distribution Patterns, 295-304.
Muniz, F. L., Campos, Z., Hernández Rangel, S. M., Martínez, J. G., Souza, B. C., De Thoisy,
B., Botero-Arias, R., Hrbek, T., & Farias, I. P. (2018). Delimitation of evolutionary units
in Cuvier’s dwarf caiman, Paleosuchus palpebrosus (Cuvier, 1807): insights from
conservation of a broadly distributed species. Conservation Genetics, 19, 599-610.
Oaks, J. R. (2011). A time-calibrated species tree of crocodylia reveals a recent radiation of
the true crocodiles. Evolution, 65, 3285-3297.
Oliveira, D. P., Carvalho, V. T., & Hrbek, T. (2016). Cryptic diversity in the lizard genus Plica
(Squamata): Phylogenetic diversity and Amazonian biogeography. Zoologica Scripta, 45,
630-641.
Ortiz, D. A., Lima, A. P., & Werneck, F. P. (2018) Environmental transition zone and rivers
shape intraspecific population structure and genetic diversity of an Amazonian rain forest
tree frog. Evolutionary Ecology, 32, 359–378.
Peterson, B. K., Weber, J. N., Kay, E. H., Fisher, H. S., & Hoekstra, H. E. (2012). Double digest RADseq: an inexpensive method for de novo SNP discovery and genotyping in
model and non-model species. PLoS ONE, 7, e37135.
Pickles, R. S. A., Groombridge, J. J., Zambrana Rojas, V. D., Van Damme, P., Gottelli, D.,
Kundu, S., Bodmer, R., Ariani, C. V., Iyengar, A., & Jordan, W. C. (2011). Evolutionary
history and identification of conservation units in the giant otter, Pteronura brasiliensis.
Molecular Phylogenetics and Evolution, 61, 616–627.
Pounds, J. A. & Jackson, J. F. (1981). Riverine Barriers to Gene Flow and the Differentiation
of Fence Lizard Populations. Evolution, 35, 516-528.
Pyron, R. A. & Wiens, J. J. (2013). Large-scale phylogenetic analyses reveal the causes of
high tropical amphibian diversity. Proceedings of the Royal Society of London Series B:
Biological Sciences, 280, 20131622.
Rambaut, A. (2014). FigTree v1.4.2, http://tree.bio.ed.ac.uk/software/figtree/.
Rangel, T. F. L. V. B., Diniz-Filho, J. A. F., & Bini, L. M. (2010). SAM: A comprehensive
application for Spatial Analysis in Macroecology. Ecography, 33, 46-50.
78

Räsänen, M. E., Salo, J. S., & Kalliola, R. J. (1987). Fluvial perturbance in the western
Amazon basin: regulation by long-term sub-Andean tectonics. Science, 238, 1398-1401.
Ribas, C. C., Aleixo, A., Nogueira, A. C. R., Miyaki, C. Y., & Cracraft, J. (2012). A
palaeobiogeographic model for biotic diversification within Amazonia over the past three
million years. Proceedings of the Royal Society of London Series B: Biological Sciences ,
279, 681–689.
Ribas, C.C., Aleixo, A., Gubili, C., d’Horta, F.M., Brumfield, R.T., & Cracraft, J. (2018)
Biogeography and diversification of Rhegmatorhina (Aves: Thamnophilidae):
Implications for the evolution of Amazonian landscapes during the Quaternary. Journal
of Biogeography, 45, 917–928.
Rodriguez, M. S., Cramer, C. A., Bonatto, S. L., & Reis, R. E. (2008). Taxonomy of
Ixinandria Isbrücker & Nijssen (Loricariidae: Loricariinae) based on morphological and
molecular data. Neotropical Ichthyology, 6, 367-378.
Sambrook, J., Fritsch, E. F., & Maniatis, T. (1989). Molecular Cloning: A Laboratory
Manual. Cold Springs Harbor Laboratory Press, Cold Springs Harbor, NY.
Santos, M. C. F., Ruffino, M. L., & Farias, I. P. (2007). High levels of genetic variability and panmixia of the tambaqui Colossoma macropomum (Cuvier, 1818) in the main channel
of the Amazon River. Journal of Fish Biology, 71A, 33-44.
Schietti, J., Martins, D., Emilio, T., Souza, P. F., Levis, C., Baccaro, F. B., Pinto, J. L. P. V.,
Moulatlet, G. M., Stark, S. C., Sarmento, K., de Araújo, R. N. O., Costa, F. R. C., Schöngart, J., Quesada, C. A., Saleska, S. R., Tomasella, J., & Magnusson W. E. (2016).
Forest structure along a 600 km transect of natural disturbances and seasonality gradients
in central-southern Amazonia. Journal of Ecology, 104(5), 1335-1346.
Schneider, C. H., Gross, M. C., Terencio, M. L., & Porto, J. I. R. (2012). Cryptic diversity in
the mtDNA of the ornamental fish Carnegiella strigata. Journal of Fish Biology, 81,
1210-24.
Simões, P. I. (2010). Diversificação do complexo Allobates femoralis (Anura, Dendrobatidae)
em florestas da Amazônia brasileira: desvendando padrões atuais e históricos. Instituto
Nacional de Pesquisas da Amazônia, Manaus, Brazil.
Simões, P. I., Sturaro, M. J., Peloso, P. L. V., & Lima, A. P. (2013). A new diminutive species
of Allobates Zimmermann and Zimmermann, 1988 (Anura, Aromobatidae) from the
northwestern Rio Madeira—Rio Tapajós interfluve, Amazonas, Brazil. Zootaxa, 3609,
251-273.
Sivasundar, A., Bermingham, E., & Ortí, G. (2001). Population structure and biogeography of
79

migratory freshwater fishes (Prochilodus: Characiformes) in major South American
rivers. Molecular Ecology, 10, 407-417.
Smith, B. T., McCormack, J. E., Cuervo, A. M., Hickerson, M. J., Aleixo, A., Brumfield, R.T.
(2014). The drivers of tropical speciation. Nature, 515, 406-409.
Sokal, R. R., Oden, N. L., & Thomson, B. A. (1997). A simulation study of microevolutionary
inferences by spatial autocorrelation analysis. Biological Journal of the Linnean Society,
60, 73-93.
Tagliacollo, V. A., Roxo, F. F., Duke-Sylvester, S. M., Oliveira, C., & Albert, J. S. (2015).
Biogeographical signature of river capture events in Amazonian lowlands. Journal of
Biogeography, 42, 2349-2362.
Ussami, N., Shiraiwa, S., & Dominguez, J. M. L. (1999). Basement reactivation in a sub-
Andean foreland flexural bulge: The Pantanal wetland, SW Brazil. Tectonics, 18, 25-39.
Vari, R. P., Ferraris, C. J., & De Pinna, M. C. C. (2005). The Neotropical whale catfishes
(Siluriformes: Cetopsidae: Cetopsinae), a revisionary study. Neotropical Ichthyology, 3,
127-238.
Wallace, A. R. (1852). On the monkeys of the Amazon. Proceedings of the Zoological
Society, London, 20, 107-110.
Wilkinson, M.J., Marshall, L. G., & Lundberg, J. G. (2006). River behavior on megafans and
potential influences on diversification and distribution of aquatic organisms. Journal of
South American Earth Sciences, 21, 151-172.
Willis, S. C., Macrander, J., Farias, I. P., & Ortí, G. (2012). Simultaneous delimitation of
species and quantification of interspecific hybridization in Amazonian peacock cichlids
(genus Cichla) using multi-locus data. BMC Evolutionary Biology, 12, 96.
Wimberger, P. H., Reis, R. E., & Thornton, K. R. (1998). Mitochondrial phylogenetics,
biogeography, and evolution of parental care and mating systems in Gymnogeophagus
(Perciformes: Cichlidae). In L. R. Malabarba, R. E. Reis, R. P. Vari, C. A. S. Lucena, &
Z. M. S. (Eds.). Lucena Phylogeny and Classification of Neotropical Fishes (pp. 509-
518). Edipucrs: Porto Alegre.
80
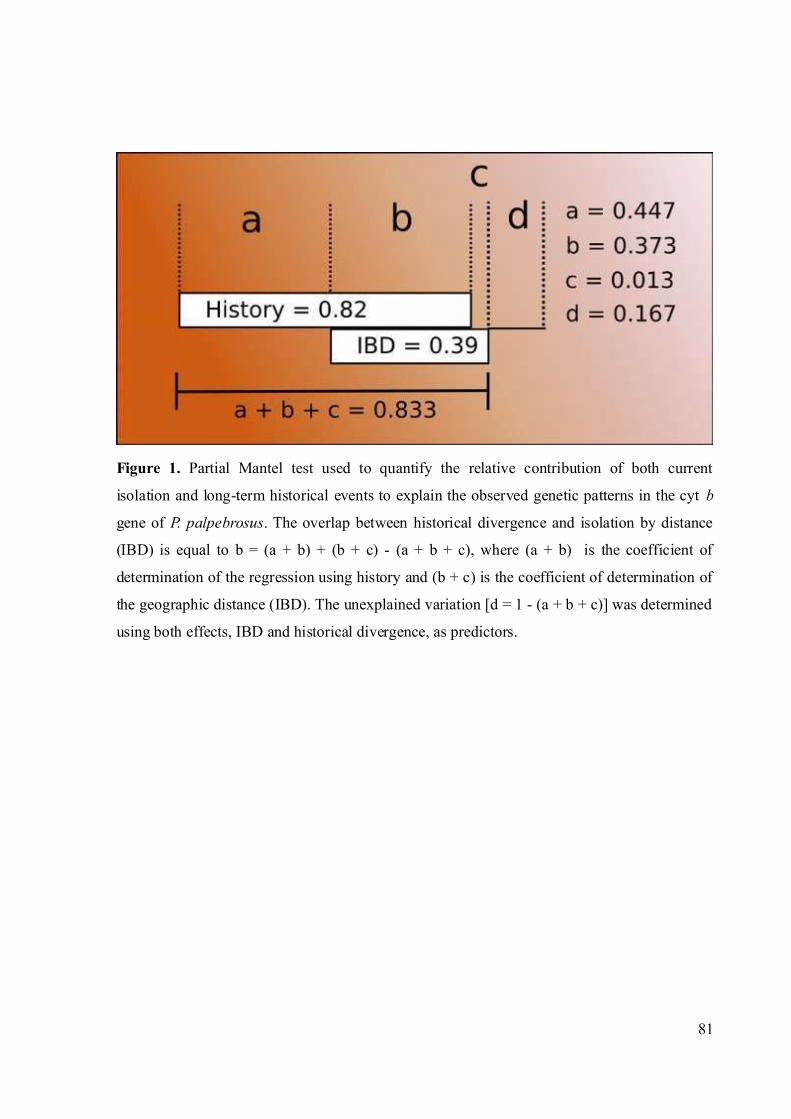
Figure 1. Partial Mantel test used to quantify the relative contribution of both current
isolation and long-term historical events to explain the observed genetic patterns in the cyt b
gene of P. palpebrosus. The overlap between historical divergence and isolation by distance
(IBD) is equal to b = (a + b) + (b + c) - (a + b + c), where (a + b) is the coefficient of
determination of the regression using history and (b + c) is the coefficient of determination of
the geographic distance (IBD). The unexplained variation [d = 1 - (a + b + c)] was determined
using both effects, IBD and historical divergence, as predictors.
81

Figure 2. Time calibrated Bayesian phylogeny of P. palpebrosus biological groups based on
the analysis of the mitochondrial cyt b gene in the program BEAST. The red circle represent
secondary calibration point based on Oaks (2011). A sequence of P. trigonatus from genbank
(EU161679.1) was used as outgroup. Nodes are labeled with the most likely divergence time
and bars around nodes represent 95% HPD intervals. Scale is in millions of years ago.
82

Figure 3. Time-calibrated species tree of the genus Paleosuchus inferred with SNAPP using
532 unlinked bialelic SNPs. This claudogram represents the posterior distribution of species
trees and high color density is indicative of areas in the species trees with high topology
agreement. Nodes are labeled with the most likely divergence time and 95% HPD divergence
time intervals. Divergence times are in millions of years ago.
83
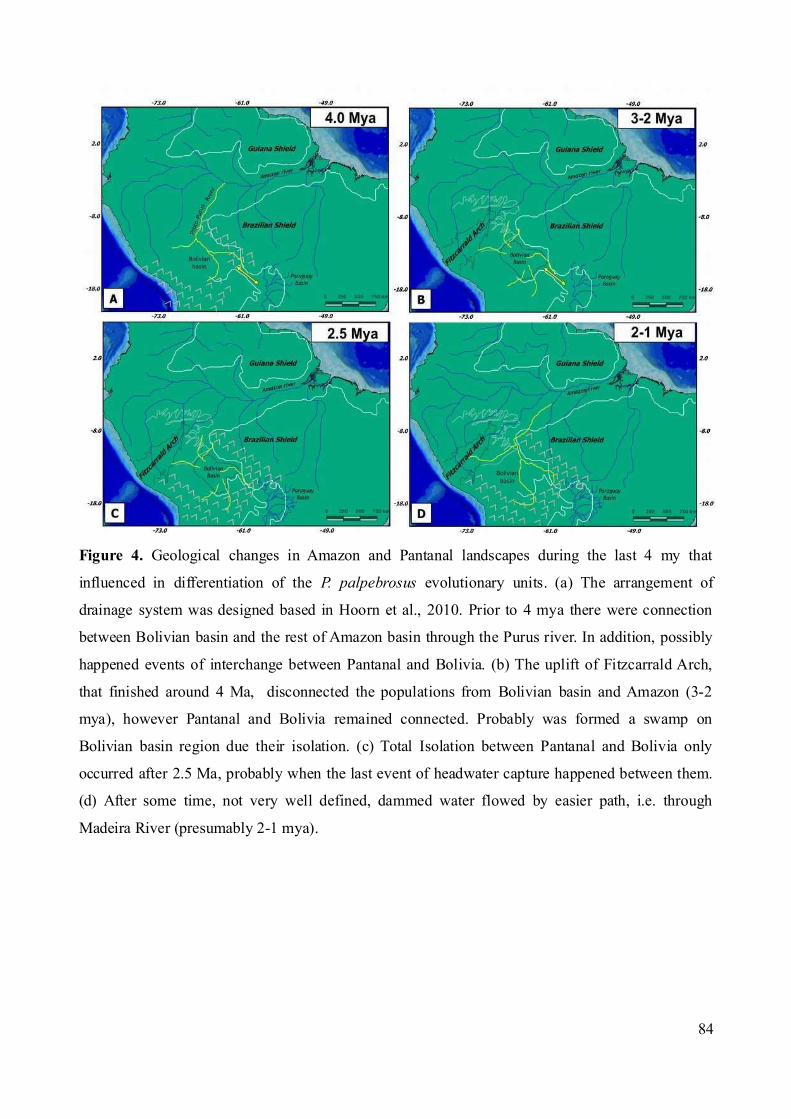
Figure 4. Geological changes in Amazon and Pantanal landscapes during the last 4 my that
influenced in differentiation of the P. palpebrosus evolutionary units. (a) The arrangement of
drainage system was designed based in Hoorn et al., 2010. Prior to 4 mya there were connection
between Bolivian basin and the rest of Amazon basin through the Purus river. In addition, possibly
happened events of interchange between Pantanal and Bolivia. (b) The uplift of Fitzcarrald Arch,
that finished around 4 Ma, disconnected the populations from Bolivian basin and Amazon (3-2
mya), however Pantanal and Bolivia remained connected. Probably was formed a swamp on
Bolivian basin region due their isolation. (c) Total Isolation between Pantanal and Bolivia only
occurred after 2.5 Ma, probably when the last event of headwater capture happened between them.
(d) After some time, not very well defined, dammed water flowed by easier path, i.e. through
Madeira River (presumably 2-1 mya).
84

SUPPORTING INFORMATION
Additional Supporting Information may be found in the online version of this article:
Figure S1. Haplotype networks from genes Myc, C-Mos and DEN. Colors represent the
geographic origin of individuals. Number of gene copies with the same haplotype are given.
85
1
2
3
4

Figure S2. Alternative cyt b time-calibrated tree using only fossil records. Red circles
indicate calibrate points we used: (1) Aligatorinae/Caimaninae calibration point at
between 66-75 mya (Müller & Reisz, 2005); (2) Caiman oldest known fossil age at 10 mya,
modeled with exponential distribution (mean = 4, initial value = 15 and offset = 9); (3) The
first non-ambiguo Paleosuchus fossil at ~12 mya (Salas-Gismondi et al., 2015), modeled with
exponential distribution (mean = 4, initial value = 15 and offset = 12). Caiman sequences,
except those of P. palpebrosus, were download from genbank.
86
5
6
7
8
9
10
11

CAPÍTULO 3
Muniz FL, Campos Z, Polo E, Bittencourt PS,
Farias IP, Hrbek T. Filogenômica e
reconstrução espaço-temporal das linhagens do
complexo de espécies Paleosuchus
palpebrosus (Alligatoridae: Caimaninae). A ser
submetido para o Journal of Biogeography.
87
12

Artigo Original1
Filogenômica e reconstrução espaço-temporal das linhagens do complexo de
espécies Paleosuchus palpebrosus (Alligatoridae: Caimaninae)
Muniz, Fábio1,2; Campos, Zilca3; Polo, Érico2; Bittencourt, Pedro Senna2; Farias, Izeni Pires2,4;
Hrbek, Tomas2,4
1Instituto Nacional de Pesquisas da Amazônia, programa de pós-graduação em Genética, Conservação e
Biologia Evolutiva, Manaus, AM, Brazil
2Laboratório de Evolução e Genética Animal, Departamento de Genética, Instituto de Ciências Biológicas,
Universidade Federal do Amazonas, Manaus, AM, Brazil
3Empresa Brasileira de Pesquisa Agropecuária (Embrapa) Pantanal, Corumbá, MS, Brazil
4Brigham Young University, Provo, UT
*Correspondence: Fábio Muniz, e-mail: [email protected]
Palavras-chave: hibridização, árvore de espécies, área ancestral, jacaré-paguá.
88

RESUMO
Estabelecer uma linha prática para delimitar espécies permanece desafiador, principalmente
em casos onde ocorre hibridização. Em vertebrados, a hibridização tem sido considerada rara,
no entanto, o avanço da tecnologia viabilizou a amostragem genômica de espécies não-
modelos, e pesquisas recentes detectaram especiação com hibridização. Estudos prévios
sugerem que a história evolutiva de Paleosuchus palpebrosus deve ser melhor investigada,
uma vez que possivelmente teriam ocorrido múltiplos eventos de isolamento e contato
secundário entre as linhagens desse complexo de espécies. Neste estudo, ampliamos a
amostragem anterior, reavaliamos a estrutura populacional e estimamos a origem e rota de
dispersão do complexo P. palpebrosus usando o gene cyt b. Em seguida, utilizando dados
genômicos, estimamos as relações filogenéticas entre as linhagens e investigamos os eventos
de hibridização ao longo do processo de diversificação do grupo. Por fim, discutimos os
efeitos da hibridização na estimativa da árvore de espécies e avaliamos como os resultados se
ajustam ao modelo de diversificação previamente proposto. A amostragem foi ampliada (N =
357) e análises de estrutura populacional revelaram uma nova linhagem mitocondrial no
Escudo Brasileiro. A reconstrução espaço-temporal sugere que o ancestral do complexo P.
palpebrosus tinha ampla distribuição do Nordeste ao sul da Amazônia. A árvore de espécies
com os dados genômicos foi reconstruída usando dois métodos coalescentes e em ambos a
linhagem "Amazônia" foi bem suportada, mas as relações filogenéticas entre as demais
linhagens permaneceram não resolvidas. Nós também investigamos modelos de divergência
com migração ou hibridização pós-divergência e encontramos indícios de hibridização entre
as linhagens "Amazônia" e "Madeira". Nossos resultados reforçam o modelo de especiação
alopátrica proposto anteriormente, no entanto, será necessário ampliar a amostragem
89

genômica para investigar a ocorrência de hibridização e testar a hipótese do número de
espécies.
INTRODUÇÃO
Um conceito fundamental em sistemática biológica tem sido o de espécie, alvo de
extenso debate na história recente da ciência. O conceito biológico de espécie (Mayr, 1942)
foi o paradígma adotado por biólogos durante a segunda metade do século XX, e até pouco
tempo influenciou muitas decisões taxonômicas. Mais recentemente, foi proposto o conceito
geral de espécie como linhagens evolutivas independentes (de Queiroz, 2007), que foi
amplamente aceito, pois conseguiu distinguir filosoficamente o conceito de espécie dos
critérios operacionais a serem utilizados para delimitá-las. O debate sobre o conceito foi
resolvido, mas o problema de estabelecer uma linha prática para delimitação de espécies
permanece, principalmente em casos onde ocorre hibridização ou introgressão.
A hibridização pode previnir ou promover a especiação, pois assim como a
introgressão de genes pode homogeneizar linhagens independentes, diminuindo a divergência
genética previamente estabelecida (Runemark et al., 2012), também pode selecionar genes em
um novo arcabouço genético, capaz de favorecer o isolamento reprodutivo e a evolução
adaptativa de uma linhagem (Butlin & Ritchie, 2009; Abbott et al., 2013; Hedrick et al., 2013;
Edwards et al., 2016). A especiação com hibridização é comumente observada em plantas, no
entanto, em animais, a hibridização tem sido historicamente considerada rara ou de limitada
significância evolutiva (Servedio et al., 2013; Schumer et al., 2014). Porém, o avanço da
tecnologia viabilizou a amostragem de genes distribuídos pelo genoma de espécies não-
modelos, e em consequência disso, vários estudos encontraram especiação com hibridização
em vertebrados na natureza (Brelsford et al., 2011; Hermansen et al., 2011; Stemshorn et al.,
90

2011; Barbiano et al., 2013; Keller et al., 2013; Monzón et al., 2014; Trier et al., 2014;
Lavretsky et al., 2015; Barrera-Guzmán et al., 2018; Gottscho et al., 2017; Maguilla et al.,
2018), indicando ser essa uma situação mais comum do que se pensava até pouco tempo atrás.
A revolução tecnológica em curso também repercute no aumento da capacidade de
processamento dos computadores, e viabilizou o avanço de técnicas baseadas em coalescência
para reconstruir árvores de espécies com dados multiloci. Isso é importante porque a filogenia
baseada em um gene pode ser incompatível com a árvore de espécies, em geral, devido ao
Incomplete Lineage Sorting (ILS). O Multispecies Coalescent Model é capaz de considerar as
incertezas geradas pelas incompatibilidades entre as árvores de genes e a árvore de espécies
(Heled & Drummond, 2010), na tentativa de inferir as reais relações filogenéticas entre os
taxóns, mas as incompatibilidades são modeladas como ILS e um dos pressupostos da técnica
é ausência de fluxo gênico. Por isso, as relações filogenéticas entre espécies que supostamente
hibridizam ou hibridizaram na natureza podem ficar obscurecidas e devem ser avaliadas de
maneira complementar a outros métodos analíticos.
Neste estudo, nós investigamos a filogenômica do jacaré-paguá (Paleosuchus
palpebrosus), uma espécie amplamente distribuída na América do Sul. Muniz et al. (2018;
cap. 1 da tese) foram os primeiros a detectar estrutura genética em P. palpebrosus, ao
proporem a existência de pelo menos três Evolutionarily Significant Units (ESUs) no corredor
Amazônia-Madeira-Pantanal, que deveriam ser consideradas como espécies candidatas desse
complexo de espécies.
Muniz et al. (in prep.; cap. 2 desta tese) propuseram uma hipótese de mudanças
sucessivas na paisagem que melhor explicariam os processos de diversificação das linhagens
recém-descobertas, assumindo um modelo de especiação alopátrica. Neste estudo foi
91

encontrado incongruência entre a árvore filogenética reconstruídas com o gene cyt b e aquela
reconstruída com os marcadores SNPs, de modo que as relações filogenéticas entre as
espécies candidatas ainda não puderam ser completamente resolvidas. Foi encontrada
monofilia dos grupos com o marcador mitocondrial, mas não com o marcador genômico, o
que pode ter sido causado por vários processos evolutivos, dentre os quais os principais são:
ILS e hibridização.
Os resultados encontrados em ambos os trabalhos (Muniz et al., 2018; Muniz et al., in
prep) sugerem que podem ter ocorrido múltiplos eventos de isolamento e contato secundário
entre as linhagens e que existem mecanismos de isolamento reprodutivo entre "Amazonia" e
"Madeira". Como já visto, a ocorrência de hibridização pode influenciar na tomada de
decisões taxonômicas, então é imprescindível que a história evolutiva do complexo P.
palpebrosus seja desvendada antes que análises de delimitação de espécies sejam aplicadas.
A seguir destacamos os indícios percebidos nos estudos anteriores que motivaram a
elaboração deste: (1) o fato de um indivíduo com haplótipo mitocondrial da linhagem
"Bolívia" ter apresentado frequência dos loci nucleares compatível com a linhagem
"Pantanal" (ver Muniz et al., 2018), sugere que houve introgressão do genoma do "Pantanal"
em "Bolivia" devido a migração dos machos, já que o genoma mitocondrial de "Bolivia" foi
mantido; (2) A proporção de alelos compartilhados entre "Bolivia" e "Pantanal" diminui
gradativamente à medida que aumenta a distância para os limites atuais entre as bacias
Amazônica e do Alto Paraguai, indicando que há uma zona de contato secundário que se
estende por toda a drenagem do Rio Guaporé; (3) A monofilia recíproca encontrada com o
marcador mitocondrial e a ausência de mistura com os marcadores nucleares, entre as
linhagens adjacentes "Amazônia" e "Madeira", sugerem que existe um mecanismo de
92

isolamento reprodutivo entre elas, uma vez que não há barreira física aparente que os inpeçam
de trocar genes.
Neste estudo, testamos a ocorrência de possíveis linhagens não identificadas
anteriormente, dado que a amostragem com o marcador mitocondrial foi ampliada em relação
aos trabalhos anteriores, para incluir localidades nas bacias dos rios Paraná, São Francisco,
Parnaíba, entre outros (ver Material e Métodos). Nossos objetivos foram: (1) investigar
demografia histórica, estimando a origem e a rota de dispersão das linhagens mitocondriais;
(2) reconstruir a árvore de espécies utilizando diferentes métodos coalescentes, a fim de
resolver as relações entre as espécies candidatas; (3) estimar o melhor modelo de migração
entre as linhagens, descrevendo como o fluxo gênico teria influenciado o processo de
especiação das espécies candidatas do complexo P. palpebrosus; (4) e avaliar o ajuste destes
processos ao modelo biogeográfico previamente proposto (capítulo 2 desta tese).
MATERIAL E MÉTODOS
Coleta dos dados genéticos
Nós utilizamos todas as 206 amostras previamente sequenciadas para o citocromo b
(cyt b) utilizadas em Muniz et al. (2018). Sequenciamos 151 amostras adicionais provenientes
de 34 localidades em várias bacias hidrográficas situadas nos biomas Cerrado e Caatinga (ver
Figura 1). Ao todo, foram obtidas 357 sequências do gene cyt b de indivíduos amostrados em
82 localidades (Figura 1). As amostras de tecido adicionais foram coletadas sob a licença
brasileira #13048-1/IBAMA e foram depositadas na Coleção de Tecidos de Genética Animal
(CTGA) do Laboratório de Evolução e Genética Animal (LEGAL) na Universidade Federal
do Amazonas (UFAM), Manaus, Brasil.
93

Além da amostragem com o marcador mitocondrial nós utilizamos diferentes
filtragens de loci com os dados genômicos obtidos a partir de um subset de 20 indivíduos
pertencentes ao complexo P. palpebrosus, sendo cinco de cada linhagem mitocondrial
previamente identificada ("Amazônia", "Madeira", "Bolívia" e "Pantanal"), além de cinco
indivíduos de P. trigonatus usados como grupo externo.
Para obtenção das sequências adicionais do gene cyt b o DNA genômico foi isolado
usando o método de extração com CTAB 2 % (Doyle & Doyle, 1987) com uma adição de 15
mg/mL de Proteinase K. O gene cyt b foi amplificado usando o protocolo descrito em Hrbek
et al. (2008) e as sequências foram obtidas por meio de sequenciamento usando o método de
Sanger no sequenciador automático ABI 3500xl (Applied Biosystems). As sequências obtidas
foram editadas, montadas e alinhadas no software Geneious 6.1.8 (Drummond et al., 2014).
Nós também produzimos uma representação reduzida do genoma usando o protocolo
de sequenciamento de double digest RAD sequencing (ddRADseq) (Peterson et al., 2012) e
obtivemos as sequências no Ion Torrent PGM utilizando o chip 318 Ion PGM (Life
Technologies™). Os detalhes sobre como foram feitas as reduções do genoma são dados em
Muniz et al. (2018) e o protocolo completo de Next-generation sequencing (NGS) utilizado
neste trabalho está disponível no GitHub (https://github.com/legalLab).
As leituras obtidas com a corrida de NGS foram primeiramente processadas no
pipeline pyRAD v3.0.6 (Eaton, 2014) aplicando uma cobertura mínima de 6X e removendo
leituras com erros no barcode (sequência identificadora de cada indivíduo). Leituras com mais
de quatro nucleotídeos com baixa qualidade foram eliminadas (índice de qualidade Phred
abaixo de 20), assim como alelos com frequência mínima abaixo de 0,01. A filtragem inicial
dos dados genômicos no pyRAD resultou em 1248 loci que passaram por novas etapas de
94

filtragem até compor os diferentes conjuntos de dados (datasets) utilizados nas análises
posteriores, conforme os critérios apresentados a seguir (ver Tabela 1).
Análise dos dados mitocondriais
O conjunto completo de dados mitocondriais (357 sequências) foi analisado quanto a
estrutura populacional por meio de Inferência Bayesiana (IB) no programa BAPS v6.0
(Corander et al., 2008). Foi utilizada a comparação direta das probabilidades posteriores de
diferentes número de grupos (K) utilizando o logarítimo de verossimilhança para escolher o K
mais provável. Foi efetuada uma análise de admixture em nível individual com K variando de
1 a 10 e com 10 corridas independentes para cada valor de K.
Uma árvore de máxima verossimilhança foi reconstruída no programa RAxML v8.1.1
(Stamatakis, 2014) utilizando o modelo evolutivo GTR+G e sua topologia foi utilizada para
reconstruir uma rede de haplótipos no programa HAPLOVIEWER (Salzburger et al., 2011).
Adicionalmente, geramos uma árvore Bayesiana no programa MrBayes v3.2.2 (Ronquist et
al., 2012), com o intuito de testar monofilia e investigar sua posição filogenética da linhagem
"Cerrado" em relação às demais linhagens (Figura S1).
A história demográfica das linhagens identificadas com o cyt b foi investigada por
meio da análise Bayesian Skyline Plot (BSP) (Drummond et al., 2005) inplementada no
programa BEAST v2.4.8 (Bouckaert et al., 2014). Essa análise assume que as populações
são panmíticas e utiliza o padrão coalescente inferido para ajustar um modelo demográfico
adequado ao conjunto dos dados de sequência disponível (Drummond et al., 2005), e por isso,
foram realizadas para cada linhagem separadamente. Foi utilizado o relógio molecular estrito
(strict clock) e o tempo foi particionado em seis intervalos em cada estimativa usando o BSP.
A linhagem "Madeira" não apresentou informação suficiente para realizar o BSP, então os
95

modelos Constant Size e Exponential growth foram confrontados usando o método de
comparação de modelos AICM (Baele et al., 2012) no programa Tracer v1.6 (Rambaut et al.,
2013). Para cada corrida do BSP nós utilizamos uma cadeia com 100 milhões de passos, com
árvores sendo gravadas a cada 100 mil passos. A convergência dos parâmetros foi checada no
programa Tracer v1.6 (Rambaut et al., 2013). A fim de converter a unidade do parâmetro τ
para tempo em anos utilizamos a taxa de mutação do mtDNA de crocodilianos de 3,95 x 10⁻⁹
mutações por sítio por ano estimada por Eo & DeWoody (2010).
A distribuição do ancestral comum e sua subsequente expansão por parte da América
do Sul foi inferida usando o método de difusão Bayesiana de árvore de espécies (Nylinder et
al.. 2014) usando o marcador mitocondrial. Primeiramente uma árvore de espécies datada foi
reconstruída no programa STARBEAST v1.8.4 (Drummond et al., 2012) utilizando o tempo
de divergência entre P. palpebrosus e P. trigonatus (média = 9.53 ma; 95% HPD = 7.54–
11.31 ma) como ponto de calibração (Oaks et al., 2011). Posteriormente, nós utilizamos a
distribuição posterior de árvores da árvore de espécies para levar em conta as incertezas da
inferência filogenética e estimamos a difusão espaço-temporal das espécies usando o modelo
de difusão Browniano (Lemey et al., 2010). Nessa análise, foi utilizado um prior coalescente
considerando o tamanho populacional constante e um modelo de Relaxed Random Walk
(RRW) com distribuilção log-normal relaxada, bem como o modelo de substituição TrN+I
indicado pelo jMODELTEST. O tamanho da cadeia foi 10 milhões de passos com posterior
descarte de 10% dos primeiros passos como burn-in. O programa Tracer v1.6 foi utilizado
para checar a convergência dos parâmetros.
A análise de Difusão de Árvores de Espécies requer que sejam fornecidas as
distribuições geográficas das espécies-alvo em forma de polígonos no formato Keyhole
96
Markup Language (KML), os quais foram gerados no Google Earth (http://earth.google.com)
com base na distribuição dos pontos amostrais de nosso estudo (ver Figura 1). O recurso
“timeslice” do programa Spread v1.0 (Bielejec et al., 2011) foi usado para estimar as áreas de
distribuição ancestral, extraindo 80% HPD da distribuição de probabilidade posterior
combinada, e então foi produzido um arquivo KML para ser visualizado no Google Earth.
A área ancestral do complexo P. palpebrosus também foi estimada no pacote
BioGeoBEARS (Matzke, 2014) do programa R (R Development Core Team 2011). Além de
inferir a área ancestral, essa análise permite investigar se a diversificação das linhagens se deu
por vicariância, dispersão ou evento fundador. Para isso, foram consideradas cinco possíveis
áreas ancestrais: Escudo das Guianas (Egui), Planície Amazônica (PAm), Sul da Amazônia
(SAm), Cerrado (Cer) e Pantanal (Pant) (Figura 6). O número máximo de áreas ancestrais foi
estabelecido como sendo igual ao número total de áreas definidas, cinco.
Análise dos dados genômicos
Na tentativa de resolver as relações filogenéticas entre as linhagens, os dados
genômicos foram utilizados para reconstruir árvores de espécies aplicando dois métodos: o
Multispecies Species Coalescent (MSC) implementado no programa STARBEAST2
(Bouckaert et al., 2014) e o método coalescente que se baseia em quartetos de topologia de
árvores gênicas, implementado no programa ASTRAL-III (Zhang et al., 2018).
O STARBEAST2 é capaz de co-estimar a árvore de espécies e as árvores de genes e
leva em consideração as incertezas geradas pelas incompatibilidades entre as árvores de genes
(Heled & Drummond, 2010). No entanto, o programa modela essas incompatibilidades
exclusivamente como Incomplete Lineage Sorting, um efeito direto da retenção de
97
polimorfismo ancestral entre pares de populações, assumindo ausência de fluxo gênico. Essa
análise, porém, se torna inviável para muitos bancos de dados genômicos, devido ao número
de parâmetros a serem estimados e ao grande esforço computacional exigido.
Alternativamente, o programa ASTRAL-III busca pela árvore que compartilha o maior
número de quartetos de topologia com as árvores gênicas de entrada (Zhang et al., 2018)
estimadas previamente usando outro método de reconstrução filogenética. O método
implementado no ASTRAL-III é mais rápido e viável de ser aplicado com dados genômicos
grandes, além de ser baseado em coalescência e também considerar o efeito do ILS (Mirarab
et al., 2014; Zhang et al., 2018).
Para a análise no STARBEAST2, fizemos uma filtragem dos loci com o objetivo de
maximizar a informação filogenética contida em um conjundo de dados reduzido. Então,
inicialmente, filtramos somente os loci que foram amostrados em pelo menos um indivíduo de
cada linhagem e que apresentaram pelo menos um sítio parcimoniosamente informativo (PIS -
sítios que agrupam pelo menos dois indivíduos). Dentre estes, filtramos os loci que
produziram árvores gênicas com suporte maior que 75% em pelo menos um nó, após análise
no RAxML v8.1.1 (Stamatakis, 2014). Ao todo foram retidos 111 loci compondo o dataset 1.
O particionamento ideal do dataset 1 foi estimado no programa PartionFinder v2.1.1 (Lanfear
et al., 2012) e os loci pertencentes a uma mesma partição tiveram seus modelos de evolução
molecular ligados no STARBEAST2. Os indivíduos foram agrupados de acordo com sua
distribuição nas quatro linhagens predefininas ("Amazonas", "Madeira, "Bolívia" e
"Pantanal").
A estratégia utilizando o dataset 1 não permitiu resolver as relações filogenéticas entre
"Madeira", "Bolívia" e "Pantanal" (ver resultados). Então, adotamos uma estratégia
98

complementar, na qual subdividimos os indivíduos das linhagens "Madeira" e "Bolívia" em
dois grupos cada, de acordo com a proximidade geográfica entre eles, produzindo um total de
seis grupos ao invés de quatro (ver Figura 6). Em seguida nós filtramos os loci que foram
amostrados em pelo menos um indivíduo de cada grupo e que apresentaram pelo menos um
PIS para grupos (sítios que unem pelo menos dois grupos), totalizando 334 loci. Após essa
filtragem, nós estimamos o particionamento ideal de modelos evolutivos no PartitionFinder
v2.1.1 (Lanfear et al., 2012) e concatenamos os loci que apresentaram topologias iguais
(estimadas com o RAxML) dentro de uma mesma partição, reduzindo o conjunto de dados
para 135 sequências concatenadas que compõem o dataset 2.
Para todas as corridas no programa STARBEAST2 foram aplicados o modelo de
especiação de Yule como Tree prior e o relógio molecular estrito (Strict clock) para todos os
loci. As corridas foram realizadas na plataforma CIPRES (Miller et al., 2010;
http://www.phylo.org/index.php) utilizando 2 bilhões de passos e árvores sendo gravadas a
cada 100 mil passos, resultando em uma posterior de 20.000 árvores. A convergência dos
parâmetros foi checada no programa Tracer v1.6 para ter certeza de que os Effective Sample
Sizes (ESS) foram > 200 (Rambaut et al., 2013). A árvore de máxima credibilidade dos clados
foi sumarizada a partir do conjunto de árvores posteriores usando o TreeAnnotator v1.8.0
(Drummond & Rambaut, 2007) e editada no FigTree v1.4.2.
Para análise no ASTRAL-III foi utilizado o dataset 3, que possui o maior número de
loci (989 loci), uma vez que foram retidos os loci que estavam presente em pelo menos um
indivíduo de cada linhagem. As árvores gênicas para cada locus foram reconstruídas
separadamente no programa RAxML v8.1.1 (Stamatakis, 2014), sendo que a árvore de
máxima verossimilhança para cada locus foi escolhida dentre 20 geradas e o número de
99
bootstraps foi determinado por autoMRE. O suporte da árvore de espécies do ASTRAL-III foi
avaliado anotando-se a filogenia com as probabilidades posteriores.
A causa do baixo suporte de nós encontrados na árvore de espécies do ASTRAL-III foi
investigada usando-se o programa Quartet Sampling (Pease et al., 2018) a partir da matriz
concatenada dos dados. Esse programa utiliza métricas de suporte baseada em quartetos para
descrever se o suporte dos nós está sendo influenciado por terminais com posição incerta
(rogue taxa), por falta de informação ou por informações conflitantes (Pease et al., 2018).
Uma vez que os métodos que estimam árvore de espécies assumem ausência de fluxo
gênico, nós utilizamos o Generalized Phylogenetic Coalescent Sampler, G-PhoCS v1.2.3
(Gronau et al., 2011) para investigar a ocorrência de hibridização entre as linhagens atuais
e/ou ancestrais. Esse programa também foi utilizado para estimar parâmetros demográficos
populacionais, como: tamanho efetivo populacional (θ), taxas de migrações (m) e tempos de
divergência (τ), para quatro linhagens do complexo P. palpebrosus investigadas com os dados
genômicos. O fluxo gênico foi modelado usando diferentes bandas de migração, que são
equivalentes a taxas de migração constantes entre duas linhagens ao longo de todo o período
de coexistência delas. A presença de fluxo gênico pode afetar diretamente a estimativa desses
parâmetros, por isso, espera-se que análises que consideram isolamento com migração
forneçam estimativas mais próximas do real. Além disso, o G-PhoCS possibilita integrar todas
as possíveis fases dos dados diploides, eliminando a necessidade de esforço computacional
prévio para inferir haplótipos (Gronou et al., 2011), que é uma potencial fonte de erro
(Garrick et al., 2010).
Para tornar as corridas computacionalmente possíveis nós reduzimos o número de
indivíduos, selecionando seis representantes das quatro linhagens, sendo: um indivíduo de
100

"Amazônia" (CTGAH_0884), um de "Pantanal" (CTGAH_1741), dois indivíduos de
"Madeira" (CTGAH_2173 e CTGAH_2145) e dois de "Bolívia" (CTGAH_2310 e
CTGAH_2427). "Madeira" e "Bolívia" apresentam indícios de introgressão do genoma (ver
resultados) e por isso selecionamos mais indivíduos destas linhagens. Em seguida, foram
testadas cinco topologias possíveis e, para cada uma delas, foram gerados modelos de
migração de modo a testar todas as combinações de bandas de migração possíveis entre
linhagens adjacentes (Figura 2). Então, nós comparamos os 224 modelos avaliados no G-
PhoCS utilizando o critério de AICM (Baele et al., 2012) e escolhemos os modelos mais
prováveis. Por fim, nós estimamos os parâmetros demográficos com base na topologia e
modelo de migração mais ajustados utilizando todos os cinco indivíduos de cada linhagem.
Os priors das distribuições de probabilidade para todos os modelos testados foram
modelados com distribuição gamma. Para τ e θ nós usamos um α = 1, β = 10.000 (exceto para
os θ ancestrais, onde usamos β = 20.000) e para m nós usamos α = 0.002, β = 0.00001. Todos
os "finetune parameters" foram ativados no modo automático. Para cada modelo testado nas
análises com seis indivíduos, foram feitas 10 réplicas contendo 100 mil passos cada. Os
primeiros 10 mil passos de cada réplica foram descartados como burn in e então as corridas
foram combinadas. Para as análises com todos os 20 indivíduos foram feitas 3 réplicas
contendo 2 milhões de passos cada. Os primeiros 200 mil passos de cada réplica foram
descartados como burn in e então as corridas foram combinadas. O programa Tracer v1.6 foi
usado pra checar a convergência dos parâmetros.
De acordo com o sugerido por Gronou et al. (2011), aplicamos a equação θ = 4Neμ
para estimar o tamanho efetivo populacional em número de indivíduos diploides (N). Também
foi utilizada a equação τ = Tμ/g para converter o τ em tempo de divergência em anos T, sendo
101

g o tempo de geração médio da espécie, que assumimos como sendo 20 anos. Para isso, foi
considerada a taxa de mutação neutra para crocodilianos de μ = 7,9 x 10⁻⁹
substituições/sítio/geração, estimada a partir da divergência entre o genoma completo de
Alligator mississipienssis e de Crocodylus porosus (Green et al., 2014). Para converter as
taxas de migração m em taxa de migração por geração nós usamos a equação Msx = msxθx/4.
RESULTADOS
Estruturação genética e demografia histórica com o gene cyt b
A análise de estrutura populacional realizada no BAPS indicou que o valor de K = 5
foi o mais provável. Com isso foi detectado uma nova linhagem no bioma Cerrado e no bioma
Caatinga, no Escudo Brasileiro (Figura 1). Além disso, podemos constatar que a linhagem
previamente detectada nas cabeceiras do Rio Paraguai não estão restritas a essa região, e se
estendem por toda a bacia do Rio Paraná (a leste) e cabeceiras dos Rios Teles Pires e Juruena,
formadores do Rio Tapajós.
A rede de haplótipos indica que a recém-descoberta linhagem "Cerrado" tem uma
proximidade genealógica com a linhagem "Pantanal" (Figura 3), embora um indivíduo
amostrado na bacia do Rio Juruena apresente haplótipo mais relacionado aos da linhagem
"Bolívia". Em virtude de haver pelo menos 16 passos mutacionais separando
"Pantanal+Cerrado" de "Bolívia+Madeira" podemos inferir que esse indivíduo é descendente
de ummigrante entre as bacias do Rio Guaporé e Juruena. Também é possível observar que
somente nas bacias do Alto Rio Xingu e Alto Rio Araguaia ocorrem indivíduos de ambos os
grupos "Pantanal" e "Cerrado", com predominância de indivíduos de "Cerrado", sendo essa
uma possível zona de contato entre as linhagens.
102

O alinhamento das sequências de cyt b (1097 pb) no programa Geneious e a tradução
dos códons em aminoácidos permitiu verificar que o último dos sítios diagnósticos da
linhagem "Amazônia", identificado na Population Agregation Analisys (PAA) realizada no
capítulo 1, produziu um códon de parada prematuro. Com isso, o cyt b de todos os indivíduos
da linhagem "Amazônia" apresentam dois aminoácidos a menos que as demais linhagens, o
que caracteriza uma autopoapomorfia dessa linhagem.
As reconstruções demográficas estimadas com Bayesian Skyline Plot usando o gene
cyt b não detectaram variação significativa no tamanho populacional recente de nenhuma das
linhagens do complexo P. palpebrosus ao longo dos últimos 200 mil anos (Figura 4 A-E).
As relações filogenéticas entre as linhagens, suas áreas ancestrais e posterior difusão
pelas principais bacias hidrográficas na América do Sul são mostradas na Figura 5 A-D. A
estimativa da área de distribuição ancestral usando a análise de Difusão de Árvores de
Espécies indicou que o ancestral de P. palpebrosus seria amplamente distribuído no sul da
Amazônia e em boa parte do Escudo Brasileiro (Figura 5A). A primeira diversificação dentro
do complexo teria ocorrido entre a "Amazônia" e as demais linhagens, quando houve uma
expansão da distribuição no sentido norte e sul da bacia Amazônica (Figura 5B). Em seguida
a linhagem do Escudo Brasileiro teria se diversificado no ancestral de "Madeira-Bolívia" e no
ancestral de "Pantanal-Cerrado" (Figura 5C), quando se expandiu para o sul do Escudo
Brasileiro, em direção à bacia do Alto Paraguai. Por fim, o Pantanal e a região leste do Escudo
Brasileiro foram colonizados e "Bolívia" e "Madeira" se diversificaram (Figura 5D).
A reconstrução da área ancestral usando o BioGeoBEARS sugeriu que o modelo
DIVALIKE melhor se ajusta aos dados de cyt b de Paleosuchus (Tabela 2). O DIVALIKE
indicou que o ancestral do complexo P. palpebrosus foi amplamente distribuído, semelhante
103

ao encontrado com a análise de Difusão de Árvores de Espécies, mas com a pequena
diferença de que esse ancestral já estaria distribuído no norte da Amazônia (Figura 6). Os
eventos de diversificação teriam ocorrido por alopatria, com exceção da linhagem "Pantanal"
que teria sido colonizada recentemente por dispersão de indivíduos provenientes do Escudo
Brasileiro (Figura 6). Adicionalmente foi possível inferir a origem de P. trigonatus no Escudo
das Guianas. O ancestral teria se expandido por toda bacia Amazônica e posteriormente
sofrido diversificação por alopatria entre o Escudo das Guianas e o resto da Amazônia (Figura
6).
Filogenômica e hibridização no complexo P. palpebrosus
A árvore de espécies reconstruída no STARBEAST2 com o dataset 1 (Figura 7)
recuperou com alto suporte a relação da linhagem "Amazônia" como grupo irmão de
"Madeira+Bolívia+Pantanal", em concordância com a topologia do cyt b. Não foi possível
definir , porém, se "Bolívia" é grupo irmão de "Madeira" ou de "Pantanal" (Figura 7). As
topologias alternativas são expressas em forma de árvore de densidade com diferentes cores,
azul e vermelho, e foram igualmente prováveis (Figura 7). Em seguida nós adotamos uma
estratégia complementar utilizando o dataset 2 e recuperamos uma topologia bem suportada,
com "Madeira" sendo grupo irmão de "Bolívia+Pantanal". A linhagem "Bolívia" foi
parafilética em relação a "Pantanal" (Figura 7).
A árvore de espécies estimada com o programa ASTRAL-III apresentou nós pouco
suportados e relações filogenéticas entre os grupos não muito bem definidas. "Amazônia" e
"Pantanal" foram monofiléticos e bem suportados, enquanto "Bolívia" foi monofilético, mas
com baixo suporte no nó basal (pp = 0,64), sendo grupo irmão de "Pantanal" (pp = 0,92)
104

(Figura 8). Os indivíduos do "Madeira", no entanto, estão distribuídos pela árvore com
valores de baixo suporte, de modo que provavelmente estariam diminuindo o suporte dos
ramos adjacentes. Então, nós investigamos a causa do baixo suporte de alguns nós cruciais
usando o Quartet Sampling (Figura S2). É importante ressaltar que nenhum dos nós foram
pouco suportados devido à falta de informação, com valores de QI altos (quarteto de
informatividade). No entanto, encontramos um indivíduo da linhagem "Madeira"
(CTGAH_2145) com valor de QF (quarteto de fidelidade) substancialmente menor que os
demais (Figura S2), podendo ser um provável "rogue taxa". Avaliando o suporte do nó que
agrupa "Pantanal" e "Bolívia" identificamos baixo valor de QC (0,24, quarteto de
concordância) e alto valor de QD (0,71, quarteto diferencial) indicando baixo suporte por
conflito de informação e que existe uma topologia concorrente àquela apresentada.
A hibridização entre as linhagens atuais e/ou ancestrais pode ter sido a causa das
incertezas encontradas nas relações filogenéticas. Então, nós investigamos 224 hipóteses de
demografia histórica no programa G-PhoCS e escolhemos o melhor modelo utilizando o
critério de AICM. Os dois melhores modelos de migração (ΔAICM < 2) pertencem às
topologias A (Modelo 1) e B (Modelo 2) e contam histórias alternativas (Figura 9). Na
topologia A, "Amazônia" é grupo irmão de "Madeira+Bolívia+Pantanal". De acordo com o
modelo 1 houve hibridização persistente entre "Amazônia" e as linhagens adjacentes em três
bandas de migração diferentes, além de ter ocorrido fluxo gênico pós-divergência entre
"Madeira" e "Bolívia" (Figura 9). Na topologia B, "Pantanal" é grupo irmão de
"Amazonia+Madeira+Bolívia". De acordo com o modelo 2 a hibridização persistente ocorreu
entre "Pantanal" e as linhagens adjacentes também em três bandas de migração (Figura 9),
mas sem fluxo gênico entre "Madeira" e "Bolívia".
105

Os parâmetros demográficos: tamanho efetivo populacional (Ne), tempo de
divergência (T) e taxa de migração (m); foram estimados para os dois melhores modelos
utilizando todos os 20 indivíduos de P. palpebrosus, e os resultados são mostrados na Tabela
3. Destacamos a ocorrência de taxas de migração assimétricas, com algumas bandas de
migração contendo menos que um migrante por geração.
DISCUSSÃO
Estudos prévios demonstraram que Paleosuchus palpebrosus, uma espécie com ampla
distribuição em grande parte da América do Sul, é na verdade, um complexo de espécies que
deveria ser melhor investigado (Muniz et al., 2018; Muniz et al., in prep, cap. 2 da tese). Nós
ampliamos a amostragem realizada nos estudos anteriores e descobrimos a existência de uma
linhagem evolutiva. Essa linhagem está distribuída em boa parte do Escudo Brasileiro,
ocupando principalmente o bioma Cerrado e as bacias hidrográficas do Rio São Francisco,
Rio Parnaíba e drenagens adjacentes que deságuam no Atlântico, bacia dos Rios Tocantins-
Araguaia e cabeceiras do Rio Xingu.
Um resultado relevante envolvendo o gene cyt b foi a constatação de que a linhagem
"Amazônia" (ver capítulo 1) apresenta um códon de parada prematuro que elimina dois
aminoácidos que estão presentes nas demais linhagens do complexo. O cyt b é um gene
codificador de uma proteína que participa na cadeia transportadora de elétrons da
mitocôndria. Uma mutação que resulta na perda de aminoácidos em uma proteína e cuja
frequência foi fixada em toda a população com tamanho efetivo populacional grande (>
350.000, Muniz et al., 2018), indica a atuação de forças seletivas por um período prolongado
e reforça ainda mais que a linhagem "Amazônia" é uma espécie diferente das demais
106

linhagens do complexo P. palpebrosus. Roos et al. (2007) identificou que três genes
mitocondriais ( NADH4, NADH5 e Cyt b) de P. palpebrosus são menores que os de P.
trigonatus devido a ocorrência de um códon de parada prematuro. No entanto, essa
comparação foi feita com um indivíduo da linhagem "Amazônia", e pelo menos para o gene
cyt b, não há diferenças nos tamanhos do gene de P. trigonatus em relação às demais
linhagens ("Madeira", "Bolívia", "Pantanal" e "Cerrado") do complexo P. palpebrosus.
Muniz et al. (2018) sugeriram que é importante avaliar se a linhagem "Pantanal"
ocorre em outras bacias além da bacia do alto Paraguai, pois caso contrário, isso teria
importantes implicações para a conservação dessa linhagem, uma vez que ela estaria restrita à
uma área sob forte impacto antropogênico. Neste trabalho, foi possível detectar que a
linhagem "Pantanal" não está restrita à bacia do alto Paraguai, ocupando também a bacia do
Rio Paraná, à leste, e as cabeceiras dos rios Juruena e Teles Pires, ao norte (Figura 1). Assim,
essa linhagem inspira menor preocupação do ponto de vista da conservação do que se
imaginava.
Algumas localidades nas cabeceiras do Rio Xingu e nas cabeceiras do Rio Araguaia
apresentaram haplótipos provenientes de ambas linhagens, "Pantanal" e "Cerrado", embora
haja predominância de haplótipos pertencentes ao grupo "Cerrado" (Figura 1). A rede de
haplótipos do cyt b sugere uma relação genealógica próxima de "Pantanal" e "Cerrado" e o
compartilhamento de haplótipos entre bacias pode estar se mantendo simplesmente por
retenção de polimorfismo ancestral, ou alternativamente, indicar a existência de uma zona de
contato entre elas.
De fato, é provável que eventos de capturas de cabeceiras tenham sido cruciais para
entender a diversificação entre "Pantanal" e "Cerrado". Existe uma relação estreita entre a
107

fauna aquática da bacia do Alto Paraguai e as cabeceiras dos rios amazônicos que nascem no
Escudo Brasileiro (Hubert & Renno, 2006; Carvalho & Alberts, 2011). A presença de espécies
de peixes compartilhadas indica que esta é uma importante rota de dispersão entre essas
bacias (Carvalho & Alberts, 2011). O evento de compressão do cinturão Andino no final do
Plioceno (~2,5 Ma) deu origem à atual bacia do Pantanal (Assine, 2004). Este evento teria
promovido capturas de cabeceiras pela bacia do alto Paraguai tanto de Bolívia quanto de
alguns tributários do alto Paraná e alto Tocantins-Araguaia (Menezes et al., 2008). Mesmo
eventos de capturas mais recentes podem ter ocorrido, estabelecendo novos limites entre as
bacias Amazônica e alto Paraguai (Wilkinson et al., 2006).
Reconstrução das áreas ancestrais e rota de dispersão
As reconstruções biogeográficas de espécies que são continuamente distribuídas
através da paisagem são difíceis, pois requerem o particionamento das espécies em áreas
geograficamente discretas (Ronquist & Sanmartín, 2011). O método de difusão Bayesiana de
árvores de espécies tem a vantagem de não precisar de áreas discretas pré-definidas para fazer
uma inferência da área ancestral (Nylinder et al., 2014), porém não possibilita inferir de
maneira explícita a causa da diversificação das espécies (vicariância, dispersão ou evento
fundador) como no BioGeoBEARS (Matzke, 2014). Desse modo, ambos os métodos de
reconstrução espaço-temporal podem ser utilizados de forma complementar para montar um
cenário biogeográfico mais completo.
Ambas as análises reconstruíram uma área ancestral ampla para P. palpebrosus,
porém o BioGeoBEARS estimou que o ancestral de P. palpebrosus ocorreu no norte da
Amazônia enquanto a Difusão de Árvores de Espécies estimou uma distribuição que não
108
inclui essa região. Apesar dessa diferença, os métodos de reconstrução ancestral concordam
em relação aos eventos de diversificação alopátrica subsequentes e que a linhagem "Pantanal"
se formou recentemente a partir de um evento fundador da linhagem ancestral que ocupava o
Escudo Brasileiro.
De um modo geral, nossas reconstruções espaço-temporais não contradizem o modelo
biogeográfico proposto no capítulo 2, e ainda fornecem informações adicionais que
contribuem para desvendar a rota de dispersão das linhagens. Em ambos os modelos a
linhagem ancestral de P. palpebrosus teria ocupado o sul da Amazônia e o Escudo Brasileiro
antes de colonizar a bacia do alto Paraguai, evidenciando uma rota de dispersão que precisa
ser melhor investigada. Outra consequência disso é que no intervalo de tempo em que a sub-
bacia Boliviana endorreica teria se formado (ver capítulo 2) P. palpebrosus ainda não havia
colonizado a bacia do alto Paraguai. Portanto, ainda que tenham ocorrido eventos de capturas
de cabeceiras entre a subbacia Boliviana e a bacia do alto Paraguai, isso não resultou em fluxo
gênico ancestral entre as linhagens.
É importante ressaltar que a nossas reconstruções espaço-temporais foram feitas com
dados mitocondriais, e que uma amostragem genômica que inclua a linhagem "Cerrado" pode
ajudar a esclarecer melhor a rota de dispersão das linhagens do complexo.
Filogenômica de P. palpebrosus
As árvores de espécie reconstruídas com os dados genômicos no STARBEAST2
recuperaram a linhagem "Amazônia" como grupo irmão das demais linhagens do complexo P.
palpebrosus, suportando a hipótese de diversificação norte-sul na bacia Amazônica. As
relações filogenéticas entre "Pantanal", "Madeira" e "Bolivia", foram resolvidas com a
109

utilização do dataset 2, com "Madeira" sendo grupo irmão de "Bolívia+Pantanal".
A árvore de espécies do ASTRAL-III também não foi capaz de resolver as relações
filogenéticas entre essas três linhagens, mas permitiu observar que alguns indivíduos da
linhagem "Madeira" possuem posição incerta na árvore filogenética. As incertezas nas
relações filogenéticas podem ter sido geradas por (1) informação insuficiente, (2)
diversificação rápida das linhagens e consequente Incomplete Lineage Sorting, (3) ou fluxo
gênico pós-divergência (hibridização). Após descartar que as incertezas nas relações
filogenéticas foram causadas pela presença de "rogue taxa" ou por falta de informação, nós
investigamos modelos de divergência com migração no programa G-PhoCS e detectamos que
os melhores modelos suportam hibridização entre linhagens.
Para cada banda de migração foram estimadas as taxas de migração em ambas os
sentidos. Desse modo, observamos um fluxo gênico assimétrico, geralmente no sentido de
"Madeira+Bolívia". O número de migrantes, para algumas bandas de migração, foram
menores que um indivíduo por geração (ver Tabela 3), ou seja, uma taxa de migração baixa
para marcadores neutros (Felseinstein, 1976) em comparação com os efeitos da deriva
genética. Com isso, é provável que tenha ocorrido uma introgressão persistente de genes de
"Amazônia" (topologia A) ou "Pantanal" (topologia B) em "Madeira+Bolívia". Em ambos os
cenários, as relações filogenéticas da árvore de espécies seriam impactadas pela introgressão
recorrente, produzindo histórias conflitantes que diminuem o suporte dos ramos.
Os melhores modelos de migração foram complementares, pois sustentam
introgressão persistente de "Amazônia" ou "Pantanal" para as linhagens adjacentes. Embora
as topologias alternativas sejam igualmente prováveis nas comparações utilizando o critério
de AICM, nós podemos afirmar que a topologia A (ver Figura 9) é mais coerente, devido sua
110

congruência com os resultados genômicos encontrados no STARBEAST2 e ASTRAL-III
(Figuras 7 e 8) e com as relações filogenéticas encontradas utilizando o marcador
mitocondrial (Figura S1), que é livre do efeito da hibridização (Brown et al., 1982; Meyer,
1993). Adicionalmente, a migração persistente entre "Amazônia" e as linhagens adjacentes,
sobretudo entre "Amazônia" e o ancestral de "Madeira+Bolívia" (ver Tabela 3) favorece o
modelo 2 e pode ter contribuído para que esse modelo tenha sido sugerido como história
alternativa igualmente provável.
Não obstante essa hipótese ser uma explicação plausível para a diversificação de P.
palpebrosus e compatível com o modelo biogeográfico proposto no capítulo 2, existe uma
hipótese alternativa ainda não avaliada, de que a linhagem "Madeira" teria surgido como
produto da hibridização entre "Amazônia" e "Bolívia". Essa hipótese é complexa e não pôde
ser avaliada com as ferramentas analíticas utilizadas nesse trabalho. Entretando, essas
hipóteses alternativas devem ser testadas de maneira mais apropriada em um estudo futuro.
Este estudo fornece contribuições importantes para entender a biogeografia e a
dinâmica evolutiva do complexo de espécies P. palpebrosus. Algumas perguntas permanecem
não respondidas, como: quantas e quais espécies são válidas no complexo de espécies P.
palpebrosus? Para investigá-las com maior confiabilidade, no entanto, sabemos que será
necessário utilizar métodos analíticos capazes de diferenciar o efeito do Incomplete Lineage
Sorting e da hibridização.
111

Tabela 1. Sumarização das filtragens realizadas com o banco de dados genômicos. Para cada
dataset são mostrados: a presença e ausência dos critérios de cada filtragem, incluindo os
Sítios Parcimoniosamente Informativos (PIS), o número de indivíduos analisados, o número
de loci retidos e a análise em que cada dataset foi utilizado. O símbolo (+) indica que a
filtragem foi aplicada para o dataset e o símbolo (-) indica que a filtragem não foi aplicada.
Filtragem deloci
Ao menos1 indiv.
porlinhagem
Aomenosum PIS
Ao menos1 nó bemsuportado(> 75%)
Particionamento por
modeloevolutivo
Particionamento portopologia
No
Indiv.No loci ANÁLISE
PyRAD - - - - - 25 1.248 -
Dataset 1 + + + - - 20 111 STARBEAST2
Dataset 2 + + - + + 20 334 STARBEAST2
Dataset 3 + - - - - 25 989 ASTRAL-III
Dataset 4 + + - - - 6 95 G-PhoCS
112

Tabela 2. Comparação entre os valores de log Likelihood para cada modelo do
BioGeoBEARS (Matzke, 2013) estimados com base nos dados de cyt b. As linhagens foram
assinaladas a cinco possíveis áreas ancestrais (ver Figura 6). Foram testados seis modelos,
cuja acurácia foram assessadas usando o Akaike Information Criterion (AIC). Note que o
modelo DIVALIKE possue o menor valor de AIC e por isso foi escolhido como o modelo
mais ajustado aos dados.
Modelo log likelihood dispersão (d) extinção (e) Evento fundador (j) AIC
DEC -16,07 0,21 0,19 0,00 39,15
DEC+J -16,06 0,21 0,19 0,01 46,13
DIVALIKE -14,05 0,17 0,14 0,00 35,10
DIVALIKE+J -14,05 0,18 0,14 0,00 42,10
BAYAREALIKE -26,62 0,42 0,65 0,00 60,25
BAYAREALIKE+J -18,68 0,09 0,18 0,21 51,37
113

Tabela 3. Parâmetros demográficos estimados com base nos melhores modelos de migração
estimados no program G-PhoCS (Gronau et al., 2011). Os modelos e topologias
correspondem aos apresentados na figura 9. As linhagens foram codificadas em letras:
"Amazônia" (A), "Madeira" (M), "Bolívia" (B) e "Pantanal" (P); e os nós ancestrais foram
codificados com a combinação dessas letras (ex. MB = ancestral de "Madeira" e "Bolívia").
Os valores médios estimados para o tamanho efetivo populacional (Ne em mil indivíduos) e
para o tempo de divergência (T em milhões de anos) são mostrados para os modelos 1 e 2.
Dentro de parênteses são mostrados os valores mínimos e máximos de cada estimativa. Para
cada banda de migração foram estimadas as Taxas de Migração (M; número médio de
indivíduos migrantes por geração) em ambos os sentidos e as setas indicam a direção do fluxo
gênico.
Modelo 1/Topologia A
Ne mil indiv.(95% HDP)
T Ma (95% HDP)
Bandas demigração
M
indiv/geração
Amaz (A) 11,2 (0,0-30,0) - A→M 1,74
Bol (B) 9,6 (0,0-26,8) - M→A 0,67
Mad (M) 8,6 (0,0-24,6) - M→B 0,28
Pan (P) 10,5 (0,0-28,6) - B→M 0,28
BM 118,3 (2,1-281,7) 2,9 (0,54-5,66) A→BM 96,8
BMP 121,7 (2,6-291,2) 3,2 (0,87-6,06) BM→A 9,46
Raíz 3,0E3 (2,4E3-3,6E3) 3,9 (1,26-6,89) A→BMP 41,01
BMP→A 9,36
Modelo 2/Topologia B
Ne mil indiv.(95% HDP)
T Ma (95% HDP)
Bandas demigração
M
indiv/geração
Amaz (A) 11,0 (2,3-21,3) - B→P 0,95
Bol (B) 28,4 (5,1-57,5) - P→B 1,69
Mad (M) 32,5 (5,6-64,2) - BM→P 0,14
Pan (P) 4,7 (0,0-13,7) - P→BM 4,69
BM 145,4 (3,8-327,3) 1,0 (0,20-2,06) P→ABM 147,23
ABM 179,8 (8,1-432,6) 1,5 (0,38-2,76) ABM→P 4,01
Raíz 4,2E3 (3,7E3-4,8E3) 2,2 (0,62-4,41)
114

Figura 1. Distribuição geográfica das localidades amostradas, incluindo a amostragem
feita por Muniz et al. (2018), e gráfico do BAPS mostrando o valor de K mais provável,
K = 5. Os pontos amostrais são coloridos conforme o resultado no BAPS e os círculos
com duas cores indicam as localidades onde foram encontrados indivíduos atribuídos à
grupos diferentes. A correspondência entre as cores e os grupos populacionais são
mostrados no canto superior direito.
115

Figura 2. Parâmetros estimados e modelos de isolamento com migração testados usando o
programa G-PhoCS (Gronau et al., 2011). As linhagens do complexo P. palpebrosus estão
como terminais da árvore e os ancestrais estão indicados nos nós (ancMB = ancestral de
"Madeira" e "Bolívia"; ancMBP = ancestral de "Madeira+Bolívia" e "Pantanal"). Parâmetros
dos modelos demográficos incluem tamanho efetivo populacional (θ) para todos os ramos na
árvore, tempos de divergência (τ) para todos os nós internos e taxas de migração (m) para
todas as bandas de migração avaliadas. Foram testadas cinco topologias (A-E) e, para cada
uma delas, todas as combinações possíveis de bandas de migração entre linhagens adjacentes.
As bandas de migração foram bidirecionais e pra cada topologia o modelo sem fluxo gênico
também foi testado.
116

Figura 3. Rede de haplótipos mostrando a relação genealógica entre as linhagens de
Paleosuchus palpebrosus. As cores correspondem aos grupos detectados na análise do BAPS
(mostrados na Figura 1). Os quadrados representam as bacias amostradas e aqueles com duas
cores correspondem às bacias que continham indivíduos com haplótipos de mais de um grupo.
Alguns rios importantes não foram citados na legenda, pois a ênfase foi dada à amostragem
inédita realizada no Escudo Brasileiro.
117

Figura 4. Demografia histórica de cada uma das linhagens do complexo P. palpebrosus
estimada com base em sequências do gene mitocondrial cyt b. As estimativas foram feitas
com Bayesian Skyline Plots (A, C-E), exceto para "Madeira" (B) cujo modelo de população
constante foi melhor que o exponencial. No eixo Y é expresso o tamanho efetivo populacional
em escala logarítimica e no eixo X o tempo na escala de mil anos, considerando a taxa de
mutação do mtDNA de 3,9 10-9 substituições/sítio/ano (Eo & DeWoody, 2010).
118

Figura 5. Difusão de Árvores de Espécies no gênero Paleosuchus. À esquerda é mostrada a
árvore de espécies contendo quadrados coloridos nos ramos que são correspondentes aos
cenários A-D. Os cenários mostram as áreas estimadas das populações ancestrais (80% HPD -
highest-posterior density) em cinco intervalos de tempo, com cores correspondentes aos
quadrados na árvore de espécies. No quadro (D) são mostradas as distribuições atuais que
foram utilizadas como input para a análise de Difusão de Árvores de Espécies. Essas
distribuições foram delimitadas com base na amostragem deste trabalho. Os mapas foram
feitos no programa QGIS v.2.18.
119

Figura 6. Reconstrução de áreas ancestrais do gênero Paleosuchus realizadas no
BioGeoBEARS (Matzke, 2013). No mapa (à esquerda) são delimitadas as áreas geográficas
utilizadas como referência para a análise, com as letras de A a E sendo associadas a cada uma
das áreas. Uma árvore Bayesiana calibrada com tempo (à direita) foi reconstruída de acordo
com o modelo DIVALIKE, que foi apontado como melhor modelo utilizando o critério de
AIC (ver Tabela 2). As áreas ancestrais são mostradas em cada nó da árvore, sendo possível
discriminar se a diversificação das linhagens se deu por vicariância, dispersão ou evento
fundador.
120

Figura 7. Árvores de espécies reconstruídas no programa STARBEAST2 (Bouckaert et al.,
2014) utilizando dois conjuntos de dados diferentes, o dataset 1 com 111 loci e o dataset 2
com 334 loci (ver tabela 1). Os claudogramas representam a distribuição posterior de árvores
de espécies. A maior densidade de áreas da árvore indica maior concordância topológica e as
cores dos ramos azul e vermelha expressam topologias alternativas. As árvores consenso são
mostradas com linhas mais fortes.
121

Figura 8. Árvore de espécies reconstruída no programa ASTRAL-III (Zhang et al., 2018). As
árvores gênicas de 989 loci obtidos por ddRADseq (dataset 3, ver Tabela 1) foram
reconstruídas separadamente no programa RaxML usando o modelo de evolução nucleotídica
GTR+G e então processadas pelo algorítimo do programa ASTRAL-III. A probabilidade
posterior é indicada nos nós. A árvore de espécies no ASTRAL-III foi enraizada com
Paleosuchus trigonatus e os ramos dos indivíduos pertencentes às espécies candidatas do
complexo P. palpebrosus estão coloridos conforme sua linhagem de origem.
122

Figura 9. Melhores topologias e modelos de migração estimados no programa
G-PhoCS (Gronau et al., 2011) usando o critério de AICM (Baele et al., 2012).
Os parâmetros estimados são apresentados na Tabela 3.
123

REFERÊNCIAS
Abbott, R., Albach, D., Ansell, S., et al. (2013) Hybridization and speciation. Journal of
Evolutionary Biology, 26, 229–246.
Assine, M.L., Mantesso Neto, V., Bartorelli, A., Carneiro, C.D.R., & Brito Neves, B.B. (2004)
A bacia sedimentar do Pantanal Mato-Grossense. Geologia do Continente Sul-
Americano: evolução da obra de Fernando Flávio Marques de Almeida (ed. by V.
Mantesso-Neto, A. Bartorelli, C.D.R. Carneiro, and B.B. Brito-Neves), pp. 61–74. Beca,
São Paulo.
Baele, G., Lemey, P., Bedford, T., Rambaut, A., Suchard, M.A., & Alekseyenko, A. V. (2012)
Improving the accuracy of demographic and molecular clock model comparison while
accommodating phylogenetic uncertainty. Molecular Biology and Evolution, 29, 2157–
2167.
Barbiano, L.A. da, Gompert, Z., Aspbury, A.S., Gabor, C.R., & Nice, C.C. (2013) Population
genomics reveals a possible history of backcrossing and recombination in the
gynogenetic fish Poecilia formosa. Proceedings of the National Academy of Sciences,
110, 13797–13802.
Barrera-Guzmán, A.O., Aleixo, A., Shawkey, M.D., & Weir, J.T. (2018) Hybrid speciation
leads to novel male secondary sexual ornamentation of an Amazonian bird. Proceedings
of the National Academy of Sciences, 115, E218–E225.
Bielejec, F., Rambaut, A., Suchard, M.A., & Lemey, P. (2011) SPREAD: Spatial phylogenetic
reconstruction of evolutionary dynamics. Bioinformatics, 27, 2910–2912.
Bouckaert, R., Heled, J., Kühnert, D., Vaughan, T., Wu, C.H., Xie, D., Suchard, M.A.,
Rambaut, A., & Drummond, A.J. (2014) BEAST 2: A Software Platform for Bayesian
Evolutionary Analysis. PLoS Computational Biology, 10, e1003537.
Brelsford, A., Milá, B., & Irwin, D.E. (2011) Hybrid origin of Audubon’s warbler. Molecular
Ecology, 20, 2380–2389.
Brown, W.M., Prager, E.M., Wang, A., & Wilson, A.C. (1982) Mitochondrial DNA sequences
of primates: Tempo and mode of evolution. Journal of Molecular Evolution, 18, 225–
239.
Butlin, R.K. & Ritchie, M.G. (2009) Genetics of speciation. Heredity, 102, 1–3.
Carvalho, T.P. & Albert, J.S. (2011) The Amazon-Paraguay Divide. Historical Biogeography
of Neotropical Freshwater Fishes (ed. by J.S. Albert and R.E. Reis), pp. 192–202.
University of California Press, Los Angeles.
124

Corander, J., Marttinen, P., Sirén, J., & Tang, J. (2008) Enhanced Bayesian modelling in
BAPS software for learning genetic structures of populations. BMC Bioinformatics, 9, .
Darriba, D., Taboada, G.L., Doallo, R., & Posada, D. (2012) JModelTest 2: More models, new
heuristics and parallel computing. Nature Methods, 9, 772.
Doyle, J.J. & Doyle, J.L. (1987) A rapid DNA isolation procedure for small quantities of fresh
leaf tissue. Phytochem Bull Bot Soc Am, 19, 11–15.
Drummond, A.J., Ashton, B., Buxton, S., Cheung, M., Cooper, A., Duran, C., Field, M.,
Heled, J., Kearse, M., Markowitz, S., Moir, R., Stones-Havas, S., Sturrock, S., Thierer,
T., & Wilson, A.C. (2014) Geneious v6.1.8. .
Drummond, A.J. & Rambaut, A. (2007) BEAST: Bayesian evolutionary analysis by sampling
trees. BMC evolutionary biology, 7, 214.
Drummond, A.J., Rambaut, A., Shapiro, B., & Pybus, O.G. (2005) Bayesian coalescent
inference of past population dynamics from molecular sequences. Molecular Biology
and Evolution, 22, 1185–1192.
Drummond, A.J., Suchard, M. a, Xie, D., & Rambaut, A. (2012) Bayesian phylogenetics with
BEAUti and the BEAST 1.7. Molecular biology and evolution, 29, 1969–73.
Eaton, D.A.R. (2014) PyRAD: Assembly of de novo RADseq loci for phylogenetic analyses.
Bioinformatics, 30, 1844–1849.
Edwards, S. V., Potter, S., Schmitt, C.J., Bragg, J.G., & Moritz, C. (2016) Reticulation,
divergence, and the phylogeography–phylogenetics continuum. Proceedings of the
National Academy of Sciences, 113, 8025–8032.
Eo, S.H. & DeWoody, J.A. (2010) Evolutionary rates of mitochondrial genomes correspond to
diversification rates and to contemporary species richness in birds and reptiles.
Proceedings of the Royal Society B: Biological Sciences, 277, 3587–3592.
Felsenstein, J. (1976) The theoretical population genetics of variable selection and migration.
Annual Review of Genetics, 10, 253–280.
Garrick, R.C., Sunnucks, P., & Dyer, R.J. (2010) Nuclear gene phylogeography using
PHASE: Dealing with unresolved genotypes, lost alleles, and systematic bias in
parameter estimation. BMC Evolutionary Biology, 10, 118.
Gottscho, A.D., Wood, D.A., Vandergast, A.G., Lemos-Espinal, J., Gatesy, J., & Reeder, T.W.
(2017) Lineage diversification of fringe-toed lizards (Phrynosomatidae: Uma notata
complex) in the Colorado Desert: Delimiting species in the presence of gene flow.
Molecular Phylogenetics and Evolution, 106, 103–117.
125

Green, R.E., Braun, E.L., Armstrong, J., et al. (2014) Three crocodilian genomes reveal
ancestral patterns of evolution among archosaurs. Science, 346,
10.1126/science.1254449.
Hedrick, P.W. (2013) Adaptive introgression in animals: Examples and comparison to new
mutation and standing variation as sources of adaptive variation. Molecular Ecology, 22,
4606–4618.
Heled, J. & Drummond, A.J. (2010) Bayesian Inference of Species Trees from Multilocus
Data. Molecular Biology and Evolution, 27, 570–580.
Hermansen, J.S., Sæther, S.A., Elgvin, T.O., Borge, T., Hjelle, E., & Sætre, G.P. (2011)
Hybrid speciation in sparrows I: Phenotypic intermediacy, genetic admixture and barriers
to gene flow. Molecular Ecology, 20, 3812–3822.
Hrbek, T., Vasconcelos, W.R., Rebêlo, G.H., & Farias, I.P. (2008) Phylogenetic relationships
of South American alligatorids and the Caiman of Madeira River. Journal of
Experimental Zoology, 309A, 588–599.
Hubert, N. & Renno, J.-F. (2006) Historical biogeography of South American freshwater
fishes. Journal of Biogeography, 33, 1414–1436.
Keller, I., Wagner, C.E., Greuter, L., Mwaiko, S., Selz, O.M., Sivasundar, A., Wittwer, S., &
Seehausen, O. (2013) Population genomic signatures of divergent adaptation, gene flow
and hybrid speciation in the rapid radiation of Lake Victoria cichlid fishes. Molecular
Ecology, 22, 2848–2863.
Lanfear, R., Calcott, B., Ho, S.Y.W., & Guindon, S. (2012) PartitionFinder: Combined
selection of partitioning schemes and substitution models for phylogenetic analyses.
Molecular Biology and Evolution, 29, 1695–1701.
Lavretsky, P., Engilis, A., Eadie, J.M., & Peters, J.L. (2015) Genetic admixture supports an
ancient hybrid origin of the endangered Hawaiian duck. Journal of Evolutionary Biology,
28, 1005–1015.
Lemey, P., Rambaut, A., Welch, J.J., & Suchard, M.A. (2010) Phylogeography takes a relaxed
random walk in continuous space and time. Molecular Biology and Evolution, 27, 1877–
1885.
Maguilla, E., Escudero, M., Hipp, A.L., & Luceño, M. (2017) Allopatric speciation despite
historical gene flow: Divergence and hybridization in Carex furva and C. lucennoiberica
(Cyperaceae) inferred from plastid and nuclear RAD-seq data. Molecular Ecology, 26,
5646–5662.
Mayr, E. (1942) Systematics and the origin of species from the viewpoint of a zoologist.
126
Systematics and the origin of species from the viewpoint of a zoologist.
Menezes, N. a, Ribeiro, A.C., Weitzman, S., & Torres, R. a (2008) Biogeography of
Glandulocaudinae ( Teleostei : Characiformes : Characidae ). Zootaxa, 48, 33–48.
Meyer, A. (1993) Evolution of mitochondrial DNA in fishes. Molecular biology frontiers,
biochemistry and molecular biology of fishes (ed. by W. Hochachka & T.P. Mommsen),
Vol. 2, pp. 1-38. Elsevier Science Publishers, Amsterdam.
Miller, M.A., Pfeiffer, W., & Schwartz, T. (2010) Creating the CIPRES Science Gateway for
inference of large phylogenetic trees. 2010 Gateway Computing Environments
Workshop, GCE 2010, .
Mirarab, S., Reaz, R., Bayzid, M.S., Zimmermann, T., S. Swenson, M., & Warnow, T. (2014)
ASTRAL: Genome-scale coalescent-based species tree estimation. Bioinformatics, 30,
541–548.
Monzón, J., Kays, R., & Dykhuizen, D.E. (2014) Assessment of coyote-wolf-dog admixture
using ancestry-informative diagnostic SNPs. Molecular Ecology, 23, 182–197.
Muniz, F.L., Campos, Z., Hernández Rangel, S.M., Martínez, J.G., Souza, B.C., De Thoisy,
B., Botero-Arias, R., Hrbek, T., & Farias, I.P. (2018) Delimitation of evolutionary units
in Cuvier’s dwarf caiman, Paleosuchus palpebrosus (Cuvier, 1807): insights from
conservation of a broadly distributed species. Conservation Genetics, 19, 599–610.
Nylinder, S., Lemey, P., De Bruyn, M., Suchard, M.A., Pfeil, B.E., Walsh, N., & Anderberg, A.A. (2014) On the biogeography of centipeda: A species-tree diffusion approach.
Systematic Biology, 63, 178–191.
Oaks, J.R. (2011) A time-calibrated species tree of crocodylia reveals a recent radiation of the
true crocodiles. Evolution, 65, 3285–3297.
Pease, J.B., Brown, J.W., Walker, J.F., Hinchliff, C.E., & Smith, S.A. (2018) Quartet
Sampling distinguishes lack of support from conflicting support in the green plant tree of
life. American Journal of Botany, 105, 385–403.
Peterson, B.K., Weber, J.N., Kay, E.H., Fisher, H.S., & Hoekstra, H.E. (2012) Double digest
RADseq: An inexpensive method for de novo SNP discovery and genotyping in model
and non-model species. PLoS ONE, 7, .
De Queiroz, K. (2007) Species concepts and species delimitation. Systematic biology, 56,
879–886.
Rambaut, A., Drummond, A.J., & Suchard, M. (2013) Tracer v1. 6—MCMC trace analysis
package. Institute of Evolutionary Biology, University of Edinburgh, UK.
127

Ronquist, F., Teslenko, M., van der Mark, P., Ayres, D.L., Darling, A., Hohna, S. et al (2012)
MrBayes 3.2: efcient bayesian phylogenetic inference and model choice across a large
model space. Syst Biol 61:539–554.
Ronquist, F. & Sanmartín, I. (2011) Phylogenetic Methods in Biogeography. Annual Review
of Ecology, Evolution, and Systematics, 42, 441–464.
Roos, J., Aggarwal, R.K., & Janke, A. (2007) Extended mitogenomic phylogenetic analyses
yield new insight into crocodylian evolution and their survival of the Cretaceous-Tertiary
boundary. Molecular Phylogenetics and Evolution, 45, 663–673.
Runemark, A., Hey, J., Hansson, B., & Svensson, E.I. (2012) Vicariance divergence and gene
flow among islet populations of an endemic lizard. Molecular Ecology, 21, 117–129.
Salzburger, W., Ewing, G.B., & Von Haeseler, A. (2011) The performance of phylogenetic
algorithms in estimating haplotype genealogies with migration. Molecular Ecology, 20,
1952–1963.
Schumer, M., Rosenthal, G.G., & Andolfatto, P. (2014) How common is homoploid hybrid
speciation? Evolution, 68, 1553–1560.
Servedio, M.R., Hermisson, J., & Van Doorn, G.S. (2013) Hybridization may rarely promote
speciation. Journal of Evolutionary Biology, 26, 282–285.
Stamatakis, A. (2014) RAxML version 8: a tool for phylogenetic analysis and post-analysis of
large phylogenies. Bioinformatics, 30, 1312–1313.
Stemshorn, K.C., Reed, F.A., Nolte, A.W., & Tautz, D. (2011) Rapid formation of distinct
hybrid lineages after secondary contact of two fish species (Cottus sp.). Molecular
Ecology, 20, 1475–1491.
Trier, C.N., Hermansen, J.S., Sætre, G.P., & Bailey, R.I. (2014) Evidence for Mito-Nuclear
and Sex-Linked Reproductive Barriers between the Hybrid Italian Sparrow and Its Parent
Species. PLoS Genetics, 10, e1004075.
Wilkinson, M.J., Marshall, L.G., & Lundberg, J.G. (2006) River behavior on megafans and
potential influences on diversification and distribution of aquatic organisms. Journal of
South American Earth Sciences, 21, 151–172.
Zhang, C., Rabiee, M., Sayyari, E., & Mirarab, S. (2018) ASTRAL-III: Polynomial time
species tree reconstruction from partially resolved gene trees. BMC Bioinformatics, 19,
15–30.
128

MATERIAL SUPPLEMENTAR
Figura S1. Árvore filogenética reconstruída com base no cyt b (N = 357) por meio de
Inferência Bayesiana (IB) realizada no programa MrBayes v3.2.2 (Ronquist et al., 2012).
Cada terminal na árvore representa um indivíduo e as cores dos ramos indicam a que
linhagem o indivíduo deveria pertencer dada sua origem geográfica. Para esta análise foram
usadas quatro cadeias independentes e os priors utilizados em cada análise foram mantidos
como padrão. A IB foi realizada usando 1 milhão de passos, com amostragem a cada 1 mil
passos resultando em uma posterior de 1 mil árvores. Foram descartadas os primeiros 25%
das árvores amostradas. As topologias foram sumarizadas e visualizadas no FigTree v1.4.2
(Rambaut 2014).
129

Figura S2. Análise de suporte dos nós da árvore de espécies reconstruída no programa
ASTRAL-III (Zhang et al., 2018) feita com o programa Quartet Sampling (Pease et al., 2018).
Para cada nó relevante na árvore são fornecidos três valores de suporte separados por barras.
O primeiro valor é o QC (quarteto de concordância) que indica com que frequência o quarteto
concordante é inferido em detrimento dos quartetos discordantes. O segundo valor é o QD
(quarteto diferencial) que indica o balanço da frequência das topologias discordantes. Ele
também pode indicar se existe uma topologia discordante tão frequente quanto a topologia
concordante. O terceiro valor é o QI (quarteto de informatividade) que indica qual a
proporção das réplicas foram informativas. Todos esses valores são calculados para cada nó.
Para melhor entendimento sobre a interpretação dos valores ver Pease et al. (2018).
130

SÍNTESE GERAL
Neste estudo nós investigamos a diversidade críptica em Paleosuchus palpebrosus e
produzimos importantes contribuições para a conservação, biogeografia e biologia evolutiva
desse complexo de espécies. Nós coletamos amostras em grande parte da distribuição de P.
palpebrosus e utilizamos uma combinação de marcadores moleculares, mitocondrial e
genômico, para fazer inferências evolutivas e desvendar os processos históricos ocorridos
durante a diversificação do grupo.
No capítulo 1, nós delimitamos Unidades Evolutivas Significantes utilizando os
critérios estabelecidos pela abordagem AEC (Adaptive Evolutionary Conservation). Muitos
desses critérios se confundem com os utilizados para delimitar espécies, e sugerimos que P.
palpebrosus é na verdade um complexo de espécies. Nós avaliamos a diversidade genética das
linhagens recém descobertas e comparamos com a estimada em outras espécies/linhagens de
crocodilianos. Além disso, discutimos as implicações para a conservação de P. palpebrosus,
sugerindo que cada linhagem deve ser avaliada em separado, independentemente de serem
reconhecidas ou não taxonomicamente.
No capítulo 2, nós utilizamos um teste explícito e descartamos a hipótese de que o
isolamento por distância sozinho teria gerado o padrão observado de diversidade genética,
aceitando a hipótese histórica de rearranjo de drenagem como promotor da diversificação do
complexo P. palpebrosus no corredor Paraguai-Madeira-Amazônia. Com base em nossos
resultados, nós propomos cenários hipotéticos de evolução da paisagem para explicar a
diversificação de P. palpebrosus. Também discutimos a utilidade desse modelo biogeográfico
para a fauna aquática da região, mostrando que a diversificação de algumas espécies de
131

vertebrados aquáticos poderiam ser explicadas à luz do modelo proposto.
No capítulo 3, nós ampliamos a amostragem com mtDNA e detectamos uma linhagem
adicional no Escudo Brasileiro. Nós também estimamos a árvore de espécies utilizando dois
métodos coalescentes, testamos modelos de hibridização vs Incomplete Lineage Sorting e
reconstruímos área do ancestral comum e a rota de dispersão das linhagens. Por fim,
avaliamos o ajuste destes processos ao modelo biogeográfico previamente proposto.
De um modo geral, nosso trabalho contribuiu não só para o entendimento da biologia
evolutiva de uma espécie supostamente com ampla distribuição, mas também para a
biogeografia de espécies aquáticas que ocorrem ao longo do corredor Amazonas-Madeira-
Pantanal. Algumas questões permanecem não resolvidas, tais como: quantas e quais linhagens
devem ser reconhecidas taxonomicamente e se houveram eventos de hibridização que
estariam dificultando a resolução das relações filogenéticas. Para isso, nova amostragem
genômica será necessária, bem como o uso de ferramentas analíticas que possibilitem testar
explicitamente modelos de especiação híbrida.
132

REFERÊNCIAS BIBLIOGRÁFICAS
Albert, J.S., & Reis, R.E. (2011) Historical Biogeography of Neotropical Freshwater Fishes.
University of California Press.
Allendorf, F.W., Hohenlohe, P.A., & Luikart, G. (2010) Genomics and the future of
conservation genetics. Nature Publishing Group, 11, 697–709.
Allendorf, F.W. & Luikart, G. (2007) Conservation and the Genetics of Populations.
Blackwell Publishing.
Allendorf, F.W., Luikart, G.H., & Aitken, S.N. (2012) Conservation and the Genetics of
Populations. John Wiley & Sons.
Avise, J.C. (1994) Molecular Markers, Natural History and Evolution. Chapman & Hall, NewYork.
Avise, J.C. (2000) Phylogeography: the history and formation of species. Harvard university
press, Cambridge, MA.
Avise, J.C. (2009) Phylogeography: Retrospect and prospect. Journal of Biogeography, 36, 3–
15.
Avise, J.C., Arnold, J., Ball, R.M., Bermingham, E., Lamb, T., Neigel, J.E., Reeb, C.A., &
Saunders, N.C. (1987) Intraspecific Phylogeography: The Mitochondrial DNA Bridge
Between Population Genetics and Systematics. Annual Review of Ecology and
Systematics, 18, 489–522.
Bloor, P., Ibáñez, C., & Viloria-Lagares, T.A. (2015) Mitochondrial DNA analysis reveals
hidden genetic diversity in captive populations of the threatened American crocodile
(Crocodylus acutus) in Colombia. Ecology and evolution, 5, 130–40.
Brown, W.M., Prager, E.M., Wang, A., & Wilson, A.C. (1982) Mitochondrial DNA sequencesof primates: Tempo and mode of evolution. Proceedings of the National Academy of
Sciences, USA, 76, 1976-1971.
Campos, Z., Coutinho, M., & Abercrombie, C. (1995) Size structure and sex ratio of dwarf
caiman in the Serra Amolar, Pantanal, Brazil. Herpetological Journal, 5, 321–322.
Campos, Z., Marioni, B., Farias, I., Verdade, L.M., Bassetti, L., Coutinho, M.E., Mendonça,
S.H.S.T. De, Vieira, T.Q., & Magnusson, W.E. (2013) Avaliação do risco de extinção do
jacaré-paguá Paleosuchus palpebrosus (Cuvier, 1807) no Brasil. Biodiversidade
Brasileira, 3, 40–47.
Campos, Z., Muniz, F., Farias, I.P., & Hrbek, T. (2015) Conservation status of the Dwarf
133
caiman Paleosuchus palpebrosus in the region of the Araguaia-Tocantins Basin, Brazil.
Crocodile Specialist Group Newsletter, 6–8.
Campos, Z., Sanaiotti, T., & Magnusson, W. (2010) Maximum size of dwarf caiman,
Paleosuchus palpebrosus (Cuvier, 1807), in the Amazon and habitats surrounding the
Pantanal, Brazil. Amphibia-Reptilia, 31, 439–442.
Crandall, K.A., Bininda-Emonds, O.R.P., Mace, G.M., & Wayne, R.K. (2000) Considering
evolutionay processes in conservation biology. Trends in Ecology and Evolution , 15 (17),
290-295.
Dormann, C.F., Schweiger, O., Augenstein, I., Bailey, D., Billeter, R., De Blust, G., Defilippi,
R., Frenzel, M., Hendrickx, F., Herzog, F., Klotz, S., Liira, J., Maelfait, J.P., Schmidt, T.,
Speelmans, M., Van Wingerden, W.K.R.E., & Zobel, M. (2007) Effects of landscape
structure and land-use intensity on similarity of plant and animal communities. Global
Ecology and Biogeography, 16, 774–787.
Eaton, M.J. (2010) Dwarf Crocodile Osteolaemus tetraspis. In S.C. Manolis & C. Stevenson
(Eds.) Crocodiles. Status Survey and Conservation Action Plan (p. 127–132). Crocodile
Specialist Group, Darwin.
Eaton, M.J., Martin, A., Thorbjarnarson, J., & Amato, G. (2009) Species-level diversification
of African dwarf crocodiles (Genus Osteolaemus): A geographic and phylogenetic
perspective. Molecular Phylogenetics and Evolution, 50, 496–506.
Ewers, R.M. & Didham, R.K. (2006) Confounding factors in the detection of speciesresponses to habitat fragmentation. Biological Reviews of the Cambridge Philosophical
Society, 81, 117–142.
Franke, F.A., Schmidt, F., Borgwardt, C., Bernhard, D., Bleidorn, C., Engelmann, W.E., &
Schlegel, M. (2013) Genetic differentiation of the African dwarf crocodile Osteolaemus
tetraspis Cope, 1861 (Crocodylia: Crocodylidae) and consequences for European zoos.
Organisms Diversity & Evolution, 13, 255–266.
Frankham, R., Ballou, J.D., & Briscoe, D.A. (2010) Introduction to conservation genetics.
Cambridge University Press, Cambridge, UK.
Fraser, D.J., & Bernatchez, L. (2001) Adaptive evolutionary conservation: towards a unified
concept for defining conservation units. Molecular Ecology, 10, 2741–2752.
Funk, W.C., McKay, J.K., Hohenlohe, P.A., & Allendorf, F.W. (2012) Harnessing genomics
for delineating conservation units. Trends in Ecology and Evolution, 27, 489–496.
Godshalk, R. (2006) Phylogeography and conservation genetics of the yacare caiman
(Caiman yacare) of South America. University of Florida, Gainesville, Florida, USA.
134

Gravena, W., Farias, I.P., Da Silva, M.N.F., Da Silva, V.M.F., & Hrbek, T. (2014) Looking to
the past and the future: Were the Madeira River rapids a geographical barrier to the boto
(Cetacea: Iniidae)? Conservation Genetics, 15, 619–629.
Gravena, W., da Silva, V.M.F., da Silva, M.N.F., Farias, I.P., & Hrbek, T. (2015) Living
between rapids: genetic structure and hybridization in botos (Cetacea: Iniidae: Inia spp.)
of the Madeira River, Brazil. Biological Journal of the Linnean Society, 114, 764–777.
Grigg, G., & Kirshner, D. (2015) Biology and Evolution of Crocodylians. Cornell University
Press.
Haig, S.M. (1998) Molecular contributions to conservation. Ecology, 79, 413–425.
Hekkala, E., Shirley, M.H., Amato, G., Austin, J.D., Charter, S., Thorbjarnarson, J., Vliet,
K.A., Houck, M.L., Desalle, R., & Blum, M.J. (2011) An ancient icon reveals new
mysteries: mummy DNA resurrects a cryptic species within the Nile crocodile.
Molecular ecology, 20, 4199–4215.
Henle, K., Davies, K.F., Kleyer, M., Margules, C., & Settele, J. (2004) Predictors of Species
Sensitivity to Fragmentation. Biodiversity and Conservation, 13, 207–251.
Hrbek, T., Da Silva, V.M.F., Dutra, N., Gravena, W., Martin, A.R., & Farias, I.P. (2014) A new
species of river dolphin from Brazil or: How little do we know our biodiversity. PLoS
ONE, 9(1), e83623.
Hrbek, T., Vasconcelos, W.R., Rebelo, G., & Farias, I.P. (2008) Phylogenetic relationships of
South American alligatorids and the Caiman of Madeira River. Journal of Experimental
Zoology Part A: Ecological Genetics and Physiology, 309, 588–599.
Hubert, N., Duponchelle, F., Nuñez, J., Garcia-Davila, C., Paugy, D., & Renno, J.F. (2007)
Phylogeography of the piranha genera Serrasalmus and Pygocentrus: Implications for
the diversification of the Neotropical ichthyofauna. Molecular Ecology, 16, 2115–2136.
Hubert, N., & Renno, J.F. (2006) Historical biogeography of South American freshwater
fishes. Journal of Biogeography, 33, 1414–1436.
Hudson. R.R., & Turelli, M. (2003) Stochasticity overrules the ‘‘three-times rule’’: genetic
drift, genetic draft, and coalescence times for nuclear loci versus mitochondrial DNA.
Evolution, 57, 182–190.
Hughes, C.E., Pennington, R.T., & Antonelli, A. (2013) Neotropical Plant Evolution:
Assembling the Big Picture. Botanical Journal of the Linnean Society, 171, 1–18.
Leite, R.N., & Rogers, D.S. (2013) Revisiting Amazonian phylogeography: Insights into
diversification hypotheses and novel perspectives. Organisms Diversity and Evolution,
13, 639–664.
135

Li, W.H. (1997) Molecular evolution. Sinauer Associates. Sunderland, MA.
Luikart, G.H., England, P., Tallmon, D.A., Jordan, S., & Taberlet, P. (2003) The power andpromise of population genomics: from genotyping to genome-typing. Nature Rev. Genet.,4, 981–994.
McAliley, L.R., Willis, R.E., Ray, D.A., White, P.S., Brochu, C.A., & Densmore, L.D. (2006)
Are crocodiles really monophyletic? Evidence for subdivisions from sequence and
morphological data. Molecular Phylogenetics and Evolution, 39, 16–32.
Meyer, A. (1993) Evolution of mitochondrial DNA in fishes. In: Hochachka, W., & Mommsen
T.P. (Eds). Molecular biology frontiers, biochemistry and molecular biology of fishes,
(Vol. 2, p. l-38). Elsevier Science Publishers, Amsterdam.
Moritz, C. (1994) Defining ‘Evolutionarily Significant Units’ for conservation. Trends in
Ecology & Evolution, 9, 373–375.
Moritz, C., Lavery, S., & Slade, R. (1995) Using allele frequency and phylogeny to define
units for conservation and management. 249–262.
Moritz, C., Patton, J.L., Schneider, C.J., & Smith, T.B. (2000) Diversification of rainforest
faunas: An integrated molecular approach. Annual Review of Ecology and Systematics,
31, 533–563.
Muniz, F.L. (2012) Filogeografia e genética de populações de jacaré-paguá (Paleosuchus
palpebrosus) ao longo do rio Madeira e bacia do rio Paraguai (Pantanal). Instituto
Nacional de Pesquisas da Amazônia, Manaus, Brasil.
Nichols, R. (2001) Gene trees and species trees are not the same. Trends in Ecology &
Evolution, 16, 358–364.
Öckinger, E., Schweiger, O., Crist, T.O., Debinski, D.M., Krauss, J., Kuussaari, M., Petersen,
J.D., Pöyry, J., Settele, J., Summerville, K.S., & Bommarco, R. (2010) Life-history traits
predict species responses to habitat area and isolation: A cross-continental synthesis.
Ecology Letters, 13, 969–979.
Nedbal, M.A., & Flynn, J.J. (1998) Do the combined effects of the asymmetric process of
replication and DNA damage from oxygen radicals produces a mutation rate signature in
the mitochondrial genome. Molecular Biology, 15, 219-223.
Pickles, R.S.A., Groombridge, J.J., Zambrana Rojas, V.D., Van Damme, P., Gottelli, D.,
Kundu, S., Bodmer, R., Ariani, C.V., Iyengar, A., & Jordan, W.C. (2011) Evolutionary
history and identification of conservation units in the giant otter, Pteronura brasiliensis.
Molecular Phylogenetics and Evolution, 61, 616–627.
136

Prugh, L.R., Hodges, K.E., Sinclair, A.R.E., & Brashares, J.S. (2008) Effect of habitat area
and isolation on fragmented animal populations. Proceedings of the National Academy
of Sciences, 105, 20770–20775.
de Queiroz, K. (2007) Species concepts and species delimitation. Systematic biology, 56, 879–
886.
Roe, K.J. & Lydeard, C. (1998) Species Delineation and the Identification of Evolutionarily
Significant Units : Lessons from the Freshwater Mussel Genus Potamilus (Bivalvia :
Unionidae). Journal of Shellfish Research, 17, 1359–1363.
Shirley, M.H., Villanova, V.L., Vliet, K. a, & Austin, J.D. (2014a) Genetic barcoding
facilitates captive and wild management of three cryptic African crocodile species
complexes. Animal Conservation, 18, 322–330.
Shirley, M.H., Vliet, K. a, Carr, A.N., & Austin, J.D. (2014b) Rigorous approaches to species
delimitation have significant implications for African crocodilian systematics and
conservation. Proceedings. Biological sciences / The Royal Society, 281, 20132483.
Smolensky, N.L. (2015) Co-occurring cryptic species pose challenges for conservation: a case
study of the African dwarf crocodile (Osteolaemus spp.) in Cameroon. Oryx, 49, 584–590.
Vogler, A.P. & Desalle, R.O.B. (1994) Diagnosing Units of Conservation Management.
Conservation Biology, 8, 354–363.
Waples, R.S. (1991) Pacific salmon, Oncorynchus spp., and the definition of “species” under
the Endangered Species Act. Marine Fisheries Review, 53, 11–22.
Waples, R.S. (1995) Evolutionarily significant units and the conservation of biological
diversity under the Endangered Species Act.
137

APÊNDICE A
Campos Z, Muniz FL, Farias IP, Hrbek T (2015b) Conservation status of the dwarf caiman
Paleosuchus palpebrosus in the region of the Araguaia-Tocantins basin, Brazil. Crocodile
Spec Group Newsl 34:4–8.
138

139
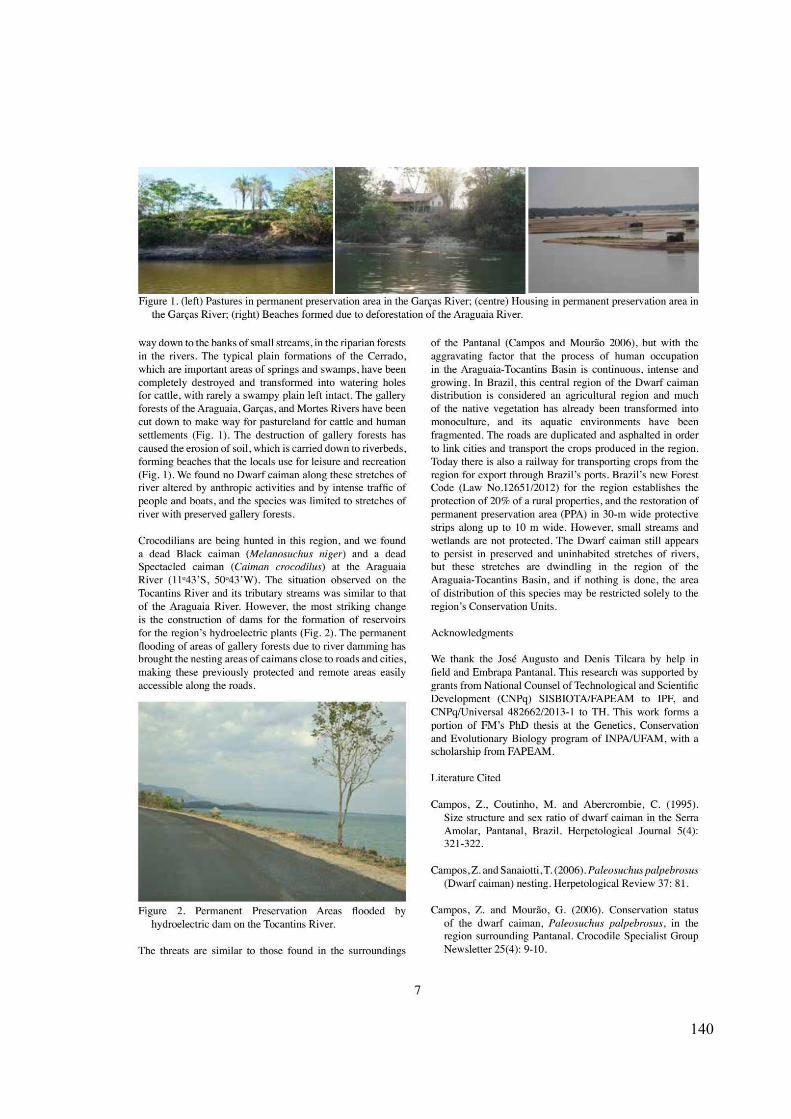
140
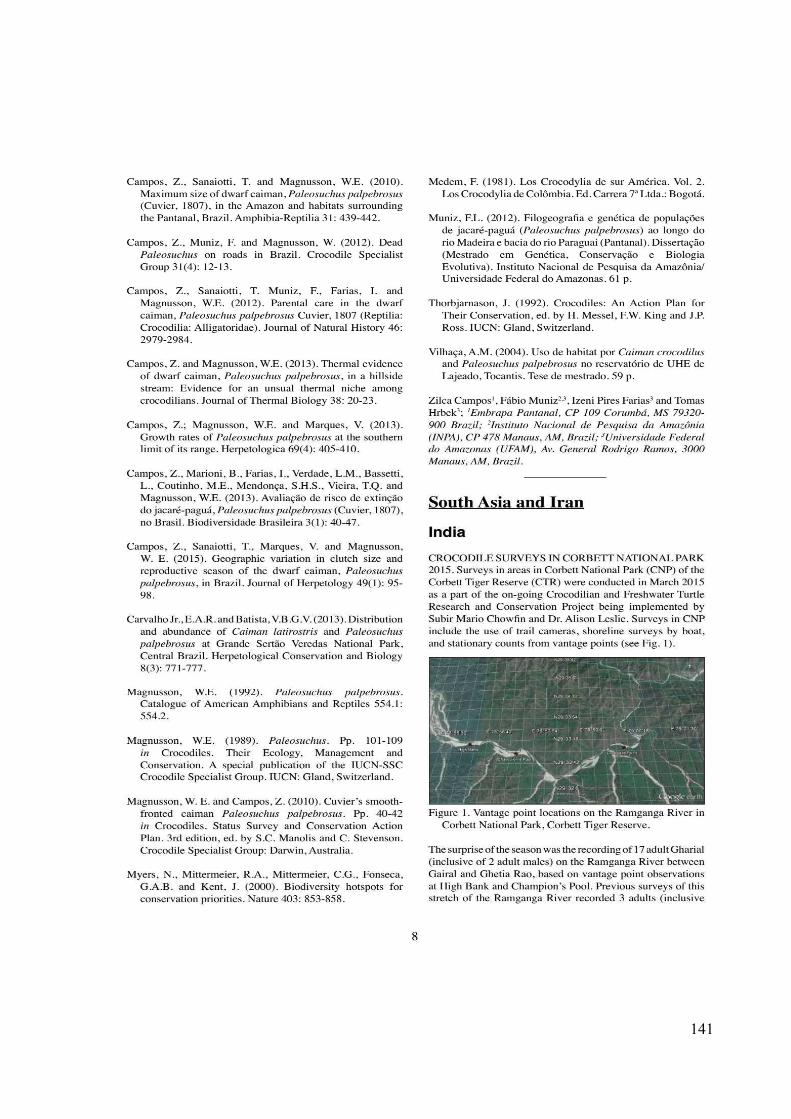
141

APÊNDICE B
Muniz F, Bittencourt PS, Farias IP, Hrbek T, Campos Z (2015) New records on occurrence of
Paleosuchus in the Branco river basin, Roraima state, Brazil. Crocodile Specialist Group
Newsletter 34: 8–10.
142

143

146
147

148
Recommended


