SYNTHESIS AND CHARACTERIZATION OF
MIXED OXIDES CONTAINING COBALT,
COPPER AND IRON AND STUDY OF THEIR
CATALYTIC ACTIVITY
A thesis submitted to the
UNIVERSITY OF PUNE
for the degree of
DOCTOR OF PHILOSOPHY
(in Chemistry)
BY
THOMAS MATHEW
CATALYSIS DIVISION
NATIONAL CHEMICAL LABORATORY
PUNE- 411008
INDIA
OCTOBER 2002

Dedicated to My Elder Brother
CERTIFICATE
Certified that the work incorporated in the thesis, “Synthesis and
characterization of mixed oxides containing Cobalt, Copper and Iron and
study of their catalytic activity” submitted by Mr. Thomas Mathew, for
the Degree of Doctor of Philosophy, was carried out by the candidate under
my supervision in the Catalysis Division, National Chemical Laboratory,
Pune - 411008, India. Such material as has been obtained from other sources
has been duly acknowledged in the thesis.
Dr. B. S. Rao (Research Supervisor)
ACKNOWLEDGEMENTS
I wish to express my profound sense of gratitude to my research supervisor, Dr. B.
S. Rao, Scientist G, National Chemical Laboratory, Pune for his valuable guidance and
constant encouragement throughout the course of this investigation. His cooperative
attitude has helped me a lot during the course of these investigations.
It gives me great pleasure to express my deep sense of gratitude and indebtedness
to Dr. C. S. Gopinath, Scientist, NCL for his expert and inspiring guidance and
suggestions in carrying out the research work.
I am grateful to Dr. A. V. Ramaswamy, Head, Catalysis and Inorganic Chemistry
Division, NCL for providing me all facilities required for my research work. I am thankful
to Prof. Károly Lázár, Ms. Zsuzsanna Koppány and Prof. László Guczi, Institute of Isotope
and Surface Chemistry, CRC, H-1525 Budapest, Hungary for Mössbauer, TPR and TPD
studies.
I am very thankful to Dr. C. V. V. Satyanarayana for supervising my research work
after the retirement of Dr. B. S. Rao. I am very much indebted to Dr. R. Vetrivel, Dr. S. G.
Hegde, Ms. Violet Samuel, Dr. H. S. Soni, Mrs. Nalini Jacob, Dr. Belhekar, Dr. Awate, Ms.
Agashe , Dr. P. A. Joy, Dr. S. D. Kulkarni, Dr. S. K. Date, Mr. V. V. Bokade, Dr. S. P.
Mirajkar, Dr. Sugunan, Dr. Ramankutty, Sreejarani and Nisha for their valuable help and
cooperation given to me in completing my research work successfully.
I also thank Dr. A. P. Singh, Dr. S. Sivasankar, Dr. Rajiv Kumar, Dr. V. P.
Shiralkar, Dr. Vijayamohanan, Dr. C. Gopinathan, Dr. Veda Ramaswamy, Dr. Budhkar,
Mr. K. Ramakrishnan, Mr. C. V. Kavedia, Dr. R. A. Shaikh, Mr. Purushothaman, Madhu,
Katti and all other scientific and nonscientific staff in the Catalysis Division, NCL, for
their help on various occasions.
I express my sincere thanks to Dr. K. Sreekumar, Dr. T. M. Jyothi and Dr. R.
Rajgopal for their support and all kind of help. I sincerely thank my colleagues Shiju,
Shivanand, Satyanarayana Reddy and Anand for their friendly help and kind cooperation
during the course of the theses work.
At this moment it is my pleasure to acknowledge my indebteness to the teachers,
research scholors and my M. Sc class mates (Riju, Joseph, Rajesh, Pradeep, Jeude and
Sujith) of School of Chemical Science, Mahatma Ganhi University, Kottayam for their
wholehearted help and for encouraging me to come in research field.
My special thanks are due to Ranjeet, Sidhesh, Balakrishna Tope, Suresh, Anirban
Ghosh, Bennur, Mandal, Pathra, Senapathi, Raja, Dr. T. Raja, Kiran Rao, Dr. M. B.
Talwar, Venkidathiri, Venkat, Dr. K. Selvaraj, Mukherjee, Karuna, Sharanappa,
Prashanth, Roshan, Praful, Sachin, Anil, Praveen, Dr. Ghore, Dr.U. D. Joshi, Mr. Somani,
Sabde, Anil Sinha, Sindhu, Sharada, Vandhana, Preethi, Pallavi, Mahesh, Vijayaraj,
Thirunavakarasu, Vasu, Dhanasree and Smitha, for their help on various occasions
I would like to thank my friends, Sureshan, Suresh (Pattar), Rajesh, Jayaprakash,
Vinod, Newman, Sreekumar, Shivasankar, Biju (Mayavi), Pradeep Pallan, Suju, Jinu,
Brother, Praveen, Nagamani, Muthu, Jolly, Sreejith, Jainy, Sebastian, Surendran, Shylesh,
Sajeev, Rajsankar, Gopakumar, Mr. Karunakaran, Kala and family, Tresa and family for
their all kind of help extended to me. Their company provided me joyful moments during
the stay in Pune. Also it gives me great pleasure to thank Dr. Thomas Daniel and family
for their love and help.
I take this opportunity to extend my heartfelt thanks to my numerous good hearted
friends in my native place. Specially I would like to thank Rajannan, Ajayan sir, Sathiajith
sankar, Sankar sir, Vikru, Sudershan sir, Raju sir, Fr. Thomas Mukaluvila, Monachan,
Ponnachan, Sathiadas, Hariprazeed, Vivek for their love and encouragement that they
have shown to me.
I take this opportunity to express my deep sense of gratitude to my family members,
Ammachan and Ammavi, Mamachan and Rosili ammama, Kunjammama and family, Fr.
Antoni Valiyavilayil and other relatives for their love, trust, continuous encouragement
and unfailing support throughout my educational career.
Finally, my thanks are due to Dr. S. Sivaram, Director, NCL and Dr. P. Ratnasamy
(former Director, NCL) for allowing me to carryout the research work at NCL and submit
the work in the form of a thesis for the award of Ph. D degree and also to CSIR, New
Delhi, India, for providing me a research fellowship.
Thomas Mathew
i
CONTENTS
1 INTRODUCTION
1.1 INTRODUCTION 1
1.2 HETEROGENEOUS CATALYSIS 1
1.3 OXIDES 2
1.4 MIXED METAL OXIDES 3
1.5 PREPARATION OF CATALYSTS 3
1.6 TRANSITION METAL OXIDES AS CATALYSTS 4
1.7 TYPES OF INTERACTION BETWEEN ORGANIC
MOLECULES AND OXIDE SURFACES
4
1.8 SURFACE ANALYSIS OF CATALYSTS 5
1.9 SPINELS 6
1.10 FERROSPINELS 9
1.11 COPPER AND COBALT FERRITES 9
1.12 ACID-BASE AND REDOX PROPERTIES 10
1.13 CATALYTIC ACTIVITY OF SPINELS 10
1.14 ALKYLATION OF PHENOL 14
1.15 PHENOL METHYLATION 15
1.15.1 Efficient methylation through synergism 17
1.16 OBJECTIVE OF THE PRESENT WORK 19
1.17 REFERENCES 24
2 EXPERIMENTAL AND PHYSICO CHEMICAL
CHARACTERIZATION
2.1 CATALYST PREPARATION 31
2.2 CATALYTIC ACTIVITY MEASUREMENTS 31
2.3 PHYSICO CHEMICAL CHARACTERIZATIONS 33
2.3.1 Introduction 33
2.3.2 Theory and experimental procedure 33
ii
2.3.2.1 X-ray diffraction analysis 33
2.3.2.2 Diffuse reflectance infrared spectroscopy 34
2.3.2.3 Surface area determination by BET method 35
2.3.2.4 Scanning electron microscopy 36
2.3.2.5 Thermal analysis 36
2.3.2.6 Temperature programmed techniques: TPR and
TPD
37
2.3.2.7 Mössbauer spectroscopy 38
2.3.2.8 X-ray photoelectron spectroscopy (XPS) 39
2.3.2.9 Infrared adsorption studies 40
2.3.3 Results and discussion 40
2.4 ACID-BASIC PROPERTIES 45
2.4.1 Introduction 45
2.4.2 Experimental 46
2.4.3 Results 47
2.4.3.1 Hydroxyl groups on Cu1-xCoxFe2O4 47
2.4.3.2 Pyridine adsorption 49
2.4.3.3 Temperature dependence of pyridine adsorption 50
2.4.3.4 Basicity 52
2.4.3.4.1 CO2 adsorption 52
2.4.3.4.2 Adsorption studies of TCNQ and
chloranil
53
2.4.4 Discussion 54
2.4.4.1 Composition dependence of hydroxy species on
Cu1-xCoxFe2O4
54
2.4.4.2 Acidity of Cu1-xCoxFe2O4 55
2.4.4.3 Basicity of Cu1-xCoxFe2O4 58
2.4.4.4 Correlation between theoretical and experimental
results
59
2.4.5 Conclusions 61
iii
2.5 REFERENCES 63
3 CATALYTIC ACTIVITY STUDIES AND MECHANISM OF
PHENOL METHYLATION
SECTION I
3.1 INTRODUCTION 66
3.2 RESULTS AND DISCUSSION OF PHENOL METHYLATION 67
3.2.1 Effect of MeOH:PhOH molar ratio 67
3.2.2 Effect of catalyst composition 69
3.2.3 Reaction temperature dependence 71
3.2.4 Discussion 73
3.2.5 Thermodynamic aspects of phenol methylation 74
3.3 PHENOL METHYLATION USING DIMETHYL CARBONATE 79
3.4 CATALYTIC ETHYLATION OF PHENOL 81
3.4.1 Introduction 81
3.4.2 Results 81
3.4.2.1 Effect of Ethanol:Phenol mole ratio 81
3.4.2.2 Effect of time on stream 83
3.4.2.3 Effect of catalyst composition 83
3.4.2.4 Effect of reaction temperature 85
3.4.3 Discussion 86
3.5 ISOPROPYLATION OF PHENOL 89
3.5.1 Introduction 89
3.5.2 Results and discussion 90
3.6 TERTIARY BUTYLATION OF PHENOL 93
3.6.1 Introduction 93
3.6.2 Results and discussion 93
SECTION II
3.7 INTRODUCTION 97
3.8 RESULTS 97
iv
3.8.1 Adsorption of methanol 97
3.8.2 Adsorption of phenol 102
3.8.3 Adsorption of Anisole 105
3.8.4 Adsorption of o-cresol 106
3.8.5 Adsorption of 2,6 – xylenol 107
3.8.6 Coadsorption of phenol and methanol 109
3.9 DISCUSSION 111
3.9.1 Reactivity of methanol 111
3.9.2 Reactivity of phenol and phenolic products 112
3.9.3 Mechanism of phenol methylation 113
3.10 REFERENCES 116
4 CHARACTERIZATION OF SPENT CATALYSTS AND
Co-Cu SYNERGISM
SECTION I
4.1 INTRODUCTION 119
4.2 METHYLATION OF PHENOL 119
4.2.1 Bulk characterization (XRD and Surface area) 119
4.2.2 Infrared spectroscopy 121
4.2.3 Mössbauer spectroscopy 122
4.2.4 Temperature programmed reduction and desorption
(TPR, TPD)
125
4.2.5 Thermogravimetry and differential thermal analysis (TG
and DTA)
128
4.2.6 XPS analysis 130
4.2.6.1 Oxygen 1s core level 130
4.2.6.2 Cu 2p core level 131
4.2.6.3 Cu L3M45M45 133
4.2.6.4 Co 2p core level and Co-L3M45M45 auger transitions 135
4.2.6.5 Fe 2p core level and Fe-L3M45M45 137
v
4.2.6.6 Valence band photoemission 139
4.2.6.7 Bulk and surface composition 141
4.3 PHENOL ETHYLATION 143
4.3.1 Characterization of Cu1-xCoxFe2O4 143
4.3.2 XPS Analysis 144
4.3.2.1 Cu 2p core level and CuL3M45M45 144
4.3.2.2 Co 2p core level and Co-L3M45M45 auger
transitions
146
4.3.2.3 Fe 2p core level and Fe-L3M45M45 148
4.3.2.4 Valence band studies 149
4.3.2.5 Surface composition 150
4.4 COMPARISON OF DIFFERENT PHENOL ALKYLATIONS 152
4.4.1 Characterization of Cu0.50Co0.50Fe2O4 153
4.4.2 XPS Analysis 154
4.4.2.1 Cu 2p core level 154
4.4.2.2 Co 2p core level 155
4.4.2.3 Fe 2p core level 156
4.4.2.4 Valence band photoemission 157
4.4.2.5 Surface composition 158
SECTION II
4.5 INTRODUCTION 160
4.6 DISCUSSION 160
4.6.1 Chemical state and distribution of transition metal ions in
Cu1-xCoxFe2O4 system
160
4.6.2 Changes in the bulk structure - extent of the expected
phase separation
161
4.6.3 Structural effects due to the reducing reaction conditions 163
4.6.4 Carbonaceous deposits formed in the process of
alkylation
165
vi
4.6.5 Surface state – XPS 167
4.6.6 Cu-Co Synergism 167
4.6.7 Comparison of different phenol alkylation reactions 169
4.6.8 Acid-base strength and methylation activity performance 171
4.7 REFERENCES 173
5 SUMMARY AND CONCLUSIONS 175
vii
ABBREVIATIONS
Chloranil 2,3,5,6-tetrachloro-1-4-benzoquinone
DMC Dimethyl carbonate
DRIR Drift infrared
DTA Differential thermal analysis
FWHM Full width at half maximum
2,4-DTBP 2,4-Di tertiary butyl phenol
IS Isomer shift
MHF Magnetic hyperfine field
PDNB p-Dinitro benzene
QS Quadrupole splitting
RI Relative spectral area
SEM Scanning electron microscopy
2-TBP 2-Tertiary butyl phenol
4-TBP 4-Tertiary butyl phenol
TCNQ 7,7,8,8- Tetracyanoquino dimethane
TG Thermogravimetry
TMP 2,4,6- Trimethyl phenol
TOS Time on stream
TPD Temperature programmed desorption
TPR Temperature programmed reduction
VB Valence band
WHSV Weight hourly space velocity
XPS X-ray photoelectron spectroscopy
XRD X-ray diffraction
List of publications: 1. Cu-Co Synergism in Cu1-xCoxFe2O4 – Catalysis and XPS Aspects.
T. Mathew, N. R. Shiju, K. Sreekumar, B. S. Rao and C. S. Gopinath, J. Catal., 210
(2002) 405.
2. Cu1-xCoxFe2O4 ferrospinels in alkylation: structural changes upon reaction.
K. Lázár, T. Mathew, Z. Koppány, J. Megyeri, V. Samuel, S. P. Mirajkar, B. S. Rao,
and L. Guczi, Phys. Chem. Chem. Phys., 4 (2002) 3530.
3. Acid-base properties of Cu1-xCoxFe2O4 ferrospinels: FT-IR investigations.
T. Mathew, N. R. Shiju, B. B. Tope, S. G. Hegde, B. S. Rao and C. S. Gopinath,
Phys. Chem. Chem. Phys., 4 (2002) 4260.
4. Thermodynamic study of reaction of phenol with methanol over Cu1-xCoxFe2O4 (x =
0, 0.25, 0.50, 0.75 & 1) spinel system.
T. Mathew, N.R. Shiju, R.Y. Nimje, P.M. Adkine, B.S. Rao and V.V. Bokade,
Chem. Eng. Res. Design (Accepted for publication)
5. Selective synthesis of 3-picoline via the vapour phase methylation of pyridine with
methanol over Ni-Co-Fe ternary spinel systems.
K.Sreekumar, Thomas Mathew, R. Rajagopal, R. Vetrivel and B.S. Rao; Catal.
Lett., 65 (2000) 99.
6. Oxidative dehydrogenation of ethylbenzene over Ni1-xCoxFe2O4 (x = 0,0.2,0.5,0.8
and 1.0) -type ferrites: Influence of spinel composition on acid-base properties and
styrene selectivity.
K.Sreekumar, Thomas Mathew, T.M. Jyothi, Biju M. Devassy, S. Sugunan and
B.S. Rao; Polish Journal of Chemistry, 74 (2000) 509-517.
7. Formation of 3-picoline and 3,5-lutidine using Zn1-xCoxFe2O4 (x = 0,0.2,0.5,0.8 and
1.0) -type ferrites.
K. Sreekumar, T. Mathew, B. M. Devassy, R. Rajgopal, R. Vetrivel and B. S. Rao,
Appl. Catal, A:General, 205 (2001)11.
8. A comparative study on aniline alkylation activity using methanol and dimethyl
carbonate as alkylating agent over Zn1-xCoxFe2O4 (x = 0,0.2,0.5,0.8 and 1.0) -type
ferrites.
K. Sreekumar, T. Mathew, S. P. Mirajkar, S. Sugunan and B. S. Rao, Appl. Catal,
A:General, 201 (2000) L1.
9. Selective N-methylation of aniline with dimethyl carbonate over Zn1-xCoxFe2O4 (x
= 0, 0.2, 0.5, 0.8 and 1.0) type systems.
K. Sreekumar, T.M. Jyothi, T. Mathew, M. B. Talwar, S. Sugunan and B. S. Rao, J.
Mol. Catal. A, 159 (2000) 327.

Chapter 1: Introduction
1
1.1. INTRODUCTION
Catalyst synthesis and development have become a wide spread research field
because of the increasing global demand for better systems in chemical industry. The
successful exploitation of a material as a catalyst will give value-added products with
better yields. Research in this field is driven by the effort of the fine chemical and
pharmaceutical industries to replace wasteful non-catalytic processes by economical and
eco-friendly (green) catalytic routes. Three major areas involving catalysts can be broadly
classified as (i) petroleum refining (ii) chemicals and (iii) emission control.
Many new catalysts have been discovered which can be broadly classified either
into homogeneous catalysis or heterogeneous catalysis systems. Though homogeneous
systems possess several advantages such as better selectivity, activity and reproducibility,
they are associated with several drawbacks like low thermal stability and short catalyst
life-time, which amplify the cost of production. Hence the synthesis of new heterogeneous
systems to replace the existing homogeneous systems has become a challenging task in the
catalysis field.
1.2. HETEROGENEOUS CATALYSIS
Heterogeneous catalysis is gaining increasing importance in the production of fine
chemicals and pharmaceuticals due to its definite technical advantages, which greatly
enhance production processes, competitiveness and economics. For example,
heterogeneous catalysts employed as main cracking catalysts in petroleum refinery, which
is the largest process among the industrial chemical processes. The main advantage of the
heterogeneous catalytic process is that it can be operated continuously in a reactor without
interruption. Since the catalyst is present in a phase different from the reactants and the
products, the separation of the catalyst from the final reaction mass is also quite easy.
Among various heterogeneous catalysts, oxide systems are versatile and widely
used for many organic transformations reactions like oxidation, hydrogenation and
dehydrogenation, condensation, cracking, isomerization, alkylation etc. Oxides have an
ability to bring about electron transfer as well as proton transfer and they can, therefore, be
used in both redox and acid base reactions [1]. Hence oxide catalysts are important from
Chapter 1: Introduction
2
commercial point of view and have been used for manufacturing many value-added
products.
1.3. OXIDES
Classifying metal oxides as catalysts are quite tedious since it involves a variety of
crystal systems of different compositions with a wide range of physico-chemical
properties. Oxide catalysts fall into two general categories. They are either poor electrical
conductors or good conductors. Insulator oxides are those in which the cationic material
has a single oxidation state, so they have stoichiometric M:O ratios. The simple oxides,
MgO, Al2O3 and SiO2 and the more complex zeolites, which are aluminosilicates, fall into
this category. These materials are not effective as oxidation catalysts and find most use as
solid acids or bases [2,3].
Semiconductor and conducting oxides are most commonly used in oxidations.
They are materials in which the metal ion species is relatively easily cycled between two
different valence states. There can be two different oxidation states under reaction
conditions as in Fe2O3, V2O5, TiO2, CuO or NiO, or the interconversion between the
positive ion and neutral metal as with the more easily reduced oxides such as ZnO and
CdO. Semiconductor oxides can be either n-type (e.g., Fe2O3, V2O5, TiO2, CuO etc) or p-
type (e.g., NiO, CoO, Cu2O etc).
In general, oxides are prepared in single component or in multiple components;
they may be crystalline or amorphous and they may be supported or unsupported. While
simple oxides show activity for some oxidations they are more commonly used as solid
acids or bases. Since single component oxides do not come under the purview of the
present study, to list a discussion of them in detail is beyond the scope of this chapter.
Complex oxides (mixed metal oxides) can act as acids or bases as well as oxidation
catalysts. Complex oxides can range in composition from binary oxides to the more
complex ternary and quaternary systems.
Chapter 1: Introduction
3
1.4. MIXED METAL OXIDES
Oxides of two or more different kinds of cations are known as mixed metal oxides.
They can be further classified based on whether they are crystalline or amorphous. If the
oxides are crystalline the crystal structure can determine the oxide composition. For
instance, perovskites have the general formula ABO3, scheelites are ABO4, spinels are
AB2O4 and palmeirites are A3B2O8 [4].
The common feature of mixed oxide catalysts, irrespective of the mode of mutual
arrangement of their components, is the presence of MIn+- Ox and MII
n+- Ox polyhedra,
where MI and MII are different cations in their structure. These polyhedra can be
connected in various ways, e.g., corner, or edge sharing, forming chains MI-O-MII-O, MI-
O-MI-O or MII-O-MII. Various arrangements of atoms of a given element, differing by the
coordination, nature and the next neighboring cation and type of bonding may be then
exposed on the catalyst surface. It could be then anticipated that different environment of
atoms that constitute an active center would give rise to different reactivity towards an
approaching molecule.
For mixed oxide catalysts it is not always evident which of the constituent elements
plays a role of active centers. Although the industrial catalysts are usually multiphase
systems, the presence of one phase, for example spinels, appears usually to be
indispensable to render the systems active in a given reaction. One of the most important
results of the studies on monophasic systems is the demonstration of different catalytic
properties of different crystallographic faces in an oxide, which provided an experimental
proof for structure sensitivity phenomenon in the oxide systems.
1.5. PREPARATION OF CATALYSTS
A new catalyst can amplify process efficiency, reduce production cost and replace
existing processes with better ones. Recently, a number of fundamental studies concerning
the influence of preparation procedures on the catalyst performance have been published
[5,6]. In all cases, it was stated that the activity and selectivity of the catalysts were
dependent on preparation parameters, in particular thermal activation, thereby suggesting
that catalyst preparation is a critical factor. The most common methods used to prepare
Chapter 1: Introduction
4
complex oxides are co-precipitation [7,8], sol-gel method [9,10], complexation method [8],
combustion method [11,12] and ceramic method [13].
1.6. TRANSITION METAL OXIDES AS CATALYSTS
The high catalytic activity of transition metals appears to be one of the most
significant facts of heterogeneous catalysis. It is believed that a mixture of oxides brings
out a combined effect or a sort of synergistic behavior, which is well known among
transition metal oxides, enhancing the catalytic activity [14,15]. Moreover, transition
metal ions exhibit various oxidation states, due to intrinsic oxidation-reduction processes
[16] or by catalytic reaction [14,15] and that can occur at the same or different sites as a
consequence of fine balance of the respective preference of the ions concerned. Selective
oxidation, ammoxidation and selective dehydrogenation constitute the most important
catalytic uses of transition metal oxides [17]. Many workers have explained the high
catalytic activity on the basis of the fact that the cations exert an abnormally strong
deforming action and that there is a gradual decrease in the potential of the chemical forces
in bonds that are formed by d-electrons, in comparisons with bonds formed by s- and p-
electrons.
Due to their ability to have various oxidation state, transition metals form non-
stoichiometric oxides, and they have excellent potentials for oxidation and reduction
(redox) reactions, because they can both give and accept electrons.
Mn+ => M(n+1)+ + e-
M(n+1)+ + e- => Mn+
1.7. TYPES OF INTERACTION BETWEEN ORGANIC MOLECULES AND
OXIDE SURFACES
The main chemical interactions between the surface of an oxide catalyst and a
molecule are:
1. Acid-base interactions (ionic): These can be either of Bronsted or Lewis type involving
proton exchange or electron pair donation, respectively. In acid catalyzed reactions,
Chapter 1: Introduction
5
reactants act as bases toward catalysts which act as acids. On the other hand in a base
catalyzed reaction reactants act as acids toward catalysts that act as bases.
2. Redox interactions (electronic): Redox reactions involving the exchange of electrons
between the solid and the adsorbed molecules. Such interactions are particularly important
in oxidation catalysis.
3. Coordination chemistry interactions: These interactions usually occur when transition
metal ions are present in the catalyst or are anchored at the surface of a support and can go
from the simple coordination of a ligand in the coordination sphere of the transition metal
ion to more complex processes involving activation of the ligand molecule by interaction
with ‘d’ orbitals of the metal ion itself, such as charge transfer between them.
1.8. SURFACE ANALYSIS OF CATALYSTS
Heterogeneous catalysts are sometimes called surface catalysts because they
position the reactant molecules on their very surface. Chemisorption of the substances on
the surface of the catalyst is the first step in heterogeneous catalysis, which is followed by
the reaction of the chemisorbed molecules and the desorption of the products from the
catalyst.
The developments in surface science techniques have provided very detailed idea
about the surface structures, chemical composition and electronic properties of the
surfaces. In particular, the advances in instrumentation and experimental techniques have
made it possible to study the chemistry of the interface between the transition metal oxide
and the fluid phase in greater detail than ever before. Among various surface techniques,
X-ray Photoelectron Spectroscopy (XPS) is the most promising technique due to direct
identification of electronic structure details; based on this one can identify three key
concepts applicable to the surface chemistry of metal oxides: (1) oxidation state of the
surface (2) redox properties of the oxide and (3) coordination environment of surface
atoms.
Chapter 1: Introduction
6
1.9. SPINELS
Among the mixed oxides, spinel-type oxides remain prominent. The spinel oxides
have the general formula AB2O4, where A and B are cations with oxidation states of +2
and +3, respectively. Although the most numerous and most interesting compounds with
the spinel structure are oxides, some halides and sulphide also crystallize in this structure.
The spinel structure, named for the mineral spinel MgAl2O4, is face centered cubic with a
large unit cell containing eight formula units [18-20]. It can be described as a cubic close-
packed array of anions (O2- ions) with the metal ions located in interstitial positions in this
array. Two types of interstices are available, one formed by four anions at the vertices of a
tetrahedron and the other by six anions at the vertices of an octahedron; these interstices
are commonly called the tetrahedral (Td) or A sites and the octahedral (Oh) or B sites,
respectively. The preference of the individual ions for the two types of lattice sites are
determined by [21-24] ionic radii of the specific ions, size of the interstices, temperature
and the orbital preference for specific coordination.
The cation distribution also depends on the method of preparation of the
compounds [25] as well as the processing parameters therein, such as the thermal history
of the sample which includes, processing temperature, method of annealing etc [20, 26-28]
and also on the composition [26,29]. The distribution of cations in different coordinations
in several phases of spinel structure as a function of equilibrium temperature has been
qualitatively demonstrated by Datta and Roy [27]. When the various factors as mentioned
above are counter balancing one another, there can be a completely random arrangement of
metal ions among the eight Td and sixteen Oh sites.
In the unit cell of 32 oxygen ions there are 64 Td sites and 32 Oh sites. Of these, 8
Td holes and 16 Oh holes are occupied by cations. In other words, 1/8 of the Td interstices
and 1/2 of the Oh interstices are occupied by cations. The unit cell of an ideal spinel
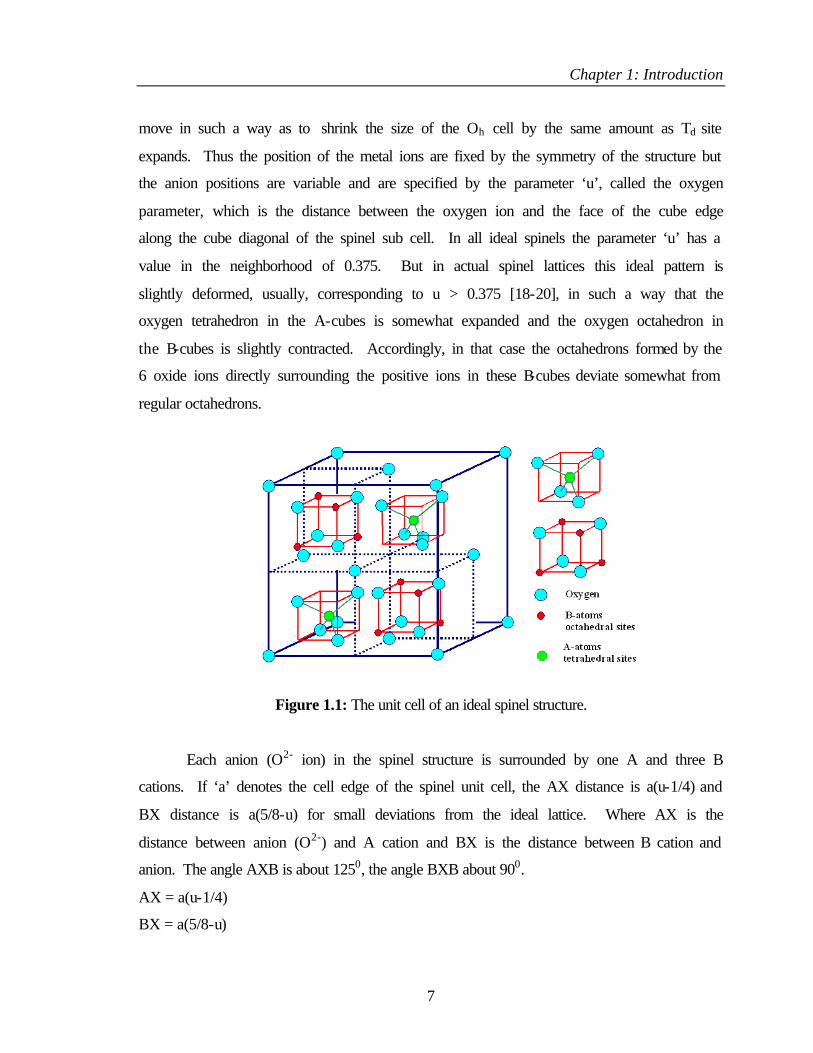
structure is shown in Figure 1.1. From the figure, it is evident that there are two types of
cubic building units inside a big fcc O-ion lattice, filling all 8 octants.
The positions of the ions in the spinel lattice are not perfectly regular and some
distortion does occur. The Td sites are often too small for the metal ions so that the oxygen
ions move slightly to accommodate them. The oxygen ions connected with the Oh sites
Chapter 1: Introduction
7
move in such a way as to shrink the size of the Oh cell by the same amount as Td site
expands. Thus the position of the metal ions are fixed by the symmetry of the structure but
the anion positions are variable and are specified by the parameter ‘u’, called the oxygen
parameter, which is the distance between the oxygen ion and the face of the cube edge
along the cube diagonal of the spinel sub cell. In all ideal spinels the parameter ‘u’ has a
value in the neighborhood of 0.375. But in actual spinel lattices this ideal pattern is
slightly deformed, usually, corresponding to u > 0.375 [18-20], in such a way that the
oxygen tetrahedron in the A-cubes is somewhat expanded and the oxygen octahedron in
the B-cubes is slightly contracted. Accordingly, in that case the octahedrons formed by the
6 oxide ions directly surrounding the positive ions in these B-cubes deviate somewhat from
regular octahedrons.
Figure 1.1: The unit cell of an ideal spinel structure.
Each anion (O2- ion) in the spinel structure is surrounded by one A and three B
cations. If ‘a’ denotes the cell edge of the spinel unit cell, the AX distance is a(u-1/4) and
BX distance is a(5/8-u) for small deviations from the ideal lattice. Where AX is the
distance between anion (O2-) and A cation and BX is the distance between B cation and
anion. The angle AXB is about 1250, the angle BXB about 900.
AX = a(u-1/4)
BX = a(5/8-u)
Chapter 1: Introduction
8
For an ideal spinel, ‘u’ = 0.375
Hence, AX = a (0.375-1/4) = 0.125a
BX = a(5/8 – 0.375) = 0.25a
This difference in the bond length of two types of cations with the anions is an important
factor in determining their electrical and catalytic properties [20].
Further, the spinel structure is very flexible with respect to the cations it can
incorporate. There are two end-member cation distributions in the spinels, called normal
and inverse spinels. Originally, in accordance with classical principles of crystallography,
in the spinels of the type AB2O4, if the less abundant A cation is restricted to Td sites (also
called A-sites) and the more abundant B cation is restricted to the Oh sites (also called B-
sites) the spinels are called normal spinels. But Barth and Posenjak [30] pointed out a
second possibility, in which half of the B cations occupy the Td sites and all A cations
together with the other half of the B cations in the Oh sites. This type of spinel
configuration is called ‘inverse’ spinels. Barth and Posenjak, who based their conclusions
up on a detailed discussion of the intensities of x-ray diffraction pictures, have already
given a number of examples of both groups. In addition to these two arrangements, there
are possibilities for some intermediate arrangements with an averaged distribution of all
ions about all spinel cation positions. Recent work such as that of Datta and Roy [27] and
Hafner and Laves [31] have shown that there are many ‘intermediate’ or ‘random’ spinels
which are in between the normal and inverse arrangements. These intermediate spinels are
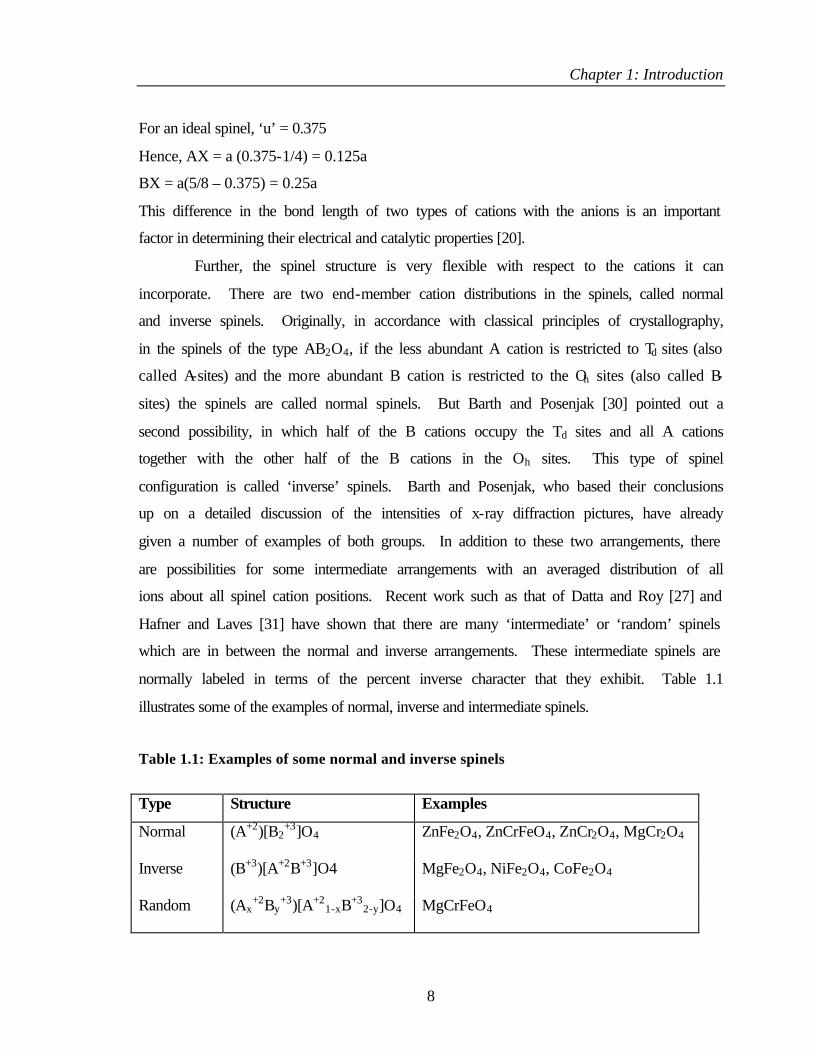
normally labeled in terms of the percent inverse character that they exhibit. Table 1.1
illustrates some of the examples of normal, inverse and intermediate spinels.
Table 1.1: Examples of some normal and inverse spinels
Type Structure Examples
Normal (A+2)[B2+3]O4 ZnFe2O4, ZnCrFeO4, ZnCr2O4, MgCr2O4
Inverse (B+3)[A+2B+3]O4 MgFe2O4, NiFe2O4, CoFe2O4
Random (Ax
+2By+3)[A+2
1-xB+32-y]O4 MgCrFeO4
Chapter 1: Introduction
9
Deviations from the ideal structure with orthorhombic and tetragonal symmetry are
known, although they are scarce and poorly characterized [20]. The distorted structure
may exist at relatively low calcinations temperature, but it transforms to the cubic structure
at high temperature. There are two origins for these distortions, viz. the Jahn-Teller effect
and superstructure formation. CuFe2O4 is a classical example of spinel, which exists both
in cubic and tetragonal form [28].
1.10. FERROSPINELS
Spinel oxides containing iron (III) are called ferrospinels. The interesting
electrical, magnetic and catalytic properties of these compounds are governed critically by
their chemical composition. Simple ferrospinels (AIIFe2O4), as well as mixed ferrite
spinels of the general formula AIIi-xBIII
xFe2O4 are known.
1.11. COPPER AND COBALT FERRITES
Neutron diffraction reveals that cobalt ferrite, CoFe2O4, is completely inverse and
has cubic structure [32]. Smit and Wijn reported a lattice constant of 8.38 Å for CoFe2O4
[33]. The measured magnetic moment is 4 µB, even though the theoretical value is 3 µB
[34]. In CoFe2O4, the ferric ions preferentially fill the tetrahedral sites, but there is room
for only half of them (eight). The remaining eight go on the octahedral sites, as do the
eight Co2+ ions. The arrangement of Co2+ and Fe3+ spins in Td sites are antiparallel and
leads to antiferromagnetic interaction. The Fe3+ ion moments will just cancel, but the
moments on the Co ions give rise to an uncompensated moment or magnetization.
Copper ferrite spinels show an interesting magnetic, electric, and crystallographic
[35-38] properties, which are induced by the mixed valencies of copper and iron atoms in
the two crystallographic sub lattices. Single crystals of CuFe2O4 are prepared by heating
stoichiometric amounts of Fe2O3 and CuO at 9500C in air for several hours [39]. CuFe2O4
has a transformation from cubic to a tetragonal structure [28,40]. In the cubic phase, the
Cu ions are situated both in the Td and Oh sites so that cubic copper ferrite has neither
normal nor completely inverse structure [41].
Chapter 1: Introduction
10
1.12. ACID-BASE AND REDOX PROPERTIES
Two important properties of ferrites directly related to catalytic performance and
are (i) acid-base property and (ii) redox property. Since the surface of ferrites may be
primarily related to their catalytic properties, the nature and concentration of the surface
sites can be evaluated by analysis of the interactions of suitable probe molecules and the
surfaces of these oxides. Acid sites in ferrites have been investigated by adsorption of a
basic molecule such as pyridine where as basic sites have been evaluated by adsorption of
acidic molecules such as carbon oxides. On the other hand, the donor-acceptor properties
of ferrite surfaces can be evaluated by adsorption studies of electron acceptors such as
7,7,8,8-Tetracyanoquinodimethane (TCNQ), 2,3,5,6-tetrachloro-1-4-benzoquinone
(chloranil) and p-dinitrobenzene (PDNB).
Redox property exhibited by transition metal ions is another important factor that
determine the high catalytic performance of ferrites towards many of the organic reactions
/ transformations. Robust structural features of the ferrospinels enable them to withstand even
reducing atmosphere and the lattice configuration remains unchanged even under the reduction
of Fe3+ to Fe2+ [42]. Original state can be regained by simple oxidation. This demonstrates that
Fe3+ can be easily replaced between Td and Oh sites by varying the concentration of other
cations.
1.13. CATALYTIC ACTIVITY OF SPINELS
The ample diversity of properties that the spinel compounds exhibit is derived from
the fact that the possibility of synthesis of multicomponent spinels by partial substitution of
cations in position A and B giving rise to compounds of formula (AxA’1-x)(ByB’2-y)O4.
This accounts for the variety of reactions in which they have been used as catalyst.
Moreover, partial substitution of A and B ions giving rise to complex oxides is possible
while keeping the spinel structure.
Spinels used in catalytic applications are generally synthesized by low temperature
co-precipitation methods [43-48] are sufficient to overcome the drawbacks such as low
surface area, varying morphology, inhomogeniety at atomistic level and large particle with
grain boundary, which are generally associated with high temperature preparation [49].
Chapter 1: Introduction
11
These methods have resulted in tailor-making of materials having desired morphology,
microscopic homogeneity, texture, chemical purity etc. Further, co-precipitation methods
generate Bronsted acid sites in different cationic environments in addition to Lewis sites,
which makes the catalyst active and effective for many of the organic transformations like
aromatic alkylation, acylation etc [43-48].
The interesting catalytic properties shown by spinels are controlled by various
properties such as, nature of ions, their charge and site distribution among Td and Oh sites.
Differential Neutron Diffraction (DND) studies on spinels revealed that the surface of
normal spinel consists of a mixture of (110) and (111) planes [50]. Beaufils and Barbaux
have compared the experimental results from DND with some models involving argon-
oxygen anions and concluded that these planes contain only Oh cations and oxygen anion,
respectively [50]. Later Ziolkowski and Barboux theoretically predicted the same [51].
Additionally, Jacobs et al [52] in a study, using LEIS (Low energy ion scattering, a
technique sensitive to the outer most atomic layer), revealed that spinel surface sites are
mainly Oh and, hence, the Oh cations are mainly exposed on the surface.
Spinels are reported to be thermally stable and they maintain enhanced and
sustained activity for a variety of industrially important reactions such as decomposition of
N2O and H2O2 [53-56], hydrodesulphurisation of petroleum crude [57], oxidation of CO,
H2, methane and methanol [58-62], oxidative dehydrogenation of hydrocarbons [63-68],
hydrogenation of organic compounds [69,70], treatment of automobile exhaust gases
[71,72], and dehydrogenation of ethyl benzene and alcohols etc [42,73-77]. In addition to
the above mentioned reactions, a variety of organic transformation reactions are carried out
over spinel oxides. For example, Roesky etal [78] reported an improved synthesis method
for indenes (from indanones) and styrenes (from acetophenones) by use of a ZnO/Al2O3
spinel catalyst.
Cobalt modified MgAl2O4 used for the production of ethene and other industrial
gases by diesel fuel pyrolysis [79]. Spinel catalysts are also employed for reducing NO by
using NH3 and propane as reductants [80,81]. Another synthetically important reaction is
the synthesis of methyl formate. Recently Sato et al [82] reported the vapour phase
dehydrocoupling reaction of methanol to methyl formate using CuAl2O4 catalyst.
Chapter 1: Introduction
12
Reactions such as hydrogenation of maleic anhydride to γ-butyrolactone and
tetrahydrofuran [83], oxidation of benzoic acid to phenol [84], reduction of fatty esters into
higher alcohols [85], methanation of CO and CO2 [86,87], synthesis of higher alcohols
[88] etc were successfully applied over various types of spinels.
Among the spinel compounds, ferrites have been used as effective catalysts for a
number of industrially important reactions as those mentioned above. The catalytic
effectiveness of ferrites for many such reactions arises because of the ease with which iron
can exchange its oxidation state between 2 and 3. Another important attribute of these
materials, from commercial stand point is their stability under extremely reducing
conditions, which is due to the spinel structure. Thus the reduction of Fe3+ to Fe2+ takes
place without altering the lattice configurations so that up on reoxidation, the original state
is retained [42]. In contrast to the spinel ferrites, the catalyst Fe2O3 loses its activity as it is
reduced to FeO and metallic iron.
Among various reactions, the most widely studied reaction using spinel type
catalyst is perhaps the catalytic selective oxidation of carbon monoxide. Selective removal
of CO from CO/H2 mixed gas is a key step for fuel cell or sensor technology [89].
Tamaura and Tabata [90] have found that at a reaction temperature of 3000C, oxygen
deficient ferrites can be used as an efficient material for decomposing CO2 gas (since there
is need to reduce CO2 emissions to the atmosphere by decomposition to C and oxygen in
order to reduce the greenhouse effect).
Among various ferrites, Co- and Cu- ferrites are found to be very active and have
been used widely for many industrially important reactions such as
hydrogenation/dehydrogenation, CO oxidation etc. For example, it is reported that both
CoFe2O4 and CuFe2O4 are highly active for the conversion of butene to butadiene [68].
Surface and lattice oxygen atoms participate in the reactions. Selectivity for the
dehydrogenation reaction was strongly dependent on the presence of gaseous oxygen in the
case of CoFe2O4, although the selectivity over the Cu catalyst was not a strong function of
gaseous oxygen. The copper catalyst was more active, but selectivity of the oxidation
reaction to butadiene was much poorer on the copper ferrite. A probable reason, as
Chapter 1: Introduction
13
suggested by the authors, for the difference in activity of two catalysts is the greater
reducibility of the copper ion relative to the cobalt.
CuFe2O4 shows an excellent performance towards the catalytic removal of NOx
and diesel soot particulates than any other ternary AB2O4 spinel-type oxides [72]. Among
the metal oxides, spinel type cobalt oxide (Co3O4) is the most active catalyst for oxidation
of CO [89]. CoFe2O4 shows excellent activity towards the chemical decomposition of
H2O2 [55]. Several workers reported the catalytic properties of CoFe3-xO4, NiFe3-xO4 and
CuFe3-xO4 (0 ≤ x ≤ 3) for H2O2 decomposition [53,54]. According to them the catalytic
activity follows the order Co > Cu > Ni and that Co1.5Fe1.5O4 is the most active one.
Recent reports reveal that ferrospinel systems prepared by low temperature
coprecipitation methods are highly efficient for aromatic alkylation and acylation
reactions. For example, CuCr-ferrites are found to be active for Friedel-Crafts alkylation
to form diphenylmethane [48]. Ni-, Co- and Cu-ferrites have been recently applied for
benzoylation of toluene [91]. Apart from acylation, modified ferrospinels are stable
catalysts for aromatic alkylation as well. One of the simplest ferrospinels, magnetite,
(Fe3O4), exhibits catalytic activity in production of important intermediates, e.g. in
alkylation of phenol with methanol to 2,6-xylenol, to the monomer of the thermoresistant
poly-(2,6-dimethyl)-phenylene oxide resin [92]. To improve the catalytic performance of
ferrites, modifying cations can be introduced into the structure.
Recently Sreekumar and Rao etal invoked the idea of using single phase ferrites
based on Ni, Co and Zn for various aromatic alkylation reactions such as aniline
methylation [46,93-95], pyridine methylation [44,45] and phenol methylation [96,97].
Spinel systems with different stoichiometry among divalent ions are extensively studied
for this reaction. In alkylation processes the activity is primarily attributed to the presence
of Lewis acid sites, as on Bronsted sites deactivation occur [98]. The structure of catalyst
may change simultaneously while catalyzing a reaction. For example, in a single-
component iron oxide catalyst the active magnetite phase developed from hematite in the
course of the alkylation of phenol [92]. In other words hematite, Fe2O3, with iron
exclusively in ferric state, was converted to Fe3O4 with partial reduction, containing Fe2+/3+
Chapter 1: Introduction
14
mixed valent ions in the [B] sublattice of octahedral sites. Hence, a part of Lewis acid
centers were modified during reaction.
1.14. ALKYLATION OF PHENOL
Alkyl phenols are compounds having the alkyl group substituted or replaced either
in the phenyl ring or in the OH of the side chain. These compounds are industrially
important, either used as directly or as chemical intermediates in the manufacture of
pharmaceuticals, pesticides, herbicides, plastics, special grade paints and a variety of
chemicals [99]. The important applications of some of the alkyl phenols are represented in
Table 1.2. The stringent specifications and the demand of these chemicals necessitate the
development of catalytic systems and the processes for the selective production.
Conventionally, alkyl phenols can be prepared by Friedel Crafts alkylation reaction
[99]. Friedel Craft’s alkylation reaction has got several disadvantages such as poor
selectivity, high capital cost, reactor corrosion, formation of byproducts and difficulty in
catalyst regeneration [100]. Recently, much attention has been paid to the development of
environmentally friendly catalysts for the production of industrially important alkylated
phenols. Solid acid catalysts are very important alternatives to protonic acids or Friedel
Craft’s type catalysts. The acidic and basic nature of solids provides a fascinating
opportunity to study these reactions by varying their catalytic characteristics. Numerous
reports on the production of these alkyl substituted phenols are available in literature, some
of which are patents. In the prior art, the catalysts used for the alkylation of the reactions
are ranging from ceramics, through zeolites to semiconducting metal oxides and mixed
metal oxides. Alkylating agents such as C1-C4 alcohols, various olefins, dimethyl
carbonate etc are widely employed for alkylation. The reaction is sensitive to acidic and
basic properties of the catalysts, reaction parameters such as temperature, mole ratio of
reactants and type of alkylating agent.
Metal oxides are good alternative to both zeolites and aluminium phenolate for
selective ortho alkylation using olefins/alcohols since with former undesired para alkylated
products can be brought down considerably [99]. On zeolites alkylation results a mixture
of O- and C- alkylated products [101-105]. Among various metal oxides, transition metal
Chapter 1: Introduction
15
oxides alone or in combination with other metal oxides are found to be the most active and
selective for ortho alkylation [106-108].
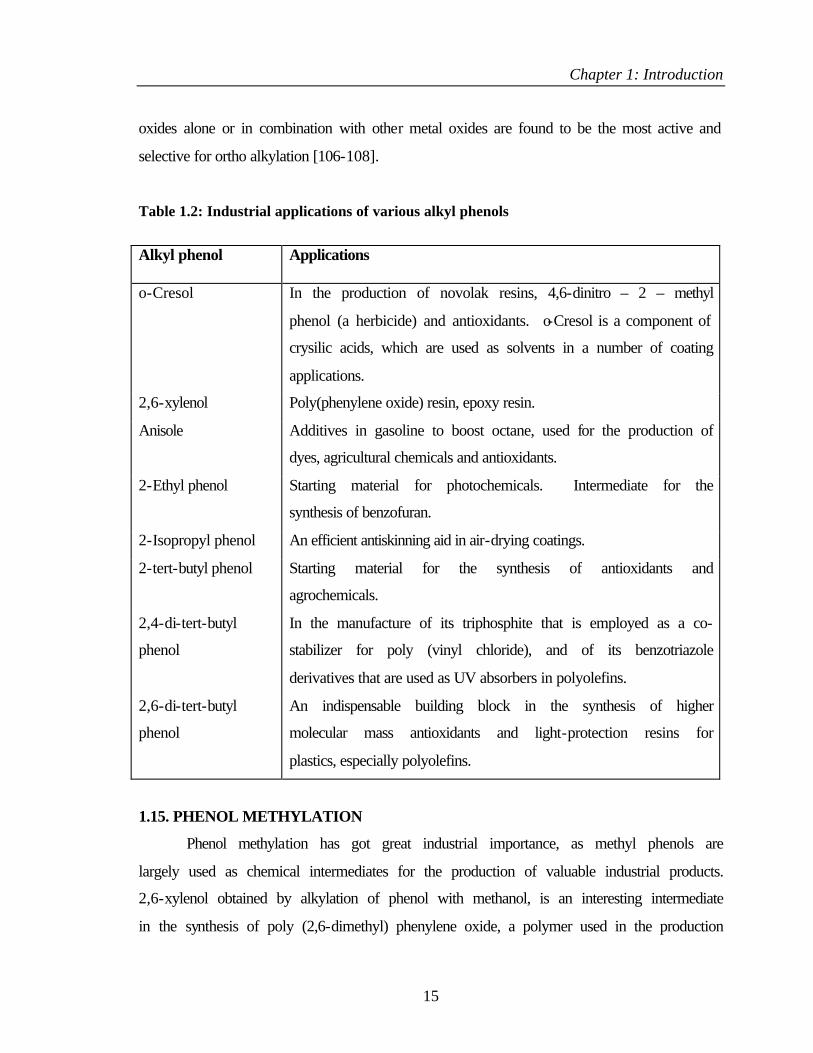
Table 1.2: Industrial applications of various alkyl phenols
Alkyl phenol Applications
o-Cresol In the production of novolak resins, 4,6-dinitro – 2 – methyl
phenol (a herbicide) and antioxidants. o-Cresol is a component of
crysilic acids, which are used as solvents in a number of coating
applications.
2,6-xylenol Poly(phenylene oxide) resin, epoxy resin.
Anisole Additives in gasoline to boost octane, used for the production of
dyes, agricultural chemicals and antioxidants.
2-Ethyl phenol Starting material for photochemicals. Intermediate for the
synthesis of benzofuran.
2-Isopropyl phenol An efficient antiskinning aid in air-drying coatings.
2-tert-butyl phenol Starting material for the synthesis of antioxidants and
agrochemicals.
2,4-di-tert-butyl
phenol
In the manufacture of its triphosphite that is employed as a co-
stabilizer for poly (vinyl chloride), and of its benzotriazole
derivatives that are used as UV absorbers in polyolefins.
2,6-di-tert-butyl
phenol
An indispensable building block in the synthesis of higher
molecular mass antioxidants and light-protection resins for
plastics, especially polyolefins.
1.15. PHENOL METHYLATION
Phenol methylation has got great industrial importance, as methyl phenols are
largely used as chemical intermediates for the production of valuable industrial products.
2,6-xylenol obtained by alkylation of phenol with methanol, is an interesting intermediate
in the synthesis of poly (2,6-dimethyl) phenylene oxide, a polymer used in the production
Chapter 1: Introduction
16
housings for electrical equipment and of pipes resistant to high pressure and temperature
[109,110].
Several papers and patents have been published on the alkylation of phenol with
methanol in the presence of different catalyst systems varying from MgO [111-118], Al2O3
[98,119-122], metal oxides [123,124], mixed metal oxides [125-127] and zeolites [101-
105]. The commercial process for the synthesis of o-cresol and 2,6-xylenol is based
mainly on MgO [117,118] and supported vanadium-iron mixed oxide [128]. Vapour phase
methylation of phenol has been investigated over various mixed metal oxides such as
MgO-based [115,116], Al2O3-based [129-131], Fe2O3-based [92,107,132-137], V2O5-
based [108,125,126], TiO 2-based oxides [111,138] and Al containing hydrotalcites
[139,140] and various other oxide systems [141-148].
A literature survey suggests that phenol methylation over both modified and
unmodified zeolites mostly results in a mixture of methylated products (both O- and C-
methylation), of which anisole is the predominant product. These are less selective for 2,6-
xylenol, the most demanded methylated product. The poor selectivity of ortho alkylates,
especially for 2,6-xylenol, due to pore constraint and fast deactivation due to coking made
industrial chemist to do move work on phenol methylation over promising metal oxide
catalysts. Oxides either alone or in combination with other oxides are so far the best for
selective formation of 2,6-xylenol. A variety of oxides have been used for studying phenol
methylation and among which either one of MgO, Al2O3 and Fe2O3 are mostly used as
one of the component. Oxides of transition metals based on Mn2+, Cu2+, Co+, Ni2+, V5+,
Cr3+ and Ti4+, SiO2, various phosphates, CeO2 etc were used as second component.
Oxides based on MgO and Al2O3 are two classic examples and have been widely
employed for phenol methylation. These two oxides are different in their acid-base
properties; MgO is basic and Al2O3 is acidic in nature. Their acid-base properties
considerably affect the product distribution. Considerable amount of anisole is observed
along with ortho alkylated products on alumina against predominant orthoalkylation over
MgO. This is due to the difference in nature of mode of interaction of phenol molecules
over these surfaces due to the difference in their acid-base properties. Hence it is proposed
Chapter 1: Introduction
17
that addition of any oxide component to MgO or Al2O3 modify their acid-base properties
and accordingly product selectivity.
It has been reported that the vapour phase reaction of phenol with methanol over
MgO gives 2,6-xylenol in an excellent yield. In the US patent 4, 933, 509, GE, USA
claims 92.7% conversion with 76.9% selectivity to 2,6-xylenol over MgO catalyst and by
the US patent 4,661,638 the claim is that the conversion could be improved to 97.0% by
promoting MgO with Mn oxide. Vapour phase synthetic method using TiO2-MgO
[111,115], MgO-CeO2 [116], MgO-CuO [149], MgO-MnO [150] and MgO-Mn2O3 [150]
has also been reported. This demonstrates that MgO is most favourable in the synthesis of
2,6-xylenol as compared with other catalysts that are used in the methylation of phenol.
1.15.1. Efficient methylation through synergism
It has been observed that both MgO and Al2O3 in combination with a transition
metal oxide component show better orthoselectivity than either MgO or Al2O3 alone.
Transition metal oxide itself or in combination with other transition metal oxides are found
to be effective for ortho methylation. Inoe and Enomoto [151] described liquid phase
alkylation using transition metal oxides including ZnO, Fe2O3, Cr2O3 and TiO2 and
observed predominant formation of orthoalkylates. Alkylation of phenol on V2O5
[108,125,126] and TiO 2 systems [111,138] are found to be more active than MgO and
SiO2. Addition of V2O5 to titania [108] helped to increase 2,6-xylenol selectivity and
reduced the formation of undesired products. The alkylation activity and stabilities of
vanadia was improved by the addition of chromia, which by itself is a poor alkylation
catalyst [125,126]. Similarly TiO2-ZnO [152] and Al2O3-ZnO [129] produce
predominantly ring alkylated products in which the high orthoselectivity is attributed to a
combination of weakly acidic sites and stongly basic sites. TiO2-MgO mixed oxides was
found to be more active and selective than pure MgO for 2,6-xylenol that has been
attributed to a combined effect of weak acidity and strong basicity of the catalyst
[111,115]. Recently Sato etal reported MgO-CeO2 mixed oxide systems are effective for
ortho methylation [116]. Catalysts containing MgO-MnO or MnO-Mn2O3 are found to be
more effective for 2,6-xylenol formation [150]. Grabowska et al reported ZnAl2O4 spinels
Chapter 1: Introduction
18
are active for phenol methylation and depending on the method of preparation selectivity
of ortho products vary [153].
In all the above cases, there are two disadvantages: (1) the catalyst composition,
particularly the active phase is not well defined and hence reproducibility is poor, and (2)
there is always para alkylation happening to an extent of at least 4%, thus making the
separation of impurities as an essential unit process. In the 1970’s a new type of catalysts
were developed, the main component being iron oxides (FexOy) system. Many
formulations based on this fundamental system were investigated [136]. Iron oxide
possesses acid-base property in between MgO and Al2O3 and hence the addition of iron
oxide to either MgO or Al2O3 results an increase of both phenol conversion and 2,6-
xylenol selectivity. Phenol methylation on a Fe-V-O/SiO2 catalyst is one of the new
catalytic processes, which have been developed in Japan during the last few years [135].
Grabowska et al studied the alkylation of phenol to o-cresol and 2,6-xylenol with MeOH in
the presence of Fe and Fe-Mg oxides [134]. The catalyst displayed high activity and
selectivity towards C-alkylation in ortho position. The active phase in the studied catalysts
is highly dispersed magnetite or mixed spinel of Fe(MgFe)O4 type [134]. Magnetite
containing salts of Cr, Si, K and V are found to be highly selective for ortho methylation
[154]. Similarly Fe2O3 in combination with other oxides such as CdO, SnO2, CeO2, NiO,
CoO, Cr2O3, ZrO2 etc show excellent selectivity in 2,6-xylenol formation [107,132-136].
Kotanigawa et al carried out phenol methylation over an MO-Fe2O3 catalyst containing Cu,
Mg, Ca, Ba, Zn, Mn, Co or Ni each as M [107]. All these systems show excellent
selectivity for ortho methylation. Thus a specific relation between iron and selective
formation of orthoalkylates seemed to exist.
From the literature survey it is clear that multicomponent oxide systems shows
better activity and selectivity (for ortho methylation) towards phenol methylation. It is
believed that a mixture of oxides brings out a combined effect, in other words synergistic
behavior, enhancing the catalytic activity. It is generally observed that multicomponent
oxide systems require relatively low temperature for better catalytic performance than the
individual components. For example, mixed oxides show their catalytic activity at the
temperature range between 300 and 4500C, and they are more selective for 2,6-xylenol
Chapter 1: Introduction
19
formation. Whereas simple oxides such as MgO, CeO2, Mn3O4 and ThO2 show their
catalytic activities at temperatures higher than 4500C. Kotanigawa et al reported binary
oxides of the system MO-Fe2O3 (where M = Mg, Ca, Ba, Co, Ni, Zn and Cu) are active
and selective for 2,6-xylenol at 3500C, whereas the individual oxide components such as
MgO, Fe2O3 etc require more than 4000C for achieving good conversion and high 2,6-
xylenol selectivity [107]. Thus the synergetic or combined effect of metallic components
has considerable influence on catalytic performance. Due to synergism, the individual
metallic ions show more homogeneity in their property towards a particular reaction. This
is possible only if the valence band energy of the metallic ions of mixed oxide system have
comparable energy. If VB energy is widely separated, proper overlapping between the
metallic orbitals is energetically unfavorable and hence reduces the catalytic effectiveness.
For example, addition of vanadia to titania or chromia helped to increase the activity and
2,6-xylenol selectivity. Whereas the effect of V2O5 addition to MgO or SiO2 is
insignificant with respect to phenol conversion and selectivity patterns. In the former case,
all the ions have valence 3d orbitals, energetically comparable and favourable for overlap.
Whereas for both Mg2+ and Si4+ involve 3s and 3p orbitals are empty and placed on the
unoccupied orbitals, which has got considerable energy difference with V 3d for any
overlap. In another case, calcined magnesium aluminium hydrotalcites is more active than
either MgO or Al2O3 [139, 140]. Here both Mg2+ and Al3+ ions fall same valence level,
which makes the situation more favourable for proper overlap and hence the catalyst
system behaves more or less like a single component rather than showing individual
property. This leads to the catalyst system function as an effective catalyst for the reaction.
1.16. OBJECTIVE OF THE PRESENT WORK
From the above literature survey, MgO catalysts promoted by the transition metal
oxides are the ones providing by far the good conversion of phenol to 2,6-xylenol. Later
several attempts have been made to develop a better catalysts to achieve much better
selectivity, more conversion and to lessen the harsh reaction conditions such as high
reaction temperature, the disadvantages existing for conventional MgO catalysts. Most of
the attempts were focused more of iron based oxide systems. Japanese patent 101 13561
Chapter 1: Introduction
20
awarded to Asahi based on again a multimetallic oxide catalyst, with iron oxide as a chief
component, claims 93% conversion and 97% selectivity.
Grabowska et al carried out phenol methylation over Fe2O3 and Fe3O4 prepared by
different methods [92]. The x- ray and magnetic investigation of these catalysts indicated
highly dispersed magnetite is the active phase. In order to bring down the reduction level
on heamatite and to reduce the crystallite size during the reaction, they modified iron
catalysts with various ions such as Si, K, Cr or Cs ions [92,154]. Considerably better
results were obtained on introducing Cr and Si by cooprecipitation. In this instance the
increase in crystallite size is minimized after the use. This is connected with the
advantageous influence of Si on the texture of iron catalysts and its action in protecting the
catalyst on sintering. A similar effect is observed with Cr. On the other hand, K and Cs
ions act as an activator of magnetite. Thus the following important criteria should be taken
into account while considering a multicomponent oxide systems based on iron oxide for
phenol methylation reaction.
(i) High phenol conversion
(ii) Good selectivity of 2,6-xylenol
(iii) The problem of deactivation should be tackled while introducing other metallic
componet to the iron oxide system. This can be achieved only by reducing the reduction
level on Fe2O3 and by controlling the crystallite size during the course of reaction.
(iv) Explore the possibility of synergism. This is possible only when the energy of valence
orbitals of involved ions have comparable energy.
Being Fe2O3 as chief component, by introducing other first row transition metal
ions such as V5+, Ni2+, Co2+, Zn2+, Mn2+ and/or Cu2+, the possibility of synergism can be
exploited. Iron oxides in combination with either one or more of these oxides are found to
be active and selective for 2,6-xylenol [107]. It has been observed that Cu2+ ion has got
promoting influence on selective formation of 2,6-xylenol [107,155]. For example,
Krishnasamy et al studied the influence of CuSO4 loading on alumina for phenol
methylation in the vapour phase and found that addition of CuSO4 to alumina enhance the
formation of 2,6-xylenol [155]. Copper-magnesium catalysts promote ortho alkylation of
the hydroxy aromatic compound in high yield, minimizing decomposition of the alkanol,
Chapter 1: Introduction
21
and have long life [149]. In yet another variation, US patent 4048239 describes a process
in which alkylation of phenol is carried out selectively at ortho position using aldehydes
and H2 in the presence of a Cu-Cr catalyst [156].
Sreekumar et al invoked the idea of using single phase ferrites based on Ni, Co and
Zn for phenol methylation reaction [96,97]. Spinel systems with different stoichiometry
among divalent ions are extensively studied for this reaction. All these catalysts are highly
selective towards ortho methylation. Among these catalysts, CoFe2O4 is found to be the
more active and selective towards phenol methylation and 2,6-xylenol formation. Rao et al
in a patent claim to make 2,6-xylenol with high selectivity and least amount of side
products, over a single phase ternary oxide system containing Co and Fe as metals [43].
CoFe2O4 shows excellent stability over a long period of time. Recently it has been
reported that CuFe2O4 show even better activity and selectivity towards 2,6-xylenol
formation than CoFe2O4 [47]. However CuFe2O4 deactivates in a reasonable period of
time due to sintering and considerable increase of crystallite size during the course of the
reaction. Kotanigawa et al [107] reported that over CuO-Fe2O3, the degree of reduction
obtained experimentally exceeds the calculated value, which infers that the reduction takes
place not only in heamatite, but also in cupric oxide. Additionally, Cu2+ ion promotes the
reduction of Fe3+ ion. Whereas in CoFe2O4, reaction hardly reduces the compound.
Moreover both Cu2+ and Co2+ ions have got diverse character with respect to its activity
towards reaction involving H2; the former is dehydrogenating agent whereas the latter is a
hydrogenating agent. The hydrogenation/dehydrogenation ability of these ions is very
important in reactions involving methanol. Reaction of phenol with methanol is always
associated with unavoidable methanol decomposition. In other words, the alkylating agent
methanol reacts through two simultaneous pathways, the methylation of phenol and the
decomposition of methanol itself. The gasification of methanol can be demonstrated by
CH3OH → CO + 2H2 (1)
CO + 3H2 → CH4 + H2O (2)
CO + H2O → CO2 + H2 (3)
Thus it is recommended to keep methanol/phenol mole ratio more than the required
stoichiometric ratio of 2 for 2,6-xylenol production. Hence efficiency of alkylation
Chapter 1: Introduction
22
catalyst should be discussed from the relation between the main reaction and the ability of
these catalysts to govern the undesired side reaction in favour of main reaction.
Elucidation of the nature of Cu and Co interaction in the spinel system is very
useful to understand the selective ortho methylation of phenol and in general to explore the
role of Cu-Co synergism on the catalytic performance in various industrially important
chemical processes. It is also to be emphasized here that the Cu-Co mixed system can act
as a dual reaction catalyst depending on the material preparation and reaction conditions.
For example, Cu-Co-multicomponent mixed oxide catalysts with different supports, like
ZnO and/or Al2O3, are being used in important industrial chemical processes such as
methanol reforming to H2 as well as low pressure methanol synthesis from syngas and it is
clear from the following equations (Eqs. 4-6) [157]:
CH3OH (l) ⇔ 2H2 (g) + CO (g); (4)
∆H0298 (∆G0
298) = + 128.1 (29) KJ mol-1
CH3OH (l) + H2O (1) ⇔ 3H2 (g) + CO2 (g); (5)
∆H0298 (∆G0
298) = + 130.9 (8.9) KJ mol-1
CO (g) + H2O (1) ⇔ H2 (g) + CO2 (g); water gas shift reaction (6)
∆H0298 (∆G0
298) = + 2.8(20.1) KJ mol-1
Above reactions clearly indicates that irrespective of the support, Cu-Co synergism alone
can induce the above reactions, which will affect the course of the reaction.
In the present study effects of simultaneous addition of Cu and Co are studied in a
series of Cu1-xCoxFe2O4 (x= 0, 0.25, 0.5, 0.75, 1.0) samples. Elucidation of the nature of
Cu and Co interaction in the spinel system is very useful to understand the selective
orthomethylation of phenol and in general to explore the role of Cu-Co synergism on the
catalytic performance in various industrially important chemical processes. Hence, the
following important objectives were taken into consideration:
• Preparation of a series of ferrospinels containing Cu and Co having a general
formula Cu1-xCoxFe2O4 ( where x = 0, 0.25, 0.50, 0.75 and 1 ) by co-precipitation
method.
Chapter 1: Introduction
23
• Characterization of Cu1-xCoxFe2O4 by physicochemical and spectroscopic methods
such as XRD, XRF, SEM, Surface area (by N2 sorption), TG-DTA, TPR,
Mossbauer and photoemission.
• Most important was the evaluation of the catalytic activity of the systems for
phenol methylation using methanol as the alkylating agent and to optimize the
process parameters to achieve the synthetically valuable C-alkylated products o-
cresol and 2,6-xylenol selectively and in better yield.
• Detailed analysis of the fresh and spent catalysts to understand the changes in
electronic, and structural features that occur during phenol methylation.
Photoemission and other characterization techniques such as Mössbauer, TPR,
TPD, TG-DTA etc have been employed for the above purpose.
• Acid-base properties of the catalysts by in situ FTIR technique using pyridine and
CO2 as probe adsorbate. Evaluation of donor-acceptor properties of these materials
using electron acceptors having different electron affinity values to understand the
strength and distribution of electron donor sites.
• Phenol alkylation by using various alkylating agents such as dimethyl carbonate,
ethanol, isopropanol and isobutene and to compare the catalytic performance
between various alcohols or alkene as alkylating agent.
• Adsorption behavior of both reactants and products of phenol methylation such as
phenol, methanol, o-cresol, 2,6-xylenol, anisole and HCHO over the surfaces of
selected compostions of the system Cu1-xCoxFe2O4 by in situ FTIR technique to get
an insight on the mechanism of phenol methylation over these catalyst surfaces.
Chapter 1: Introduction
24
1.17. REFERENCES 1 J. Halber, in J. A. Thomas and K. I. Zamaraev (Eds), Perspecitves in Catalysis, Blackwell
Scientific Publications, p-371 (1992).
2 J. M. Thomas, Sci. Am., 266 (1992) 112.
3 H. Hattori, Stud. Surf. Sci. Catal., 78 (1993) 35.
4 Catalytic chemistry of solid-state inorganics, W. R. Moser and J. Happel, Eds., Ann. N. Y.
Acad. Sci., 272 (1976) 1-73.
5 A. J. Marchi, J. I. Di Cosimo and C. R. Apesteguia, in “Proceedings, 4th International
Symposium on Scientific Bases for the preparation of Heterogeneous catalysts”, Louvain-
la Neuve, Paper H-7, 1986.
6 A. J. Marchi, J. I. Di Cosimo and C. R. Apesteguia, in “Proceedings, 9th International
Congress on Catalysis” (J. M. Philips and M. Ternan, Eds.), Vol. 2, p. 529-536, Chem.
Institute of Canada, Ottawa, 1988.
7 P. Courty, C. Marcilly, in Preparation of Catalysts I, B. Delmon, P. A. Jacobs and G.
Poncelet (Eds), Stud. Surf. Sci. Catal., 1 (1976) 119.
8 J. A. Scwarz, C. Contescu and A. Contescu, Chem. Rev., 95 (1995) 484.
9 L. Hench and J. K. West, Chem. Rev., 90 (1990) 33.
10 M. Schneider and A. Baiker, Catal. Rev. Sci. & Eng., 37 (1995) 515.
11 R. Gopichandran and K. C. Patil, Mater. Lett., 12 (1992) 437.
12 S. S. Manoharan and K. C. Patil, J. Amer. Ceram. Soc., 75 (1992) 1012.
13 A. K. Cheetand and P. Day, Solid State Chemistry Techniques, Oxford University Press,
1987.
14 G. M. Schwab, E. Roth, C. H. Grinzoz and N. Mavrakis, in “Structure and properties of
solid surfaces”(R. Gomer and C. S. Smith, Eds.), Univ. Chicago Press, Chicago, 1953.
15 J. P. Suchet, “Chemical Physics of Semiconductors”, Chap.5, p.82, 83, Van Nostrand,
London, 1965.
16 A. Miller, J. Appl. Phys., 30 (1959) 245.
17 K. Tanabe, M. Misono and H. Hattori, Stud. Surf. Sci. Catal., Vol. 51, New Solid Acids
and Bases and Their Catalytic Properties, 1989.
18 F. C. Romeijn, Philips Research Reports, 18 (1953) 304.
19 E. J. W. Verwey and E. L. Heilmann, J. Chem. Phys., 15 (1947) 174.
20 G. Blasse, Philips Research Rep. Supplement, 3 (1964) 40.
Chapter 1: Introduction
25
21 J. Smit and H. P. J. Wijn, Ferrite, Philips Technical Library, Eindhoven, The Netherlands,
p. 137, 1959.
22 E. W. Gorter, Philips Res. Rept., 9 (1954) 302.
23 E. J. W. Verwey, F. De Boer and J. H. Van Santen, J. Chem. Phys., 16 (1948) 1091.
24 B. Viswanathan and V. R. K. Murthy (eds.), Ferrite Materials (Science and Technology),
Narosa Publishing House, 1990.
25 A. Meenakshi Sundaram, V. Sreenivasan, Phys. Status Solidi A, 69 (1982) K15.
26 R. K. Datta, R. Roy, J. Am. Ceram. Soc., 50 (1967) 578.
27 R. K. Datta and K. Roy, Nature, 191 (1961) 169.
28 E. Prince and R. G. Trueting, Acta Cryst., 9 (1956) 1025.
29 R. K. Datta, R. Roy, Am. Mineral, 53 (1968) 1456.
30 T. F. W. Barth and E. Posenjak, Zs. Kristallographie, 84 (1952) 325.
31 S. Hafner and F. Laves, Z. Krist., 115 (1961) 321.
32 E. Prince, Phys. Rev., 102 (1956) 674.
33 J. Smit and H. P. J. Wijn, Advan. Electron. Electron Phys., 6 (1954) 83.
34 R. Pauthenet, Compt. Rend., 230 (1950) 1842.
35 N. Namba and S. Kobayashi, Jap. J. appl. phys., 17 (1978) 1819.
36 V. A. M. Brabers and J. Klerk, Thermochimica Acta, 18 (1977) 287.
37 V. A. M. Brabers, Mat. Res. Bull., 18 (1983) 861.
38 E. Kester and B. Gillot, J. Phys. Chem. Solids, 59 (1998) 1259.
39 T. Miyadai, Y. Matsuo and S. Miyahara, J. Phys. Soc. Japan, 19 (1964) 1747.
40 T. Inoue and S. Iida, J. Phys. Soc. Japan, 13 (1958) 656.
41 L. Weil, F. Bertaut and L. Bochirol, J. Phys. Radium, 11 (1950) 208.
42 C. S. Narasimhan and C. S. Swamy, Appl. Catal., 2 (1982) 315.
43 B. S. Rao, K. Sreekumar and T. M. Jyothi, Indian Patent, 2707/98, 1998.
44 K. Sreekumar, T. Mathew, R. Rajgopal, R. Vetrivel and B. S. Rao, Catal. Lett., 65 (2000)
99.
45 K. Sreekumar, T. Mathew, B. M. Devassy, R. Rajgopal, R. Vetrivel and B. S. Rao, Appl.
Catal, A:General, 205 (2001)11.
46 K. Sreekumar, T. Mathew, S. P. Mirajkar, S. Sugunan and B. S. Rao, Appl. Catal,
A:General, 201 (2000) L1.
47 B. S. Rao, T. Mathew, N. R. Shiju and R. Vetrivel, Indian Patent filed.
48 S. Ghorpade, V. S. Darshane and S. G. Dixit, Appl. Catal. A:General, 166 (1998) 135.
Chapter 1: Introduction
26
49 P. S. Anilkumar, J. J. Shrotri, S. D. Kulkarni, C. E. Deshpande and S. K. Date, Mater.
Lett., 27 (1996) 293.
50 J. P. Beaufils and Y. Barbaux, J. Appl. Cryst., 15 (1982) 301.
51 J. Ziolkowski and Y. Barbaux, J. Mol. Catal., 67 (1991) 199.
52 J. P. Jacobs, A. Maltha, J. R. H. Reintjes, T. Drimal, V. Ponec, H. H. Brogersma, J.
Catal., 147 (1994) 294.
53 J. R. Goldstein and A. C. C. Tseung, J. Catal., 32 (1974) 452.
54 A. I. Onuchukwu, J. Chem. Soc. Faraday Trans. I., 80 (1984) 1447.
55 H. M. Cota, J. Katan, M. Chim and F. J. Schoenweis, Nature, 203 (1964) 1281.
56 A. C. C. Tseung and J. R. Goldstein, J. Phys. Chem., 76 (1972) 3646.
57 G. K. Boreskov, V. V. Proporski and V. A. Sezonov, “Proc. 4th Inter. Congr. Catalysis”,
Moscow, 1963.
58 K. Omata, T. Takada, S. Kasahara and M. Yamada, Appl. Catal., 146 (1996) 255.
59 J. Ghose and K. S. R. C. Murthy, J. Catal., 162 (1996) 359.
60 A. A. Awe, G. Miliades and J. C. Vickerman, J. Catal., 62 (1980) 202.
61 K. S. R. C. Murthy and J. Ghose, J. Catal., 147 (1994) 171.
62 F. Severino, J. Brito, O. Carias and J. Lainc, J. Catal., 102 (1986) 172.
63 W. L. Kehl and R. J. Rennard, U. S. Patent, 3,450,787 (1969).
64 H. H. Kung and M. C. Kung, J. Phys. Chem., 84 (1980) 383.
65 J. Sloczynski, J. Ziolkowski, B. Grzybowska, R. Grabowski, D. Jachewicz, K. Wcislo and
L. Gengembre, J. Catal., 187 (1999) 410.
66 E. Finocchio, G. Busca, V. Lorenzelli and R. J. Willey, J. Catal., 151 (1995) 204.
67 W. R. Cares and J. W. Hightower, J. Catal., 23 (1971) 193.
68 R. J. Rennard and W. L. Kehl, J. Catal., 21 (1971) 282.
69 J. Jenck and J. E. Germain, J. Catal., 65 (1980) 133, 141.
70 J. W. Evans, P. S. Casey, M. S. Wainwright, D. L. Trimm and N. W. Cant, Appl. Catal., 7
(1983) 31.
71 W. F. Shangguan, Y. Teraoka and S. Kagawa, Appl. Catal. B: Environmental, 16 (1998) 149.
72 W. F. Shangguan, Y. Teraoka and S. Kagawa, Appl. Catal. B: Environmental, 8 (1996) 217.
73 N. John Jebarathinam, M. Eswaramoorthy and V. Krishnasamy, Appl. Catal., 145 (1996)
57.
74 W. S. Chen, M. D. Lee and J. F. Lee, Appl. Catal., 83 (1992) 201.
75 K. Sreekumar, Ph. D Theses, Submitted to Cochin University of Science and Technology,
Chapter 1: Introduction
27
Kochi, February 1999.
76 G. R. Dube and V. S. Darshane, J. Mol. Catal., 79 (1993) 285.
77 Sreekumar, K.; Thomas, M.; Jyothi, T. M.; Biju, M. D.; Sugunan, S.; Rao, B. S., Pol. J.
Chem., 74 (2000) 509.
78 R. Roesky, J. Weiguny, H. Bestgen and U. Dingerdissen, Appl. Catal. A., 176 (1999) 213.
79 G. Xanthopoulou, Appl. Catal. A: General, 182 (1999) 285.
80 J. Sloczynski, J. Jans, T. Machej, J. Rynkowski and J. Stoch, Appl. Catal. B:
Environmental, 24 (2000) 45.
81 G. Fierro, S. Morpurgo, M. Lo Jacono, M. Inversi and I. Pettiti, Appl. Catal. A: General,
166 (1998) 407.
82 S. Sato, M. Iijima, T. Nakayama, T. Sodesawa and F. Nozaki, J. Catal., 169 (1997) 447.
83 G. L. Castiglioni, A. Vaccari, G. Fierro, M. Inversi, M. Lo Jacono, G. Minclli, I. Pettiti, P.
Porta and M. Gazzano, Appl. Catal. A: General, 123 (1995) 123.
84 J. Miki, M. Asanuma, Y. Tachibana and T. Shikada, J. Catal., 151 (1995) 323.
85 B. Miya, F. Hoshino and I. Iwasa, J. Catal., 5 (1966) 401.
86 P. Schoubye, J. Catal., 14 (1969) 238.
87 H. Kato, T. Sano, Y. Wada, Y. Tamaura, M. Tsuji, T. Tsuji and S. Miyazaki, J. Mater.
Sci., 30 (1995) 6350.
88 W. S. Epling, G. B. Hoflund, W. M. Hartand and D. M. Minahan, J. Catal., 169 (1997)
438.
89 S. H. Oh and R. M. Sinkevitch, J. Catal., 142 (1993) 254.
90 Y. Tamaura and M. Tabata, Nature, 346 (1990) 255.
91 C.G. Ramankutty and S. Sugunan, Appl. Catal. A: General, 218 (2001) 39.
92 H. Grabowska, W. Kaczmarczyk and J. Wrzyszcz, Appl. Catal., 47 (1989) 351.
93 K. Sreekumar, T. M. Jyothi, T. Mathew, M. B. Talawar, S. Sugunan and B. S. Rao, J.
Mol. Catal. A: Chem., 159 (2000) 327.
94 K. Sreekumar, T. Raja, B. P. Kiran, S. Sugunan and B. S. Rao, Appl. Catal. A, 182 (1999)
327.
95 K. Sreekumar, T. M. Jyothi, M. B. Talawar, B. P. Kiran, B. S. Rao and S. Sugunan, J.
Mol. Catal. A: Chem., 152 (2000) 225.
96 K. Sreekumar and S. Sugunan, Appl. Catal. A, 230 (2002) 245.
97 K. Sreekumar and S. Sugunan, J. Mol. Catal. A: Chemical, 185 (2002) 259.
98 E. Santacesaria, D. Grasso, D. Gelosa and S. Carra, Appl. Catal., 64 (1990) 83.
Chapter 1: Introduction
28
99 Fiege, H.; Bayer, A. G.; Leverkusen. Federal Republic of Germany, in “Ullmann's
Encyclopedia of Industrial Chemistry”, A19, 324.
100 S. Patinuin, B. S. Friedman, in “Alkylation of Aromatics with Alkenes and Alkanes in
Friedel Crafts and Related Reactions”, Vol. 3, G. A. Olah (ed.), Interscience, New York,
p. 75, 1964.
101 X-W. Li, M. Han, X-Y. Liu, Z-F. Pei and L-Q. She, Stud. Surf. Sci. Catal., 105 B (1997)
1157.
102 K. Zhang, C. Huang, H. Zhang, S. Xiang, S. Liu, D. Xu and H. Li, Appl. Catal. A, 166
(1998) 89.
103 K. Zhang, H. Zhang, G. Xu, S. Xiang, D. Xu, S. Liu and H. Li, Appl. Catal. A, 207 (2001)
183.
104 L. Garcia, G. Giannetto, M. R. Goldwasser, M. Guisnet and P. Magnoux, Catal. Lett., 37
(1996) 121.
105 M. Marczewski, G. Perot and M. Guisnet, Stud. Surf. Sci. Catal., 41 (1988) 273.
106 M. Inoue and S. Enomoto, Chem. Pharm. Bull., 20 (1972) 232.
107 T. Kotanigawa, M. Yamamoto, K. Shimakowa and Y. Yoshida, Bull. Chem. Soc. Jpn., 44
(1971) 1961.
108 V. Venkatrao, K. V. R. Chary, V. Durgakumari and S. Narayanan, Appl. Catal., 61 (1990)
89.
109 A. S. Hay, G. F. Endres and J. W. Eustance, J. Amer. Chem. Soc., 81 (1959) 6335.
110 A. S. Hay, J. Polymer Sci., 58 (1962) 581.
111 K. Tanabe, H. Hattori, T. Sumiyoshi, K. Tamaru and T. Kondo, J. Catal., 53 (1978) 1.
112 S. Sato, K. Koizumi and F. Nozaki, Appl. Catal. A, 133 (1995) L7.
113 T-F. Tsai and F-L. Wang, Catal. Lett., 73 (2001) 167.
114 W. C. Choi, J. S. Kim, T. H. Lee and S. I. Woo, Catalysis Today, 63 (2000) 229.
115 K. Tanabe and T. Nishizaki, in “Proc. 6th Internat. Congr. Catal”., London, G. C. Bond,
P. B. Wells and F. C. Thompkins (eds.), p. 863 (1977).
116 S. Sato, K. Koizumi and F. Nozaki, J. Catal., 178 (1998) 264.
117 G. L. Warner (General Electric Co., USA) US Patent 4933509 (1990).
118 R. A. Battista, J. G. Bennett, J. J. Kokoszka, F. L. Tungate (General Electric Co., USA)
US Patent, 4661638 (1987).
119 M. Marczewski, G. Perot and M. Guisnet, React. Kinet. Catal. Lett., 57 (1996) 21.
120 R. Pierantozzi and A. F. Nordquist, Appl. Catal., 21 (1986) 263.
Chapter 1: Introduction
29
121 P. Belitrame, P. L. Belitrame, P. Carniti, A. Castelli and L. Forni, Appl. Catal., 29 (1987)
327.
122 M. C. Samolada, E. Grigoriadou, Z. Kiparissides and I. A. Vasalos, J. Catal., 152 (1995)
52.
123 C. Bezouhanova and M. Al-Zihari, Appl. Catal., 83 (1992) 45.
124 S. Sato, K. Koizumi and F. Nozaki, Appl. Catal. A, 133 (1995) L7.
125 S. Narayanan, V. Venkatrao and V. Durgakumari, J. Mol. Catal., 52 (1989) L29.
126 V. Venkatrao, V. Durgakumari and S. Narayanan, Appl. Catal., 49 (1989) 165.
127 H. Grabowska, W. Mista, J. Trawczynski, J. Wrzyszc and M. Zawadzki, Res. Chem.
Intermed., 27 (2001) 305.
128 Japanese Patent, 10113561 (1998), Asahi, Japan.
129 K. Tanabe, K. Shimazu and H. Hattori, J. Catal., 57 (1979) 35.
130 F. M. Bautista, J. M. Campelo, A. Garcia, D. Luna, J. M. Marinas and A. A. Romero,
React. Kinet. Catal. Lett., 63 (1998) 261.
131 F. M. Bautista, J. M. Campelo, A. Garcia, D. Luna, J. M. Marinas and A. Romero, J. M.
Navio and M. Macias, Appl. Catal. A, 99 (1993) 161.
132 T. Kotanigawa, Bull. Chem. Soc. Jpn., 47 (1974) 950.
133 T. Kotanigawa and K. Shimakowa, Bull. Chem. Soc. Jpn., 47 (1974) 1535.
134 H. Grabowska, J. Jablonski, W. Mista and J. Wrzyszc, Res. Chem. Intermed., 22 (1996)
53.
135 M. Misono and N. Nojiri, Appl. Catal., 64 (1990) 1.
136 B. E. Leach, US Patent, 4227024 (1980).
137 K. A. Adey, F. S. Yates and J. H. Young, US Patent 4471149 (1984).
138 J. M. Campelo, A. Garcia, D. Luna, J. M. Marinas and M. S. Moreno, Stud. Surf. Sci.
Catal., 41 (1988) 249.
139 S. Velu and C. S. Swamy, Appl. Catal. A, 119 (1994) 241.
140 S. Velu and C. S. Swamy, Appl. Catal. A, 145 (1996) 141, 225.
141 R. Pierantozzi and A. F. Nordquist, Appl. Catal., 21 (1986) 263.
142 T. Yamanaka, Bull. Chem. Soc. Jpn., 49 (1976) 2669.
143 F. Nozaki and I. Kimura, Bull. Chem. Soc. Jpn., 50 (1977) 614.
144 J. Xu, A-Z. Yan and Q-H. Xu, React. Kinet. Catal. Lett., 62 (1997) 71.
145 E. Santa, M. Diserio, P. Ciambelli, D. Gelosa and S. Carra, Appl. Catal., 64 (1990) 101.
146 S. Balsama, P. Beltrame, P. L. Beltrame, P. Carniti, L. Forni and G. Zuretti, Appl. Catal.,
13
Chapter 1: Introduction
30
13 (1984) 161.
147 P. D. Chantal, S. Kaliaguine and J. L. Grandmaison, Appl. Catal., 18 (1985) 133.
148 Z. Fu and Y. Ono, Catal. Lett., 21 (1993) 43.
149 J. G. Bennett and G. R. Chambers, European Patent, 127833 (1984).
150 T. G. Lin, L. W. Ho, A. N. Ko and Y. J. Perng, US Patent, 4876398 (1989).
151 M. Inoue and S. Enomoto, Chem. Pharm. Bull., 24 (1976) 2199.
152 K. Tanabe, C. Ishiya, I. Matsuzaki, I. Ichikawa and H. Hattori, Bull. Chem. Soc. Jpn., 45
(1972) 47.
153 H. Grabowska, W. Mista, J. Trawczynski, J. Wrzyszcz and M. Zawadzki, Res. Chem.
Intermed., 27 (2001) 305.
154 J. Wrzyszcz, J. Cmielewska, Z. Jaworska-galas, W. Kaczmarczyk, K. Mazur and W.
Mista, Polish Patent, 159870 (1993).
155 V. Krishnasamy, T. V. Subramaniam and S. Soundararajan, J. Indian Chemical Society,
59 (1982) 1067.
156 W. E. Smith, US Patent, 4048239 (1977).
157 S. Velu, K. Suzuki, M. Okazaki, M. P. Kapoor, T. Osaki and F. Ohashi, J. Catal., 194
(2000) 373.
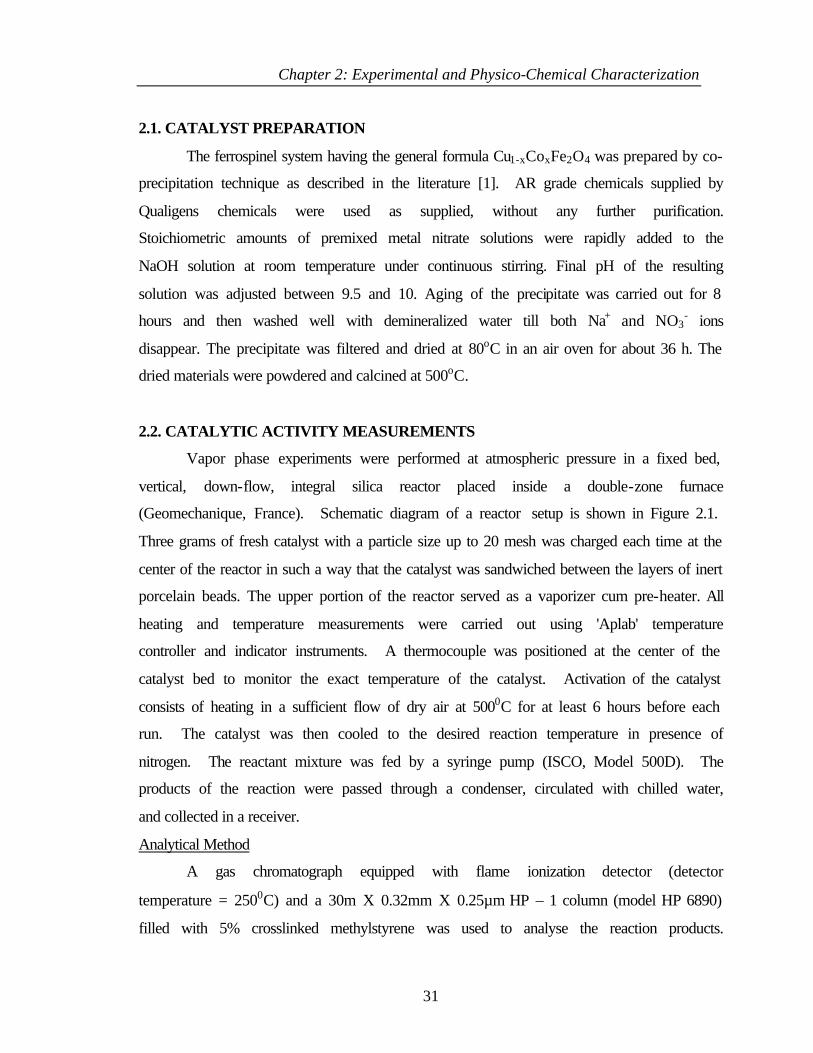
Chapter 2: Experimental and Physico-Chemical Characterization
31
2.1. CATALYST PREPARATION
The ferrospinel system having the general formula Cu1-xCoxFe2O4 was prepared by co-
precipitation technique as described in the literature [1]. AR grade chemicals supplied by
Qualigens chemicals were used as supplied, without any further purification.
Stoichiometric amounts of premixed metal nitrate solutions were rapidly added to the
NaOH solution at room temperature under continuous stirring. Final pH of the resulting
solution was adjusted between 9.5 and 10. Aging of the precipitate was carried out for 8
hours and then washed well with demineralized water till both Na+ and NO3- ions
disappear. The precipitate was filtered and dried at 80oC in an air oven for about 36 h. The
dried materials were powdered and calcined at 500oC.
2.2. CATALYTIC ACTIVITY MEASUREMENTS
Vapor phase experiments were performed at atmospheric pressure in a fixed bed,
vertical, down-flow, integral silica reactor placed inside a double-zone furnace
(Geomechanique, France). Schematic diagram of a reactor setup is shown in Figure 2.1.
Three grams of fresh catalyst with a particle size up to 20 mesh was charged each time at the
center of the reactor in such a way that the catalyst was sandwiched between the layers of inert
porcelain beads. The upper portion of the reactor served as a vaporizer cum pre-heater. All
heating and temperature measurements were carried out using 'Aplab' temperature
controller and indicator instruments. A thermocouple was positioned at the center of the
catalyst bed to monitor the exact temperature of the catalyst. Activation of the catalyst
consists of heating in a sufficient flow of dry air at 5000C for at least 6 hours before each
run. The catalyst was then cooled to the desired reaction temperature in presence of
nitrogen. The reactant mixture was fed by a syringe pump (ISCO, Model 500D). The
products of the reaction were passed through a condenser, circulated with chilled water,
and collected in a receiver.
Analytical Method
A gas chromatograph equipped with flame ionization detector (detector
temperature = 2500C) and a 30m X 0.32mm X 0.25µm HP – 1 column (model HP 6890)
filled with 5% crosslinked methylstyrene was used to analyse the reaction products.
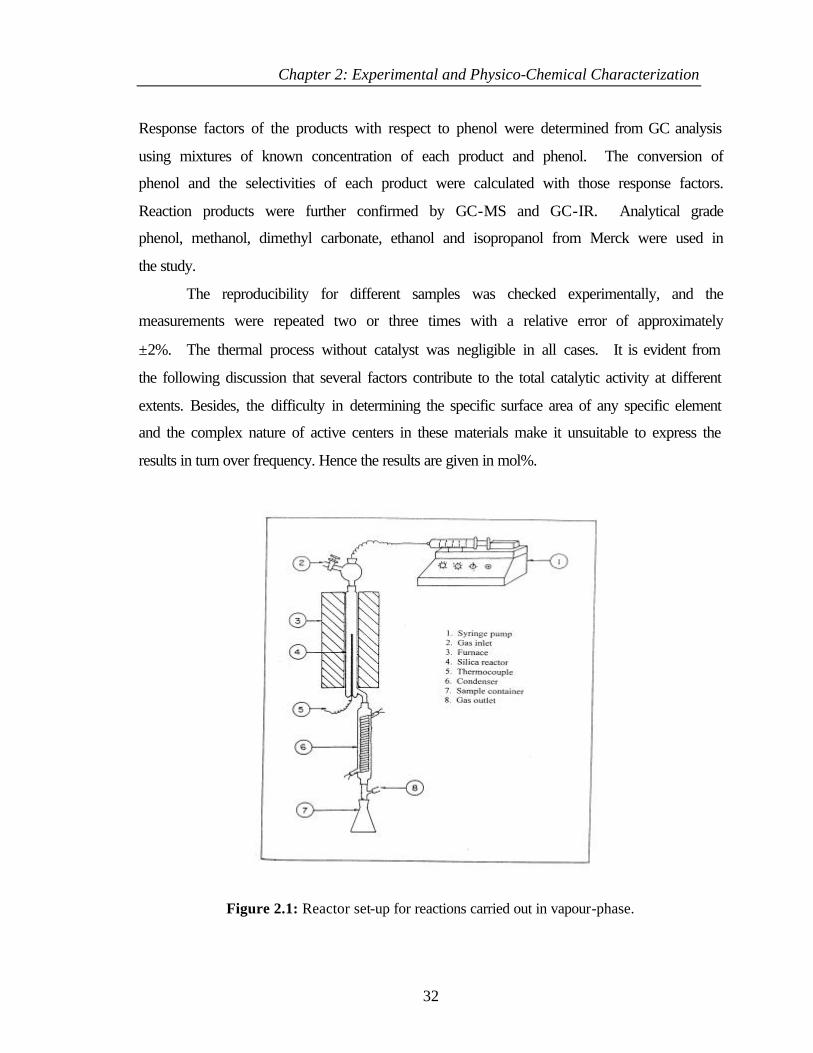
Chapter 2: Experimental and Physico-Chemical Characterization
32
Response factors of the products with respect to phenol were determined from GC analysis
using mixtures of known concentration of each product and phenol. The conversion of
phenol and the selectivities of each product were calculated with those response factors.
Reaction products were further confirmed by GC-MS and GC-IR. Analytical grade
phenol, methanol, dimethyl carbonate, ethanol and isopropanol from Merck were used in
the study.
The reproducibility for different samples was checked experimentally, and the
measurements were repeated two or three times with a relative error of approximately
±2%. The thermal process without catalyst was negligible in all cases. It is evident from
the following discussion that several factors contribute to the total catalytic activity at different
extents. Besides, the difficulty in determining the specific surface area of any specific element
and the complex nature of active centers in these materials make it unsuitable to express the
results in turn over frequency. Hence the results are given in mol%.
Figure 2.1: Reactor set-up for reactions carried out in vapour-phase.
Chapter 2: Experimental and Physico-Chemical Characterization
33
2.3. PHYSICOCHEMICAL CHARACTERIZATIONS
2.3.1. Introduction
The ultimate goal of research in heterogeneous catalysis is to correlate the structure
and composition of a catalyst with its performance. Catalyst performance is judged in
terms of its activity, product selectivity and life. Catalyst characterization is one of the
crucial aspects of catalyst design since it gives information about crystallinity, surface
structure, nature of active sites, particle size and morphology, acidity, and other
characteristic features.
The calcined samples were characterized by adopting various physico-chemical
methods such as X-ray diffraction analysis, infrared spectroscopy, surface area and pore
volume measurements, SEM, TG-DTA, TPR, XPS, adsorption studies of electron
acceptors and FTIR adsorption of pyridine and CO2.
The present chapter gives a brief account of the theory and principle of various
characterization techniques used for the current study. The procedure for each
experimental technique is described in this chapter. Though the results of some of the
characterization techniques are presented in this chapter, characterization techniques such
as XPS, Mössbauer, TPR etc, which are extensively used for comparing both fresh and
spent catalysts are included in chapter 4. The acid-base properties of the catalyst system
are discussed in detail in this chapter.
2.3.2. Theory and experimental procedure
2.3.2.1. X-Ray diffraction analysis
The diffraction patterns can be used to identify various phases in a catalyst.
Diffraction can occur whenever Bragg’s law nλ = 2d sinθ is satisfied. The XRD method
involves the interaction between the incident monochromatized X-rays (like Cu Kα or
MoKα source) with the periodic structures of polycrystalline material. Bragg peaks are
measured by observing the intensity of the scattered radiation as a function of scattering
angle 2θ. The interplanar distances or d-spacings are calculated from the values of the
peaks observed from the above Bragg equation, where, ‘n’ is order of reflection and the
values are 1,2,3 etc. The width of diffraction peaks carries information on the dimensions
Chapter 2: Experimental and Physico-Chemical Characterization
34
of the reflecting planes. Diffraction lines from the perfect crystals are very narrow. For
crystals with size below 100 nm, line broadening occurs due to incomplete destructive
interference in scattering directions where the X-rays are out of phase. The Debye-
Scherrer formula [2],
Dhkl = 0.9λ/B cosθ (1)
is used to estimate the crystallite size, where Dhkl, λ, B and θ are the volume averaged particle
diameter, x-ray wavelength, full width at half maximum (FWHM) and diffraction angle,
respectively. It is possible to find out the symmetry and cell constant of a given powder by x-
ray diffraction technique.
Powder X-ray diffraction (XRD) patterns of the all catalysts reported in this thesis
were recorded using a Rigaku Geigerflex instrument equipped with Cu Kα radiation (λ =
1.5405 Å) with Ni-filter.
2.3.2.2. Diffuse reflectance infrared spectroscopy
Infrared techniques have got remarkable importance in the field of heterogeneous
catalysis and in the field of surface chemistry and catalysis over metal oxides. A variety of
IR techniques have been used in order to get information on the surface chemistry of
different solids. With respect to the characterization of metal oxide catalysts two
techniques largely predominate, namely, the transmission/absorption and the diffuse
reflection techniques.
In recent years, the use of IR spectroscopy in the diffuse reflectance mode is grown
strongly since this technique does not need particular efforts in the sample preparation (the
powder is simply deposited on a sample holder), especially useful in the case of highly
scattering samples employed in heterogeneous catalysis. The theory of diffuse reflectance
spectra was developed by Kubelka and Munk [3] and extended by Kortun et al [4]. According
to this theory,
f(Rα) = (1-Rα)2/2Rα = K/S (2)
where Rα is the diffuse reflectance from an ‘infinitely’ thick sample, K is the extinction
coefficient and S is a scattering coefficient.
Chapter 2: Experimental and Physico-Chemical Characterization
35
It is known that structure plays an important role in the catalytic activity of many
heterogeneous systems. In many cases, the positions of the infrared bands are sensitive to
the changes in the ratio of metal cations in the catalyst composition. Since, in spinels
metal ions are distributed in two different environments, the spinel phase formation can be
very well assigned by the appearance of two broad IR bands.
The IR spectrum of the ferrite samples reported here were recorded through a DR
mode (Shimadzu) in the range 400 cm-1 to 1000 cm-1.
2.3.2.3. Surface area determination by BET method
The Brunauer-Emmett-Teller (BET) method is the most widely used procedure for
the determination of surface area of solid materials and involves the use of the BET
equation (3).
P/Vads(P0-P) = 1/VmC + [(C-1)/VmC]*(P/P0) (3)
where P = adsorption equilibrium pressure, P0 = standard vapour pressure of the adsorbent,
Vads = volume at STP occupied by molecules adsorbed at pressure P, Vm = volume of
adsorbate required for a monolayer coverage, C = constant related to heat of adsorption. A
plot of P/Vads(P0-P) Vs (P/P0) will yield a straight line usually in the range 0.05 ≤ P/P0 ≤ 0.35.
The slope (s) and intercept (i) of the BET plot are s = (C-1)/VmC and i = 1/VmC. Solving these
equations permits the calculation of Vm. Then the specific surface area of the catalyst can be
calculated as,
Specific surface area, m2g-1cat. = [(VmNa)/22414*Wt]*Am (4)
Am = mean cross sectional area occupied by adsorbate molecule (16.2 A2 for N2), Wt =
weight of the catalyst sample, Na = Avogadro number, Vm = monolayer volume in ml at
STP.
To differentiate between the adsorption mechanism in micropore and that occurring
in meso and macropores, the t-plot analysis developed by Lippens and de Boer was applied
[5]. The method consists of plotting the adsorption isotherm in terms of the volume of the
gas adsorbed versus the statistical film thickness, t. The pore size distribution is obtained
from the analysis of the desorption isotherms by applying the BJH model [6] which
involves the area of the pore walls and uses the Kelvin equation to correlate the partial
Chapter 2: Experimental and Physico-Chemical Characterization
36
pressure of nitrogen in equilibrium with the porous solid to the size of the pores where the
capillary condensation takes place.
The BET surface area and pore volume of the catalysts were determined by N2
adsorption-desorption method at liquid N2 temperature (77K) using Quantachrome Nova-
1200 adsorption unit. About 200 mg of sample was degassed at 3000C for about 4 hours
till the residual pressure was <10-3 Torr. The isotherms were analysed in a conventional
manner, that includes the BET surface area in the region of the relative pressure P/P0 =
0.05 to 0.3 with the assumption for the nitrogen molecular area in an adsorbed monolayer
of w=0.162 nm2. The pore size distribution were calculated via the BJH method. The total
pore volumes were taken at P/P0 = 0.95.
2.3.2.4. Scanning electron microscopy (SEM)
Scanning electron microscopy is considered to be a powerful tool to get
informations about morphology and particle size. SEM is carried out by passing a narrow
electron beam over the surface and detecting the yield of either secondary or back scattered
electrons as a function of the position of the primary beam. The size and morphology of
the crystals of all the compositions were examined using a JEOL JSM-840A scanning
electron microscope.
2.3.2.5. Thermal analysis (TG and DTA)
Thermal analysis includes a group of methods by which the physical and chemical
properties of a substance, a mixture and/or reaction mixtures are determined as a function
of temperature (or time), while the sample is subjected to a controlled temperature
program. In thermogravimetry, the mass of the sample is monitored as a function of
temperature (or time), while the sample is subjected to a controlled temperature program.
Differential Thermal Analysis (DTA) measures the difference in temperature between a
sample and a thermally inert reference as the temperature is raised. A plot of this
differential provides information on exothermic and endothermic reactions taking place in
the sample, which include phase transitions, dehydration, decomposition, redox, or solid-
state reactions.
Chapter 2: Experimental and Physico-Chemical Characterization
37
Thermogravimetry and differential thermal analysis measurements were performed
with a Mettler TA-1 apparatus equipped with a control and data acquisiton system
developed by the Anatech Bv. About 100 mg samples of spent catalysts were measured in
air at a heating ramp of 2 K min-1 up to 1070 K.
2.3.2.6. Temperature programmed techniques: TPR and TPD
Temperature programmed reduction (TPR), oxidation (TPO), desorption (TPD) and
reaction spectroscopy (TPRS) form a class of techniques in which a chemical reaction is
monitored while the temperature increases linearly. The basis set up for TPR, TPO and
TPD consists of a reactor and a thermal conductivity detector to measure the hydrogen
content in TPR/TPD or the oxygen content in TPO, of the gas mixture before and after
reaction. The TPR/TPO methods are used for qualitative and quantitative analysis.
In the TPR technique the catalyst material is subjected to a programmed
temperature rise, while a reducing gas mixture is flowing over it (usually, hydrogen diluted
in some inert gas like argon). The reduction rate is continuously measured by monitoring
the change in composition of the gas mixture after passing through the reactor. The
decrease in H2 concentration in the effluent gas with respect to the initial percentage
monitors the reaction progress.
TPD is a technique for studying the kinetics of adsorbates on solid surfaces. The
data are collected under well-controlled ultra-high vacuum conditions and after analysis
yield values of kinetic parameters as a function of adsorbate surface coverage. The sample
temperature is heated (by a variety of means) in a controlled fashion. The mass
spectrometer is tuned to monitor one or more mass fragments simultaneously that can be
correlated to the sample temperature. The desorption temperature, the shape of the
desorption peak, and how all these change with initial surface coverage and heating rate
are all analyzed to provide information about the binding character of the
adsorbate/substrate system.
TPR and TPD measurements were performed by a SORBSTAR apparatus
equipped with thermal conductivity detector (TCD) and mass spectrometer (MS) to
Chapter 2: Experimental and Physico-Chemical Characterization
38
identify the desorbed molecules. TPR measurements were carried out in a flow of 1 %
H2/Ar mixture, TPD studies were performed in pure He stream.
2.3.2.7. Mössbauer spectroscopy
The phenomenon of recoil free resonance absorption of nuclear gamma rays
(Mössbauer effect) has been known to be a powerful tool for investigating the properties of
internal fields acting on nuclei in solids [7,8]. Due to the presence of surrounding
electronic charges, the nuclear energy levels are perturbed and the scanning of these levels
gives valuable information about the nature of bonding in solids. Mössbauer isomer shift
(IS) is a parameter by which the nature of different cationic oxidation states and the
character of chemical entities in a catalyst may be monitored. The isomer shift (IS) is the
consequence of the Coulomb interaction between the positively charged nucleus and the
negatively charged s-electrons. The electric quadrupole splitting is caused by the
interaction of the electric quadrupole moment with an electric field gradient. Quadrupole
splitting data may be used to access the structural properties of catalysts and the
distribution of electronic charge around the probe atoms. Magnetic hyperfine splitting or
the so-called Zeeman effect arises from the interaction between the nuclear magnetic
dipole moment and the magnetic field at the nucleus. This interaction splits both nuclear
levels and removes all degeneracy. From the eight possible transitions only six are
allowed and the spectrum contains six equidistant peaks, called sextet or sextuplet. The
separation between the peaks in the spectrum is proportional to the magnetic field at the
nucleus.
Mössbauer spectroscopy finds extensive applications and has been largely applied
for compounds containing iron. If the iron atoms occupy equivalent lattice positions, the
local fields at the iron nuclei are characterized by a single set of parameters. If they
occupy two non-equivalent sets of positions, as in the case of ferrites, one would expect to
obtain a superimposition of two parameters. If, in addition, both Fe2+ and Fe3+ ions are
present in the lattice, the spectra will be more complex. Mössbauer studies on ferrites
provide valuable information on the ratio of the Fe3+ in Td and Oh sites, the type of ordering
Chapter 2: Experimental and Physico-Chemical Characterization
39
(Neel – type or Yafet – Kittal type) and any deviation from stoichiometry leading to mixed
valence states such as Fe2+ and Fe3+.
Mössbauer spectra were obtained in constant acceleration mode. Spectra were
fitted assuming a Lorentzian line shape; none of the positional parameters were
constrained. Isomer shift values are related to the center of metallic α-iron spectrum at
room temperature. The estimated accuracy of the positional parameters is ± 0.03 mm/s [9].
2.3.2.8. X-ray photoelectron spectroscopy (XPS)
The X-ray photoelectron spectroscopy [10-12] is based on the photoelectric effect,
which involves the bombardment of a sample surface with X rays and the measurement of
the concomitant photoemitted electrons. The photoemitted electrons have discrete kinetic
energies that are characteristic of the emitting atoms and their bonding states. The kinetic
energy, Ek, of these photoelectrons is determined by the energy of the X-ray radiation, hν,
and the electron binding energy, Eb, as given by:
Ek = hν- Eb (5)
The experimentally measured energies of the photoelectrons are given by:
Ek = hν- Eb - Ew (6)
where Ew is the work function of the spectrometer.
The XPS technique is highly surface specific due to the short range of the
photoelectrons that are excited from the solid. The binding energy of the peaks is
characteristic of each element. The peak areas can be used (with appropriate sensitivity
factors) to determine the composition of the materials surface. The shape of each peak and
the binding energy can be slightly altered by the chemical state of the emitting atom.
Hence XPS can provide chemical bonding information as well. XPS and the related Auger
electron spectroscopy (AES) can provide elemental analysis for essentially the entire
periodic table. Because the electrons whose energies are analyzed arise from a depth of no
greater than about 5 nm, the techniques are surface-sensitive.
X-ray Photoelectron spectra were acquired on a VG Microtech Multilab ESCA 3000
spectrometer using a non-monochromatized MgKα x-ray source (hν = 1253.6 eV) on ‘in situ’
scraped fresh catalyst pellets and powder samples of spent catalysts at room temperature.
Chapter 2: Experimental and Physico-Chemical Characterization
40
Selected spectra were recorded with AlKα x-ray (hν = 1486.6 eV) also to eliminate the overlap
between different Auger and core levels. Base pressure in the analysis chamber was
maintained at 3-6 x 10⁻¹⁰ Torr range. The energy resolution of the spectrometer was
determined from the full width at half maximum of metallic gold and the value obtained is
better that 0.8 eV for MgKα radiation and 1.1 eV for AlKα radiation respectively, at a pass
energy of 20 eV. The error in the BE values [13,14] reported is ±0.1 eV.
2.3.2.9. Infrared adsorption studies
The most common application of IR in catalysis is to identify adsorbed species and
to study the way in which these species are chemisorbed on the surface of the catalyst [15-
17]. More specifically, IR spectroscopy has been used to study the adsorption of typical
probe molecules like ammonia, pyridine and other bases, hydrocarbons, carbon dioxide
which can monitor either the acidic or basic sites on oxide catalysts [18]. Investigation of
adsorbed species in relation to their behavior in catalytic reactions is the main field of
application of IR spectroscopy. IR studies if performed under conditions where some
intermediates are actually detectable can give valuable information on the catalysis
mechanisms.
2.3.3. Results and discussion
Chemical compositions (determined by XRF), structural and textural properties of Cu1-
xCoxFe2O4 spinel system catalysts prepared in the present study are summarized in Table 2.1.
XRF results display the bulk metal ion concentrations in line with starting composition.
Figure 2.2a shows the XRD patterns of calcined catalysts. It can be seen that, the
fresh Cu-rich catalyst (x = 0.0) exhibit diffraction pattern attributed to cubic spinel phase
[19] and a considerable amount of CuO and Fe2O3 phases. This indicates the spinel
formation is not complete at 5000C for x = 0.0 in agreement with literature reports [19-22].
Substitution of Cu by Co increases the overall crystallinity of spinel phase and all the
peaks are indexed as reported in ASTM card (card no. 1-1121 and 3-0864, JCPDS card
No: 3-864, 22-1086). However, trace amount of α-Fe2O3 impurity phase was also detected
in Co-containing catalysts. The lattice constant, a, obtained for CuFe2O4 and CoFe2O4 are
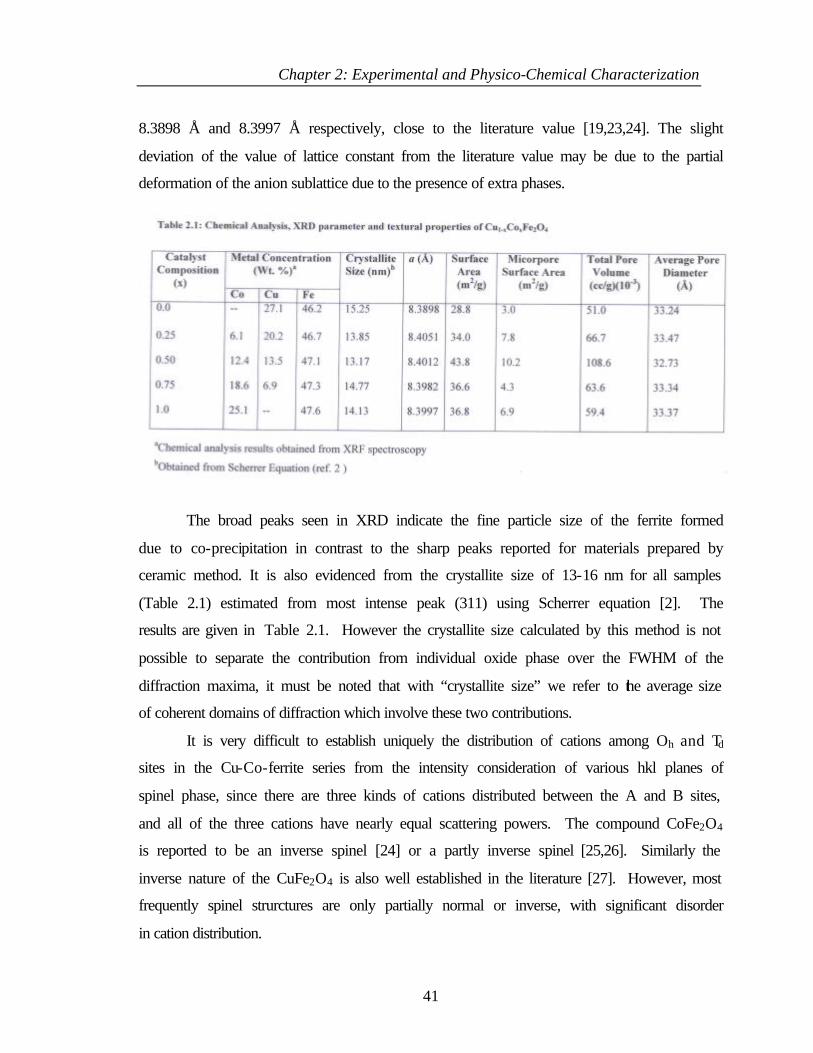
Chapter 2: Experimental and Physico-Chemical Characterization
41
8.3898 Å and 8.3997 Å respectively, close to the literature value [19,23,24]. The slight
deviation of the value of lattice constant from the literature value may be due to the partial
deformation of the anion sublattice due to the presence of extra phases.
The broad peaks seen in XRD indicate the fine particle size of the ferrite formed
due to co-precipitation in contrast to the sharp peaks reported for materials prepared by
ceramic method. It is also evidenced from the crystallite size of 13-16 nm for all samples
(Table 2.1) estimated from most intense peak (311) using Scherrer equation [2]. The
results are given in Table 2.1. However the crystallite size calculated by this method is not
possible to separate the contribution from individual oxide phase over the FWHM of the
diffraction maxima, it must be noted that with “crystallite size” we refer to the average size
of coherent domains of diffraction which involve these two contributions.
It is very difficult to establish uniquely the distribution of cations among Oh and Td
sites in the Cu-Co-ferrite series from the intensity consideration of various hkl planes of
spinel phase, since there are three kinds of cations distributed between the A and B sites,
and all of the three cations have nearly equal scattering powers. The compound CoFe2O4
is reported to be an inverse spinel [24] or a partly inverse spinel [25,26]. Similarly the
inverse nature of the CuFe2O4 is also well established in the literature [27]. However, most
frequently spinel strurctures are only partially normal or inverse, with significant disorder
in cation distribution.
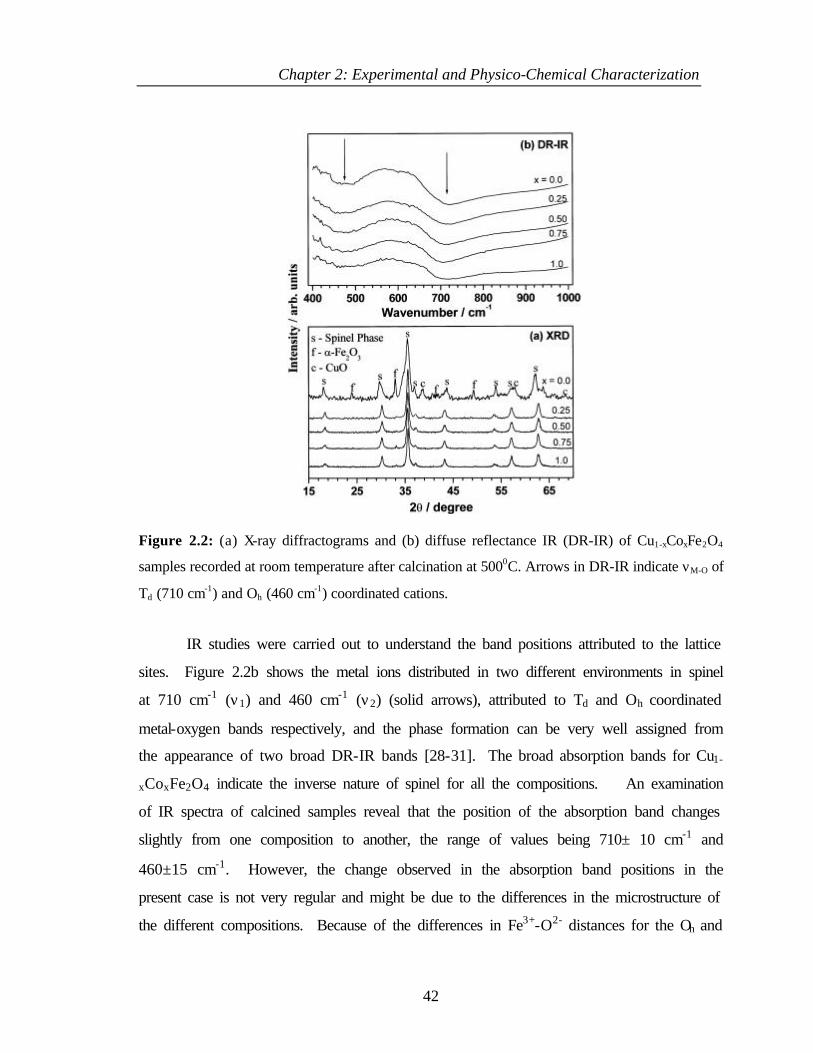
Chapter 2: Experimental and Physico-Chemical Characterization
42
Figure 2.2: (a) X-ray diffractograms and (b) diffuse reflectance IR (DR-IR) of Cu1-xCoxFe2O4
samples recorded at room temperature after calcination at 5000C. Arrows in DR-IR indicate νM-O of
Td (710 cm-1) and Oh (460 cm-1) coordinated cations.
IR studies were carried out to understand the band positions attributed to the lattice
sites. Figure 2.2b shows the metal ions distributed in two different environments in spinel
at 710 cm-1 (ν1) and 460 cm-1 (ν2) (solid arrows), attributed to Td and Oh coordinated
metal-oxygen bands respectively, and the phase formation can be very well assigned from
the appearance of two broad DR-IR bands [28-31]. The broad absorption bands for Cu1-
xCoxFe2O4 indicate the inverse nature of spinel for all the compositions. An examination
of IR spectra of calcined samples reveal that the position of the absorption band changes
slightly from one composition to another, the range of values being 710± 10 cm-1 and
460±15 cm-1. However, the change observed in the absorption band positions in the
present case is not very regular and might be due to the differences in the microstructure of
the different compositions. Because of the differences in Fe3+-O2- distances for the Oh and
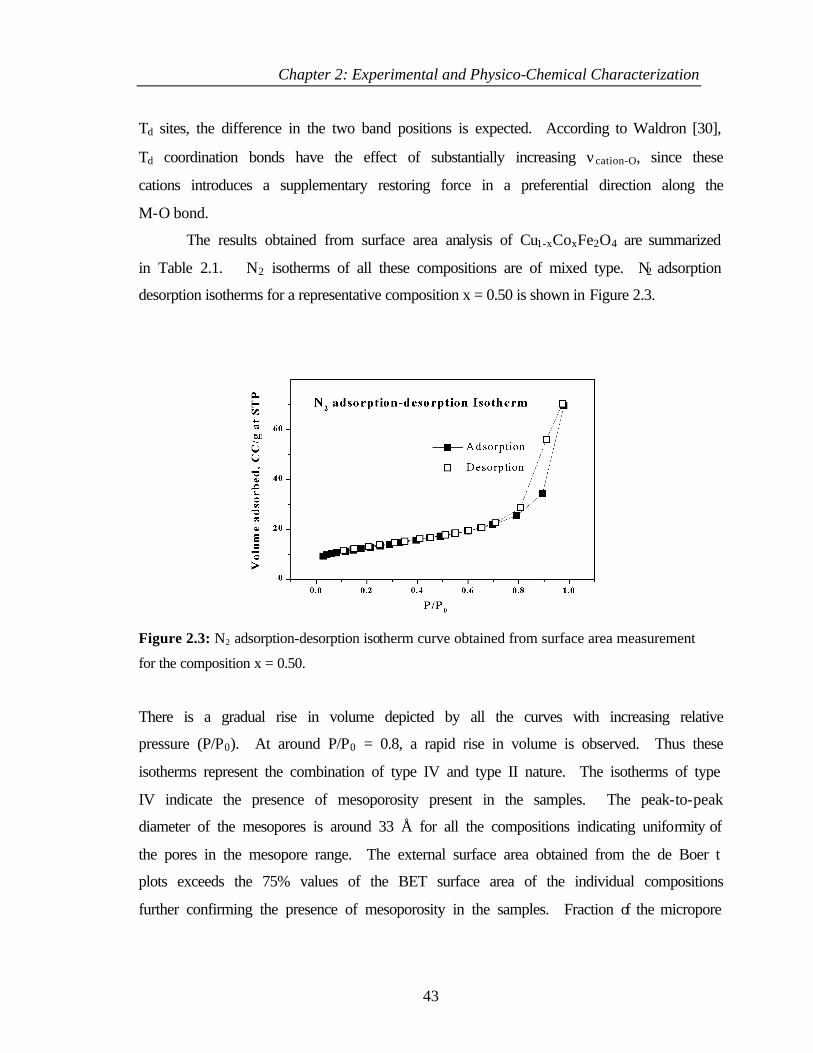
Chapter 2: Experimental and Physico-Chemical Characterization
43
Td sites, the difference in the two band positions is expected. According to Waldron [30],
Td coordination bonds have the effect of substantially increasing νcation-O, since these
cations introduces a supplementary restoring force in a preferential direction along the
M-O bond.
The results obtained from surface area analysis of Cu1-xCoxFe2O4 are summarized
in Table 2.1. N2 isotherms of all these compositions are of mixed type. N2 adsorption
desorption isotherms for a representative composition x = 0.50 is shown in Figure 2.3.
Figure 2.3: N2 adsorption-desorption isotherm curve obtained from surface area measurement
for the composition x = 0.50.
There is a gradual rise in volume depicted by all the curves with increasing relative
pressure (P/P0). At around P/P0 = 0.8, a rapid rise in volume is observed. Thus these
isotherms represent the combination of type IV and type II nature. The isotherms of type
IV indicate the presence of mesoporosity present in the samples. The peak-to-peak
diameter of the mesopores is around 33 Å for all the compositions indicating uniformity of
the pores in the mesopore range. The external surface area obtained from the de Boer t
plots exceeds the 75% values of the BET surface area of the individual compositions
further confirming the presence of mesoporosity in the samples. Fraction of the micropore
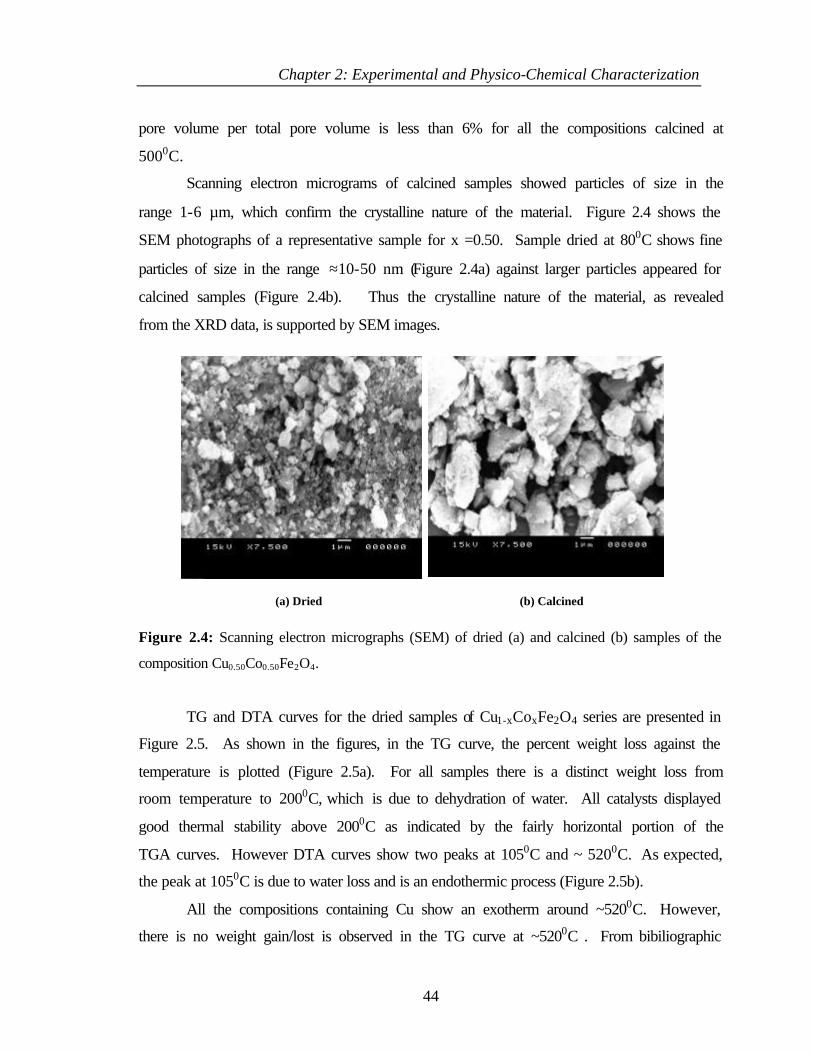
Chapter 2: Experimental and Physico-Chemical Characterization
44
pore volume per total pore volume is less than 6% for all the compositions calcined at
5000C.
Scanning electron micrograms of calcined samples showed particles of size in the
range 1-6 µm, which confirm the crystalline nature of the material. Figure 2.4 shows the
SEM photographs of a representative sample for x =0.50. Sample dried at 800C shows fine
particles of size in the range ≈10-50 nm (Figure 2.4a) against larger particles appeared for
calcined samples (Figure 2.4b). Thus the crystalline nature of the material, as revealed
from the XRD data, is supported by SEM images.
Figure 2.4: Scanning electron micrographs (SEM) of dried (a) and calcined (b) samples of the
composition Cu0.50Co0.50Fe2O4.
TG and DTA curves for the dried samples of Cu1-xCoxFe2O4 series are presented in
Figure 2.5. As shown in the figures, in the TG curve, the percent weight loss against the
temperature is plotted (Figure 2.5a). For all samples there is a distinct weight loss from
room temperature to 2000C, which is due to dehydration of water. All catalysts displayed
good thermal stability above 2000C as indicated by the fairly horizontal portion of the
TGA curves. However DTA curves show two peaks at 1050C and ~ 5200C. As expected,
the peak at 1050C is due to water loss and is an endothermic process (Figure 2.5b).
All the compositions containing Cu show an exotherm around ~5200C. However,
there is no weight gain/lost is observed in the TG curve at ~5200C . From bibiliographic
(a) Dried (b) Calcined
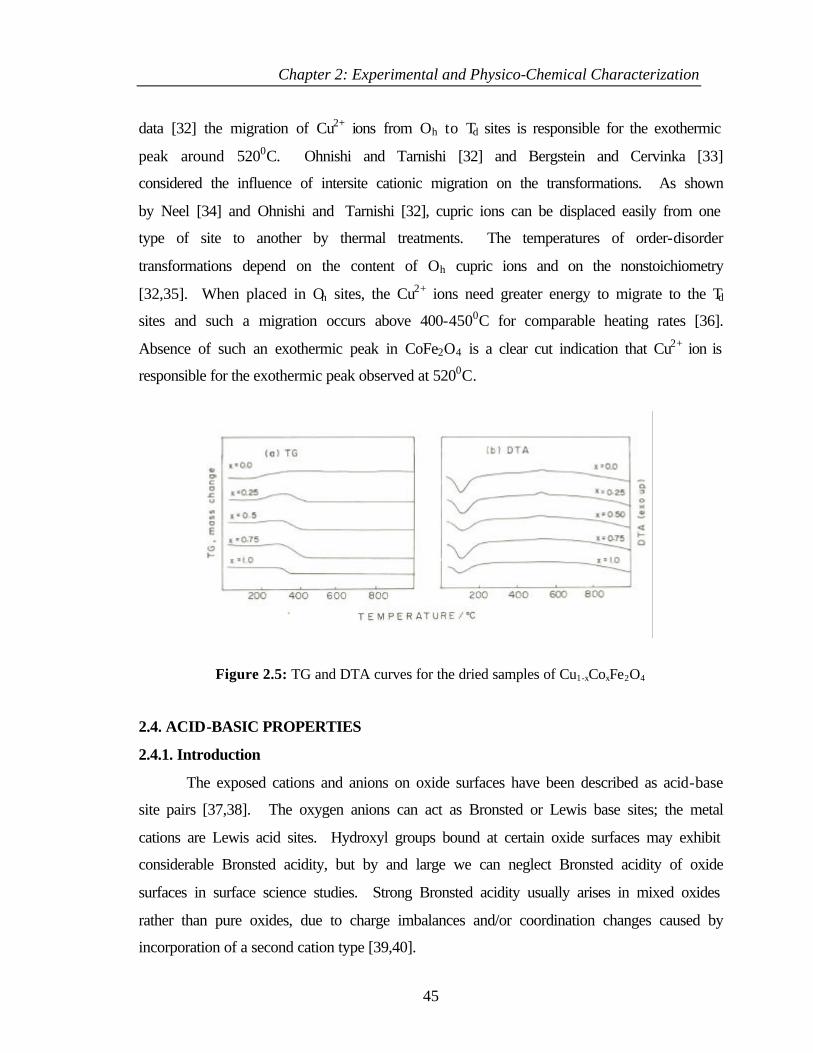
Chapter 2: Experimental and Physico-Chemical Characterization
45
data [32] the migration of Cu2+ ions from Oh to Td sites is responsible for the exothermic
peak around 5200C. Ohnishi and Tarnishi [32] and Bergstein and Cervinka [33]
considered the influence of intersite cationic migration on the transformations. As shown
by Neel [34] and Ohnishi and Tarnishi [32], cupric ions can be displaced easily from one
type of site to another by thermal treatments. The temperatures of order-disorder
transformations depend on the content of Oh cupric ions and on the nonstoichiometry
[32,35]. When placed in Oh sites, the Cu2+ ions need greater energy to migrate to the Td
sites and such a migration occurs above 400-4500C for comparable heating rates [36].
Absence of such an exothermic peak in CoFe2O4 is a clear cut indication that Cu2+ ion is
responsible for the exothermic peak observed at 5200C.
Figure 2.5: TG and DTA curves for the dried samples of Cu1-xCoxFe2O4
2.4. ACID-BASIC PROPERTIES
2.4.1. Introduction
The exposed cations and anions on oxide surfaces have been described as acid-base
site pairs [37,38]. The oxygen anions can act as Bronsted or Lewis base sites; the metal
cations are Lewis acid sites. Hydroxyl groups bound at certain oxide surfaces may exhibit
considerable Bronsted acidity, but by and large we can neglect Bronsted acidity of oxide
surfaces in surface science studies. Strong Bronsted acidity usually arises in mixed oxides
rather than pure oxides, due to charge imbalances and/or coordination changes caused by
incorporation of a second cation type [39,40].
Chapter 2: Experimental and Physico-Chemical Characterization
46
A variety of physico chemical methods have been employed and widely applied to
evaluate the strength and the amount of acid/basic sites on catalysts. A large variety of
probe molecules have been utilized to both qualitatively ascertain the acidity and basicity
and provide the measure and nature of these acidic and basic sites [41-48]. For example,
pyridine was chosen as the base probe molecule to measure the acidity. When
chemisorbed on a surface possessing acid properties, pyridine can interact with acidic
protons, electron acceptor sites and H from neutral or weakly acidic hydroxyls [45,46].
CO2 has been used to probe basic surface properties because it is amphoteric (but known
by its acidic nature) and therefore it is expected to adsorb both acidic and more strongly on
basic sites [47,48]. On the other hand, adsorption of certain organic molecules likes
7,7,8,8-Tetracyanoquinodimethane (TCNQ), 2,3,5,6-tetrachloro-1-4-benzoquinone
(chloranil) and p-dinitrobenzene (PDNB) on the oxide surface will provide insight on the
strength and distribution of electron donor sites on the oxide surfaces [49,50]. By probing
the interaction of these molecules with the surface, information can be obtained on the
oxidation state of the metal ion, the coordination symmetry, the degree of coordination
unsaturation of the surface hydroxy groups and the presence and the nature of surface
Lewis and Bronsted acid sites.
2.4.2. Experimental
FTIR adsorption of CO2 and pyridine were operated in drift mode. Calcined
powder sample was taken in a sample holder and placed in a specially designed cell. The
samples were then heated in situ from room temperature to 4000C at a heating rate of
50C/min and in a flowing stream (40 ml/min) of 99.99% N2. The sample was kept at 4000C
for 3 hours and then the hydroxyl region of the spectra was measured. The sample was
then cooled to 1000C and pyridine vapour was introduced for 10 minutes in the N2 flow.
The low concentration of gas-phase pyridine was necessary in order to decrease the
background pyridine signals in the IR spectra. The temperature was then slowly increased
under the N2 flow and IR spectra were recorded at different temperatures up to 4000C. A
resolution of 2 cm-1 is attained after averaging over 500 scans for all the IR spectra
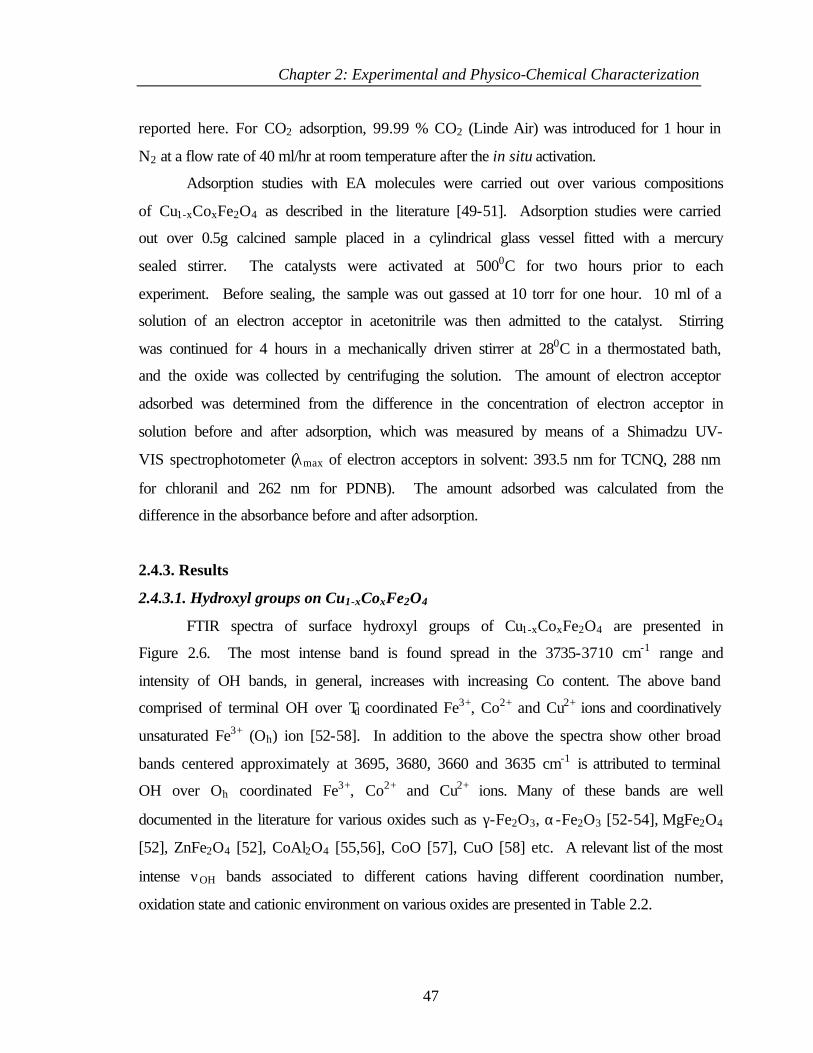
Chapter 2: Experimental and Physico-Chemical Characterization
47
reported here. For CO2 adsorption, 99.99 % CO2 (Linde Air) was introduced for 1 hour in
N2 at a flow rate of 40 ml/hr at room temperature after the in situ activation.
Adsorption studies with EA molecules were carried out over various compositions
of Cu1-xCoxFe2O4 as described in the literature [49-51]. Adsorption studies were carried
out over 0.5g calcined sample placed in a cylindrical glass vessel fitted with a mercury
sealed stirrer. The catalysts were activated at 5000C for two hours prior to each
experiment. Before sealing, the sample was out gassed at 10 torr for one hour. 10 ml of a
solution of an electron acceptor in acetonitrile was then admitted to the catalyst. Stirring
was continued for 4 hours in a mechanically driven stirrer at 280C in a thermostated bath,
and the oxide was collected by centrifuging the solution. The amount of electron acceptor
adsorbed was determined from the difference in the concentration of electron acceptor in
solution before and after adsorption, which was measured by means of a Shimadzu UV-
VIS spectrophotometer (λmax of electron acceptors in solvent: 393.5 nm for TCNQ, 288 nm
for chloranil and 262 nm for PDNB). The amount adsorbed was calculated from the
difference in the absorbance before and after adsorption.
2.4.3. Results
2.4.3.1. Hydroxyl groups on Cu1-xCoxFe2O4
FTIR spectra of surface hydroxyl groups of Cu1-xCoxFe2O4 are presented in
Figure 2.6. The most intense band is found spread in the 3735-3710 cm-1 range and
intensity of OH bands, in general, increases with increasing Co content. The above band
comprised of terminal OH over Td coordinated Fe3+, Co2+ and Cu2+ ions and coordinatively
unsaturated Fe3+ (Oh) ion [52-58]. In addition to the above the spectra show other broad
bands centered approximately at 3695, 3680, 3660 and 3635 cm-1 is attributed to terminal
OH over Oh coordinated Fe3+, Co2+ and Cu2+ ions. Many of these bands are well
documented in the literature for various oxides such as γ-Fe2O3, α-Fe2O3 [52-54], MgFe2O4
[52], ZnFe2O4 [52], CoAl2O4 [55,56], CoO [57], CuO [58] etc. A relevant list of the most
intense νOH bands associated to different cations having different coordination number,
oxidation state and cationic environment on various oxides are presented in Table 2.2.
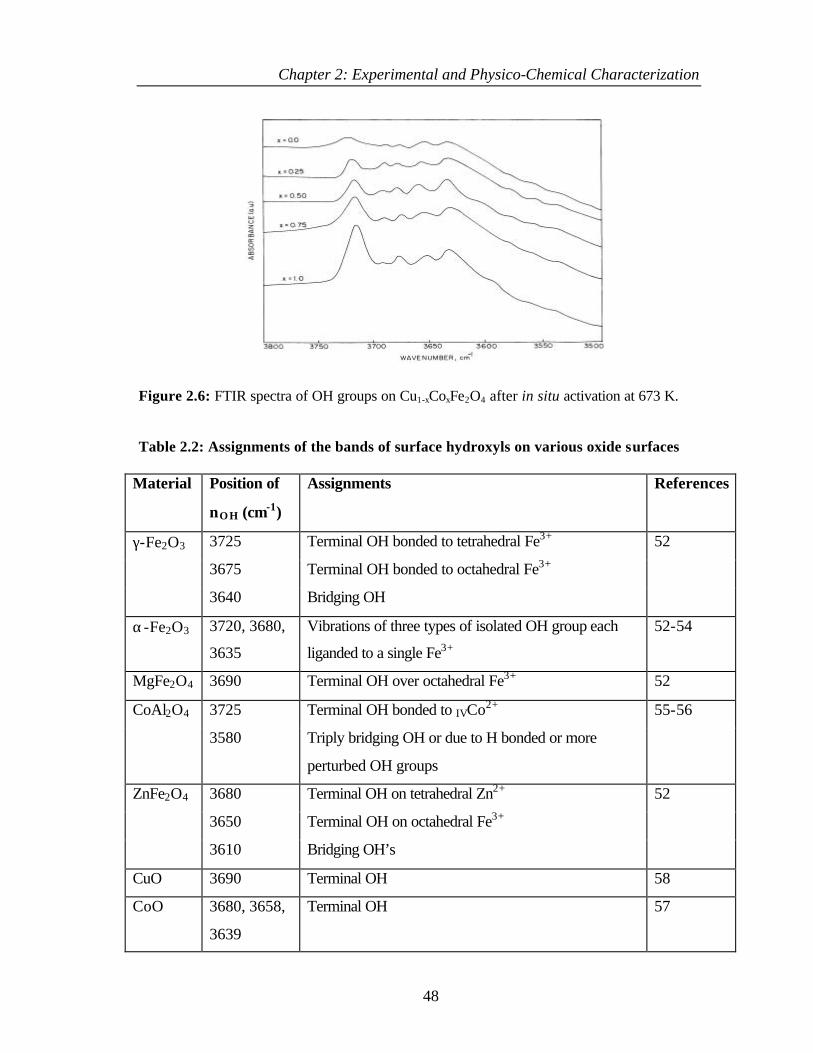
Chapter 2: Experimental and Physico-Chemical Characterization
48
Figure 2.6: FTIR spectra of OH groups on Cu1-xCoxFe2O4 after in situ activation at 673 K.
Table 2.2: Assignments of the bands of surface hydroxyls on various oxide surfaces
Material Position of
νO H (cm-1)
Assignments References
3725 Terminal OH bonded to tetrahedral Fe3+
3675 Terminal OH bonded to octahedral Fe3+
γ-Fe2O3
3640 Bridging OH
52
α-Fe2O3 3720, 3680,
3635
Vibrations of three types of isolated OH group each
liganded to a single Fe3+
52-54
MgFe2O4 3690 Terminal OH over octahedral Fe3+ 52
3725 Terminal OH bonded to IVCo2+ CoAl2O4
3580 Triply bridging OH or due to H bonded or more
perturbed OH groups
55-56
3680 Terminal OH on tetrahedral Zn2+
3650 Terminal OH on octahedral Fe3+
ZnFe2O4
3610 Bridging OH’s
52
CuO 3690 Terminal OH 58
CoO 3680, 3658,
3639
Terminal OH 57
Chapter 2: Experimental and Physico-Chemical Characterization
49
2.4.3.2. Pyridine adsorption
The IR spectrum of pyridine adsorbed on Cu1-xCoxFe2O4 at 373 K was recorded
and shown in Figure 2.7. Four important pyridine ring modes occur approximately at
1606, 1573, 1485 and 1446 cm-1 termed ν8a, ν8b, ν19a and ν19b respectively [59,60] and
listed in Table 2.3.
Figure 2.7: FTIR spectra of pyridine adsorbed on Cu1-xCoxFe2O4 surfaces at 373 K, after in situ
activation at 673 K.
Table 2.3: Position of the various IR bands (in cm-1) of pyridine and pyridinium ion adsorbed
at 373 K over various compositions of Cu1-xCoxFe 2O4
Composition ν 8a ν 8b νpyridinium-ion ν 19a ν 19b
CuFe2O4 1606 1573 1541 1485 1446
Cu0.75Co0.25Fe2O4 1608 1575 1541 1485 1446
Cu0.5Co0.5Fe2O4 1608 1573 1548 1485 1446
Cu0.25Co0.75Fe2O4 1608 1573 1543 1483 1446
CoFe2O4 1604 1575 1541 1487 1446
Chapter 2: Experimental and Physico-Chemical Characterization
50
Note that the pyridine molecule can be retained on the surface of oxides in following three
different modes [43] namely, (1) interaction of the N lone pair electron and the H atom of
OH group, (2) transfer of a proton from surface OH group to the pyridine forming
pyridinium ion (Bronsted acidity), and (3) pyridine coordination to an electron deficient
metal atom (Lewis acidity). Predominant IR bands, ν8a and ν19b, confirm the major
contribution of acidity is due to Lewis acid sites on all compositions. Among the above
four vibration modes, ν8a is very sensitive with respect to the oxidation state, coordination
symmetry and cationic environment [45]. A broad ν8a band at 1606 cm-1 at x = 0 decreases
in width at higher ‘x’ values and indicates a decrease in the disorder of cation distribution
in these spinels. ν8b at 1575 cm-1 is found to be very labile and its stability on the surface is
temperature dependent [52,55]. When the temperature increases above 373 K, ν8b band
completely disappears and confirms its labile nature. Hence, it is concluded that these
species are bound to the terminal OH groups via H-bonding. This coordinative interaction
is very weak and the molecule bound in this way gets desorbed at high temperature. A
weak band centered at ~1540 cm-1 is attributed to pyridinium ion [45,61].
2.4.3.3. Temperature dependence of pyridine adsorption
FTIR spectra of pyridine adsorbed Cu1-xCoxFe2O4 samples were recorded between
373 K and 673 K. Above results for three selected compositions, x = 0, 0.50 and 1 are
shown in Figure 2.8. Important changes in the spectral features are highlighted: (1) The
bands corresponding to ν8a, ν19a and ν19b modes display broad and intense peak for all the
compositions up to 573 K. Presence of certain pyridine bands is observed even at 673 K on
CoFe2O4 in contrast to no bands on Cu containing samples; (2) The bands correspond to
ν8a shifts to higher ν as the temperature increases for all compositions; (3) ν19a and ν19b
bands are shifted to lower ν as the temperature increases for all the compositions. An
apparent single band centered at 1446 cm-1 at temperature 373 K is split into two
components at intermediate compositions (0<x<1) at higher temperatures; (4) On all
compositions a band centered at ~1352 cm-1 increases in intensity as the temperature
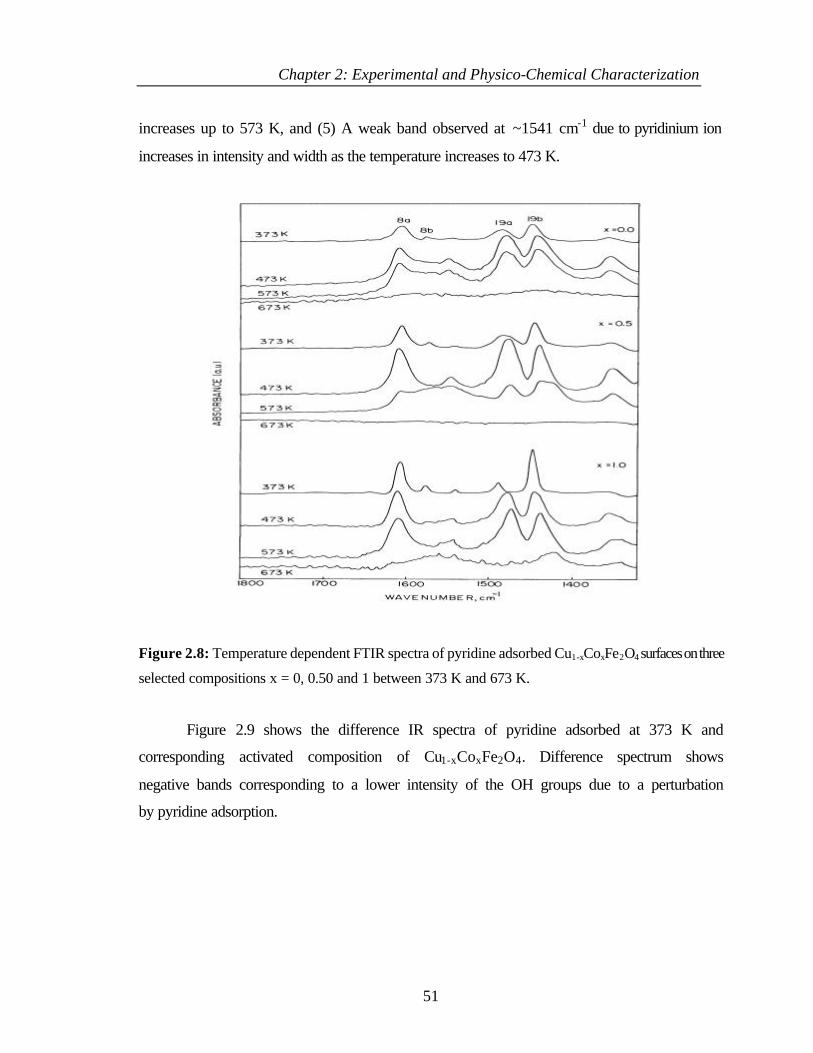
Chapter 2: Experimental and Physico-Chemical Characterization
51
increases up to 573 K, and (5) A weak band observed at ~1541 cm-1 due to pyridinium ion
increases in intensity and width as the temperature increases to 473 K.
Figure 2.8: Temperature dependent FTIR spectra of pyridine adsorbed Cu1-xCoxFe2O4 surfaces on three
selected compositions x = 0, 0.50 and 1 between 373 K and 673 K.
Figure 2.9 shows the difference IR spectra of pyridine adsorbed at 373 K and
corresponding activated composition of Cu1-xCoxFe2O4. Difference spectrum shows
negative bands corresponding to a lower intensity of the OH groups due to a perturbation
by pyridine adsorption.
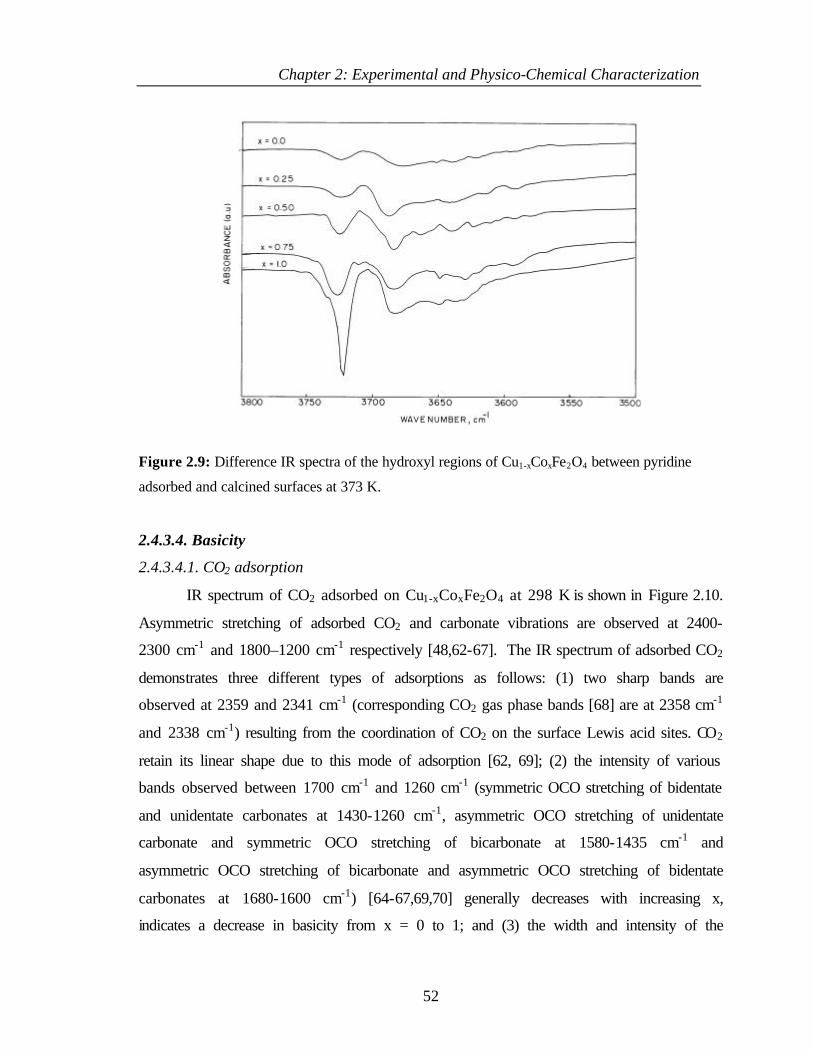
Chapter 2: Experimental and Physico-Chemical Characterization
52
Figure 2.9: Difference IR spectra of the hydroxyl regions of Cu1-xCoxFe2O4 between pyridine
adsorbed and calcined surfaces at 373 K.
2.4.3.4. Basicity
2.4.3.4.1. CO2 adsorption
IR spectrum of CO2 adsorbed on Cu1-xCoxFe2O4 at 298 K is shown in Figure 2.10.
Asymmetric stretching of adsorbed CO2 and carbonate vibrations are observed at 2400-
2300 cm-1 and 1800–1200 cm-1 respectively [48,62-67]. The IR spectrum of adsorbed CO2
demonstrates three different types of adsorptions as follows: (1) two sharp bands are
observed at 2359 and 2341 cm-1 (corresponding CO2 gas phase bands [68] are at 2358 cm-1
and 2338 cm-1) resulting from the coordination of CO2 on the surface Lewis acid sites. CO2
retain its linear shape due to this mode of adsorption [62, 69]; (2) the intensity of various
bands observed between 1700 cm-1 and 1260 cm-1 (symmetric OCO stretching of bidentate
and unidentate carbonates at 1430-1260 cm-1, asymmetric OCO stretching of unidentate
carbonate and symmetric OCO stretching of bicarbonate at 1580-1435 cm-1 and
asymmetric OCO stretching of bicarbonate and asymmetric OCO stretching of bidentate
carbonates at 1680-1600 cm-1) [64-67,69,70] generally decreases with increasing x,
indicates a decrease in basicity from x = 0 to 1; and (3) the width and intensity of the
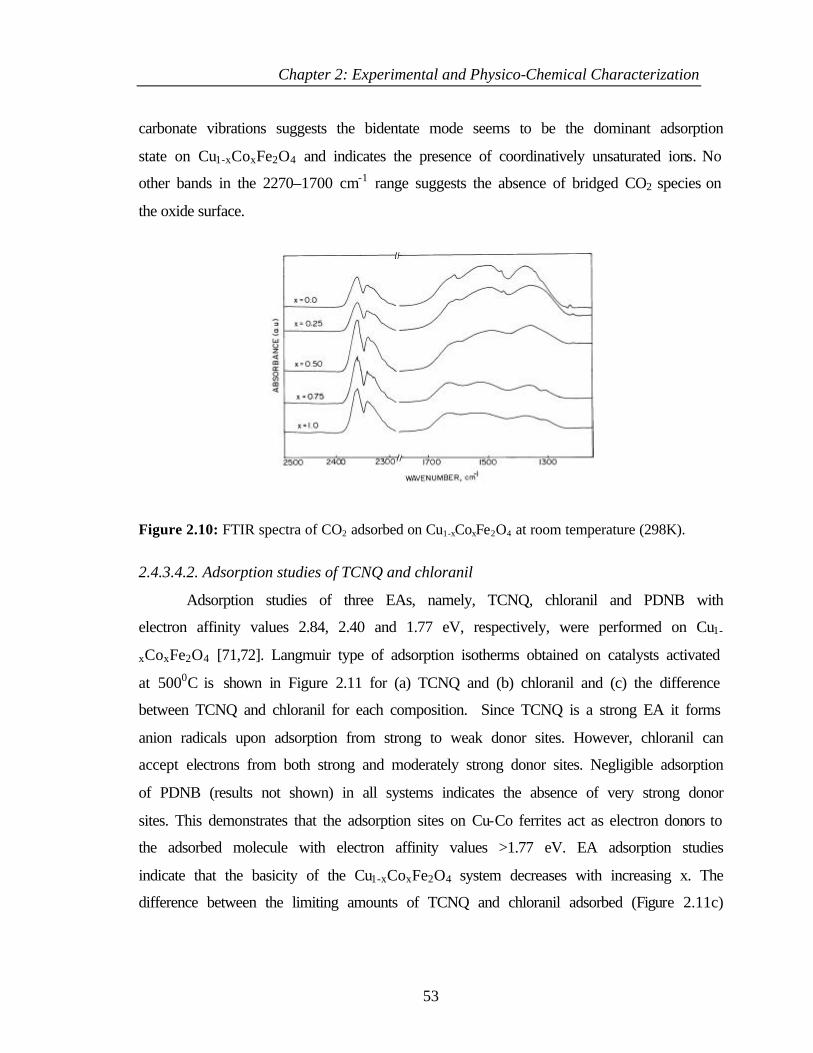
Chapter 2: Experimental and Physico-Chemical Characterization
53
carbonate vibrations suggests the bidentate mode seems to be the dominant adsorption
state on Cu1-xCoxFe2O4 and indicates the presence of coordinatively unsaturated ions. No
other bands in the 2270–1700 cm-1 range suggests the absence of bridged CO2 species on
the oxide surface.
Figure 2.10: FTIR spectra of CO2 adsorbed on Cu1-xCoxFe2O4 at room temperature (298K).
2.4.3.4.2. Adsorption studies of TCNQ and chloranil
Adsorption studies of three EAs, namely, TCNQ, chloranil and PDNB with
electron affinity values 2.84, 2.40 and 1.77 eV, respectively, were performed on Cu1-
xCoxFe2O4 [71,72]. Langmuir type of adsorption isotherms obtained on catalysts activated
at 5000C is shown in Figure 2.11 for (a) TCNQ and (b) chloranil and (c) the difference
between TCNQ and chloranil for each composition. Since TCNQ is a strong EA it forms
anion radicals upon adsorption from strong to weak donor sites. However, chloranil can
accept electrons from both strong and moderately strong donor sites. Negligible adsorption
of PDNB (results not shown) in all systems indicates the absence of very strong donor
sites. This demonstrates that the adsorption sites on Cu-Co ferrites act as electron donors to
the adsorbed molecule with electron affinity values >1.77 eV. EA adsorption studies
indicate that the basicity of the Cu1-xCoxFe2O4 system decreases with increasing x. The
difference between the limiting amounts of TCNQ and chloranil adsorbed (Figure 2.11c)
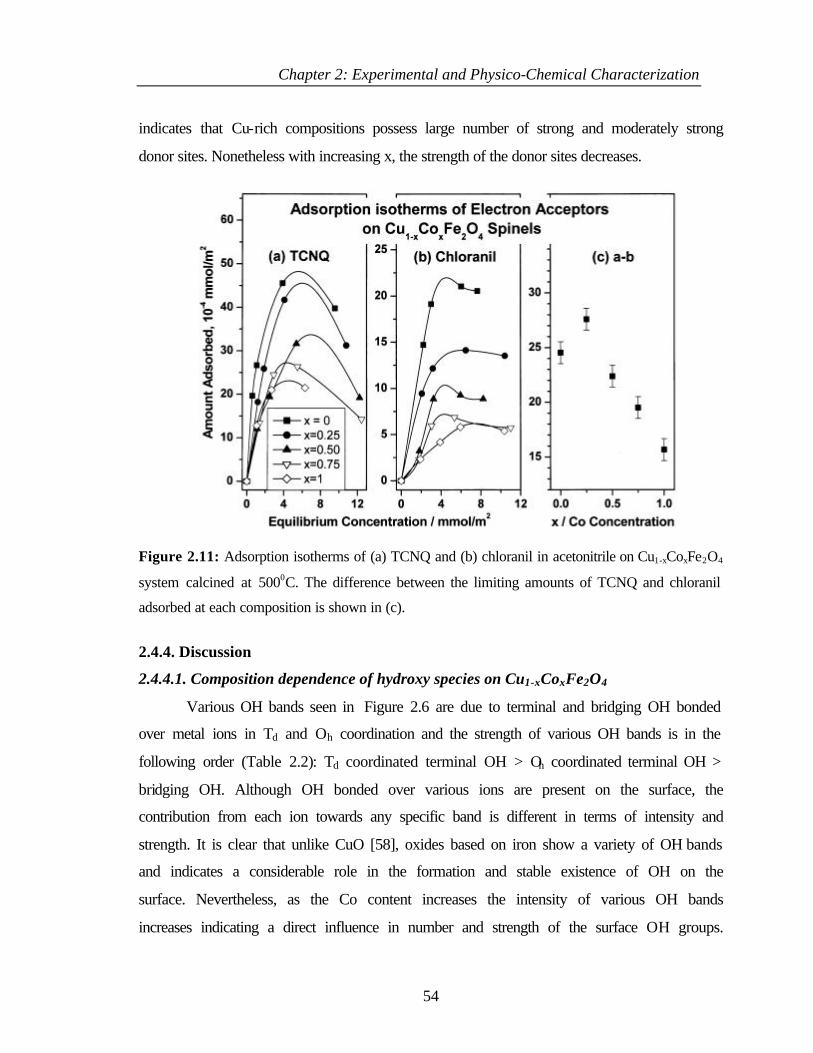
Chapter 2: Experimental and Physico-Chemical Characterization
54
indicates that Cu-rich compositions possess large number of strong and moderately strong
donor sites. Nonetheless with increasing x, the strength of the donor sites decreases.
Figure 2.11: Adsorption isotherms of (a) TCNQ and (b) chloranil in acetonitrile on Cu1-xCoxFe2O4
system calcined at 5000C. The difference between the limiting amounts of TCNQ and chloranil
adsorbed at each composition is shown in (c).
2.4.4. Discussion
2.4.4.1. Composition dependence of hydroxy species on Cu1-xCoxFe2O4
Various OH bands seen in Figure 2.6 are due to terminal and bridging OH bonded
over metal ions in Td and Oh coordination and the strength of various OH bands is in the
following order (Table 2.2): Td coordinated terminal OH > Oh coordinated terminal OH >
bridging OH. Although OH bonded over various ions are present on the surface, the
contribution from each ion towards any specific band is different in terms of intensity and
strength. It is clear that unlike CuO [58], oxides based on iron show a variety of OH bands
and indicates a considerable role in the formation and stable existence of OH on the
surface. Nevertheless, as the Co content increases the intensity of various OH bands
increases indicating a direct influence in number and strength of the surface OH groups.
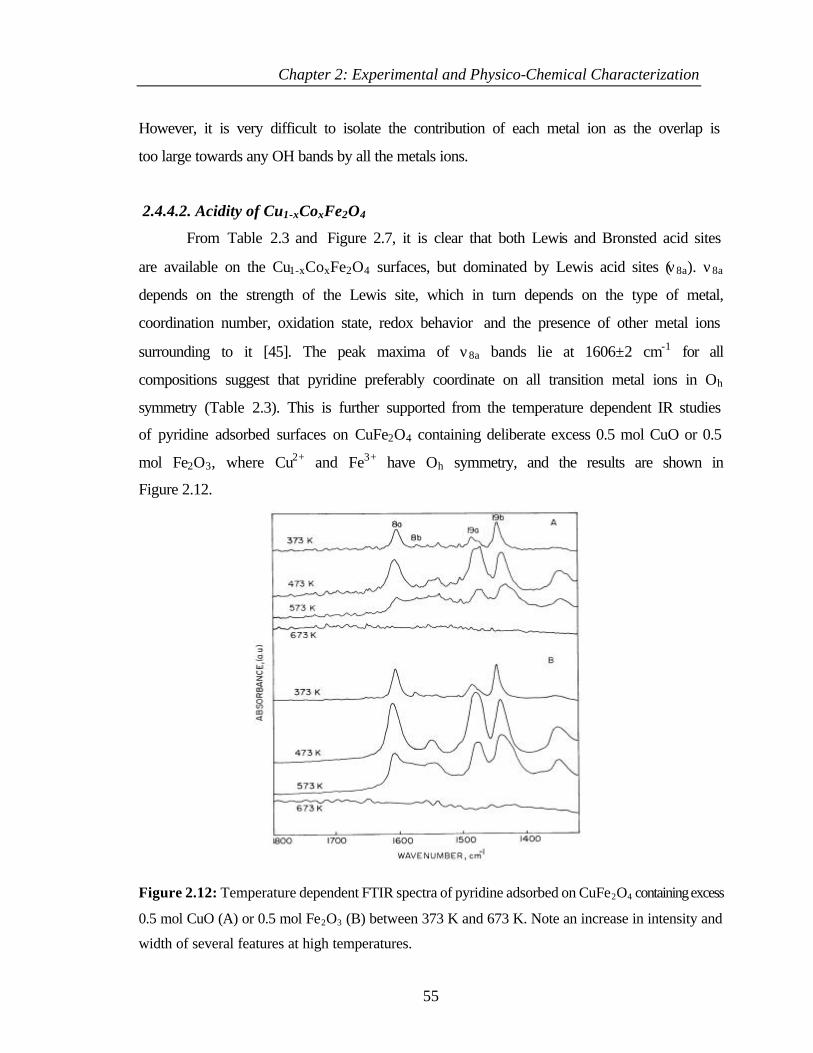
Chapter 2: Experimental and Physico-Chemical Characterization
55
However, it is very difficult to isolate the contribution of each metal ion as the overlap is
too large towards any OH bands by all the metals ions.
2.4.4.2. Acidity of Cu1-xCoxFe2O4
From Table 2.3 and Figure 2.7, it is clear that both Lewis and Bronsted acid sites
are available on the Cu1-xCoxFe2O4 surfaces, but dominated by Lewis acid sites (ν8a). ν8a
depends on the strength of the Lewis site, which in turn depends on the type of metal,
coordination number, oxidation state, redox behavior and the presence of other metal ions
surrounding to it [45]. The peak maxima of ν8a bands lie at 1606±2 cm-1 for all
compositions suggest that pyridine preferably coordinate on all transition metal ions in Oh
symmetry (Table 2.3). This is further supported from the temperature dependent IR studies
of pyridine adsorbed surfaces on CuFe2O4 containing deliberate excess 0.5 mol CuO or 0.5
mol Fe2O3, where Cu2+ and Fe3+ have Oh symmetry, and the results are shown in
Figure 2.12.
Figure 2.12: Temperature dependent FTIR spectra of pyridine adsorbed on CuFe2O4 containing excess
0.5 mol CuO (A) or 0.5 mol Fe2O3 (B) between 373 K and 673 K. Note an increase in intensity and
width of several features at high temperatures.
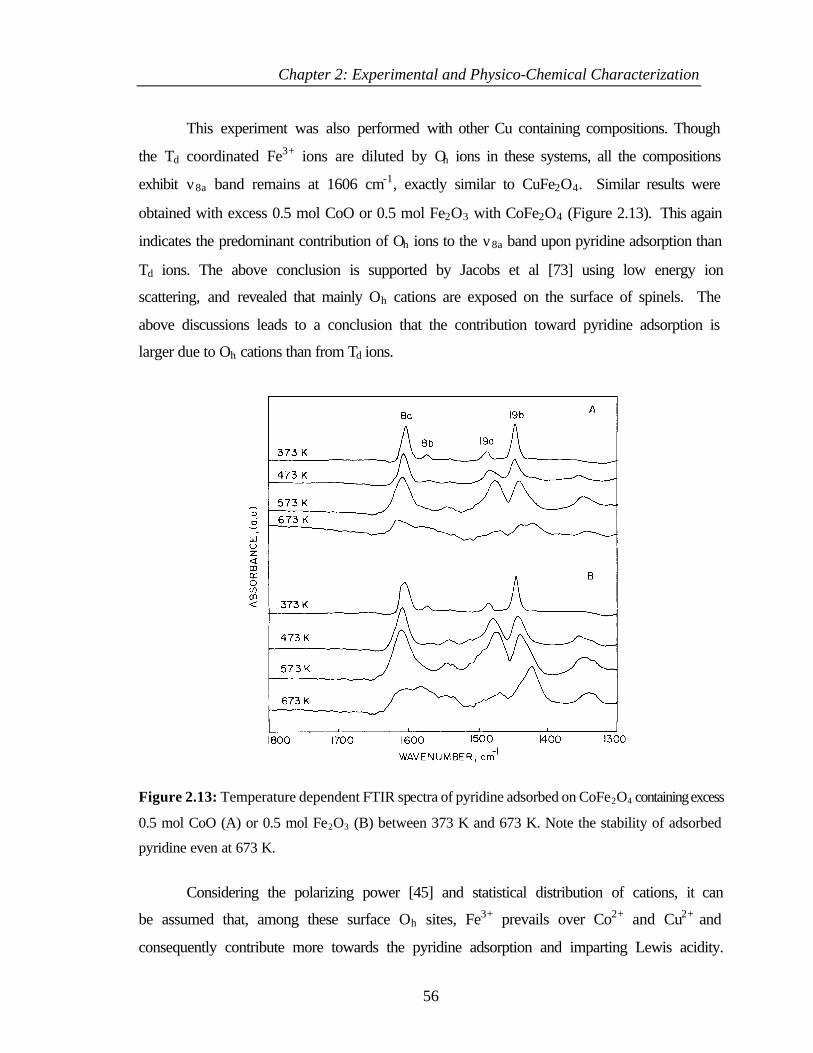
Chapter 2: Experimental and Physico-Chemical Characterization
56
This experiment was also performed with other Cu containing compositions. Though
the Td coordinated Fe3+ ions are diluted by Oh ions in these systems, all the compositions
exhibit ν8a band remains at 1606 cm-1, exactly similar to CuFe2O4. Similar results were
obtained with excess 0.5 mol CoO or 0.5 mol Fe2O3 with CoFe2O4 (Figure 2.13). This again
indicates the predominant contribution of Oh ions to the ν8a band upon pyridine adsorption than
Td ions. The above conclusion is supported by Jacobs et al [73] using low energy ion
scattering, and revealed that mainly Oh cations are exposed on the surface of spinels. The
above discussions leads to a conclusion that the contribution toward pyridine adsorption is
larger due to Oh cations than from Td ions.
Figure 2.13: Temperature dependent FTIR spectra of pyridine adsorbed on CoFe2O4 containing excess
0.5 mol CoO (A) or 0.5 mol Fe2O3 (B) between 373 K and 673 K. Note the stability of adsorbed
pyridine even at 673 K.
Considering the polarizing power [45] and statistical distribution of cations, it can
be assumed that, among these surface Oh sites, Fe3+ prevails over Co2+ and Cu2+ and
consequently contribute more towards the pyridine adsorption and imparting Lewis acidity.
Chapter 2: Experimental and Physico-Chemical Characterization
57
This is further supported by increasing Fe/(Cu+Co) surface atomic ratio from 0 to 1,
calculated from XPS analysis (See chapter 4, Table 4.7). Nevertheless, Cu2+ and Co2+
indirectly influence the nature of surface active sites is explained as follows. Upon pyridine
adsorption there is electron flow from pyridine to spinel surface results in the reduction of
highly vulnerable cations, like Cu2+, and the extent of reduction increases at high
temperature. Consequently, the charge density around Fe3+ is also modified and leads to a
decreased interaction between pyridine and oxide surface and hence a less stable adsorbed
complex. Contrarily, Co2+ is robust and no reduction is observed on pyridine adsorption,
even at high temperature. Hence Co2+ acts as a structure stabilizer and stabilizes Fe3+ state
in higher proportion, probably exceeding the stoichiometric 1:2 ratio corresponding to the
A and B sites in spinels. Thus Co2+ and Cu2+ ions affect the surface state of Fe3+ upon
pyridine adsorption, in an exactly opposite manner. An increase in Co content decreases
the reducibility of Fe3+ ions and consequently strengthens the Lewis acidity of ferrites.
Similar results are obtained from adsorption studies of n-butylamine followed by
thermogravimetry by Ramankutty and Sugunan [74].
Parallel to the above reported spectral changes, pyridine adsorption causes
decreases in intensity of various surface OH groups, seen as negative absorbance bands in
the difference IR spectrum (Figure 2.9). Since the pyridinium ion is simultaneously
detected on all these samples, it is likely that the reduction of the OH band intensity is due
to the transfer of some protons of these OH groups to the adsorbed pyridine. Hydrogen
bonded and bridged OH groups are expected to be less reactive than isolated terminal OH
groups [53]. The large negative band observed at ~3720 cm-1 (Figure 2.9) indicates that,
isolated OH groups bonded to Fe3+ and Co2+ ions are likely to be involved in pyridinium
ion and α-pyridone formation. An increase in intensity of bands correspond to pyridinium
ion and α-pyridone with increase in temperature up to 473 K (Figures 2.8 and 2.9)
indicates that high temperature is essential to overcome the activation energy barrier for
the formation of these species. Further, α-pyridone and bipyridyl formation is evident from
the observation of a moderately intense band at 1352 cm-1 and unusual broadening of other
bands with high intensity together with other minor features at high temperatures (Figure
2.8). Such bipyridyl species are observed on semiconducting oxides such as Fe2O3 and
Chapter 2: Experimental and Physico-Chemical Characterization
58
SnO2 and is formed via pyridine dimerization by heating [75,76]. The band observed at
1352 cm-1 corresponds to α-pyridone [77] and occurs through a nucleophilic attack of
surface OH group at ~3720 cm-1 on to the 2-position of the aromatic ring [77,78].
2.4.4.3. Basicity of Cu1-xCoxFe2O4
The formation of carbonate like structures upon CO2 adsorption reveals the surface
basicity. Bicarbonates formation causes perturbation of OH groups in the 3800-3500 cm-1
range and formation of certain new OH bands (not shown). Additionally, a weak band
observed at 1220 cm-1 is attributed to the C-O-H bending vibration of bicarbonate [67].
Broad IR bands in the 1800-1200 cm-1 range indicate bidentate species are predominant on
the oxide surface due to CO2 adsorption. On α-Al2O3 [79] and MgO [66, 80], where the
entire cationic coordination is due only to Oh, bidentates are, by far, the most prevailing
structure. The large formation of bidentate carbonates indicates the Cu1-xCoxFe2O4 surface
possess mainly Oh coordinated ions and reiterates our earlier conclusion.
Adsorption studies with EA revealed that Cu-rich compositions possess maximum
number of strong basic sites and the same decreases with increasing x considerably. We
propose that the basic strength of a surface oxide ion is stronger with more coordinative
unsaturations and weaker with greater polarising power of the cations to which it is
bonded. The polarising power increases when there is a rise in charge and size declines and
vice versa. Strong or moderately strong basic sites would arise from structures where
surface oxide ions bridge over two or more bivalent ions, while weak basic sites are
expected on oxide ions bridge over Fe3+ ions. Also the Oh coordinated cation is bigger than
that of Td and hence the polarizing power of the latter is higher than that of the former. Due
to the above points, it is highly plausible that coordinatively unsaturated Oh cations,
preferably divalent cations, offer strong basic sites and hence adsorbents like TCNQ,
chloranil and CO2 preferably adsorb on these sites. It is reasonable to conclude that
adsorption of EA occurs mainly at the Oh sites. From these also it is clear that the Oh cation
plays a significant role in determining the acid base properties of the system. The extent of
spinel inversion decreases with increasing x on Cu1-xCoxFe2O4 indicates less divalent
cations go to Oh sites and hence basicity decreases with increasing x.
Chapter 2: Experimental and Physico-Chemical Characterization
59
Ferrospinels are generally n-type semiconductors, which lose lattice oxygen on
heating, causing anion vacancies. The released electrons are accommodated by reduction
of Fe3+ to Fe2+ ions and, in the case of Cu containing samples, by conversion of Cu2+ to
Cu+ (due to the high reducibility of Cu2+ ion). The presence of free electrons in defect sites
causes an increased basicity and this is maximum for CuFe2O4. This can be due to the
higher susceptibility of CuFe2O4 to the creation of defect sites with calcination, imposed
by the high thermal instability [81] and the special coordination described as (4+2)
coordination of Cu (II) oxide [82].
2.4.4.4. Correlation between theoretical and experimental results
In the following an attempt has been made to correlate experimental results with
theoretical (empirical) quantities. According to Lewis definition, acidity and basicity are
electron accepting and electron donating properties that could contribute to the formation
of a covalent bond. Larger the electronegativity, the stronger the electron accepting power
can be considered as a first approximation [83]. According to Sanderson [84] the
electronegativity of the metal ion would be expected to change linearly with its charge.
Later Zhang [85] has proposed a numerical scale for the acid strengths (Z) of cations and
he defined it as
Z = P - 7.7 χZ + 8 ……………..(7)
where P and χZ are the polarizing power and electronegativity of the ion respectively. The
advantage of such a scale is the predictive power for thermochemical and physical
properties that obviously depend on the nature of the chemical bond established between
the acid cation and the basic anion. In the case of inorganic compounds, this bond is called
iono-covalent, meaning that this bond involves simultaneously electrostatic force (ionic
part) and covalent forces resulting from the combination of atomic orbitals. To express
this duality, for a given cation, Zhang took into account (a) the polarizing power and (b)
the electronegativity for the covalent part. He calculated the polarizing power,
electronegativity and acid strength of various cations [85] and it is noted that the acid
strength of cations relevant to our compositions are in the order Fe3+>Fe2+≈Co2+>Cu2+ >
Cu+.
Chapter 2: Experimental and Physico-Chemical Characterization
60
When an organic molecule like electron donating pyridine adsorbs on the surface,
cations get reduced due to charge transfer. Thus the easily reducible metal ions like Cu2+
undergo fast reduction to Cu+ and hence the stability of metal ion-pyridine complex
decreases. From the acid strength of various cations it is clear that reduced Cu+ has very
poor acidity. In other words, for a given ligand, corresponding stability constants of metal
ions are in the order Fe3+> Co2+ >Cu2+ and hence the acidity of these ions also follow the
same order, as shown earlier.
Recently Lebouteiller and Courtine [86] have developed a new theoretical approach
to calculate the bulk optical basicity value for mixed oxide systems. The attractive feature
of this method is that it includes both valence and coordination number of the ion present
in the compound. The optical basicity (Λ) of various cations in different oxidation state
and coordination environment is calculated and is available in their paper [86].
Λ value of all the compositions can be calculated for both normal and completely
inverse case using equations 8 and 9.
Λnormal IVA2+VIB3+
2O4 = 2/8 * Λ( IVA2+) + 6/8 * Λ( VIB3+) (8)
Λinverse IVB3+VIA2+
VIB3+O4 = 3/8 * Λ( IVB3+) + 2/8 * Λ( VIA2+) + 3/8 * Λ( VIA3+) (9)
The results are tabulated and presented in Table 2.4. From the table it is clear that as the Cu content increases basicity increases and thus
CuFe2O4 is most basic and CoFe2O4 is the least. The results correlate well with the
experimental results (as shown in Figure 4.29, Chapter 4). This suggests that the basic
strength is dominated by global properties with respect to the chemical nature of the
various compositions. Moreover, from the table it is clear that for a given composition,
completely inverse structure has maximum basicity than the corresponding normal
structure. CoFe2O4 is the least inverse and hence it should be the least basic and
experimental results confirm the same.
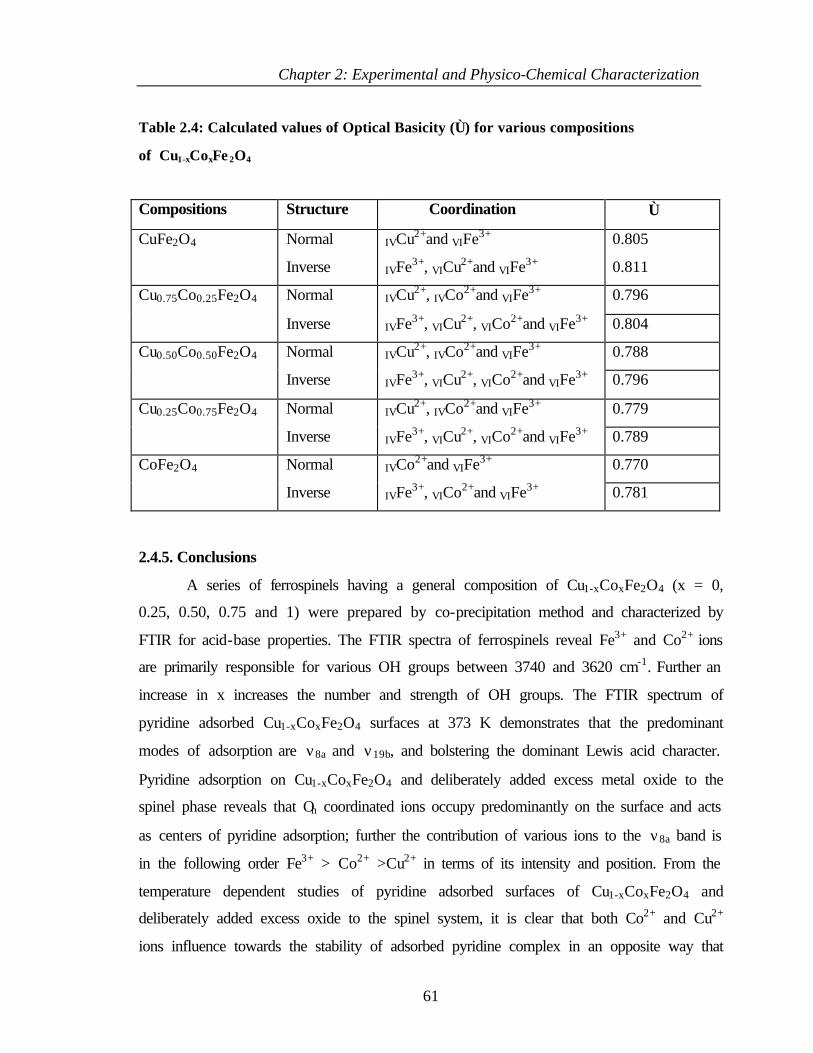
Chapter 2: Experimental and Physico-Chemical Characterization
61
Table 2.4: Calculated values of Optical Basicity (∧) for various compositions
of Cu1-xCoxFe 2O4
Compositions Structure Coordination ∧
Normal IVCu2+and VIFe3+ 0.805 CuFe2O4
Inverse IVFe3+, VICu2+and VIFe3+ 0.811
Normal IVCu2+, IVCo2+and VIFe3+ 0.796 Cu0.75Co0.25Fe2O4
Inverse IVFe3+, VICu2+, VICo2+and VIFe3+ 0.804
Normal IVCu2+, IVCo2+and VIFe3+ 0.788 Cu0.50Co0.50Fe2O4
Inverse IVFe3+, VICu2+, VICo2+and VIFe3+ 0.796
Normal IVCu2+, IVCo2+and VIFe3+ 0.779 Cu0.25Co0.75Fe2O4
Inverse IVFe3+, VICu2+, VICo2+and VIFe3+ 0.789
Normal IVCo2+and VIFe3+ 0.770 CoFe2O4
Inverse IVFe3+, VICo2+and VIFe3+ 0.781
2.4.5. Conclusions
A series of ferrospinels having a general composition of Cu1-xCoxFe2O4 (x = 0,
0.25, 0.50, 0.75 and 1) were prepared by co-precipitation method and characterized by
FTIR for acid-base properties. The FTIR spectra of ferrospinels reveal Fe3+ and Co2+ ions
are primarily responsible for various OH groups between 3740 and 3620 cm-1. Further an
increase in x increases the number and strength of OH groups. The FTIR spectrum of
pyridine adsorbed Cu1-xCoxFe2O4 surfaces at 373 K demonstrates that the predominant
modes of adsorption are ν8a and ν19b, and bolstering the dominant Lewis acid character.
Pyridine adsorption on Cu1-xCoxFe2O4 and deliberately added excess metal oxide to the
spinel phase reveals that Oh coordinated ions occupy predominantly on the surface and acts
as centers of pyridine adsorption; further the contribution of various ions to the ν8a band is
in the following order Fe3+ > Co2+ >Cu2+ in terms of its intensity and position. From the
temperature dependent studies of pyridine adsorbed surfaces of Cu1-xCoxFe2O4 and
deliberately added excess oxide to the spinel system, it is clear that both Co2+ and Cu2+
ions influence towards the stability of adsorbed pyridine complex in an opposite way that
Chapter 2: Experimental and Physico-Chemical Characterization
62
Co2+ impart the stability to the surface. In general, the total intrinsic acidity of Cu1-
xCoxFe2O4 increases with cobalt content. The formation of pyridinium ion indicates the
presence of Bronsted acidity too, however it is weak.
CO2 adsorption on Cu1-xCoxFe2O4 indicates the predominant bidentate complex on
the surface, which requires coordinatively unsaturated Oh ions on the surface. Adsorption
studies of electron acceptors indicate that basicity of the system decreases with increasing
x. CoFe2O4 and CuFe2O4 shows inverse trends in their acidic and basic behaviour and for
0.25≥x≤0.75 there is some compromise between the acidic and basic behavior.
The acidity of the catalysts correlated with the acid strength (Z) of the involved
cations proposed by Zhang, where the polarizing power and electronegativity of the cations
are considered. The acid strength of the cations are in the order of Fe3+ > Co2+ > Cu2+. On
the other hand, basicity correlated with the optical basicity (∧) of corresponding oxides
proposed by Lebouteiller and Courtine, where both valence and coordination number of
the cation present in the compound are considered.
Chapter 2: Experimental and Physico-Chemical Characterization
63
2.5. REFERENCES
1 Ref. 43-47 and 49 of chapter 1
2 N. F. M. Henry, J. Lipson and W. A. Wooster, “The interpretation of x-ray diffraction
photographs” Macmillan and Co Ltd., London, 1951.
3 P. Kubelka and F. Munk, Z. Tech. Phys., 12 (1931) 593.
4 P. Kortum, W. Braun and C. Harzog, Angew. Chem. Int. Ed. Engl., 2 (1963) 333.
5 B. C. Lippens and J. H. de Boer, J. Catal., 4 (1965) 319.
6 E. P. Barret, L. G. Joyner and P. H. Halenda, J. Amer. Chem. Soc., 73 (1951) 373.
7 R. Mossbauer, Z. Phys., 151 (1958) 124.
8 O. C. Kistner and A. W. Sunyar, Phys. Rev. Lett., 4 (1960) 412.
9 K. Lazar, G. Lejeune, R. K. Ahedi, S. S. Shevade and A. N. Kotasthane, J. Phys. Chem. B.,
102 (1998) 4865.
10 T. A. Carlson, X-ray Photoelectron Spectroscopy, Dowden, Hutchinson & Ross:
Stroudsburg, PA, 1978.
11 Practical Surface Analysis, Vol. 1: Auger and X-ray Photoelectron Spectroscopy, 2nd ed.,
D. Briggs, M. P. Seah, Eds., Wiley, New York, 1990.
12 S. Hüfner, Photoelectron Spectroscopy, Springer-Verlag: Berlin, 1995.
13 M. K. Dongare, V. Ramaswamy, C. S. Gopinath, A. V. Ramaswamy, S. Scheurell, M. Brueckner and E. Kemnitz, J. Catal., 199 (2001) 209.
14 V. L. J. Joly, P. A. Joy, S. K. Date and C. S. Gopinath, J. Phys. Condens. Matt., 13 (2001)
649.
15 M. D. Baker, Catal. Rev. Sci. & Eng., 29 (1987) 269.
16 J. A. Lercher, C. Grundling and G. Eder-Mirth, Catal. Today, 27 (1996) 353.
17 J. C. Lavalley, Catal. Today, 27 (1996) 377.
18 M. C. Kung and H. H. Kung, Catal. Rev. Sci. & Eng., 27 (1985) 425.
19 Ref. 28 of chapter 1
20 J. Mexmain, Ann. Chim (Paris), 4 (1969) 429.
21 J. Mexmain, Ann. Chim(Paris), 6 (1971) 297.
22 T. Yamaguchi, Proc. Fac. Eng. Keiogijuku Univ., 19 (1967) 776.
23 J. Smit and H. P. J. Wijn, Advan. Electron. Electronphys., 6 (1954) 83.
24 G. H. Jonker, J. Phys. Chem. Solids, 9 (1959)165.
25 G. H. Sawatzky, F. Van der Woude and A. H. Morrish, J. Appl. Phys. 39 (1968) 1204.
26 G. H. Sawatzky, F. Van der Woude and A. H. Morrish, Phys. Rev. 187 (1969) 747.
Chapter 2: Experimental and Physico-Chemical Characterization
64
27 E. J. W. Verwey and E. L. Heilmann, J. Chem. Phys., 15 (1947) 174.
28 P. Tarte, Spectrochim. Acta, 19 (1965) 49.
29 J. Preudhomma and P. Tarte, Spectrochim. Acta A, 27 (1971) 961.
30 R. D. Waldron, Phys. Rev., 99 (1955)1727.
31 W. B. White and B. A. De Angelis, Spectrochim Acta A, 23 (1967) 985.
32 H. Ohnishi and T. Teranishi., J. Phys. Soc. Jpn., 16 (1961) 35.
33 A. Bergstein and L. Cervinka, Czech J. Phys. Ser. B, 11 (1961) 584.
34 L. Neel, C. R. Acad. Sci. Paris, (1950) 190.
35 H. M. O’Bryan, H. J. Levinstein and R. C. Sherwood, J. Appl. Phys., 37 (1966) 1437.
36 C. Villette, Ph. Tailhades and A. Rousset, J. Solid State Chem., 117 (1995) 64.
37 R. J. Kokes, Intra-Sci. Chem. Rep., 6 (1972) 77.
38 R. L. Burwell, G. L. Haller, K. C. Taylor and J. F. Read, Adv. Catal., 29 (1969) 1.
39 K. Tanabe, Solid Acids and Bases, Academic, New York, 1970.
40 H. H. Kung, J. Solid state chem., 52 (1984) 191.
41 M.C. Kung and H.H. Kung, Catal. Rev. – Sci. Eng., 27 (1985) 425.
42 P. Berteau and B. Delmon, Catal. Today, 5 (1989) 121.
43 G. Busca, Catal. Today, 27 (1996) 323.
44 J.A. Lercher, C. Grundling and G. Edermirth, Catal. Today, 27 (1996) 353.
45 G. Busca, Catal. Today, 41 (1998) 191.
46 J.C. Lavalley, Catal. Today, 27 (1996) 377.
47 G. Ramis, G. Busca and V. Lorenzelli, Mat. Chem. Phys., 29 (1991) 425.
48 R. Philipp and K. Fujimoto, J. Phys. Chem., 96 (1992) 9035.
49 S. Sugunan and G.D. Devika Rani, Indian J. Chem., 32(A) (1993) 993.
50 S. Sugunan and G.D. Devika Rani, J. Material Science, 28 (1993) 4811.
51 Ref. 44-46 of chapter 1
52 G. Busca, V. Lorenzelli, G. Ramis and R. J. Willey, Langmuir, 9 (1993) 1492.
53 C. H. Rochester and S. A. Topham, J. Chem. Soc. Faraday Trans. I., 75 (1979) 1073.
54 C. H. Rochester and S. A. Topham, J. Chem. Soc. Faraday Trans. I., 75 (1979) 1259.
55 G. Busca, V. Lorenzelli, V. S. Escribano and R. Guidetti, J. Catal., 131 (1991) 167.
56 G. Busca, V. Lorenzelli and V. Bolis, Mater. Chem. Phys., 31 (1992) 221.
57 G.Busca, R.Guidetti and V. Lorenzelli, J. Chem. Soc. Faraday Trans., 86 (1990) 989.
58 G. Busca, J. Mol Catal., 43 (1987) 225.
59 C. H. Kline and J. Turkevich, J. Chem. Phys., 12 (1944) 300.
Chapter 2: Experimental and Physico-Chemical Characterization
65
60 C. Morterra, A. Chiorino, G. Ghiotti and E. Garrone, J. Chem. Soc. Faraday Trans. I., 75
(1979) 271.
61 S.Ghorpade, V.S.Darshane and S.G.Dixit, Appl. Catal., A General, 166 (1998) 135.
62 A. Ueno and C.O. Bennett, J. Catal., 54 (1978) 31.
63 G. Busca and V. Lorenzelli, Mater. Chem., 7 (1982) 89.
64 K. Nakamoto, “Infrared and Raman Spectra of Inorganic and Coordination Compounds”,
Third Edn., Wiley, New York, p. 243 (1978).
65 F. Solymosi and H. Knozinger, J. Catal., 122 (1990) 166.
66 C. Morterra, G. Ghiotti, F. Boccuzzi and S. Coluccia, J. Catal., 51 (1978) 299.
67 J. I. DiCosimo, V. K. Diez, M. Xu, E. Iglesia and C. R. Apesteguia, J. Catal., 178 (1998)
499.
68 G. Keresztury, M. Incze, F. Soti and L. Imre, Spectrochim. Acta A, 36 (1980) 1007.
69 R. P. Eischens and W. A. Pliskin, Adv. Catal., 9 (1952) 662.
70 D. M. Griffiths and C.H. Rochester, J. Chem. Soc. Faraday Trans. I, 73 (1977) 1988.
71 K. Esumi, H. Shimade and K. Meguro, Bull. Chem. Soc. Japan, 50 (1977) 2795.
72 K.Esumi, K.Miyata, F.Waki and K.Meguro, Bull. Chem. Soc. Japan, 59 (1986) 3363.
73 J. P. Jacobs, A. Maltha, J. R. H. Reintjes, T. Drimal, V. Ponec and H. H. Brogersma, J.
Catal., 147 (1994) 294.
74 C. G. Ramankutty and S. Sugunan, Appl. Catal. A: General, 218 (2001) 39.
75 G. Busca and V. Lorenzelli, Mater. Chem., 6 (1981) 175.
76 P. G. Harrison and E. W. Thornton, J. Chem. Soc. Faraday Trans. I, 71 (1975) 1013.
77 H. Knozinger, H. Krietenbrink, H. D. Muller and W. Schulz, Proc. Sixth Internat. Congress on Catalysis (The Chemical Society, London, 1977), Vol. 1, p.183.
78 E.Borello, G.D.Gatta, B.Fubini, C.Morterra and G.Venturello, J. Catal., 35 (1974) 1.
79 C. Morterra, S. Coluccia, G. Ghiotti and A. Zecchina, Z. Physik. Chem. Frankfurt (N.F),
104 (1977) 275.
80 J. V. Evans and T. D. Whately, Trans. Faraday Soc., 63 (1967) 2769.
81 J.L.G. Fierro and J.F. Garcia de la Banda, Catal. Rev. – Sci. Eng., 28 (1986) 265.
82 A.F. Wells, Structural Inorganic Chemistry, 4th Edition, ELBS, London, p. 890 (1979).
83 J. Kijenski and A. Baiker, Catal. Today, 5 (1989) 1.
84 R.T. Sanderson, Inorganic Chemistry, Reinhold: New York, p. 136 (1967).
85 Y. Zhang, Inorg. Chem., 21 (1982) 3889.
86 A. Lebouteiller and P. Courtine, J. Solid state Chemistry, 137 (1998) 94.
Chapter 3: Catalytic Activity Studies and Mechanism of Phenol Methylation
66
SECTION I
3.1. INTRODUCTION
Phenol can be alkylated with methanol in the liquid or gas phase. Liquid phase
phenol methylation is generally carried out in the presence of Lewis acid catalyst and it
gives ortho and para substitution with low selectivity [1,2]. Further, it gives numerous side
products and their separation is difficult. Moreover, it is technologically unfavourable due
to long reaction times, high pressure, high consumption of catalyst and troublesome
regeneration [1-3].
Among various methylation agents, methanol is the most promising and
economically demanded than DMC and conventional methylating agents such as dimethyl
sulphate and methyl chloride [1,3]. Conventional processes are atom inefficient and
generate large amount of waste. For example, if one were to alkylate cresol
stoichiometrically with dimethyl sulphate and neutralize the H2SO4 with sodium carbonate,
the atom efficiency (AE) would be just 0.58. On the other hand, the direct methylation
with methanol will have an AE of 0.87, the only byproduct being water. Besides,
methanol is far cheaper and easier to handle than methyl sulphate. Though DMC is more
environmental friendly than methanol, with the former less selectivity is achieved towards
ortho methylation.
Vapour phase methylation of phenol with methanol using solid acid catalysts is the
most recommended process for C-alkylation. Gas phase methylation of phenol by CH3OH
was reported by Ipatieff as early as 1925 [4]. Later, solid catalysts of the mixed oxides
type containing basic sites, or acidic and basic sites, were found to catalyze efficiently the
methylation of phenols with methyl alcohol with high selectivity for ortho methylation.
Usually in the gas phase, methanol and phenol vapours react in a flow reactor under
atmospheric pressure in the temperature range of 300-4200C. The catalyst used forms a
stationary bed. Often water is added to the feed in an amount of 5-15 % by weight of the
total amount of phenol and methanol.
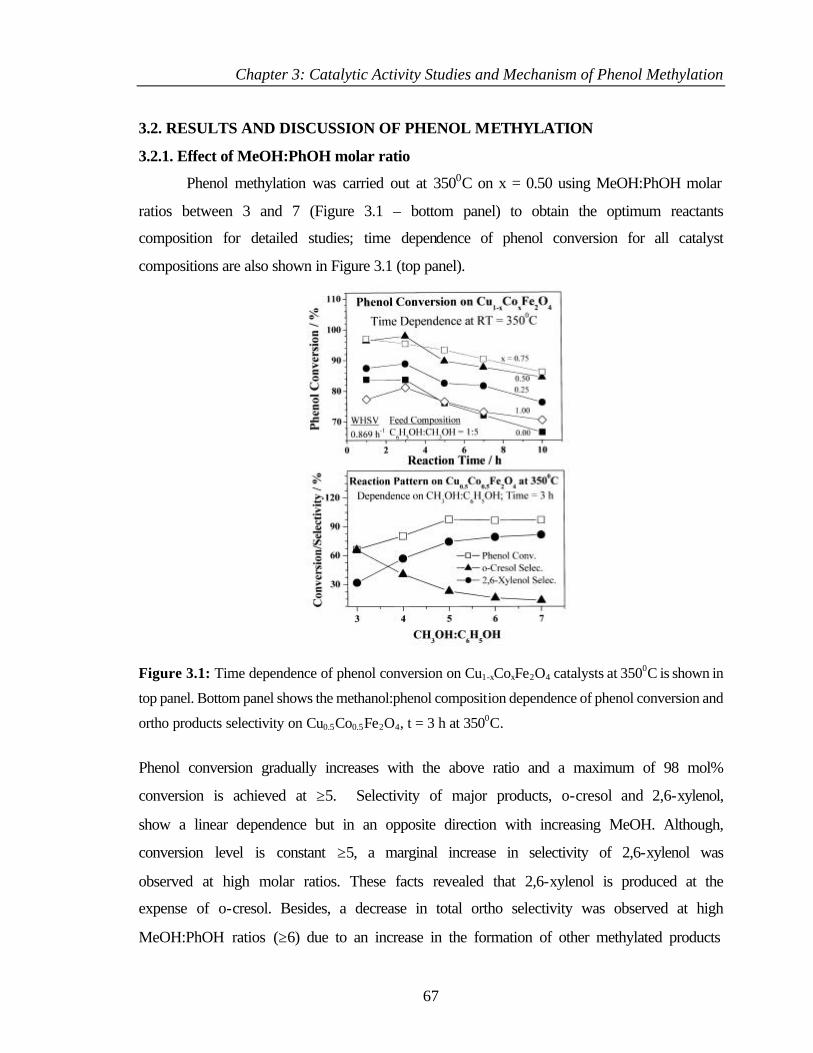
Chapter 3: Catalytic Activity Studies and Mechanism of Phenol Methylation
67
3.2. RESULTS AND DISCUSSION OF PHENOL METHYLATION
3.2.1. Effect of MeOH:PhOH molar ratio
Phenol methylation was carried out at 3500C on x = 0.50 using MeOH:PhOH molar
ratios between 3 and 7 (Figure 3.1 – bottom panel) to obtain the optimum reactants
composition for detailed studies; time dependence of phenol conversion for all catalyst
compositions are also shown in Figure 3.1 (top panel).
Figure 3.1: Time dependence of phenol conversion on Cu1-xCoxFe2O4 catalysts at 3500C is shown in
top panel. Bottom panel shows the methanol:phenol composition dependence of phenol conversion and
ortho products selectivity on Cu0.5Co0.5Fe2O4, t = 3 h at 3500C.
Phenol conversion gradually increases with the above ratio and a maximum of 98 mol%
conversion is achieved at ≥5. Selectivity of major products, o-cresol and 2,6-xylenol,
show a linear dependence but in an opposite direction with increasing MeOH. Although,
conversion level is constant ≥5, a marginal increase in selectivity of 2,6-xylenol was
observed at high molar ratios. These facts revealed that 2,6-xylenol is produced at the
expense of o-cresol. Besides, a decrease in total ortho selectivity was observed at high
MeOH:PhOH ratios (≥6) due to an increase in the formation of other methylated products
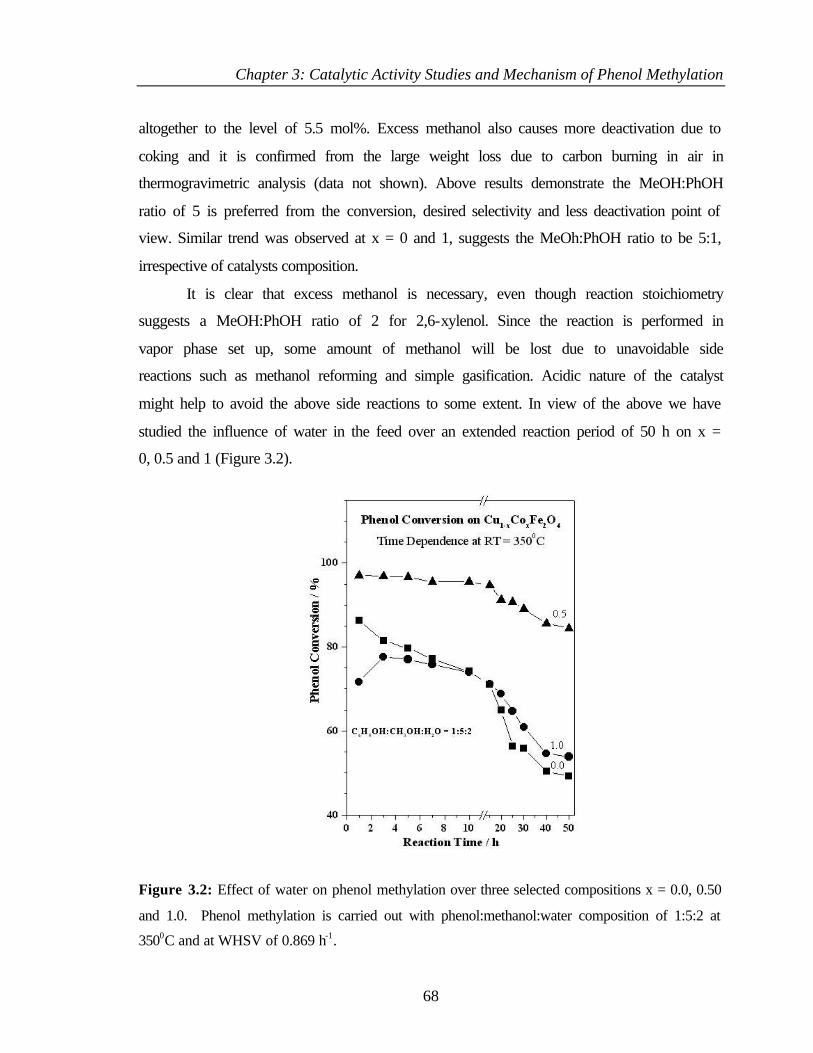
Chapter 3: Catalytic Activity Studies and Mechanism of Phenol Methylation
68
altogether to the level of 5.5 mol%. Excess methanol also causes more deactivation due to
coking and it is confirmed from the large weight loss due to carbon burning in air in
thermogravimetric analysis (data not shown). Above results demonstrate the MeOH:PhOH
ratio of 5 is preferred from the conversion, desired selectivity and less deactivation point of
view. Similar trend was observed at x = 0 and 1, suggests the MeOh:PhOH ratio to be 5:1,
irrespective of catalysts composition.
It is clear that excess methanol is necessary, even though reaction stoichiometry
suggests a MeOH:PhOH ratio of 2 for 2,6-xylenol. Since the reaction is performed in
vapor phase set up, some amount of methanol will be lost due to unavoidable side
reactions such as methanol reforming and simple gasification. Acidic nature of the catalyst
might help to avoid the above side reactions to some extent. In view of the above we have
studied the influence of water in the feed over an extended reaction period of 50 h on x =
0, 0.5 and 1 (Figure 3.2).
Figure 3.2: Effect of water on phenol methylation over three selected compositions x = 0.0, 0.50
and 1.0. Phenol methylation is carried out with phenol:methanol:water composition of 1:5:2 at
3500C and at WHSV of 0.869 h-1.
Chapter 3: Catalytic Activity Studies and Mechanism of Phenol Methylation
69
PhOH:MeOH:H2O ratio of 1:5:2 was used in this study. Generally, a prolonged stability is
observed with considerably low deactivation compared to the feed without H2O. Needless
to say the advantage of H2O in the feed is that the steam will suppress coke formation by
water gas shift reaction and will maintain catalytic activity for longer period. Further,
methylation carried out in H2 atmosphere showed fast deactivation of the catalyst with low
PhOH conversion demonstrate large reduction of catalyst suppresses the methylation and
hints the metallic species are not the methylation centers. Besides test reactions were
carried out with MeOH alone on ferrospinels shows typical reformate products and after
about 5h methanol started condensing additionally. Thermogravimetric analysis of the
above catalysts clearly exhibit the amount of coke is comparable to that of treated with 1:5
ratio of PhOH:MeOH. This hints the coke formation is mostly due to MeOH
decomposition and other routes like phenol-resin polymerization is less likely under our
experimental conditions.
Figure 3.1 (top panel) shows decrease in phenol conversion, in general, with
reaction time at any catalyst composition. Comparable high phenol conversion is observed
at x = 0.5 and 0.75 and all other compositions show relatively lower conversion levels.
Phenol methylation gave predominant (≥97.5 mol%) ortho methylated products viz. o-
cresol and 2,6-xylenol over Cu1-xCoxFe2O4 (Figures 3.3 and 3.4). Minor products such as
anisole, 2,4-xylenol, p-cresol and 2,4,6-trimethyl phenol (TMP) etc. were also produced
altogether in 0.5-2.5 mol% range (Tables 3.1 and 3.2) irrespective of the composition and
temperature. However, ≥3750C a slight increase in side products up to 5 mol% was
observed. Detailed results are presented in the following.
3.2.2. Effect of catalyst composition
Figure 3.3 shows the selectivity of (a) o-cresol and (b) 2,6-xylenol and (c) phenol
conversion as a function of catalyst composition at different temperatures. The product
distribution obtained from phenol methylation reaction over Cu1-xCoxFe2O4 under the
optimized conditions (Temperature = 3500C, PhOH:MeOH mole ratio = 1:5, WHSV =
0.869 h-1 and TOS = 3) is presented in Table 3.1.
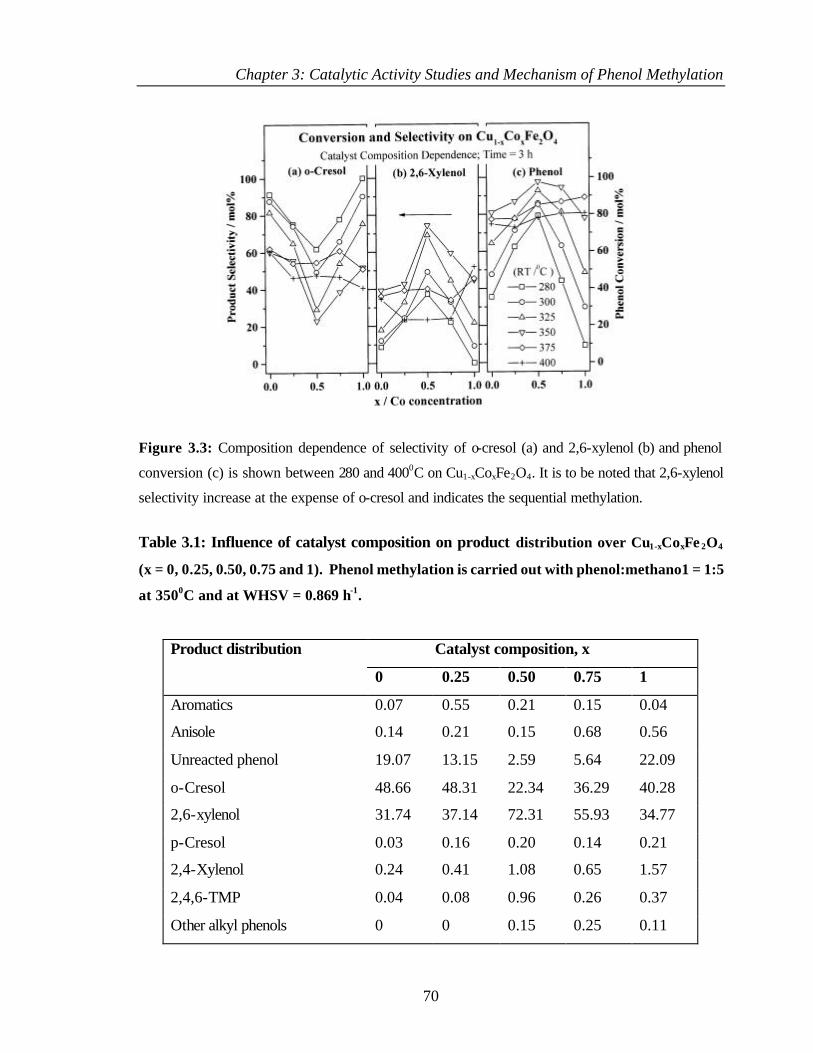
Chapter 3: Catalytic Activity Studies and Mechanism of Phenol Methylation
70
Figure 3.3: Composition dependence of selectivity of o-cresol (a) and 2,6-xylenol (b) and phenol
conversion (c) is shown between 280 and 4000C on Cu1-xCoxFe2O4. It is to be noted that 2,6-xylenol
selectivity increase at the expense of o-cresol and indicates the sequential methylation.
Table 3.1: Influence of catalyst composition on product distribution over Cu1-xCoxFe 2O4
(x = 0, 0.25, 0.50, 0.75 and 1). Phenol methylation is carried out with phenol:methano1 = 1:5
at 3500C and at WHSV = 0.869 h-1.
Catalyst composition, x Product distribution
0 0.25 0.50 0.75 1
Aromatics 0.07 0.55 0.21 0.15 0.04
Anisole 0.14 0.21 0.15 0.68 0.56
Unreacted phenol 19.07 13.15 2.59 5.64 22.09
o-Cresol 48.66 48.31 22.34 36.29 40.28
2,6-xylenol 31.74 37.14 72.31 55.93 34.77
p-Cresol 0.03 0.16 0.20 0.14 0.21
2,4-Xylenol 0.24 0.41 1.08 0.65 1.57
2,4,6-TMP 0.04 0.08 0.96 0.26 0.37
Other alkyl phenols 0 0 0.15 0.25 0.11
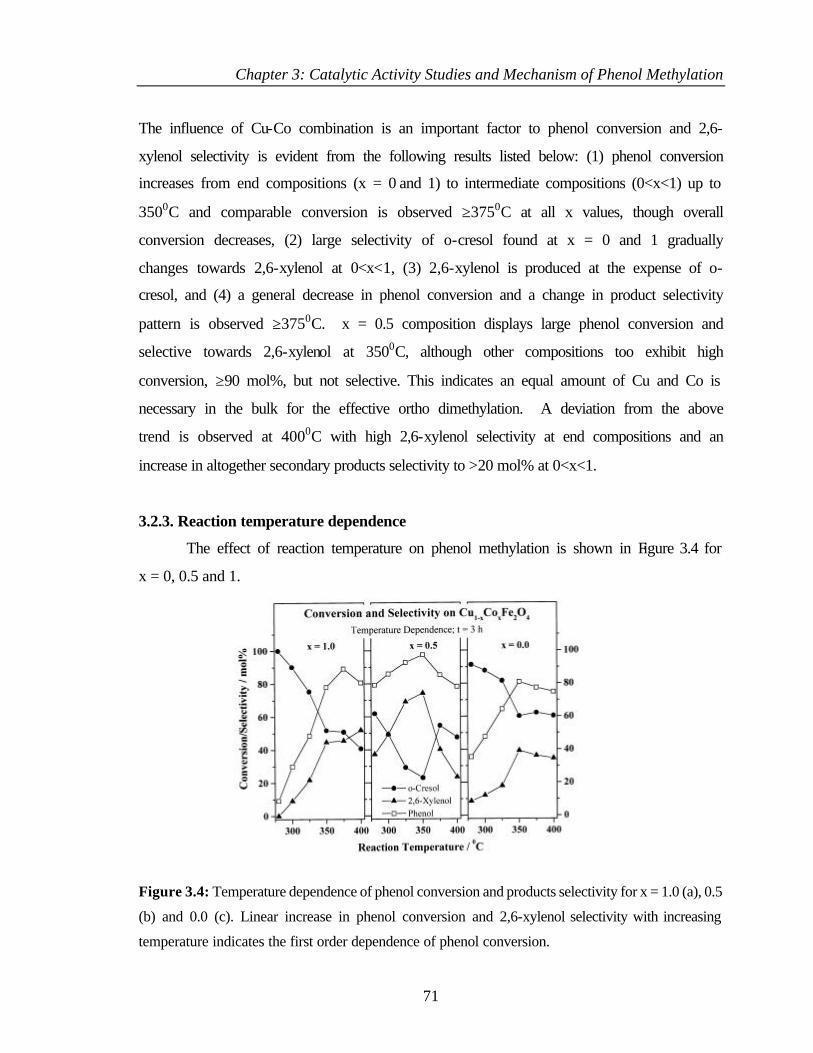
Chapter 3: Catalytic Activity Studies and Mechanism of Phenol Methylation
71
The influence of Cu-Co combination is an important factor to phenol conversion and 2,6-
xylenol selectivity is evident from the following results listed below: (1) phenol conversion
increases from end compositions (x = 0 and 1) to intermediate compositions (0<x<1) up to
3500C and comparable conversion is observed ≥3750C at all x values, though overall
conversion decreases, (2) large selectivity of o-cresol found at x = 0 and 1 gradually
changes towards 2,6-xylenol at 0<x<1, (3) 2,6-xylenol is produced at the expense of o-
cresol, and (4) a general decrease in phenol conversion and a change in product selectivity
pattern is observed ≥3750C. x = 0.5 composition displays large phenol conversion and
selective towards 2,6-xylenol at 3500C, although other compositions too exhibit high
conversion, ≥90 mol%, but not selective. This indicates an equal amount of Cu and Co is
necessary in the bulk for the effective ortho dimethylation. A deviation from the above
trend is observed at 4000C with high 2,6-xylenol selectivity at end compositions and an
increase in altogether secondary products selectivity to >20 mol% at 0<x<1.
3.2.3. Reaction temperature dependence
The effect of reaction temperature on phenol methylation is shown in Figure 3.4 for
x = 0, 0.5 and 1.
Figure 3.4: Temperature dependence of phenol conversion and products selectivity for x = 1.0 (a), 0.5
(b) and 0.0 (c). Linear increase in phenol conversion and 2,6-xylenol selectivity with increasing
temperature indicates the first order dependence of phenol conversion.
Chapter 3: Catalytic Activity Studies and Mechanism of Phenol Methylation
72
Table 3.2 summarizes the effect of reaction temperature towards product distribution over
x = 0.50 at a temperature range between 280 and 4000C. These results have been
presented above, but are displayed in a new way here to highlight the correlation between
conversion and selectivity. Figure 3.4 and Table 3.2 demonstrates: (1) Phenol conversion
increases linearly with temperature up to 3500C and a concurrent increase (decrease) in
2,6-xylenol (o-cresol) selectivity is observed at any given x. (2) Positive and negative first
order dependence on phenol conversion for 2,6-xylenol and o-cresol selectivity,
respectively, for all composition up to 3500C, (3) Decrease in o-cresol production is
compensated by an increase in 2,6-xylenol selectivity explains the methylation is
sequential and methylation rate also increases with temperature up to 3500C, and (4)
Importance of 1:1 ratio of Cu:Co combination in x = 0.5 at 2800C by displaying
comparable catalytic activity as that of end compositions at T≥3500C.
Table 3.2: Effect of temperature on product distribution over Cu0.50Co0.50Fe 2O4. Phenol
methylation is carried out with phenol:methano1 = 1:5 at 3500C and at WHSV = 0.869 h-1.
Temperature Product Distribution
(Mol %) 280 300 325 350 375 400
Aromatics 0 0 0.13 0.21 1.34 18.79
Anisole 0.08 0.15 0.16 0.15 0.40 0.09
Unreacted phenol 20.83 14.10 7.26 2.59 14.82 21.80
o-Cresol 48.92 42.41 27.04 22.34 46.49 37.16
2,6-xylenol 29.47 42.28 64.00 72.31 34.10 18.29
p-Cresol 0.20 0.32 0.14 0.20 0.27 0.25
2,4-Xylenol 0.22 0.20 0.81 1.08 1.16 1.09
2,4,6-TMP 0.23 0.38 0.28 0.96 1.00 1.05
Other alkyl phenols 0.05 0.17 0.16 0.15 0.37 0.98
Biphenyls 0 0 0 0 0.05 0.53
Chapter 3: Catalytic Activity Studies and Mechanism of Phenol Methylation
73
3.2.4. Discussion
An important aspect of the methylation reaction to the discussion presented here is
related to the dependence of the product selectivity on phenol conversion. High phenol
conversion (98 mol%) and 2,6-xylenol selectivity (75 mol%) is achieved at x = 0.5
composition between 325 and 3500C. However on moving either side of the above
conditions, in terms of reaction temperature as well as catalyst compositions, increases the
selectivity of o-cresol with decreasing phenol conversion (Figures 3.3 and 3.4). A linear
relation is shown between increasing phenol conversion and 2,6-xylenol selectivity at
temperatures upto 3500C in Figure 3.4. Hence high phenol conversion becomes a
prerequisite for dimethylation to produce 2,6-xylenol. However this is not the case with o-
cresol, as its selectivity declines with increasing phenol conversion. These two points
actually suggests the stepwise methylation of PhOH to 2,6-xylenol through o-cresol at high
phenol conversion. Near total ortho products formation below 3500C at all x values
indicates, in general, the desorption of ortho products are high. At high MeOH:PhOH
ratios (≥6) high methylation capacity with low phenol on the catalyst surface leads to more
secondary products.
Low selectivity of 2,6-xylenol observed at x = 0 and 1 is attributed to high
gasification of MeOH than its decomposition. This is clearly supported by the low carbon
content on the spent catalysts at x = 0 and 1 compositions (Chapter 4, Table 4.7 and Figure
4.6). Better selectivity of 2,6-xylenol and high C content observed clearly suggests the
methanol decomposition is increasing at 0<x<1 (Figures 3.3 and 3.4). This is further clear
from the very high 2,6-xylenol selectivity (≥80 mol%) observed at x = 0.5 with high
MeOH:PhOH ratio of 6 and 7 (Figure 3.1). Mixed metal oxides of CuO-Fe2O3 and CoO-
Fe2O3 shows about 68% methanol gasification [5] at 3500C supports our findings and the
necessity of high methanol in this reaction on ferrospinels. Although x = 0 and 1 shows
decreasing phenol conversion at T>3750C, an increase in 2,6-xylenol selectivity indicates
an increase in methanol decomposition and dimethylation capacity.
Introduction of Co in CuFe2O4 system (at x = 0.25) shows an increase in phenol
conversion to 62 mol% from 35 mol% at x = 0.0 at 2800C (Figure 3.3). Contrarily,
introduction of Cu in CoFe2O4 (x = 0.75) displays an increase in phenol conversion five
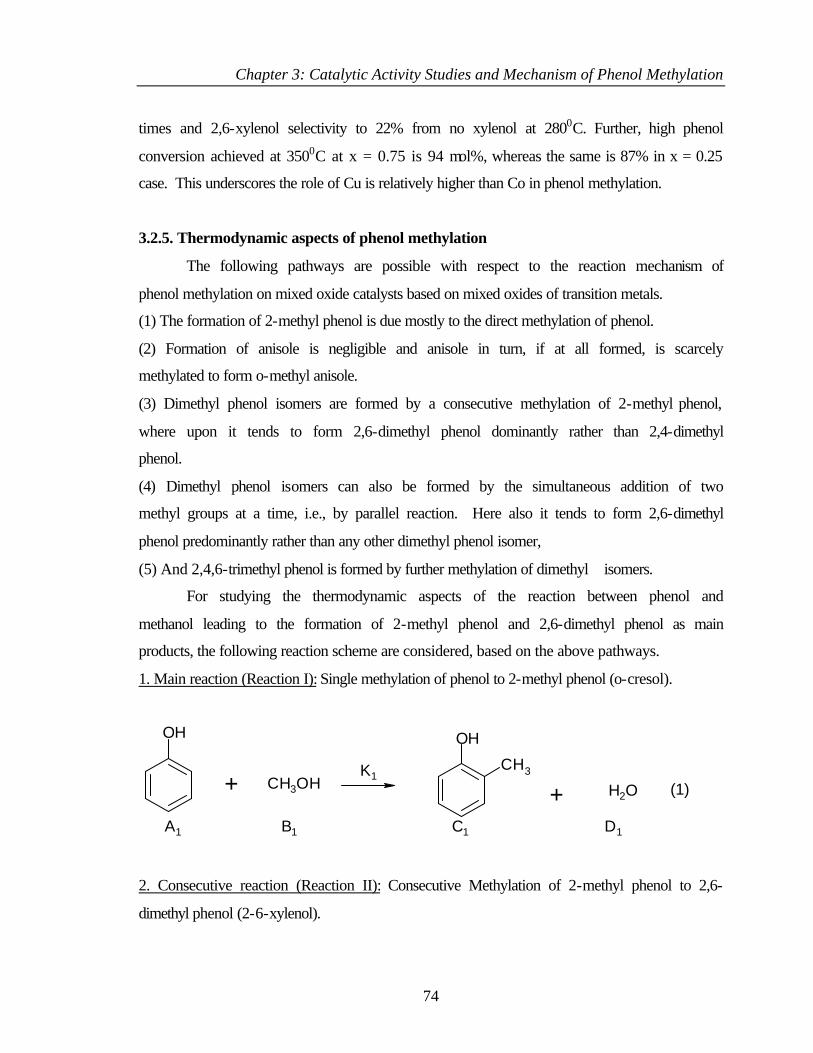
Chapter 3: Catalytic Activity Studies and Mechanism of Phenol Methylation
74
times and 2,6-xylenol selectivity to 22% from no xylenol at 2800C. Further, high phenol
conversion achieved at 3500C at x = 0.75 is 94 mol%, whereas the same is 87% in x = 0.25
case. This underscores the role of Cu is relatively higher than Co in phenol methylation.
3.2.5. Thermodynamic aspects of phenol methylation
The following pathways are possible with respect to the reaction mechanism of
phenol methylation on mixed oxide catalysts based on mixed oxides of transition metals.
(1) The formation of 2-methyl phenol is due mostly to the direct methylation of phenol.
(2) Formation of anisole is negligible and anisole in turn, if at all formed, is scarcely
methylated to form o-methyl anisole.
(3) Dimethyl phenol isomers are formed by a consecutive methylation of 2-methyl phenol,
where upon it tends to form 2,6-dimethyl phenol dominantly rather than 2,4-dimethyl
phenol.
(4) Dimethyl phenol isomers can also be formed by the simultaneous addition of two
methyl groups at a time, i.e., by parallel reaction. Here also it tends to form 2,6-dimethyl
phenol predominantly rather than any other dimethyl phenol isomer,
(5) And 2,4,6-trimethyl phenol is formed by further methylation of dimethyl isomers.
For studying the thermodynamic aspects of the reaction between phenol and
methanol leading to the formation of 2-methyl phenol and 2,6-dimethyl phenol as main
products, the following reaction scheme are considered, based on the above pathways.
1. Main reaction (Reaction I): Single methylation of phenol to 2-methyl phenol (o-cresol).
OH
+ CH3OH
OH
CH3
+ H2O (1)
A1 B1 C1 D1
K1
2. Consecutive reaction (Reaction II): Consecutive Methylation of 2-methyl phenol to 2,6-
dimethyl phenol (2-6-xylenol).
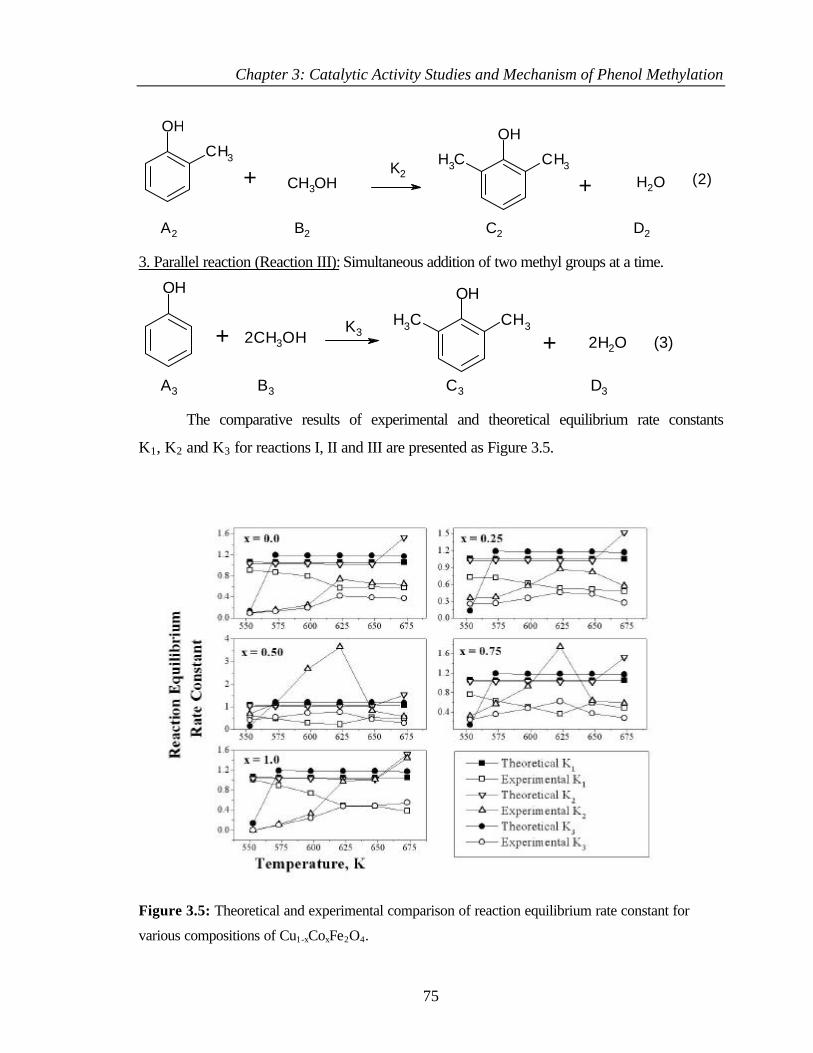
Chapter 3: Catalytic Activity Studies and Mechanism of Phenol Methylation
75
OH
CH3
+ CH3OH
OH
CH3CH3
+ H2O (2)
A2 B2 C2 D2
K2
3. Parallel reaction (Reaction III): Simultaneous addition of two methyl groups at a time.
OH
+
OH
CH3CH3
+ 2CH3OH 2H2O (3)
A3 B3 C3 D3
K3
The comparative results of experimental and theoretical equilibrium rate constants
K1, K2 and K3 for reactions I, II and III are presented as Figure 3.5.
Figure 3.5: Theoretical and experimental comparison of reaction equilibrium rate constant for
various compositions of Cu1-xCoxFe2O4.
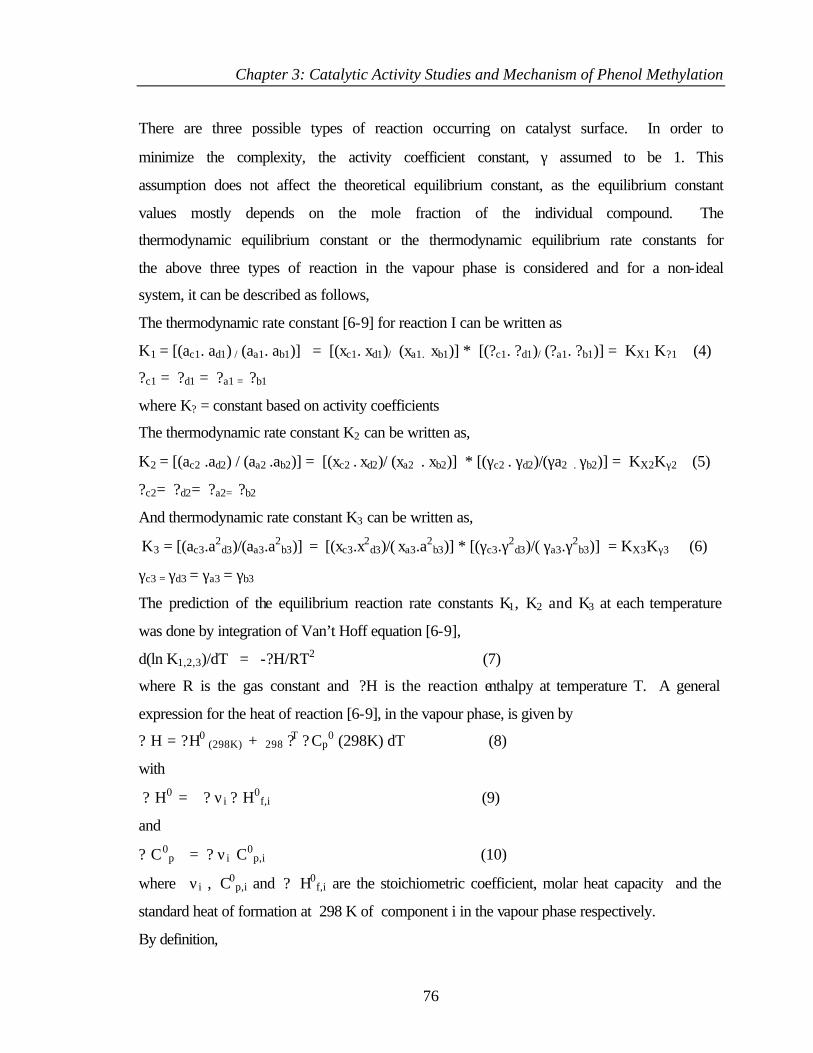
Chapter 3: Catalytic Activity Studies and Mechanism of Phenol Methylation
76
There are three possible types of reaction occurring on catalyst surface. In order to
minimize the complexity, the activity coefficient constant, γ assumed to be 1. This
assumption does not affect the theoretical equilibrium constant, as the equilibrium constant
values mostly depends on the mole fraction of the individual compound. The
thermodynamic equilibrium constant or the thermodynamic equilibrium rate constants for
the above three types of reaction in the vapour phase is considered and for a non-ideal
system, it can be described as follows,
The thermodynamic rate constant [6-9] for reaction I can be written as
K1 = [(ac1. ad1) / (aa1. ab1)] = [(xc1. xd1)/ (xa1. xb1)] * [(?c1. ?d1)/ (?a1. ?b1)] = KX1 K?1 (4)
?c1 = ?d1 = ?a1 = ?b1
where K? = constant based on activity coefficients
The thermodynamic rate constant K2 can be written as,
K2 = [(ac2 .ad2) / (aa2 .ab2)] = [(xc2 . xd2)/ (xa2 . xb2)] * [(γc2 . γd2)/(γa2 . γb2)] = KX2Kγ2 (5)
?c2= ?d2= ?a2= ?b2
And thermodynamic rate constant K3 can be written as,
K3 = [(ac3.a2d3)/(aa3.a2
b3)] = [(xc3.x2d3)/( xa3.a2
b3)] * [(γc3.γ2d3)/( γa3.γ2
b3)] = KX3Kγ3 (6)
γc3 = γd3 = γa3 = γb3
The prediction of the equilibrium reaction rate constants K1, K2 and K3 at each temperature
was done by integration of Van’t Hoff equation [6-9],
d(ln K1,2,3)/dT = -?H/RT2 (7)
where R is the gas constant and ?H is the reaction enthalpy at temperature T. A general
expression for the heat of reaction [6-9], in the vapour phase, is given by
? H = ?H0 (298K) + 298 ?T ? Cp
0 (298K) dT (8)
with
? H0 = ? νi ? H0f,i (9)
and
? C0p
= ? νi C0p,i (10)
where νi , C0p,i and ? H0
f,i are the stoichiometric coefficient, molar heat capacity and the
standard heat of formation at 298 K of component i in the vapour phase respectively.
By definition,
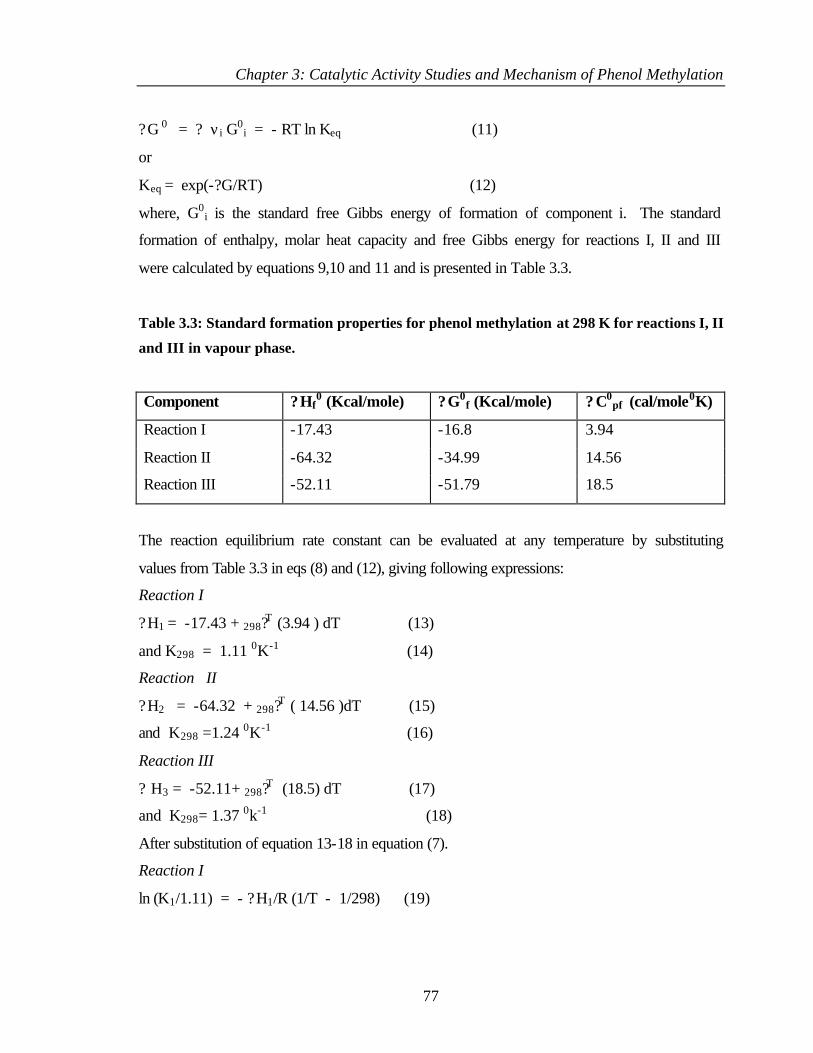
Chapter 3: Catalytic Activity Studies and Mechanism of Phenol Methylation
77
?G 0 = ? νi G0i = - RT ln Keq (11)
or
Keq = exp(-?G/RT) (12)
where, G0i is the standard free Gibbs energy of formation of component i. The standard
formation of enthalpy, molar heat capacity and free Gibbs energy for reactions I, II and III
were calculated by equations 9,10 and 11 and is presented in Table 3.3.
Table 3.3: Standard formation properties for phenol methylation at 298 K for reactions I, II
and III in vapour phase.
Component ?Hf0 (Kcal/mole) ?G0
f (Kcal/mole) ? C0pf (cal/mole0K)
Reaction I -17.43 -16.8 3.94
Reaction II -64.32 -34.99 14.56
Reaction III -52.11 -51.79 18.5
The reaction equilibrium rate constant can be evaluated at any temperature by substituting
values from Table 3.3 in eqs (8) and (12), giving following expressions:
Reaction I
?H1 = -17.43 + 298?T (3.94 ) dT (13)
and K298 = 1.11 0K-1 (14)
Reaction II
?H2 = -64.32 + 298?T ( 14.56 )dT (15)
and K298 =1.24 0K-1 (16)
Reaction III
? H3 = -52.11+ 298?T (18.5) dT (17)
and K298= 1.37 0k-1 (18)
After substitution of equation 13-18 in equation (7).
Reaction I
ln (K1/1.11) = - ?H1/R (1/T - 1/298) (19)
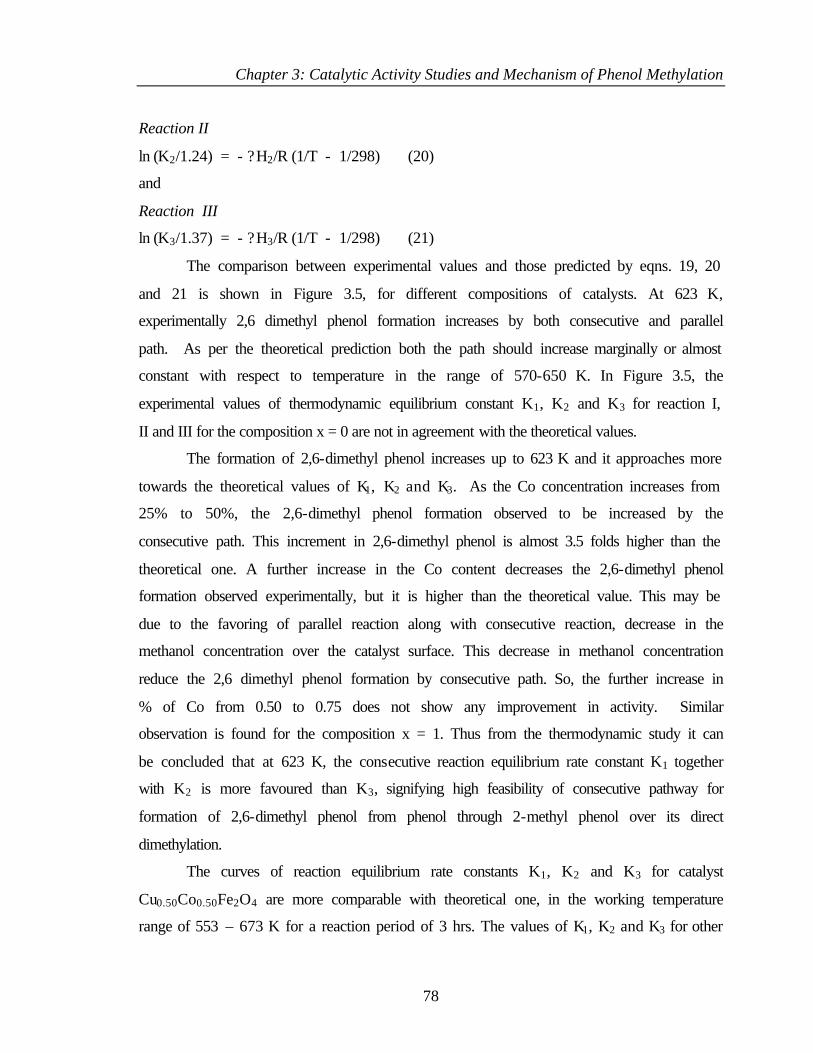
Chapter 3: Catalytic Activity Studies and Mechanism of Phenol Methylation
78
Reaction II
ln (K2/1.24) = - ?H2/R (1/T - 1/298) (20)
and
Reaction III
ln (K3/1.37) = - ?H3/R (1/T - 1/298) (21)
The comparison between experimental values and those predicted by eqns. 19, 20
and 21 is shown in Figure 3.5, for different compositions of catalysts. At 623 K,
experimentally 2,6 dimethyl phenol formation increases by both consecutive and parallel
path. As per the theoretical prediction both the path should increase marginally or almost
constant with respect to temperature in the range of 570-650 K. In Figure 3.5, the
experimental values of thermodynamic equilibrium constant K1, K2 and K3 for reaction I,
II and III for the composition x = 0 are not in agreement with the theoretical values.
The formation of 2,6-dimethyl phenol increases up to 623 K and it approaches more
towards the theoretical values of K1, K2 and K3. As the Co concentration increases from
25% to 50%, the 2,6-dimethyl phenol formation observed to be increased by the
consecutive path. This increment in 2,6-dimethyl phenol is almost 3.5 folds higher than the
theoretical one. A further increase in the Co content decreases the 2,6-dimethyl phenol
formation observed experimentally, but it is higher than the theoretical value. This may be
due to the favoring of parallel reaction along with consecutive reaction, decrease in the
methanol concentration over the catalyst surface. This decrease in methanol concentration
reduce the 2,6 dimethyl phenol formation by consecutive path. So, the further increase in
% of Co from 0.50 to 0.75 does not show any improvement in activity. Similar
observation is found for the composition x = 1. Thus from the thermodynamic study it can
be concluded that at 623 K, the consecutive reaction equilibrium rate constant K1 together
with K2 is more favoured than K3, signifying high feasibility of consecutive pathway for
formation of 2,6-dimethyl phenol from phenol through 2-methyl phenol over its direct
dimethylation.
The curves of reaction equilibrium rate constants K1, K2 and K3 for catalyst
Cu0.50Co0.50Fe2O4 are more comparable with theoretical one, in the working temperature
range of 553 – 673 K for a reaction period of 3 hrs. The values of K1, K2 and K3 for other
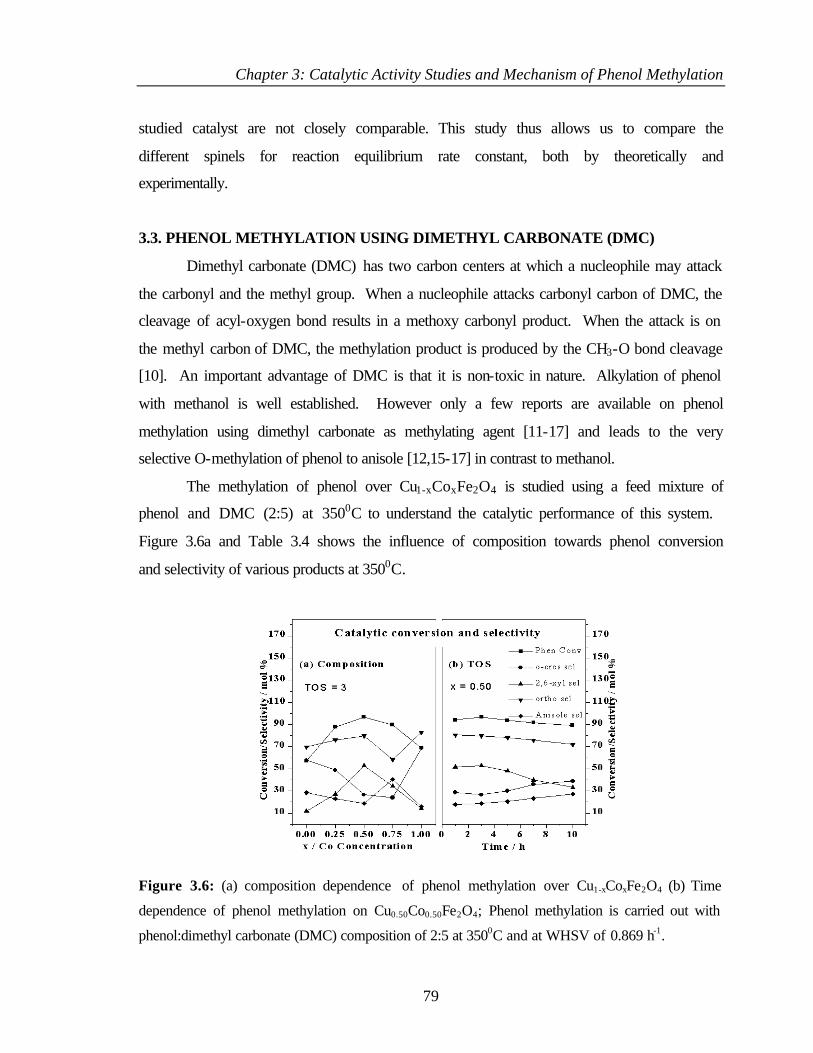
Chapter 3: Catalytic Activity Studies and Mechanism of Phenol Methylation
79
studied catalyst are not closely comparable. This study thus allows us to compare the
different spinels for reaction equilibrium rate constant, both by theoretically and
experimentally.
3.3. PHENOL METHYLATION USING DIMETHYL CARBONATE (DMC)
Dimethyl carbonate (DMC) has two carbon centers at which a nucleophile may attack
the carbonyl and the methyl group. When a nucleophile attacks carbonyl carbon of DMC, the
cleavage of acyl-oxygen bond results in a methoxy carbonyl product. When the attack is on
the methyl carbon of DMC, the methylation product is produced by the CH3-O bond cleavage
[10]. An important advantage of DMC is that it is non-toxic in nature. Alkylation of phenol
with methanol is well established. However only a few reports are available on phenol
methylation using dimethyl carbonate as methylating agent [11-17] and leads to the very
selective O-methylation of phenol to anisole [12,15-17] in contrast to methanol.
The methylation of phenol over Cu1-xCoxFe2O4 is studied using a feed mixture of
phenol and DMC (2:5) at 3500C to understand the catalytic performance of this system.
Figure 3.6a and Table 3.4 shows the influence of composition towards phenol conversion
and selectivity of various products at 3500C.
Figure 3.6: (a) composition dependence of phenol methylation over Cu1-xCoxFe2O4 (b) Time
dependence of phenol methylation on Cu0.50Co0.50Fe2O4; Phenol methylation is carried out with
phenol:dimethyl carbonate (DMC) composition of 2:5 at 3500C and at WHSV of 0.869 h-1.
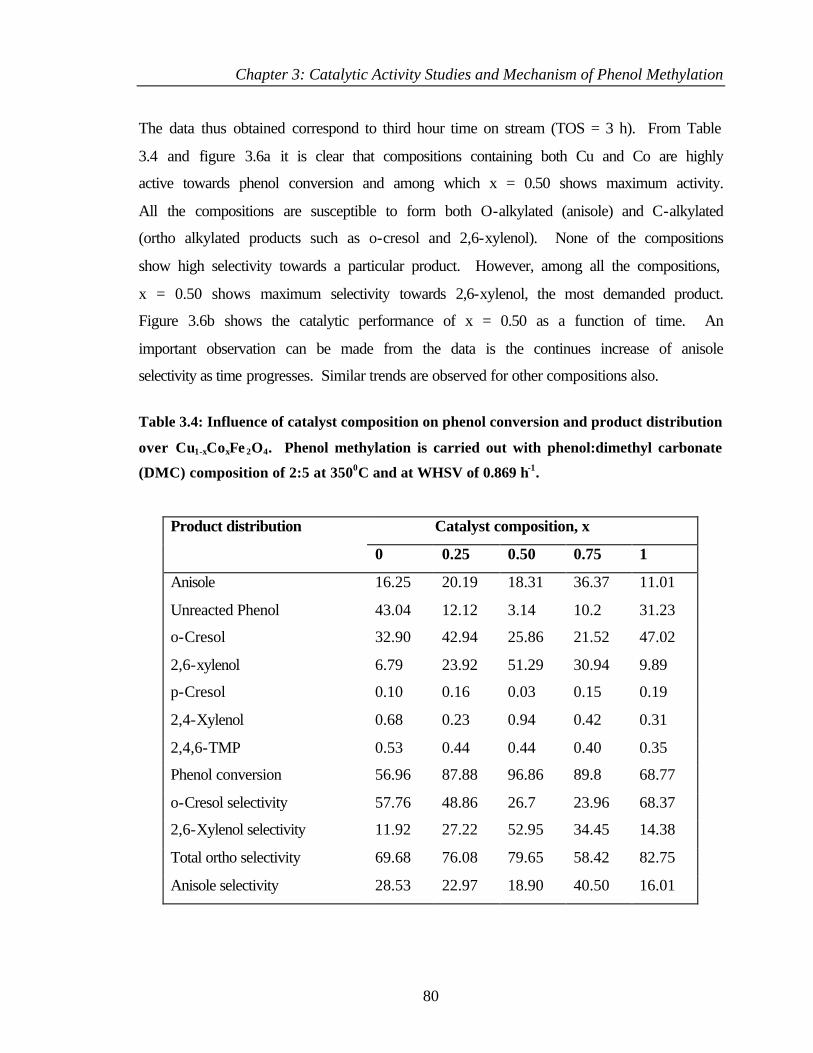
Chapter 3: Catalytic Activity Studies and Mechanism of Phenol Methylation
80
The data thus obtained correspond to third hour time on stream (TOS = 3 h). From Table
3.4 and figure 3.6a it is clear that compositions containing both Cu and Co are highly
active towards phenol conversion and among which x = 0.50 shows maximum activity.
All the compositions are susceptible to form both O-alkylated (anisole) and C-alkylated
(ortho alkylated products such as o-cresol and 2,6-xylenol). None of the compositions
show high selectivity towards a particular product. However, among all the compositions,
x = 0.50 shows maximum selectivity towards 2,6-xylenol, the most demanded product.
Figure 3.6b shows the catalytic performance of x = 0.50 as a function of time. An
important observation can be made from the data is the continues increase of anisole
selectivity as time progresses. Similar trends are observed for other compositions also.
Table 3.4: Influence of catalyst composition on phenol conversion and product distribution
over Cu1-xCoxFe 2O4. Phenol methylation is carried out with phenol:dimethyl carbonate
(DMC) composition of 2:5 at 3500C and at WHSV of 0.869 h-1.
Catalyst composition, x Product distribution
0 0.25 0.50 0.75 1
Anisole 16.25 20.19 18.31 36.37 11.01
Unreacted Phenol 43.04 12.12 3.14 10.2 31.23
o-Cresol 32.90 42.94 25.86 21.52 47.02
2,6-xylenol 6.79 23.92 51.29 30.94 9.89
p-Cresol 0.10 0.16 0.03 0.15 0.19
2,4-Xylenol 0.68 0.23 0.94 0.42 0.31
2,4,6-TMP 0.53 0.44 0.44 0.40 0.35
Phenol conversion 56.96 87.88 96.86 89.8 68.77
o-Cresol selectivity 57.76 48.86 26.7 23.96 68.37
2,6-Xylenol selectivity 11.92 27.22 52.95 34.45 14.38
Total ortho selectivity 69.68 76.08 79.65 58.42 82.75
Anisole selectivity 28.53 22.97 18.90 40.50 16.01
Chapter 3: Catalytic Activity Studies and Mechanism of Phenol Methylation
81
3.4. CATALYTIC ETHYLATION OF PHENOL
3.4.1. Introduction
2-ethyl phenol resulting from the ethylation of phenol is a valuable chemical and it
is used as a starting material for photochemicals [1]. It is also an intermediate for the
synthesis of benzofuran, which in turn together with indene is the raw material used for the
production of indene-coumarone resins [18]. Numerous studies have been devoted to the
alkylation of phenol with ethanol or ethylene for the synthesis of mono and diethyl phenols
[1,19-25]. 2-ethyl phenol and 2,6-diethyl phenol are produced industrially by ortho
ethylation of phenol with ethylene in high-pressure autoclaves at 320-3400C and 20mPa in
the presence of 1-2 % aluminum phenolate. Various types of catalysts have been reported
to prepare 2-ethyl phenol, including Th/Al oxides, Fe-Si-Mg oxides, phosphoric acid-SiO2,
Fe2O3, Cr2O3, magnetite, hydrotalcites, zeolites and Al2O3 oxides [1,19-25]. However
these catalysts possess one or more of the drawbacks such as, low conversion, severe
operative conditions, poor selectivity due to number of side products and lack of
reproducibility.
3.4.2. Results
Reaction of phenol with ethanol provides ortho ethylated 2-ethyl phenol (EtPhOH)
as major product over Cu1-xCoxFe2O4. Side products such as para ethylated phenols, ethyl
phenyl ether (phenitole), ethyl methyl phenols, cresols etc are also formed in very small
quantities. Formation of 2,6-diethyl phenol occurs to an extent of 10-15 % selectivity at
high temperatures.
3.4.2.1. Effect of Ethanol:Phenol mole ratio on Cu1-xCoxFe2O4
In order to choose an optimum feed mix, phenol ethylation on x = 0.50 was carried
out at 3500C using molar ratios of EtOH:PhOH between 3 and 7 (Figure 3.7a). PhOH
conversion varies in a volcano shape with increasing EtOH:PhOH ratio with a maximum
conversion observed at a value of 5. PhOH conversion decreases above and below 5.
Above trend hints the amount of EtOH is too less at a ratio of 3 for a better PhOH
conversion. Nevertheless, low conversion at high EtOH:PhOH ratio might be due to excess
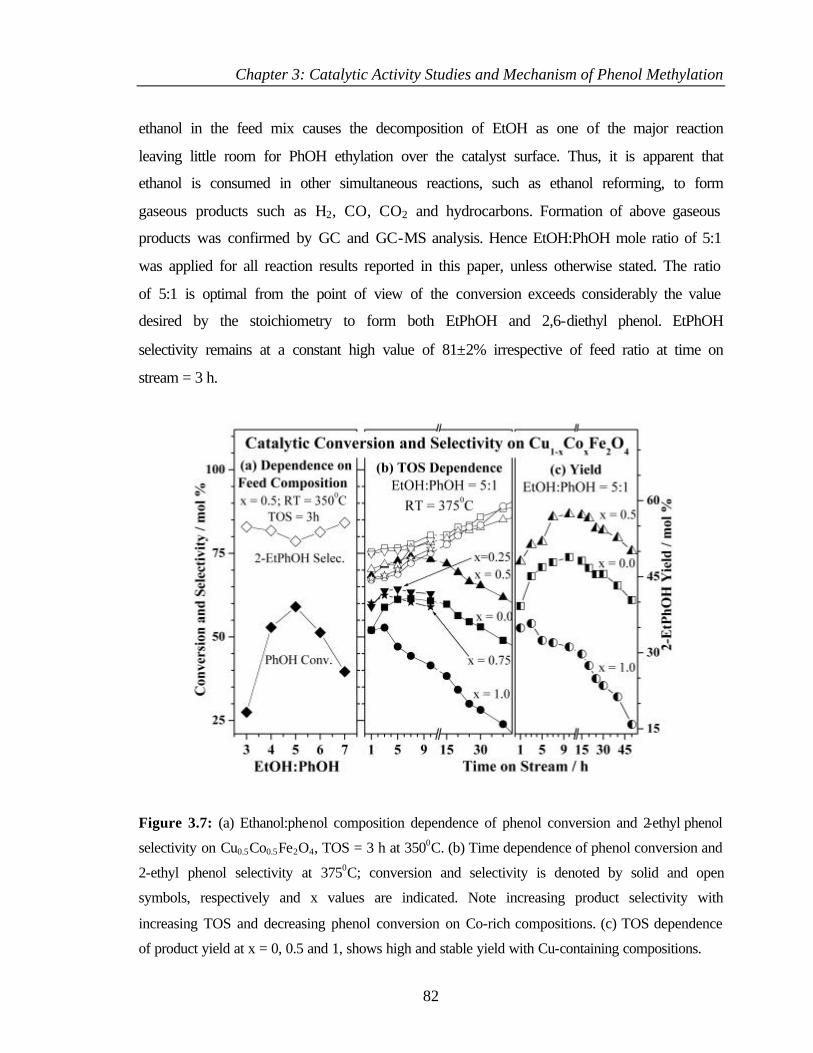
Chapter 3: Catalytic Activity Studies and Mechanism of Phenol Methylation
82
ethanol in the feed mix causes the decomposition of EtOH as one of the major reaction
leaving little room for PhOH ethylation over the catalyst surface. Thus, it is apparent that
ethanol is consumed in other simultaneous reactions, such as ethanol reforming, to form
gaseous products such as H2, CO, CO2 and hydrocarbons. Formation of above gaseous
products was confirmed by GC and GC-MS analysis. Hence EtOH:PhOH mole ratio of 5:1
was applied for all reaction results reported in this paper, unless otherwise stated. The ratio
of 5:1 is optimal from the point of view of the conversion exceeds considerably the value
desired by the stoichiometry to form both EtPhOH and 2,6-diethyl phenol. EtPhOH
selectivity remains at a constant high value of 81±2% irrespective of feed ratio at time on
stream = 3 h.
Figure 3.7: (a) Ethanol:phenol composition dependence of phenol conversion and 2-ethyl phenol
selectivity on Cu0.5Co0.5Fe2O4, TOS = 3 h at 3500C. (b) Time dependence of phenol conversion and
2-ethyl phenol selectivity at 3750C; conversion and selectivity is denoted by solid and open
symbols, respectively and x values are indicated. Note increasing product selectivity with
increasing TOS and decreasing phenol conversion on Co-rich compositions. (c) TOS dependence
of product yield at x = 0, 0.5 and 1, shows high and stable yield with Cu-containing compositions.
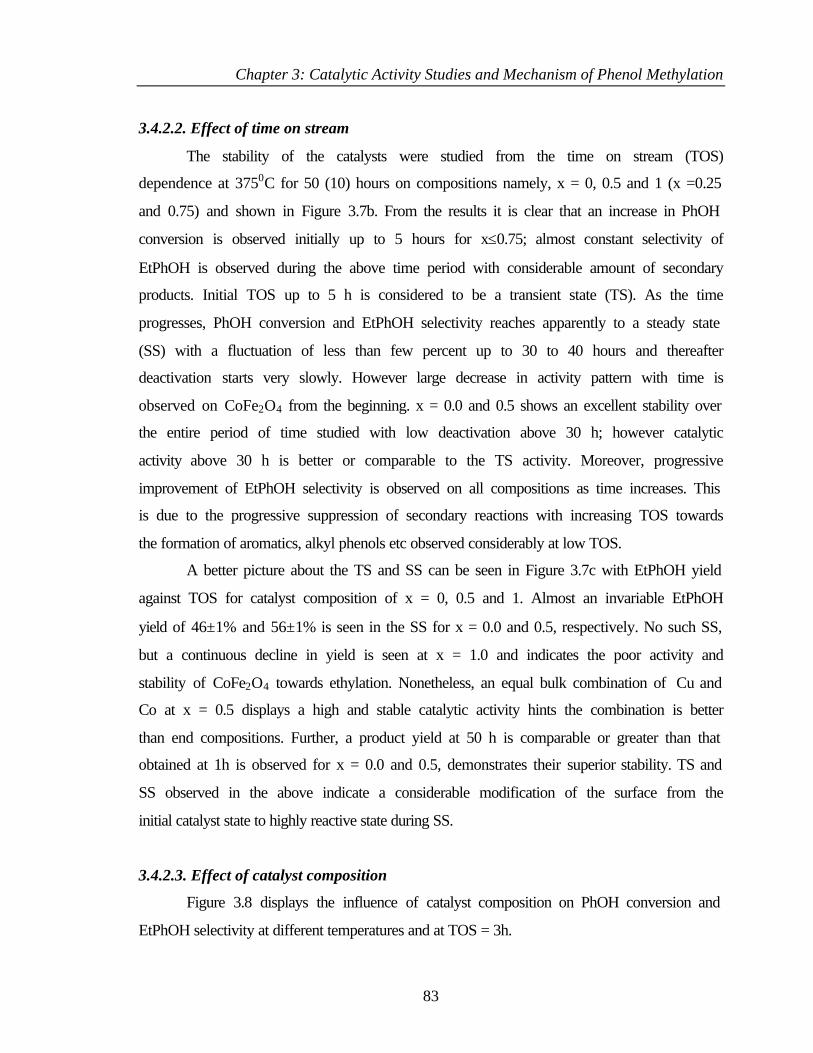
Chapter 3: Catalytic Activity Studies and Mechanism of Phenol Methylation
83
3.4.2.2. Effect of time on stream
The stability of the catalysts were studied from the time on stream (TOS)
dependence at 3750C for 50 (10) hours on compositions namely, x = 0, 0.5 and 1 (x =0.25
and 0.75) and shown in Figure 3.7b. From the results it is clear that an increase in PhOH
conversion is observed initially up to 5 hours for x≤0.75; almost constant selectivity of
EtPhOH is observed during the above time period with considerable amount of secondary
products. Initial TOS up to 5 h is considered to be a transient state (TS). As the time
progresses, PhOH conversion and EtPhOH selectivity reaches apparently to a steady state
(SS) with a fluctuation of less than few percent up to 30 to 40 hours and thereafter
deactivation starts very slowly. However large decrease in activity pattern with time is
observed on CoFe2O4 from the beginning. x = 0.0 and 0.5 shows an excellent stability over
the entire period of time studied with low deactivation above 30 h; however catalytic
activity above 30 h is better or comparable to the TS activity. Moreover, progressive
improvement of EtPhOH selectivity is observed on all compositions as time increases. This
is due to the progressive suppression of secondary reactions with increasing TOS towards
the formation of aromatics, alkyl phenols etc observed considerably at low TOS.
A better picture about the TS and SS can be seen in Figure 3.7c with EtPhOH yield
against TOS for catalyst composition of x = 0, 0.5 and 1. Almost an invariable EtPhOH
yield of 46±1% and 56±1% is seen in the SS for x = 0.0 and 0.5, respectively. No such SS,
but a continuous decline in yield is seen at x = 1.0 and indicates the poor activity and
stability of CoFe2O4 towards ethylation. Nonetheless, an equal bulk combination of Cu and
Co at x = 0.5 displays a high and stable catalytic activity hints the combination is better
than end compositions. Further, a product yield at 50 h is comparable or greater than that
obtained at 1h is observed for x = 0.0 and 0.5, demonstrates their superior stability. TS and
SS observed in the above indicate a considerable modification of the surface from the
initial catalyst state to highly reactive state during SS.
3.4.2.3. Effect of catalyst composition
Figure 3.8 displays the influence of catalyst composition on PhOH conversion and
EtPhOH selectivity at different temperatures and at TOS = 3h.
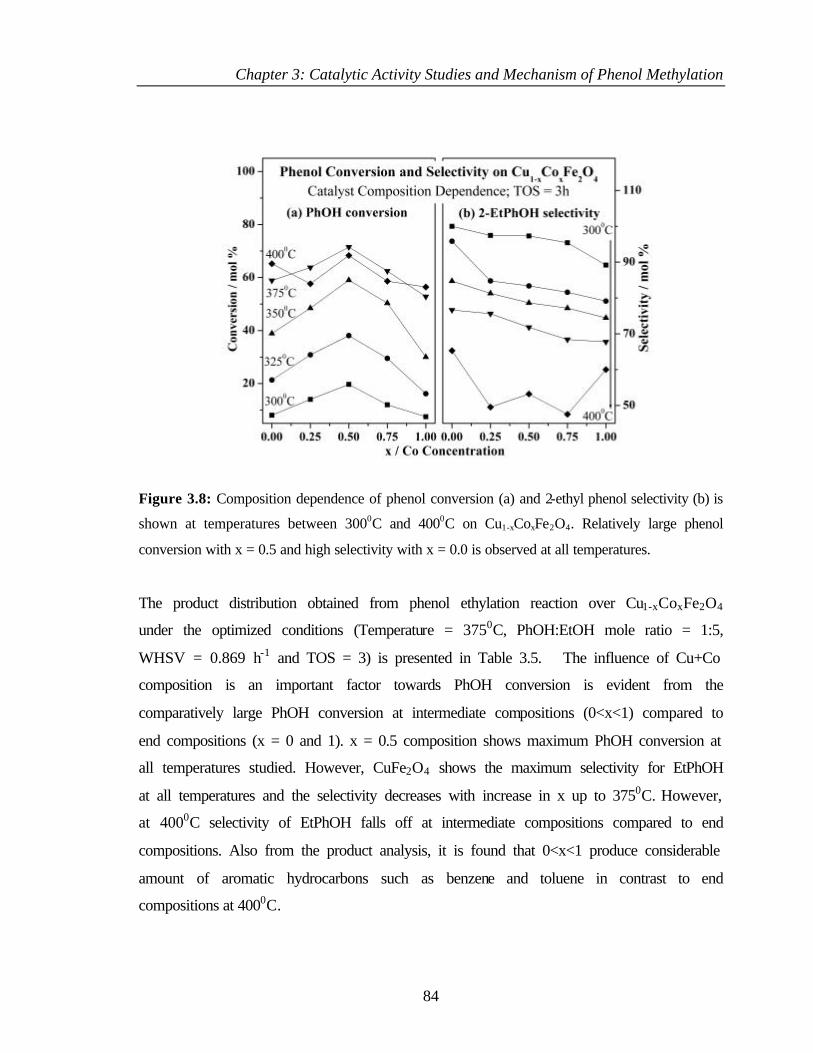
Chapter 3: Catalytic Activity Studies and Mechanism of Phenol Methylation
84
Figure 3.8: Composition dependence of phenol conversion (a) and 2-ethyl phenol selectivity (b) is
shown at temperatures between 3000C and 4000C on Cu1-xCoxFe2O4. Relatively large phenol
conversion with x = 0.5 and high selectivity with x = 0.0 is observed at all temperatures.
The product distribution obtained from phenol ethylation reaction over Cu1-xCoxFe2O4
under the optimized conditions (Temperature = 3750C, PhOH:EtOH mole ratio = 1:5,
WHSV = 0.869 h-1 and TOS = 3) is presented in Table 3.5. The influence of Cu+Co
composition is an important factor towards PhOH conversion is evident from the
comparatively large PhOH conversion at intermediate compositions (0<x<1) compared to
end compositions (x = 0 and 1). x = 0.5 composition shows maximum PhOH conversion at
all temperatures studied. However, CuFe2O4 shows the maximum selectivity for EtPhOH
at all temperatures and the selectivity decreases with increase in x up to 3750C. However,
at 4000C selectivity of EtPhOH falls off at intermediate compositions compared to end
compositions. Also from the product analysis, it is found that 0<x<1 produce considerable
amount of aromatic hydrocarbons such as benzene and toluene in contrast to end
compositions at 4000C.
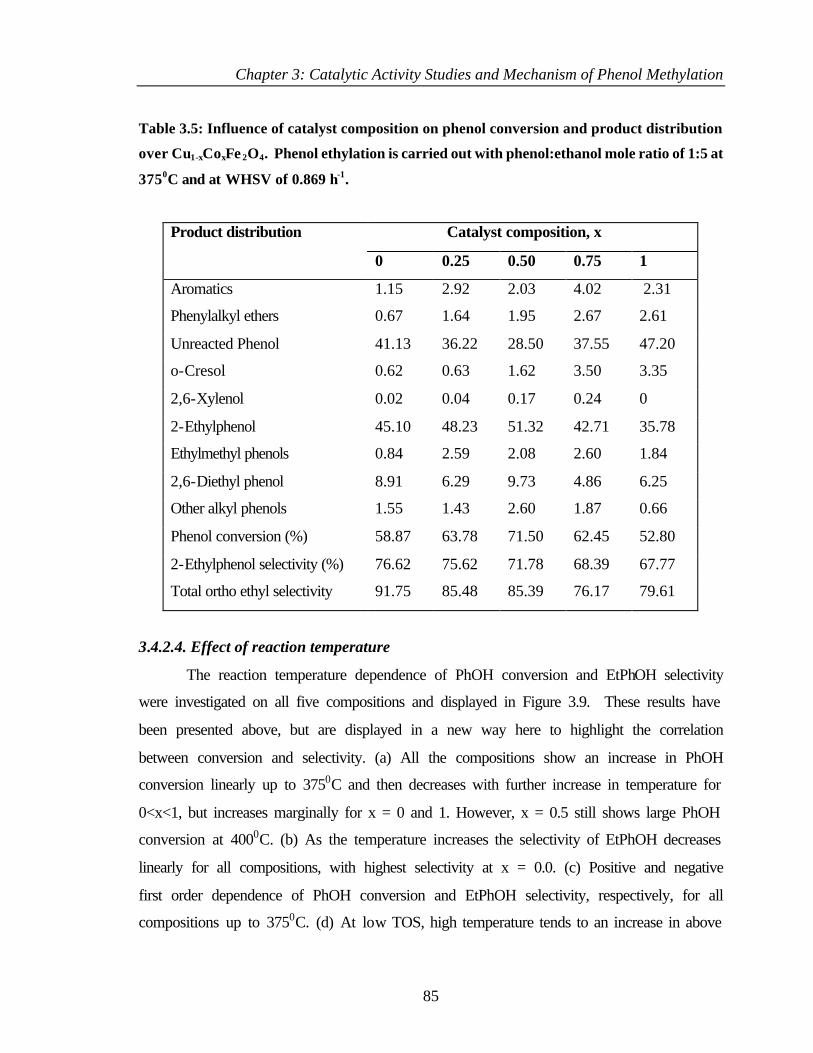
Chapter 3: Catalytic Activity Studies and Mechanism of Phenol Methylation
85
Table 3.5: Influence of catalyst composition on phenol conversion and product distribution
over Cu1-xCoxFe 2O4. Phenol ethylation is carried out with phenol:ethanol mole ratio of 1:5 at
3750C and at WHSV of 0.869 h-1.
Catalyst composition, x Product distribution
0 0.25 0.50 0.75 1
Aromatics 1.15 2.92 2.03 4.02 2.31
Phenylalkyl ethers 0.67 1.64 1.95 2.67 2.61
Unreacted Phenol 41.13 36.22 28.50 37.55 47.20
o-Cresol 0.62 0.63 1.62 3.50 3.35
2,6-Xylenol 0.02 0.04 0.17 0.24 0
2-Ethylphenol 45.10 48.23 51.32 42.71 35.78
Ethylmethyl phenols 0.84 2.59 2.08 2.60 1.84
2,6-Diethyl phenol 8.91 6.29 9.73 4.86 6.25
Other alkyl phenols 1.55 1.43 2.60 1.87 0.66
Phenol conversion (%) 58.87 63.78 71.50 62.45 52.80
2-Ethylphenol selectivity (%) 76.62 75.62 71.78 68.39 67.77
Total ortho ethyl selectivity 91.75 85.48 85.39 76.17 79.61
3.4.2.4. Effect of reaction temperature
The reaction temperature dependence of PhOH conversion and EtPhOH selectivity
were investigated on all five compositions and displayed in Figure 3.9. These results have
been presented above, but are displayed in a new way here to highlight the correlation
between conversion and selectivity. (a) All the compositions show an increase in PhOH
conversion linearly up to 3750C and then decreases with further increase in temperature for
0<x<1, but increases marginally for x = 0 and 1. However, x = 0.5 still shows large PhOH
conversion at 4000C. (b) As the temperature increases the selectivity of EtPhOH decreases
linearly for all compositions, with highest selectivity at x = 0.0. (c) Positive and negative
first order dependence of PhOH conversion and EtPhOH selectivity, respectively, for all
compositions up to 3750C. (d) At low TOS, high temperature tends to an increase in above
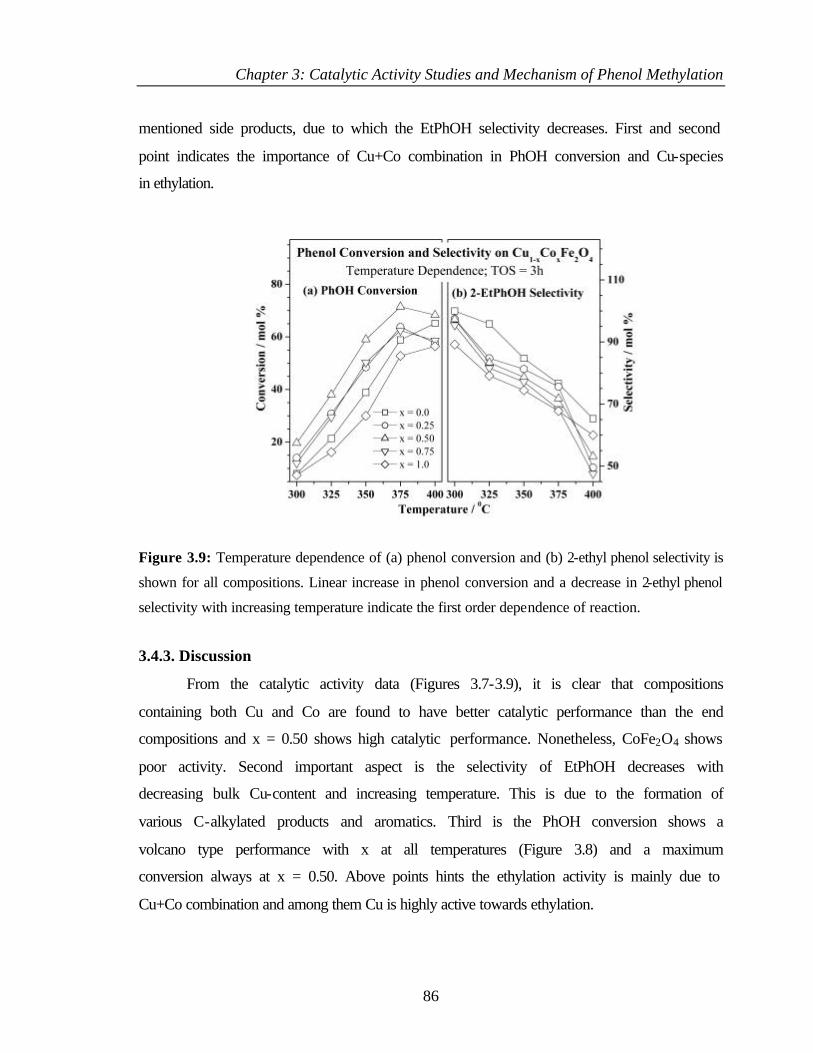
Chapter 3: Catalytic Activity Studies and Mechanism of Phenol Methylation
86
mentioned side products, due to which the EtPhOH selectivity decreases. First and second
point indicates the importance of Cu+Co combination in PhOH conversion and Cu-species
in ethylation.
Figure 3.9: Temperature dependence of (a) phenol conversion and (b) 2-ethyl phenol selectivity is
shown for all compositions. Linear increase in phenol conversion and a decrease in 2-ethyl phenol
selectivity with increasing temperature indicate the first order dependence of reaction.
3.4.3. Discussion
From the catalytic activity data (Figures 3.7-3.9), it is clear that compositions
containing both Cu and Co are found to have better catalytic performance than the end
compositions and x = 0.50 shows high catalytic performance. Nonetheless, CoFe2O4 shows
poor activity. Second important aspect is the selectivity of EtPhOH decreases with
decreasing bulk Cu-content and increasing temperature. This is due to the formation of
various C-alkylated products and aromatics. Third is the PhOH conversion shows a
volcano type performance with x at all temperatures (Figure 3.8) and a maximum
conversion always at x = 0.50. Above points hints the ethylation activity is mainly due to
Cu+Co combination and among them Cu is highly active towards ethylation.
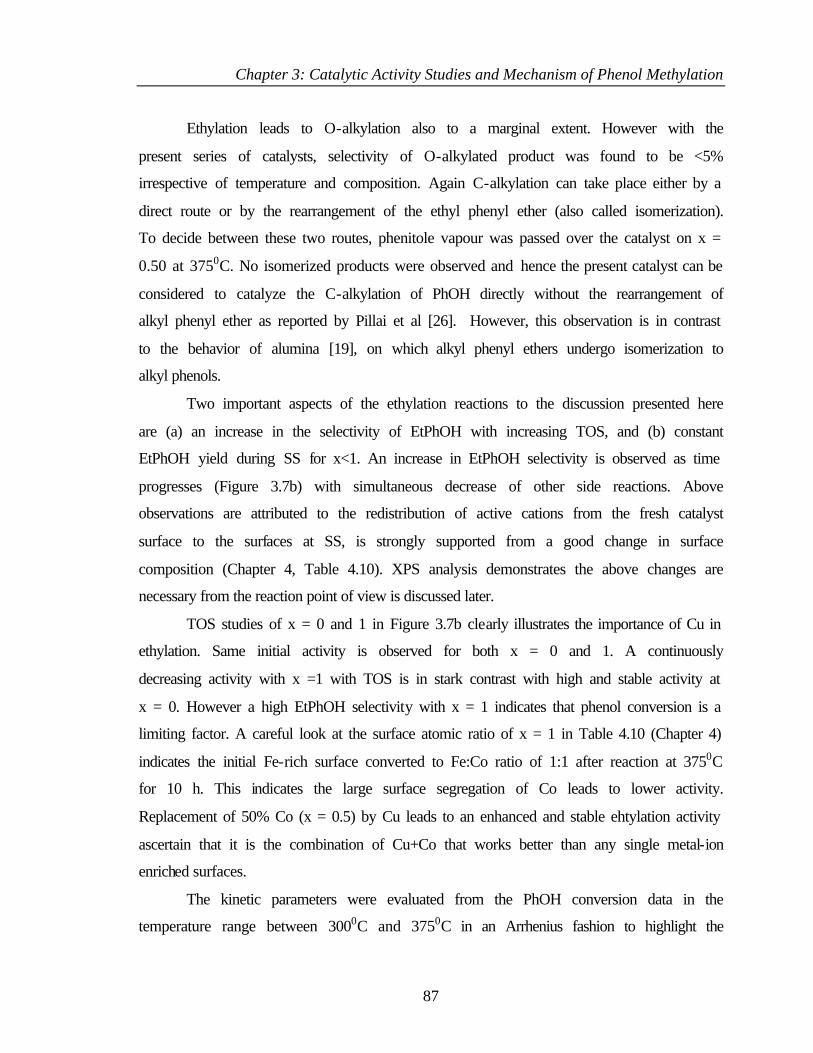
Chapter 3: Catalytic Activity Studies and Mechanism of Phenol Methylation
87
Ethylation leads to O-alkylation also to a marginal extent. However with the
present series of catalysts, selectivity of O-alkylated product was found to be <5%
irrespective of temperature and composition. Again C-alkylation can take place either by a
direct route or by the rearrangement of the ethyl phenyl ether (also called isomerization).
To decide between these two routes, phenitole vapour was passed over the catalyst on x =
0.50 at 3750C. No isomerized products were observed and hence the present catalyst can be
considered to catalyze the C-alkylation of PhOH directly without the rearrangement of
alkyl phenyl ether as reported by Pillai et al [26]. However, this observation is in contrast
to the behavior of alumina [19], on which alkyl phenyl ethers undergo isomerization to
alkyl phenols.
Two important aspects of the ethylation reactions to the discussion presented here
are (a) an increase in the selectivity of EtPhOH with increasing TOS, and (b) constant
EtPhOH yield during SS for x<1. An increase in EtPhOH selectivity is observed as time
progresses (Figure 3.7b) with simultaneous decrease of other side reactions. Above
observations are attributed to the redistribution of active cations from the fresh catalyst
surface to the surfaces at SS, is strongly supported from a good change in surface
composition (Chapter 4, Table 4.10). XPS analysis demonstrates the above changes are
necessary from the reaction point of view is discussed later.
TOS studies of x = 0 and 1 in Figure 3.7b clearly illustrates the importance of Cu in
ethylation. Same initial activity is observed for both x = 0 and 1. A continuously
decreasing activity with x =1 with TOS is in stark contrast with high and stable activity at
x = 0. However a high EtPhOH selectivity with x = 1 indicates that phenol conversion is a
limiting factor. A careful look at the surface atomic ratio of x = 1 in Table 4.10 (Chapter 4)
indicates the initial Fe-rich surface converted to Fe:Co ratio of 1:1 after reaction at 3750C
for 10 h. This indicates the large surface segregation of Co leads to lower activity.
Replacement of 50% Co (x = 0.5) by Cu leads to an enhanced and stable ehtylation activity
ascertain that it is the combination of Cu+Co that works better than any single metal-ion
enriched surfaces.
The kinetic parameters were evaluated from the PhOH conversion data in the
temperature range between 3000C and 3750C in an Arrhenius fashion to highlight the
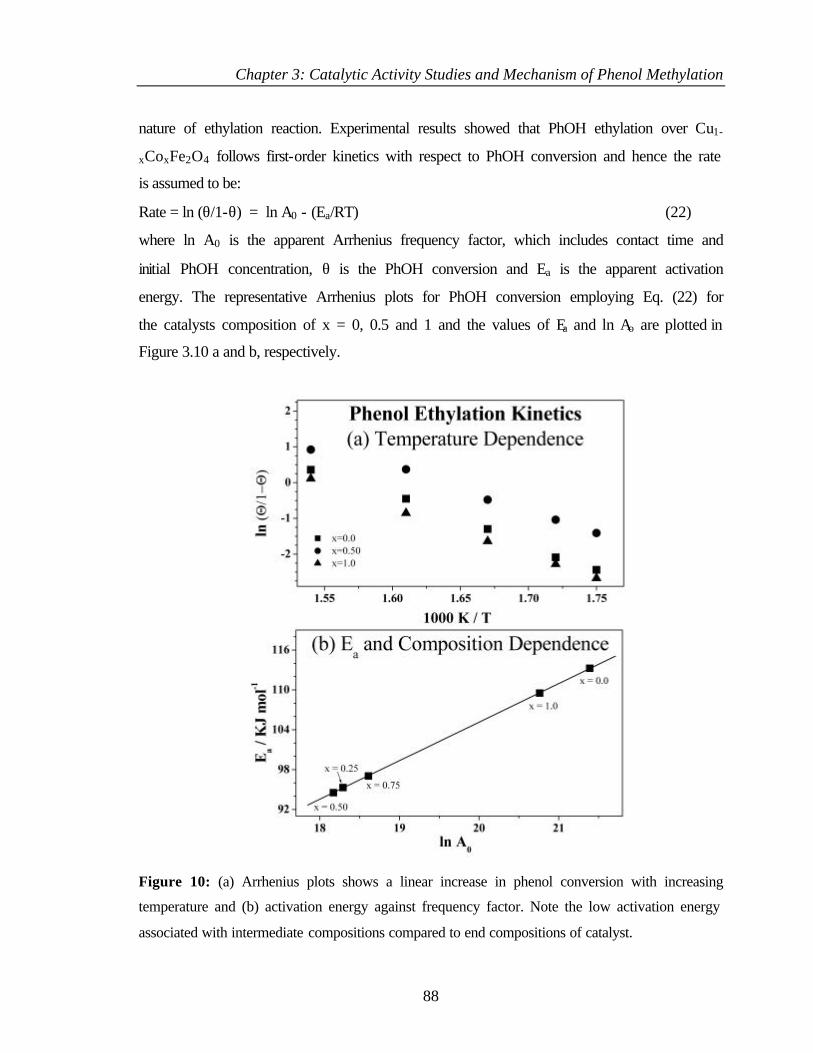
Chapter 3: Catalytic Activity Studies and Mechanism of Phenol Methylation
88
nature of ethylation reaction. Experimental results showed that PhOH ethylation over Cu1-
xCoxFe2O4 follows first-order kinetics with respect to PhOH conversion and hence the rate
is assumed to be:
Rate = ln (θ/1-θ) = ln A0 - (Ea/RT) (22)
where ln A0 is the apparent Arrhenius frequency factor, which includes contact time and
initial PhOH concentration, θ is the PhOH conversion and Ea is the apparent activation
energy. The representative Arrhenius plots for PhOH conversion employing Eq. (22) for
the catalysts composition of x = 0, 0.5 and 1 and the values of Ea and ln Ao are plotted in
Figure 3.10 a and b, respectively.
Figure 10: (a) Arrhenius plots shows a linear increase in phenol conversion with increasing
temperature and (b) activation energy against frequency factor. Note the low activation energy
associated with intermediate compositions compared to end compositions of catalyst.
Chapter 3: Catalytic Activity Studies and Mechanism of Phenol Methylation
89
From the kinetic parameters it is clear that compositions containing both Cu and Co exhibit
relatively low Ea towards PhOH conversion than end compositions. There are hardly any
reports available regarding the kinetic parameters for phenol ethylation. However, the Ea
values for the PhOH methylation have been reported in the range of 20-130 KJ/mol over
MnO [27], anions loaded AlPO4-Al2O3 [28], HZSM-5 [29] and Mg-Al hydrotalcites [30].
The Ea evaluated in the present study varies almost in the same and close range (94-113
KJ/mol) supports the validity of the model assumed for the evaluation of kinetic
parameters.
It has been shown by several authors that a good correlation exists between Ea and
ln A0 for different reactions taking place over one catalyst [31-33]. Such a correlation is
termed as 'compensation effect' or 'isokinetic effect' and can be written as:
Ea = a + b · ln A (23)
where a and b are constants called correlation parameters [33]. A plot of Ea versus ln Ao
for the Cu1-xCoxFe2O4 (x = 0 to 1) series shows a straight line (Figure 3.10b) with a very
high linear regression coefficient of 0.9999 indicating the existence of a good
compensation effect and hints the mechanism of PhOH ethylation remains the same over
the entire Cu1-xCoxFe2O4 series. Value of a and b evaluated from this plot are 10.83 and
5.80 KJ/mol respectively. ln Ao for the various compositions can be related to the entropy
of activation of the reactant species [34], and it is found that the intermediate compositions
offers less entropy of activation than x = 0 and 1.
3.5. ISOPROPYLATION OF PHENOL
3.5.1. Introduction
An extensive study of the alkylation of phenol, both with propanol and
isopropanol in the presence of alumina has been published [35,36]. Industrially, 2-
isopropyl phenol is produced from phenol and propene using γ-Al2O3 as the catalyst at a
temperature 250-3000C and 10Mpa pressure [1]. Alkylation of phenol with propene
resulted isopropyl alcohol due to the formation of more stable 20 carbocation intermediate
[1,37]. Kannan etal [35] observed that, in the alkylation of phenol with 1-propanol over γ-
Al2O3, O-alkylation takes place without any isomerisation of the propyl moiety while a
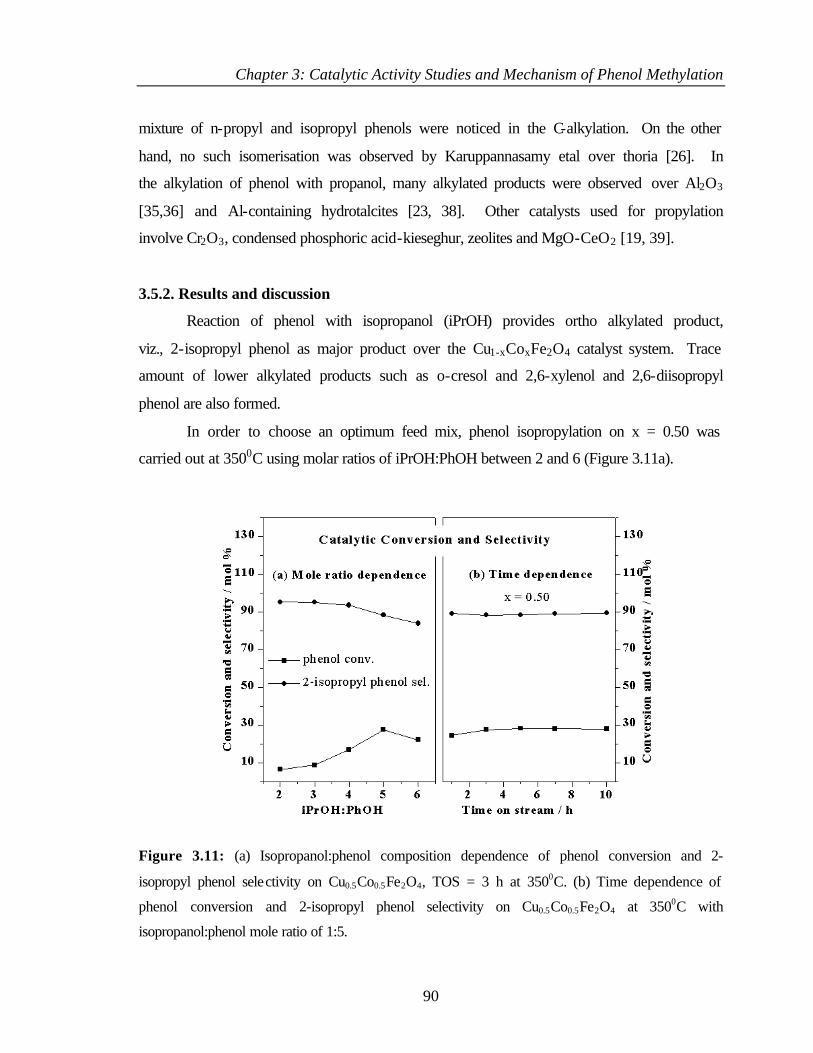
Chapter 3: Catalytic Activity Studies and Mechanism of Phenol Methylation
90
mixture of n-propyl and isopropyl phenols were noticed in the C-alkylation. On the other
hand, no such isomerisation was observed by Karuppannasamy etal over thoria [26]. In
the alkylation of phenol with propanol, many alkylated products were observed over Al2O3
[35,36] and Al-containing hydrotalcites [23, 38]. Other catalysts used for propylation
involve Cr2O3, condensed phosphoric acid-kieseghur, zeolites and MgO-CeO2 [19, 39].
3.5.2. Results and discussion
Reaction of phenol with isopropanol (iPrOH) provides ortho alkylated product,
viz., 2-isopropyl phenol as major product over the Cu1-xCoxFe2O4 catalyst system. Trace
amount of lower alkylated products such as o-cresol and 2,6-xylenol and 2,6-diisopropyl
phenol are also formed.
In order to choose an optimum feed mix, phenol isopropylation on x = 0.50 was
carried out at 3500C using molar ratios of iPrOH:PhOH between 2 and 6 (Figure 3.11a).
Figure 3.11: (a) Isopropanol:phenol composition dependence of phenol conversion and 2-
isopropyl phenol selectivity on Cu0.5Co0.5Fe2O4, TOS = 3 h at 3500C. (b) Time dependence of
phenol conversion and 2-isopropyl phenol selectivity on Cu0.5Co0.5Fe2O4 at 3500C with
isopropanol:phenol mole ratio of 1:5.
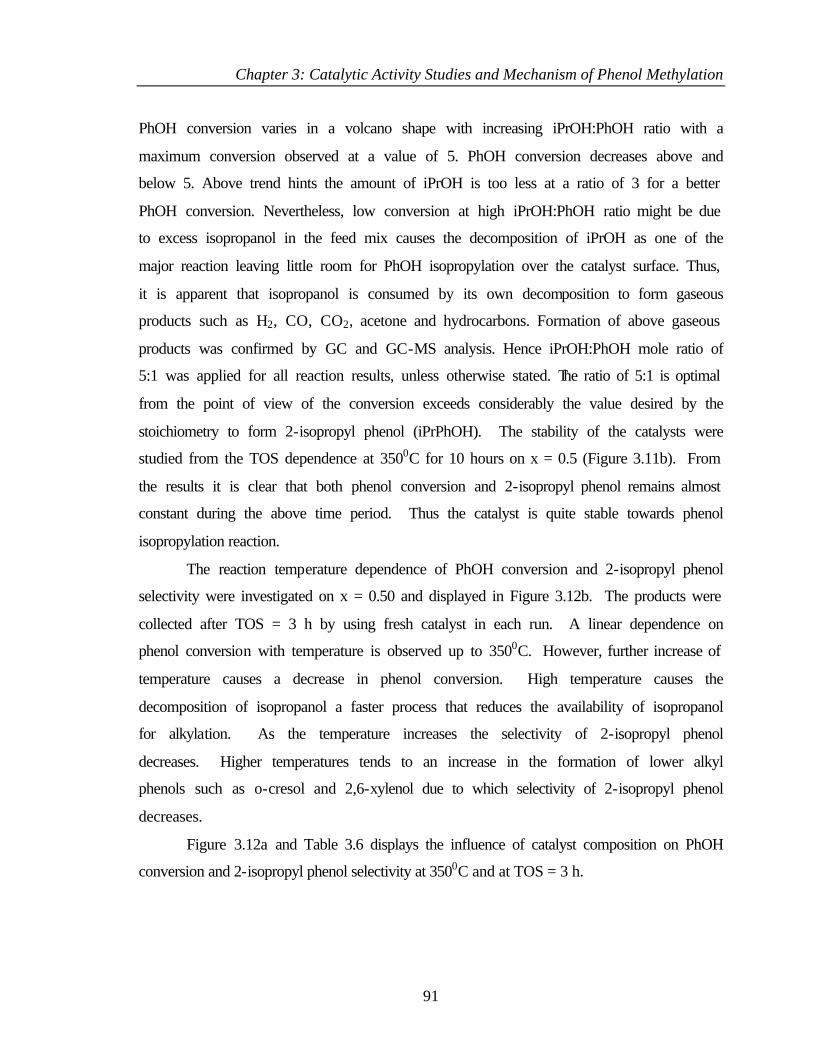
Chapter 3: Catalytic Activity Studies and Mechanism of Phenol Methylation
91
PhOH conversion varies in a volcano shape with increasing iPrOH:PhOH ratio with a
maximum conversion observed at a value of 5. PhOH conversion decreases above and
below 5. Above trend hints the amount of iPrOH is too less at a ratio of 3 for a better
PhOH conversion. Nevertheless, low conversion at high iPrOH:PhOH ratio might be due
to excess isopropanol in the feed mix causes the decomposition of iPrOH as one of the
major reaction leaving little room for PhOH isopropylation over the catalyst surface. Thus,
it is apparent that isopropanol is consumed by its own decomposition to form gaseous
products such as H2, CO, CO2, acetone and hydrocarbons. Formation of above gaseous
products was confirmed by GC and GC-MS analysis. Hence iPrOH:PhOH mole ratio of
5:1 was applied for all reaction results, unless otherwise stated. The ratio of 5:1 is optimal
from the point of view of the conversion exceeds considerably the value desired by the
stoichiometry to form 2-isopropyl phenol (iPrPhOH). The stability of the catalysts were
studied from the TOS dependence at 3500C for 10 hours on x = 0.5 (Figure 3.11b). From
the results it is clear that both phenol conversion and 2-isopropyl phenol remains almost
constant during the above time period. Thus the catalyst is quite stable towards phenol
isopropylation reaction.
The reaction temperature dependence of PhOH conversion and 2-isopropyl phenol
selectivity were investigated on x = 0.50 and displayed in Figure 3.12b. The products were
collected after TOS = 3 h by using fresh catalyst in each run. A linear dependence on
phenol conversion with temperature is observed up to 3500C. However, further increase of
temperature causes a decrease in phenol conversion. High temperature causes the
decomposition of isopropanol a faster process that reduces the availability of isopropanol
for alkylation. As the temperature increases the selectivity of 2-isopropyl phenol
decreases. Higher temperatures tends to an increase in the formation of lower alkyl
phenols such as o-cresol and 2,6-xylenol due to which selectivity of 2-isopropyl phenol
decreases.
Figure 3.12a and Table 3.6 displays the influence of catalyst composition on PhOH
conversion and 2-isopropyl phenol selectivity at 3500C and at TOS = 3 h.
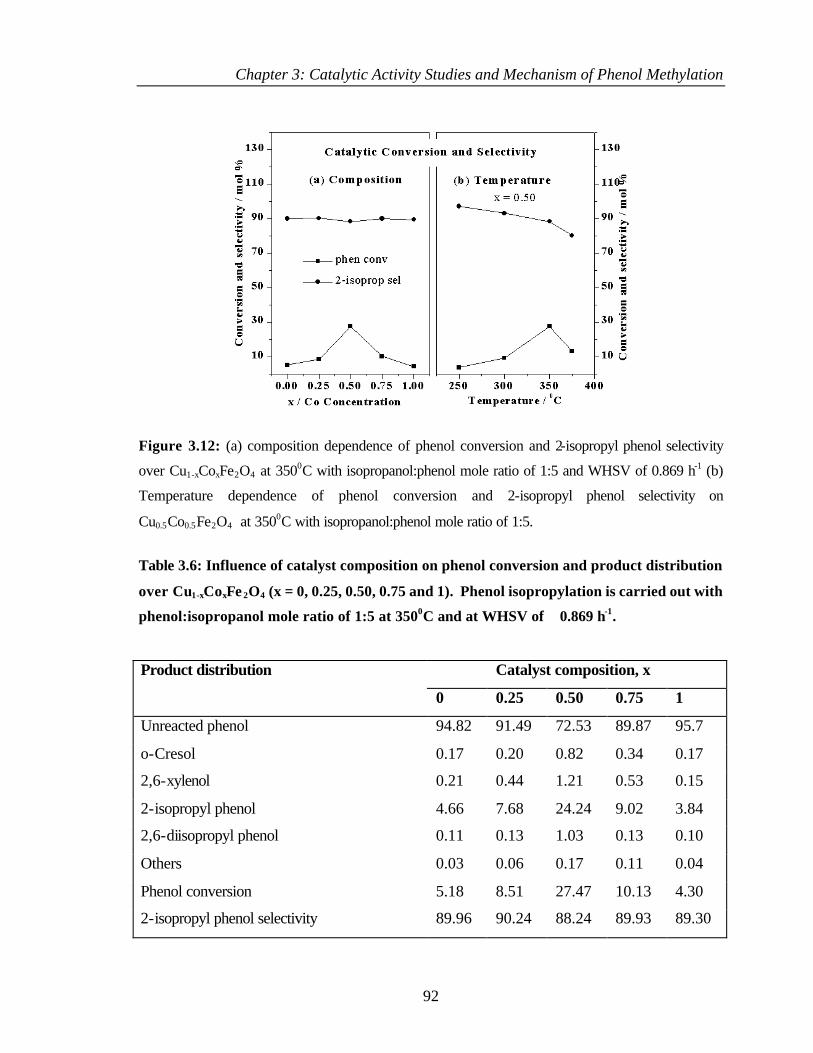
Chapter 3: Catalytic Activity Studies and Mechanism of Phenol Methylation
92
Figure 3.12: (a) composition dependence of phenol conversion and 2-isopropyl phenol selectivity
over Cu1-xCoxFe2O4 at 3500C with isopropanol:phenol mole ratio of 1:5 and WHSV of 0.869 h-1 (b)
Temperature dependence of phenol conversion and 2-isopropyl phenol selectivity on
Cu0.5Co0.5Fe2O4 at 3500C with isopropanol:phenol mole ratio of 1:5.
Table 3.6: Influence of catalyst composition on phenol conversion and product distribution
over Cu1-xCoxFe 2O4 (x = 0, 0.25, 0.50, 0.75 and 1). Phenol isopropylation is carried out with
phenol:isopropanol mole ratio of 1:5 at 3500C and at WHSV of 0.869 h-1.
Catalyst composition, x Product distribution
0 0.25 0.50 0.75 1
Unreacted phenol 94.82 91.49 72.53 89.87 95.7
o-Cresol 0.17 0.20 0.82 0.34 0.17
2,6-xylenol 0.21 0.44 1.21 0.53 0.15
2-isopropyl phenol 4.66 7.68 24.24 9.02 3.84
2,6-diisopropyl phenol 0.11 0.13 1.03 0.13 0.10
Others 0.03 0.06 0.17 0.11 0.04
Phenol conversion 5.18 8.51 27.47 10.13 4.30
2-isopropyl phenol selectivity 89.96 90.24 88.24 89.93 89.30
Chapter 3: Catalytic Activity Studies and Mechanism of Phenol Methylation
93
Though all are less active towards phenol isopropylation, compositions containing both Cu
and Co show comparatively high activity. Among Cu-Co mixed compositions, x = 0.50
shows considerably large phenol conversion. Irrespective of the compositions, all are
highly selective towards ortho alkylation and show ~90% selectivity in 2-isopropyl phenol
formation.
3.6. TERTIARY BUTYLATION OF PHENOL
3.6.1. Introduction
Tertiary butylation of phenol has been studied extensively owing to industrial
interest in the production as antioxidants, in the synthesis of various agrochemicals,
fragrance compounds, ultraviolet absorbers, thermoresistant polymers and heat stabilizers
of polymeric materials [1]. Both tertiary butyl alcohol and isobutene used extensively for
this purpose. Various catalysts reported for this reaction involve, Cr2O3, ion exchange
resins, zeolites, zirconia and sulphated zirconia [19,23,40-47]. It is reported that the
molecular sieve based catalysts like SAPO–11, HY, Hβ , AlMCM-41 and FeMCM-41 were
proved to be potential catalysts for the tertiary butylation of phenol among the various
solid acid catalysts [43-47]. However, unlike other phenol alkylation the reaction of
tertiary butylation of phenol gives numerous products depending on the nature of the
catalysts as well as on the reaction conditios.
3.6.2. Results and discussion
Tertiary butylation of phenol was carried out with isobutene (gas) at 2000C. The
main products of t-butylation of phenol on Cu1-xCoxFe2O4 are 2-tertiary butyl phenol (2-
TBP), 4-tertiary butyl phenol (4-TBP) and 2,4-di tertiary butyl phenol (2,4-DTBP). 2,6-di
tertiary butyl phenol is also formed, but in trace amount. Figure 3.13a shows the results of
alkylation of phenol with isobutene over x = 0.5 at 2000C with various isobutene:phenol
ratio (1 to 7). It can be seen that an increase of phenol conversion is observed as the
isobutene/phenol mole ratio increases to 5 and thereafter decreases. However,
comparatively high yield for 2-TBP was noticed at 1:3 feed ratio. Hence, this feed ratio
was maintained throughout the study. Figure 3.13b shows the change in phenol conversion
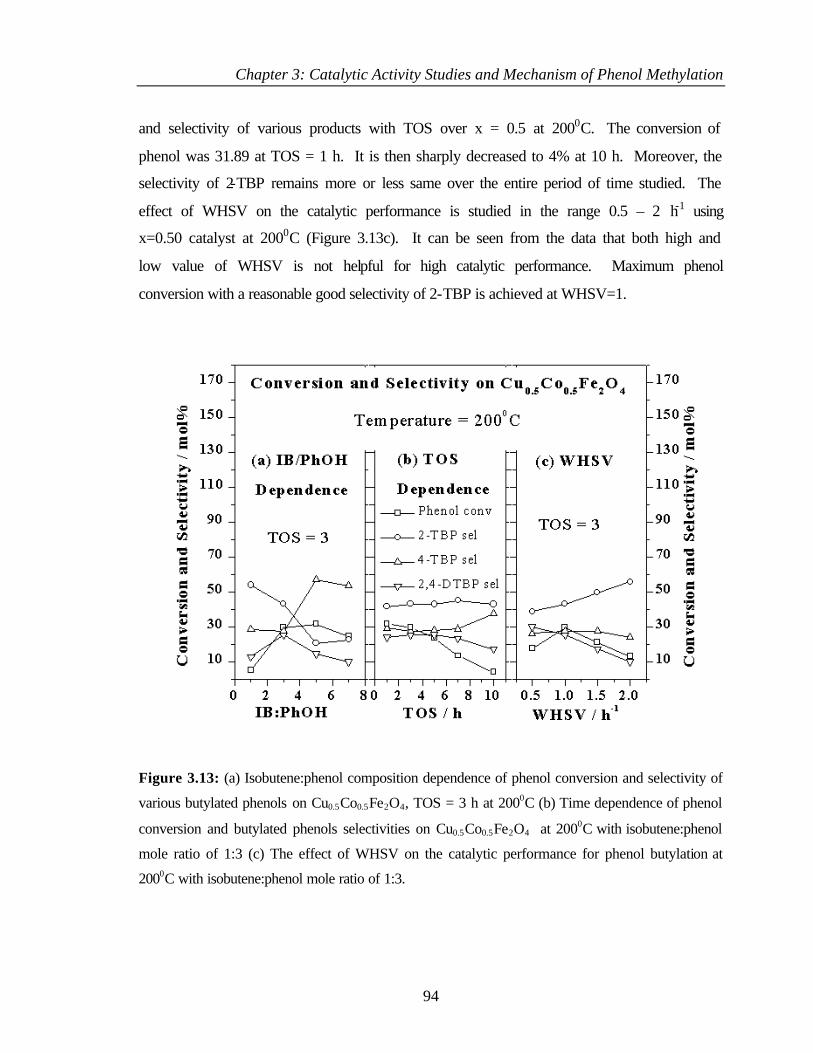
Chapter 3: Catalytic Activity Studies and Mechanism of Phenol Methylation
94
and selectivity of various products with TOS over x = 0.5 at 2000C. The conversion of
phenol was 31.89 at TOS = 1 h. It is then sharply decreased to 4% at 10 h. Moreover, the
selectivity of 2-TBP remains more or less same over the entire period of time studied. The
effect of WHSV on the catalytic performance is studied in the range 0.5 – 2 h-1 using
x=0.50 catalyst at 2000C (Figure 3.13c). It can be seen from the data that both high and
low value of WHSV is not helpful for high catalytic performance. Maximum phenol
conversion with a reasonable good selectivity of 2-TBP is achieved at WHSV=1.
Figure 3.13: (a) Isobutene:phenol composition dependence of phenol conversion and selectivity of
various butylated phenols on Cu0.5Co0.5Fe2O4, TOS = 3 h at 2000C (b) Time dependence of phenol
conversion and butylated phenols selectivities on Cu0.5Co0.5Fe2O4 at 2000C with isobutene:phenol
mole ratio of 1:3 (c) The effect of WHSV on the catalytic performance for phenol butylation at
2000C with isobutene:phenol mole ratio of 1:3.
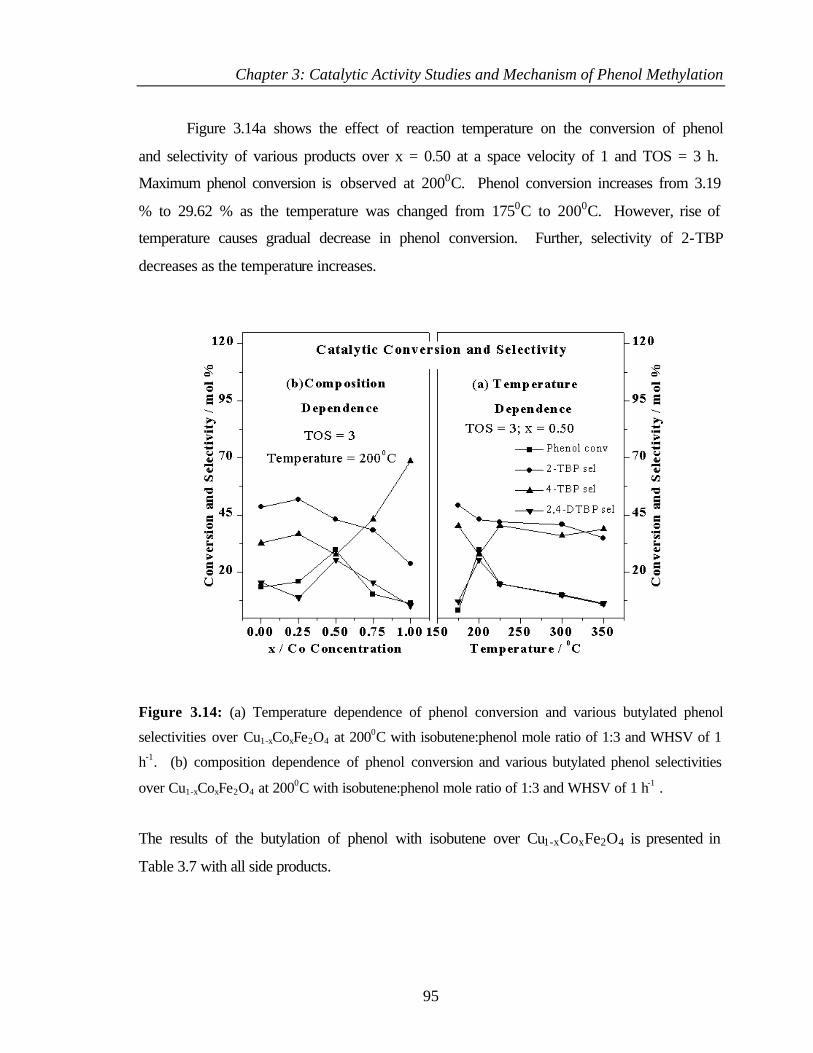
Chapter 3: Catalytic Activity Studies and Mechanism of Phenol Methylation
95
Figure 3.14a shows the effect of reaction temperature on the conversion of phenol
and selectivity of various products over x = 0.50 at a space velocity of 1 and TOS = 3 h.
Maximum phenol conversion is observed at 2000C. Phenol conversion increases from 3.19
% to 29.62 % as the temperature was changed from 1750C to 2000C. However, rise of
temperature causes gradual decrease in phenol conversion. Further, selectivity of 2-TBP
decreases as the temperature increases.
Figure 3.14: (a) Temperature dependence of phenol conversion and various butylated phenol
selectivities over Cu1-xCoxFe2O4 at 2000C with isobutene:phenol mole ratio of 1:3 and WHSV of 1
h-1. (b) composition dependence of phenol conversion and various butylated phenol selectivities
over Cu1-xCoxFe2O4 at 2000C with isobutene:phenol mole ratio of 1:3 and WHSV of 1 h-1 .
The results of the butylation of phenol with isobutene over Cu1-xCoxFe2O4 is presented in
Table 3.7 with all side products.
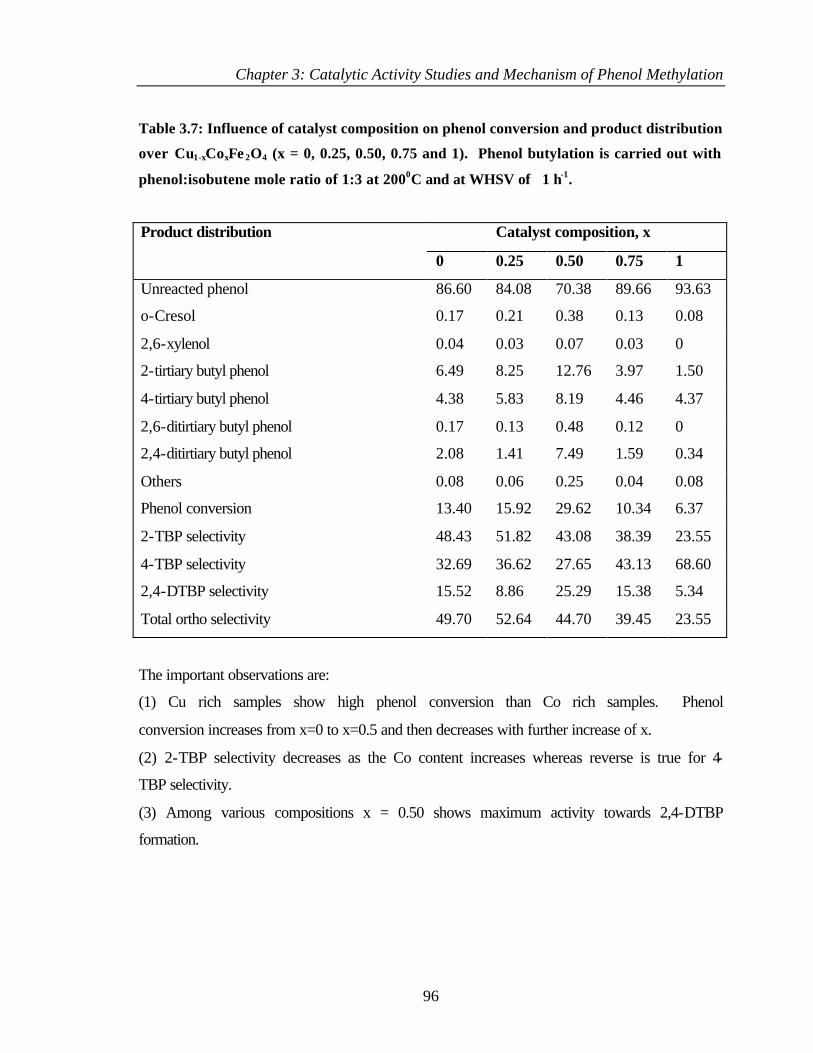
Chapter 3: Catalytic Activity Studies and Mechanism of Phenol Methylation
96
Table 3.7: Influence of catalyst composition on phenol conversion and product distribution
over Cu1-xCoxFe 2O4 (x = 0, 0.25, 0.50, 0.75 and 1). Phenol butylation is carried out with
phenol:isobutene mole ratio of 1:3 at 2000C and at WHSV of 1 h-1.
Catalyst composition, x Product distribution
0 0.25 0.50 0.75 1
Unreacted phenol 86.60 84.08 70.38 89.66 93.63
o-Cresol 0.17 0.21 0.38 0.13 0.08
2,6-xylenol 0.04 0.03 0.07 0.03 0
2-tirtiary butyl phenol 6.49 8.25 12.76 3.97 1.50
4-tirtiary butyl phenol 4.38 5.83 8.19 4.46 4.37
2,6-ditirtiary butyl phenol 0.17 0.13 0.48 0.12 0
2,4-ditirtiary butyl phenol 2.08 1.41 7.49 1.59 0.34
Others 0.08 0.06 0.25 0.04 0.08
Phenol conversion 13.40 15.92 29.62 10.34 6.37
2-TBP selectivity 48.43 51.82 43.08 38.39 23.55
4-TBP selectivity 32.69 36.62 27.65 43.13 68.60
2,4-DTBP selectivity 15.52 8.86 25.29 15.38 5.34
Total ortho selectivity 49.70 52.64 44.70 39.45 23.55
The important observations are:
(1) Cu rich samples show high phenol conversion than Co rich samples. Phenol
conversion increases from x=0 to x=0.5 and then decreases with further increase of x.
(2) 2-TBP selectivity decreases as the Co content increases whereas reverse is true for 4-
TBP selectivity.
(3) Among various compositions x = 0.50 shows maximum activity towards 2,4-DTBP
formation.
Chapter 3: Catalytic Activity Studies and Mechanism of Phenol Methylation
97
SECTION II
3.7. INTRODUCTION
IR technique is ideally suitable for investigating the nature of adsorbed surface
intermediates on the oxide surface during catalytic reactions. The spectra of adsorbed
species can provide information about the chemistry occurring on the surface. In the
following we have attempted to study the adsorption behavior of phenol, methanol,
mixture of phenol and methanol, formic acid and various methylated phenols separately to
get an insight on the mechanism of phenol methylation on the surface of Cu1-xCoxFe2O4.
FTIR of above adsorbed molecules was recorded in drift mode and the experimental
procedure is as described in chapter 2 (Section 2.4.2).
3.8. RESULTS
3.8.1. Adsorption of methanol
The IR spectra of methanol adsorbed at different temperatures on three selected
compositions x = 0, 0.50 and 1 were recorded in the region 1000-1800 cm-1 and 2700-3100
cm-1 are shown in Figure 3.15 and Figure 3.16, respectively.
Figure 3.15: FTIR spectra of methanol adsorbed on Cu1-xCoxFe2O4 for three selected compositions
x = 0.0, 0.50 and 1.0 in the range 1000-1800 cm-1 at different temperatures.
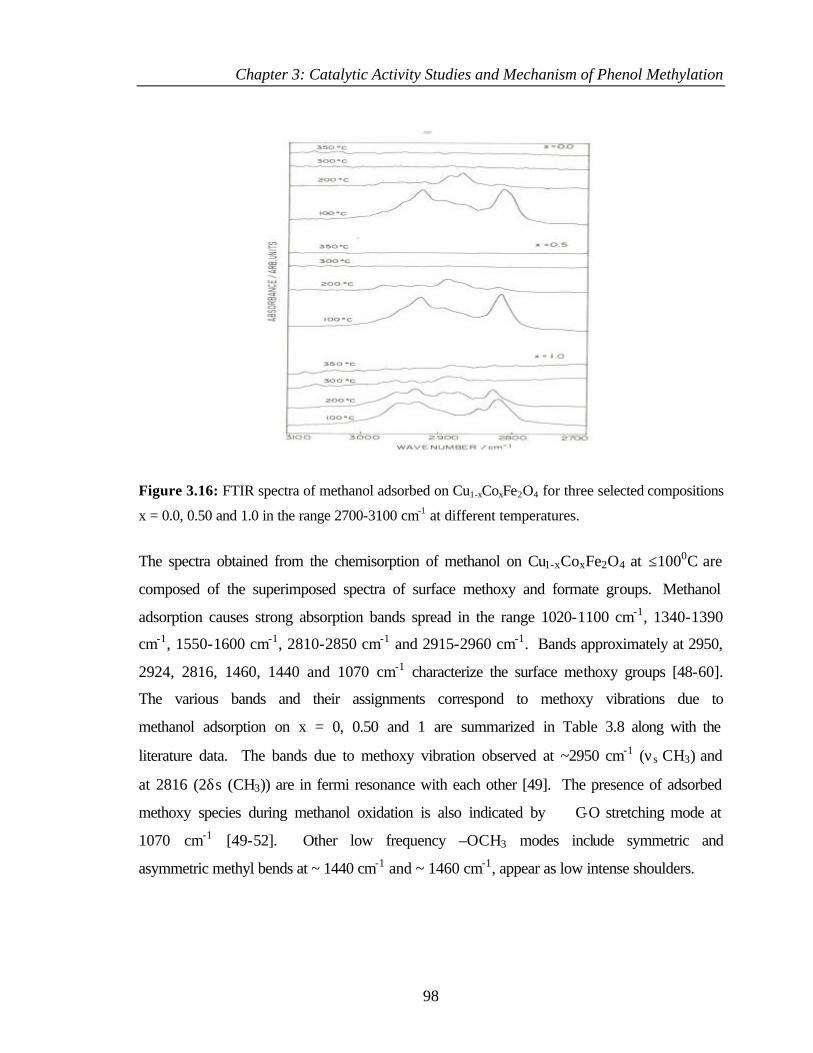
Chapter 3: Catalytic Activity Studies and Mechanism of Phenol Methylation
98
Figure 3.16: FTIR spectra of methanol adsorbed on Cu1-xCoxFe2O4 for three selected compositions
x = 0.0, 0.50 and 1.0 in the range 2700-3100 cm-1 at different temperatures.
The spectra obtained from the chemisorption of methanol on Cu1-xCoxFe2O4 at ≤1000C are
composed of the superimposed spectra of surface methoxy and formate groups. Methanol
adsorption causes strong absorption bands spread in the range 1020-1100 cm-1, 1340-1390
cm-1, 1550-1600 cm-1, 2810-2850 cm-1 and 2915-2960 cm-1. Bands approximately at 2950,
2924, 2816, 1460, 1440 and 1070 cm-1 characterize the surface methoxy groups [48-60].
The various bands and their assignments correspond to methoxy vibrations due to
methanol adsorption on x = 0, 0.50 and 1 are summarized in Table 3.8 along with the
literature data. The bands due to methoxy vibration observed at ~2950 cm-1 (νs CH3) and
at 2816 (2δs (CH3)) are in fermi resonance with each other [49]. The presence of adsorbed
methoxy species during methanol oxidation is also indicated by C-O stretching mode at
1070 cm-1 [49-52]. Other low frequency –OCH3 modes include symmetric and
asymmetric methyl bends at ~ 1440 cm-1 and ~ 1460 cm-1, appear as low intense shoulders.
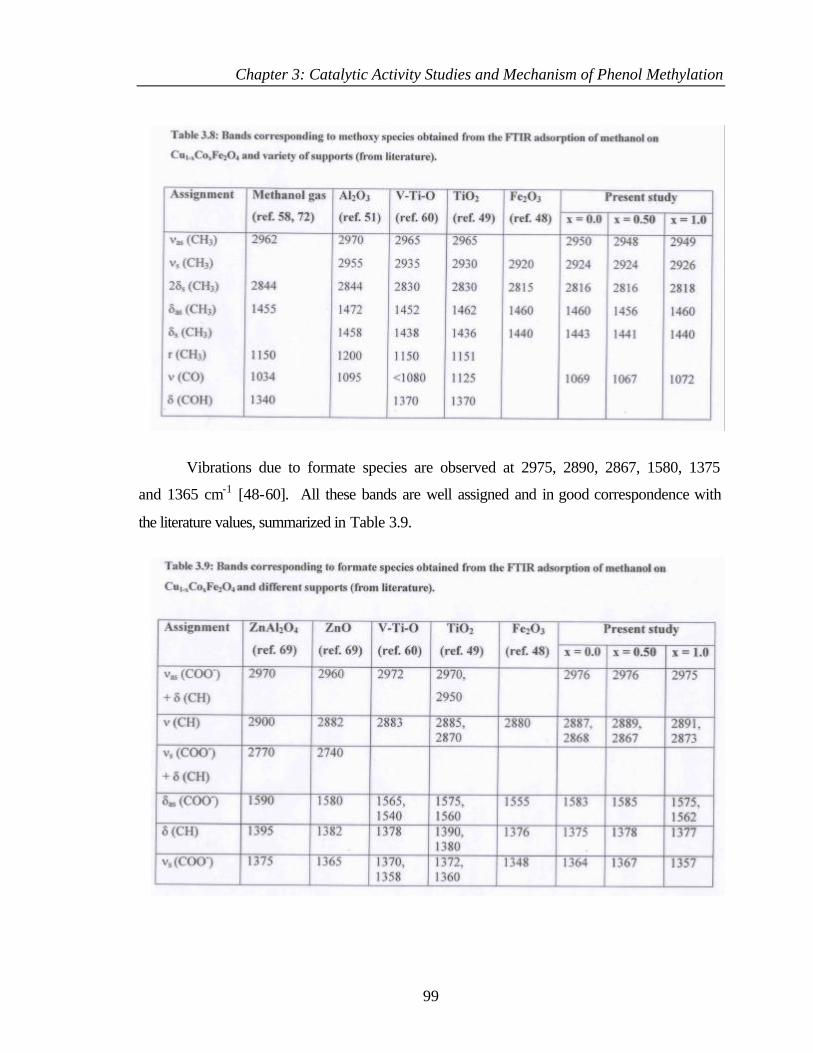
Chapter 3: Catalytic Activity Studies and Mechanism of Phenol Methylation
99
Vibrations due to formate species are observed at 2975, 2890, 2867, 1580, 1375
and 1365 cm-1 [48-60]. All these bands are well assigned and in good correspondence with
the literature values, summarized in Table 3.9.
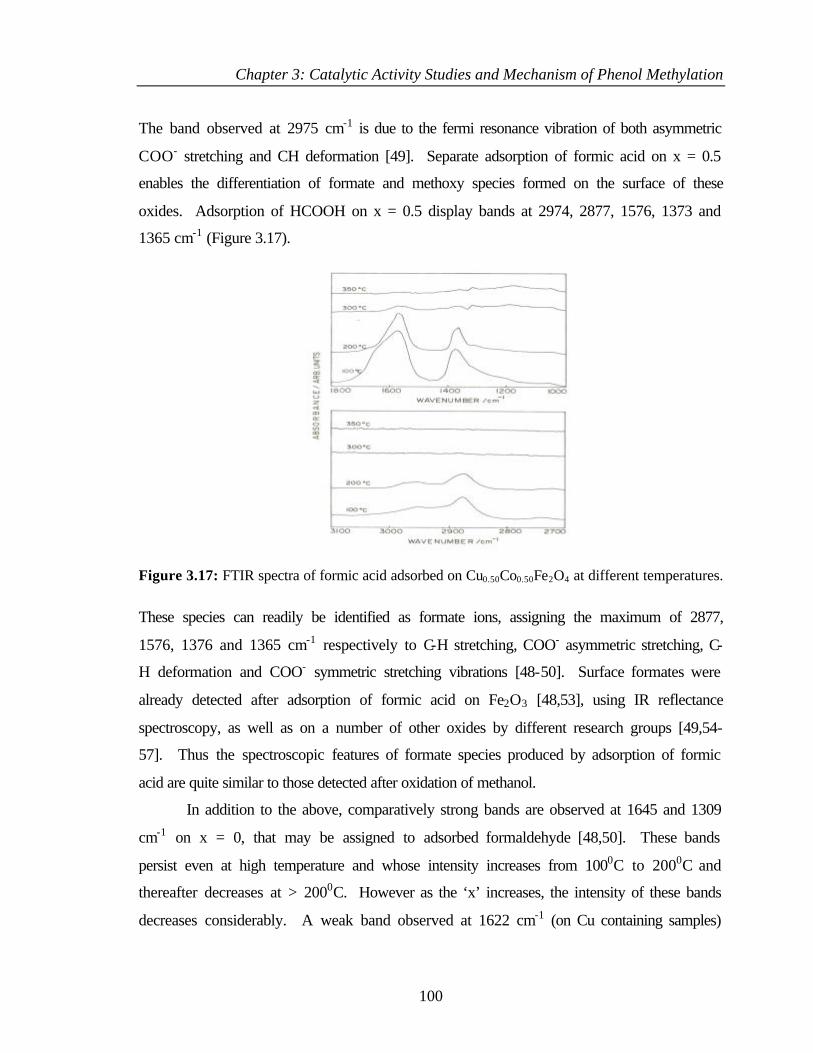
Chapter 3: Catalytic Activity Studies and Mechanism of Phenol Methylation
100
The band observed at 2975 cm-1 is due to the fermi resonance vibration of both asymmetric
COO- stretching and CH deformation [49]. Separate adsorption of formic acid on x = 0.5
enables the differentiation of formate and methoxy species formed on the surface of these
oxides. Adsorption of HCOOH on x = 0.5 display bands at 2974, 2877, 1576, 1373 and
1365 cm-1 (Figure 3.17).
Figure 3.17: FTIR spectra of formic acid adsorbed on Cu0.50Co0.50Fe2O4 at different temperatures.
These species can readily be identified as formate ions, assigning the maximum of 2877,
1576, 1376 and 1365 cm-1 respectively to C-H stretching, COO- asymmetric stretching, C-
H deformation and COO- symmetric stretching vibrations [48-50]. Surface formates were
already detected after adsorption of formic acid on Fe2O3 [48,53], using IR reflectance
spectroscopy, as well as on a number of other oxides by different research groups [49,54-
57]. Thus the spectroscopic features of formate species produced by adsorption of formic
acid are quite similar to those detected after oxidation of methanol.
In addition to the above, comparatively strong bands are observed at 1645 and 1309
cm-1 on x = 0, that may be assigned to adsorbed formaldehyde [48,50]. These bands
persist even at high temperature and whose intensity increases from 1000C to 2000C and
thereafter decreases at > 2000C. However as the ‘x’ increases, the intensity of these bands
decreases considerably. A weak band observed at 1622 cm-1 (on Cu containing samples)
Chapter 3: Catalytic Activity Studies and Mechanism of Phenol Methylation
101
can be assigned to a species coordinatively bonded through the carbonyl oxygen to Lewis
acid sites [48].
Heat treatments under N2 atmosphere and above 1000C cause considerable decrease
in intensity of the bands associated with methoxy species; however, the species responsible
for formate grows in intensity (Figures 3.15 and 3.16). Thus, the absorbances appear as
high intense peaks at 2950 cm-1, 2923 cm-1 and 1067 cm-1 have become low intense peaks
as the temperature increases to 2000C. On the other hand, the bands appear as low intense
peaks at 1000C at 2976, 2887, 2868, 1645, 1583, 1375 and 1364 cm-1 have become high
intense peaks with minor changes in their positions as the temperature increases. These
bands correspond to those, which appear after adsorption of formic acid on the same
surface and can be assigned to surface formate ions obtained by oxidation of methoxy
groups. Similar observations have already been detected on various metal oxides such as
Fe2O3 [48], TiO2 [49,52], SnO2 [57], ZrO2 [59], V2O5 [59,60], Cr2O3 [61] etc. However
the shifts observed on Cu1-xCoxFe2O4 in comparison with the single component oxides are
significant enough to conclude that species formed on Cu1-xCoxFe2O4 are indeed
characteristic of a mixed phase and not due to the adsorption on one component, CuO,
CoO or Fe2O3. Further increase in temperature causes splitting as well as reduction in
intensity of several bands indicate the adsorbed methanol species are unstable on the
surface.
The adsorption behavior of methanol over Cu1-xCoxFe2O4 shows slight differences
between Cu containing samples and pure CoFe2O4. The important difference between x =
1 and Cu containing compositions towards methanol adsorption are:
(1) The amount of methanol adsorbed at 1000C (in terms of intensity) on x =1 is relatively
low in comparison with Cu containing samples indicates comparatively high temperature is
needed for the activation of methanol on x = 1.
(2) The concentration of methoxy species is high and it persists even at 3000C on x = 1
where as on Cu containing samples, methoxy species are quite unstable and it is evident
from the very low concentration of these species even at 2000C. Parallel to this the
concentration of formate species increased to considerable extent at this temperature. This
clearly shows methanol is highly susceptible to oxidation on Cu containing samples. For
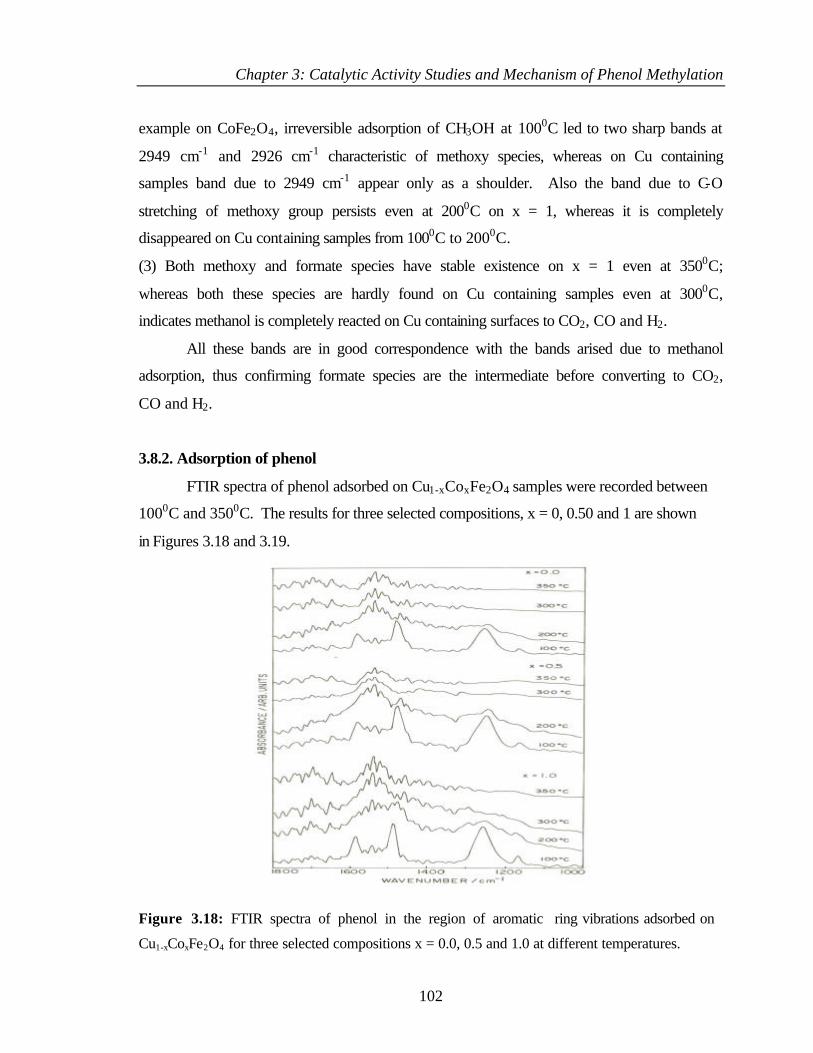
Chapter 3: Catalytic Activity Studies and Mechanism of Phenol Methylation
102
example on CoFe2O4, irreversible adsorption of CH3OH at 1000C led to two sharp bands at
2949 cm-1 and 2926 cm-1 characteristic of methoxy species, whereas on Cu containing
samples band due to 2949 cm-1 appear only as a shoulder. Also the band due to C-O
stretching of methoxy group persists even at 2000C on x = 1, whereas it is completely
disappeared on Cu containing samples from 1000C to 2000C.
(3) Both methoxy and formate species have stable existence on x = 1 even at 3500C;
whereas both these species are hardly found on Cu containing samples even at 3000C,
indicates methanol is completely reacted on Cu containing surfaces to CO2, CO and H2.
All these bands are in good correspondence with the bands arised due to methanol
adsorption, thus confirming formate species are the intermediate before converting to CO2,
CO and H2.
3.8.2. Adsorption of phenol
FTIR spectra of phenol adsorbed on Cu1-xCoxFe2O4 samples were recorded between
1000C and 3500C. The results for three selected compositions, x = 0, 0.50 and 1 are shown
in Figures 3.18 and 3.19.
Figure 3.18: FTIR spectra of phenol in the region of aromatic ring vibrations adsorbed on
Cu1-xCoxFe2O4 for three selected compositions x = 0.0, 0.5 and 1.0 at different temperatures.
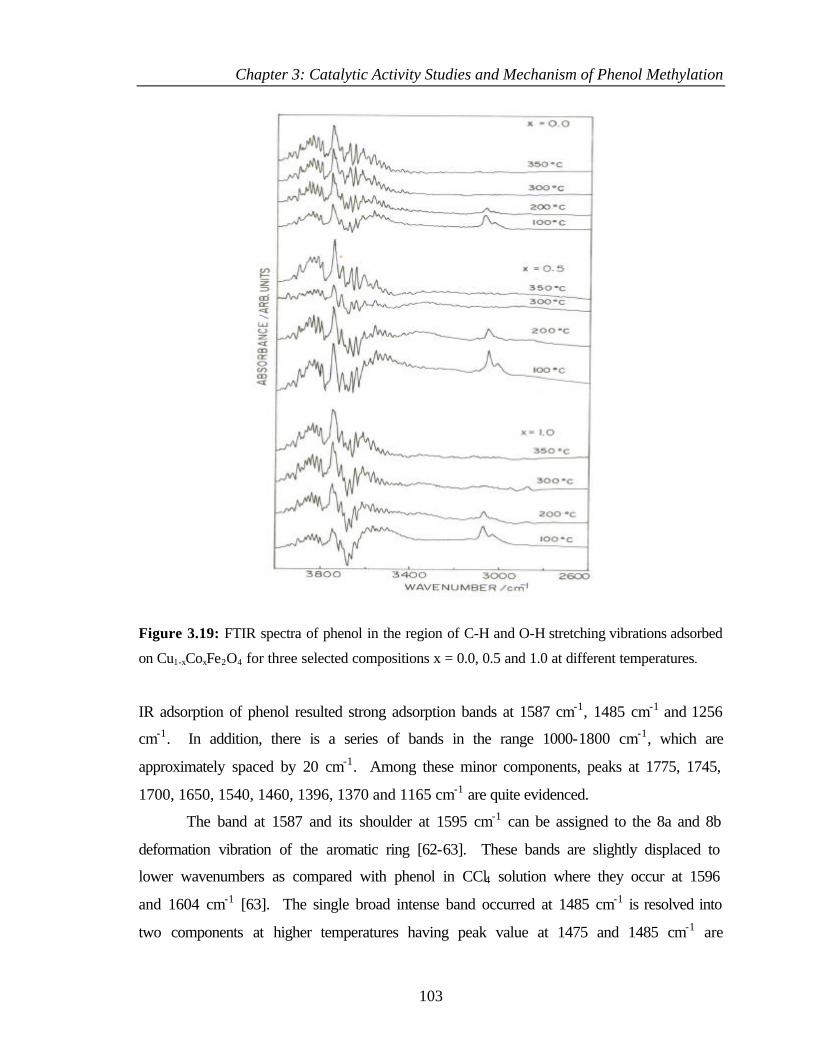
Chapter 3: Catalytic Activity Studies and Mechanism of Phenol Methylation
103
Figure 3.19: FTIR spectra of phenol in the region of C-H and O-H stretching vibrations adsorbed
on Cu1-xCoxFe2O4 for three selected compositions x = 0.0, 0.5 and 1.0 at different temperatures.
IR adsorption of phenol resulted strong adsorption bands at 1587 cm-1, 1485 cm-1 and 1256
cm-1. In addition, there is a series of bands in the range 1000-1800 cm-1, which are
approximately spaced by 20 cm-1. Among these minor components, peaks at 1775, 1745,
1700, 1650, 1540, 1460, 1396, 1370 and 1165 cm-1 are quite evidenced.
The band at 1587 and its shoulder at 1595 cm-1 can be assigned to the 8a and 8b
deformation vibration of the aromatic ring [62-63]. These bands are slightly displaced to
lower wavenumbers as compared with phenol in CCl4 solution where they occur at 1596
and 1604 cm-1 [63]. The single broad intense band occurred at 1485 cm-1 is resolved into
two components at higher temperatures having peak value at 1475 and 1485 cm-1 are
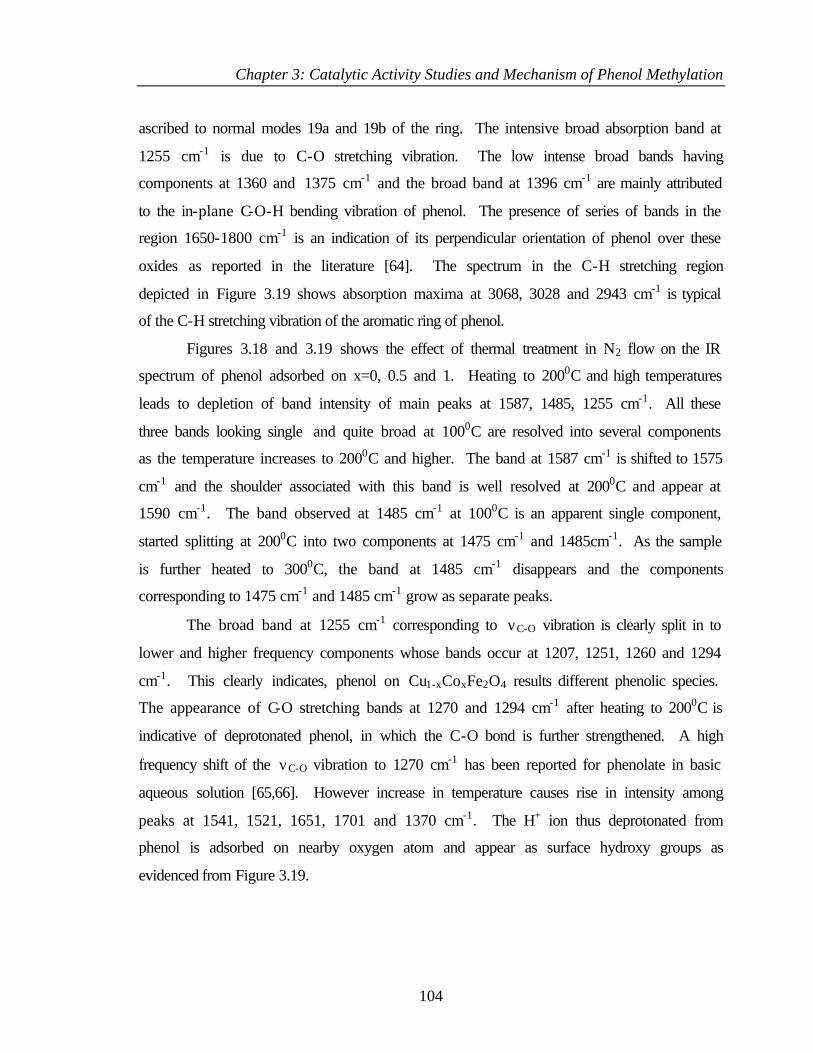
Chapter 3: Catalytic Activity Studies and Mechanism of Phenol Methylation
104
ascribed to normal modes 19a and 19b of the ring. The intensive broad absorption band at
1255 cm-1 is due to C-O stretching vibration. The low intense broad bands having
components at 1360 and 1375 cm-1 and the broad band at 1396 cm-1 are mainly attributed
to the in-plane C-O-H bending vibration of phenol. The presence of series of bands in the
region 1650-1800 cm-1 is an indication of its perpendicular orientation of phenol over these
oxides as reported in the literature [64]. The spectrum in the C-H stretching region
depicted in Figure 3.19 shows absorption maxima at 3068, 3028 and 2943 cm-1 is typical
of the C-H stretching vibration of the aromatic ring of phenol.
Figures 3.18 and 3.19 shows the effect of thermal treatment in N2 flow on the IR
spectrum of phenol adsorbed on x=0, 0.5 and 1. Heating to 2000C and high temperatures
leads to depletion of band intensity of main peaks at 1587, 1485, 1255 cm-1. All these
three bands looking single and quite broad at 1000C are resolved into several components
as the temperature increases to 2000C and higher. The band at 1587 cm-1 is shifted to 1575
cm-1 and the shoulder associated with this band is well resolved at 2000C and appear at
1590 cm-1. The band observed at 1485 cm-1 at 1000C is an apparent single component,
started splitting at 2000C into two components at 1475 cm-1 and 1485cm-1. As the sample
is further heated to 3000C, the band at 1485 cm-1 disappears and the components
corresponding to 1475 cm-1 and 1485 cm-1 grow as separate peaks.
The broad band at 1255 cm-1 corresponding to νC-O vibration is clearly split in to
lower and higher frequency components whose bands occur at 1207, 1251, 1260 and 1294
cm-1. This clearly indicates, phenol on Cu1-xCoxFe2O4 results different phenolic species.
The appearance of C-O stretching bands at 1270 and 1294 cm-1 after heating to 2000C is
indicative of deprotonated phenol, in which the C-O bond is further strengthened. A high
frequency shift of the νC-O vibration to 1270 cm-1 has been reported for phenolate in basic
aqueous solution [65,66]. However increase in temperature causes rise in intensity among
peaks at 1541, 1521, 1651, 1701 and 1370 cm-1. The H+ ion thus deprotonated from
phenol is adsorbed on nearby oxygen atom and appear as surface hydroxy groups as
evidenced from Figure 3.19.
Chapter 3: Catalytic Activity Studies and Mechanism of Phenol Methylation
105
3.8.3. Adsorption of Anisole
In the Figure 3.20, spectra of anisole on x = 0.5 is given at different temperatures,
as difference spectra from anisole adsorbed and pure compound. In the region of ring
vibrations prominent peaks are observed at 1600 and 1496 cm-1. Corresponding peaks for
liquid anisole are at 1601 and 1498 cm-1, which shows that adsorbed anisole is less
strongly bonded on the surface of x = 0.5. The major peak observed at 1247 cm-1 is νC-O
vibration. In addition to this, several minor features are observed at 1570, 1550, 1530,
1460, 1309, 1180, 1076 and 1041 cm-1. No bands are detected in the range 1650-1800 cm-
1 neglects the perpendicular orientation of benzene ring. Bands at 3062 cm-1 and 3010 cm-1
are due to C-H stretching of the aromatic ring of the phenol molecule. Additionally,
vibrations due to CH3 group of anisole are observed at 2952, 2922 and 2837 cm-1.
Figure 3.20: FTIR spectra of anisole adsorbed on x = 0.50 at different temperatures. Top panel
represents the spectra in the region of aromatic vibrations. Bottom panel represents aromatic C-H
and O-H stretching and CH3 vibrations.
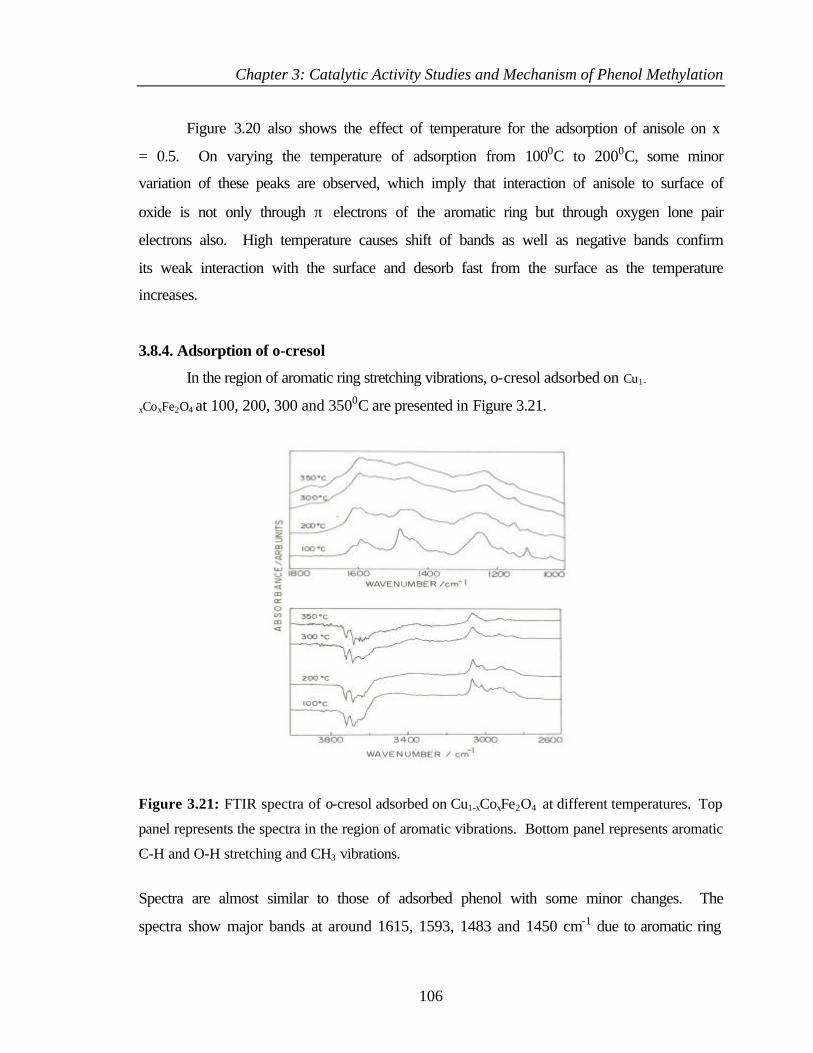
Chapter 3: Catalytic Activity Studies and Mechanism of Phenol Methylation
106
Figure 3.20 also shows the effect of temperature for the adsorption of anisole on x
= 0.5. On varying the temperature of adsorption from 1000C to 2000C, some minor
variation of these peaks are observed, which imply that interaction of anisole to surface of
oxide is not only through π electrons of the aromatic ring but through oxygen lone pair
electrons also. High temperature causes shift of bands as well as negative bands confirm
its weak interaction with the surface and desorb fast from the surface as the temperature
increases.
3.8.4. Adsorption of o-cresol
In the region of aromatic ring stretching vibrations, o-cresol adsorbed on Cu1-
xCoxFe2O4 at 100, 200, 300 and 3500C are presented in Figure 3.21.
Figure 3.21: FTIR spectra of o-cresol adsorbed on Cu1-xCoxFe2O4 at different temperatures. Top
panel represents the spectra in the region of aromatic vibrations. Bottom panel represents aromatic
C-H and O-H stretching and CH3 vibrations.
Spectra are almost similar to those of adsorbed phenol with some minor changes. The
spectra show major bands at around 1615, 1593, 1483 and 1450 cm-1 due to aromatic ring
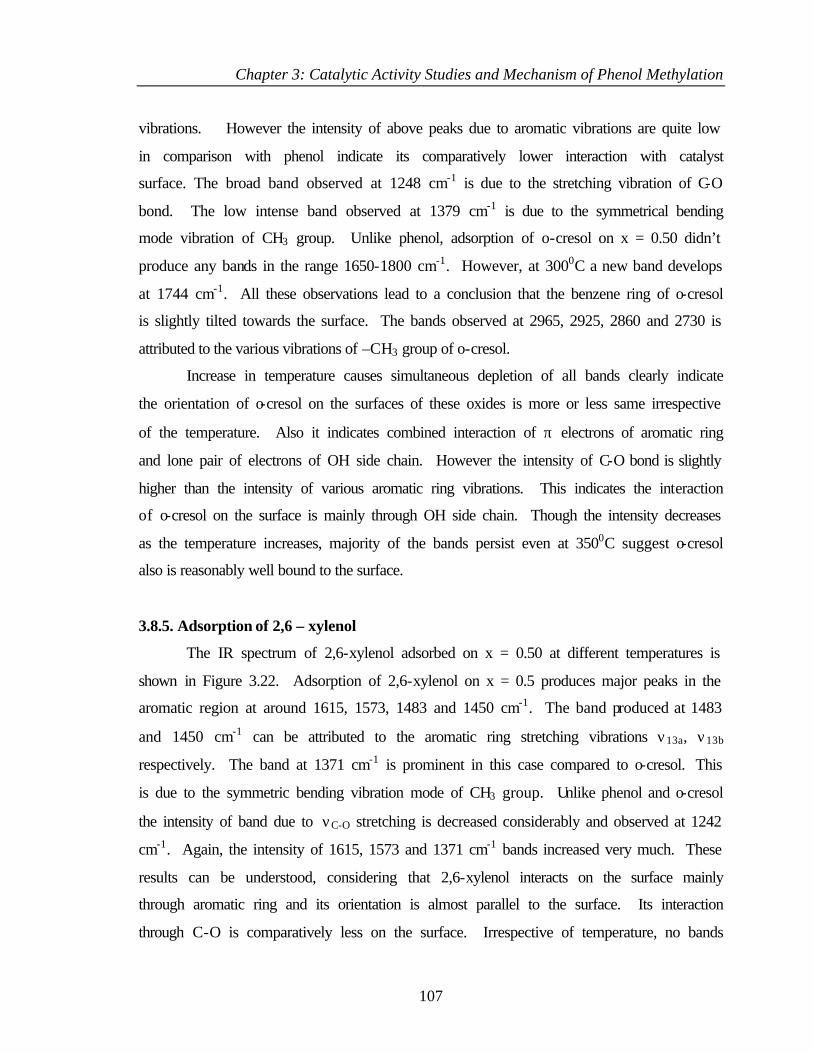
Chapter 3: Catalytic Activity Studies and Mechanism of Phenol Methylation
107
vibrations. However the intensity of above peaks due to aromatic vibrations are quite low
in comparison with phenol indicate its comparatively lower interaction with catalyst
surface. The broad band observed at 1248 cm-1 is due to the stretching vibration of C-O
bond. The low intense band observed at 1379 cm-1 is due to the symmetrical bending
mode vibration of CH3 group. Unlike phenol, adsorption of o-cresol on x = 0.50 didn’t
produce any bands in the range 1650-1800 cm-1. However, at 3000C a new band develops
at 1744 cm-1. All these observations lead to a conclusion that the benzene ring of o-cresol
is slightly tilted towards the surface. The bands observed at 2965, 2925, 2860 and 2730 is
attributed to the various vibrations of –CH3 group of o-cresol.
Increase in temperature causes simultaneous depletion of all bands clearly indicate
the orientation of o-cresol on the surfaces of these oxides is more or less same irrespective
of the temperature. Also it indicates combined interaction of π electrons of aromatic ring
and lone pair of electrons of OH side chain. However the intensity of C-O bond is slightly
higher than the intensity of various aromatic ring vibrations. This indicates the interaction
of o-cresol on the surface is mainly through OH side chain. Though the intensity decreases
as the temperature increases, majority of the bands persist even at 3500C suggest o-cresol
also is reasonably well bound to the surface.
3.8.5. Adsorption of 2,6 – xylenol
The IR spectrum of 2,6-xylenol adsorbed on x = 0.50 at different temperatures is
shown in Figure 3.22. Adsorption of 2,6-xylenol on x = 0.5 produces major peaks in the
aromatic region at around 1615, 1573, 1483 and 1450 cm-1. The band produced at 1483
and 1450 cm-1 can be attributed to the aromatic ring stretching vibrations ν13a, ν13b
respectively. The band at 1371 cm-1 is prominent in this case compared to o-cresol. This
is due to the symmetric bending vibration mode of CH3 group. Unlike phenol and o-cresol
the intensity of band due to νC-O stretching is decreased considerably and observed at 1242
cm-1. Again, the intensity of 1615, 1573 and 1371 cm-1 bands increased very much. These
results can be understood, considering that 2,6-xylenol interacts on the surface mainly
through aromatic ring and its orientation is almost parallel to the surface. Its interaction
through C-O is comparatively less on the surface. Irrespective of temperature, no bands
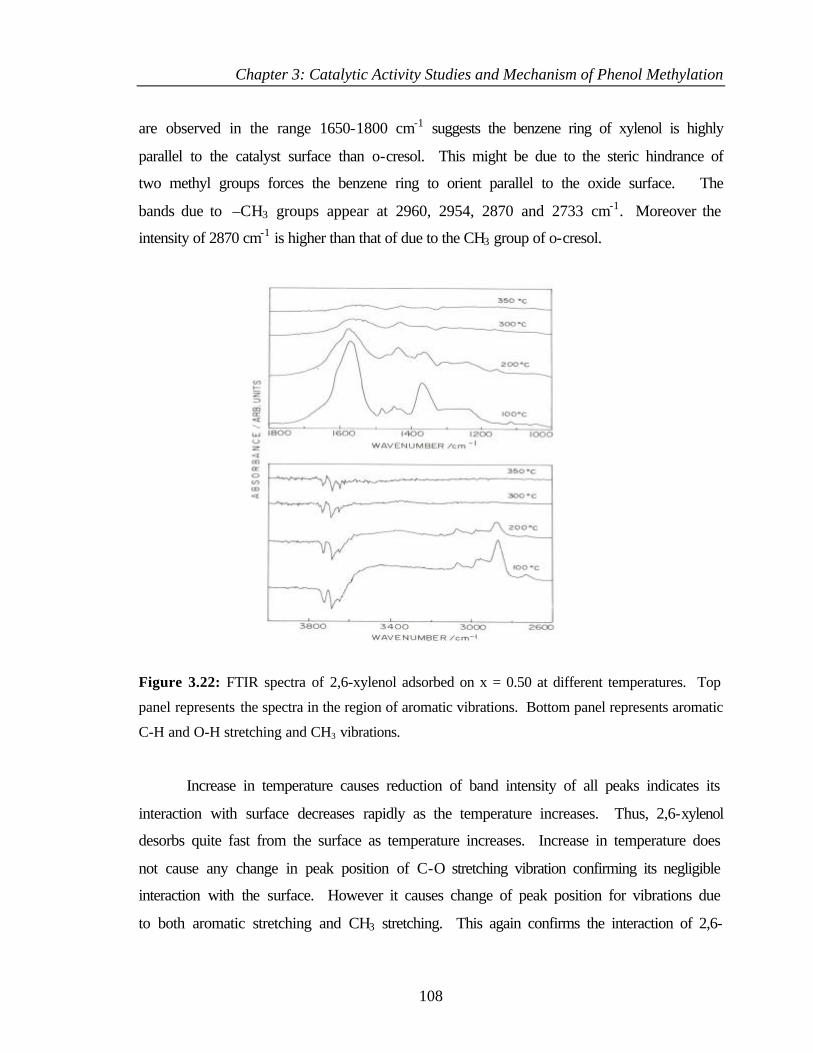
Chapter 3: Catalytic Activity Studies and Mechanism of Phenol Methylation
108
are observed in the range 1650-1800 cm-1 suggests the benzene ring of xylenol is highly
parallel to the catalyst surface than o-cresol. This might be due to the steric hindrance of
two methyl groups forces the benzene ring to orient parallel to the oxide surface. The
bands due to –CH3 groups appear at 2960, 2954, 2870 and 2733 cm-1. Moreover the
intensity of 2870 cm-1 is higher than that of due to the CH3 group of o-cresol.
Figure 3.22: FTIR spectra of 2,6-xylenol adsorbed on x = 0.50 at different temperatures. Top
panel represents the spectra in the region of aromatic vibrations. Bottom panel represents aromatic
C-H and O-H stretching and CH3 vibrations.
Increase in temperature causes reduction of band intensity of all peaks indicates its
interaction with surface decreases rapidly as the temperature increases. Thus, 2,6-xylenol
desorbs quite fast from the surface as temperature increases. Increase in temperature does
not cause any change in peak position of C-O stretching vibration confirming its negligible
interaction with the surface. However it causes change of peak position for vibrations due
to both aromatic stretching and CH3 stretching. This again confirms the interaction of 2,6-
Chapter 3: Catalytic Activity Studies and Mechanism of Phenol Methylation
109
xylenol on the surface is mainly through aromatic π electrons and hence its orientation is
more or less parallel with respect to the surface. Unlike phenol and o-cresol, the intensity
of various bands arised due to 2,6-xylenol adsorption decreases considerably above 3000C.
This indicates 2,6-xylenol desorbs fast as the temperature increases. The IR observations
of o-cresol and 2,6-xylenol clearly hints longer residence time of the former leads to
second methylation and leads to the latter and its subsequent fast desorption at reaction
temperatures.
3.8.6. Coadsorption of phenol and methanol
Figure 3.23 demonstrates IR spectrum of phenol coadsorbed with methanol. It was
obtained after adsorption of phenol and methanol (using phenol:methanol mole ratio 1:5)
at 1000C and subsequent heating to 3500C.
Figure 3.23: FTIR spectra of phenol and methanol coadsorbed on Cu1-xCoxFe2O4 at different
temperatures (phenol:methanol = 1:5 mole ratio is used for coadsorption).
Chapter 3: Catalytic Activity Studies and Mechanism of Phenol Methylation
110
Apparently, the decomposition as well as oxidation of methanol is retarded in the
presence of phenol. Remarkably, the intensity of C-O stretching bands of methoxy moiety
at 1067 cm-1 is significantly decreased when methanol was heated in the presence of
phenol. The aromatic ring vibration of phenol at 1585 cm-1 is shifted to 1591 cm-1 and
exhibits a shoulder at 1570 cm-1. The narrow band at 1481 cm-1 observed on phenol
adsorption is shifted to 1487 cm-1 and overlapped with an additional band at 1472 cm-1.
Above four bands are characteristic bands of o-cresol and 2,6-xylenol. It is important to
note that the bands due to formate species observed at 1580, 1375 and 1365 cm-1 when
methanol was sole reagent is either lost or decreased in intensity when methanol is
coadsorbed with phenol. Another important change to be noted is that the methyl
vibrations observed at 2950, 2924 and 2816 cm-1 is lost when methanol is in coadsorbed
state.
Number of bands disappeared in the phenolic region when phenol is coadsorbed
with methanol in contrast to adsorption of phenol alone. Additionally a number of bands
observed in the C-H region of aromatic at 3114, 3099, 3070, 3051, 3033 and 3026 cm-1.
This hints coadsorption leads to some sort of interaction between phenol and methanol.
The bands exhibited on phenol adsorption in the range 1650-1800 cm-1 is disappeared
when phenol is coadsorbed with methanol. This behavior is similar to the behavior
exhibited by o-cresol and 2,6-xylenol.
As the temperature increases from 1000C, the band at 1591 cm-1 is shifted to 1585
cm-1. The band at 1560 cm-1 appear as a shoulder along with the band at 1591 cm-1 grows
in intensity as the temperature increases to 2000C and is slightly split from the main band.
The two separated bands observed at 1487 cm-1 and 1471 cm-1 at 1000C decrease in
intensity and merge together (whose center is at 1465 cm-1) as the temperature increases to
3000C. The broad band at 1253 cm-1 at 1000C further broadens when the temperature
increases. Above 3000C, the intensity of various bands decreases considerably indicates
the products formed during the reaction desorbs fast. This behavior is similar to that
exhibited by either o-cresol or 2,6-xylenol.
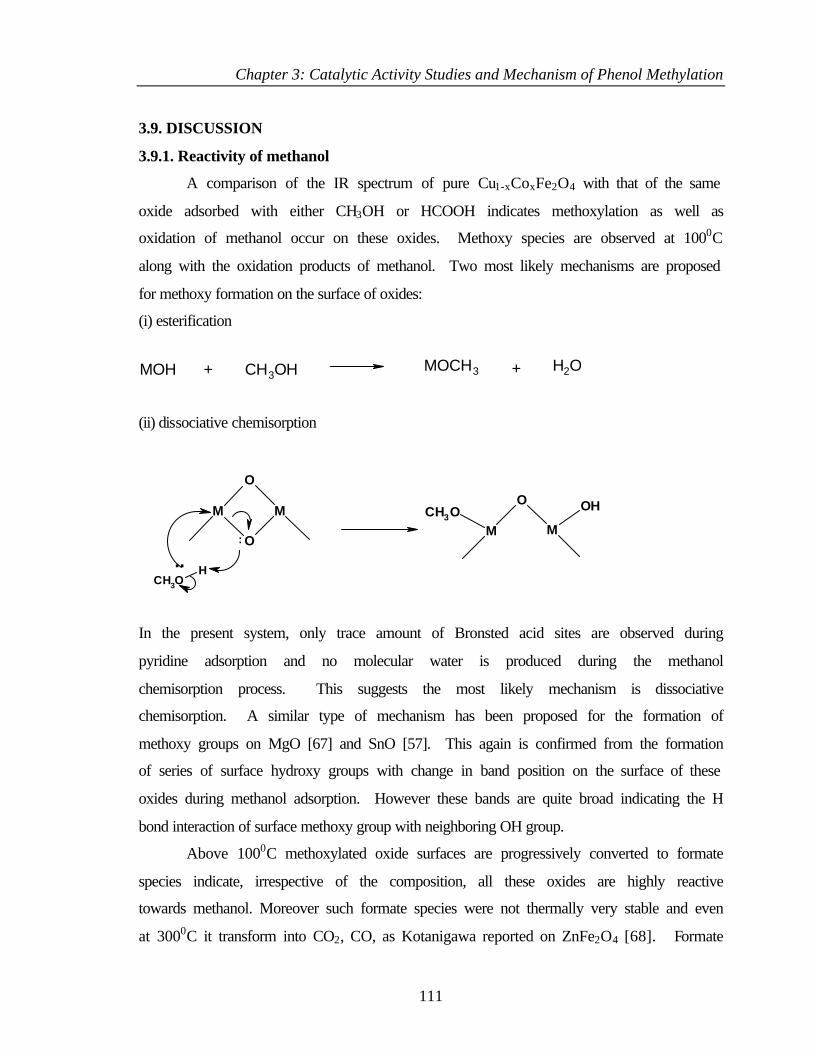
Chapter 3: Catalytic Activity Studies and Mechanism of Phenol Methylation
111
3.9. DISCUSSION
3.9.1. Reactivity of methanol
A comparison of the IR spectrum of pure Cu1-xCoxFe2O4 with that of the same
oxide adsorbed with either CH3OH or HCOOH indicates methoxylation as well as
oxidation of methanol occur on these oxides. Methoxy species are observed at 1000C
along with the oxidation products of methanol. Two most likely mechanisms are proposed
for methoxy formation on the surface of oxides:
(i) esterification
(ii) dissociative chemisorption
In the present system, only trace amount of Bronsted acid sites are observed during
pyridine adsorption and no molecular water is produced during the methanol
chemisorption process. This suggests the most likely mechanism is dissociative
chemisorption. A similar type of mechanism has been proposed for the formation of
methoxy groups on MgO [67] and SnO [57]. This again is confirmed from the formation
of series of surface hydroxy groups with change in band position on the surface of these
oxides during methanol adsorption. However these bands are quite broad indicating the H
bond interaction of surface methoxy group with neighboring OH group.
Above 1000C methoxylated oxide surfaces are progressively converted to formate
species indicate, irrespective of the composition, all these oxides are highly reactive
towards methanol. Moreover such formate species were not thermally very stable and even
at 3000C it transform into CO2, CO, as Kotanigawa reported on ZnFe2O4 [68]. Formate
O
M
O
M
:
CH3OH..
O
M MCH3O OH
MOH + CH3OH MOCH3 + H2O
Chapter 3: Catalytic Activity Studies and Mechanism of Phenol Methylation
112
concentration in the case of Cu containing samples is higher than that on CoFe2O4
indicating the presence of Cu has a promoting role in their formation. The promoting
action of Cu on methanol decomposition has been reported in the literature [69]. However
it is very difficult to detect bands due to methanol adsorption on Cu ions of such a complex
catalyst system. The only conclusion that can be drawn is a decrease in the thermal
stability of methoxy and formate species adsorbed on Cu containing ferrites due to the
presence of Cu2+ ion. Though all the compositions show general trend towards methanol
adsorption, the methoxy and formate species formed on x = 1 is quite stable even at 3500C
suggest methanol seems to be activated only at high temperature.
3.9.2. Reactivity of phenol and phenolic products
IR adsorption of phenol on Cu1-xCoxFe2O4 shows signals of both undissociated
phenol and phenolate like species. Phenolate species are formed due to the dissociative
adsorption of phenol on an acid-base pair site. Phenolate ion is adsorbed on metal cation
(Lewis acid site) where as the dissociated H adsorbs as a H+ on a nearby O atom. Thus a
series of O-H bands are formed in the region 3500-3800 cm-1 (shown in Figure 3.19).
Examination of bands in the region 1600-1800 cm-1 for phenol and methylated
phenol reveals a number of low intensity out of plane combination bands [64] at 1650,
1700, 1745 and 1775 cm-1 for phenol; however these bands are either hardly detected, or
the intensity is small on methylated phenols. Also these bands are practically disappeared
for the phenol in the coadsorbed state with methanol. Karagounes and coworkers [70,71]
have interpreted a decrease in the intensity of out of plane C-H vibrations of chemisorbed
aromatic molecules to indicate that these molecules are adsorbed with the plane of the
aromatic ring parallel to the adsorbent surface. Applying a similar interpretation to the
above observations leads to the conclusion that the chemisorbed phenol molecule is
adsorbed through O atom to the Lewis acid site whose aromatic ring is almost
perpendicular to the plane of the oxide. On the other hand, situation is quite different in
the case of co-adsorption of phenol and methanol. Methanol is adsorbed onto the protons
released by phenol, which in turn interact to the ortho position of the phenolic oxygen.
This interaction govern the orientation of aromatic ring of phenol and from the absence of
Chapter 3: Catalytic Activity Studies and Mechanism of Phenol Methylation
113
bands in the IR spectrum in the range 1650-1800 cm-1, it is possible to suggests that,
aromatic ring of phenol tilts slightly toward the surface while interacting with methanol.
This is again confirmed from the adsorption state of methylated products of phenol such as
o-cresol, anisole and 2,6-xylenol. In all these cases, the chemisorbed phenol molecule also
has its benzene ring more or less coplanar with the surface such that interaction with the
surface results in a lack of bands in the region 1650-1800 cm-1. Though the phenolic ring
is more or less coplanar, it is tilted upward such that the para position is more removed
from the surface than the ortho.
The C-O stretching band for chemisorbed methyl phenols found in a relatively
wide region between 1220-1320 cm-1 in comparison with phenolic C-O stretching band.
Same inference can be made from phenol in the presence of methanol where it is found
that the nature and appearance of C-O band is similar to that observed in the case of o-
cresol. Moreover, as the methyl group increases the intensity of C-O stretching band
decreases, which indicates the interaction through phenolic oxygen to the surface decreases
from phenol to o-cresol to 2,6-xylenol. Thus it is highly plausible that the aromatic ring of
these phenolic compounds have become more parallel, but tilted upward as the number of
methyl groups increases. Also as the temperature increases the intensity of various bands
decreases tremendously as goes from phenol to o-cresol to 2,6-xylenol. Above details
leads to a conclusion that the methylated phenols have got weak interaction with the
surface and are highly susceptible to desorb from the surface as the temperature increases.
This is an essential requisite for achieving efficient methylation. However for x=1, it
requires relatively high temperature than the Cu containing samples. Kinetic data also
leads to the same conclusion and it is found that unlike Cu compounds, CoFe2O4 shows
maximum conversion and selectivity at 3750C where as for other compounds it is at 3500C.
3.9.3. Mechanism of phenol methylation
IR studies clearly showed that surface bound alkoxides or strongly polarized O-H
bands were formed when methanol is adsorbed to Cu1-xCoxFe2O4. Similarly phenol is
dissociatively adsorbed on nearby acid base pair site as phenoxide ion and proton. The
dissociated proton has a governing role on the fate of methanol molecule, which facilitates
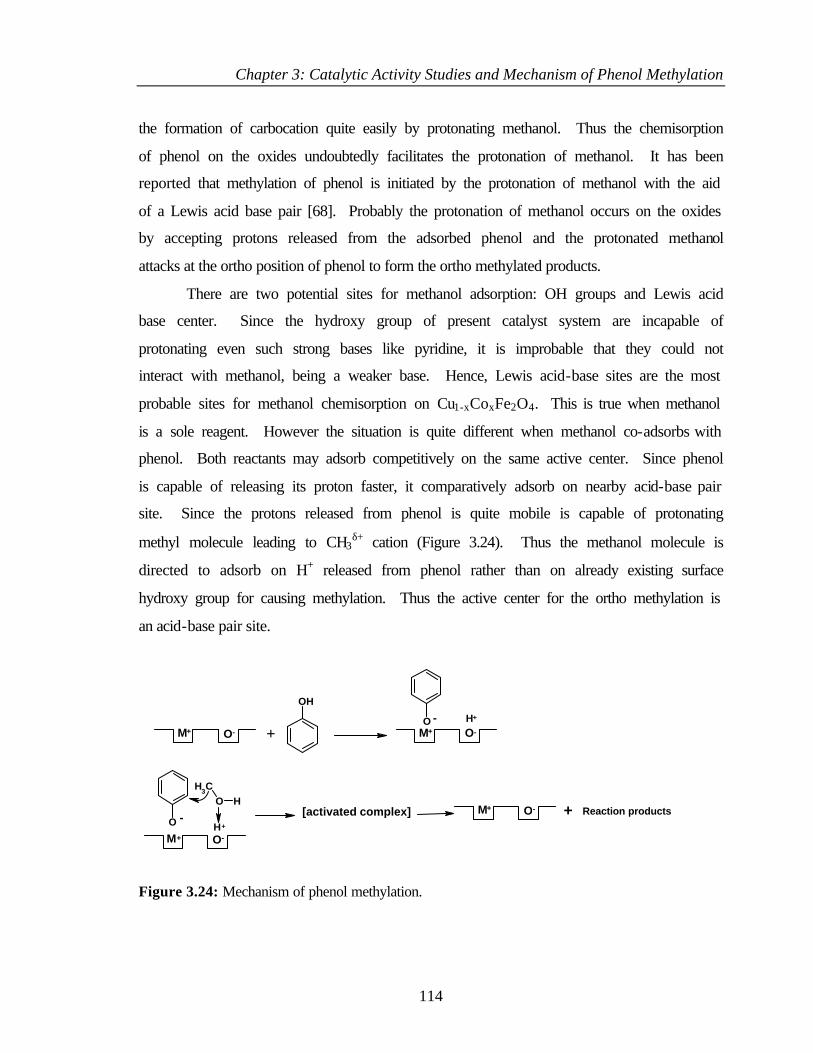
Chapter 3: Catalytic Activity Studies and Mechanism of Phenol Methylation
114
the formation of carbocation quite easily by protonating methanol. Thus the chemisorption
of phenol on the oxides undoubtedly facilitates the protonation of methanol. It has been
reported that methylation of phenol is initiated by the protonation of methanol with the aid
of a Lewis acid base pair [68]. Probably the protonation of methanol occurs on the oxides
by accepting protons released from the adsorbed phenol and the protonated methanol
attacks at the ortho position of phenol to form the ortho methylated products.
There are two potential sites for methanol adsorption: OH groups and Lewis acid
base center. Since the hydroxy group of present catalyst system are incapable of
protonating even such strong bases like pyridine, it is improbable that they could not
interact with methanol, being a weaker base. Hence, Lewis acid-base sites are the most
probable sites for methanol chemisorption on Cu1-xCoxFe2O4. This is true when methanol
is a sole reagent. However the situation is quite different when methanol co-adsorbs with
phenol. Both reactants may adsorb competitively on the same active center. Since phenol
is capable of releasing its proton faster, it comparatively adsorb on nearby acid-base pair
site. Since the protons released from phenol is quite mobile is capable of protonating
methyl molecule leading to CH3δ+ cation (Figure 3.24). Thus the methanol molecule is
directed to adsorb on H+ released from phenol rather than on already existing surface
hydroxy group for causing methylation. Thus the active center for the ortho methylation is
an acid-base pair site.
Figure 3.24: Mechanism of phenol methylation.
OH
M+ O- + M+ O-O - H+
[activated complex]
CH3
O H
H+
M+ O-
O - + Reaction productsM+ O-
Chapter 3: Catalytic Activity Studies and Mechanism of Phenol Methylation
115
C-alkylation can take place either by a direct route or by the isomerization of O-
alkylation product. To decide between these two routes, anisole were passed over the
catalyst under optimum condition. No isomerized products were obtained. Thus these
compounds do not have any activity for the transformation of anisole into o-cresol in the
catalytic conversion of anisole at 3500C. Therefore, they have no acidic sites that catalyze
the methyl migration of anisole. It may be recalled that this is in contrast to the behavior
of alumina, on which alkyl phenyl ethers undergo isomerization to C-alkyl phenols [19].
Chapter 3: Catalytic Activity Studies and Mechanism of Phenol Methylation
116
3.10. REFERENCES
1 H. Fiege, A. G. Bayer and Leverkusen, Federal Republic of Germany, in “Ullmann’s
Encyclopedia of Industrial Chemistry”. A19, 324.
2 M. Inoue and S. Enomoto, Chem. Pharm. Bull., 24 (1976) 2199.
3 S. Patinuin and B. S. Friedman, in: Alkylation of Aromatics with Alkenes and Alkanes in
Friedel Crafts and Related Reactions, Interscience, New York, G. A. Olah (ed.), Vol. 3
(1964).
4 V. N. Ipatieff, N. Orloff and G. Razuvaeff, Bull. Soc. Chim. Fr., 37 (1925) 1576.
5 Ref. 107 and 133 of chapter 1
6 Perry’s Chemical Engineers Handbook, 1984, 6th ed., New York, McGraw Hill.
7 J. M. Smith and H. C. Van Ness, 1987, Introduction to chemical engineering
thermodynamics, 4th ed., New York, Mc Graw Hill.
8 R. C. Reid, J. M. Prausnitz and B. E. Poling, 1987, The properties of gases and liquids,
4th ed., New York, Mc Graw Hill.
9 D. R. Stull, E. F. Westrum and G. C. Sinke, G.C., 1969, The chemical thermodynamics
of organic compounds, John Wiley & Sons, Inc. New York.
10 Y. Ono, Catalysis Today, 35 (1997) 15.
11 A. Bomben, M. Selva, P. Tundo and L. Valli, Ind. Eng. Chem. Res., 38 (1999) 2075.
12 T. M. Jyothi, T. Raja, M. B. Talwar, K. Sreekumar, S. Sugunan and B. S. Rao, Synth.
Commun., 30 (2000) 3929 .
13 Y. Ono, Appl. Catal. A, 155 (1997) 133.
14 T. Beutel, J. Chem. Soc., Faraday Trans., 94 (1998) 985.
15 Z. Fu and Y. Ono, Catal. Lett., 21 (1993) 43.
16 F. M. Bautista, J. M. Campelo, A. Garcia, D. Luna, J. M. Marinas and A. A. Romero, React.
Kinet. Catal. Lett., 63 (1998) 261.
17 F. M. Bautista, J. M. Campelo, A. Garcia, D. Luna, J. M. Marinas, A. A. Romero and M. R.
Urbano, React. Kinet. Catal. Lett., 62 (1997) 47.
18 H. Saltonstall and Settle., J. Am. Chem. Soc. 71 (1949) 943.
19 M. Inoue and S. Emoto, Chem. Pharm. Bull. 20 (1972) 232.
20 R. Stroh, R. Seydel and W. Hahn, in “Neuere Methoden der praparatively organischen
chemie”, W. Foerst (ed.), Verlag Chemie, Weinheim Vol. II (1960) 231-246.
21 Z. P. Aleksandrova, J. Gen. Chem. (U. S. S. R). 12 (1942) 522.
Chapter 3: Catalytic Activity Studies and Mechanism of Phenol Methylation
117
22 A. G. Bayer, EP 102 493, 1983.
23 S. Velu and C. S. Swamy, Res. Chem. Intermed., 26 (2000) 295.
24 J. Das and A. B. Halgeri, Appl. Catal. A., 194 (2000) 359.
25 P. B. Venuto, L. A. Hamilton, P. S. Candis and J. J. Wise, J. Catal., 5 (1966) 81.
26 S. Karuppannasamy, K. Narayanan and C. N. Pillai, J. Catal., 66 (1980) 281.
27 K. Li, I. Wang and K. Chang, Ind. Eng. Chem. Res., 32 (1993)1007.
28 F. M. Bautista, J. M. Campelo, A. Garcia, D. Luna, J. M. Marinas, A. Romero, J. A.
Navio and M. Macias, Appl. Catal., 99 (1993)161.
29 E. Santacesaria, M. Diserio, P. Ciambelli, D. Gelosa and S. Carra, Appl. Catal. 64 (1990)
101.
30 S. Velu and C. S. Swamy, Appl. Catal. A., 145 (1996) 225.
31 P. L. Yue and O. Olaofe, Chem. Eng. Res. Des., 62 (1984) 167.
32 F. M. Bautista, J. M. Campelo, A. Garcia, D. Luna and J. M. Marinas, J. Catal., 107
(1987) 181.
33 A. Corma, F. Llopis, J. B. Monton and S. Weller, J. Catal., 142 (1993) 97.
34 A. B. Hart and R. A. Ross, J. Catal., 2 (1963) 121 and 251.
35 S. V. Kannan and C. N. Pillai, Indian J. Chem., 8 (1970) 1144.
36 L. H. Klemm and D. R. Taylor, J. Org. Chem., 45 (1980) 4320, 4326.
37 B. Choudhri and M. M. Sharma, Ind. Eng. Chem. Res., 30 (1991) 227.
38 S. Velu and C. S. Swamy, Catal. Lett., 40 (1996) 265.
39 S. Sato, R. Takahashi, T. Sodesawa, K. Matsumoto and Y. Kamimura, J. Catal., 184
(1999) 180.
40 A. Sakthivel, N. Saritha and P. selvam, Catal. Lett., 72 (2001) 225.
41 K. G. Chandra and M. M. Sharma, Catal. Lett., 19 (1993) 309.
42 R. A. Rajadhyakasha and D. D. Chaudhari, Ind. Eng. Chem. Res., 26 (1987) 1276.
43 S. K. Badamali, A. Sakthivel and P. Selvam, Catal. Lett., 65 (2000) 153.
44 K. Zhang, H. Zhang, G. Xu, S. Xiang, D. Xu, S. Liu and H. Li, Appl. Catal. A., 207
(2001) 183.
45 S. K. Badamali, A. Sakthivel and P. Selvam, Catal. Today., 63 (2000) 291.
46 S. Subramanian, A. Mitra, C. V. V. Satyanarayana and D. K. Chakrabarty, Appl. Catal.
A., 159 (1997) 229.
47 K. Zhang, C. Huang, S. Xiang, S. Liu, D. Xu and H. Li, Appl. Catal. A., 166 (1998) 89.
48 G. Busca and V. Lorenzelli, J. Catal., 66 (1980) 155.
Chapter 3: Catalytic Activity Studies and Mechanism of Phenol Methylation
118
49 G. Busca, A. S. Elmi and P. Forzatti, J. Phys. Chem., 91 (1987) 5263.
50 K. Nakamoto, “Infrared Spectra of Inorganic and Coordination Compounds”, p. 199.
Wiley, New York, 1963.
51 G. Busca, P. F. Rossi, V. Lorenzelli, M. Benaissa, J. Travert and J. C. Lavalley, J. Phys.
Chem., 89 (1985) 5433.
52 G. Busca, P. Forzatti, J. C. Lavalley and E. Tronconi, In “Catalysis by Acids and Bases”,
B. Imelik etal., Eds.; Elsevier: Amsterdam, p.14 (1985).
53 N. Takezawa, J. Chem. Soc. Chem. Commun., 1451 (1971).
54 Y. Noto, K. Fukuda, T. Onishi and K. Tamaru, Trans. Faraday Soc., 63 (1967) 2300.
55 A. Ueno, T. Onishi and K. Tamaru, Trans. Faraday Soc., 66 (1970) 756.
56 G. Munuera, J. Catal., 18 (1970) 19.
57 E. W. Thornton and P. G. Harrison, J. Chem. Soc. Faraday Trans. I, 71 (1975) 2468.
58 M. A. Natal-Santiago and J. A. Dumesic, J. Catal., 175 (1998) 252.
59 L. J. Burcham and I. E. Wachs, Catal. Today, 49 (1999) 467.
60 L. J. Burcham, G. Deo, X. Gao and I. E. Wachs, Top. Catal., 11/12(1-4) (2000) 85.
61 A. A. Davydov, W. M. Shchekochikhin, P. M. Zajcev, Y. M. Shchekochikhin and P.
Keier, Kinet. Katal., 12 (1971) 694.
62 E. B. Wilson, Phys. Rev., 45 (1934) 706.
63 J. H. S. Green, J. Chem. Soc., 2236 (1961).
64 D. R. Taylor and K. H. Ludlum, J. Phys. Chem., 76 (1972) 2882.
65 M. I. Tejedor-Tejedor, E. C. Yost and M. A. Anderson, Langmuir, 6 (1990) 979.
66 L. Palmisano, M. Schiavello, A. Sclafani, G. Martra, E. Borello and S. Coluccia, Appl.
Catal B: Environmental, 3 (1994) 117.
67 R. O. Kagel and R. G. Greenler, J. Chem. Phys., 49 (1968) 1638.
68 T. Kotanigawa, Bull. Chem. Soc. Jpn., 47 (1974) 950.
69 C. Chauvin, J. Saussey, J. C. Lavalley, H. Idriss, J-P. Hindermann, A. Kiennemann, P.
Chaumette and P. Courty, J. Catal., 121 (1990) 56.
70 G. Karagounis and O. Peter, Z. Elektrochem., 61 (1957) 827.
71 G. Karagounis and O. Peter, Z. Elektrochem., 61 (1957) 1094.
Chapter 4: Characterization of Spent Catalysts and Co-Cu Synergism
119
SECTION I
4.1. INTRODUCTION
Properties of the fresh and spent catalysts are compared to understand the changes
that happened in bulk and on the surface due to the reaction. Various physicochemical
characterization techniques are used for this purpose with special emphasize on XRD,
Mössbauer, TPR and TPD, TG-DTA and XPS. Most of the characterization results clearly
demonstrate that the changes that occurred to the catalysts surfaces are similar and
irrespective of any alkylation. Due to this methylation spent catalysts are given in detail.
For higher alkylation catalysts, important and new results are highlighted. Irrespective of
the alkylating agent, composition x = 0.50 shows maximum activity in terms of phenol
conversion and corresponding ortho alkyl selectivity. Hence the analysis of the spent
catalyst after various phenol alkylations with x = 0.50 composition is given a special
consideration.
4.2. METHYLATION OF PHENOL
Specifically, the spent (methylation) catalysts were obtained after 10 h of reaction
at optimized conditions for 2,6-xylenol formation (methanol to phenol ratio of 5, reaction
temperature 3500C). In correlation with the catalytic performance, (shown in vapour-phase
methylation – chapter 3), attention is focussed to electronic and structural changes, in
particular the following four aspects: (i) any changes in the oxidation state of metal ions
and the surface atomic ratio of metal ions remain the same during reaction (ii) any phase
separation Cu2O + Fe3O4 that might occur in the mixed Cu-Co ferrites, (iii) there is any
variation in the Fe3+ to Fe2+/3+ ratio and redistribution between (A) and [B] sites, and (iv)
formation of carbonaceous deposits.
4.2.1. Bulk characterization (XRD and Surface area)
Diffractograms of the fresh and the spent catalysts are shown in Figure 4.1. The
spent catalysts are crystalline and all the peaks are indexed. It can be seen that at x = 0.0 few
lines are observed in contrast to the same fresh catalyst and ‘d’ values are the same in both
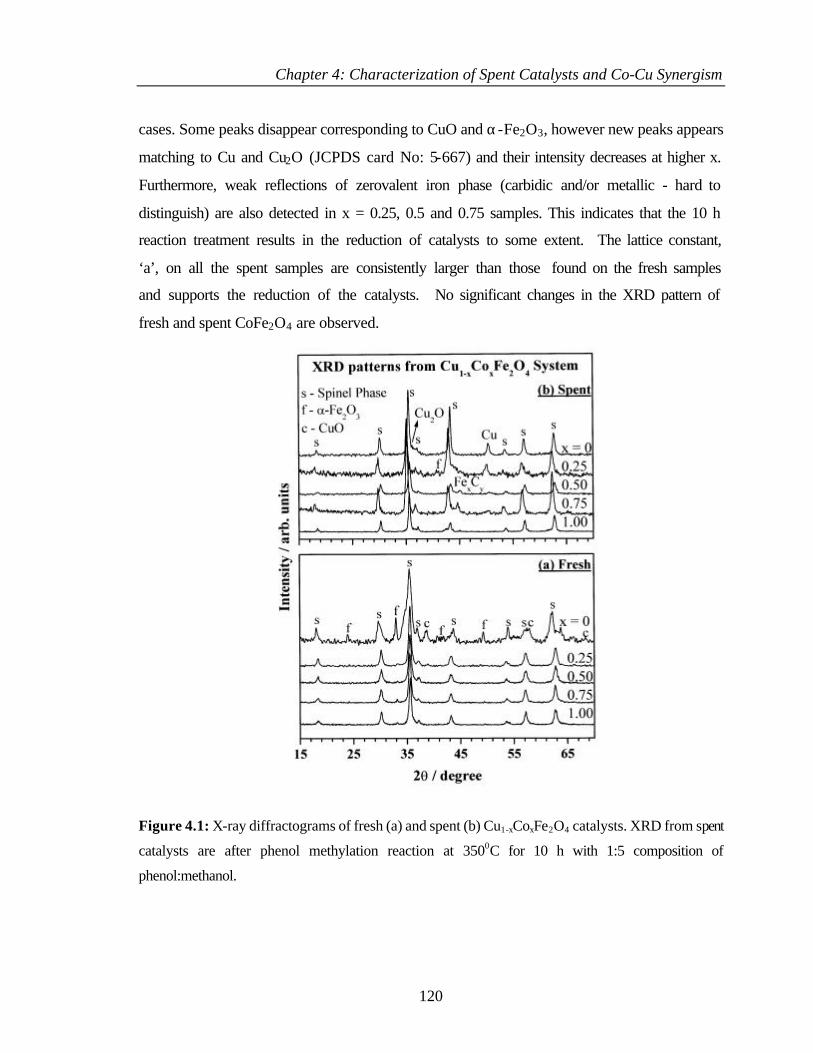
Chapter 4: Characterization of Spent Catalysts and Co-Cu Synergism
120
cases. Some peaks disappear corresponding to CuO and α-Fe2O3, however new peaks appears
matching to Cu and Cu2O (JCPDS card No: 5-667) and their intensity decreases at higher x.
Furthermore, weak reflections of zerovalent iron phase (carbidic and/or metallic - hard to
distinguish) are also detected in x = 0.25, 0.5 and 0.75 samples. This indicates that the 10 h
reaction treatment results in the reduction of catalysts to some extent. The lattice constant,
‘a’, on all the spent samples are consistently larger than those found on the fresh samples
and supports the reduction of the catalysts. No significant changes in the XRD pattern of
fresh and spent CoFe2O4 are observed.
Figure 4.1: X-ray diffractograms of fresh (a) and spent (b) Cu1-xCoxFe2O4 catalysts. XRD from spent
catalysts are after phenol methylation reaction at 3500C for 10 h with 1:5 composition of
phenol:methanol.
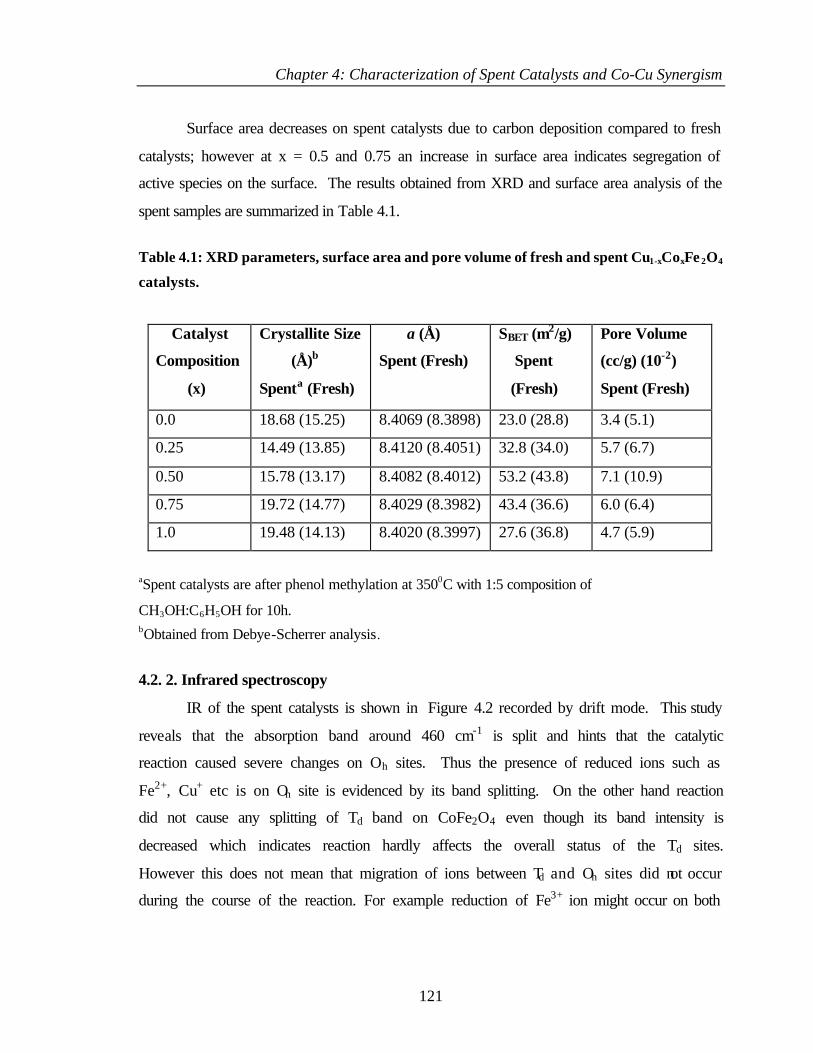
Chapter 4: Characterization of Spent Catalysts and Co-Cu Synergism
121
Surface area decreases on spent catalysts due to carbon deposition compared to fresh
catalysts; however at x = 0.5 and 0.75 an increase in surface area indicates segregation of
active species on the surface. The results obtained from XRD and surface area analysis of the
spent samples are summarized in Table 4.1.
Table 4.1: XRD parameters, surface area and pore volume of fresh and spent Cu1-xCoxFe 2O4
catalysts.
Catalyst
Composition
(x)
Crystallite Size
(Å)b
Spenta (Fresh)
a (Å)
Spent (Fresh)
SBET (m2/g)
Spent
(Fresh)
Pore Volume
(cc/g) (10-2)
Spent (Fresh)
0.0 18.68 (15.25) 8.4069 (8.3898) 23.0 (28.8) 3.4 (5.1)
0.25 14.49 (13.85) 8.4120 (8.4051) 32.8 (34.0) 5.7 (6.7)
0.50 15.78 (13.17) 8.4082 (8.4012) 53.2 (43.8) 7.1 (10.9)
0.75 19.72 (14.77) 8.4029 (8.3982) 43.4 (36.6) 6.0 (6.4)
1.0 19.48 (14.13) 8.4020 (8.3997) 27.6 (36.8) 4.7 (5.9)
aSpent catalysts are after phenol methylation at 3500C with 1:5 composition of
CH3OH:C6H5OH for 10h. bObtained from Debye-Scherrer analysis.
4.2. 2. Infrared spectroscopy
IR of the spent catalysts is shown in Figure 4.2 recorded by drift mode. This study
reveals that the absorption band around 460 cm-1 is split and hints that the catalytic
reaction caused severe changes on Oh sites. Thus the presence of reduced ions such as
Fe2+, Cu+ etc is on Oh site is evidenced by its band splitting. On the other hand reaction
did not cause any splitting of Td band on CoFe2O4 even though its band intensity is
decreased which indicates reaction hardly affects the overall status of the Td sites.
However this does not mean that migration of ions between Td and Oh sites did not occur
during the course of the reaction. For example reduction of Fe3+ ion might occur on both
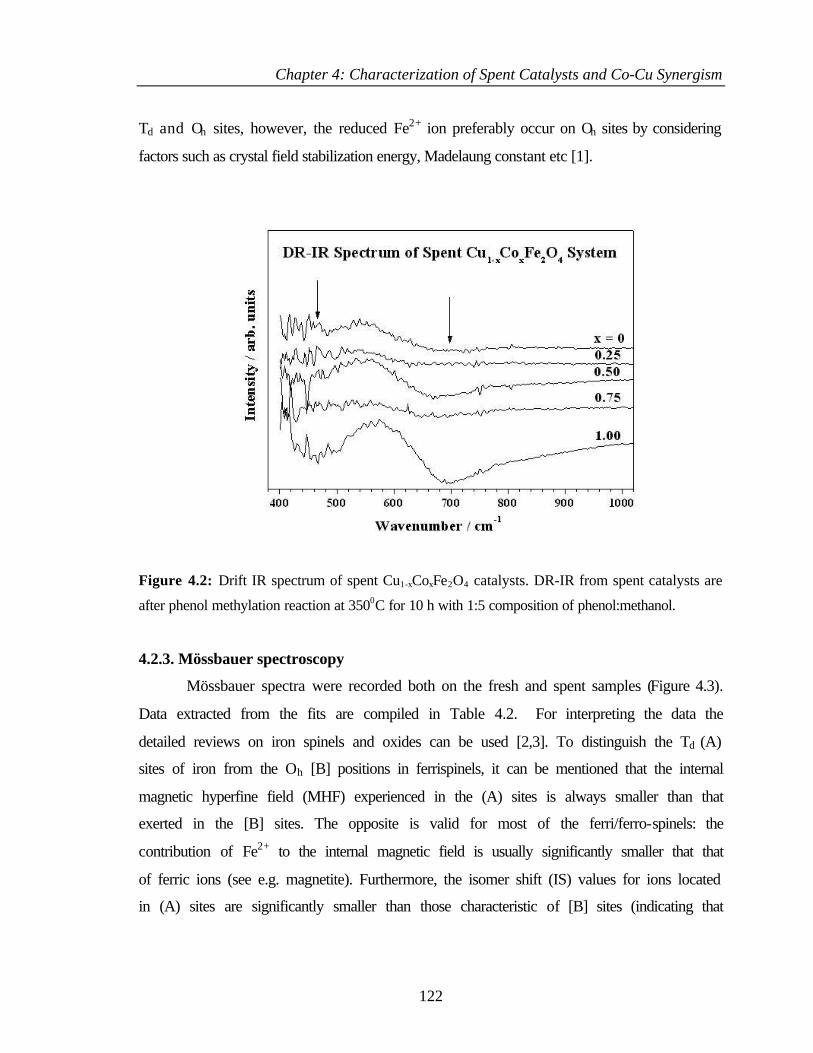
Chapter 4: Characterization of Spent Catalysts and Co-Cu Synergism
122
Td and Oh sites, however, the reduced Fe2+ ion preferably occur on Oh sites by considering
factors such as crystal field stabilization energy, Madelaung constant etc [1].
Figure 4.2: Drift IR spectrum of spent Cu1-xCoxFe2O4 catalysts. DR-IR from spent catalysts are
after phenol methylation reaction at 3500C for 10 h with 1:5 composition of phenol:methanol.
4.2.3. Mössbauer spectroscopy
Mössbauer spectra were recorded both on the fresh and spent samples (Figure 4.3).
Data extracted from the fits are compiled in Table 4.2. For interpreting the data the
detailed reviews on iron spinels and oxides can be used [2,3]. To distinguish the Td (A)
sites of iron from the Oh [B] positions in ferrispinels, it can be mentioned that the internal
magnetic hyperfine field (MHF) experienced in the (A) sites is always smaller than that
exerted in the [B] sites. The opposite is valid for most of the ferri/ferro-spinels: the
contribution of Fe2+ to the internal magnetic field is usually significantly smaller that that
of ferric ions (see e.g. magnetite). Furthermore, the isomer shift (IS) values for ions located
in (A) sites are significantly smaller than those characteristic of [B] sites (indicating that
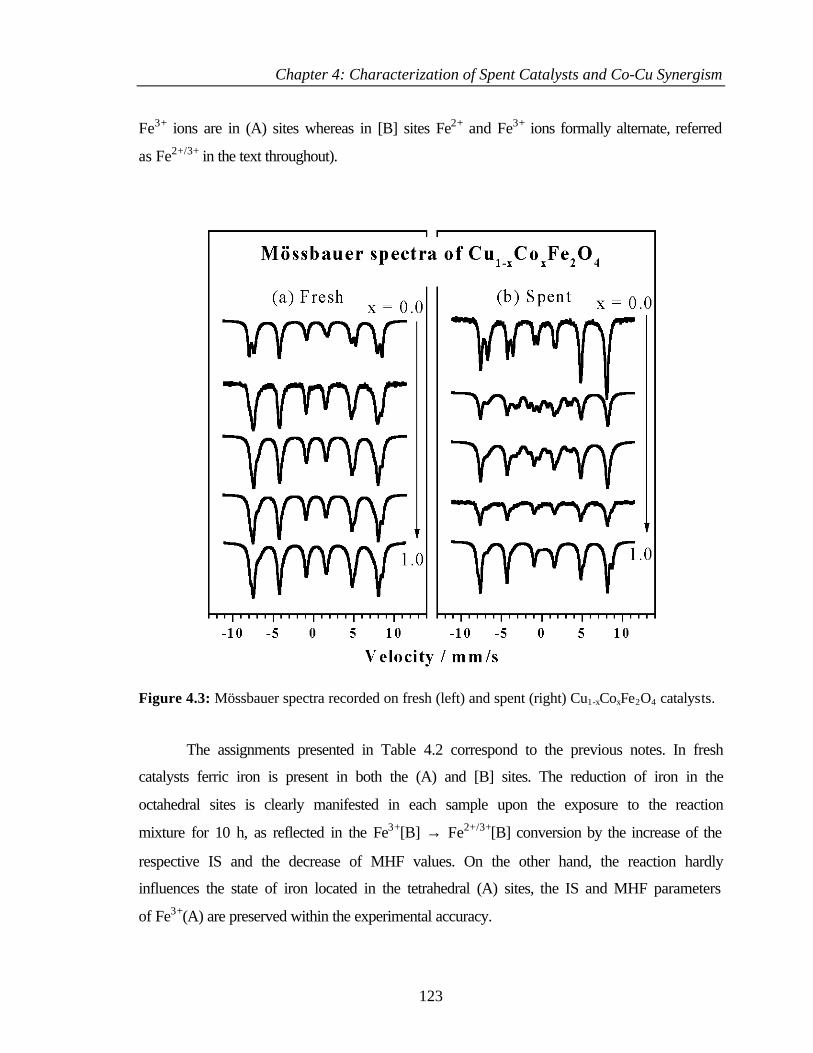
Chapter 4: Characterization of Spent Catalysts and Co-Cu Synergism
123
Fe3+ ions are in (A) sites whereas in [B] sites Fe2+ and Fe3+ ions formally alternate, referred
as Fe2+/3+ in the text throughout).
Figure 4.3: Mössbauer spectra recorded on fresh (left) and spent (right) Cu1-xCoxFe2O4 catalysts.
The assignments presented in Table 4.2 correspond to the previous notes. In fresh
catalysts ferric iron is present in both the (A) and [B] sites. The reduction of iron in the
octahedral sites is clearly manifested in each sample upon the exposure to the reaction
mixture for 10 h, as reflected in the Fe3+[B] → Fe2+/3+[B] conversion by the increase of the
respective IS and the decrease of MHF values. On the other hand, the reaction hardly
influences the state of iron located in the tetrahedral (A) sites, the IS and MHF parameters
of Fe3+(A) are preserved within the experimental accuracy.
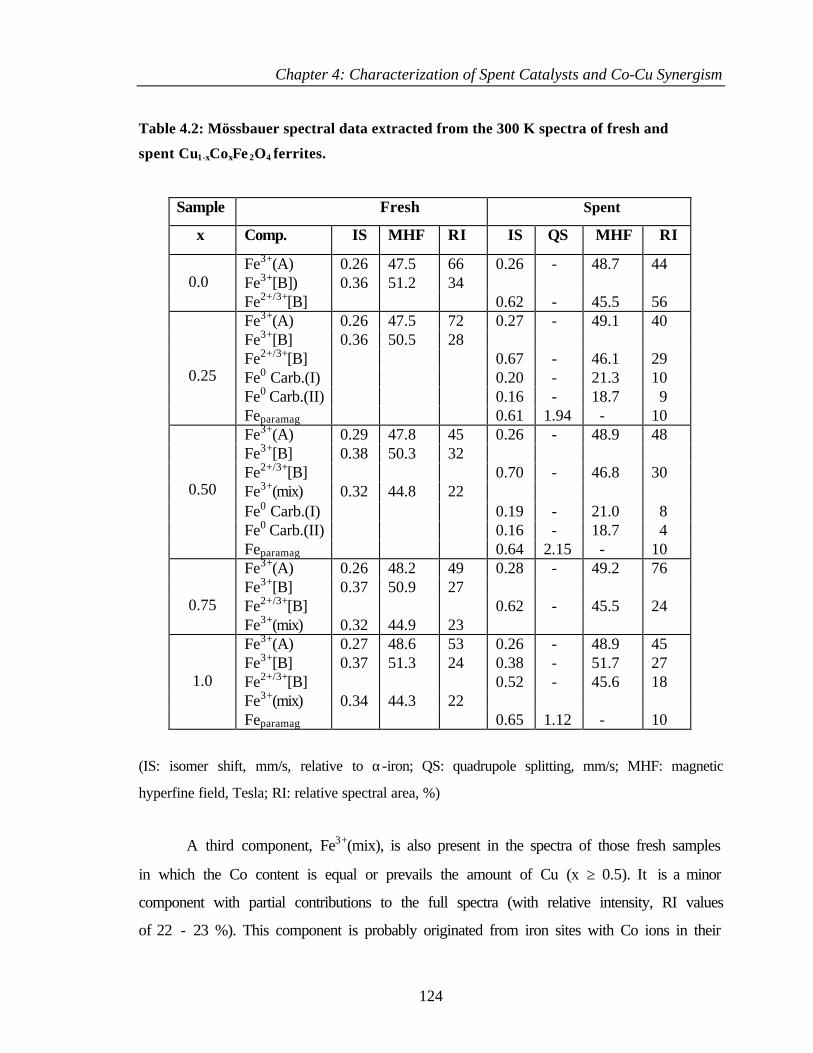
Chapter 4: Characterization of Spent Catalysts and Co-Cu Synergism
124
Table 4.2: Mössbauer spectral data extracted from the 300 K spectra of fresh and
spent Cu1-xCoxFe 2O4 ferrites.
Sample Fresh Spent
x Comp. IS MHF RI IS QS MHF RI
Fe3+(A) 0.26 47.5 66 0.26 - 48.7 44 Fe3+[B]) 0.36 51.2 34
0.0
Fe2+/3+[B] 0.62 - 45.5 56 Fe3+(A) 0.26 47.5 72 0.27 - 49.1 40 Fe3+[B] 0.36 50.5 28 Fe2+/3+[B] 0.67 - 46.1 29 Fe0 Carb.(I) 0.20 - 21.3 10 Fe0 Carb.(II) 0.16 - 18.7 9
0.25
Feparamag 0.61 1.94 - 10 Fe3+(A) 0.29 47.8 45 0.26 - 48.9 48 Fe3+[B] 0.38 50.3 32 Fe2+/3+[B] 0.70 - 46.8 30 Fe3+(mix) 0.32 44.8 22 Fe0 Carb.(I) 0.19 - 21.0 8 Fe0 Carb.(II) 0.16 - 18.7 4
0.50
Feparamag 0.64 2.15 - 10 Fe3+(A) 0.26 48.2 49 0.28 - 49.2 76 Fe3+[B] 0.37 50.9 27 Fe2+/3+[B] 0.62 - 45.5 24
0.75
Fe3+(mix) 0.32 44.9 23 Fe3+(A) 0.27 48.6 53 0.26 - 48.9 45 Fe3+[B] 0.37 51.3 24 0.38 - 51.7 27 Fe2+/3+[B] 0.52 - 45.6 18 Fe3+(mix) 0.34 44.3 22
1.0
Feparamag 0.65 1.12 - 10
(IS: isomer shift, mm/s, relative to α-iron; QS: quadrupole splitting, mm/s; MHF: magnetic
hyperfine field, Tesla; RI: relative spectral area, %)
A third component, Fe3+(mix), is also present in the spectra of those fresh samples
in which the Co content is equal or prevails the amount of Cu (x ≥ 0.5). It is a minor
component with partial contributions to the full spectra (with relative intensity, RI values
of 22 - 23 %). This component is probably originated from iron sites with Co ions in their
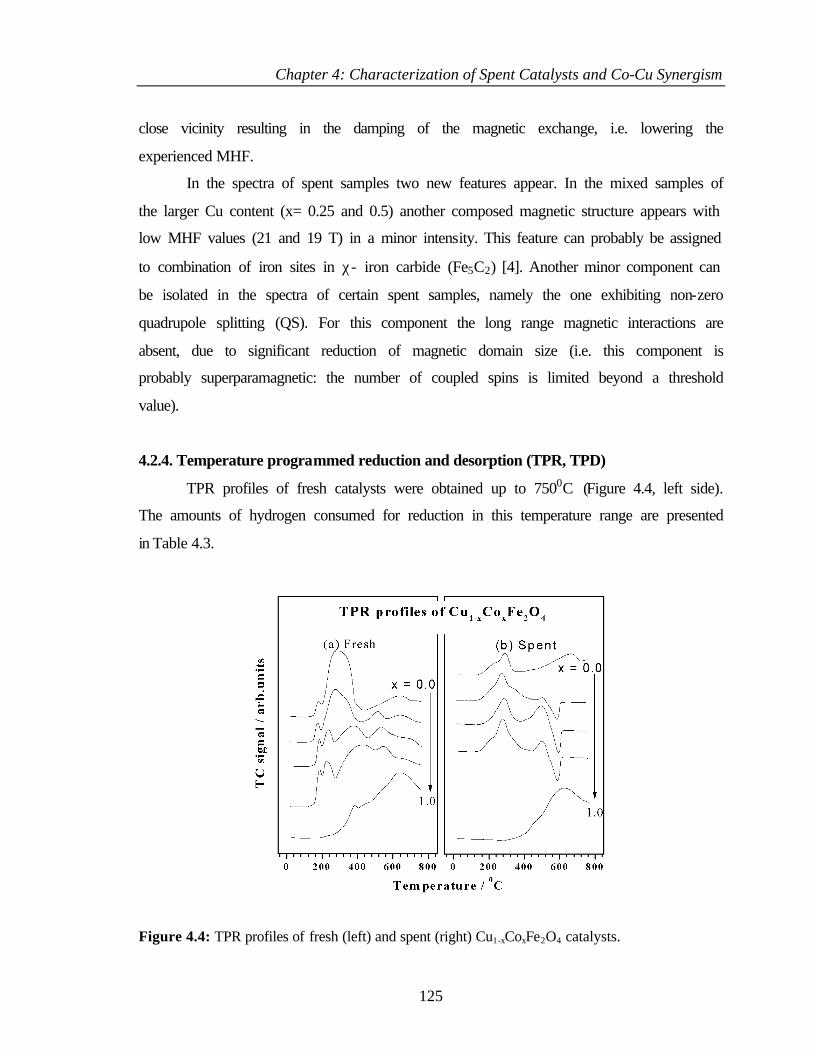
Chapter 4: Characterization of Spent Catalysts and Co-Cu Synergism
125
close vicinity resulting in the damping of the magnetic exchange, i.e. lowering the
experienced MHF.
In the spectra of spent samples two new features appear. In the mixed samples of
the larger Cu content (x= 0.25 and 0.5) another composed magnetic structure appears with
low MHF values (21 and 19 T) in a minor intensity. This feature can probably be assigned
to combination of iron sites in χ- iron carbide (Fe5C2) [4]. Another minor component can
be isolated in the spectra of certain spent samples, namely the one exhibiting non-zero
quadrupole splitting (QS). For this component the long range magnetic interactions are
absent, due to significant reduction of magnetic domain size (i.e. this component is
probably superparamagnetic: the number of coupled spins is limited beyond a threshold
value).
4.2.4. Temperature programmed reduction and desorption (TPR, TPD)
TPR profiles of fresh catalysts were obtained up to 7500C (Figure 4.4, left side).
The amounts of hydrogen consumed for reduction in this temperature range are presented
in Table 4.3.
Figure 4.4: TPR profiles of fresh (left) and spent (right) Cu1-xCoxFe2O4 catalysts.
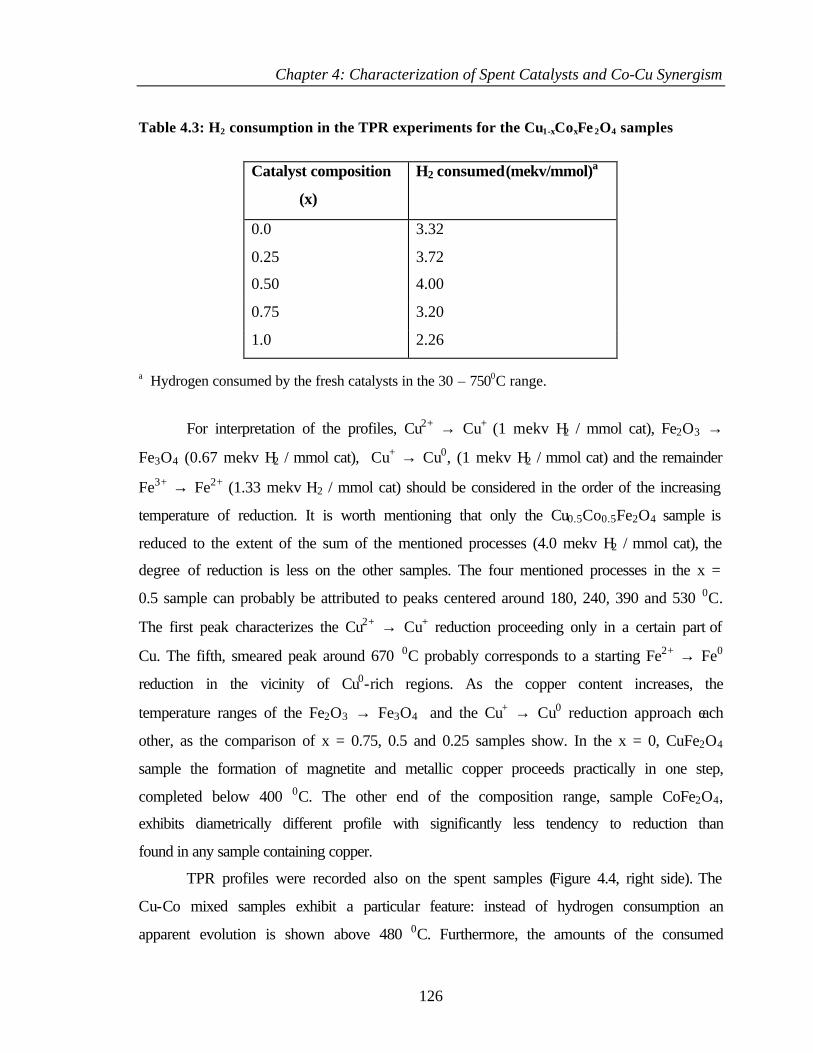
Chapter 4: Characterization of Spent Catalysts and Co-Cu Synergism
126
Table 4.3: H2 consumption in the TPR experiments for the Cu1-xCoxFe 2O4 samples
Catalyst composition
(x)
H2 consumed (mekv/mmol)a
0.0 3.32
0.25 3.72
0.50 4.00
0.75 3.20
1.0 2.26
a Hydrogen consumed by the fresh catalysts in the 30 – 7500C range.
For interpretation of the profiles, Cu2+ → Cu+ (1 mekv H2 / mmol cat), Fe2O3 →
Fe3O4 (0.67 mekv H2 / mmol cat), Cu+ → Cu0, (1 mekv H2 / mmol cat) and the remainder
Fe3+ → Fe2+ (1.33 mekv H2 / mmol cat) should be considered in the order of the increasing
temperature of reduction. It is worth mentioning that only the Cu0.5Co0.5Fe2O4 sample is
reduced to the extent of the sum of the mentioned processes (4.0 mekv H2 / mmol cat), the
degree of reduction is less on the other samples. The four mentioned processes in the x =
0.5 sample can probably be attributed to peaks centered around 180, 240, 390 and 530 0C.
The first peak characterizes the Cu2+ → Cu+ reduction proceeding only in a certain part of
Cu. The fifth, smeared peak around 670 0C probably corresponds to a starting Fe2+ → Fe0
reduction in the vicinity of Cu0-rich regions. As the copper content increases, the
temperature ranges of the Fe2O3 → Fe3O4 and the Cu+ → Cu0 reduction approach each
other, as the comparison of x = 0.75, 0.5 and 0.25 samples show. In the x = 0, CuFe2O4
sample the formation of magnetite and metallic copper proceeds practically in one step,
completed below 400 0C. The other end of the composition range, sample CoFe2O4,
exhibits diametrically different profile with significantly less tendency to reduction than
found in any sample containing copper.
TPR profiles were recorded also on the spent samples (Figure 4.4, right side). The
Cu-Co mixed samples exhibit a particular feature: instead of hydrogen consumption an
apparent evolution is shown above 480 0C. Furthermore, the amounts of the consumed
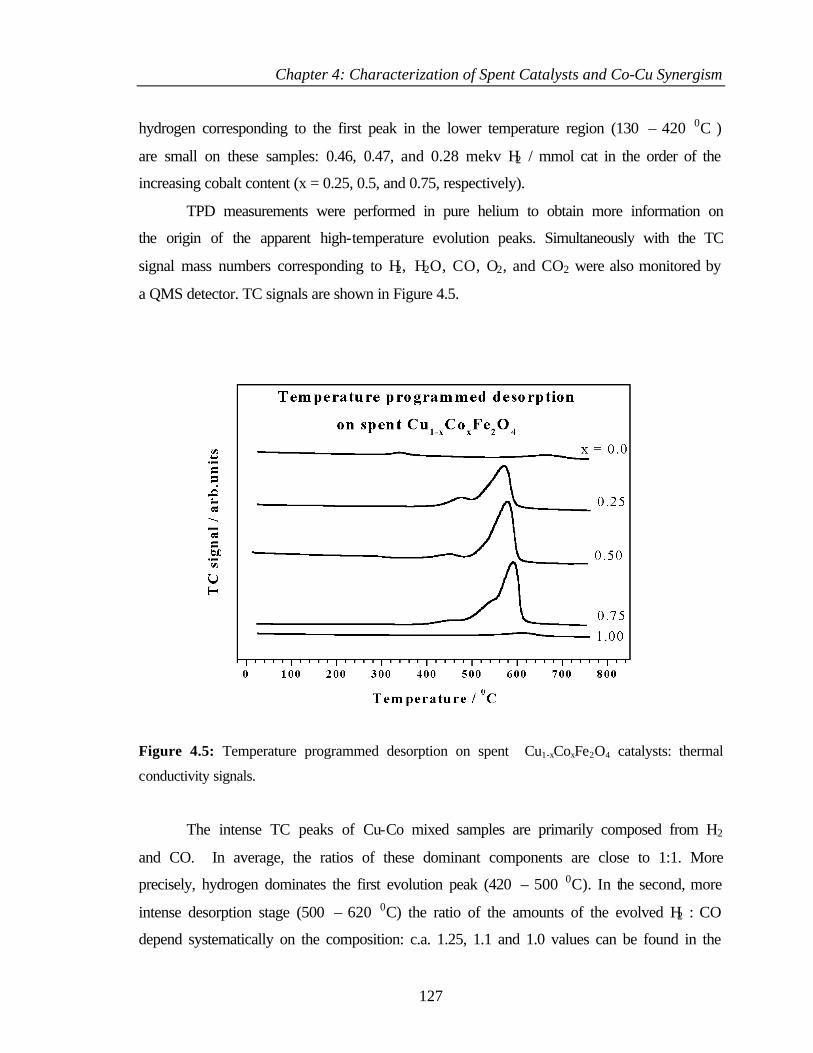
Chapter 4: Characterization of Spent Catalysts and Co-Cu Synergism
127
hydrogen corresponding to the first peak in the lower temperature region (130 – 420 0C )
are small on these samples: 0.46, 0.47, and 0.28 mekv H2 / mmol cat in the order of the
increasing cobalt content (x = 0.25, 0.5, and 0.75, respectively).
TPD measurements were performed in pure helium to obtain more information on
the origin of the apparent high-temperature evolution peaks. Simultaneously with the TC
signal mass numbers corresponding to H2, H2O, CO, O2, and CO2 were also monitored by
a QMS detector. TC signals are shown in Figure 4.5.
Figure 4.5: Temperature programmed desorption on spent Cu1-xCoxFe2O4 catalysts: thermal
conductivity signals.
The intense TC peaks of Cu-Co mixed samples are primarily composed from H2
and CO. In average, the ratios of these dominant components are close to 1:1. More
precisely, hydrogen dominates the first evolution peak (420 – 500 0C). In the second, more
intense desorption stage (500 – 620 0C) the ratio of the amounts of the evolved H2 : CO
depend systematically on the composition: c.a. 1.25, 1.1 and 1.0 values can be found in the
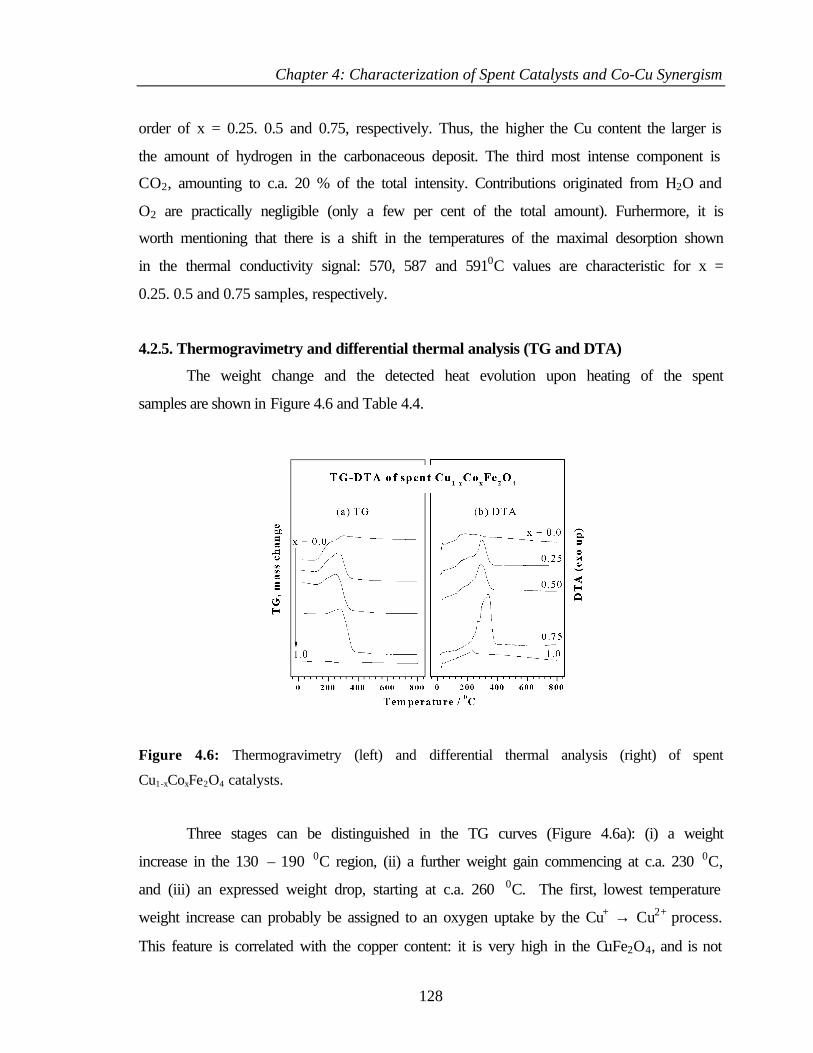
Chapter 4: Characterization of Spent Catalysts and Co-Cu Synergism
128
order of x = 0.25. 0.5 and 0.75, respectively. Thus, the higher the Cu content the larger is
the amount of hydrogen in the carbonaceous deposit. The third most intense component is
CO2, amounting to c.a. 20 % of the total intensity. Contributions originated from H2O and
O2 are practically negligible (only a few per cent of the total amount). Furhermore, it is
worth mentioning that there is a shift in the temperatures of the maximal desorption shown
in the thermal conductivity signal: 570, 587 and 5910C values are characteristic for x =
0.25. 0.5 and 0.75 samples, respectively.
4.2.5. Thermogravimetry and differential thermal analysis (TG and DTA)
The weight change and the detected heat evolution upon heating of the spent
samples are shown in Figure 4.6 and Table 4.4.
Figure 4.6: Thermogravimetry (left) and differential thermal analysis (right) of spent
Cu1-xCoxFe2O4 catalysts.
Three stages can be distinguished in the TG curves (Figure 4.6a): (i) a weight
increase in the 130 – 190 0C region, (ii) a further weight gain commencing at c.a. 230 0C,
and (iii) an expressed weight drop, starting at c.a. 260 0C. The first, lowest temperature
weight increase can probably be assigned to an oxygen uptake by the Cu+ → Cu2+ process.
This feature is correlated with the copper content: it is very high in the CuFe2O4, and is not
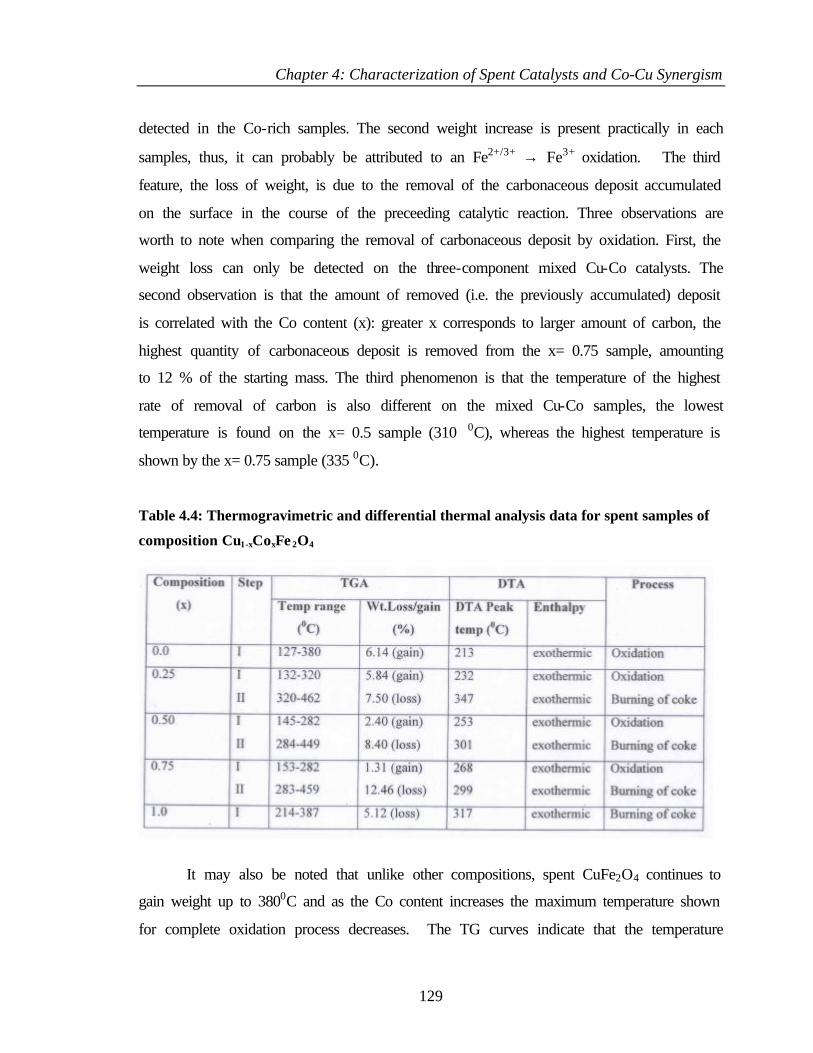
Chapter 4: Characterization of Spent Catalysts and Co-Cu Synergism
129
detected in the Co-rich samples. The second weight increase is present practically in each
samples, thus, it can probably be attributed to an Fe2+/3+ → Fe3+ oxidation. The third
feature, the loss of weight, is due to the removal of the carbonaceous deposit accumulated
on the surface in the course of the preceeding catalytic reaction. Three observations are
worth to note when comparing the removal of carbonaceous deposit by oxidation. First, the
weight loss can only be detected on the three-component mixed Cu-Co catalysts. The
second observation is that the amount of removed (i.e. the previously accumulated) deposit
is correlated with the Co content (x): greater x corresponds to larger amount of carbon, the
highest quantity of carbonaceous deposit is removed from the x= 0.75 sample, amounting
to 12 % of the starting mass. The third phenomenon is that the temperature of the highest
rate of removal of carbon is also different on the mixed Cu-Co samples, the lowest
temperature is found on the x= 0.5 sample (310 0C), whereas the highest temperature is
shown by the x= 0.75 sample (335 0C).
Table 4.4: Thermogravimetric and differential thermal analysis data for spent samples of
composition Cu1-xCoxFe 2O4
It may also be noted that unlike other compositions, spent CuFe2O4 continues to
gain weight up to 3800C and as the Co content increases the maximum temperature shown
for complete oxidation process decreases. The TG curves indicate that the temperature
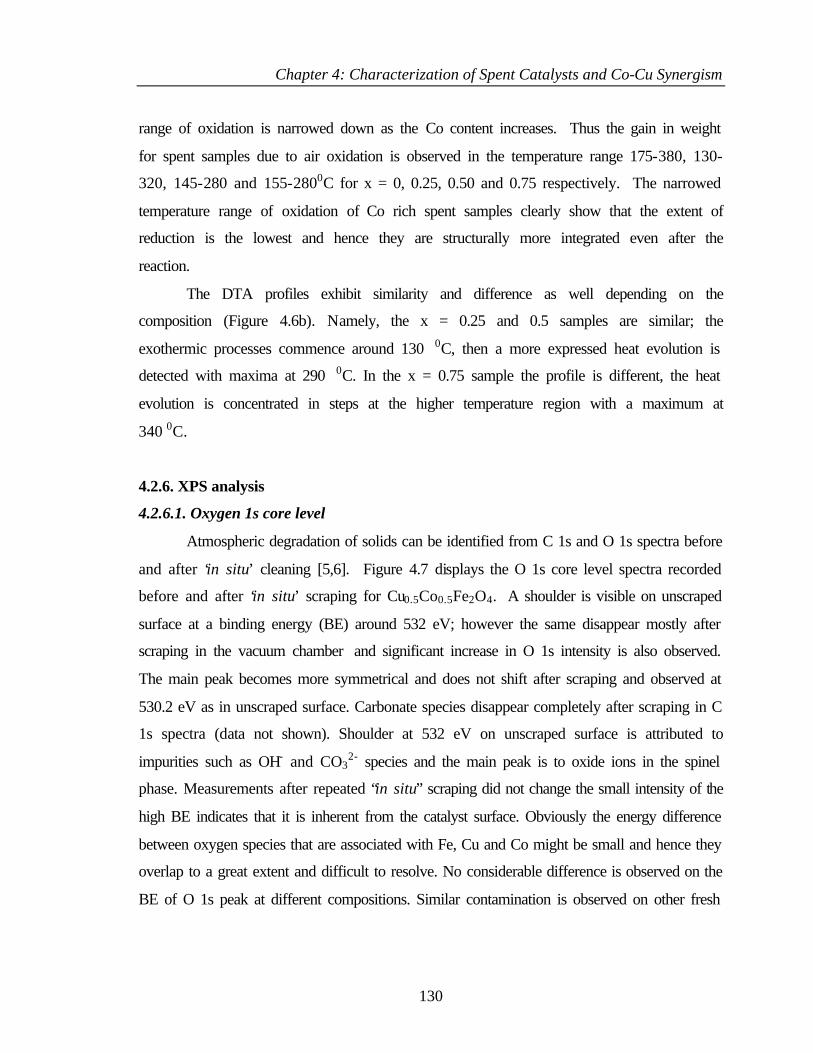
Chapter 4: Characterization of Spent Catalysts and Co-Cu Synergism
130
range of oxidation is narrowed down as the Co content increases. Thus the gain in weight
for spent samples due to air oxidation is observed in the temperature range 175-380, 130-
320, 145-280 and 155-2800C for x = 0, 0.25, 0.50 and 0.75 respectively. The narrowed
temperature range of oxidation of Co rich spent samples clearly show that the extent of
reduction is the lowest and hence they are structurally more integrated even after the
reaction.
The DTA profiles exhibit similarity and difference as well depending on the
composition (Figure 4.6b). Namely, the x = 0.25 and 0.5 samples are similar; the
exothermic processes commence around 130 0C, then a more expressed heat evolution is
detected with maxima at 290 0C. In the x = 0.75 sample the profile is different, the heat
evolution is concentrated in steps at the higher temperature region with a maximum at
340 0C.
4.2.6. XPS analysis
4.2.6.1. Oxygen 1s core level
Atmospheric degradation of solids can be identified from C 1s and O 1s spectra before
and after ‘in situ’ cleaning [5,6]. Figure 4.7 displays the O 1s core level spectra recorded
before and after ‘in situ’ scraping for Cu0.5Co0.5Fe2O4. A shoulder is visible on unscraped
surface at a binding energy (BE) around 532 eV; however the same disappear mostly after
scraping in the vacuum chamber and significant increase in O 1s intensity is also observed.
The main peak becomes more symmetrical and does not shift after scraping and observed at
530.2 eV as in unscraped surface. Carbonate species disappear completely after scraping in C
1s spectra (data not shown). Shoulder at 532 eV on unscraped surface is attributed to
impurities such as OH- and CO32- species and the main peak is to oxide ions in the spinel
phase. Measurements after repeated “in situ” scraping did not change the small intensity of the
high BE indicates that it is inherent from the catalyst surface. Obviously the energy difference
between oxygen species that are associated with Fe, Cu and Co might be small and hence they
overlap to a great extent and difficult to resolve. No considerable difference is observed on the
BE of O 1s peak at different compositions. Similar contamination is observed on other fresh
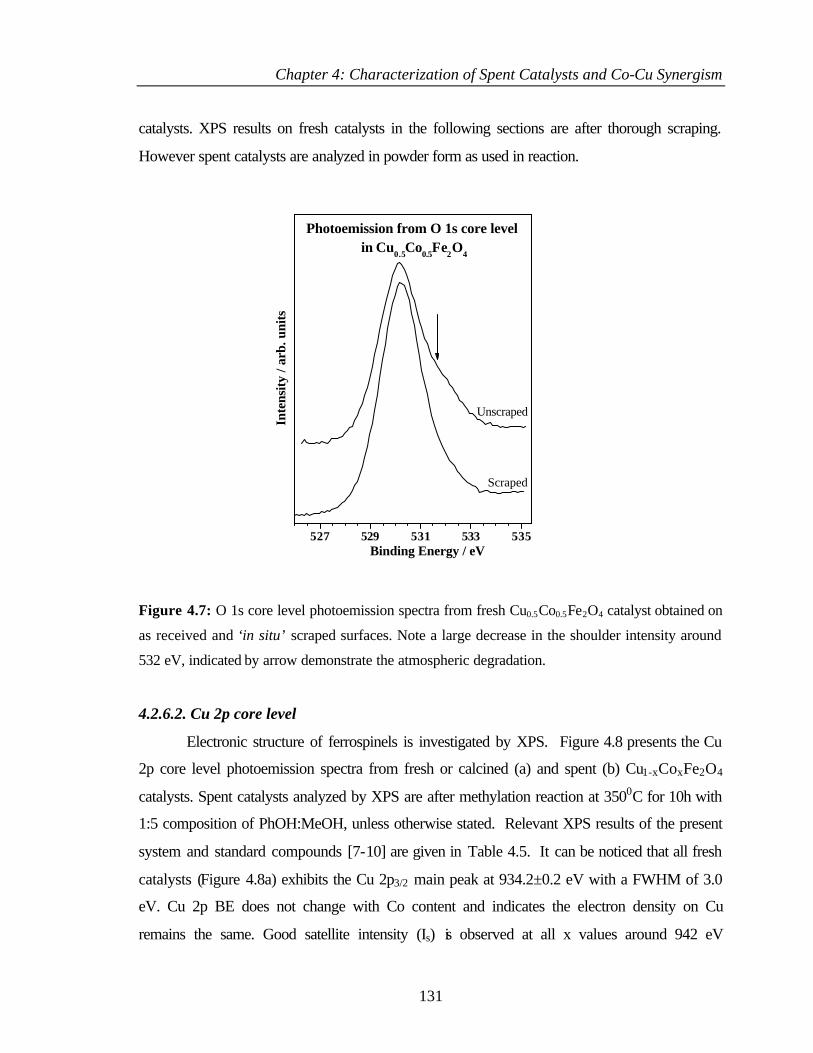
Chapter 4: Characterization of Spent Catalysts and Co-Cu Synergism
131
catalysts. XPS results on fresh catalysts in the following sections are after thorough scraping.
However spent catalysts are analyzed in powder form as used in reaction.
Figure 4.7: O 1s core level photoemission spectra from fresh Cu0.5Co0.5Fe2O4 catalyst obtained on
as received and ‘in situ’ scraped surfaces. Note a large decrease in the shoulder intensity around
532 eV, indicated by arrow demonstrate the atmospheric degradation.
4.2.6.2. Cu 2p core level
Electronic structure of ferrospinels is investigated by XPS. Figure 4.8 presents the Cu
2p core level photoemission spectra from fresh or calcined (a) and spent (b) Cu1-xCoxFe2O4
catalysts. Spent catalysts analyzed by XPS are after methylation reaction at 3500C for 10h with
1:5 composition of PhOH:MeOH, unless otherwise stated. Relevant XPS results of the present
system and standard compounds [7-10] are given in Table 4.5. It can be noticed that all fresh
catalysts (Figure 4.8a) exhibits the Cu 2p3/2 main peak at 934.2±0.2 eV with a FWHM of 3.0
eV. Cu 2p BE does not change with Co content and indicates the electron density on Cu
remains the same. Good satellite intensity (Is) is observed at all x values around 942 eV
527 529 531 533 535
Photoemission from O 1s core level in Cu0.5Co0.5Fe2O4
Unscraped
Inte
nsity
/ ar
b. u
nits
Binding Energy / eV
Scraped
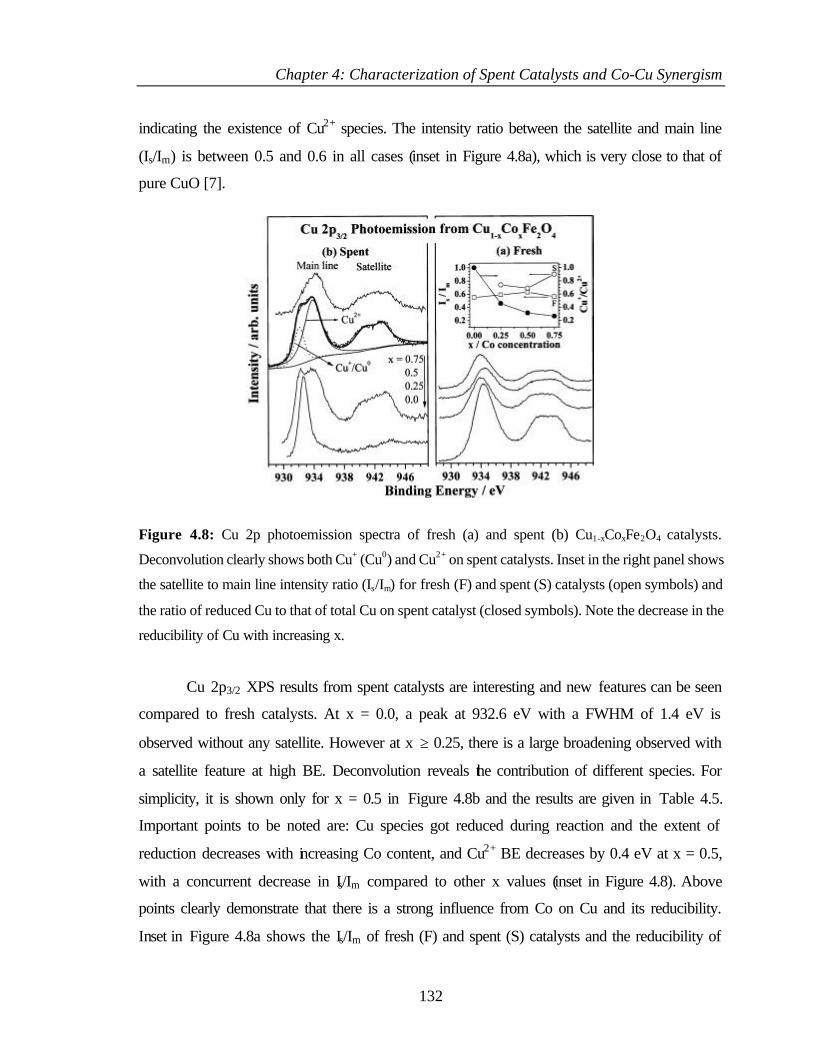
Chapter 4: Characterization of Spent Catalysts and Co-Cu Synergism
132
indicating the existence of Cu2+ species. The intensity ratio between the satellite and main line
(Is/Im) is between 0.5 and 0.6 in all cases (inset in Figure 4.8a), which is very close to that of
pure CuO [7].
Figure 4.8: Cu 2p photoemission spectra of fresh (a) and spent (b) Cu1-xCoxFe2O4 catalysts.
Deconvolution clearly shows both Cu+ (Cu0) and Cu2+ on spent catalysts. Inset in the right panel shows
the satellite to main line intensity ratio (Is/Im) for fresh (F) and spent (S) catalysts (open symbols) and
the ratio of reduced Cu to that of total Cu on spent catalyst (closed symbols). Note the decrease in the
reducibility of Cu with increasing x.
Cu 2p3/2 XPS results from spent catalysts are interesting and new features can be seen
compared to fresh catalysts. At x = 0.0, a peak at 932.6 eV with a FWHM of 1.4 eV is
observed without any satellite. However at x ≥ 0.25, there is a large broadening observed with
a satellite feature at high BE. Deconvolution reveals the contribution of different species. For
simplicity, it is shown only for x = 0.5 in Figure 4.8b and the results are given in Table 4.5.
Important points to be noted are: Cu species got reduced during reaction and the extent of
reduction decreases with increasing Co content, and Cu2+ BE decreases by 0.4 eV at x = 0.5,
with a concurrent decrease in Is/Im compared to other x values (inset in Figure 4.8). Above
points clearly demonstrate that there is a strong influence from Co on Cu and its reducibility.
Inset in Figure 4.8a shows the Is/Im of fresh (F) and spent (S) catalysts and the reducibility of
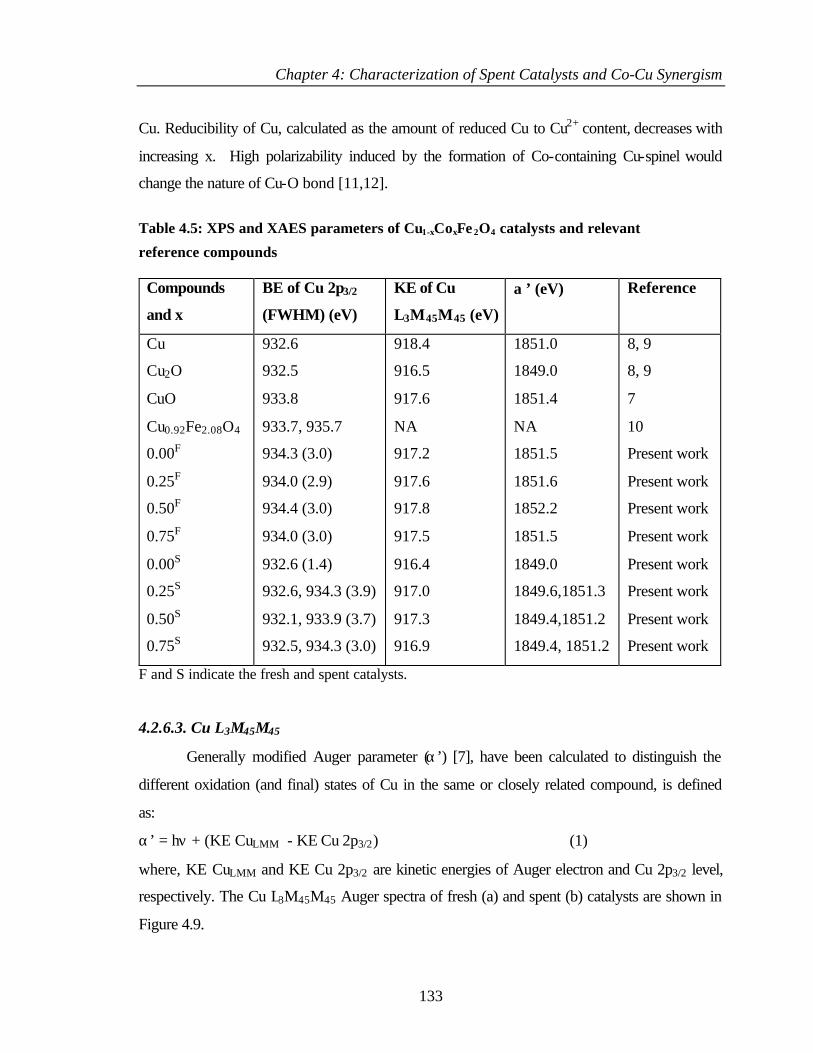
Chapter 4: Characterization of Spent Catalysts and Co-Cu Synergism
133
Cu. Reducibility of Cu, calculated as the amount of reduced Cu to Cu2+ content, decreases with
increasing x. High polarizability induced by the formation of Co-containing Cu-spinel would
change the nature of Cu-O bond [11,12].
Table 4.5: XPS and XAES parameters of Cu1-xCoxFe 2O4 catalysts and relevant
reference compounds
Compounds
and x
BE of Cu 2p3/2
(FWHM) (eV)
KE of Cu
L3M45M45 (eV)
α ’ (eV) Reference
Cu
Cu2O
CuO
Cu0.92Fe2.08O4
0.00F
0.25F
0.50F
0.75F
0.00S
0.25S
0.50S
0.75S
932.6
932.5
933.8
933.7, 935.7
934.3 (3.0)
934.0 (2.9)
934.4 (3.0)
934.0 (3.0)
932.6 (1.4)
932.6, 934.3 (3.9)
932.1, 933.9 (3.7)
932.5, 934.3 (3.0)
918.4
916.5
917.6
NA
917.2
917.6
917.8
917.5
916.4
917.0
917.3
916.9
1851.0
1849.0
1851.4
NA
1851.5
1851.6
1852.2
1851.5
1849.0
1849.6,1851.3
1849.4,1851.2
1849.4, 1851.2
8, 9
8, 9
7
10
Present work
Present work
Present work
Present work
Present work
Present work
Present work
Present work
F and S indicate the fresh and spent catalysts.
4.2.6.3. Cu L3M45M45
Generally modified Auger parameter (α’) [7], have been calculated to distinguish the
different oxidation (and final) states of Cu in the same or closely related compound, is defined
as:
α’ = hν + (KE CuLMM - KE Cu 2p3/2) (1)
where, KE CuLMM and KE Cu 2p3/2 are kinetic energies of Auger electron and Cu 2p3/2 level,
respectively. The Cu L3M45M45 Auger spectra of fresh (a) and spent (b) catalysts are shown in
Figure 4.9.
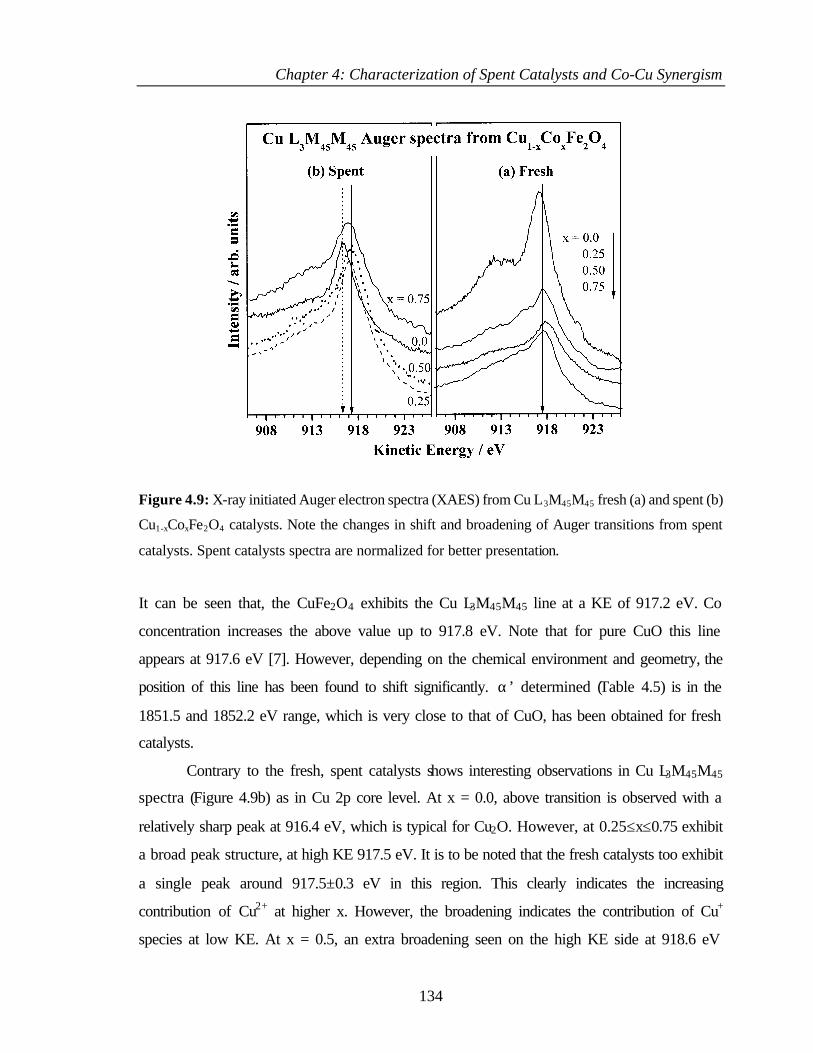
Chapter 4: Characterization of Spent Catalysts and Co-Cu Synergism
134
Figure 4.9: X-ray initiated Auger electron spectra (XAES) from Cu L3M45M45 fresh (a) and spent (b)
Cu1-xCoxFe2O4 catalysts. Note the changes in shift and broadening of Auger transitions from spent
catalysts. Spent catalysts spectra are normalized for better presentation.
It can be seen that, the CuFe2O4 exhibits the Cu L3M45M45 line at a KE of 917.2 eV. Co
concentration increases the above value up to 917.8 eV. Note that for pure CuO this line
appears at 917.6 eV [7]. However, depending on the chemical environment and geometry, the
position of this line has been found to shift significantly. α’ determined (Table 4.5) is in the
1851.5 and 1852.2 eV range, which is very close to that of CuO, has been obtained for fresh
catalysts.
Contrary to the fresh, spent catalysts shows interesting observations in Cu L3M45M45
spectra (Figure 4.9b) as in Cu 2p core level. At x = 0.0, above transition is observed with a
relatively sharp peak at 916.4 eV, which is typical for Cu2O. However, at 0.25≤x≤0.75 exhibit
a broad peak structure, at high KE 917.5 eV. It is to be noted that the fresh catalysts too exhibit
a single peak around 917.5±0.3 eV in this region. This clearly indicates the increasing
contribution of Cu2+ at higher x. However, the broadening indicates the contribution of Cu+
species at low KE. At x = 0.5, an extra broadening seen on the high KE side at 918.6 eV
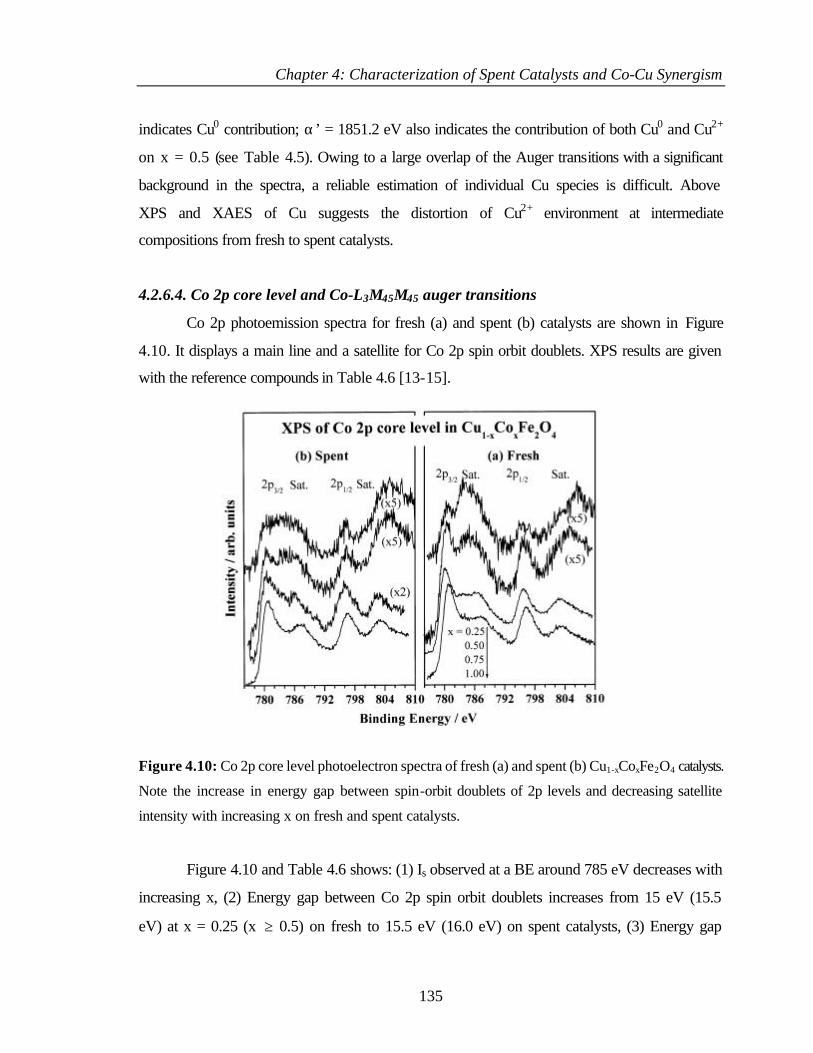
Chapter 4: Characterization of Spent Catalysts and Co-Cu Synergism
135
indicates Cu0 contribution; α’ = 1851.2 eV also indicates the contribution of both Cu0 and Cu2+
on x = 0.5 (see Table 4.5). Owing to a large overlap of the Auger transitions with a significant
background in the spectra, a reliable estimation of individual Cu species is difficult. Above
XPS and XAES of Cu suggests the distortion of Cu2+ environment at intermediate
compositions from fresh to spent catalysts.
4.2.6.4. Co 2p core level and Co-L3M45M45 auger transitions
Co 2p photoemission spectra for fresh (a) and spent (b) catalysts are shown in Figure
4.10. It displays a main line and a satellite for Co 2p spin orbit doublets. XPS results are given
with the reference compounds in Table 4.6 [13-15].
Figure 4.10: Co 2p core level photoelectron spectra of fresh (a) and spent (b) Cu1-xCoxFe2O4 catalysts.
Note the increase in energy gap between spin-orbit doublets of 2p levels and decreasing satellite
intensity with increasing x on fresh and spent catalysts.
Figure 4.10 and Table 4.6 shows: (1) Is observed at a BE around 785 eV decreases with
increasing x, (2) Energy gap between Co 2p spin orbit doublets increases from 15 eV (15.5
eV) at x = 0.25 (x ≥ 0.5) on fresh to 15.5 eV (16.0 eV) on spent catalysts, (3) Energy gap
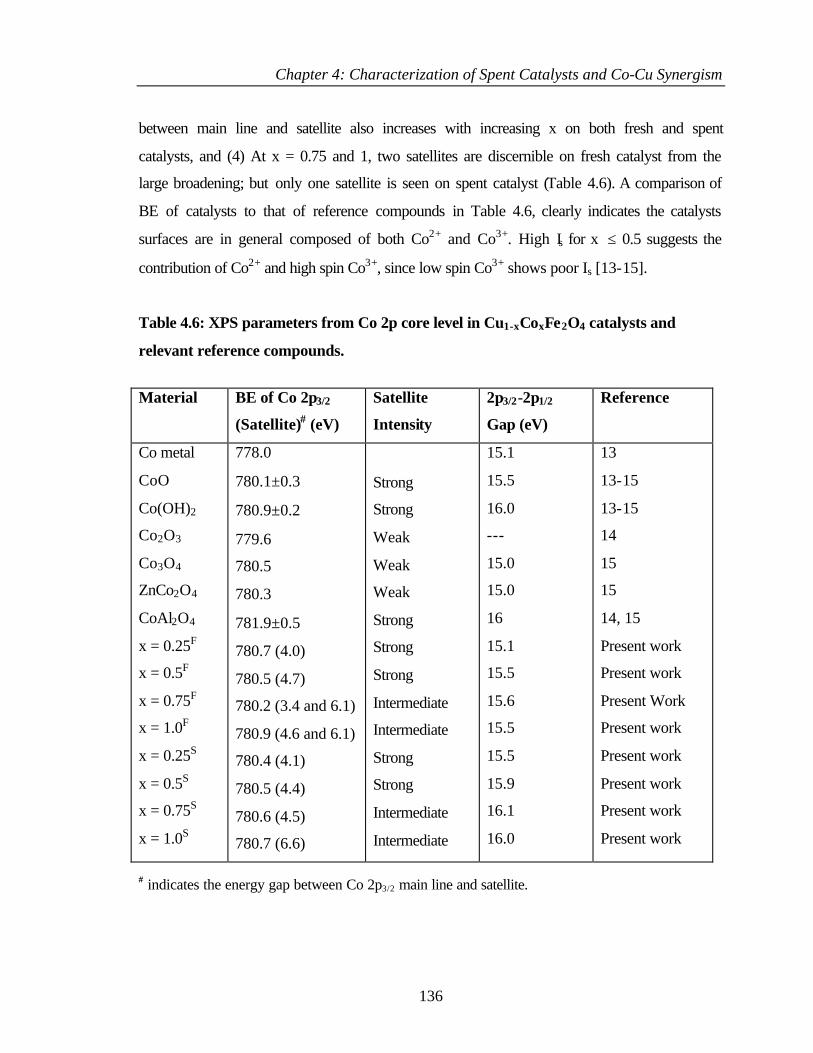
Chapter 4: Characterization of Spent Catalysts and Co-Cu Synergism
136
between main line and satellite also increases with increasing x on both fresh and spent
catalysts, and (4) At x = 0.75 and 1, two satellites are discernible on fresh catalyst from the
large broadening; but only one satellite is seen on spent catalyst (Table 4.6). A comparison of
BE of catalysts to that of reference compounds in Table 4.6, clearly indicates the catalysts
surfaces are in general composed of both Co2+ and Co3+. High Is for x ≤ 0.5 suggests the
contribution of Co2+ and high spin Co3+, since low spin Co3+ shows poor Is [13-15].
Table 4.6: XPS parameters from Co 2p core level in Cu1-xCoxFe2O4 catalysts and
relevant reference compounds.
Material BE of Co 2p3/2
(Satellite)# (eV)
Satellite
Intensity
2p3/2-2p1/2
Gap (eV)
Reference
Co metal
CoO
Co(OH)2
Co2O3
Co3O4
ZnCo2O4
CoAl2O4
x = 0.25F
x = 0.5F
x = 0.75F
x = 1.0F
x = 0.25S
x = 0.5S
x = 0.75S
x = 1.0S
778.0
780.1±0.3
780.9±0.2
779.6
780.5
780.3
781.9±0.5
780.7 (4.0)
780.5 (4.7)
780.2 (3.4 and 6.1)
780.9 (4.6 and 6.1)
780.4 (4.1)
780.5 (4.4)
780.6 (4.5)
780.7 (6.6)
Strong
Strong
Weak
Weak
Weak
Strong
Strong
Strong
Intermediate
Intermediate
Strong
Strong
Intermediate
Intermediate
15.1
15.5
16.0
---
15.0
15.0
16
15.1
15.5
15.6
15.5
15.5
15.9
16.1
16.0
13
13-15
13-15
14
15
15
14, 15
Present work
Present work
Present Work
Present work
Present work
Present work
Present work
Present work
# indicates the energy gap between Co 2p3/2 main line and satellite.
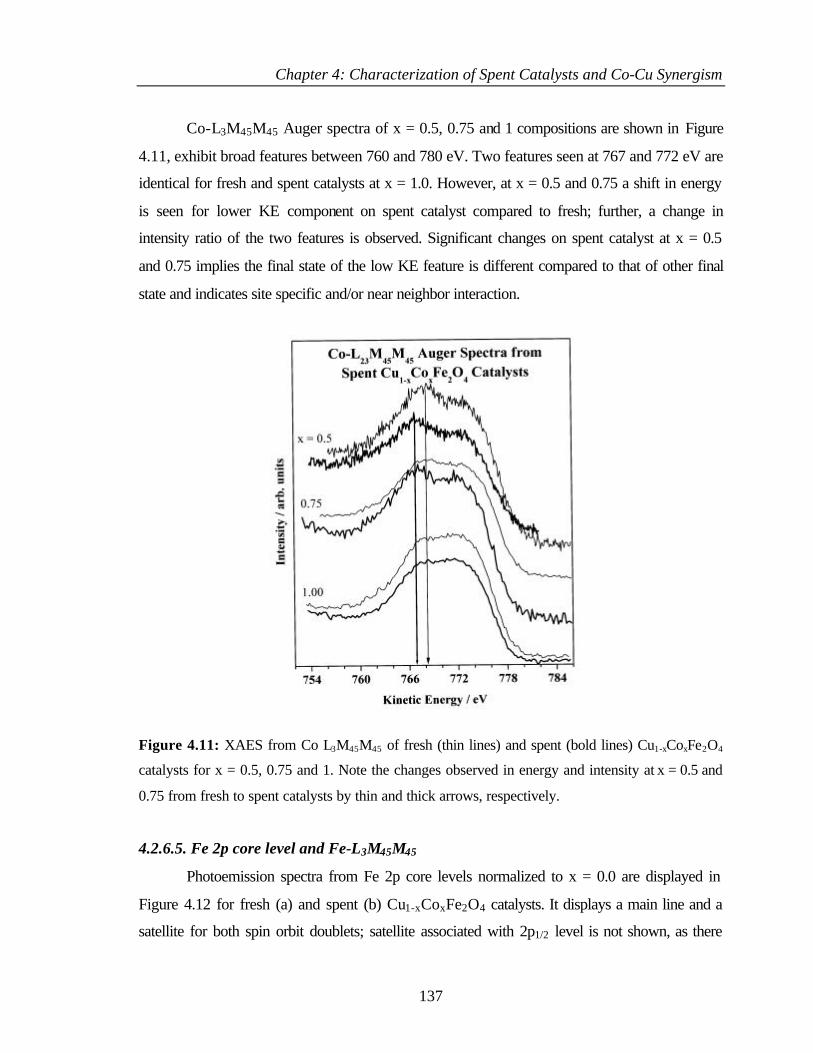
Chapter 4: Characterization of Spent Catalysts and Co-Cu Synergism
137
Co-L3M45M45 Auger spectra of x = 0.5, 0.75 and 1 compositions are shown in Figure
4.11, exhibit broad features between 760 and 780 eV. Two features seen at 767 and 772 eV are
identical for fresh and spent catalysts at x = 1.0. However, at x = 0.5 and 0.75 a shift in energy
is seen for lower KE component on spent catalyst compared to fresh; further, a change in
intensity ratio of the two features is observed. Significant changes on spent catalyst at x = 0.5
and 0.75 implies the final state of the low KE feature is different compared to that of other final
state and indicates site specific and/or near neighbor interaction.
Figure 4.11: XAES from Co L3M45M45 of fresh (thin lines) and spent (bold lines) Cu1-xCoxFe2O4
catalysts for x = 0.5, 0.75 and 1. Note the changes observed in energy and intensity at x = 0.5 and
0.75 from fresh to spent catalysts by thin and thick arrows, respectively.
4.2.6.5. Fe 2p core level and Fe-L3M45M45
Photoemission spectra from Fe 2p core levels normalized to x = 0.0 are displayed in
Figure 4.12 for fresh (a) and spent (b) Cu1-xCoxFe2O4 catalysts. It displays a main line and a
satellite for both spin orbit doublets; satellite associated with 2p1/2 level is not shown, as there
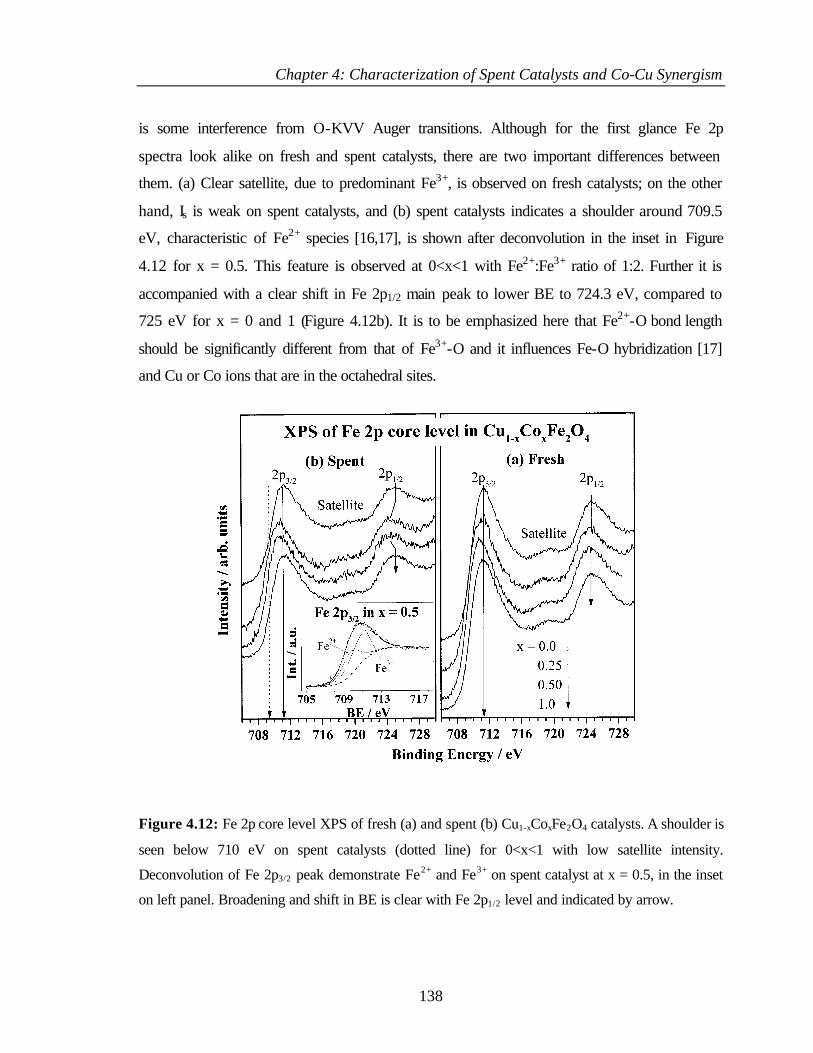
Chapter 4: Characterization of Spent Catalysts and Co-Cu Synergism
138
is some interference from O-KVV Auger transitions. Although for the first glance Fe 2p
spectra look alike on fresh and spent catalysts, there are two important differences between
them. (a) Clear satellite, due to predominant Fe3+, is observed on fresh catalysts; on the other
hand, Is is weak on spent catalysts, and (b) spent catalysts indicates a shoulder around 709.5
eV, characteristic of Fe2+ species [16,17], is shown after deconvolution in the inset in Figure
4.12 for x = 0.5. This feature is observed at 0<x<1 with Fe2+:Fe3+ ratio of 1:2. Further it is
accompanied with a clear shift in Fe 2p1/2 main peak to lower BE to 724.3 eV, compared to
725 eV for x = 0 and 1 (Figure 4.12b). It is to be emphasized here that Fe2+-O bond length
should be significantly different from that of Fe3+-O and it influences Fe-O hybridization [17]
and Cu or Co ions that are in the octahedral sites.
Figure 4.12: Fe 2p core level XPS of fresh (a) and spent (b) Cu1-xCoxFe2O4 catalysts. A shoulder is
seen below 710 eV on spent catalysts (dotted line) for 0<x<1 with low satellite intensity.
Deconvolution of Fe 2p3/2 peak demonstrate Fe2+ and Fe3+ on spent catalyst at x = 0.5, in the inset
on left panel. Broadening and shift in BE is clear with Fe 2p1/2 level and indicated by arrow.
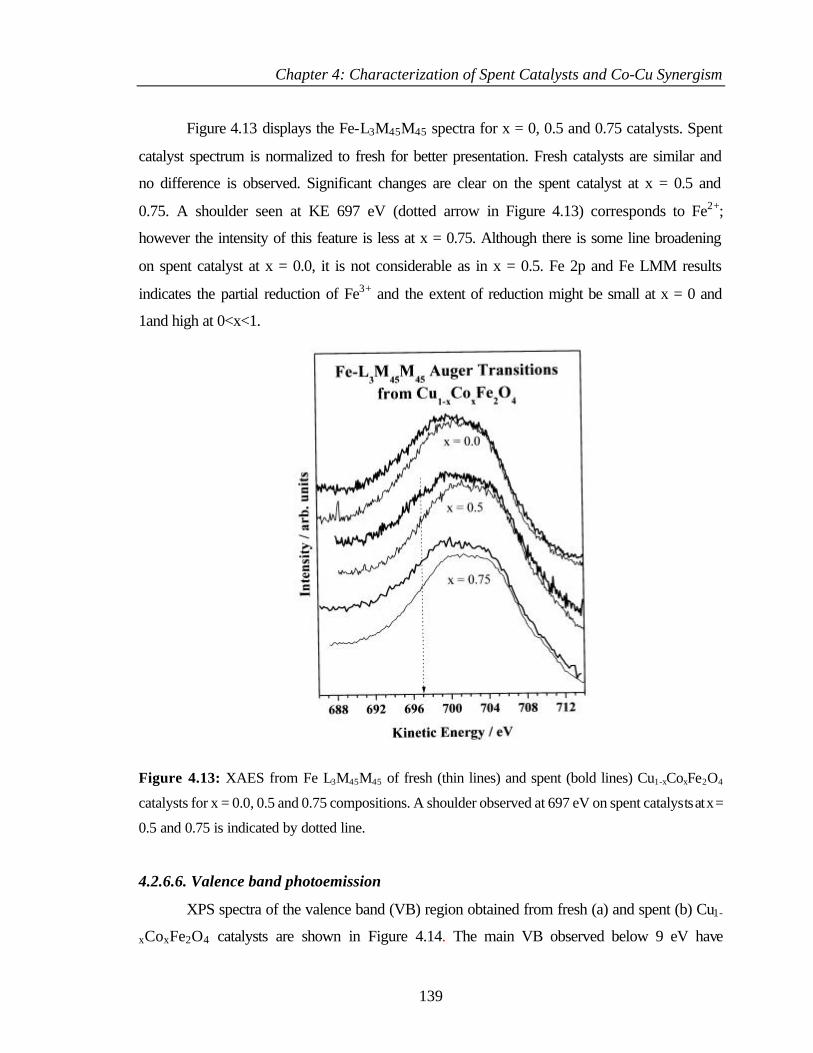
Chapter 4: Characterization of Spent Catalysts and Co-Cu Synergism
139
Figure 4.13 displays the Fe-L3M45M45 spectra for x = 0, 0.5 and 0.75 catalysts. Spent
catalyst spectrum is normalized to fresh for better presentation. Fresh catalysts are similar and
no difference is observed. Significant changes are clear on the spent catalyst at x = 0.5 and
0.75. A shoulder seen at KE 697 eV (dotted arrow in Figure 4.13) corresponds to Fe2+;
however the intensity of this feature is less at x = 0.75. Although there is some line broadening
on spent catalyst at x = 0.0, it is not considerable as in x = 0.5. Fe 2p and Fe LMM results
indicates the partial reduction of Fe3+ and the extent of reduction might be small at x = 0 and
1and high at 0<x<1.
Figure 4.13: XAES from Fe L3M45M45 of fresh (thin lines) and spent (bold lines) Cu1-xCoxFe2O4
catalysts for x = 0.0, 0.5 and 0.75 compositions. A shoulder observed at 697 eV on spent catalysts at x =
0.5 and 0.75 is indicated by dotted line.
4.2.6.6. Valence band photoemission
XPS spectra of the valence band (VB) region obtained from fresh (a) and spent (b) Cu1-
xCoxFe2O4 catalysts are shown in Figure 4.14. The main VB observed below 9 eV have
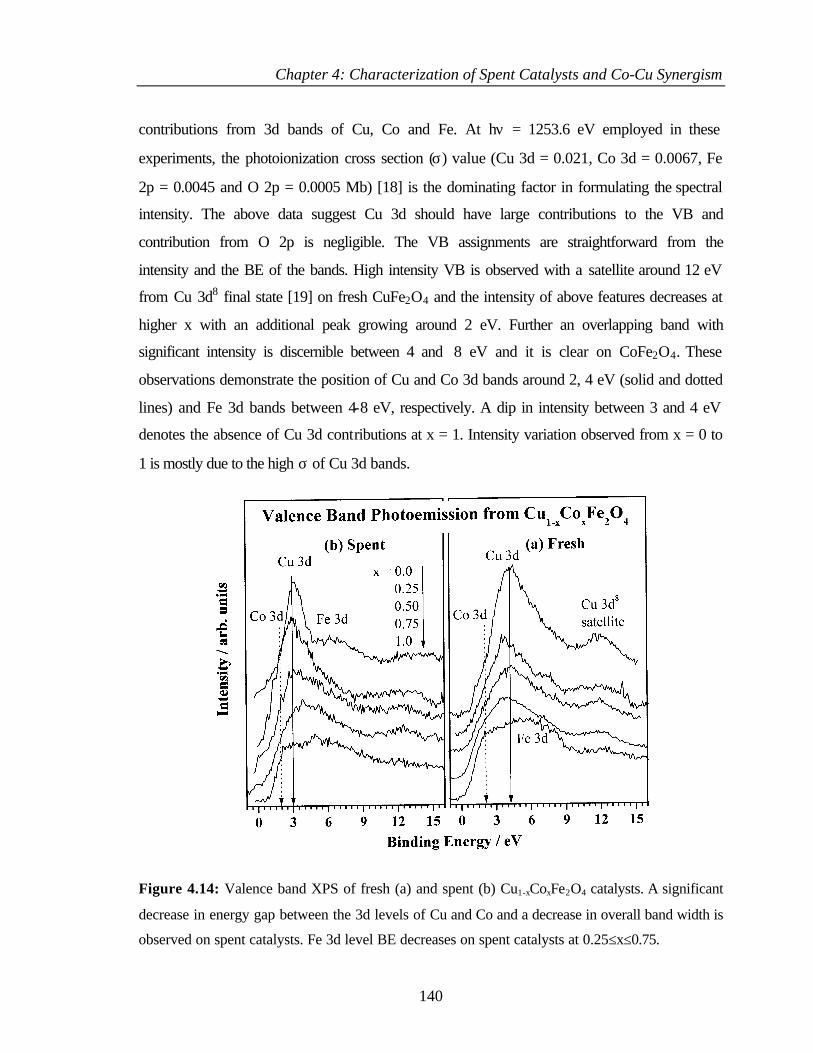
Chapter 4: Characterization of Spent Catalysts and Co-Cu Synergism
140
contributions from 3d bands of Cu, Co and Fe. At hν = 1253.6 eV employed in these
experiments, the photoionization cross section (σ) value (Cu 3d = 0.021, Co 3d = 0.0067, Fe
2p = 0.0045 and O 2p = 0.0005 Mb) [18] is the dominating factor in formulating the spectral
intensity. The above data suggest Cu 3d should have large contributions to the VB and
contribution from O 2p is negligible. The VB assignments are straightforward from the
intensity and the BE of the bands. High intensity VB is observed with a satellite around 12 eV
from Cu 3d8 final state [19] on fresh CuFe2O4 and the intensity of above features decreases at
higher x with an additional peak growing around 2 eV. Further an overlapping band with
significant intensity is discernible between 4 and 8 eV and it is clear on CoFe2O4. These
observations demonstrate the position of Cu and Co 3d bands around 2, 4 eV (solid and dotted
lines) and Fe 3d bands between 4-8 eV, respectively. A dip in intensity between 3 and 4 eV
denotes the absence of Cu 3d contributions at x = 1. Intensity variation observed from x = 0 to
1 is mostly due to the high σ of Cu 3d bands.
Figure 4.14: Valence band XPS of fresh (a) and spent (b) Cu1-xCoxFe2O4 catalysts. A significant
decrease in energy gap between the 3d levels of Cu and Co and a decrease in overall band width is
observed on spent catalysts. Fe 3d level BE decreases on spent catalysts at 0.25≤x≤0.75.
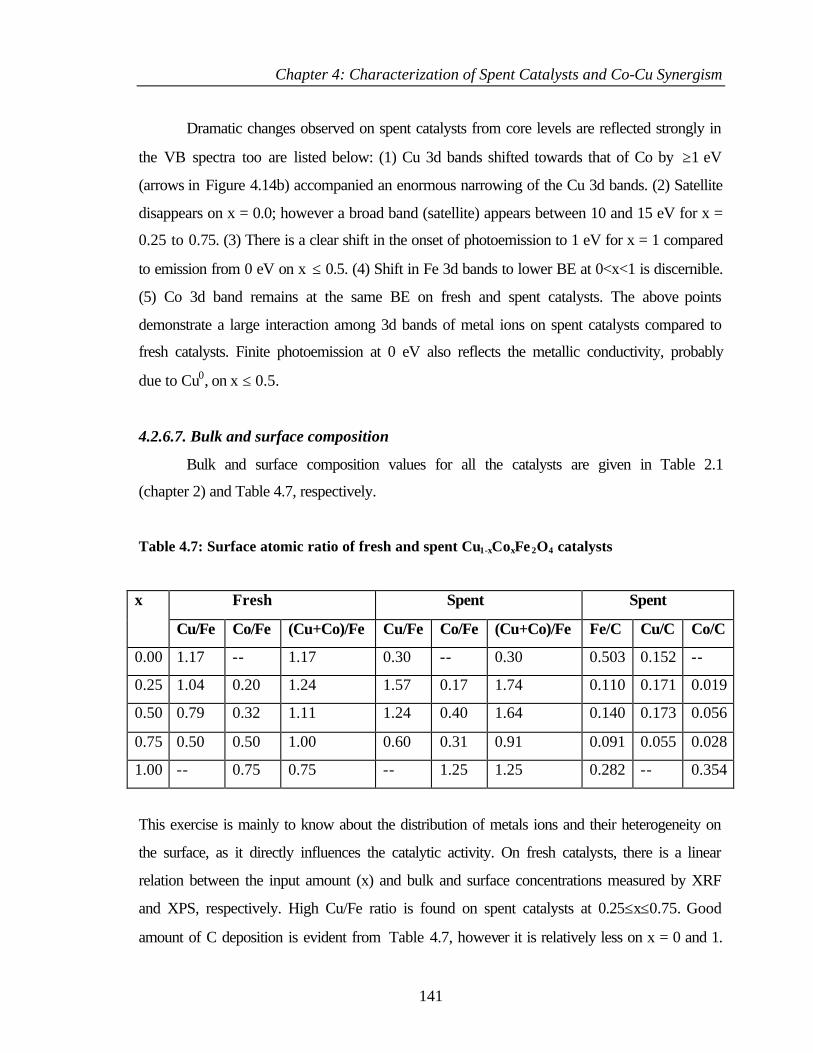
Chapter 4: Characterization of Spent Catalysts and Co-Cu Synergism
141
Dramatic changes observed on spent catalysts from core levels are reflected strongly in
the VB spectra too are listed below: (1) Cu 3d bands shifted towards that of Co by ≥1 eV
(arrows in Figure 4.14b) accompanied an enormous narrowing of the Cu 3d bands. (2) Satellite
disappears on x = 0.0; however a broad band (satellite) appears between 10 and 15 eV for x =
0.25 to 0.75. (3) There is a clear shift in the onset of photoemission to 1 eV for x = 1 compared
to emission from 0 eV on x ≤ 0.5. (4) Shift in Fe 3d bands to lower BE at 0<x<1 is discernible.
(5) Co 3d band remains at the same BE on fresh and spent catalysts. The above points
demonstrate a large interaction among 3d bands of metal ions on spent catalysts compared to
fresh catalysts. Finite photoemission at 0 eV also reflects the metallic conductivity, probably
due to Cu0, on x ≤ 0.5.
4.2.6.7. Bulk and surface composition
Bulk and surface composition values for all the catalysts are given in Table 2.1
(chapter 2) and Table 4.7, respectively.
Table 4.7: Surface atomic ratio of fresh and spent Cu1-xCoxFe 2O4 catalysts
Fresh Spent Spent x
Cu/Fe Co/Fe (Cu+Co)/Fe Cu/Fe Co/Fe (Cu+Co)/Fe Fe/C Cu/C Co/C
0.00 1.17 -- 1.17 0.30 -- 0.30 0.503 0.152 --
0.25 1.04 0.20 1.24 1.57 0.17 1.74 0.110 0.171 0.019
0.50 0.79 0.32 1.11 1.24 0.40 1.64 0.140 0.173 0.056
0.75 0.50 0.50 1.00 0.60 0.31 0.91 0.091 0.055 0.028
1.00 -- 0.75 0.75 -- 1.25 1.25 0.282 -- 0.354
This exercise is mainly to know about the distribution of metals ions and their heterogeneity on
the surface, as it directly influences the catalytic activity. On fresh catalysts, there is a linear
relation between the input amount (x) and bulk and surface concentrations measured by XRF
and XPS, respectively. High Cu/Fe ratio is found on spent catalysts at 0.25≤x≤0.75. Good
amount of C deposition is evident from Table 4.7, however it is relatively less on x = 0 and 1.
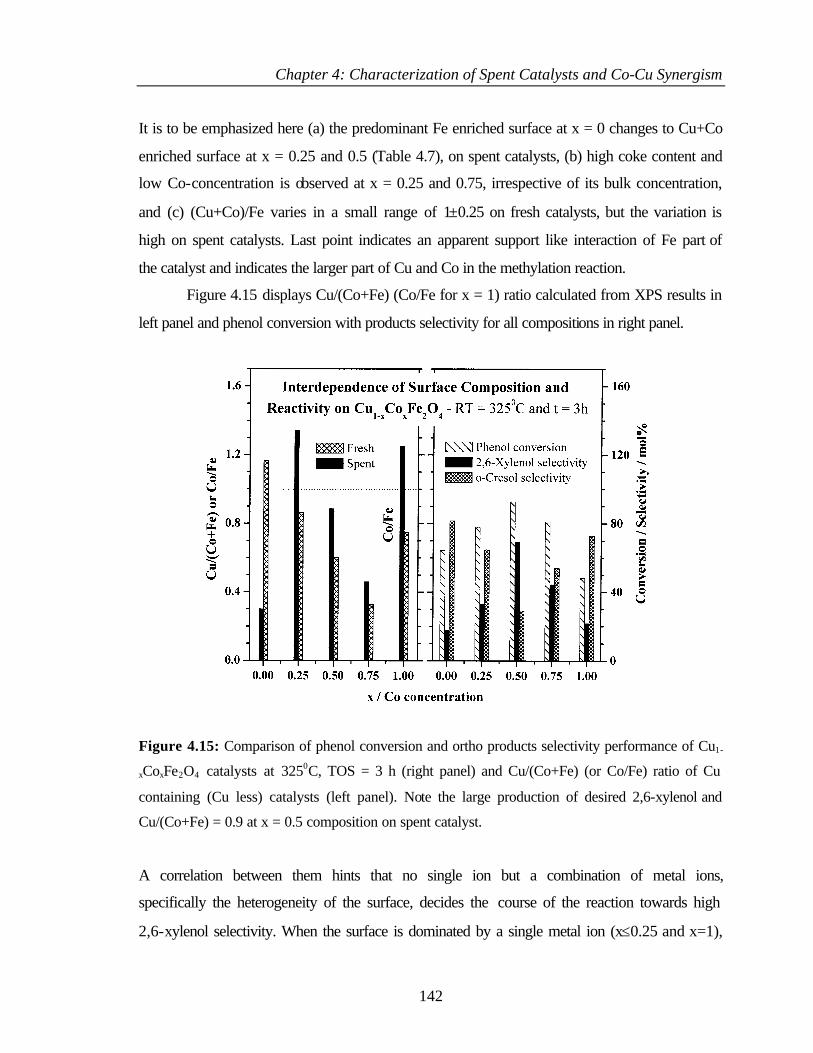
Chapter 4: Characterization of Spent Catalysts and Co-Cu Synergism
142
It is to be emphasized here (a) the predominant Fe enriched surface at x = 0 changes to Cu+Co
enriched surface at x = 0.25 and 0.5 (Table 4.7), on spent catalysts, (b) high coke content and
low Co-concentration is observed at x = 0.25 and 0.75, irrespective of its bulk concentration,
and (c) (Cu+Co)/Fe varies in a small range of 1±0.25 on fresh catalysts, but the variation is
high on spent catalysts. Last point indicates an apparent support like interaction of Fe part of
the catalyst and indicates the larger part of Cu and Co in the methylation reaction.
Figure 4.15 displays Cu/(Co+Fe) (Co/Fe for x = 1) ratio calculated from XPS results in
left panel and phenol conversion with products selectivity for all compositions in right panel.
Figure 4.15: Comparison of phenol conversion and ortho products selectivity performance of Cu1-
xCoxFe2O4 catalysts at 3250C, TOS = 3 h (right panel) and Cu/(Co+Fe) (or Co/Fe) ratio of Cu
containing (Cu less) catalysts (left panel). Note the large production of desired 2,6-xylenol and
Cu/(Co+Fe) = 0.9 at x = 0.5 composition on spent catalyst.
A correlation between them hints that no single ion but a combination of metal ions,
specifically the heterogeneity of the surface, decides the course of the reaction towards high
2,6-xylenol selectivity. When the surface is dominated by a single metal ion (x≤0.25 and x=1),
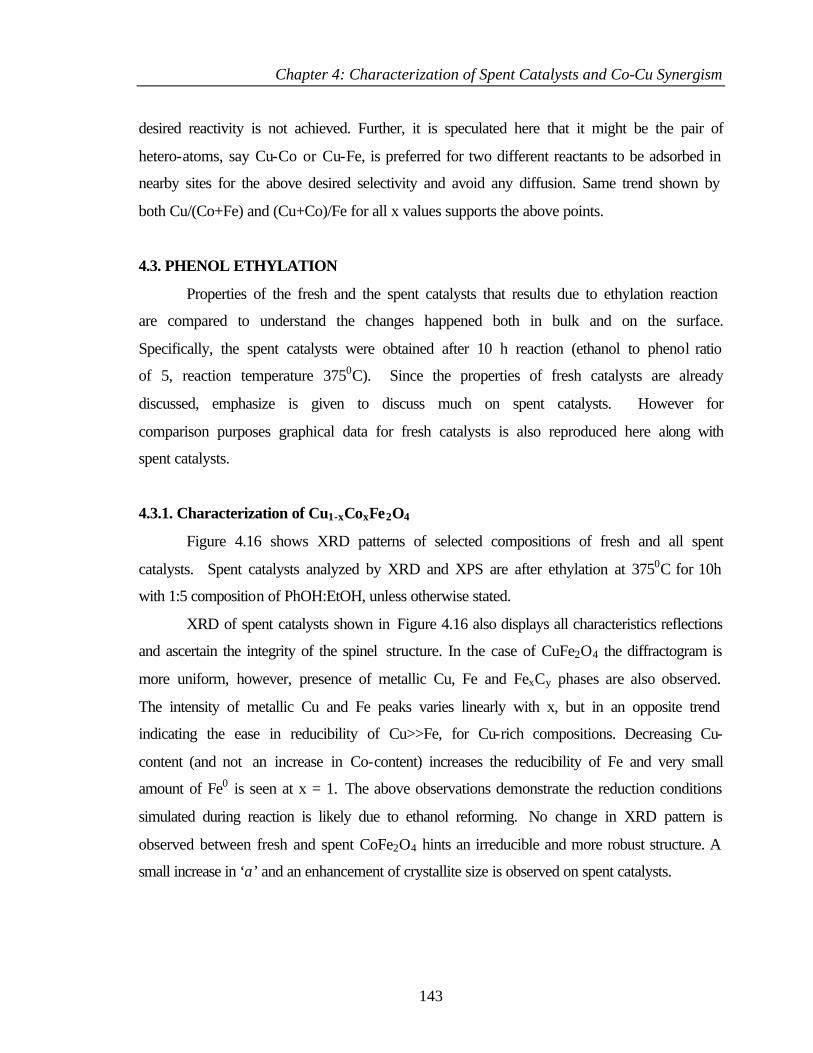
Chapter 4: Characterization of Spent Catalysts and Co-Cu Synergism
143
desired reactivity is not achieved. Further, it is speculated here that it might be the pair of
hetero-atoms, say Cu-Co or Cu-Fe, is preferred for two different reactants to be adsorbed in
nearby sites for the above desired selectivity and avoid any diffusion. Same trend shown by
both Cu/(Co+Fe) and (Cu+Co)/Fe for all x values supports the above points.
4.3. PHENOL ETHYLATION
Properties of the fresh and the spent catalysts that results due to ethylation reaction
are compared to understand the changes happened both in bulk and on the surface.
Specifically, the spent catalysts were obtained after 10 h reaction (ethanol to phenol ratio
of 5, reaction temperature 3750C). Since the properties of fresh catalysts are already
discussed, emphasize is given to discuss much on spent catalysts. However for
comparison purposes graphical data for fresh catalysts is also reproduced here along with
spent catalysts.
4.3.1. Characterization of Cu1-xCoxFe2O4
Figure 4.16 shows XRD patterns of selected compositions of fresh and all spent
catalysts. Spent catalysts analyzed by XRD and XPS are after ethylation at 3750C for 10h
with 1:5 composition of PhOH:EtOH, unless otherwise stated.
XRD of spent catalysts shown in Figure 4.16 also displays all characteristics reflections
and ascertain the integrity of the spinel structure. In the case of CuFe2O4 the diffractogram is
more uniform, however, presence of metallic Cu, Fe and FexCy phases are also observed.
The intensity of metallic Cu and Fe peaks varies linearly with x, but in an opposite trend
indicating the ease in reducibility of Cu>>Fe, for Cu-rich compositions. Decreasing Cu-
content (and not an increase in Co-content) increases the reducibility of Fe and very small
amount of Fe0 is seen at x = 1. The above observations demonstrate the reduction conditions
simulated during reaction is likely due to ethanol reforming. No change in XRD pattern is
observed between fresh and spent CoFe2O4 hints an irreducible and more robust structure. A
small increase in ‘a’ and an enhancement of crystallite size is observed on spent catalysts.
Chapter 4: Characterization of Spent Catalysts and Co-Cu Synergism
144
Figure 4.16: X-ray diffractograms of selected compositions of fresh and spent (ethylation) Cu1-
xCoxFe2O4 catalysts. XRD from spent catalysts are after phenol ethylation reaction at 3750C for 10
h with 1:5 composition of phenol:ethanol. Note an opposite trend in the intensity of metallic Cu
and Fe on spent catalysts.
4.3.2. XPS Analysis
4.3.2.1. Cu 2p core level and CuL3M45M45
Figure 4.17 displays the photoemission spectra of Cu 2p3/2 core level from fresh (a)
and spent (b) Cu1-xCoxFe2O4 catalysts. Several interesting and new features can be seen
from the Cu 2p3/2 XPS results of spent catalysts (Figure 4.17b) compared to fresh catalysts.
The main features in this spectral region are due to Cu2+ species exhibited at a BE of 934.2
along with the satellites around 942 eV and Cu+ (and/or Cu0) at 932.6±0.1 eV.
Deconvolution reveals the contribution of the above two Cu-species and Cu-reducibility in
terms of Cu+/Cu2+ is shown in Figure 4.17c along with Is/Im. For simplicity, deconvolution
is shown only for x = 0.75 in Figure 4.17b and the results are given in Table 4.8.
Main results from Figure 4.17a-c are highlighted in the following: (1) Cu2+ species
got partially reduced to Cu+ at all x values during reaction; however Cu reducibility
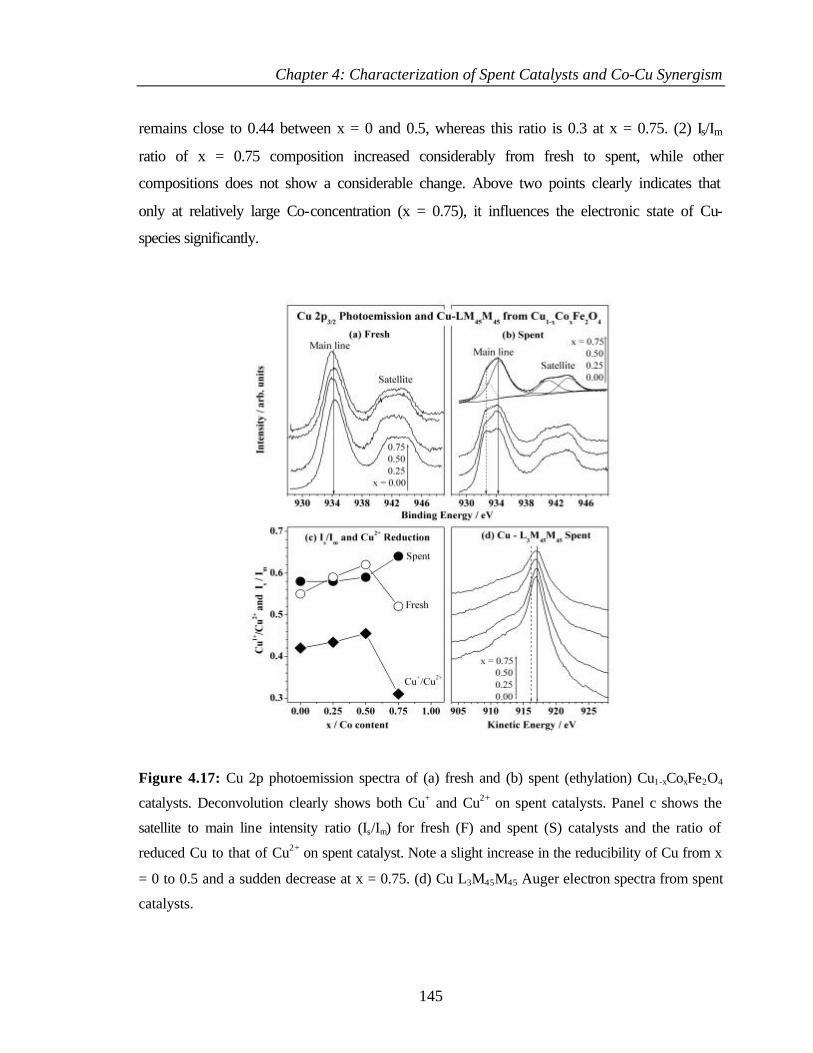
Chapter 4: Characterization of Spent Catalysts and Co-Cu Synergism
145
remains close to 0.44 between x = 0 and 0.5, whereas this ratio is 0.3 at x = 0.75. (2) Is/Im
ratio of x = 0.75 composition increased considerably from fresh to spent, while other
compositions does not show a considerable change. Above two points clearly indicates that
only at relatively large Co-concentration (x = 0.75), it influences the electronic state of Cu-
species significantly.
Figure 4.17: Cu 2p photoemission spectra of (a) fresh and (b) spent (ethylation) Cu1-xCoxFe2O4
catalysts. Deconvolution clearly shows both Cu+ and Cu2+ on spent catalysts. Panel c shows the
satellite to main line intensity ratio (Is/Im) for fresh (F) and spent (S) catalysts and the ratio of
reduced Cu to that of Cu2+ on spent catalyst. Note a slight increase in the reducibility of Cu from x
= 0 to 0.5 and a sudden decrease at x = 0.75. (d) Cu L3M45M45 Auger electron spectra from spent
catalysts.
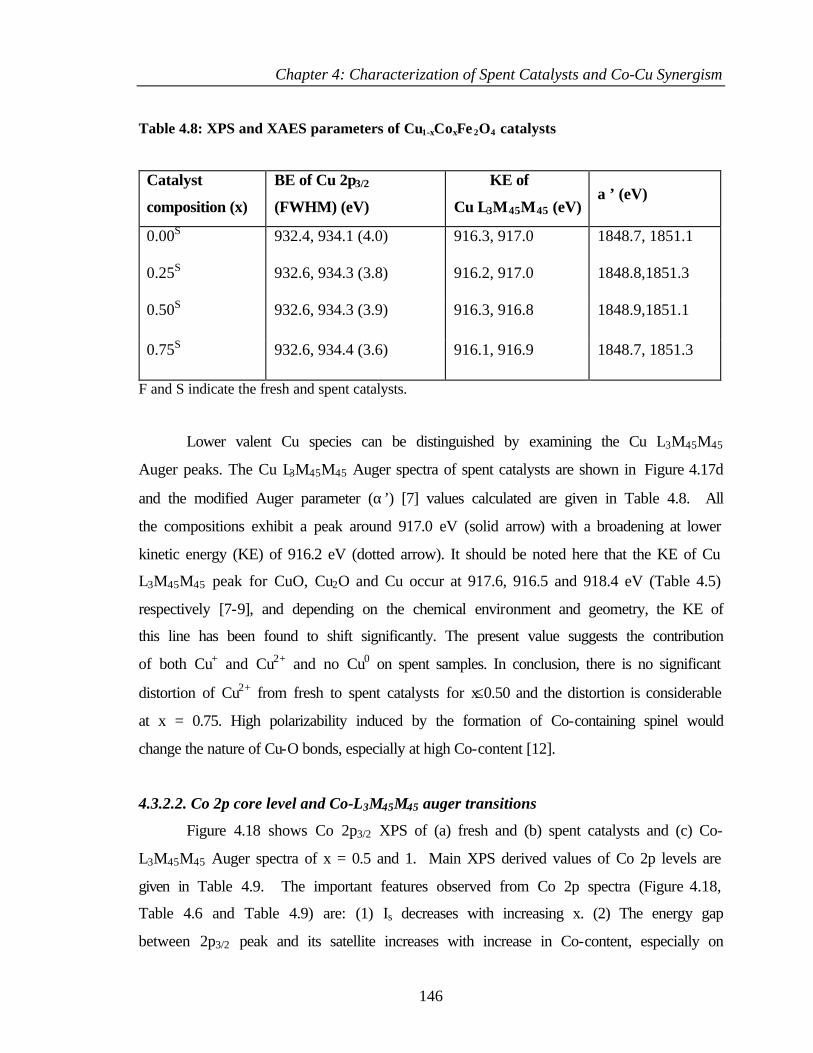
Chapter 4: Characterization of Spent Catalysts and Co-Cu Synergism
146
Table 4.8: XPS and XAES parameters of Cu1-xCoxFe 2O4 catalysts
Catalyst
composition (x)
BE of Cu 2p3/2
(FWHM) (eV)
KE of
Cu L3M45M45 (eV) α ’ (eV)
0.00S 932.4, 934.1 (4.0) 916.3, 917.0 1848.7, 1851.1
0.25S 932.6, 934.3 (3.8) 916.2, 917.0 1848.8,1851.3
0.50S 932.6, 934.3 (3.9) 916.3, 916.8 1848.9,1851.1
0.75S 932.6, 934.4 (3.6) 916.1, 916.9 1848.7, 1851.3
F and S indicate the fresh and spent catalysts.
Lower valent Cu species can be distinguished by examining the Cu L3M45M45
Auger peaks. The Cu L3M45M45 Auger spectra of spent catalysts are shown in Figure 4.17d
and the modified Auger parameter (α’) [7] values calculated are given in Table 4.8. All
the compositions exhibit a peak around 917.0 eV (solid arrow) with a broadening at lower
kinetic energy (KE) of 916.2 eV (dotted arrow). It should be noted here that the KE of Cu
L3M45M45 peak for CuO, Cu2O and Cu occur at 917.6, 916.5 and 918.4 eV (Table 4.5)
respectively [7-9], and depending on the chemical environment and geometry, the KE of
this line has been found to shift significantly. The present value suggests the contribution
of both Cu+ and Cu2+ and no Cu0 on spent samples. In conclusion, there is no significant
distortion of Cu2+ from fresh to spent catalysts for x≤0.50 and the distortion is considerable
at x = 0.75. High polarizability induced by the formation of Co-containing spinel would
change the nature of Cu-O bonds, especially at high Co-content [12].
4.3.2.2. Co 2p core level and Co-L3M45M45 auger transitions
Figure 4.18 shows Co 2p3/2 XPS of (a) fresh and (b) spent catalysts and (c) Co-
L3M45M45 Auger spectra of x = 0.5 and 1. Main XPS derived values of Co 2p levels are
given in Table 4.9. The important features observed from Co 2p spectra (Figure 4.18,
Table 4.6 and Table 4.9) are: (1) Is decreases with increasing x. (2) The energy gap
between 2p3/2 peak and its satellite increases with increase in Co-content, especially on
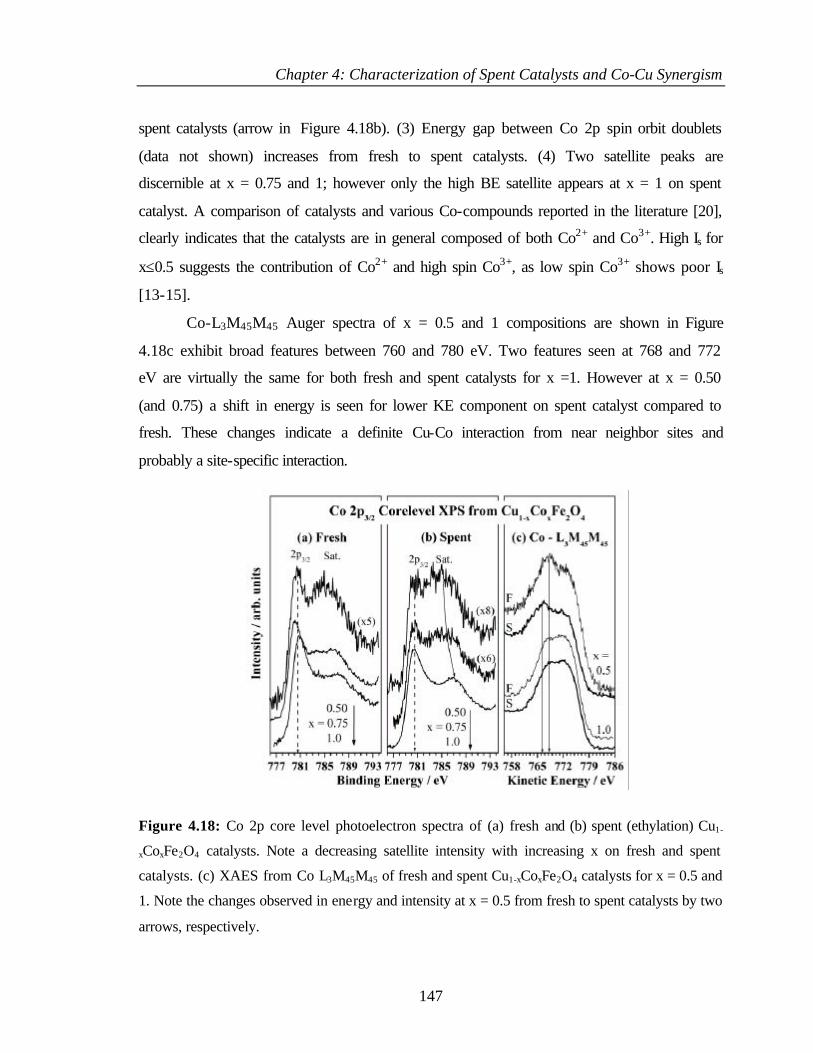
Chapter 4: Characterization of Spent Catalysts and Co-Cu Synergism
147
spent catalysts (arrow in Figure 4.18b). (3) Energy gap between Co 2p spin orbit doublets
(data not shown) increases from fresh to spent catalysts. (4) Two satellite peaks are
discernible at x = 0.75 and 1; however only the high BE satellite appears at x = 1 on spent
catalyst. A comparison of catalysts and various Co-compounds reported in the literature [20],
clearly indicates that the catalysts are in general composed of both Co2+ and Co3+. High Is for
x≤0.5 suggests the contribution of Co2+ and high spin Co3+, as low spin Co3+ shows poor Is
[13-15].
Co-L3M45M45 Auger spectra of x = 0.5 and 1 compositions are shown in Figure
4.18c exhibit broad features between 760 and 780 eV. Two features seen at 768 and 772
eV are virtually the same for both fresh and spent catalysts for x =1. However at x = 0.50
(and 0.75) a shift in energy is seen for lower KE component on spent catalyst compared to
fresh. These changes indicate a definite Cu-Co interaction from near neighbor sites and
probably a site-specific interaction.
Figure 4.18: Co 2p core level photoelectron spectra of (a) fresh and (b) spent (ethylation) Cu1-
xCoxFe2O4 catalysts. Note a decreasing satellite intensity with increasing x on fresh and spent
catalysts. (c) XAES from Co L3M45M45 of fresh and spent Cu1-xCoxFe2O4 catalysts for x = 0.5 and
1. Note the changes observed in energy and intensity at x = 0.5 from fresh to spent catalysts by two
arrows, respectively.
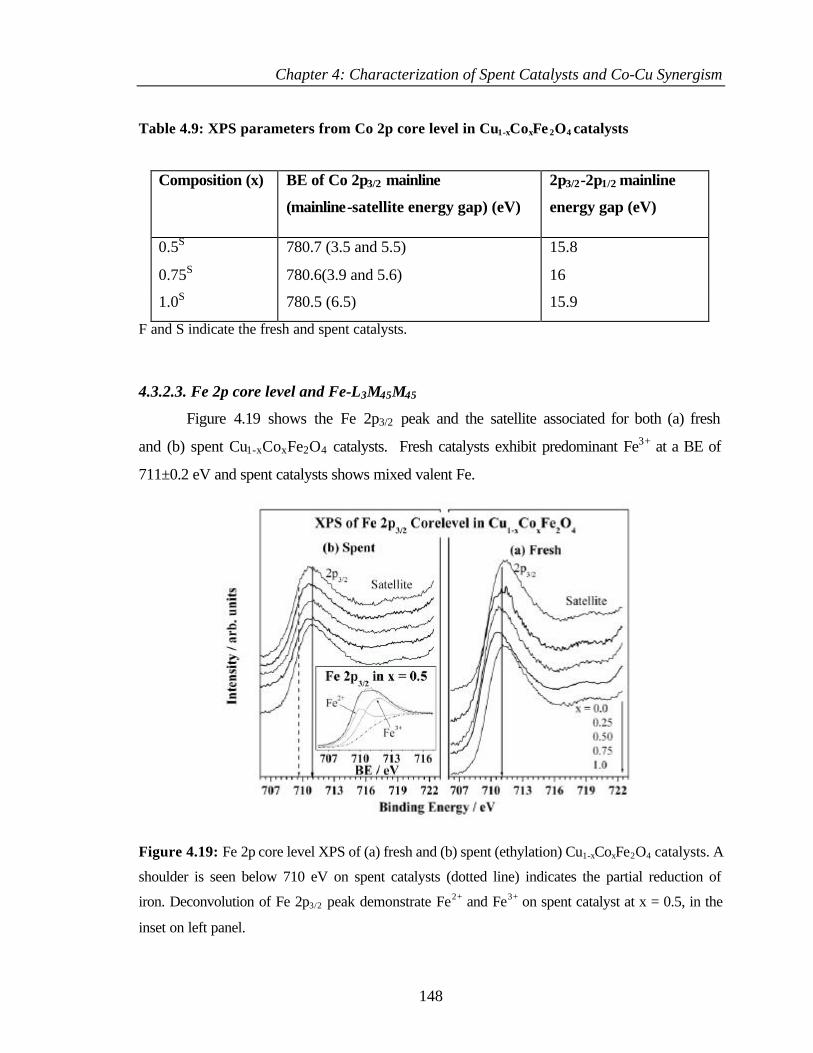
Chapter 4: Characterization of Spent Catalysts and Co-Cu Synergism
148
Table 4.9: XPS parameters from Co 2p core level in Cu1-xCoxFe 2O4 catalysts
Composition (x) BE of Co 2p3/2 mainline
(mainline-satellite energy gap) (eV)
2p3/2-2p1/2 mainline
energy gap (eV)
0.5S 780.7 (3.5 and 5.5) 15.8
0.75S 780.6(3.9 and 5.6) 16
1.0S 780.5 (6.5) 15.9
F and S indicate the fresh and spent catalysts.
4.3.2.3. Fe 2p core level and Fe-L3M45M45
Figure 4.19 shows the Fe 2p3/2 peak and the satellite associated for both (a) fresh
and (b) spent Cu1-xCoxFe2O4 catalysts. Fresh catalysts exhibit predominant Fe3+ at a BE of
711±0.2 eV and spent catalysts shows mixed valent Fe.
Figure 4.19: Fe 2p core level XPS of (a) fresh and (b) spent (ethylation) Cu1-xCoxFe2O4 catalysts. A
shoulder is seen below 710 eV on spent catalysts (dotted line) indicates the partial reduction of
iron. Deconvolution of Fe 2p3/2 peak demonstrate Fe2+ and Fe3+ on spent catalyst at x = 0.5, in the
inset on left panel.
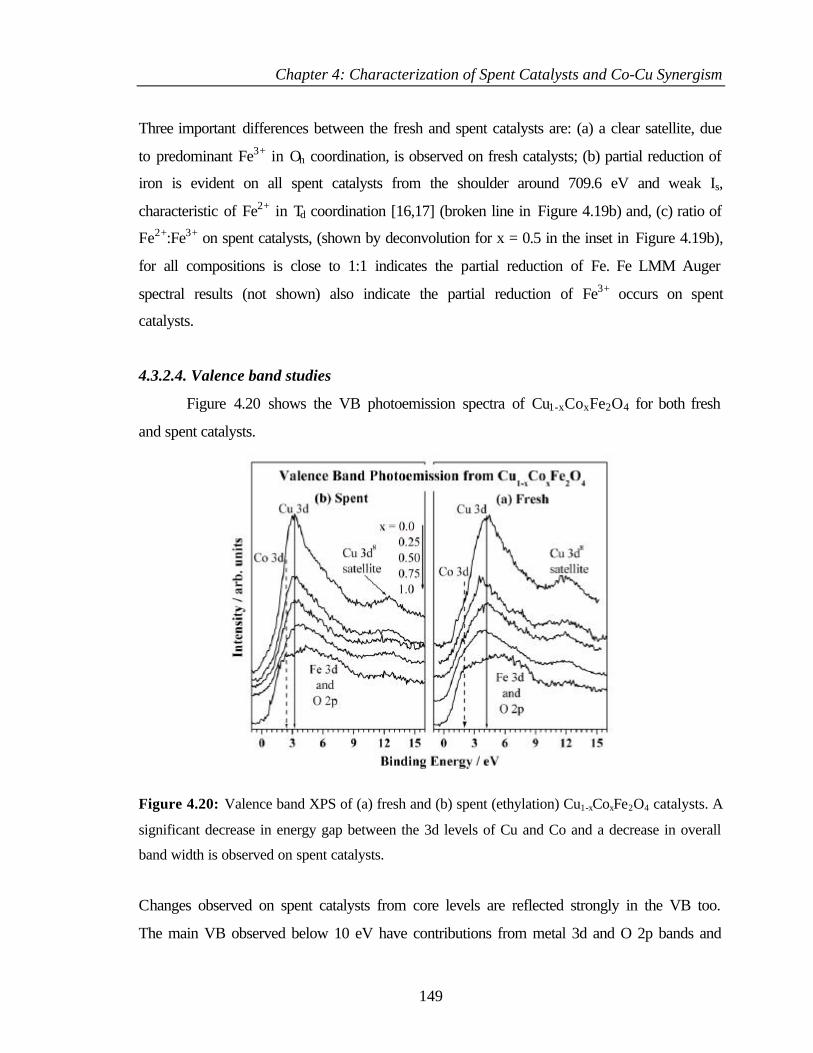
Chapter 4: Characterization of Spent Catalysts and Co-Cu Synergism
149
Three important differences between the fresh and spent catalysts are: (a) a clear satellite, due
to predominant Fe3+ in Oh coordination, is observed on fresh catalysts; (b) partial reduction of
iron is evident on all spent catalysts from the shoulder around 709.6 eV and weak Is,
characteristic of Fe2+ in Td coordination [16,17] (broken line in Figure 4.19b) and, (c) ratio of
Fe2+:Fe3+ on spent catalysts, (shown by deconvolution for x = 0.5 in the inset in Figure 4.19b),
for all compositions is close to 1:1 indicates the partial reduction of Fe. Fe LMM Auger
spectral results (not shown) also indicate the partial reduction of Fe3+ occurs on spent
catalysts.
4.3.2.4. Valence band studies
Figure 4.20 shows the VB photoemission spectra of Cu1-xCoxFe2O4 for both fresh
and spent catalysts.
Figure 4.20: Valence band XPS of (a) fresh and (b) spent (ethylation) Cu1-xCoxFe2O4 catalysts. A
significant decrease in energy gap between the 3d levels of Cu and Co and a decrease in overall
band width is observed on spent catalysts.
Changes observed on spent catalysts from core levels are reflected strongly in the VB too.
The main VB observed below 10 eV have contributions from metal 3d and O 2p bands and
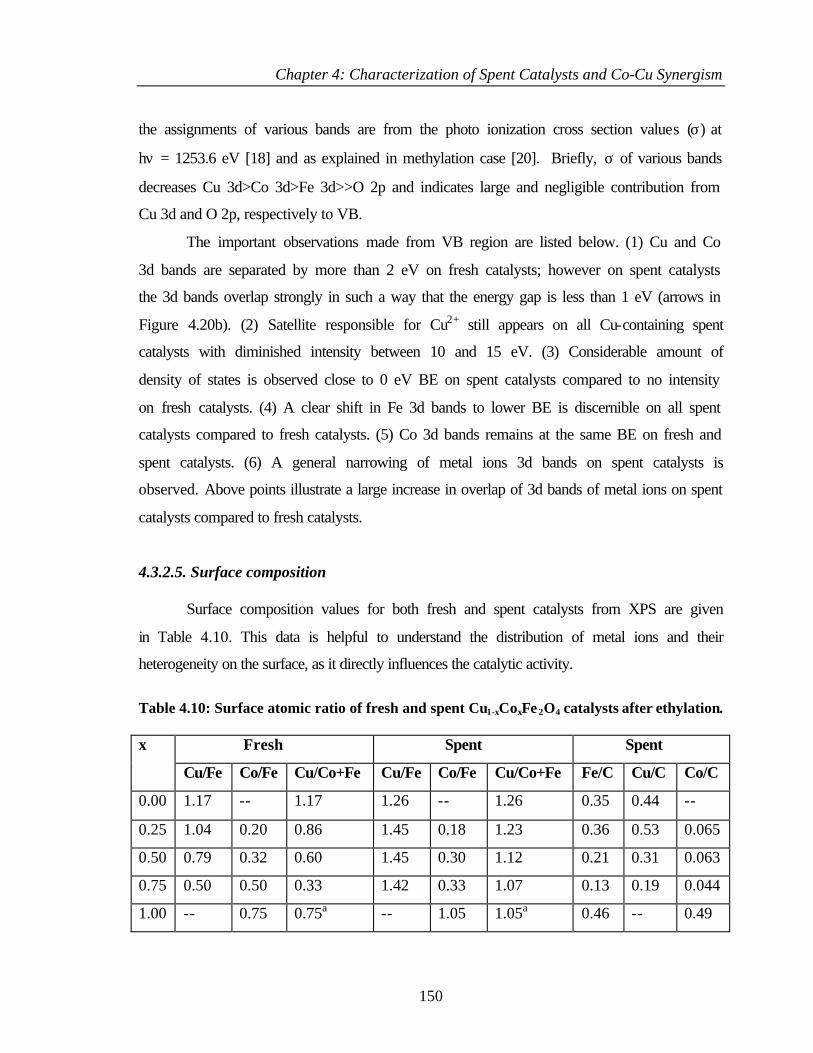
Chapter 4: Characterization of Spent Catalysts and Co-Cu Synergism
150
the assignments of various bands are from the photo ionization cross section values (σ) at
hν = 1253.6 eV [18] and as explained in methylation case [20]. Briefly, σ of various bands
decreases Cu 3d>Co 3d>Fe 3d>>O 2p and indicates large and negligible contribution from
Cu 3d and O 2p, respectively to VB.
The important observations made from VB region are listed below. (1) Cu and Co
3d bands are separated by more than 2 eV on fresh catalysts; however on spent catalysts
the 3d bands overlap strongly in such a way that the energy gap is less than 1 eV (arrows in
Figure 4.20b). (2) Satellite responsible for Cu2+ still appears on all Cu-containing spent
catalysts with diminished intensity between 10 and 15 eV. (3) Considerable amount of
density of states is observed close to 0 eV BE on spent catalysts compared to no intensity
on fresh catalysts. (4) A clear shift in Fe 3d bands to lower BE is discernible on all spent
catalysts compared to fresh catalysts. (5) Co 3d bands remains at the same BE on fresh and
spent catalysts. (6) A general narrowing of metal ions 3d bands on spent catalysts is
observed. Above points illustrate a large increase in overlap of 3d bands of metal ions on spent
catalysts compared to fresh catalysts.
4.3.2.5. Surface composition
Surface composition values for both fresh and spent catalysts from XPS are given
in Table 4.10. This data is helpful to understand the distribution of metal ions and their
heterogeneity on the surface, as it directly influences the catalytic activity.
Table 4.10: Surface atomic ratio of fresh and spent Cu1-xCoxFe 2O4 catalysts after ethylation.
Fresh Spent Spent x
Cu/Fe Co/Fe Cu/Co+Fe Cu/Fe Co/Fe Cu/Co+Fe Fe/C Cu/C Co/C
0.00 1.17 -- 1.17 1.26 -- 1.26 0.35 0.44 --
0.25 1.04 0.20 0.86 1.45 0.18 1.23 0.36 0.53 0.065
0.50 0.79 0.32 0.60 1.45 0.30 1.12 0.21 0.31 0.063
0.75 0.50 0.50 0.33 1.42 0.33 1.07 0.13 0.19 0.044
1.00 -- 0.75 0.75a -- 1.05 1.05a 0.46 -- 0.49
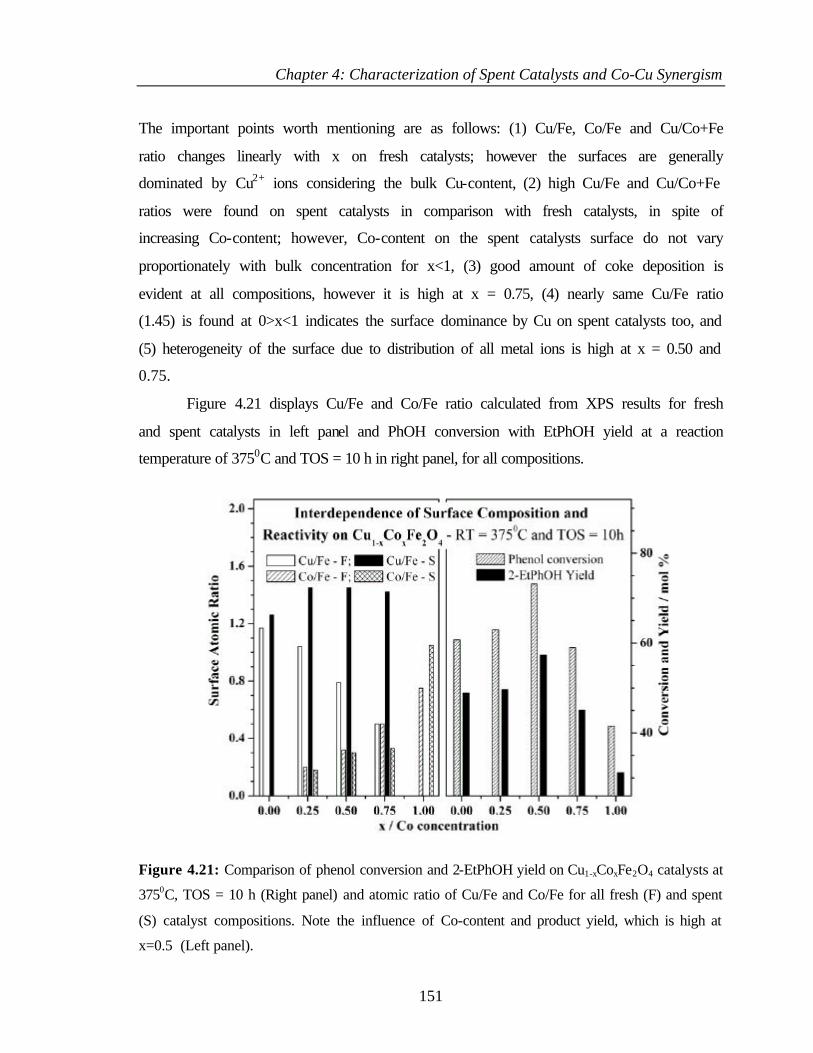
Chapter 4: Characterization of Spent Catalysts and Co-Cu Synergism
151
The important points worth mentioning are as follows: (1) Cu/Fe, Co/Fe and Cu/Co+Fe
ratio changes linearly with x on fresh catalysts; however the surfaces are generally
dominated by Cu2+ ions considering the bulk Cu-content, (2) high Cu/Fe and Cu/Co+Fe
ratios were found on spent catalysts in comparison with fresh catalysts, in spite of
increasing Co-content; however, Co-content on the spent catalysts surface do not vary
proportionately with bulk concentration for x<1, (3) good amount of coke deposition is
evident at all compositions, however it is high at x = 0.75, (4) nearly same Cu/Fe ratio
(1.45) is found at 0>x<1 indicates the surface dominance by Cu on spent catalysts too, and
(5) heterogeneity of the surface due to distribution of all metal ions is high at x = 0.50 and
0.75.
Figure 4.21 displays Cu/Fe and Co/Fe ratio calculated from XPS results for fresh
and spent catalysts in left panel and PhOH conversion with EtPhOH yield at a reaction
temperature of 3750C and TOS = 10 h in right panel, for all compositions.
Figure 4.21: Comparison of phenol conversion and 2-EtPhOH yield on Cu1-xCoxFe2O4 catalysts at
3750C, TOS = 10 h (Right panel) and atomic ratio of Cu/Fe and Co/Fe for all fresh (F) and spent
(S) catalyst compositions. Note the influence of Co-content and product yield, which is high at
x=0.5 (Left panel).
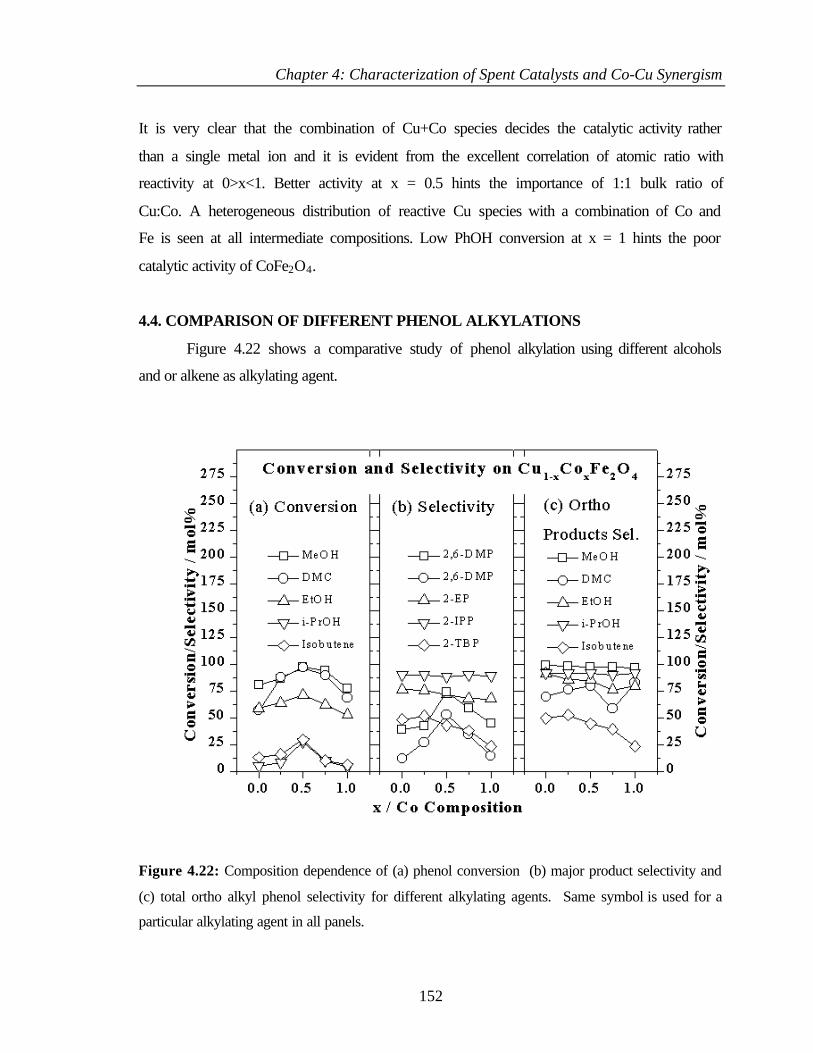
Chapter 4: Characterization of Spent Catalysts and Co-Cu Synergism
152
It is very clear that the combination of Cu+Co species decides the catalytic activity rather
than a single metal ion and it is evident from the excellent correlation of atomic ratio with
reactivity at 0>x<1. Better activity at x = 0.5 hints the importance of 1:1 bulk ratio of
Cu:Co. A heterogeneous distribution of reactive Cu species with a combination of Co and
Fe is seen at all intermediate compositions. Low PhOH conversion at x = 1 hints the poor
catalytic activity of CoFe2O4.
4.4. COMPARISON OF DIFFERENT PHENOL ALKYLATIONS
Figure 4.22 shows a comparative study of phenol alkylation using different alcohols
and or alkene as alkylating agent.
Figure 4.22: Composition dependence of (a) phenol conversion (b) major product selectivity and
(c) total ortho alkyl phenol selectivity for different alkylating agents. Same symbol is used for a
particular alkylating agent in all panels.
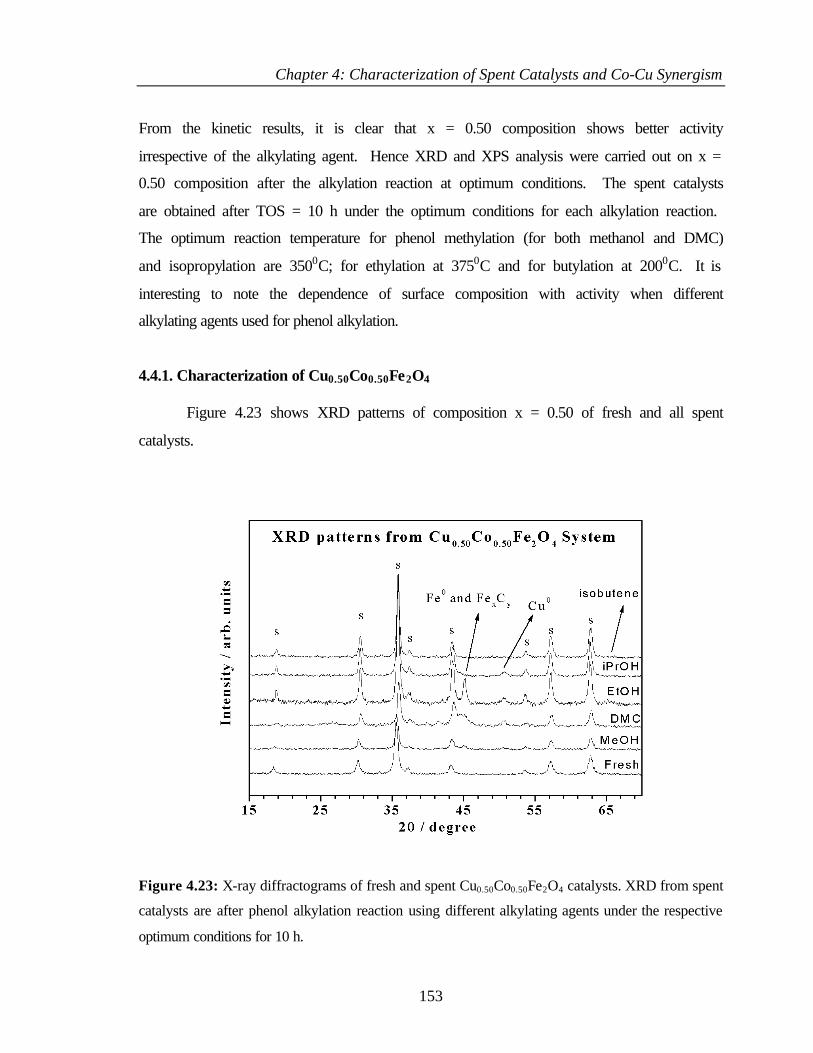
Chapter 4: Characterization of Spent Catalysts and Co-Cu Synergism
153
From the kinetic results, it is clear that x = 0.50 composition shows better activity
irrespective of the alkylating agent. Hence XRD and XPS analysis were carried out on x =
0.50 composition after the alkylation reaction at optimum conditions. The spent catalysts
are obtained after TOS = 10 h under the optimum conditions for each alkylation reaction.
The optimum reaction temperature for phenol methylation (for both methanol and DMC)
and isopropylation are 3500C; for ethylation at 3750C and for butylation at 2000C. It is
interesting to note the dependence of surface composition with activity when different
alkylating agents used for phenol alkylation.
4.4.1. Characterization of Cu0.50Co0.50Fe2O4
Figure 4.23 shows XRD patterns of composition x = 0.50 of fresh and all spent
catalysts.
Figure 4.23: X-ray diffractograms of fresh and spent Cu0.50Co0.50Fe2O4 catalysts. XRD from spent
catalysts are after phenol alkylation reaction using different alkylating agents under the respective
optimum conditions for 10 h.
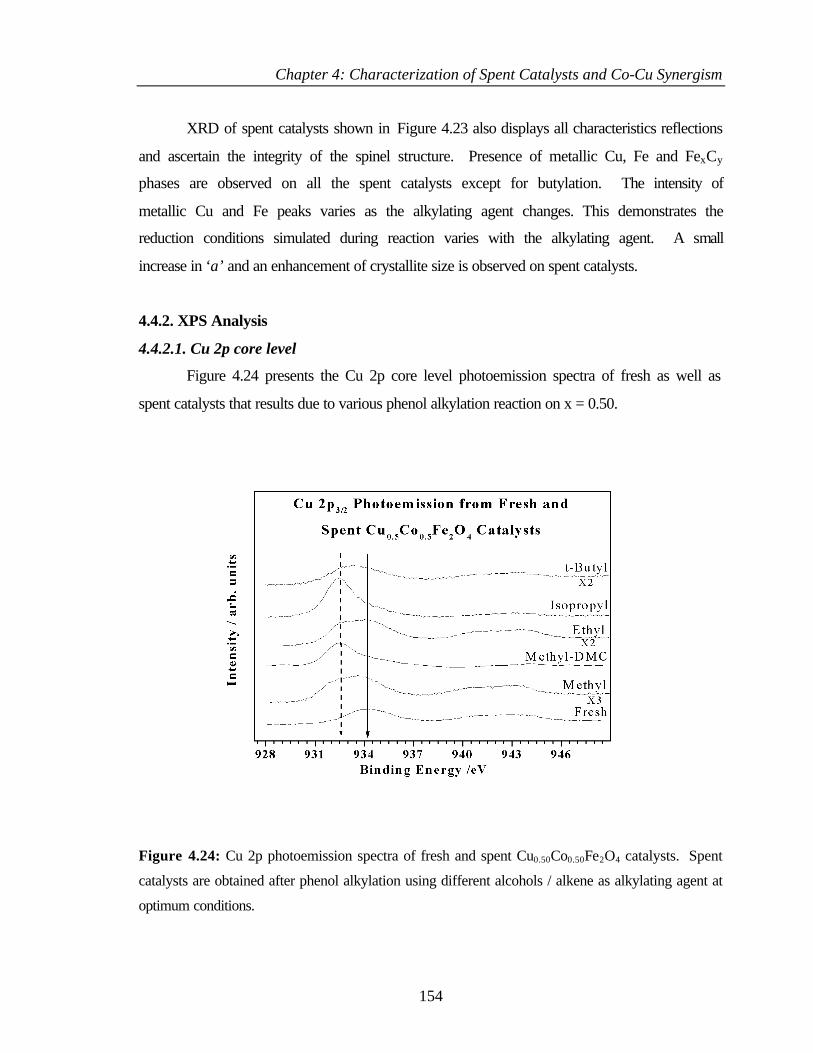
Chapter 4: Characterization of Spent Catalysts and Co-Cu Synergism
154
XRD of spent catalysts shown in Figure 4.23 also displays all characteristics reflections
and ascertain the integrity of the spinel structure. Presence of metallic Cu, Fe and FexCy
phases are observed on all the spent catalysts except for butylation. The intensity of
metallic Cu and Fe peaks varies as the alkylating agent changes. This demonstrates the
reduction conditions simulated during reaction varies with the alkylating agent. A small
increase in ‘a’ and an enhancement of crystallite size is observed on spent catalysts.
4.4.2. XPS Analysis
4.4.2.1. Cu 2p core level
Figure 4.24 presents the Cu 2p core level photoemission spectra of fresh as well as
spent catalysts that results due to various phenol alkylation reaction on x = 0.50.
Figure 4.24: Cu 2p photoemission spectra of fresh and spent Cu0.50Co0.50Fe2O4 catalysts. Spent
catalysts are obtained after phenol alkylation using different alcohols / alkene as alkylating agent at
optimum conditions.
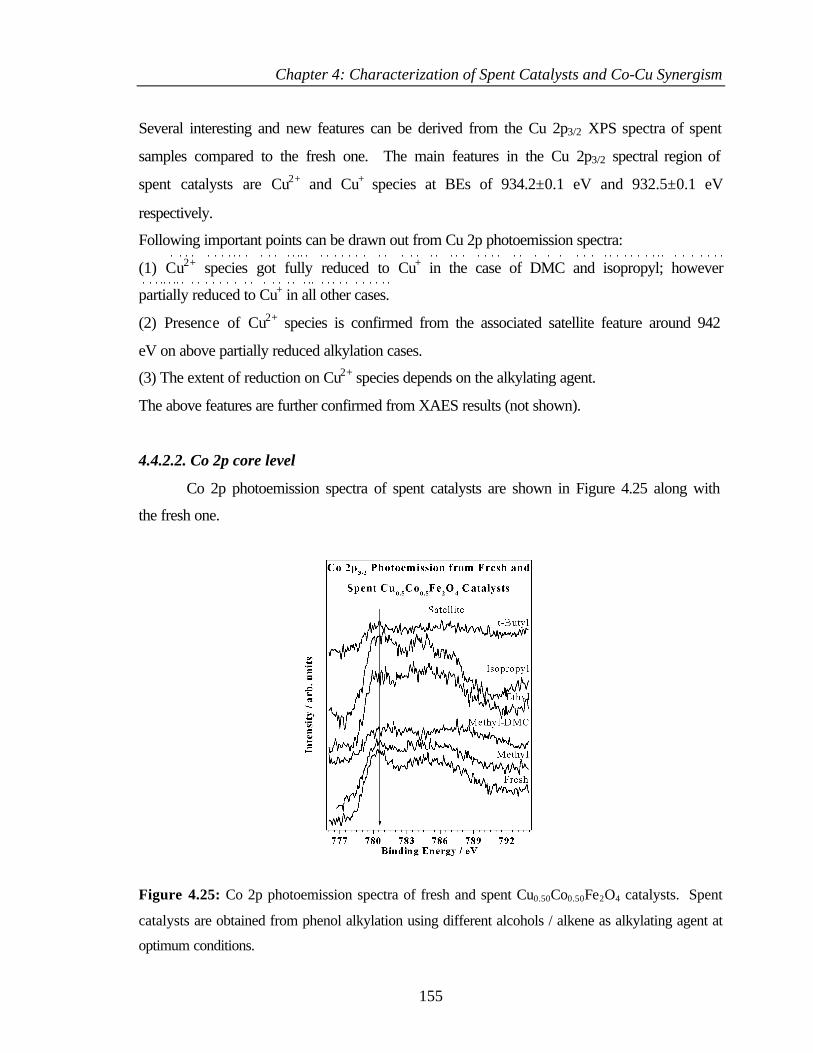
Chapter 4: Characterization of Spent Catalysts and Co-Cu Synergism
155
Several interesting and new features can be derived from the Cu 2p3/2 XPS spectra of spent
samples compared to the fresh one. The main features in the Cu 2p3/2 spectral region of
spent catalysts are Cu2+ and Cu+ species at BEs of 934.2±0.1 eV and 932.5±0.1 eV
respectively.
Following important points can be drawn out from Cu 2p photoemission spectra:
(1) Cu2+ species got fully reduced to Cu+ in the case of DMC and isopropyl; however
partially reduced to Cu+ in all other cases.
(2) Presence of Cu2+ species is confirmed from the associated satellite feature around 942
eV on above partially reduced alkylation cases.
(3) The extent of reduction on Cu2+ species depends on the alkylating agent.
The above features are further confirmed from XAES results (not shown).
4.4.2.2. Co 2p core level
Co 2p photoemission spectra of spent catalysts are shown in Figure 4.25 along with
the fresh one.
Figure 4.25: Co 2p photoemission spectra of fresh and spent Cu0.50Co0.50Fe2O4 catalysts. Spent
catalysts are obtained from phenol alkylation using different alcohols / alkene as alkylating agent at
optimum conditions.
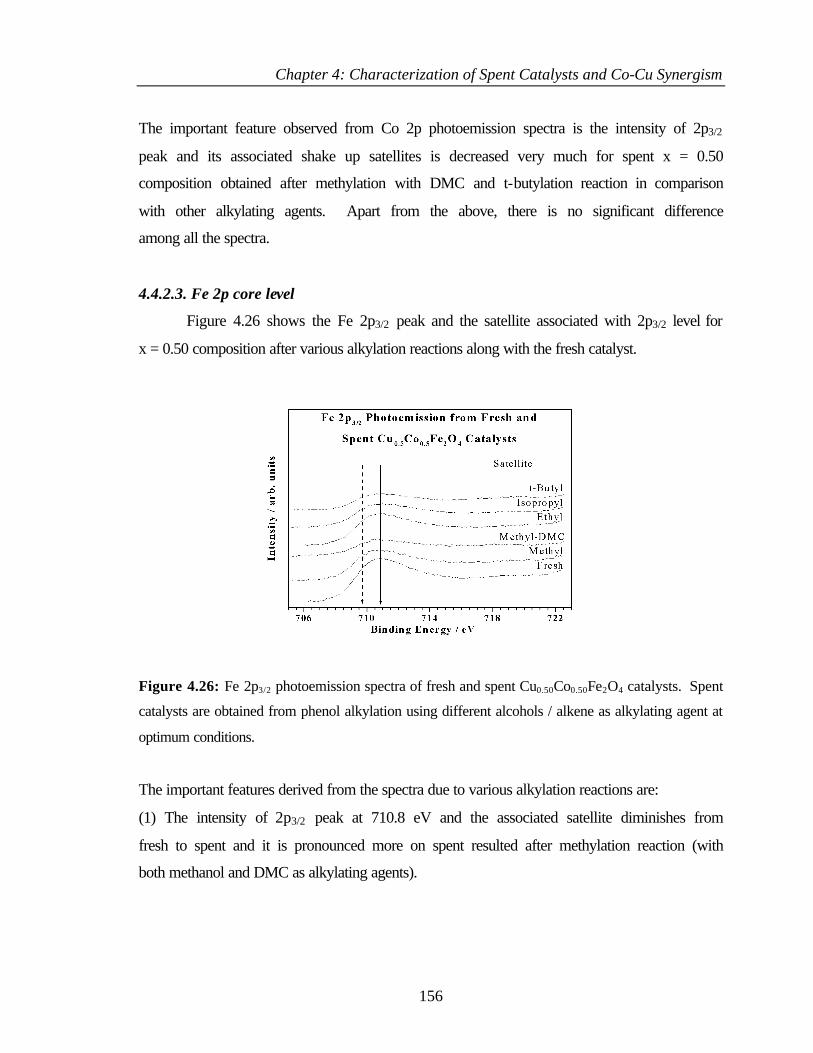
Chapter 4: Characterization of Spent Catalysts and Co-Cu Synergism
156
The important feature observed from Co 2p photoemission spectra is the intensity of 2p3/2
peak and its associated shake up satellites is decreased very much for spent x = 0.50
composition obtained after methylation with DMC and t-butylation reaction in comparison
with other alkylating agents. Apart from the above, there is no significant difference
among all the spectra.
4.4.2.3. Fe 2p core level
Figure 4.26 shows the Fe 2p3/2 peak and the satellite associated with 2p3/2 level for
x = 0.50 composition after various alkylation reactions along with the fresh catalyst.
Figure 4.26: Fe 2p3/2 photoemission spectra of fresh and spent Cu0.50Co0.50Fe2O4 catalysts. Spent
catalysts are obtained from phenol alkylation using different alcohols / alkene as alkylating agent at
optimum conditions.
The important features derived from the spectra due to various alkylation reactions are:
(1) The intensity of 2p3/2 peak at 710.8 eV and the associated satellite diminishes from
fresh to spent and it is pronounced more on spent resulted after methylation reaction (with
both methanol and DMC as alkylating agents).
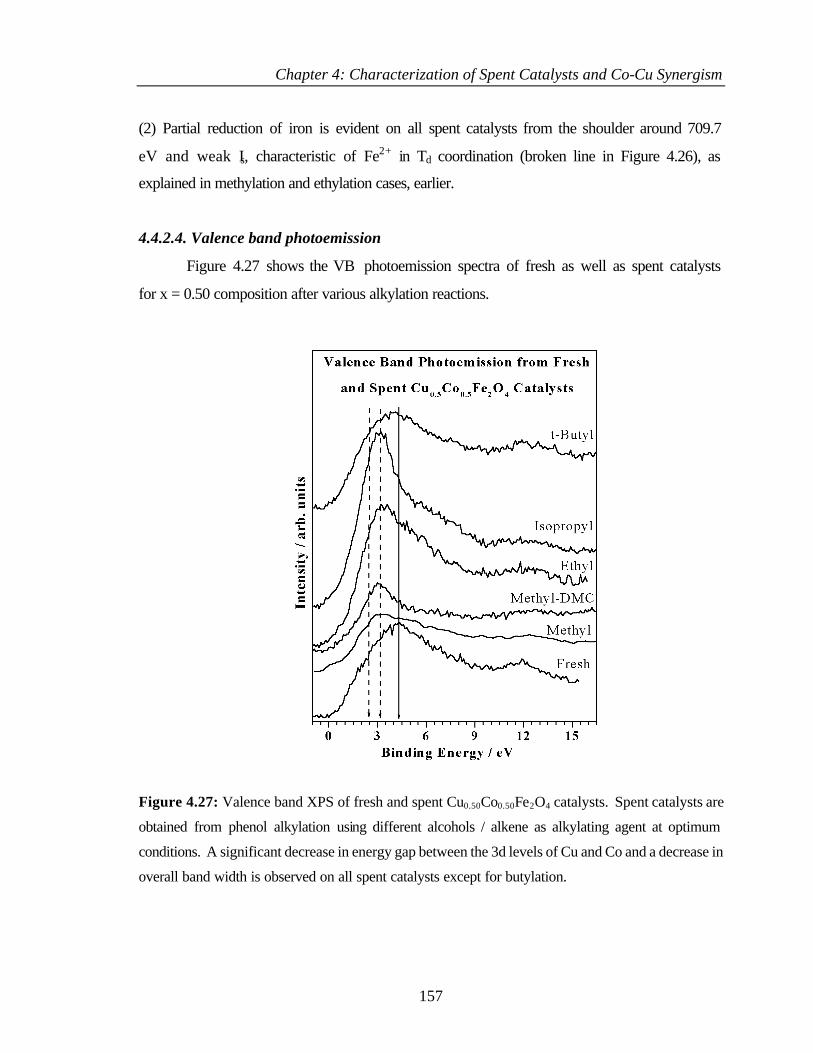
Chapter 4: Characterization of Spent Catalysts and Co-Cu Synergism
157
(2) Partial reduction of iron is evident on all spent catalysts from the shoulder around 709.7
eV and weak Is, characteristic of Fe2+ in Td coordination (broken line in Figure 4.26), as
explained in methylation and ethylation cases, earlier.
4.4.2.4. Valence band photoemission
Figure 4.27 shows the VB photoemission spectra of fresh as well as spent catalysts
for x = 0.50 composition after various alkylation reactions.
Figure 4.27: Valence band XPS of fresh and spent Cu0.50Co0.50Fe2O4 catalysts. Spent catalysts are
obtained from phenol alkylation using different alcohols / alkene as alkylating agent at optimum
conditions. A significant decrease in energy gap between the 3d levels of Cu and Co and a decrease in
overall band width is observed on all spent catalysts except for butylation.
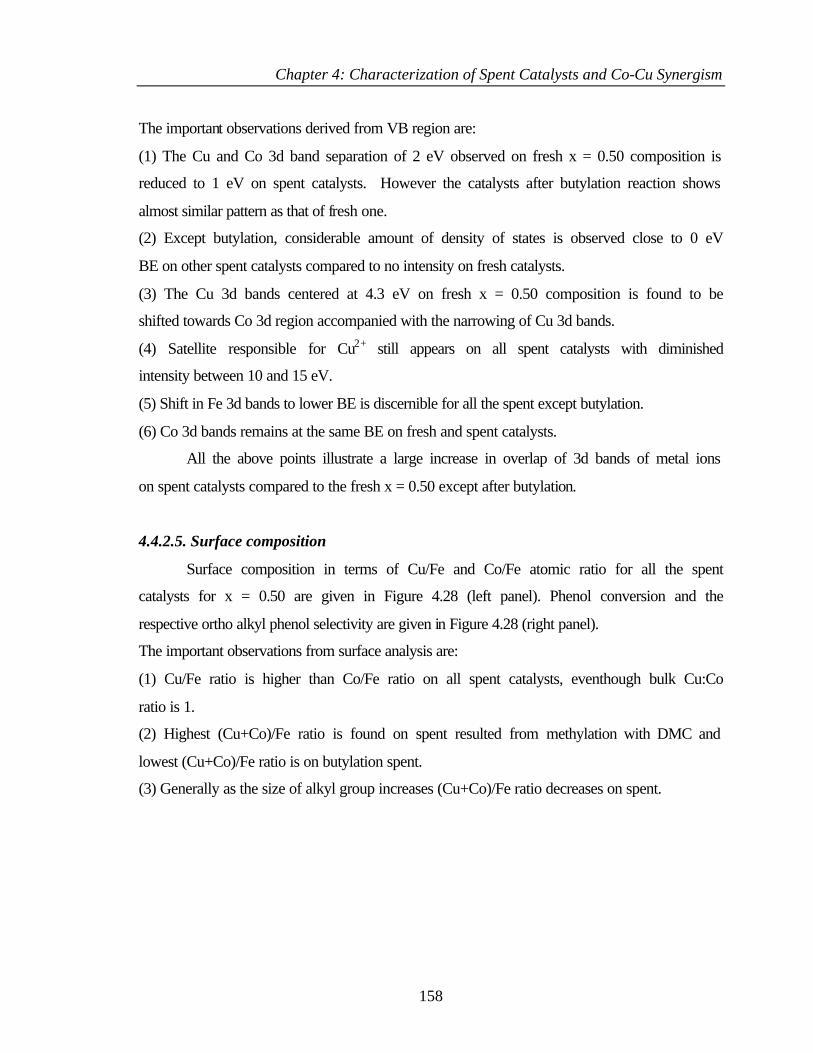
Chapter 4: Characterization of Spent Catalysts and Co-Cu Synergism
158
The important observations derived from VB region are:
(1) The Cu and Co 3d band separation of 2 eV observed on fresh x = 0.50 composition is
reduced to 1 eV on spent catalysts. However the catalysts after butylation reaction shows
almost similar pattern as that of fresh one.
(2) Except butylation, considerable amount of density of states is observed close to 0 eV
BE on other spent catalysts compared to no intensity on fresh catalysts.
(3) The Cu 3d bands centered at 4.3 eV on fresh x = 0.50 composition is found to be
shifted towards Co 3d region accompanied with the narrowing of Cu 3d bands.
(4) Satellite responsible for Cu2+ still appears on all spent catalysts with diminished
intensity between 10 and 15 eV.
(5) Shift in Fe 3d bands to lower BE is discernible for all the spent except butylation.
(6) Co 3d bands remains at the same BE on fresh and spent catalysts.
All the above points illustrate a large increase in overlap of 3d bands of metal ions
on spent catalysts compared to the fresh x = 0.50 except after butylation.
4.4.2.5. Surface composition
Surface composition in terms of Cu/Fe and Co/Fe atomic ratio for all the spent
catalysts for x = 0.50 are given in Figure 4.28 (left panel). Phenol conversion and the
respective ortho alkyl phenol selectivity are given in Figure 4.28 (right panel).
The important observations from surface analysis are:
(1) Cu/Fe ratio is higher than Co/Fe ratio on all spent catalysts, eventhough bulk Cu:Co
ratio is 1.
(2) Highest (Cu+Co)/Fe ratio is found on spent resulted from methylation with DMC and
lowest (Cu+Co)/Fe ratio is on butylation spent.
(3) Generally as the size of alkyl group increases (Cu+Co)/Fe ratio decreases on spent.
Chapter 4: Characterization of Spent Catalysts and Co-Cu Synergism
159
Figure 4.28: Comparison of phenol conversion and ortho products selectivity performance of
Cu0.50Co0.50Fe2O4 catalyst for different alkylating agents at optimum condition, t = 3 h (right panel)
and Cu/Fe and Co/Fe ratio (left panel).
From the comparison between surface atomic ratio and phenol alkylation activity, it
is clear that spent catalysts having high Cu/Fe atomic ratio show high catalytic
performance. Thus spent catalysts resulted after methylation (with both methanol and
DMC) and ethylation possess relatively high Cu/Fe atomic ratio and in all these three cases
high phenol conversion is observed. Whereas for the spent catalysts of both isopropylation
and butylation cases low Cu/Fe atomic ratio is observed and the phenol conversion is less
for both cases. Thus it can be concluded that high Cu-content on the surface is an essential
requisite for better catalytic performance and large Fe-content on the surface, reduces the
catalytic activity, as already explained in methylation cases (x = 0.00) cases.
Chapter 4: Characterization of Spent Catalysts and Co-Cu Synergism
160
SECTION II
4.5. INTRODUCTION
Observations derived from the analysis of the spent catalysts are discussed in detail
in this section. The analysis of the spent catalysts obtained from various phenol
alkylations revealed similar structural changes. Hence we restrict this discussion part in
terms of catalytic activity to methylation, and structural changes are discussed in detail.
Regarding phenol methylation the results fullfill the expectations: the mixed Cu-Co
ferrites exhibit the highest activities, the conversion of phenol exceeds significantly the
activities shown by the x = 0 and x = 1 samples at T ≤ 350 0C. The three dominant effects
of the mixing of the Cu and Co ferrites, viz. possible changes in the bulk structure
(occasional phase separation), changes in the oxidation state of the altervalent ions
(included the redistribution of iron in (A) and [B] sites), and formation of different
carbonaceous deposits are discussed in the forthcoming paragraphs. The most important
finding is for efficient dimethylation Cu-Co interaction in the Cu1-xCoxFe2O4 spinel system is
very much essential, which is demonstrated through the changes in oxidation state and overlap
of 3d bands of transition metal ions, elucidated from XPS studies.
4.6. DISCUSSION
4.6.1. Chemical state and distribution of transition metal ions in Cu1-xCoxFe2O4 system
Spent catalysts show predominant spinel phase and small amount of metallic Cu, iron
carbide and Cu2O due to reductive atmosphere under methylation conditions. Nonetheless Cu0
and Fe0 are not observed in XPS results (Figures 4.8 and 4.12) at any composition hints the
surface metal atoms are oxidized. However, coke deposition prevents the oxidation of metal
species in the bulk and seen in XRD. This also indicates the inevitable structural collapse to
some extent at x = 0.0; nevertheless, the structural integrity retained is high at x≥0.25 and
confirmed from XRD. Surface area increases after reaction on x = 0.5 and 0.75 and the same
decreases at other compositions. At x = 0.0 and 0.25 it is probably due to agglomeration of Fe
and Cu particles, respectively, (Figure 4.15). Nonetheless, x = 0.5 shows uniform distribution
Chapter 4: Characterization of Spent Catalysts and Co-Cu Synergism
161
of all the ions and copper being the major species supports its high activity. All the above
indicates there is a considerable redistribution of the cations under reaction conditions,
especially at 0<x<1.
It is evident that above such modifications occurs in the case of ethylation spent
catalysts too. Seemingly, there is an apparent correlation between surface area and phenol
conversion. It is to be noted here that the surface area of Cu1-xCoxFe2O4 system prepared by
high temperature glycine nitrate combustion method [21] exhibit <2 m2/g for all compositions
and show low methylation activity (results not shown) but follows the same trend as that of
samples prepared by co-precipitation. This indicates the surface area is not a dominating factor
in methylation reactions.
The reaction conditions imposed over the catalyst due to other phenol alkylation
reaction were also reducing. However the extent of reduction depends on the alkylating
agent as well as the reaction conditions. Decomposition of alcohols occurs along with
alkylation results in formation of CO, H2 and hydrocarbons, which are sufficient enough to
reduce the fresh catalyst. Thus the reaction ended with the reduction of Cu2+, Fe3+ and
Co3+ ions to its lower oxidation states as in the case of methylation but to different extents.
Spent catalysts show predominant spinel phase and small amount of Cu, ∝-Fe, FexCy and
Cu2O.
4.6.2. Changes in the bulk structure - extent of the expected phase separation
It is known that the CuO + Fe2O3 = CuFe2O4 process is slightly endothermal, thus
decomposition of the Cu ferrite might proceed spontaneously. In fact, for the Cu ferrite,
this presumption has clearly proven by XRD, TG-DTA and Mössbauer studies. The X-ray
diffractograms recorded both on the fresh and spent CuFe2O4 samples display the presence
of other Cu, CuO, Fe2O3, etc. phases as well. In addition, the comparison of the fresh and
spent catalyst exhibits far the largest shift in the value of ’a’ lattice parameter, indicating a
noticeable change in the structure upon treatment. In correspondence, the Mössbauer
spectra recorded on the CuFe2O4 samples exhibit characteristic shapes, e.g. the spectrum of
the spent catalyst might be used as a textbook illustration for magnetite.
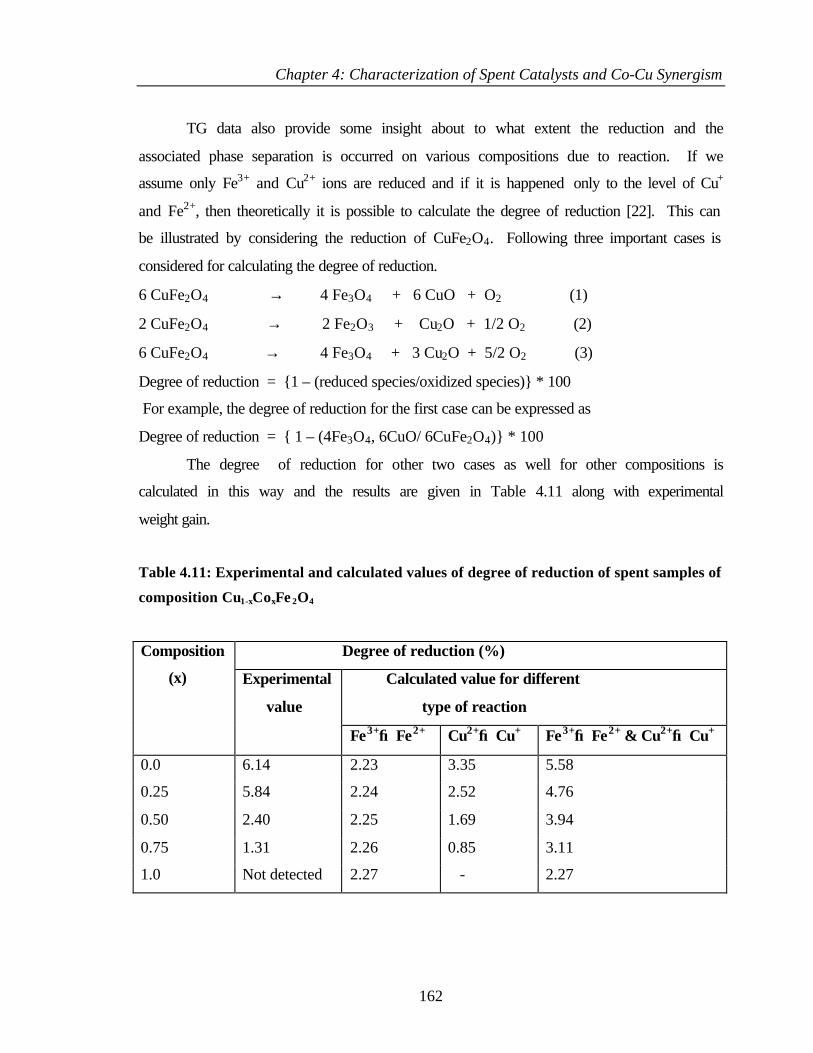
Chapter 4: Characterization of Spent Catalysts and Co-Cu Synergism
162
TG data also provide some insight about to what extent the reduction and the
associated phase separation is occurred on various compositions due to reaction. If we
assume only Fe3+ and Cu2+ ions are reduced and if it is happened only to the level of Cu+
and Fe2+, then theoretically it is possible to calculate the degree of reduction [22]. This can
be illustrated by considering the reduction of CuFe2O4. Following three important cases is
considered for calculating the degree of reduction.
6 CuFe2O4 → 4 Fe3O4 + 6 CuO + O2 (1)
2 CuFe2O4 → 2 Fe2O3 + Cu2O + 1/2 O2 (2)
6 CuFe2O4 → 4 Fe3O4 + 3 Cu2O + 5/2 O2 (3)
Degree of reduction = {1 – (reduced species/oxidized species)} * 100
For example, the degree of reduction for the first case can be expressed as
Degree of reduction = { 1 – (4Fe3O4, 6CuO/ 6CuFe2O4)} * 100
The degree of reduction for other two cases as well for other compositions is
calculated in this way and the results are given in Table 4.11 along with experimental
weight gain.
Table 4.11: Experimental and calculated values of degree of reduction of spent samples of
composition Cu1-xCoxFe 2O4
Degree of reduction (%)
Calculated value for different
type of reaction
Composition
(x) Experimental
value
Fe3+→Fe2+ Cu2+→Cu+ Fe3+→Fe2+ & Cu2+→Cu+
0.0 6.14 2.23 3.35 5.58
0.25 5.84 2.24 2.52 4.76
0.50 2.40 2.25 1.69 3.94
0.75 1.31 2.26 0.85 3.11
1.0 Not detected 2.27 - 2.27
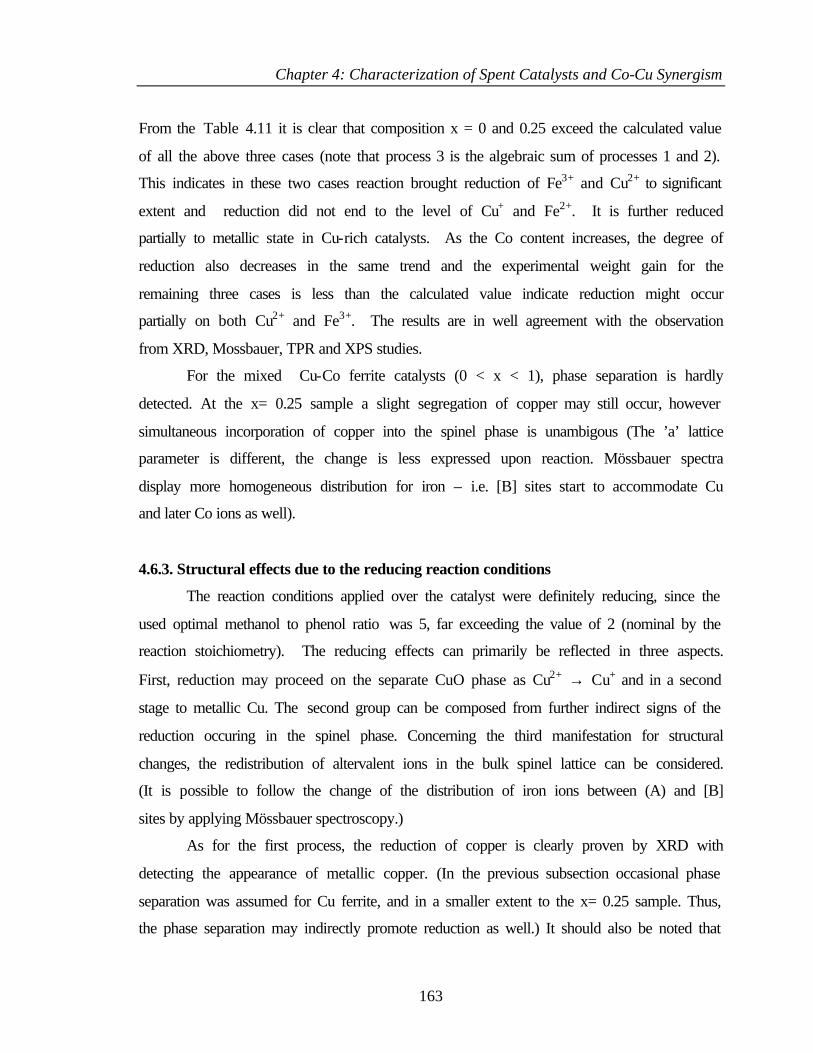
Chapter 4: Characterization of Spent Catalysts and Co-Cu Synergism
163
From the Table 4.11 it is clear that composition x = 0 and 0.25 exceed the calculated value
of all the above three cases (note that process 3 is the algebraic sum of processes 1 and 2).
This indicates in these two cases reaction brought reduction of Fe3+ and Cu2+ to significant
extent and reduction did not end to the level of Cu+ and Fe2+. It is further reduced
partially to metallic state in Cu-rich catalysts. As the Co content increases, the degree of
reduction also decreases in the same trend and the experimental weight gain for the
remaining three cases is less than the calculated value indicate reduction might occur
partially on both Cu2+ and Fe3+. The results are in well agreement with the observation
from XRD, Mossbauer, TPR and XPS studies.
For the mixed Cu-Co ferrite catalysts (0 < x < 1), phase separation is hardly
detected. At the x= 0.25 sample a slight segregation of copper may still occur, however
simultaneous incorporation of copper into the spinel phase is unambigous (The ’a’ lattice
parameter is different, the change is less expressed upon reaction. Mössbauer spectra
display more homogeneous distribution for iron – i.e. [B] sites start to accommodate Cu
and later Co ions as well).
4.6.3. Structural effects due to the reducing reaction conditions
The reaction conditions applied over the catalyst were definitely reducing, since the
used optimal methanol to phenol ratio was 5, far exceeding the value of 2 (nominal by the
reaction stoichiometry). The reducing effects can primarily be reflected in three aspects.
First, reduction may proceed on the separate CuO phase as Cu2+ → Cu+ and in a second
stage to metallic Cu. The second group can be composed from further indirect signs of the
reduction occuring in the spinel phase. Concerning the third manifestation for structural
changes, the redistribution of altervalent ions in the bulk spinel lattice can be considered.
(It is possible to follow the change of the distribution of iron ions between (A) and [B]
sites by applying Mössbauer spectroscopy.)
As for the first process, the reduction of copper is clearly proven by XRD with
detecting the appearance of metallic copper. (In the previous subsection occasional phase
separation was assumed for Cu ferrite, and in a smaller extent to the x= 0.25 sample. Thus,
the phase separation may indirectly promote reduction as well.) It should also be noted that
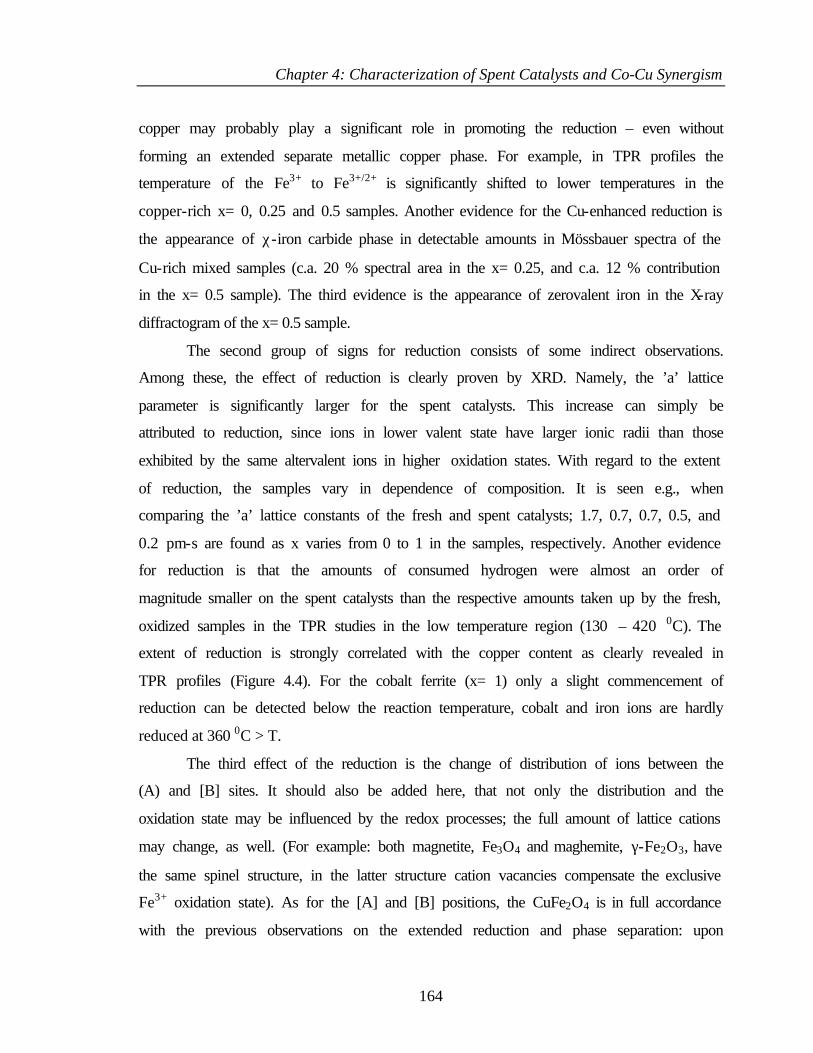
Chapter 4: Characterization of Spent Catalysts and Co-Cu Synergism
164
copper may probably play a significant role in promoting the reduction – even without
forming an extended separate metallic copper phase. For example, in TPR profiles the
temperature of the Fe3+ to Fe3+/2+ is significantly shifted to lower temperatures in the
copper-rich x= 0, 0.25 and 0.5 samples. Another evidence for the Cu-enhanced reduction is
the appearance of χ-iron carbide phase in detectable amounts in Mössbauer spectra of the
Cu-rich mixed samples (c.a. 20 % spectral area in the x= 0.25, and c.a. 12 % contribution
in the x= 0.5 sample). The third evidence is the appearance of zerovalent iron in the X-ray
diffractogram of the x= 0.5 sample.
The second group of signs for reduction consists of some indirect observations.
Among these, the effect of reduction is clearly proven by XRD. Namely, the ’a’ lattice
parameter is significantly larger for the spent catalysts. This increase can simply be
attributed to reduction, since ions in lower valent state have larger ionic radii than those
exhibited by the same altervalent ions in higher oxidation states. With regard to the extent
of reduction, the samples vary in dependence of composition. It is seen e.g., when
comparing the ’a’ lattice constants of the fresh and spent catalysts; 1.7, 0.7, 0.7, 0.5, and
0.2 pm-s are found as x varies from 0 to 1 in the samples, respectively. Another evidence
for reduction is that the amounts of consumed hydrogen were almost an order of
magnitude smaller on the spent catalysts than the respective amounts taken up by the fresh,
oxidized samples in the TPR studies in the low temperature region (130 – 420 0C). The
extent of reduction is strongly correlated with the copper content as clearly revealed in
TPR profiles (Figure 4.4). For the cobalt ferrite (x= 1) only a slight commencement of
reduction can be detected below the reaction temperature, cobalt and iron ions are hardly
reduced at 360 0C > T.
The third effect of the reduction is the change of distribution of ions between the
(A) and [B] sites. It should also be added here, that not only the distribution and the
oxidation state may be influenced by the redox processes; the full amount of lattice cations
may change, as well. (For example: both magnetite, Fe3O4 and maghemite, γ-Fe2O3, have
the same spinel structure, in the latter structure cation vacancies compensate the exclusive
Fe3+ oxidation state). As for the [A] and [B] positions, the CuFe2O4 is in full accordance
with the previous observations on the extended reduction and phase separation: upon
Chapter 4: Characterization of Spent Catalysts and Co-Cu Synergism
165
reaction the Fe3+(A) sites are partially depleted and the Fe2+/3+[B] positions are filled up,
leaving only small space to Cu ions for staying inserted in the lattice (the ratio of the
Fe3+(A) to Fe2+/3+[B] populations < 1; Table 4.2). In the catalytically most active mixed
samples (0 < x < 1) distinct changes are seen: in the spent samples the ratio of the Fe3+(A)
to Fe2+/3+[B] populations reverses to > 1, i.e. Co (and occasionally Cu) ions may occupy
[B] sites in higher proportions. At the same time however, the reducibility is maintained
for iron sites in the octahedral [B] positions: the full amounts of Fe3+[B] are converted to
Fe2+/3+[B] upon exposing the fresh samples to the reaction mixture. In the cobalt ferrite the
extent of reduction is the smallest among all the samples, for example, the Fe3+ state is
mostly maintained in [B] sites, it prevails over the Fe2+/3+ proportion in the spent catalyst.
Due to the lower coordination number of the tetrahedral cations, the attractive force
for a single tetrahedral M-O bond will be strong [1]. Since each octahedral cation is
surrounded by more number of anions, the octahedral M-O bond will be weaker and hence
will be more polar. Jacobs et al [23] in a study, using LEIS (Low energy ion scattering, a
technique which is sensitive to the outer most atomic layer), revealed that spinel surface
sites are mainly octahedral and, hence, the octahedral cations are mainly exposed on the
surface. Narasimhan and Swamy reported that weak octahedral M-O bonds act as strong
alcohol adsorption centers [24]. The DR-IR studies of spent samples also show the
pronounced splitting of octahedral bands. All these observations help to conclude that the
octahedral sites are the main centers of organic molecule adsorption which causes the
reduction of respective ions more on octahedral sites than on tetrahedral.
4.6.4. Carbonaceous deposits formed in the process of alkylation
Formation of carbonaceous deposits is clearly revealed on the catalytically most
active, mixed Cu-Co ferrites. For example, TG measurements reveal a significant weight
loss, amounting to 8 – 12 wt %, upon heating the samples in air. In this aspect, the
different nature of the carbon deposit is worth to point out, namely, the deposits formed on
the two copper-rich x= 0.25 and 0.5 samples exhibit similar behaviour, whereas the
deposit formed on the cobalt rich x= 0.75 sample shows different properties. Three
similarities for the x= 0.25 and 0.5 samples can be mentioned. First, their carbonaceous
Chapter 4: Characterization of Spent Catalysts and Co-Cu Synergism
166
deposits contain hydrogen in a significant proportion, the H2 : CO ratio exceeds 1 as the
mass spectroscopy of the TPD studies show. The second feature is the comparatively low
temperature of the removal of the deposit: either in air (in TG) or in helium (in TPD) the
deposits are removed at similar temperatures (around 580 K). The third feature is the
formation of iron carbide in detectable amounts. This feature is due to the strong reducing
potential exerted by these hydrogen-rich carbonaceous deposits: the carbon exists probably
in a reactive form which is able to form iron carbide in detectable amounts in the two
copper-rich mixed samples.
The cobalt–rich mixed ferrite is different in the aspects mentioned above. First, it
does not contain hydrogen in high proportion. (The weight loss shown by TG is the largest,
as well as the released amount of heat detected by the DTA). The second point is that the
characteristic coke burning temperatures are the highest (c.a. 610 K for TG and TPD).
Third, no iron carbide is formed (in detectable amount) in contrast to the highest amount of
removed deposit (12 wt %).
On the basis of these three mentioned differences it is plausible to suggest that the
structures of the carbonaceous deposits are different for the copper-rich and for the cobalt-
rich samples. In the former x= 0.25 and 0.5 samples the layer is probably more porous,
containing hydrogen and reactive carbon constituents, whereas probably more dense
deposit is formed on the spent cobalt-rich ferrite sample. The structural difference in the
carbonaceous deposit is probably correlated with the weaker extent of reduction in the x=
0.75 sample.
On the other hand, the properties of the carbonaceous deposit are also correlated
with the acidity of catalysts. The acid-base properties of Cu1-xCoxFe2O4 reveal that acidity
(basicity) increases (decreases) as ’x’ increases. Moreover from pyridine adsorption it is
found that acidity is mainly due to Lewis and presence of pyridinium ions at 1541 cm-1
(Bronsted sites) was hardly detected. Considering the previous finding, that the best
catalytic performance is at the x = 0.5 composition, it can be assumed that a medium
acidity is preferred for the reaction. This is also correlated with the composition of the
carbonaceous deposits since on the preferred catalyst a high H : C ratio ( > 1, i.e. "soft”
deposit [25]) was detected.
Chapter 4: Characterization of Spent Catalysts and Co-Cu Synergism
167
4.6.5. Surface state – XPS
Number of changes observed from fresh to spent catalysts throws more light on the
transformations that are occurring under experimental conditions. Main points from the XPS
results can be summarized in a nutshell as below: Decrease in reducibility of copper with
increasing x, increasing 3d bands overlap and redistribution of metal ions on spent catalysts.
There is no static charging observed on any of the spent catalysts and a weak photoemission at
0.0 BE, except at x = 1, demonstrates the bulk conducting nature of the catalysts, in agreement
with XRD results. Main observations from XPS in combination with the desired reaction
pattern at x = 0.5 suggest the metal ions should be distributed optimally to have a large 3d band
overlap. These factors demonstrate a hand-in-hand change and enhances the heterogeneity of
the surface chemically and integrate the material electronically in such a way that multi-
reactions are carried out in close proximity. This also indicates the synergism and effective
utilization of reactants in this ferrospinel catalyst at 0<x<1. Large production of 2,6-xylenol
with high phenol conversion and a ratio of 0.9 for Cu/Co+Fe at x = 0.5 insist on the optimum
distribution of active species to have a highly heterogeneous surface.
Spent catalysts of composition x = 0.50 obtained from various phenol alkylations
show high surface Cu/Fe atomic ratio though Cu:Co atomic ratio is 1:1 in the fresh. Very
low Cu/Fe atomic ratio observed on butylation spent shows low and decreasing catalytic
activity with reaction time. This clearly hints that Cu2+ is the species that enhances the
alkylation activity largely and there is a sizeable redistribution of the cations on the catalyst
surface during time on reaction conditions.
4.6.6. Cu-Co Synergism
XPS results in the present study clearly indicate that the Cu and Co 3d bands and their
overlap play a central role in the catalytic performance in the methylation reaction. The Cu-
rich composition (x = 0.0) exhibits the total reduction of Cu species and low surface Cu atomic
% is possibly due to significantly large CH3OH reforming and H2 production. Contrarily, at x
= 1.0, no significant chemical changes are observed with Co in XPS. However at intermediate
compositions CH3OH reforming is suppressed to a considerable level is also evident from the
enhancement in the total amount of Cu species on the surface, Cu2+ content and methylation
Chapter 4: Characterization of Spent Catalysts and Co-Cu Synergism
168
activity compared to x = 0.0 (Figure 4.15). The decreasing amount of reduced Cu species with
increasing x is attributed to the participation of Co in the hydrogenation activity under the
present experimental conditions. Hydrogenation by Co consumes considerable amount of H2
and converts C and CO into methane, methyl and MeOH species [26-30], which are utilized
again through normal methylation route. This is in addition to Co activating MeOH for
methylation. The above process might be preferred in the presence of Co rather than the
reduction of Cu2+ to Cu, as in x = 0.0.
Low phenol conversion and 2,6-xylenol selectivity at x = 1, changes very significantly
and favorably by the addition of Cu at x = 0.75 and 0.5 clearly demonstrates the prime
importance of Cu in phenol adsorption and combined effect of Cu+Co for 2,6-xylenol
selectivity in this system, as discussed in the previous paragraphs. It is the latter factor known
as Cu-Co synergism that plays a major role in the phenol methylation reaction is clearly
evident from the above discussions. In the fresh catalysts Co 3d band is the top most energy
level. Observation of metallic copper on the spent catalysts clearly hints the broad Cu 4s band
[31] also overlaps with 3d bands of Cu, Co as well as Fe at intermediate compositions under
experimental conditions and makes these materials integrated chemically and electronically.
Recently we have shown the Cu-Co mixed oxide hydrotalcite catalyst performs
oxidative steam reforming [32] with high rate of H2 production and low levels of CO through
hydrogen spillover mechanism as on Cu-ZrO2 [33]; XPS results also demonstrate a close
similarity between fresh and reduced catalysts. The above results support the Cu-Co synergism
in the present ferrospinel environment also to perform methanol reforming to produce H2 as
well as hydrogenation of carbon species under methylation. The observed shift in the Fe 3d
levels also suggests that Fe is not a silent spectator and involves in the electronic structure of
the catalyst, at least at all intermediate compositions. A change in spin state of Co is also
speculated from fresh to spent catalysts from the change in energy gap between Co 2p spin-
orbit doublets and Is [34] along with redistribution of Co in Td and Oh sites (Figures 4.10 and
4.11). At x = 0.5 the above changes is accompanied with changes in Cu and Fe photoemission
too and supports the spin-state also can influence the conversion and selectivity. IR studies on
the above catalysts for acid-base properties support the above conclusions and a good
correlation is observed with catalytic activity [35].
Chapter 4: Characterization of Spent Catalysts and Co-Cu Synergism
169
Desired reaction pattern observed in the case of other alkylations except butylation
for the composition x = 0.50 is due to an optimum distribution of metal ions on surface and
bulk and larger 3d band overlap. These factors enhances the heterogeneity of the surface
chemically and integrate the material electronically in such a way that multi reactions are
carried out in close proximity. This also indicates the synergetic and effective utilization
of reactants in this ferrospinel catalyst. The relatively low Cu+Co/Fe ratio on the surface
might be the reason for fast deactivation for butylation.
4.6.7. Comparison of different phenol alkylation reactions
Comparison of phenol alkylation with various alcohols brings out the similarities
and differences between them. Figure 4.22 displays comparison of the activity data for
various phenol alkylations under the respective optimum conditions with x = 0.50
composition. The optimum conditions required for better performance are different as the
alkylating agent changes. With regard to the alkylating ability of the alcohols studied, the
total conversion of the phenol follows the order: methanol ≈ DMC > ethanol > isopropanol
≈ isobutene. Hence the primary alcohols are the best alkylating reagents. This ability
decreases with the size and branching of the hydrocarbon chain. One reason for this
general trend can be explained by the easier dehydration of 20 and 30 alcohols to olefins.
High temperatures do not favour alkylation, with the exception of methanol and DMC.
An important difference between methylation and higher alkylation is the
reluctance of the later to form exclusive alkylated products at ortho position. Among
methylation itself, a big difference was observed in the selectivity of methylated products
between methanol and DMC when used as alkylating agents. The selectivity for 2,6-
xylenol was higher with methanol than with DMC. Instead, the selectivity for the O-
alkylated product was considerably higher in the methylation with DMC, whereas with
methanol, negligible amount of O-alkylated product is formed.
Another important aspect derived from kinetic data is the difference in activity
towards the formation of ortho dialkylated products as the alkylating agent changes. For
example, although ortho dimethylation is highly favoured, in addition to ortho methylation,
the same for dialkylation is found to be significantly low with other alcohols and it is
Chapter 4: Characterization of Spent Catalysts and Co-Cu Synergism
170
hardly formed with higher alkylating agents such as isopropanol and isobutene. Moreover
higher alcohols result other side products like p-alkylated products that reduces the ortho
selectivity. In the experiments with ethanol, isopropanol and isobutene, lower alkyl
phenols are also formed, by cracking of a Caliphatic - Caliphatic bond in the chain of the initially
formed alkyl phenols. This infers, the steric factor of alkylating agent is an important
criterion for efficient ortho alkylation. Kinetic and thermodynamic studies on phenol
methylation indicate that dimethylated product is formed through sequential methylation.
Hence, single ortho methylated product is very much essential to reside sufficiently long
time, but not too long, on catalyst surface for its further methylation to form
orthodimethylated product. A very large residence time of ortho methylated phenol might
lead to second methylation at all possible positions; however except 2,6-xylenol other
products are not observed suggests the residence time is not too long. This indicate the
steric hindrance of alkyl group is not favourable for proper orientation and hence the
geometric fitting over the present catalyst system for subsequent ortho alkylation.
Number of changes observed in XPS from fresh to spent catalysts of composition x
= 0.50 for different phenol alkylation throws more light on the changes that are occurring
under experimental conditions. The following important observations can be derived from
XPS data of spent catalysts:
(1) A clear reduction of Cu is seen on all spent; however the extent of reduction depends
on the alkylating agent.
(2) A definite partial reduction of all metal ions after reaction and a consequent increase in
the overlap of 3d bands is observed on all spent catalysts, except butylation catalysts.
Main observations from XPS in combination with the desired reaction pattern
suggest overlap of ‘3d’ orbitals of all the three ions in the valence level is very much
essential for high activity towards phenol alkylation. This is evidenced from the VB
photoemission spectra of the spent x = 0.50 composition, where it has been found that the
VB spectra of the spent catalyst is narrowed down due to better overlap in comparison with
the fresh. The time on stream studies indicate that the catalyst is stable towards all the
alkylation except butylation. The relatively low Cu+Co/Fe ratio on the surface might be
the reason for fast deactivation for butylation. Desired reaction pattern observed in the
Chapter 4: Characterization of Spent Catalysts and Co-Cu Synergism
171
case of methylation and ethylation is due to an optimum distribution of metal ions on
surface and bulk and larger 3d band overlap. These factors enhances the heterogeneity of
the surface chemically and integrate the material electronically in such a way that multi
reactions are carried out in close proximity. This also indicates the synergetic and
effective utilization of reactants in this ferrospinel catalyst.
4.6.8. Acid-base strength and methylation activity performance
A detailed study on the performance of Cu1-xCoxFe2O4 catalysts towards phenol
methylation has already been discussed in section I of this chapter. Figure 4.29 displays a
comparison between the catalytic performance in terms of phenol conversion and
selectivity of 2,6-xylenol obtained at a reaction temperature of 3250C with a
phenol:methanol composition of 1:5, and relative acidity obtained from the area of ν8a and
ν19b bands in FTIR spectra of pyridine adsorbed catalysts.
In this reaction methylation is sequential and 2,6-xylenol is produced at the expense
of o-cresol and for simplicity o-cresol selectivity is not given in Figure 4.29. A steep
increase in relative acidity with Co concentration (Figure 4.29) clearly supports an increase
in acidity both in terms of strength and number. It is clear from Figure 4.29 that neither
highly acidic nor weakly acidic (or basic) catalyst at x = 1.0 and 0.0, respectively, is active
towards phenol conversion to produce 2,6-xylenol. However 0.25≥x≤0.75 show better
catalytic performance and x = 0.5 is superior and demonstrates an intermediate acidity
character. This clearly indicates that an optimum acid-base property favours the overall
reaction. It is also interesting to note that usually Friedel-Crafts alkylation reactions require
highly acidic catalysts, which is not entirely true in the present case. The extent of
secondary methanol reforming reaction decreases from x = 0 to 1, as seen from reduced
Cu-species in XPS results might be a reason for the above contradiction. It is clear that
substitution of Co2+ for Cu2+ creates an increase in acidity with a concomitant decrease in
the amount of basic sites. XPS results on Cu1-xCoxFe2O4 demonstrate that x = 0.5
composition exhibits Cu-Co synergism and the same is correlated with the catalytic
performance. Cu-Co synergism and low coke content at x = 0.5 among intermediate
compositions suggests that intermediate acidity enhances methylation activity in a way that
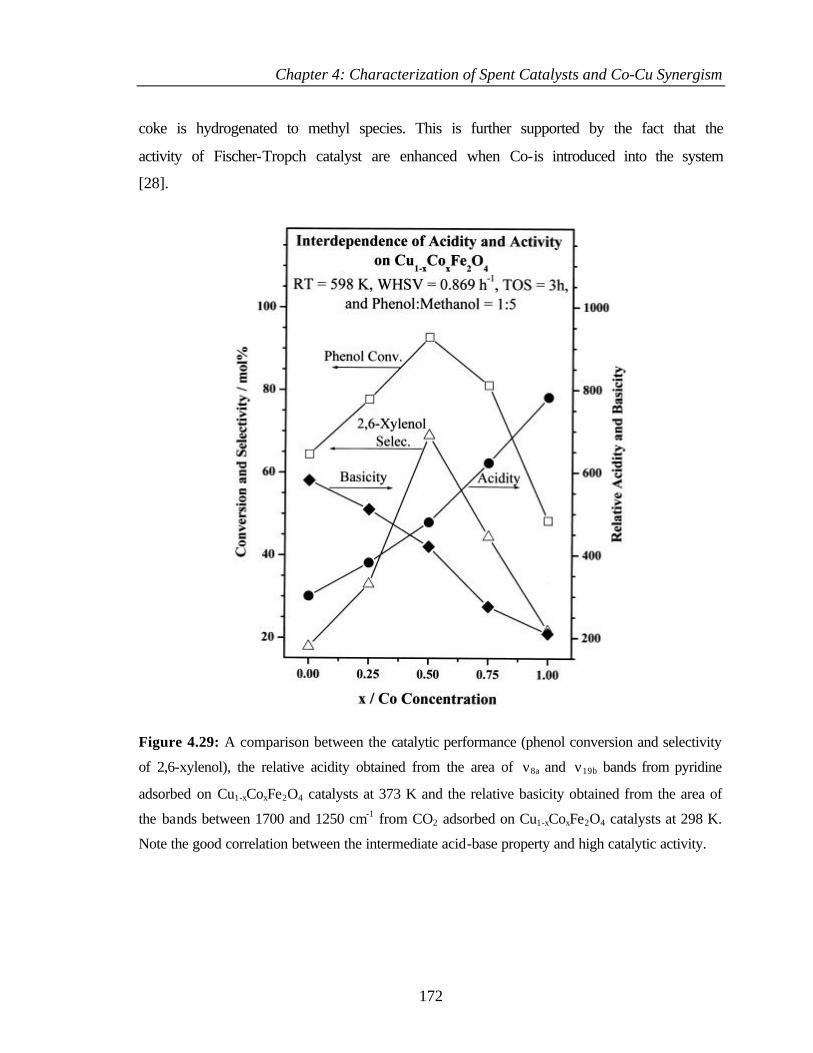
Chapter 4: Characterization of Spent Catalysts and Co-Cu Synergism
172
coke is hydrogenated to methyl species. This is further supported by the fact that the
activity of Fischer-Tropch catalyst are enhanced when Co-is introduced into the system
[28].
Figure 4.29: A comparison between the catalytic performance (phenol conversion and selectivity
of 2,6-xylenol), the relative acidity obtained from the area of ν8a and ν19b bands from pyridine
adsorbed on Cu1-xCoxFe2O4 catalysts at 373 K and the relative basicity obtained from the area of
the bands between 1700 and 1250 cm-1 from CO2 adsorbed on Cu1-xCoxFe2O4 catalysts at 298 K.
Note the good correlation between the intermediate acid-base property and high catalytic activity.
Chapter 4: Characterization of Spent Catalysts and Co-Cu Synergism
173
4.7. REFERENCES 1 Ref. 18-20 of chapter 1
2 E. Murad and J. H. Johnston, in: Applications of Mössbauer Spectroscopy to Inorganic
Chemistry, ed. G. J. Long, Plenum Press, New York, Vol. 2 (1985) p. 507.
3 R. E. Vandenberghe and E. de Grave, in: Applications of Mössbauer Spectroscopy to
Inorganic Chemistry, eds: G. J. Long and F. Grandjean, Plenum Press, New York, Vol. 3
(1986) p. 59.
4 J. W. Niemantsverdriet, A. M. van der Kraan, W. L. van Dijk and H. S. van der Baan, J.
Phys. Chem., 84 (1980) 3363.
5 C. S. Gopinath, S. Subramanian, M. Paranthaman and A. M. Hermann, Phys. Rev. B, 48
(1993) 15999.
6 C. S. Gopinath, S. Subramanian, P. S. Prabhu, M. S. R. Rao and G. V. S. Rao, Physica C,
218 (1993) 117.
7 G. Moretti, G. Fierro, M. L. Jacono and P. Porta, Surf. Interface Analysis, 14 (1989) 325.
8 S. Poulston, P. M. Parlett, P. Stone and M. Bowker, Surf. Interface Analysis, 24 (1996) 811.
9 B. R. Strohmeier, B. E. Leyden, R. S. Field and D. M. Hercules, J. Catal., 94 (1985) 514.
10 V. A. M. Brabers, Mat. Res. Bull., 18 (1983) 861.
11 Y. Okamoto, K. Fukino, T. Imamaka and S. Teranishi, J. Phys. Chem., 87 (1983) 3740.
12 G. Van der Laan, C. Westra, C. Haas and G. A. Sawatzky, Phys. Rev. B, 23 (1981) 4369.
13 M. S. Stranick, M. Houalla and D. M. Hercules, J. Catal., 106 (1987) 362.
14 N. S. McIntyre and M. G. Cook, Anal. Chem., 47 (1975) 2210.
15 Z. Zsoldos and L. Guczi, J. Phys. Chem., 96 (1992) 9393.
16 P. Mills and J. L. Sullivan, J. Phys. D, 16 (1983) 723.
17 T. Fujii, F. M. F. de Groot, G. A. Sawatzky, F. C. Voogt, T. Hibma and K. Okada, Phys.
Rev. B, 59 (1999) 3195.
18 J. J. Yeh and I. Lindau, At. Data Nucl. Data Tables; 32 (1985) 1.
19 L. H. Tjeng, C. T. Chen, J. Ghijsen, P. Rudolf and F. Sette, Phys. Rev. Lett., 67 (1991) 501.
20 T. Mathew, N. R. Shiju, K. Sreekumar, B. S. Rao and C. S. Gopinath, J. Catal., 210 (2002)
405.
21 L. A. Chick, L. R. Pederson, G. D. Maupin, J. L. Bates, L. E. Thomas and G. J. Exarhos,
Mater. Lett., 10 (1990) 6.
Chapter 4: Characterization of Spent Catalysts and Co-Cu Synergism
174
22 T. Kotanigawa, M. Yamamoto, K. Shimokawa and Y. Yoshida, Bull. Chem. Soc. Japan., 44
(1971) 1961.
23 J. P. Jacobs, A. Maltha, J. R. H. Reintjes, T. Drimal, V. Ponec and H. H. Brogersma, J.
Catal., 147 (1994) 294.
24 C. S. Narasimhan and C. S. Swamy, Appl. Catal., 2 (1982) 315.
25 M. Guisnet, in: Handbook of Heterogeneous Catalysis, eds: G. Ertl, H. Knözinger and J.
Weitkamp, VCH, Weinheim, Vol. 2 (1997) p. 626.
26 G. Fierro, M. L. Jacono, M. Inversi, R. Dragone and P. Porta, Topics in Catal., 10 (2000) 39.
27 A. J. Marchi, J. I. Di Cosino and C. R. Apesteguia, Catal. Today, 15 (1992) 383.
28 G. Fornasari, A. D. Huysser, L. Mintcher, F. Trifiro and A. Vaccari, J. Catal., 135 (1992)
386.
29 C. Cabet, A. C. Roger, A. Kiennemann, S. Läkamp and G. Pourrow, J. Catal., 173 (1998) 64.
30 E. Iglesia, Appl. Catal. A, 161 (1997) 59; and references therein.
31 A. J. Dekker, “Solid State Physics”, Prentice Hall, UK, 1981.
32 S. Velu, K. Suzuki and C. S. Gopinath, J. Phys. Chem. B, (In press, 2002).
33 K. D. Jung and A. T. Bell, J. Catal., 193 (2000) 207.
34 V. L. J. Joly, P. A. Joy, S. K. Date and C. S. Gopinath, J. Phys. Condens. Matt., 13 (2001)
649.
35 T. Mathew, N. R. Shiju, B. B. Tope, S. G. Hegde, B. S. Rao and C. S. Gopinath, Phys.
Chem. Chem. Phys., 4 (2002) 4260.

Chapter 5: Summary and Conclusions
175
The various conclusions drawn based on the work are summarized in this chapter.
Chapter 1 presents a general introduction to catalysis and various types of
catalysts. It mainly describes the published literature on the structure, preparation and
catalytic aspects of spinels with special emphasize on ferrites. The acid-base properties, an
important aspect of heterogeneous catalysis, and its origin on oxide surfaces are discussed
briefly in this chapter. It presents the use of various alkyl phenols and the importance of
phenol methylation. Various catalysts reported for phenol methylation are discussed. The
necessity of developing a catalyst system for phenol methylation and why ferrites based on
Cu and Co are employed for this are described. The necessity of using XPS being a
surface science technique in catalysis is described.
Chapter 2 describes the procedure for the synthesis of various compositions of the
Cu1-xCoxFe2O4 (x = 0, 0.25, 0.50, 0.75 and 1) were prepared by co-precipitation method
and characterized by XRD, XRF, SEM, surface area (by N2 sorption), IR and TG-DTA.
Theory and experimental procedure for each technique are described briefly under the
respective technique. Theory and experimental procedure employed for other techniques
such as Mössbauer, XPS, TG-DTA, TPR and TPD are also discussed in this section. The
experimental set up for gaseous phase reaction is mentioned in this secton.
X-ray diffraction of fresh catalysts revealed the formation of spinel phase along with a
mixture of CuO and α-Fe2O3 phases at x = 0.0, while trace amount of α-Fe2O3 for x≥0.25. IR
spectra of calcined samples reveal that the metal ions distributed in two different
environments in spinel at 710 cm-1 (ν1) and 460 cm-1 (ν2), attributed to tetrahedral (Td) and
octahedral (Oh) coordinated metal-oxygen bands respectively. Scanning electron
micrograms of calcined samples showed particles of size in the range 1-6 µm, which
confirm the crystalline nature of the material.
The acid-base properties of the system is evaluated by using different probe
molecules and is discussed in detail. The IR spectra of ferrospinel reveals Fe3+ and Co2+
ions are mainly responsible for various hydroxy groups on the surface. The IR adsorption
of pyridine is carried out to evaluate the acidiy of the system. Temperature dependent IR
studies of pyridine adsorbed spinels and on deliberately added metal oxide to the spinel
phase exemplifies the contribution of metal ions and its coordination state towards Lewis
Chapter 5: Summary and Conclusions
176
acidity. IR studies of spinel surface adsorbed with CO2 and adsorption studies of electron
acceptors such as 7,7,8,8-tetracyanoquinodimethane, 2,3,5,6-tetrachloro-1-4-benzoquinone
and p-dinitrobenzene are carried out to evaluate the nature of basic sites and the strength
and distribution of electron donor sites present on the spinel surface. It is found that acidity
(basicity) of the Cu1-xCoxFe2O4 spinel system increases (decreases) from x = 0 to 1.
Chapter 3 is divided into two parts. Section I presents the catalytic activity data
of phenol alkylation in the vapour phase over Cu1-xCoxFe2O4. Among various alkylation
reactions, methylation of phenol is studied extensively. Kinetic and catalysis aspects of
phenol methylation is discussed in this section. The optimization of phenol methylation is
carried out by varying reaction parameters such as temperature, methanol/phenol mole
ratio, space velocity and influence of water in the feed mixture. Phenol methylation gives
two major products namely o-cresol and 2,6-xylenol. Large phenol conversion and 2,6-xylenol
production is observed at 3500C and x = 0.5 shows good catalytic performance. Increase in
selectivity of 2,6-xylenol at the expense of o-cresol demonstrates the phenol methylation is
sequential.
Phenol alkylation is also carried out by employing various alkylating agents such as
DMC, ethanol, isopropanol and isobutene. Alkylation of phenol with DMC results both C-
and O- alkylated products. Reaction of phenol with ethanol provides ortho ethylated 2-
ethyl phenol (EtPhOH) as major product over Cu1-xCoxFe2O4. Kinetic parameters
calculated from Arrhenius analysis for phenol ethylation are in good agreement with
experimental results that intermediate compositions exhibit relatively low activation
energy (Ea) towards phenol conversion than end compositions. Compensation effect
observed between frequency factor and Ea suggests the ethylation reaction mechanism
remains the same at all x values. Reaction of phenol with isopropanol (iPrOH) provides
ortho alkylated product, viz., 2-isopropyl phenol as major product over the Cu1-xCoxFe2O4
catalyst system. The main products of t-butylation of phenol with isobutene as alkylating
agent are 2-tertiary butyl phenol (2-TBP), 4-tertiary butyl phenol (4-TBP) and 2,4-di
tertiary butyl phenol (2,4-DTBP), of which 2-TBP predominates over the others.
It has been found that influence of Cu+Co composition is a decisive factor towards
PhOH conversion and is evident from the comparatively large PhOH conversion at
Chapter 5: Summary and Conclusions
177
intermediate compositions (0<x<1) compared to end compositions (x = 0 and 1) for any
type of phenol alkylation. Irrespective of the alkylating agent, x = 0.5 composition shows
maximum PhOH conversion at all temperatures studied.
Section II describes the mechanistic aspects of phenol methylation over the
surfaces of Cu1-xCoxFe2O4. FTIR adsorption of reactants and products of phenol
methylation were carried out over Cu1-xCoxFe2O4 to understand the mechanism of phenol
methylation. The spectra obtained from the chemisorption of methanol onto Cu1-
xCoxFe2O4 at ≤1000C are composed of the superimposed spectra of surface methoxy and
formate groups. Methoxy formation on the surface of these oxides is most likely due to
dissociative chemisorption. IR adsorption of phenol on Cu1-xCoxFe2O4 shows signals of
both undissociated phenol and phenolate like species. Phenolate species are formed due to
the dissociative adsorption of phenol on an acid-base pair site. Phenolate ion is adsorbed
on metal cation (Lewis acid site) whereas the dissociated H adsorbs as a H+ on a nearby O
atom. It is found that methylation of phenol is initiated by the protonation of methanol with
the aid of a Lewis acid base pair. Probably the protonation of methanol occurs on the
oxides by accepting protons released from the adsorbed phenol and the protonated
methanol attacks at the ortho position of phenol to form the ortho methylated products.
Thus the active center for the ortho methylation is an acid-base pair site.
Chapter 4 is divided into two parts. Section I describes the characterization of
spent catalysts to understand the various aspects of physicochemical changes that occur
both in bulk and on surfaces of all the compositions of the system Cu1-xCoxFe2O4 due to
phenol methylation. XRD, TG-DTA, DRIFT IR, surface area, TPR and TPD, Mössbauer
and XPS were carried out for this purpose and the results were discussed in detail in this
section.
Though kinetic studies of phenol alkylation using various alcohols and or alkene is
carried out over Cu1-xCoxFe2O4, special emphasize for characterizing the spent sample has
taken mostly for phenol methylation and ethylation. XRD of the spent catalysts displayed
better crystallinity hints the integrity of the structure. Various structural changes have been
observed due to exposure of the fresh catalysts to the reaction mixture. Namely, phase
separation to Cu2O and magnetite in x= 0 and 0.25 samples, various extents of reduction
Chapter 5: Summary and Conclusions
178
(decreasing monotonously with the copper content, and resulting in partial reduction and
redistribution of iron in tetrahedral (A) and octahedral [B] sites) and formation of
carbonaceous deposits are detected. The catalyst performance is correlated with the
discussed three structural changes, viz. with the occasional phase segregation, with the
partial reduction of metal ions, including the appearance of Fe2+/3+ ions in various
proportions in the [B] sites, and with the formation of carbonaceous deposits.
The occasional phase segregation is mostly revealed in Cu-rich (x= 0, and 0.25)
samples. Stable magnetite formation is observed, and separate Cu2O (and, after reduction,
metallic copper) regions appear. The copper phase opens path for reduction in the
neighboring regions in further stages of reaction. The reaction conditions, optimized for
production of 2,6-xylenol, were extensively reducing. Thus, iron ions located in the
octahedral [B] sites became reduced to the Fe2+/3+ state. During reaction the ratios of
Fe3+(A) to Fe2+/3+[B] were also changed, and incorporation of Cu and Co to the [B] sites
had also taken place. Thus, strength and distribution of Lewis centers, necessary for
reaction were also modified.
The carbonaceous layer formed is the trace of the progress of reaction: it is strongly
correlated with the appearance and extent of the catalytic activity. It can be suggested that
in the catalytically most active Cu-rich x= 0.25 and 0.5 samples the Lewis centers are
prevailing, the carbonaceous deposit contains hydrogen, and the carbon is rather reactive in
this layer. In the Co-rich x= 0.75 sample the deposit is less abundant in hydrogen, the
carbon present is more dense, e.g. less reactive.
X-ray photoelectron spectroscopy and x-ray induced Auger electron spectroscopy
revealed the presence of Cu2+, Fe3+, Co2+ and Co3+ species on fresh catalysts. Metal ions got
reduced partially to lower oxidation states on spent catalysts. Reducibility of Cu2+ species
decreases with increasing x. Valence band photoemission studies demonstrated a clear increase
in the overlap between 3d bands of Cu, Co and Fe from fresh to spent catalysts.
Irrespective of the alkylating agent, composition x = 0.50 shows maximum activity
in terms of phenol conversion and corresponding ortho alkyl selectivity. Hence the
analysis of the spent for various phenol alkylations are restricted only to x = 0.50
composition. However only XRD and XPS has chosen to examine the changes in surface
Chapter 5: Summary and Conclusions
179
and the oxidation states of various metal ions for different alkylations. XRD of spent
catalysts resulted from various phenol alkylations displays all characteristics reflections and
ascertain the integrity of the spinel structure. Presence of small amount of metallic Cu, Fe
and FexCy phases are observed on all the spent except for butylation. The intensity of
metallic Cu and Fe peaks varies as the alkylating agent changes. XPS analysis of the spent
catalyst of composition x = 0.50 obtained from various phenol alkylations revealed that
reduction of Fe3+, Co3+ and Cu2+ ions have occurred and the extent of reduction depends on the
alkylating agent.
Various features and conclusions arrived due to the characterization of spent
catalysts were discussed in Section II. The importance of Cu-Co synergism that plays a
major role in the efficient dimethylation of phenol to 2,6-xylenol is discussed in this
section. The better catalytic results observed with x = 0.5 is attributed to an optimum
distribution of Cu-species with heteroatom neighbors on the surface and the maximum overlap
between the Cu and Co 3d bands makes the ferrospinel integrated chemically and
electronically. Low phenol conversion and 2,6-xylenol selectivity at x = 1, changes very
significantly and favorably by the addition of Cu at x = 0.75 and 0.5 clearly demonstrates the
prime importance of Cu in phenol adsorption and combined effect of Cu+Co for 2,6-xylenol
selectivity in this system. It is the latter factor known as Cu-Co synergism that plays a major
role in the phenol methylation reaction. Cu-Co synergism in the present ferrospinel
environment also to perform methanol reforming to produce H2 as well as hydrogenation of
carbon species under methylation. The observed shift in the Fe 3d levels also suggests that Fe
is not a silent spectator and involves in the electronic structure of the catalyst, at least at all
intermediate compositions.
Different phenol alkylations are compared in this section. With regard to the
alkylating ability of the alcohols studied, the total conversion of the phenol follows the
order: methanol ≈ DMC > ethanol > isopropanol ≈ isobutene. An important difference
between methylation and higher alkylation is the reluctance of the latter to form exclusive
alkylated products at ortho position. Spent catalysts of composition x = 0.50 obtained
from various phenol alkylations show high surface Cu/Fe ratio and segregation of Cu on
the surface. Very low Cu/Fe ratio observed on propylation and butylation spent catalysts
Chapter 5: Summary and Conclusions
180
show low and decreasing catalytic activity with reaction time. This clearly hints that Cu2+
is the species that enhances the alkylation activity largely and there is a sizeable
redistribution of the cations on the catalyst surface during reaction conditions.
Main observations from XPS in combination with the desired reaction pattern
suggest overlap of ‘3d’ orbitals of all the three metal ions in the valence level is very much
essential for high activity towards phenol alkylation. This is evidenced from the VB
photoemission spectra of the spent x = 0.50 composition, where it has been found that the
VB spectra of the spent catalyst is narrowed down due to better overlap in comparison with
the fresh. A correlation between acidity, basicity and catalytic performance reveals that an
intermediate acid-base character enhances the phenol methylation activity.
Recommended

![Savitribai Phule Pune University - [SPPU] , Pune, Maharashtra](https://img.pdfslide.net/doc/110x75/631876443394f2252e02b615/savitribai-phule-pune-university-sppu-pune-maharashtra.jpg)


