
CREMA Gellertstrasse 24 CH - 4052 Basel www.crema-research.ch
CREMA
Center for Research in Economics, Management and the Arts
Valuing Public Goods:
The Life Satisfaction Approach
Bruno S. Frey
Simon Luechinger
Alois Stutzer
Working Paper No. 2004 - 11

Valuing Public Goods: The LifeSatisfaction Approach
Bruno S. Frey, Simon Luechinger and Alois Stutzer*
University of Zurich
March 8, 2004
Abstract: This paper discusses a novel approach to elicit people’s preferences for
public goods, namely the life satisfaction approach. Reported subjective well-being
data are used to directly evaluate utility consequences of public goods. The strengths
of this approach are compared to traditional approaches and identification issues are
addressed. Moreover, it is applied to estimate utility losses caused by terrorist
activities in France, the UK and the Republic of Ireland. Terrorism in these countries
depresses life satisfaction in a sizeable and robust way. However, the calculation of
the trade-off between terrorism and income requires improved measurement of the
marginal utility of income. (100 words)
JEL classification: D61, D74, H41, H56, I31
Keywords: life satisfaction approach, non-market valuation, cost-benefit analysis, subjective
well-being, and terrorism
* University of Zurich, Institute for Empirical Research in Economics, Bluemlisalpstr. 10, CH-8006 Zurich,Switzerland. The first and third authors are also affiliated with CREMA – Center for Research in Economics,Management and the Arts. Phone +41 1 634 37 28, fax +41 1 634 49 07, e-mail [email protected],[email protected], [email protected]. We are grateful to Ed Glaeser, Lorenz Goette, Stephan Meierand Dina Pomeranz for helpful comments and to Rosemary Brown for improving the English.

Valuing Public Goods: The Life Satisfaction Approach
1 Introduction
How valuable are national security and law enforcement, clean air and scenic beauties or theprotection of the cultural heritage to individuals? More generally, the question is howindividuals value different public or publicly provided goods. It is commonplace thatindividuals have no incentive to disclose their true demand for non-excludable goods; it isadvantageous to understate demand when it positively affects contribution requirements andto overstate demand otherwise. Therefore, some economists are very pessimistic as to whetherit is possible to assess people’s preferences for public goods: “[T]he very essence of thepublic goods problem is that there is no way these preferences can be determined” (Due andFriedlaender 1973, p. 53; emphasis added).
In contrast to this negative view, a vast literature exists, reflecting extensive research andconsiderable progress in valuing public goods in monetary terms. Essentially, two avenueshave been pursued: revealed preference methods on the one hand and stated preferencemethods on the other hand. The former are based on actual behavior and utilizecomplementary and substitutive relationships between public and various marketed goods toinfer the value attributed to public goods from market transactions in private goods. Examplesare the hedonic market approach, the travel cost approach and the averting or mitigatingbehavior method, to name just the most prominent ones. In the case of stated preferencemethods, individuals are directly asked to value the public good in question; the mostprevalent method is contingent valuation. Both avenues have their weaknesses. Revealedpreference methods are based on stringent assumptions, crucial elements are inherentlydifficult to measure and non-use values cannot be captured. The hypothetical nature ofcontingent valuation surveys, on the other hand, may entail unreliable results and strategicbehavior.
The life satisfaction approach presented in this paper constitutes a novel and potentiallyeffective approach. It correlates the degree of public goods or public bads with individuals’reported subjective well-being and evaluates them directly in terms of life satisfaction, as wellas relative to the effect of income. This approach obviates some of the major difficultiesinherent in both the revealed preference and stated preference methods. As it is not based onobserved behavior, the underlying assumptions are less restrictive and non-use values can – tosome extent – be measured. Furthermore, individuals are not asked to value the public gooddirectly, but to evaluate their general subjective well-being, life satisfaction or happiness. Thisis presumably a cognitively less demanding task, does not evoke answers considered desirableby the persons asked, and there is no reason to expect strategic behavior.
3
A growing literature in economics uses data on reported subjective well-being andinvestigates the determinants of happiness at the individual level (e.g. socio-demographicfactors, income and employment status) and at the societal level (e.g. unemployment rate,inflation, inequality and democratic institutions). Reported subjective well-being can serve asan empirically adequate and valid approximation for individual utility. Hence, it is an obviousand straightforward strategy to directly evaluate public goods in utility terms. By measuringthe marginal utility of a public good or the marginal disutility of a public bad, as well as themarginal utility of income, the trade-off ratio between income and the public good can becalculated.
This paper has two major objectives. Firstly, we want to make the life satisfaction approachmore widely known and discuss some conceptual issues (section 2). Secondly, we apply it toterrorism, a topic that gained notoriety in recent years and is likely to be high on the politicalagenda for many years to come (section 3).1 Security, or the absence of terrorism, is afundamental public good and one of the primary justifications of the existence of the state.However, its provision competes with other public goods, and agents want to know itsvaluation relative to private goods and other public services. When the costs imposed onpeople by terrorist activities are known, the government can be expected to make betterdecisions on how many resources should be mustered to deal with terrorism. This holds evenif the government is not viewed as a social-welfare maximizing agent, but is rather seen to actin a setting characterized by political competition. The utility losses caused by terroristactivities are estimated for France, Ireland and the United Kingdom. France is the WesternEuropean country with the highest number of recorded international terrorist incidents in thelast quarter of the 20th century. Similarly, the terrorist conflict in Northern Ireland, the so-called ‘Troubles’, affected not only Northern Ireland but also Great Britain and the Republicof Ireland. We are able to show that individuals living in a region prone to terrorist activitiessuffer considerable utility losses. The calculation of the trade-off between terrorism andincome, however, requires an improved measurement of the marginal utility of income.Section 4 offers concluding remarks.
2 The Life Satisfaction Approach to Value Public Goods
2.1 The Basic Concept
Influenced by the positivistic movement in philosophy, standard economics is based on an“objectivistic” position. Individual utility is inferred from actual behavior and subjectivistexperience as captured by surveys is rejected as being not objectively observable andtherefore “unscientific”. The axiomatic approach holds that the choices made by individuals 1 For an overview and further references on the economics of terrorism, see e.g. Enders and Sandler (1995); Freyand Luechinger (2003); Sandler and Enders (2004).
4
provide all the information required to infer the utility of outcomes. However, this positionrestricts the questions that can be addressed. It is, for example, not possible to discriminatebetween competing theories that predict the same patterns in behavior, but differ in what theyput forward as people’s utility level (Frey and Stutzer 2003). Moreover, conceptions aboutindividuals’ preferences or utility functions remain vague and the valuation of public goods ishampered (Arrow 1958, pp. 8-9; Schelling 1968, pp. 143-144). Revealed preference cannot beapplied in all cases of interest and non-use values leave no behavioral trace. It is, therefore, noaccident that non-market valuation is a field in economics where surveys have been widelyused.
The recent development of happiness research in economics poses a new challenge to theobjectivistic position (for surveys see Frey and Stutzer 2002a, b; Layard 2004).2 Due toextensive work by numerous psychologists spanning many decades, the measurement ofutility has made great progress. The subjective approach to utility accounts for the greatvariety of individuals’ ideas about happiness and the good life and recognizes that observedbehavior is an incomplete indicator for individual well-being. Following the economictradition of relying on the judgment of the persons directly involved, people are considered tobe the best judges of the overall quality of their life. With the help of representative surveys, itis possible to get indications of individuals’ evaluation of their life satisfaction. It can becaptured with single-item or multi-item questions; a prominent example of the former is theEuro-Barometer Survey Series asking: “On the whole, are you very satisfied, fairly satisfied,not very satisfied, or not at all satisfied with the life you lead?” People evaluate their level ofsubjective well-being with regard to circumstances and comparisons to other persons, pastexperience and expectations of the future. Therefore, behind the score indicated by arespondent lies a cognitive assessment to what extent their overall quality of life is judged in afavorable way (Veenhoven 1993). The measures of reported subjective well-being are thuspromising empirical approximations to individual utility.
Measures of reported subjective well-being passed a series of validation exercises, revealingthat people reporting high subjective well-being are more often smiling during socialinteractions and are less likely to commit suicide. Changes in brain activity and heart rateaccount for substantial variance in reported negative affect. Reliability studies found thatreported subjective well-being is fairly stable and sensitive to changing life circumstances(see Frey and Stutzer 2002b for references). However, in order to conduct welfarecomparisons on the basis of reported subjective well-being, further conditions have to be met.Well-being must be cardinal and interpersonally comparable. Economists are likely to beskeptical about both claims. However, evidence has been accumulated that both of them maybe less of a problem on a practical level than on a theoretical level (e.g. Kahneman 1999;
2 The empirical study of happiness used to be the province of psychology; recent surveys are Diener et al. (1999)and Kahneman et al. (1999a).

5
Ferrer-i-Carbonell and Frijters 2004). Happy people, for example, are rated as happy byfriends and family members (e.g. Sandvik et al. 1993), as well as by spouses. Furthermore,ordinal and cardinal treatments of satisfaction scores generate quantitatively very similarresults in micro-econometric happiness functions (Frey and Stutzer 2002a). Happinessresearch in economics has indeed come up with important and challenging findings, e.g.about the psychic costs of unemployment, the relativity in utility judgments from income orthe trade-off between unemployment and inflation.
Basically, there are two different ways to analyze the determinants of life satisfaction. Firstly,an indirect utility function with income and other arguments of a representative individual canbe studied. In the empirical analysis, a micro-econometric happiness function is estimated, inwhich an individual’s utility is approximated by reported subjective well-being. Explanatoryvariables are his/her (household) income and a vector of socio-demographic and socio-economic characteristics, as well as societal, economic and institutional conditions theindividual is faced with. Secondly, aggregate data can be analyzed. Usually, simple cross-country analyses are conducted, with the average happiness levels as the dependent variable,and economic, social and institutional indicators as explanatory variables.
Reported subjective well-being data can be used to assess individuals’ preferences for publicgoods or externalities. The public good or the externality faced by an individual is included asan additional argument in the indirect utility function, or as an additional explanatory variablein the micro-econometric happiness function, respectively. Similarly, the quantity of publicgoods provided, or the prevalent levels of externalities in different countries, can be includedin cross-country analyses with aggregate data. The estimated coefficients can be interpreted asmarginal utilities of the public goods or the marginal disutilities of the public bads. Togetherwith estimates for the marginal utility of income, the marginal rate of substitution betweenincome and the public good can be calculated. Because the indifference curve over incomeand the public good is estimated directly, both relevant welfare measures, the equivalentsurplus and the compensating surplus, can be computed even for inframarginal changes in theprovision of the public good, without the need of auxiliary assumptions.
In the case of decreasing marginal utility of income and/or decreasing marginal utility ofpublic good consumption, the willingness-to-pay or willingness-to-accept of different incomeclasses and/or different base levels of the public good provision can be estimated.Furthermore, heterogeneity of preferences across income classes (or other subgroups of thepopulation) with regard to the public good can be captured with interaction terms. Both theexact functional form of the utility curves and preference heterogeneity across predefinedsubgroups of the population are ultimately empirical questions that can be addressed usinglife satisfaction data.
The life satisfaction approach can be used to value a wide range of different public goods andbads, negative and positive externalities. Hitherto, the approach was exclusively used to value

6
externalities in the environmental realm. Van Praag and Baarsma (2001) were the first authorsto use life satisfaction data explicitly for the evaluation of externalities. They analyze theeffect of noise nuisance in the area of the Amsterdam Airport using individual data. Becausesubjective well-being is influenced by perceived rather than objective noise levels, andbecause the former depends not only on the latter, but also on a number of interveningvariables, like the presence of noise insulation and individual characteristics, the estimatedcompensations vary considerably for different groups of persons. Cross-country analyses areconducted by Welsch (2002) and Rehdanz and Maddison (2003). Welsch (2002) identifies anegative effect of urban air pollution (more precisely the amount of nitrogen dioxide) onaverage life satisfaction that translates into considerable monetary values of improved airquality. Rehdanz and Maddison (2003) investigate the relationship between happiness andclimate, and calculate the necessary change in GDP per capita to hold happiness at its currentlevels in the face of predicted climate changes.
2.2 Comparison with Alternative Approaches
The life satisfaction approach has several advantages over the most prominent revealedpreference methods and stated preference methods.
Stated preference methods: contingent valuation. In a contingent valuation survey,respondents are asked to value a specific public good.3 This is often an unfamiliar situationand gives rise to problems of strategic responses. Therefore, the credibility, validity andreliability of results based on contingent valuation are the subject of heated controversy ineconomics.
Skepticism is largely based on the empirically observed “embedding effect” (Kahneman andKnetsch 1992) that refers to several interrelated regularities in contingent valuation surveys.Firstly, in some studies, the willingness-to-pay is almost independent of the quantity of thepublic good provided (insensitivity to scale and scope). Further, if multiple goods are valuedin one survey, the willingness-to pay for a particular public good often depends on its positionin the sequence (sequencing effect). Finally, the sum of willingness-to-pay for individualchanges separately exceeds the willingness-to-pay for a composite change in a group ofpublic goods (sub-additivity effect). Critics see the “embedding effect” as evidence for thenon-existence of individual preferences for the public good; individuals receive a “warmglow” from expressing support for good causes and, accordingly, the survey process createsthe values it seeks to reveal (e.g. Diamond and Hausman 1994). However, meta-analyses findsignificant sensitivity to scale and scope (e.g. Smith and Osborne 1996) and, according toproponents, the sequencing and the sub-additivity effect can be explained in terms ofsubstitution effects and diminishing marginal rates of substitution (e.g. Hanemann 1994;
3 See Carson et al. (2003) for an elaborate and state-of-the-art contingent valuation study; they estimateindividuals’ willingness to pay to prevent another Exxon Valdez type oil spill.

7
Carson et al. 2001). A number of guidelines have been developed to assure credibility,validity and reliability. The most important are the presentation of adequate information, thechoice of a credible (hypothetical) payment mechanism and the use of the referendum format,the only elicitation format that is – at least under certain circumstances – incentive-compatible(Arrow et al. 1993; Portney 1994).
Nevertheless, the basic problem of the contingent valuation method remains. Due to thehypothetical nature of the questions asked and the unfamiliarity of the task, one cannotexclude that respondents fail to consider the effect of their budget constraints and substitutes.Symbolic valuation in the form of attitude expression and superficial answers are likely to bethe result (Kahneman et al. 1999b). Similarly, the problem of strategic behavior can onlybeaddressed to a limited extent. The life satisfaction approach is not affected by either of theseproblems. It does not rely on respondents’ ability to consider all relevant consequences of achange in the provision of a public good. It suffices if they state their own life satisfactionwith some degree of precision. This considerably reduces the “informational andcomputational burden” on the subjects (Di Tella et al. 2002, p. 9). Moreover, there is noreason to expect strategic behavior.
Revealed preference methods. This other group of non-market valuation techniques is basedon the idea that, when choosing between different bundles of public and private goods,individuals make a trade-off, revealing something about the value they place on these goods.Under specific circumstances, this enables inferences to be made about individuals’willingness-to-pay for the public good from market transactions in the private good. In thefollowing, the (i) hedonic market approach, (ii) the travel cost approach, (iii) the avertingbehavior method and their respective weaknesses are compared to the life satisfactionapproach employed here.
(i) Revealed preference methods: hedonic market approach. If individuals derive utility froma local public good, they prefer to live in regions with a high provision of this good and,hence, bid up housing rents and bid down wages in these regions. The public good is aqualitative characteristic of the differentiated market good housing and of jobs; the housingand labor market thus function as markets for the public good. Wage and rent differentialsserve as implicit prices and correspond, in equilibrium, to the individuals’ marginalwillingness-to-pay for the public good (e.g. Rosen 1974).4 Here lies a first and fundamentalproblem of the hedonic market approach: the approach is based on the assumption thathousing and labor markets are in full equilibrium. This assumption is justified only whenhouseholds have a very high degree of information, when there is a sufficiently wide varietyof houses and jobs, when prices adjust rapidly, when transaction and moving costs are low, as 4 Exemplary contributions are Blomquist et al. (1988) and Chay and Greenstone (2001). The former estimatecompensations for intraurban and interregional differences in amenities in the labor and housing market, thelatter investigate the effect of air pollution and successfully address the identification issues hedonic marketstudies are normally plagued with.

8
well as when there are no market restrictions (Freeman 2003, p. 366). In contrast, the lifesatisfaction approach explicitly captures utility losses in the absence of market equilibria.Compensating variation in other markets, however, has to be accounted for in cross-sectionanalyses. If they are not, the life satisfaction approach captures only the residual externality(Van Praag and Baarsma 2001, p.15-16; see also discussion in section 2.3). In this case, thelife satisfaction approach and the hedonic market approach complement each other. Anotherdrawback of the hedonic market approach is the need to account for adjustments people arelikely to make in response to changes in the level of an externality, as well as reactions of thesupply side of the hedonic market.
(ii) Revealed preference methods: travel cost approach. Whereas in the hedonic marketapproach people are assumed to relocate with regard to regional differences in public goods,the travel cost approach rests on the premise that location decisions are driven by otherfactors. Instead, individuals spend time and money traveling to and consuming publiclyprovided goods, like cultural institutions and recreational sites.5 Under certain circumstances,individuals’ willingness-to-pay can be inferred from these expenditures (Clawson andKnetsch 1966; for advanced models see e.g. Freeman 2003; Parsons 2003).6 Hence, the travelcost approach, in contrast to the life satisfaction approach, is only applicable if theconsumption of the publicly provided good entails costs. In addition, the shadow price of timeis critical to the evaluation of the public good, but inherently difficult to observe (Randall1994).
(iii) Revealed preference methods: defense expenditure approach. The defense expenditureapproach relies on the fact that private expenditures for security measures may serve as asubstitute for public security measures. Similarly, in order to mitigate adverse consequencesof an exposure to a public bad, various strategies that incur expenditures are open to anindividual. A decrease in this exposure or, alternatively, an increase in public securitymeasures, leads to a decline in private defense expenditures, which in turn reflectsindividuals’ evaluation of the public good or bad. The approach depends on the assumption ofperfect substitutability between a public or a publicly provided good and private goods (seee.g. Zeckhauser and Fisher 1976).7 While a substitutive relationship is often plausible, perfectsubstitutes represent a special case that is unlikely to prevail in many policy areas of interest(Pommerehne 1987, p. 25). Averting behavior should also not affect utility directly, neitherpositively nor negatively. Moreover, the perceived cost and risk reduction capability of aparticular averting behavior are of utmost importance, but hardly measurable. People’sperception of the degree of substitutability between public and private goods, risk reduction 5 It is a central but equivocal assumption of the travel cost approach that travel serves no other purpose than theconsumption of the public good and in itself provides no utility or disutility.6 For an application of the travel cost model, see e.g. Hausman et al. (1995). They estimate utility losses due tothe Exxon Valdez oil spill like Carson et al. (2003), who use contingent valuation surveys. The effect estimatedwith contingent valuation is more than 700 times higher than the one estimated with the travel cost approach.7 A recent contribution is e.g. Bresnahan et al. (1997).

9
capability of averting behavior, as well as the costs and direct utility consequences thereof, allinfluence their reactions to the exposure to a public bad and are reflected in their utility level.The life satisfaction approach measures the utility losses caused by the public bad, as well asthe defense expenditures directly, and can therefore be applied without any knowledge ofpeople’s reactions.
A problem common to all methods based on revealed preference is that consumption andrelocation decisions are based on perceived rather than objective (dis-)amenity levels; in casepeople’s perceptions and objective measures do not correspond sufficiently, the estimates maybe severely biased. The same caveat applies, to some extent, to the life satisfaction approach.However, in contrast to revealed preference methods, the life satisfaction approach capturesindirect effects of externalities on individuals’ utility through effects on health and the like,even if there are no direct effects. For example, whereas noise nuisance affects utility directlyand results in corresponding defense expenditures or relocation decisions, exposure to nuclearradiation can damage health through a process unnoticed by the people, but whichnevertheless lowers life satisfaction. In this case, utility losses cannot be measured usingrevealed preference methods, as there is no behavioral trace. For the same reason, revealedpreference methods cannot assess non-use values like the existence and bequest value. In thisregard, the life satisfaction approach is superior, though it is not able to capture pure existencevalues (or pure public goods more generally) as discussed below. In addition, behavioralresearch has shown that there exists a distinction between two notions of utility: experiencedutility on the one hand and decision utility on the other hand. The experienced utility of anoutcome encompasses the hedonic experience of that outcome, while the decision utility is theweight an individual assigns to that outcome in a decision (Kahneman 1994). As Rabin (1998,p. 33) points out, “[t]he realization that decision and experienced utility may be systematicallydifferent cuts to the core […] of our methods of research, requiring us to formulate ways ofinferring and eliciting preferences that go beyond a method of ‘revealed preference’ method[…] through such methods as self reports of satisfaction.” In other words, if experiencedutility and decision utility systematically differ, decisions in markets for private goods do notaccurately reveal people’s hedonic experiences from the consumption of public goods.
2.3 Identification of Utility Changes
As the preceding discussion suggests, there are a number of ingenious approaches to valuingpublic goods. They are, however, plagued with a number of problems, which hamper orprevent their application to specific goods of interest. The life satisfaction approach obviatesseveral of these problems; its application instead of, or complementary to, the traditionalapproaches therefore seems promising. In the following, we explore the requirements anddiscuss some identification issues of the life satisfaction approach.

10
Omitted variables. The life satisfaction approach, like the revealed preference methods, is notimmune to possible spurious correlations that are the result of omitted variables. If differencesin self-reported life satisfaction are explained by cross-sectional differences in the publicgood, the estimates may be severely biased due to unobserved factors that covary with lifesatisfaction and the public good. For concreteness consider terrorism. Imagine that people interrorism-prone regions report on average a lower life satisfaction than their counterparts inpeaceful areas. Obviously, the regions differ from each other in various ways other than thelevel of terrorist activities which are likely to influence the life satisfaction of its residents.
There are two ways of addressing this problem, though it cannot be completely resolved.8
Firstly, the use of data with panel structure allows for the control of time-invariant region-specific differences in life satisfaction, as well as area-independent temporal variations. Still,there may be time-variant regional effects that are correlated with happiness and the variableof concern, be it causal or not. Unemployment among young men and a general lack ofopportunities during an economic downturn could, for example, further the recruitment interrorist groups and simultaneously depress life satisfaction in the affected regions. Anotherkey issue, therefore, is to control for potentially collinear variables. However, the lack ofadequate indicators often limits this procedure. Government reactions to terrorist activities,like curfews and curtailing of civil liberties, are likely to entail utility losses, but are difficultto operationalize.
Compensating variation. According to the premise of the hedonic market approach,individuals (without firm-specific investments and land ownership) exposed to a public bad ornegative externalities are compensated in private markets, above all in the labor and housingmarket. Similarly, public goods are thought to be bought in these hedonic markets. Thiscompensating variation has therefore a countervailing effect on life satisfaction. Inequilibrium, it is predicted that all public goods and public bads are capitalized in land (orrents) and wages and, consequently, life satisfaction is equalized across regions. However,this does not mean that the positive (negative) effect of a public good (bad) would not affectresidents’ well-being. It is just that a positive (negative) effect is equally distributed amongthem. Having said this, one has to take into consideration that, in reality, various restrictions,as well as moving and transaction costs, are likely to prevent complete arbitrage/equalization.Moreover, landowners (and employees with firm-specific investments) only have a costly exitoption from locations that are negatively affected by a public bad or an externality. Theseresidual effects are still captured in reports of subjective well-being studied across regions(see also Van Praag and Baarsma 2001). However, the life satisfaction approach is notrestricted to these residual effects. In fact, it can be applied with any degree of compensation,
8 A third possibility is to instrument the variance of the public good, which is an almost hopeless undertaking inthe case of terrorism.

11
as long as the channels of compensation are accounted for.9 As income, an important channelof compensation, is included in happiness functions anyway, it is mainly rent differentials thatcould have an offsetting impact. The life satisfaction approach is applied to the best advantagewhen there is no, or only little, compensation. In these situations, the hedonic marketapproach breaks down. In contrast, the life satisfaction approach works well. Compensation ismost likely to be minor when annual intra- and interregional fluctuations are studied ratherthan variation across regions or countries. Empirically, this is possible in panel analyses as,e.g. conducted in our application in section 3.
Geographical extension. A critical element of the analysis is the choice of the spatial units orregions across which changes in life satisfaction caused by externalities are identified or, inother words, the determination of the geographical boundaries of the externality of interest.10
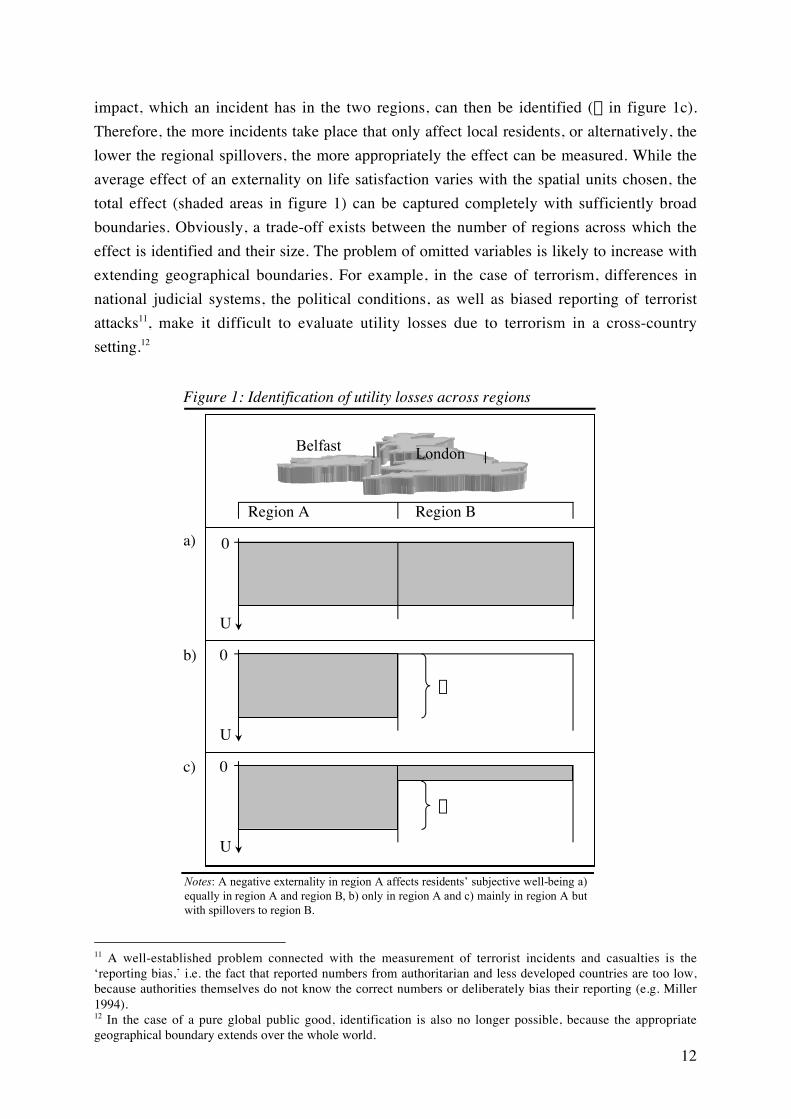
For some externalities, the boundaries are obvious and the spatial choice does not pose anyfurther problem. Noise nuisance, for example, though it might be perceived differently indifferent places and by different people, can be objectively measured and located. This is alsotrue for other externalities that are of a technological kind, in particular externalities in theenvironmental realm. Likewise, in the case of publicly provided goods, politically definedboundaries are often the appropriate choice. For social externalities, like externalities ofeducation, cultural amenities, crime or terrorism, it is far more difficult to draw boundaries.Terrorism, for example, is explicitly “designed to have far-reaching psychologicalrepercussions beyond the immediate victim or target” (Hoffman 1998; see also Wilkinson2000, p. 12, among others). In this case, one has to ask whether the climate of fear is confinedto a legally or geographically defined region and where, if at all, empathy for the victimsends? This is a serious problem, as the estimated effects crucially depend on the spatial unitschosen. Figure 1 illustrates this aspect. Suppose, for example, a bomb explodes in thecrowded business district of a small Northern Irish town and kills a large number of civilians.This terrorist incidence can affect people’s well-being in very different ways: for example, itcan be taken as an indication of a new wave of terrorist attacks all over the British Isles andthe atrocity shocks people everywhere to the same extent. In that case, it is quite likely thatlife satisfaction is depressed everywhere in Great Britain (or region B in figure 1) and inNorthern Ireland (region A) to the same extent. This situation is depicted in figure 1a. Theeffect of the incident on individuals’ well-being then cannot be identified across these tworegions. If, on the other hand, only people in Northern Ireland are affected by an incidenttaking place in Northern Ireland and no spillovers occur (figure 1b), the average decrease inlife satisfaction due to terrorism can be fully identified (it amounts to a in figure 1b). In manycases, reality is characterized by an intermediate case, whereby individuals living in region Bare also affected, but to a lesser degree (as in figure 1c). Only the difference from the average
9 Similarly, marginal implicit prices are underestimated in hedonic market analyses, which do not makeallowances for simultaneous compensation in different markets (Blomquist et al. 1988; Freeman 2003, p. 410).10 An equivalent problem is the choice of adequate time units in panel analyses.
12
impact, which an incident has in the two regions, can then be identified (b in figure 1c).Therefore, the more incidents take place that only affect local residents, or alternatively, thelower the regional spillovers, the more appropriately the effect can be measured. While theaverage effect of an externality on life satisfaction varies with the spatial units chosen, thetotal effect (shaded areas in figure 1) can be captured completely with sufficiently broadboundaries. Obviously, a trade-off exists between the number of regions across which theeffect is identified and their size. The problem of omitted variables is likely to increase withextending geographical boundaries. For example, in the case of terrorism, differences innational judicial systems, the political conditions, as well as biased reporting of terroristattacks11, make it difficult to evaluate utility losses due to terrorism in a cross-countrysetting.12
11 A well-established problem connected with the measurement of terrorist incidents and casualties is the‘reporting bias,’ i.e. the fact that reported numbers from authoritarian and less developed countries are too low,because authorities themselves do not know the correct numbers or deliberately bias their reporting (e.g. Miller1994).12 In the case of a pure global public good, identification is also no longer possible, because the appropriategeographical boundary extends over the whole world.
Belfast London
Region A Region B
a
b
0
0
0
U
U
U
a)
b)
c)
Figure 1: Identification of utility losses across regions
Notes: A negative externality in region A affects residents’ subjective well-being a)equally in region A and region B, b) only in region A and c) mainly in region A butwith spillovers to region B.

13
The discussion makes clear that knowledge of the actual situation and accurate definition ofthe regions across which the utility loss is identified are essential. In the empirical part, wesplit the countries into three regions, namely the region including the capital, particularlyterrorism-prone regions and the rest of the country. Many incidents in our data are clearlyconfined to the capital: Paris and London were plagued by attacks on foreign ambassadors,other diplomats and government officials, as well as headquarters or domestic branches offirms. Similarly, many incidents are clearly confined to a specific region because a regionalterrorist group restricts its activities to its home region. Most of the attacks of the Front deLibération Nationale de la Corse (FLNC), for example, are perpetrated in Corsica rather thanin continental France. Likewise, the Ulster Volunteer Force (UVF), its splinter group theLoyalist Volunteer Force (LVF) and the Ulster Defence Association (UDA), limit theiractivity largely to Northern Ireland. Hence, we identify utility losses in a combined cross-section and time-series analysis, whereby the cross-sectional units in the case of France arethe regions Ile-de-France (which includes Paris), Provence-Alpes-Côte d’Azur (whichincludes Corsica in the Euro-Barometer Surveys Series) and the rest of France, NorthernIreland, Greater London and the rest of Great Britain in the case of the United Kingdom, andGreat Britain, Northern Ireland and the Republic of Ireland in the case of the Northern Ireland‘Troubles’.
3 Effects of Terrorism on Life Satisfaction
In the following, we use the life satisfaction approach to measure utility losses due toterrorism. The fundamental reason for the existence of the state is to overcome the brutish andwelfare-decreasing fight of everyone against everyone. One of the basic elements of anyconstitutional consensus is therefore to grant government the unique right to use force.Terrorists deliberately undermine this consensus by using force on other people. Thus, it is aconstitutional task of the government to deal with terrorism. This, of course, involves publicspending. It is therefore necessary to know the costs imposed on people by terrorist activities.Only then can the government decide what resources should be mustered to deal withterrorism. This holds even if the government is not viewed as a social-welfare maximizingagent, but is rather seen to act in a setting characterized by political competition, mostimportantly the need to stay in power.
3.1 Data
Our main variables are people’s self-reported life satisfaction and income, as well as variousindicators of terrorism. The former are taken from the Euro-Barometer Survey Series (1970-1999), which interviews a random cross-section sample of Europeans each year. The variable
14
life satisfaction is the categorical response to the following question: “On the whole, are youvery satisfied [4], fairly satisfied [3], not very satisfied [2], or not at all satisfied [1] with thelife you lead?” The question was asked in the years between 1973 and 1998, with theexception of the years 1974 and 1996. The observations are assigned to the regions of interest,according to the respondents’ place of residence. However, all observations from south-eastFrance in 1987 and 1990 are excluded because they cannot be split up between the regionsProvence-Alpes-Côte d’Azur and the ‘Rest of France.’ Similarly, observations from the year1973 are not included in the estimations for the British Isles, because the Northern Irish sub-sample is included in the sample of Great Britain.
The Euro-Barometer Survey Series also contains information concerning the income situationof the respondents; concretely, they are classified into between 6 and 15 classes of householdincome. The class size and number of classes varies considerably between countries andsurveys. Therefore, we translate the original income class information into a number, whichrepresents the value at the mid-point of the respective class interval. The values are deflatedby consumer price indices and converted into Euros (using the irrevocable exchange ratesfixed at the end of 1998 in the case of France and Ireland, and the 1998 Pound-Euro exchangerate in the case of the United Kingdom). Because the highest income class is open-ended,respondents that fall into this income class are excluded. This exclusion results in smallerestimated coefficients for income and hence larger compensations compared to the fullsample. In order to capture the effect of household size on equivalence income, the squareroot of household size is included in the estimation equations. Further, a set of personalcharacteristics is incorporated, including sex, age, education, number of children, maritalstatus, employment status and type of community the respondent lives in. We include onlyobservations where the respondent’s age and sex are known and the respondent is over 14years old. This leads to a total of 136,909 observations, namely 40,803 observations for GreatBritain, 12,387 for Northern Ireland, 40,488 for the Republic of Ireland and 43,231 forFrance, respectively.13
In order to capture the intensity of the terrorist activity in different regions and years, we usetwo different terrorism indicators: the number of reported incidents in France and the UnitedKingdom and the number of persons killed in the Republic of Ireland and the UnitedKingdom due to the Northern Ireland conflict.
The first indicator is constructed on the basis of the RAND-St. Andrews Chronology ofInternational Terrorism, comprehending the years 1968 to 1996 (see e.g. Hoffman andHoffman 1995; made publicly available by the Oklahoma City National Memorial Institute
13 Life satisfaction data for the countries of interest are available for 153,426 observations; 856 observations areexcluded because either respondents’ age or sex are unknown or his/her age is below 14 years. The omission ofthe year 1973 in the case of the British Isles and the observations from south-east France in the years 1987 and1990 further reduces the number of observations by 3,247. Finally, 12,414 observations are excluded due to thefact that respondents belong to the highest income class.

15
for the Prevention of Terrorism on its homepage (www.mipt.org)) and the Terror AttackDatabase of the International Institute for Counter-Terrorism (www.ict.org.il) for the years1986 up to the present day. Every reported incident contains a short description with – in themajority of cases – the exact location of the incident. This allows us to assign the incident to aparticular region (only 16 incidents cannot be attributed to a region in the case of the UnitedKingdom and five in the case of France). Both databases are restricted to internationalterrorism. However, international terrorism is broadly defined and includes attacks byCorsican and Northern Irish separatist groups in France and Great Britain, as well as attacksby domestic terrorist groups whenever foreigners are involved. In France, for example,several attacks are recorded for which the Action Directe (AD) claimed credit, especially inthe mid 1980s when the AD tried to ally themselves with the German Rote Armee Fraktion(RAF). But also many state-sponsored terrorist activities took place on French territory. Anexample is the murder of the former Iranian Prime Minister Shapour Bakhtiar in Paris in 1991by a hit-squad which, according to the French investigating judge was carried out under thedirect orders of the Iranian regime (Wilkinson 2000, p. 66). Furthermore, France was plaguedwith the spillover of Basque terrorism into France, the spillover of activities by the GroupeIslamic Armée (GIA) and other incidents related to the Middle East. A large fraction ofreported incidents in Great Britain were committed by the Provisional Republican Army(PIRA) and to a lesser extent by the Irish National Liberation Army (INLA). The first ofmany sporadic, but mostly spectacular, PIRA attacks was a bomb attack in London in March1973, resulting in one death and almost 200 injured. As with France, the United Kingdom wasafflicted by the spillover of Middle East terrorism. Figure 2 depicts the number of incidents inFrance and the United Kingdom; while the number of attacks in France is slightly on thedecrease, no clear trend is visible in the United Kingdom.
Rest of France ParisProvence-Alpes-Côte d’Azur
Mean 4.29 15.63 3.91Std. Dev. 3.95 14.03 4.23Min 0 0 0Max 18 66 17
Rest ofGreat Britain London Northern Ireland
Mean 3.35 11.57 0.61Std. Dev. 3.43 7.58 1.03Min 0 0 0Max 11 30 4
0
10
20
30
40
50
60
70
1973
1974
1975
1976
1977
1978
1979
1980
1981
1982
1983
1984
1985
1986
1987
1988
1989
1990
1991
1992
1993
1994
1995
1996
1997
1998
0
5
10
15
20
25
30
35
1975
1976
1977
1978
1979
1980
1981
1982
1983
1984
1985
1986
1987
1988
1989
1990
1991
1992
1993
1994
1995
1996
1997
1998
Figure 2: Number of incidents in France, 1973-1998, and the United Kingdom, 1975-1998

16
The ‘Troubles’ in Northern Ireland, especially the violence in Northern Ireland itself, are onlypartly captured by the number of international terrorism incidents. As an alternative indicator,we therefore use the number of deaths resulting from the conflict in Northern Ireland. Theinformation regarding the deaths is compiled by Sutton (1994; an updated index is providedby the Conflict Archive on the Internet (www.cain.ulst.ac.uk)). This indicator is not restrictedto terrorism in particular, but includes political violence in general. Though the PIRA wasalways the highest taker of life, killing civilians, security forces and prison staff, the UDA andUVF were also very active; the interaction between these groups is generally referred to assectarian ‘tit-for-tat’ exchanges (McKittrick and McVea 2001, p. 109-110). Feuds betweenthe Provisional and Official IRA in 1975 and between the UDA and UVF in 2000, as well ashunger strikes on the part of imprisoned IRA members in 1981, added to the death toll. On theother hand, a considerable number died at the hand of security forces. British paratrooperskilled 14 demonstrators on the Bloody Sunday of 1972, British intelligence played a part inthe Dublin and Monaghan bombing in 1974, and the army’s undercover SAS regiment stagedambushes in which IRA members – and innocent bystanders – were shot, to name but a fewexamples.
As can be seen from figure 3, the number of deaths in Northern Ireland plummeted in 1977but otherwise remained high for the whole period under consideration. This corresponds tothe observations of McKittrick and McVea (2001, p. 133) that 1977 “was a true turning-pointin that violence fell dramatically, and would never again rise to the scale experienced in the1971-76 period.”
3.2 Empirical Strategy
Based on the described data sets, micro-econometric happiness functions are specified.Individual
†
life satisfactionitr , i.e. the life satisfaction of individual
†
i living in region r a ttime t , is explained by differences in the level of
†
terrorismtr across regions and over time, theindividual’s household
†
incomeitr other personal characteristics
†
Z itr , as well as region and time
Great Britain NorthernIreland
Republic ofIreland
Mean 2.91 90.57 2.67Std. Dev. 3.68 60.77 2.79Min 0 9 0Max 11 287 9
0
50
100
150
200
250
300
350
1975
1976
1977
1978
1979
1980
1981
1982
1983
1984
1985
1986
1987
1988
1989
1990
1991
1992
1993
1994
1995
1996
1997
1998
Figure 3: Number of victims of the Northern Ireland conflict, 1975-1998

17
fixed effects rD and tD , respectively. The specification is summarized in the followingequation:
(1)
†
Life satisfactionitr = b0 + b1terrorismtr + b2 ln(incomeitr) + b3 Z itr + b4Dt + b5Dr + eitr .
Throughout the paper, we use a robust estimator of variance, because random disturbances arepotentially correlated within groups or clusters, here cross-sectional units fora specific year.14
We tested specifications with different functional forms because there is no a priori reason tofavor one specific functional relationship between terrorism and life satisfaction over another.In particular, we studied the sensitivity of the results, using two-year and three-year movingaverages, the natural logarithm, the natural logarithm of the aforementioned moving averagesof the terrorism indicators, and these indicators squared, as well as incidents and fatality rates.As the results15 were robust with regard to sign, magnitude and statistical significance, weused the explanatory variables in the simplest form, i.e. the number of incidents and thenumber of fatalities. Various functional forms are also possible for the variable income.Diminishing marginal utility of income was affirmed by a significant negative effect ofincome squared on life satisfaction for all countries and periods considered. Hence, householdincome is included in the estimations in its natural logarithm. Finally, no heterogeneity ofpreferences across income classes with regard to terrorism seems to exist. The respectiveinteraction terms were not statistically significantly different from zero and are, therefore, notincluded in the following estimations.
3.3 Results
Basic results. The main results for the variables capturing terrorism and income are presentedin table 1. The full micro-econometric life satisfaction functions estimated for France, theUnited Kingdom, and the United Kingdom and Ireland are shown in the appendix in tableA.1. The estimated coefficients for the control-variables are comparable to earlier findings(see e.g. Di Tella et al. 2001 for results based on the Euro-Barometer Survey Series).
As can be seen from table 1, terrorism negatively affects people’s self-reported lifesatisfaction in a sizeable and statistically significant way. In France, an increase in onestandard deviation in the number of recorded terrorist incidents, i.e. an increase of 10.324incidents, lowers life satisfaction by 0.029 points on the four-point scale. For the UnitedKingdom, with a standard deviation of 7.360 incidents, the respective figure is 0.050 points;and for the United Kingdom and the Republic of Ireland, with a standard deviation of 53.670fatalities, it is 0.041. These are large effects, indicating that a reduction of the terrorist threatby one standard deviation is equivalent to shifting 2.9 percent of the French population (or 5.0
14 Ignoring the clustering in the estimation model is likely to produce downward biased standard errors, due tothe effects of aggregate variables on individual data (Moulton 1990). To get unbiased standard errors for theaggregate variable
†
terrorismitr , the regions in a specific year are used as sampling units.15 They are available from the authors on request.

18
of the British / 4.1 of the Irish population) from, for example not very satisfied [2] to fairlysatisfied [3] with life. These effects in terms of life satisfaction offer one way of valuing apublic bad with the life satisfaction approach. They could now be compared with estimatesfor other public goods or bads. For a valuation in monetary terms, estimates for the marginalutility of income have to be taken into consideration. Table 1 includes the respectiveestimations. Coefficients for (household) income are positive and highly statisticallysignificant. The partial correlation between log income and life satisfaction for France is0.218. Thus, when income is doubled, on average, a 0.151 points higher life satisfaction isreported.
Table 1. Terrorism and life satisfaction in France, the United Kingdom and the Republic ofIreland; summary
Dependent Variable
France
1973-1998
United Kingdom
1975-1998
U.K. and Ireland
1975-1998
Life satisfaction Coefficient t-value Coefficient t-value Coefficient t-value
Terrorism indicators
Number of incidents (in 10s) -0.028** -4.03 -0.068** -3.25
Number of fatalities (in 100s) -0.077** -4.00
Income
ln(income) 0.218** 17.22 0.144** 16.66 0.128** 17.57
Individual characteristics Yes Yes Yes
Year dummies Yes Yes Yes
Region dummies Yes Yes Yes
Constant Yes Yes Yes
Number of observations 43,231 53,190 93,678
Number of clusters 70 69 69
Prob > F 0.000 0.000 0.000
R2 adj. 0.07 0.07 0.08
Notes: (1) Least squares estimations; (2) standard errors are adjusted for clustering within regions per year; (3) ** is significant atthe 99 percent level, * at the 95 percent level, and (*) at the 90 percent level.
Source: Euro-Barometer Survey Series, 1970-1999, RAND-St. Andrews Chronology of International Terrorism, 1968-2000,provided by the Oklahoma City National Memorial Institute for the Prevention of Terrorism (www.mipt.org), Terror AttackDatabase of the International Institute for Counter-Terrorism (www.ict.org.il), Sutton (1994) and an updated version of the Suttonindex provided by CAIN Web Service (www.cain.ulst.ac.uk).
Sensitivity analyses. To check the validity of the results, two tests of robustness areperformed: (i) the influence of high values of the indicators reflecting the intensity of

19
terrorism is analyzed; and (ii) macro-variables capturing the economic situation are includedin order to address issues of simultaneity.
(i) In 1982, an unprecedented number of 66 terrorist attacks took place in Paris, a numbernever again reached in subsequent years (see figure 2). Similarly, in Northern Ireland,recorded fatalities in the years 1975 and 1976 by far outnumbered the fatalities of subsequentyears (see figure 3). In order to investigate whether the negative correlation between terrorismand life satisfaction is largely driven by these observations, we exclude them from theestimation. It is debatable whether this exclusion is reasonable. If people perceive largechanges in the intensity of terrorist campaigns rather than small ones, the inclusion of theseextreme values is crucial for the identification of the effect terrorism has on life satisfaction.Nevertheless, the robustness of the coefficients with regard to the exclusion of high valuesenhances the reliance on the validity of the estimates. In both cases, the magnitude of therespective coefficients increases, while the statistical significance decreases if the outliers areexcluded. Without the observation of the year 1982 for the region “Ile-de-France”, theestimated coefficient for France is -0.005 per 10 incidents (compared to -0.028 in table 1); thet-value decreases from -4.03 to -3.55 and hence the probability that the true coefficient is zeroincreases from 0.0 percent to 0.1 percent. The picture is somewhat different in the case of theestimations for the Northern Ireland conflict: though the magnitude of the estimatedcoefficient is robust, the t-value decreases from -4.00 to -1.11, and the probability that the truecoefficient is zero increases from 0.0 percent to 27.2 percent. This latter result indicates thatin fact the aforementioned turning point in violence helps to identify the negative effect of theNorthern Ireland conflict on individuals’ well-being.
(ii) One might expect the negative correlation between terrorism and life satisfaction to bespurious because the state of the economy may be (negatively) correlated with the intensity ofterrorist campaigns. If a high level of terrorist activity is generally accompanied by aslackening of the economy, people may report lower life satisfaction because of fearing jobreductions rather than terrorist attacks. Such a negative relationship between economic andterroristic activity is probable and can be due to two different causal processes. On the onehand, bad economic conditions and high levels of unemployment may facilitate therecruitment of rank and file activists. On the other hand, terrorism may dampen economicactivity. McKittrick and McVea (2001, p. 28) presume the first causal relationship forNorthern Ireland when writing that “[i]t is scarcely a coincidence that some of the areas whichfeatured prominently in the troubles […] were among those where […] high unemploymentpersisted.” However, systematic evidence for the Middle East does not indicate a causalconnection from poverty to terrorism (Krueger and Maleckova 2003). The other causalconnection is better documented. Over the last few years, economic scholars have analyzedthe effects terrorist acts have on various parts of the economy. Empirical research has shownthat terrorist acts significantly reduce the number of tourists (see Enders and Sandler 1991 forSpain; Enders et al. 1992 for Greece, Italy and Austria; and Drakos and Kutan 2003 forGreece, Turkey and Israel), lower the inflow of foreign direct investment (see Enders andSandler 1996 for Spain and Greece), decrease bilateral trade (Nitsch and Schumacher 2002),

20
have significant negative impact on aggregate consumption and savings (see Fielding 2003for Israel) as well as gross domestic income and stock prices (see Abadie and Gardeazabal2003 for the Basque Country). In order to control for the simultaneity between high levels ofpolitical violence and the slackening of the economy, we include GDP per capita (in ¤1,000)and the number of unemployed per capita as additional explanatory variables in the micro-econometric happiness function for the United Kingdom, as well as for the United Kingdomand the Republic of Ireland. Table 2 shows the estimation results.
Table 2. Terrorism and life satisfaction in the United Kingdom and theRepublic of Ireland; including macro variables
Dependent Variable
United Kingdom
1975-1998
U.K. and Ireland
1975-1998
Life satisfaction Coefficient t-value Coefficient t-value
Terrorism indicators
Number of incidents (in 10s) -0.059** -2.89
Number of fatalities (in 100s) -0.093** -4.25
Income
ln(income) 0.144** 16.63 0.126** 17.64
Macro Variables
GDP per capita (in €1,000) -0.028** -2.08 0.019** 2.11
Unemployed per capita -0.995 -0.77 -0.028 -0.03
Individual characteristics Yes Yes
Year dummies Yes Yes
Region dummies Yes Yes
Constant Yes Yes
Number of observations 53,190 93,678
Number of clusters 69 69
Prob > F 0.000 0.000
R2 adj. 0.07 0.08
Notes: (1) Least squares estimations; (2) standard errors are adjusted for clustering within regions peryear; (3) ** is significant at the 99 percent level, * at the 95 percent level, and (*) at the 90 percentlevel.
Source: Euro-Barometer Survey Series, 1970-1999, Office for National Statistics, UK, OECD, MainEconomic Indicators, RAND-St. Andrews Chronology of International Terrorism, 1968-2000,provided by the Oklahoma City National Memorial Institute for the Prevention of Terrorism(www.mipt.org), Terror Attack Database of the International Institute for Counter-Terrorism(www.ict.org.il), Sutton (1994) and an updated version of the Sutton index provided by CAIN WebService (www.cain.ulst.ac.uk).

21
Coefficients for both indicators of terrorism remain of similar magnitude and statisticalsignificance when business cycle effects are controlled for. The results for the controlvariables are much less clear-cut. GDP per capita is statistically significantly correlated withlife satisfaction but, in the case of the United Kingdom, it has an unexpected negative sign.16
Prevailing unemployment levels have a sizeable negative effect on life satisfaction, though itis not statistically significant. However, it is important to note that individuals’ income andemployment status are held constant. Though other omitted variables could possibly exist, therobustness of the terrorism indicators enhances our confidence that the estimated correlationsare not spurious.
Monetization. With the estimated coefficients of the micro-econometric happiness functionfor terrorism (
†
b1) and income ( 2b ), the people’s willingness-to-pay for a reduction interrorism can be calculated. The willingness-to-pay is measured by the compensating surplus( CS ). The CS is the decrease in income necessary to hold utility constant. In other words,the CS is the solution to the following expression:
(2)
†
v(income0;terrorism0) = v(income0 - CS;terrorism1) ,
where
†
v(⋅) is the indirect utility function,
†
income0 the initial household income, 0terrorism
the initial level of terrorism and 1terrorism the level after a hypothetical reduction. Accordingto the specification of the micro-econometric happiness function expressed in equation (1)and the definition of the CS in equation (2), the CS can be computed as follows:
(3) 2
02101 )ln()(
0b
bb incometerrorismterrorism
eincomeCS⋅+-⋅
-= .
Estimates are presented for people living in particular terrorism-prone regions. Specifically,we calculate the hypothetical willingness-to-pay for residents of Paris and London for areduction in the number of incidents to bring them on a par with the rest of France (except forthe region Provence-Alpes-Côte d’Azur) and the rest of Great Britain respectively, as well asfor the residents of Northern Ireland for a reduction in the number of fatalities to be on a parwith Great Britain and the Republic of Ireland. All CSs are calculated for an individual withthe average annual household income. The results are shown in table 3.
16 While the result is likely to be a statistical artefact, Ruhm (2000) provides systematic evidence for a negativecorrelation between economic upturns and individuals’ health.

22
Table 3. Compensating surplus for a reduction in terrorismFrance
1973-1998
United Kingdom
1975-1998
U.K. and Ireland
1975-1998
Average annual household income ¤18,419 ¤17,409 ¤15,585Reduction of terrorism 11.33 incidents 8.22 incidents 87.78 fatalitiesCompensating surplus (CS) ¤2,521 ¤5,587 ¤6,375CS in percent of income approx. 14% approx. 32% approx. 41%Notes: CS is calculated for residents of Paris and London for a reduction in the number of incidents compared to the rest ofFrance (except the region Provence-Alpes-Côte d’Azur) and the rest of Great Britain, and for the residents of NorthernIreland for a reduction in the number of fatalities compared to Great Britain and the Republic of Ireland.
Source: Own estimates on the basis of the coefficients depicted in table 1.
According to the results shown in table 3, a resident of Paris would be willing to pay around14% of his income for a reduction in terrorist activity to a level that prevails in the morepeaceful parts of the country, while a resident of London would be willing to forego around32% of his income and a resident of Northern Ireland around 41%. These estimates aresurprisingly high. Before a likely source of error is discussed that distorts estimated CSsupwards, the estimates have to be put into perspective.
The result for France, on the one hand, is comparable to the compensations which Blomquistet al. (1988) identified on the labor and housing market in the United States for individualsliving in the county with the highest rate of violent crime vis à vis individuals living in thecounty with the least crime. The compensation amounts to $2,267, or to 11% of annualhousehold income. The result for Northern Ireland, on the other hand, to some extent reflectsthe ferocity of the conflict. The number of fatalities depicted in figure 3 gives a sense of thisferocity. Fay et al. (1999, p. 204) estimate that around two thirds of the Northern Irishpopulation live in households where someone has been injured in a conflict related incident;the number of around 30,000 republican and loyalist ex-prisoners illustrates how deeplysociety was permeated by paramilitarism (McKittrick and McVea 2001, p. 150). In addition,curfews, rigorous house-to-house searches, several thousand people fleeing their homes andlarge-scale riots accompanied the worst times of the conflict. The statements of two seniorpolicemen summarize the situation: “The country stared into the face of great difficulty andcrept right to the edge of the abyss,” and “We were on the brink of all-out civil war” (cited inMcKittrick and McVea 2001, p. 211).
Another reason for a high willingness-to-pay for lower terrorist activity might be people’sdifficulty in assessing terrorism-risks. According to Viscusi and Zeckhauser (2003), peopleare subject to a propensity to predict worst-case scenarios and are prone to anomalies knownfrom other risk perception contexts. Hindsight bias and embeddedness effects are particularly

23
evident for terrorism-risk perception. Downes-Le Guin and Hoffman (1993) contend thatmuch higher probabilities are accorded to terrorism than to other life-threatening acts.Sunstein (2003), on the other hand, finds that individuals focus on the badness of the outcomerather than on the probability that it will occur. The “probability neglect” results in fear thatgreatly exceeds discounted harm. These results suggest that people are far more concernedwith terrorism than with objectively larger risks, and that fear of terrorism might be largelydetermined by the salience of the topic. Intense media coverage of terrorist acts ensures thatterrorism is very present in people’s minds. The high number of fatalities in violent periods ofthe conflict in Northern Ireland, for example, means “that hardly a newspaper or eveningtelevision programme did not bring news of either a killing or a funeral” (McKittrick andMcVea 2001, p. 94), and that “the local television news seemed to consist of nothing exceptmore and more violence, the grieving bereaved, and threats of more to come” (McKittrick andMcVea 2001, p. 194).
Marginal utility of income: source of error and priority for future research. The marginalutility of income is crucial for the calculation of the willingness-to-pay or willingness-to-accept respectively. Hence, if the marginal utility of income is not estimated correctly,estimates of the welfare measures are distorted. There are at least two problems that hamperthe estimation of the marginal utility of income. Firstly, many surveys – and especially theEuro-Barometer Survey Series used here – provide very crude information regarding people’sincome. Measurement errors in the explanatory variable, or in this case household income,bias the estimation coefficient towards zero.17 Estimated welfare measures are therebydistorted upwards. Secondly, research has shown that people adapt to higher income orconsumption levels. While an increase in income initially provides extra pleasure, it is usuallyonly transitory and the higher utility wears off (van Praag 1993; Easterlin 2001; Stutzer2004). In micro-econometric happiness functions, mainly the long-run marginal utility, i.e.marginal utility after adaptation, is captured. Therefore, the utility consequences of changes inincome are underestimated. This, too, biases estimated welfare measures upwards.
Does all this invalidate the life satisfaction approach? On the one hand, more preciseinformation of respondents’ income situation in surveys would clearly enhance the validity ofthe approach. Further, the investigation of utility or life satisfaction consequences ofexogenous income changes is an important area for future research. On the other hand, acomparison of the importance attached by individuals to different public goods is not affectedby an imprecise measurement of the marginal utility of income. If the value of public goods isexpressed in terms of life satisfaction, respective estimates can be directly put in perspectiveto spending on these goods. This already allows for an assessment of the relative efficiency of
17 However, the directions of bias cannot easily be determined a priori in the more general case of more than onepoorly measured explanatory variable. Other potential candidates for poor measurement are our indicators ofterrorist activity: the number of incidents and fatalities. Therefore, we cannot rule out that the estimatedcoefficients for terrorist activity are biased upwards.

24
pubic resource allocation. Thus, the life satisfaction approach is able to reveal importantinformation on people’s preferences for public goods.
4 Concluding Remarks
This paper discusses the life satisfaction approach, a new approach to elicit people’spreferences for public goods. A growing literature in economics uses reported subjectivewell-being data; this research has shown that self-reported life satisfaction is an empiricallyadequate and valid approximation for utility. It is therefore an obvious, but up to now rarelypursued, strategy to evaluate the utility consequences of externalities and public goodsdirectly in utility terms. Moreover, together with estimates for the marginal utility of income,the utility consequences can be monetized. A look at the weaknesses of the most prominentmethods in economics to evaluate public goods highlights the strengths of the life satisfactionapproach. Revealed preference methods, on the one hand, are based on stringent assumptions,crucial elements are inherently difficult to measure and non-use values cannot be captured. Byway of contrast, the life satisfaction approach is not based on observed behavior, and thus theunderlying assumptions are less restrictive and non-use values can – to some extent – bemeasured. On the other hand, the hypothetical nature of contingent valuation may entailunreliable results and strategic behavior. The life satisfaction approach obviates theseproblems, as individuals are not asked to value the public good directly but to evaluate theirgeneral life satisfaction. The respondents’ reported life satisfaction is then correlated with thevariable of interest.
In an exploratory application of the life satisfaction approach, estimates for people’s utilitylosses caused by terrorist activity are presented. The results for France, Great Britain and theRepublic of Ireland demonstrate that terrorist campaigns depress the life satisfaction of theindividuals in the affected regions in a sizeable way. This effect is robust when controlling forpossible simultaneity of terrorism and bad economic conditions. In the case of the NorthernIreland conflict, however, the effect is mainly identified by the turning point in violencebetween the years 1976 and 1977. Smaller changes in the level of political violence in otheryears do not significantly affect life satisfaction. In France, the result is robust with regard tothe exclusion of outliers.
Though the life satisfaction is a promising approach for the valuation of public goods, thepaper addresses several issues that are important for the adequate identification of utilitylosses. Firstly, the life satisfaction approach, like revealed preference methods, is not immuneto possible spurious correlations that are the result of omitted variables. Secondly, peopleaffected by negative externalities are possibly compensated by higher wages and lower rents;these compensations countervail the original utility consequences caused by the externality.The life satisfaction approach is neither restricted to situations where compensation in private

25
markets takes place nor to situations without such compensation. However, in cross-sectionanalyses, potential channels of compensation need to be controlled for. Thirdly, a criticalelement of the analysis is the choice of the cross-sectional units (and time units as well)across which changes in life satisfaction caused by externalities are identified. In case theexternality transcends the boundaries of the units and affects life satisfaction in the adjacentunits, the effect on life satisfaction is underestimated.
The estimated effects of terrorism in terms of life satisfaction are of a reasonable magnitude.For a change in incidents by one standard deviation in France, the effect amounts to oneseventh of being unemployed. Due to probably too low estimates for the marginal utility ofincome, estimated willingness-to-pay for a reduction of terrorism, however, is very high.Estimates range from 15% in France to 41% in Northern Ireland when the most terrorist proneregions are compared to the least terrorist prone regions. These estimates reveal a problemthat needs to be addressed by future research. Marginal utility of income is presumablyunderestimated in micro-econometric happiness functions for at least two reasons. Firstly,whereas micro-econometric happiness functions capture long run marginal utility of income,i.e. marginal utility after adaptation, willingness-to-pay corresponds to marginal utility of achange in income. Secondly, crude measurement of household income in surveys biases theestimated coefficient towards zero. However, a comparison of differences in utilityconsequences, caused by different public goods and bads, is thereby unaffected. Moreover, asthese problems can be addressed, they do not invalidate the life satisfaction approach.
REFERENCES
Abadie, Alberto and Javier Gardeazabal (2003). The Economic Costs of Conflict: A Case Study of the BasqueCountry. American Economic Review 93(1): 113-132.
Arrow, Kenneth J. (1958). Utilities, Attitudes, Choices: A Review Note. Econometrica 26(10): 1-23.
Arrow, Kenneth J., Robert S. Solow, Edward Leamer, Paul Portney, Ray Radner and Howard Schuman (1993).Report of the NOAA-Panel on Contingent Valuation. Federal Register 58(10): 4601-4614.
Blomquist, Glenn C., Mark C. Berger and John P. Hoehn (1988). New Estimates of Quality of Life in UrbanAreas. American Economic Review 78(1): 89-107.
Bresnahan, Brian W., Mark Dickie and Shelby Gerking (1997). Averting Behavior and Urban Air Pollution.Land Economics 73(3): 340-357.
Carson, Richard T., Nicholas E. Flores and Norman F. Meade (2001). Contingent Valuation: Controversies andEvidence. Environmental and Resource Economics 19(2): 173-210.
Carson, Richard T., Robert C. Mitchell, W. Michael Hanemann, Raymond J. Kopp, Stanley Pressers and Paul A.Ruud (2003). Contingent Valuation and Lost Passive Use: Damages from the Exxon Valdez Oil Spill.Environmental and Resource Economics 25(3): 257–286.
Chay, Kenneth Y. and Michael Greenstone (2001). Does Air Quality Matter? Evidence from the HousingMarket. The Center for Labor Economics Working Paper No. 33, University of California, Berkeley.

26
Clawson, Marion and Jack L. Knetsch (1966). Economics of Outdoor Recreation. London and Baltimore: JohnHopkins University Press.
Di Tella, Rafael, Robert J. MacCulloch and Andrew J. Oswald (2001). Preferences over Inflation andUnemployment: Evidence from Surveys of Happiness. American Economic Review 91(1): 335-341.
Di Tella, Rafael, Robert MacCulloch and Richard Layard (2002). Income, Happiness and Inequality as Measuresof Welfare. Mimeo, Harvard Business School.
Diamond, Peter A. and Jerry A. Hausman (1994). Contingent Valuation: Is Some Number Better Than NoNumber? Journal of Economic Perspectives 8(4): 45-64.
Diener, Ed, Eunkook M. Suh, Richard E. Lucas and Heidi L. Smith (1999). Subjective Well-Being: ThreeDecades of Progress. Psychological Bulletin 125(2): 276-302.
Downes-Le Guin, Theodore and Bruce Hoffman (1993). The Impact of Terrorism on Public Opinion, 1988 to1989. Santa Monica, CA: RAND Corporation.
Drakos, Konstantinos and Ali M. Kutan (2003). Regional Effects of Terrorism on Tourism in ThreeMediterranean Countries. Journal of Conflict Resolution 47(5): 621-641.
Due, John F. and Ann F. Friedlaender (1973). Government Finance: Economics of the Public Sector. 5th ed.Homewood: Irwin.
Easterlin, Richard A. (2001). Income and Happiness: Towards an Unified Theory. Economic Journal 111(473):465-484.
Enders, Walter and Todd Sandler (1991). Causality between Transnational Terrorism and Tourism: The Case ofSpain. Terrorism 14(1): 49-58.
Enders, Walter and Todd Sandler (1995). Terrorism: Theory and Applications. In: Keith Hartley and ToddSandler (eds). Handbook of Defense Economics, vol. 1. Amsterdam, New York and Oxford: Elsevier: 213-249.
Enders, Walter and Todd Sandler (1996). Terrorism and Foreign Direct Investment in Spain and Greece. Kyklos49(3): 331-352.
Enders, Walter, Todd Sandler and Gerald F. Parise (1992). An Econometric Analysis of the Impact of Terrorismon Tourism. Kyklos 45(4): 531-554.
Fay, Marie-Therese, Mike Morrissey and Marie Smyth (1999). Northern Ireland's Troubles: The Human Costs.London: Pluto Press.
Ferrer-i-Carbonell, Ada and Paul Frijters (2004). How Important Is Methodology for the Estimates of theDeterminants of Happiness? Economic Journal, forthcoming.
Fielding, David (2003). Counting the Cost of the Intifada: Consumption, Saving and Political Instability inIsrael. Public Choice 116(3-4): 297-312.
Freeman, A. Myrick, III (2003). The Measurement of Environmental and Resource Values: Theory and Methods.Washington, D.C.: Resources for the Future.
Frey, Bruno S. and Simon Luechinger (2003). How to Fight Terrorism: Alternatives to Deterrence. Defence andPeace Economics 14(4): 237-49.
Frey, Bruno S. and Alois Stutzer (2002a). Happiness and Economics: How the Economy and Institutions AffectWell-Being. Princeton and Oxford: Princeton University Press.
Frey, Bruno S. and Alois Stutzer (2002b). What Can Economists Learn from Happiness Research? Journal ofEconomic Literature 40(2): 402-35.

27
Frey, Bruno S. and Alois Stutzer (2003). Testing Theories of Happiness. IEW Working Paper No. 147,University of Zurich.
Hanemann, W. Michael (1994). Valuing the Environment through Contingent Valuation. Journal of EconomicPerspectives 8(4): 19-43.
Hausman, Jerry A., Gregory K. Leonard and Daniel McFadden (1995). A Utility-Consistent, Combined DiscreteChoice and Count Data Model: Assessing Recreational Use Losses Due to Natural Resource Damage.Journal of Public Economics 56(1): 1-30.
Hoffman, Bruce (1998). Inside Terrorism. New York: Columbia University Press.
Hoffman, Bruce and Donna K. Hoffman (1995). The Rand-St. Andrews Chronology of International Terrorism,1994. Terrorism and Political Violence 7(4): 178-229.
Kahneman, Daniel (1994). New Challenges to the Rationality Assumption. Journal of Institutional andTheoretical Economics 150(1): 18-36.
Kahneman, Daniel (1999). Objective Happiness. In: Daniel Kahneman, Ed Diener and Norbert Schwarz (eds).Well Being: The Foundations of Hedonic Psychology. New York, NY: Russell Sage Foundation: 3-25.
Kahneman, Daniel, Ed Diener and Norbert Schwarz (eds) (1999a). Well-Being: The Foundations of HedonicPsychology. New York, NY: Russell Sage Foundation.
Kahneman, Daniel and Jack L. Knetsch (1992). Valuing Public Goods: The Purchase of Moral Satisfaction.Journal of Economics and Management 22(1): 57-70.
Kahneman, Daniel, Ilana Ritov and David A. Schkade (1999b). Economic Preferences or Attitude Expressions?:An Analysis of Dollar Responses to Public Issues. Journal of Risk and Uncertainty 19(1-3): 203-235.
Krueger, Alan B. and Jitka Maleckova (2003). Education, Poverty and Terrorism: Is There a Causal Connection?Journal of Economic Perspectives 17(4): 119-144.
Layard, Richard (2004). Happiness. Mimeo, London School of Economics.
McKittrick, David and David McVea (2001). Making Sense of the Troubles. London: Penguin Books.
Miller, Abraham H. (1994). Comment on Terrorism and Democracy. Terrorism and Political Violence 6(4):435-439.
Moulton, Brent R. (1990). An Illustration of a Pitfall in Estimating the Effects of Aggregate Variables on MicroUnit. Review of Economics and Statistics 72(2): 334-38.
Nitsch, Volker and Dieter Schumacher (2002). Terrorism and Trade. Paper prepared for the workshop on theEconomic Consequences of Global Terrorism, Berlin, June 14 - 15, 2002.
Parsons, George R. (2003). The Travel Cost Model. In: Patricia A. Champ, Kevin J. Boyle and Thomas C.Brown (eds). A Primer on Nonmarket Valuation. Dordrecht, NL: Kluwer Academic Publishers: Ch. 9.
Pommerehne, Werner W. (1987). Präferenzen für öffentliche Güter. Ansätze zu ihrer Erfassung. Tübingen:Mohr (Siebeck).
Portney, Paul R. (1994). The Contingent Valuation Debate: Why Economists Should Care. Journal of EconomicPerspectives 8(4): 3-17.
Rabin, Matthew (1998). Psychology and Economics. Journal of Economic Literature 36(1): 11-46.
Randall, Alan (1994). A Difficulty with the Travel Cost Method. Land Economics 70(1): 88-96.
Rehdanz, Katrin and David Maddison (2003). Climate and Happiness. Research Unit Sustainability and GlobalChange Working Paper No. FNU-20, Centre for Marine and Climate Research, Hamburg University.
Rosen, Sherwin (1974). Hedonic Prices and Implicit Markets: Product Differentiation in Pure Competition.Journal of Political Economy 82(1): 34-55.

28
Ruhm, Christopher J. (2000). Are Recessions Good for Your Health? Quarterly Journal of Economics 115(2):617-650.
Sandler, Todd and Walter Enders (2004). An Economic Perspective on Transnational Terrorism. EuropeanJournal of Political Economy, forthcoming.
Sandvik, Ed, Ed Diener and Larry Seidlitz (1993). Subjective Well-Being: The Convergence and Stability ofSelf-Report and Non-Self-Report Measures. Journal of Personality 61(3): 317-342.
Schelling, Thomas C. (1968). The Life You Save May Be Your Own. In: Samuel!B. Chase (ed.). Problems inPublic Expenditure Analysis. Washington D.C.: The Brookings Institution: 127-176.
Smith, V. Kerry and Laura L. Osborne (1996). Do Contingent Valuation Estimates Pass a "Scope" Test? AMeta-Analysis. Journal of Environmental Economics and Management 31(3): 287-301.
Stutzer, Alois (2004). The Role of Income Aspirations in Individual Happiness. Journal of Economic Behaviorand Organization, forthcoming.
Sunstein, Cass R. (2003). Terrorism and Probability Neglect. Journal of Risk and Uncertainty 26(2-3): 121-136.
Sutton, Malcolm (1994). Bear in Mind These Dead …. An Index of Deaths from the Conflict in Ireland 1969-1993. Belfast: Beyond the Pale Publications.
van Praag, Bernard M. S. (1993). The Relativity of the Welfare Concept. In: Martha Nussbaum and AmartyaSen (eds). The Quality of Life. Oxford, New York, Toronto and Melbourne: Oxford University Press andClarendon Press: 362-385.
Veenhoven, Ruut (1993). Happiness in Nations: Subjective Appreciation of Life in 56 Nations 1946-1992.Rotterdam: Erasmus University Press.
Viscusi, W. Kip and Richard J. Zeckhauser (2003). Sacrificing Civil Liberties to Reduce Terrorism Risks.Journal of Risk and Uncertainty 26(2-3): 99-120.
Welsch, Heinz (2002). Preferences over Prosperity and Pollution: Environmental Valuation Based on HappinessSurveys. Kyklos 55(4): 473-494.
Wilkinson, Paul (2000). Terrorism Versus Democracy: The Liberal State Response. London and Portland, OR:Frank Cass.
Zeckhauser, Richard J. and Anthony C. Fisher (1976). Averting Behavior and External Diseconomies. KennedySchool Discussion Paper No. 41D, Harvard University.

29
Appendix
Table A-1. Terrorism and life satisfaction in France, United Kingdom and Ireland; including controlvariables; part 1
Dependent Variable
France
1973-1998
United Kingdom
1975-1998
U.K. and Ireland
1975-1998
Life satisfaction Coefficient t-value Coefficient t-value Coefficient t-value
Terrorism indicators Number of incidents (in 10s) -0.028** -4.03 -0.068** -3.25
Number of fatalities (in 100s) -0.077** -4.00
Income (household) ln(income) 0.218** 17.22 0.144** 16.66 0.128** 17.42
Size of household1/2 -0.104** -8.48 -0.077** -5.72 -0.047** -4.61
Individual characteristics Male Reference group
Female 0.037** 4.31 0.077** 12.00 0.086** 16.37
Age -0.021** -11.13 -0.013** -10.42 -0.013** -13.09
Age2 0.000** 12.37 0.000** 12.61 0.000** 15.88
Education, up to 15 years Reference group
Education, 16-19 years 0.077** 7.20 0.068** 7.56 0.103** 12.54
Education, 20 years and more 0.206** 15.26 0.152** 11.73 0.187** 14.73
In education 0.191** 9.31 0.116** 4.36 0.169** 5.11
No children Reference group
One child -0.006 -0.45 -0.023 -1.28 -0.022 -1.68
Two children 0.023 1.33 0.000 0.02 -0.014 -0.90
Three children 0.023 0.81 -0.026 -0.99 -0.029 -1.40
Four children and more -0.120* -2.29 0.036 1.44 -0.003 -0.11
Table to be continued.

30
Table A-1. Terrorism and life satisfaction in France, United Kingdom and Ireland; part 2
Dependent Variable
France
1973-1998
United Kingdom
1975-1998
U.K. and Ireland
1975-1998
Life satisfaction Coefficient t-value Coefficient t-value Coefficient t-value
Single Reference group
Married 0.073** 5.45 0.090** 7.40 0.078** 8.08
Living together 0.004 0.28 0.019 0.88 0.009 0.41
Divorced -0.148** -6.69 -0.255** -12.68 -0.252** -14.10
Separated -0.177** -5.36 -0.262** -8.48 -0.322** -12.46
Widowed -0.085** -4.31 -0.110** -5.45 -0.104** -7.38
Employed Reference group
Unemployed -0.202** -8.63 -0.374** -20.16 -0.445** 23.58
Retired 0.165** 9.50 -0.022 -1.64 -0.014 -1.20
Housewife 0.060** 4.72 -0.043** -4.14 -0.045** -5.60
Other occupation 0.164** 5.98 0.070** 3.52 0.038 1.18
Living in a rural area Reference group
Living in a small town -0.066** -5.73 -0.048** -4.29 -0.048** -4.90
Living in a big town -0.089** -7.86 -0.110** -8.94 -0.120** -11.47
Year dummies Yes Yes Yes
Region dummies Yes Yes Yes
Constant 1.307** 6.03 2.012** 16.23 2.140** 20.66
Number of observations 43,231 53,190 93,678
Number of clusters 70 69 69
Prob > F 0.000 0.000 0.000
R2 0.07 0.07 0.08
Notes: (1) Least squares estimations; (2) standard errors are adjusted for clustering within regions per year; (3) ** is significant atthe 99 percent level, * at the 95 percent level, and (*) at the 90 percent level. Results are not shown for dummies indicating thatincome, size of household, education, number of children, marital status, occupational status or size of community are notavailable.
Source: Euro-Barometer Survey Series, 1970-1999, RAND-St. Andrews Chronology of International Terrorism, 1968-2000,provided by the Oklahoma City National Memorial Institute for the Prevention of Terrorism (www.mipt.org), Terror AttackDatabase of the International Institute for Counter-Terrorism (www.ict.org.il), Sutton (1994) and an updated version of the Suttonindex provided by CAIN Web Service (www.cain.ulst.ac.uk).
Recommended


