Louisiana State University Louisiana State University
LSU Digital Commons LSU Digital Commons
LSU Doctoral Dissertations Graduate School
2014
Vocal Fold Analysis From High Speed Videoendoscopic Data Vocal Fold Analysis From High Speed Videoendoscopic Data
Jing Chen Louisiana State University and Agricultural and Mechanical College
Follow this and additional works at: https://digitalcommons.lsu.edu/gradschool_dissertations
Part of the Electrical and Computer Engineering Commons
Recommended Citation Recommended Citation Chen, Jing, "Vocal Fold Analysis From High Speed Videoendoscopic Data" (2014). LSU Doctoral Dissertations. 664. https://digitalcommons.lsu.edu/gradschool_dissertations/664
This Dissertation is brought to you for free and open access by the Graduate School at LSU Digital Commons. It has been accepted for inclusion in LSU Doctoral Dissertations by an authorized graduate school editor of LSU Digital Commons. For more information, please [email protected].
VOCAL FOLD ANALYSIS FROM HIGH SPEED VIDEOENDOSCOPIC DATA
A Dissertation
Submitted to the Graduate Faculty of the Louisiana State University and
Agricultural and Mechanical College in partial fulfillment of the
requirements for the degree of Doctor of Philosophy
in
The Division of Electrical and Computer Engineering
by Jing Chen
B.E., Huazhong University of Science and Technology, 2007 M.E., Huazhong University of Science and Technology, 2010
August 2014

ii
ACKNOWLEDGEMENTS
I would like to dedicate this dissertation to my parents, my husband, and my parents-in-law,
for their continuous support and encouragement throughout my entire life.
This dissertation could not have been completed without the help and support from a lot of
people that I am grateful to. First of all, I would like to thank my advisor, Dr. Bahadir K. Gunturk,
for his guidance and suggestions during my Ph.D. study. I would also like to thank Dr. Melda
Kunduk from Department of Communication Science and Disorders for her suggestions during my
Ph.D. study. All of the works presented in this dissertation came from constant support and discus-
sions with Dr. Gunturk and Dr. Kunduk. I would also like to thank Dr. Ikuma from Department of
Communication Science and Disorders for his invaluable comments on this research. Furthermore, I
want to thank Dr. Jerry Trahan, Dr. Jianhua Chen, and Dr. Sunggook Park (the professors in my
committee) for spending time supervising my dissertation and attending my defense.
I am thankful to the Department of Electrical and Computer Engineering and the Department
of Communication Science and Disorders for providing assistantship throughout my Ph.D. study.
Finally, I would like thank all the friends I met at LSU for making my life here wonderful and
memorable.
iii
TABLE OF CONTENTS
ACKNOWLEDGEMENTS .................................................................................................................ii LIST OF TABLES ............................................................................................................................... v LIST OF FIGURES ............................................................................................................................. vi ABSTRACT………………………………………………………………………………………………… ix CHAPTER 1. INTRODUCTION ........................................................................................................ 1
1.1 Why High Speed Videoendoscopy is Used .............................................................................. 1 1.2 Dissertation Organization ......................................................................................................... 2
CHAPTER 2. GLOTTIS SEGMENTATION USING SIMPLIFIED DYNAMIC PROGRAMMING
……………………………………………………………………………………………. 6 2.1 Motivation ................................................................................................................................ 6 2.2 Glottis Segmentation Based on Vocal Fold Edges ................................................................... 8
2.2.1 Tracking of Posterior and Anterior Endpoints .............................................................. 9 2.2.2 Vocal Fold Edge Detection ......................................................................................... 10 2.2.3 Closed Portion Determination ..................................................................................... 14
2.3 Results and Discussion ........................................................................................................... 16 2.3.1 Endpoints Tracking ..................................................................................................... 16 2.3.2 Effect of the Regularization Term .............................................................................. 17 2.3.3 Glottis Segmentation ................................................................................................... 18
2.4 Conclusions ............................................................................................................................ 20 CHAPTER 3. GLOTTAL AXIS DETERMINATION TECHNIQUES ............................................ 21
3.1 Background ............................................................................................................................ 21 3.2 Methodology .......................................................................................................................... 22
3.2.1 Subject and HSV Data Acquisition ............................................................................. 22 3.2.2 Glottal Axis Determination (GAD) Techniques ......................................................... 22 3.2.3 Features Depending on Glottal Axis ........................................................................... 28
3.3 Analysis .................................................................................................................................. 33 3.3.1 Accuracy Analysis ...................................................................................................... 33 3.3.2 Glottal Axes’ Capability to Differentiate Vocal Fold Vibratory Pattern of Normal and Disordered Voices ...................................................................................................................... 33
3.4 Results .................................................................................................................................... 34 3.4.1 Results on Accuracy Analysis ..................................................................................... 34 3.4.2 Results on Glottal Axes’ Capability to Differentiate Vocal Fold Vibratory Pattern of Normal and Disordered Voices .................................................................................................. 35
3.5 Discussions ............................................................................................................................. 37 3.6 Conclusions ............................................................................................................................ 40
CHAPTER 4. CLASSIFICATION OF VOCAL FOLD VIBRATION IN VOICE DISORDERS
WITH VARYING ETIOLOGY.................................................................................. 42 4.1 Background ............................................................................................................................ 42
iv
4.2 Data ........................................................................................................................................ 44 4.3 Feature Extraction .................................................................................................................. 44 4.4 Feature Evaluation .................................................................................................................. 53 4.5 Classification .......................................................................................................................... 55 4.6 Result and Discussion ............................................................................................................ 56 4.7 Conclusion .............................................................................................................................. 61
CHAPTER 5. SUMMARY AND FUTURE WORK......................................................................... 63
5.1 Summary ................................................................................................................................ 63 5.2 Future Work ........................................................................................................................... 64
REFERENCES …………………………………………………………………………………………... 66 APPENDIX AUTHOR’S PUBLICATIONS ..................................................................................... 72 VITA…………………………………………………………………………………………………………73
v
LIST OF TABLES
Table 2-1. Posterior and anterior endpoints tracking error ................................................................ 17 Table 3-1. Mean square error between the subjective and objective glottal axis determination techniques ........................................................................................................................................... 35 Table 3-2. Two-way ANOVA for normal vocal fold and vocal fold with polyp (pre-surgery) (GAD=glottal axis determination, 𝑆=symmetry, 𝐴𝑙=asymmetry along glottal length, 𝐴𝑎=asymmetry on glottal area, 𝑆𝑣=symmetry in vertical direction, 𝑆ℎ=symmetry in horizontal direction) ............... 36 Table 3-3. MANOVA analysis based on automatic glottal axes (GAD= glottal axis determination, EP=extreme point, REG=linear regression, PCA=principal component analysis, MREG=the modified linear regression, MPCA=the modified PCA, 𝑔𝑚𝑑𝑖𝑠𝑡=group mean distance) .................. 36 Table 4-1. Classification rate for four classification tasks ................................................................. 57 Table 4-2. Classification rate for task 1 by using SVM ..................................................................... 58 Table 4-3. Classification rate of each single feature based on SVM approach .................................. 61

vi
LIST OF FIGURES
Figure 1-1. An HSV frame obtained from the high speed videoendoscopy ........................................ 5 Figure 1-2. Three different types of vocal folds ((a) normal vocal fold vibratory pattern, (b) vibratory pattern of vocal fold with polyp (pre-surgery), (c) vibratory pattern of vocal fold with polyp (post-surgery)) ............................................................................................................................ 5 Figure 2-1. Flow chart of glottis segmentation .................................................................................... 8 Figure 2-2. Posterior and anterior endpoints matching between two successive maximum opening frames. (The size of HSV frame is 256×120, the size of local region is 7×7, the size of search window is 15×15.) .............................................................................................................................. 10 Figure 2-3. Frames within one vibration cycle and their posterior and anterior endpoints. (The first frame is the maximum opening frame.) ............................................................................................. 10 Figure 2-4. Gradient curve of one horizontal line of an image. (𝐼𝑦 is the gradient.) ......................... 11 Figure 2-5. Illustration of obtaining the cumulative minimum energy function ................................ 12 Figure 2-6. Original image (left), its 𝐼𝑦-value (middle) and 𝐸𝑟-value (right). ................................... 13 Figure 2-7. (a) Glottal open and closed segments, (b) segmentation without using CPD, (c) segmentation using CPD. ................................................................................................................... 14 Figure 2-8. (a) Manually selected endpoints at the 500th frame; (b) automatically tracked endpoints at the 500th frame. .............................................................................................................................. 17 Figure 2-9. Glottal edge detection (a) without regularization term; (b) with regularization term, 𝛼=0.001; (c) with regularization term, 𝛼=0.005; (d) with regularization term, 𝛼=0.02. ................... 18 Figure 2-10. L-curve indicating the optimal 𝛼 value. ........................................................................ 18 Figure 2-11. Glottis segmentation using the regularization term with 𝛼=0.02. ................................. 19 Figure 2-12. Comparison of glottis segmentation among (a) the fixed-threshold, (b) the active contour method and (c) the proposed method. ................................................................................... 20 Figure 3-1. Axis determination method-EP ....................................................................................... 24 Figure 3-2. Axis determination method-REG .................................................................................... 25 Figure 3-3. Axis determination method-MREG ................................................................................ 26 Figure 3-4. Axis determination method-PCA .................................................................................... 27
vii
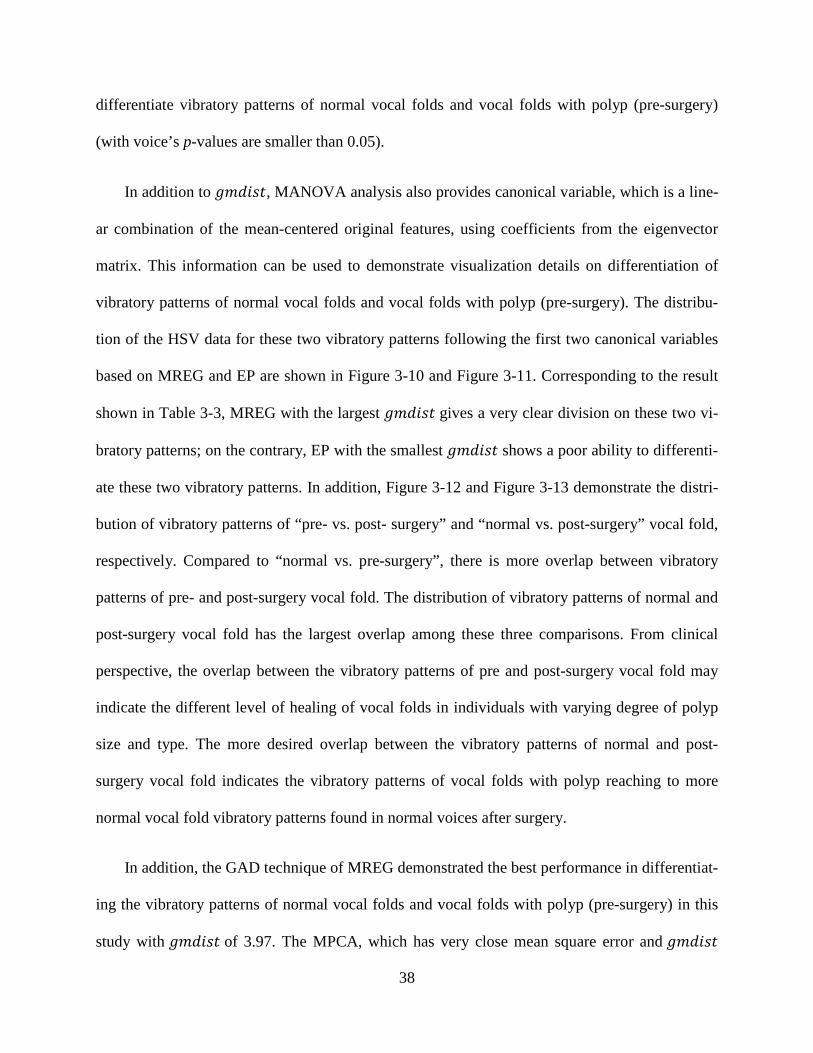
Figure 3-5. Axis determination method-MPCA ................................................................................. 28 Figure 3-6. Spatial transformation (𝑥 and 𝑦 are the original coordinate, 𝑢 and 𝑣 are the transformed coordinates, is the centroid) ............................................................................................................ 29 Figure 3-7. The distances from glottal axis to left and right glottal edge, (a) is the normal vocal fold and (b) is the vocal fold with polyp ( 𝑢=vertical coordinate, −𝑒𝑟(𝑢)=right vocal fold amplitude, 𝑒𝑙(𝑢)=left vocal fold amplitude) ........................................................................................................ 30 Figure 3-8. Asymmetry along the glottal length and asymmetry on glottal area (𝑚𝑐=the length of the part of vocal fold which crosses the glottal axis, 𝑚=the total length of glottal opening, 𝐴𝑐=the area of glottal opening which crosses the glottal axis, 𝐴=the area of glottal opening) ...................... 31 Figure 3-9. Distances from centroid to other four extreme points (𝑙1 and 𝑙2, 𝑙3 and 𝑙4 are the vertical and horizontal distance from centroid to glottal edge) ....................................................................... 32 Figure 3-10. Distribution of normal and pre-surgery data points based on the modified linear regression technique (MREG) (𝑔𝑚𝑑𝑖𝑠𝑡=group mean distance, 𝑐1 and 𝑐2 are the first two canonical variables given by MANOVA) .......................................................................................................... 39 Figure 3-11. Distribution of normal and pre-surgery data points based on the extreme points (EP) (𝑔𝑚𝑑𝑖𝑠𝑡=group mean distance, 𝑐1 and 𝑐2 are the first two canonical variables given by MANOVA)
............................................................................................................................................................ 39 Figure 3-12. Distribution of pre- and post-surgery data points based on the modified linear regression technique (MREG) (𝑔𝑚𝑑𝑖𝑠𝑡=group mean distance, 𝑐1 and 𝑐2 are the first two canonical variables given by MANOVA) .......................................................................................................... 40 Figure 3-13. Distribution of normal and post-surgery data points based on the modified linear regression technique (MREG) (𝑔𝑚𝑑𝑖𝑠𝑡=group mean distance, 𝑐1 and 𝑐2 are the first two canonical variables given by MANOVA) .......................................................................................................... 40 Figure 4-1. Left and right glottal area waveform of (a) normal vocal fold; (b) unilateral vocal fold paralysis .............................................................................................................................................. 45 Figure 4-2. Displacement calculation from one frame to the next one .............................................. 47 Figure 4-3. Opening phase and closing phase of one oscillation cycle .............................................. 48 Figure 4-4. Color-coded of HSV frame (a) original HSV frame; (b) color-coded of (a); (c) color-coded of HSV frames within one vibration cycle .............................................................................. 49 Figure 4-5. (a) left and right glottal edges of a HSV frame (b) Fourier transform of (a) .................. 50 Figure 4-6. Amplitude and its fitted curve on maximum opening frame of (a) normal vocal fold and (b) vocal fold with polyp .................................................................................................................... 51

viii
Figure 4-7. Curvature calculation ....................................................................................................... 52 Figure 4-8. Convex hull of glottal edge of (a) normal vocal fold and (b) vocal fold with polyp ...... 53 Figure 4-9. Eigenvalues of feature space ........................................................................................... 55 Figure 4-10. Distribution of HSV data based on two dimensional decreased feature ....................... 55
ix
ABSTRACT
High speed videoendoscopy (HSV) of the larynx far surpasses the limits of videostroboscopy in
evaluating the vocal fold vibratory behavior by providing much higher frame rate. HSV enables the
visualization of vocal fold vibratory pattern within an actual glottic cycle. This very detailed infor-
mation on vocal fold vibratory characteristics could provide valuable information for the assessment
of vocal fold vibratory function in disordered voices and the treatments effects of the behavioral,
medical and surgical treatment procedures. In this work, we aim at addressing the problem of classi-
fying voice disorders with varying etiology by following four steps described shortly. Our method-
ology starts with glottis segmentation. Given a HSV data, the contour of the glottal opening area in
each frame should be acquired. These contours record the vibration track of the vocal fold. After
this, we obtain a reliable glottal axis that is necessary for getting certain vibratory features. The
third step is the feature extraction on HSV data. In the last step, we complete the classification
based on the features obtained from step 3.
In this study, we first propose a novel glottis segmentation method based on simplified dynam-
ic programming, which proves to be efficient and accurate. In addition, we introduce a new ap-
proach for calculating the glottal axis. By comparing the proposed glottal axis determination meth-
ods (modified linear regression) against state-of-the-art techniques, we demonstrate that our tech-
nique is more reliable. After that, the concentration shifts to feature extraction and classification
schemes. Eighteen different features are extracted and their discrimination is evaluated based on
principal component analysis. Support vector machine and neural network are implemented to
achieve the classification among three different types of vocal folds(normal vocal fold, unilateral
vocal fold polyp, and unilateral vocal fold paralysis). The result demonstrates that the classification
rates of four different tasks are all above 80%.
1
CHAPTER 1. INTRODUCTION
Verbal communication that relies on healthy voice is so important to people’s daily life, es-
pecially for the professional voice users as singers and teachers. However, the misuse/overuse of
voice, the change in laryngeal structure and vocal folds may lead to voice disorders, which can
affect the quality of people’s life significantly. Human voice is produced by the vibration of two
vocal folds in larynx with help of the airflow from the lungs [1]. Therefore, the evaluation of vo-
cal fold vibratory function has been considered an important component of clinical voice as-
sessment protocol to help with the diagnosis of voice disorders, and plan appropriate treatment
strategies(behavioral, surgical or medical) [2]-[3].
1.1 Why High Speed Videoendoscopy is Used
The clinical evaluation of vocal function at the presence of a voice disorder include both di-
rect (laryngoscopy and videostroboscopy) and indirect methods (acoustic and aerodynamic) [4].
Compared with perceptual analysis and the quantitative approaches such as acoustic analysis,
only the direct laryngeal imaging (e.g. videostroboscopy) allows determination of etiology of a
voice disorder. Currently, videostroboscopy is a gold standard to assess vocal fold vibratory
function in a clinic setting [5]-[6]. However, significant vibration details might be overlooked
while using the videostroboscopy due to its low recording frame rate (e.g., around 30
frames/second) [7] in the presence of voice disorders that results in irregular vocal fold vibration
or short phonation duration. In this situation, high speed videoendoscopy (HSV), with its signifi-
cantly higher capturing frame rate of 2000 or higher addresses the limitations of
videostroboscopy and, could be very helpful to investigate the vocal fold vibratory characteris-
tics within a glottic cycle even the vibration is very irregular and short in duration [2][8]-[9].
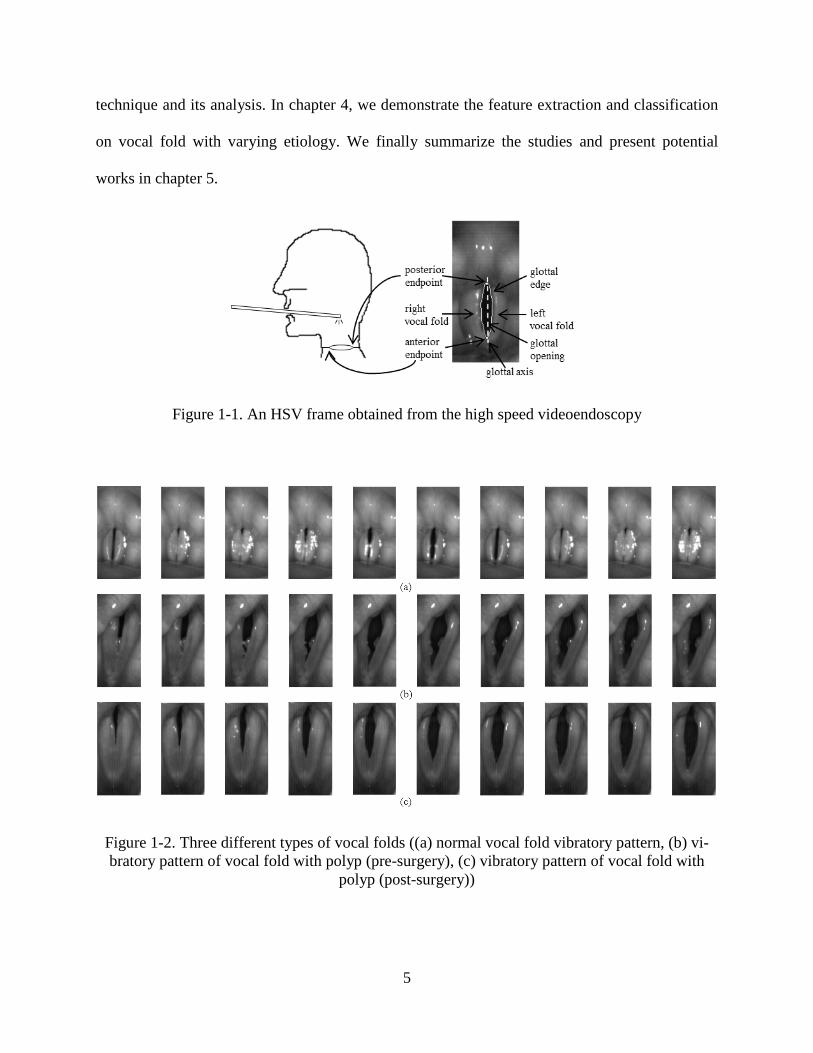
Figure 1-1 illustrates the HSV data acquisition. The rigid endoscopy, attached to the high speed
2
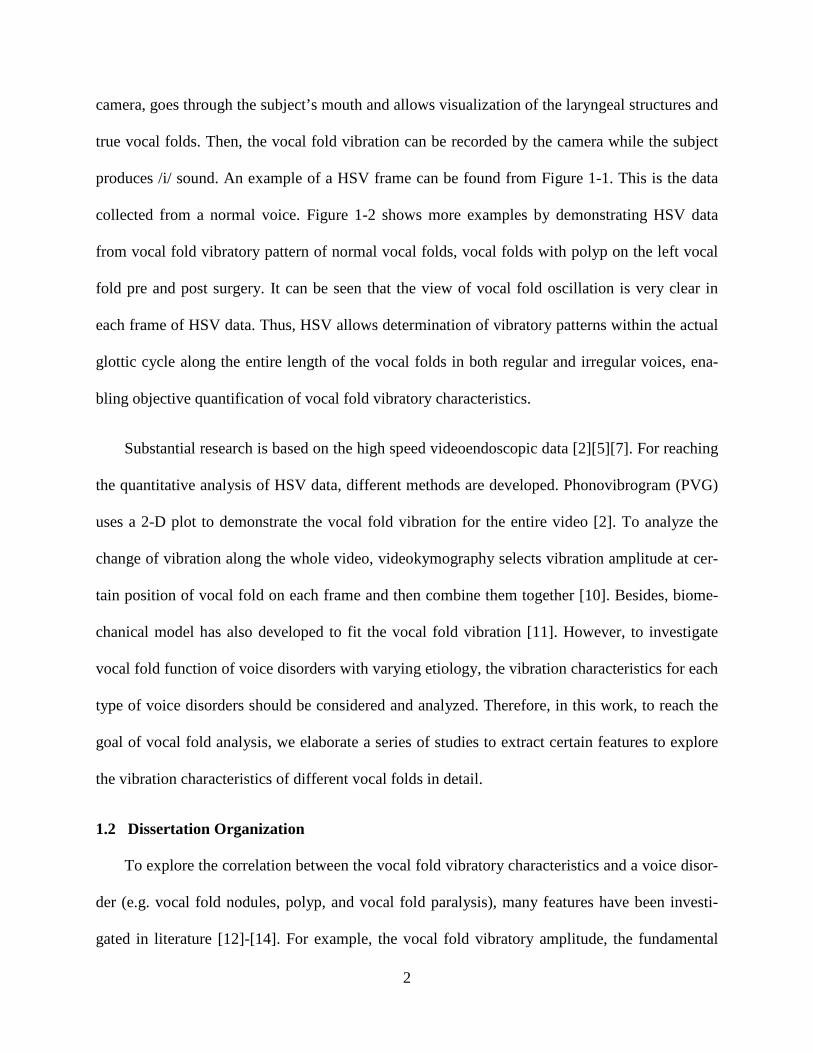
camera, goes through the subject’s mouth and allows visualization of the laryngeal structures and
true vocal folds. Then, the vocal fold vibration can be recorded by the camera while the subject
produces /i/ sound. An example of a HSV frame can be found from Figure 1-1. This is the data
collected from a normal voice. Figure 1-2 shows more examples by demonstrating HSV data
from vocal fold vibratory pattern of normal vocal folds, vocal folds with polyp on the left vocal
fold pre and post surgery. It can be seen that the view of vocal fold oscillation is very clear in
each frame of HSV data. Thus, HSV allows determination of vibratory patterns within the actual
glottic cycle along the entire length of the vocal folds in both regular and irregular voices, ena-
bling objective quantification of vocal fold vibratory characteristics.
Substantial research is based on the high speed videoendoscopic data [2][5][7]. For reaching
the quantitative analysis of HSV data, different methods are developed. Phonovibrogram (PVG)
uses a 2-D plot to demonstrate the vocal fold vibration for the entire video [2]. To analyze the
change of vibration along the whole video, videokymography selects vibration amplitude at cer-
tain position of vocal fold on each frame and then combine them together [10]. Besides, biome-
chanical model has also developed to fit the vocal fold vibration [11]. However, to investigate
vocal fold function of voice disorders with varying etiology, the vibration characteristics for each
type of voice disorders should be considered and analyzed. Therefore, in this work, to reach the
goal of vocal fold analysis, we elaborate a series of studies to extract certain features to explore
the vibration characteristics of different vocal folds in detail.
1.2 Dissertation Organization
To explore the correlation between the vocal fold vibratory characteristics and a voice disor-
der (e.g. vocal fold nodules, polyp, and vocal fold paralysis), many features have been investi-
gated in literature [12]-[14]. For example, the vocal fold vibratory amplitude, the fundamental
3
frequency, the symmetry of left and right vocal fold, and the phase asymmetries are discussed in
references [15]-[19]. All those features can be adopted to measure the irregularity of vocal fold
vibratory characteristics during voice assessment [20]-[22]. Most of these features are related to
the glottal opening area as indicated in Figure 1-1. In other words, to get those features, glottis
segmentation is a necessary pre-processing step. Several glottis segmentation methods have been
investigated in other research, such as region growing method and active contour method [23]-
[25]. In this study, we develop our own glottis segmentation method, which achieves a good bal-
ance between efficiency and accuracy.
In addition, some HSV features that describe true vocal fold vibratory functions require the
use of glottal axis, which is the projection of the median sagittal plane of the larynx onto the 2D
endoscopic imagery (refers to Figure 1-1). For example, phonovibrogram (PVG), an image pro-
cessing tool developed to analyze HSV data, uses the glottal axis to demonstrate the vocal vibra-
tory patterns in normal voice and pathological voices caused by varying etiology (laryngeal
nerve paralysis, functional voice disorder with vocal nodules) [26]. Besides, the glottal axis de-
termination is also important to extract accurate symmetry features, which is one of the most sig-
nificant measurements for evaluating the vocal fold function. There are two kinds of vocal fold
asymmetry: left-right asymmetry and anterior-posterior asymmetry [27]-[28]. Furthermore, the
biomechanical models for fitting the observed vocal fold oscillations [11][29] needs the infor-
mation of glottal axis as well. Several glottal axis determination techniques have been used in
earlier studies. Examples include the regression line and the extreme vocal fold endpoint
[11][30]. However, the most reliable glottal axis determination technique is yet to be determined.
In this study, we propose a new way to obtain the glottal axis and demonstrate its advantage in
reliability over state-of-the-art strategies.
4
Vocal fold vibratory characteristics are very useful to evaluate the vocal fold function. Fea-
ture extraction based on HSV data could help to quantify the vocal fold vibratory characteristics
and help to establish the relationship between features and voice disorders. Consequently, a reli-
able feature should be clinically useful to assess the vocal fold function. In this study, eighteen
different features that describe the vocal fold vibratory symmetry and regularity have been ex-
tracted. Aiming at exploring the relationship of features and voice disorders, we investigate the
classification among normal vocal folds and vocal folds pathologies with different etiologies
based on the extracted features. Two classification approaches including support vector machine
and neural network are applied to achieve the classification on three types of vocal folds (normal
vocal fold, unilateral vocal fold polyp, and unilateral vocal fold paralysis).
To summarize, the main contributions of this research are as follows.
• We proposed a new glottis segmentation method based on simplified dynamic program-
ming, which is proved to be both efficient and accurate to obtain the glottal area in each
frame of a HSV data.
• We developed a new glottal axis determination technique and explore its capability to
differentiate vocal fold of disordered voice from normal vocal fold by comparing with
current used glottal axis determination methods.
• We developed several pathological specific features to represent vibration characteristics
for each certain type of vocal fold. And then, the classification is achieved based on
those features among different vocal folds.
The remaining of this dissertation is organized as follows. We present our exploration on
glottis segmentation approach in chapter 2. Chapter 3 elaborates the glottal axis determination
5
technique and its analysis. In chapter 4, we demonstrate the feature extraction and classification
on vocal fold with varying etiology. We finally summarize the studies and present potential
works in chapter 5.
Figure 1-1. An HSV frame obtained from the high speed videoendoscopy
Figure 1-2. Three different types of vocal folds ((a) normal vocal fold vibratory pattern, (b) vi-bratory pattern of vocal fold with polyp (pre-surgery), (c) vibratory pattern of vocal fold with
polyp (post-surgery))
6
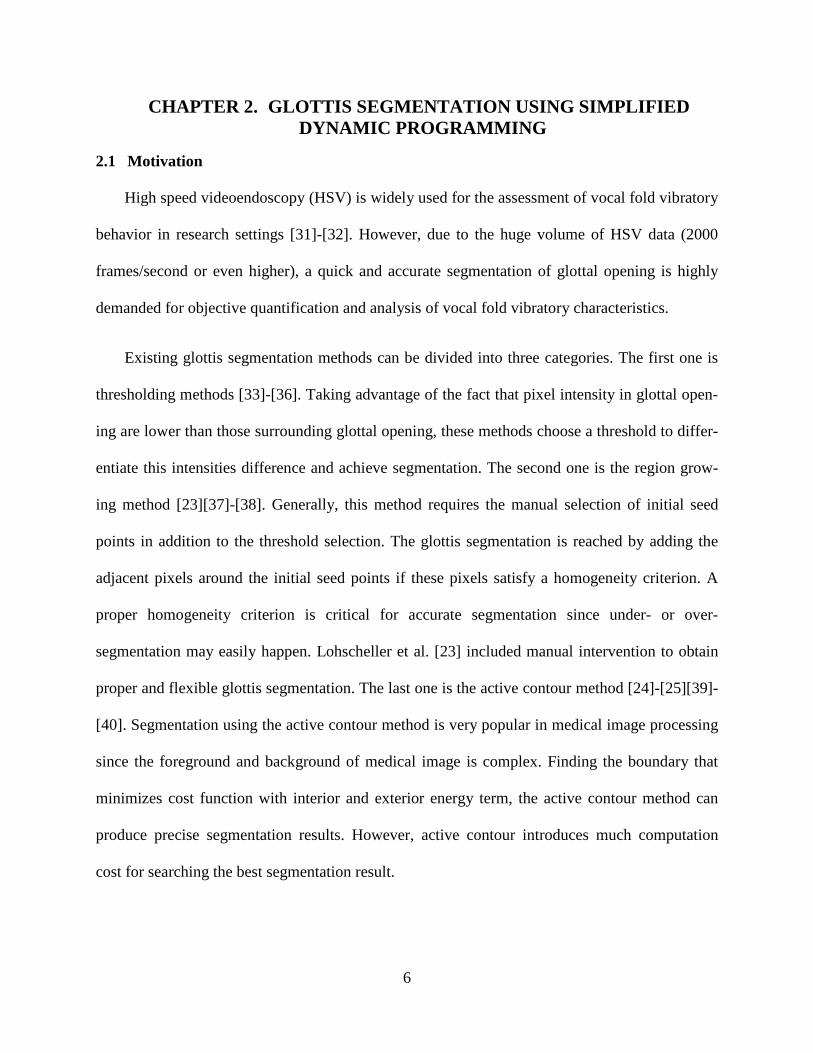
CHAPTER 2. GLOTTIS SEGMENTATION USING SIMPLIFIED DYNAMIC PROGRAMMING
2.1 Motivation
High speed videoendoscopy (HSV) is widely used for the assessment of vocal fold vibratory
behavior in research settings [31]-[32]. However, due to the huge volume of HSV data (2000
frames/second or even higher), a quick and accurate segmentation of glottal opening is highly
demanded for objective quantification and analysis of vocal fold vibratory characteristics.
Existing glottis segmentation methods can be divided into three categories. The first one is
thresholding methods [33]-[36]. Taking advantage of the fact that pixel intensity in glottal open-
ing are lower than those surrounding glottal opening, these methods choose a threshold to differ-
entiate this intensities difference and achieve segmentation. The second one is the region grow-
ing method [23][37]-[38]. Generally, this method requires the manual selection of initial seed
points in addition to the threshold selection. The glottis segmentation is reached by adding the
adjacent pixels around the initial seed points if these pixels satisfy a homogeneity criterion. A
proper homogeneity criterion is critical for accurate segmentation since under- or over-
segmentation may easily happen. Lohscheller et al. [23] included manual intervention to obtain
proper and flexible glottis segmentation. The last one is the active contour method [24]-[25][39]-
[40]. Segmentation using the active contour method is very popular in medical image processing
since the foreground and background of medical image is complex. Finding the boundary that
minimizes cost function with interior and exterior energy term, the active contour method can
produce precise segmentation results. However, active contour introduces much computation
cost for searching the best segmentation result.
7
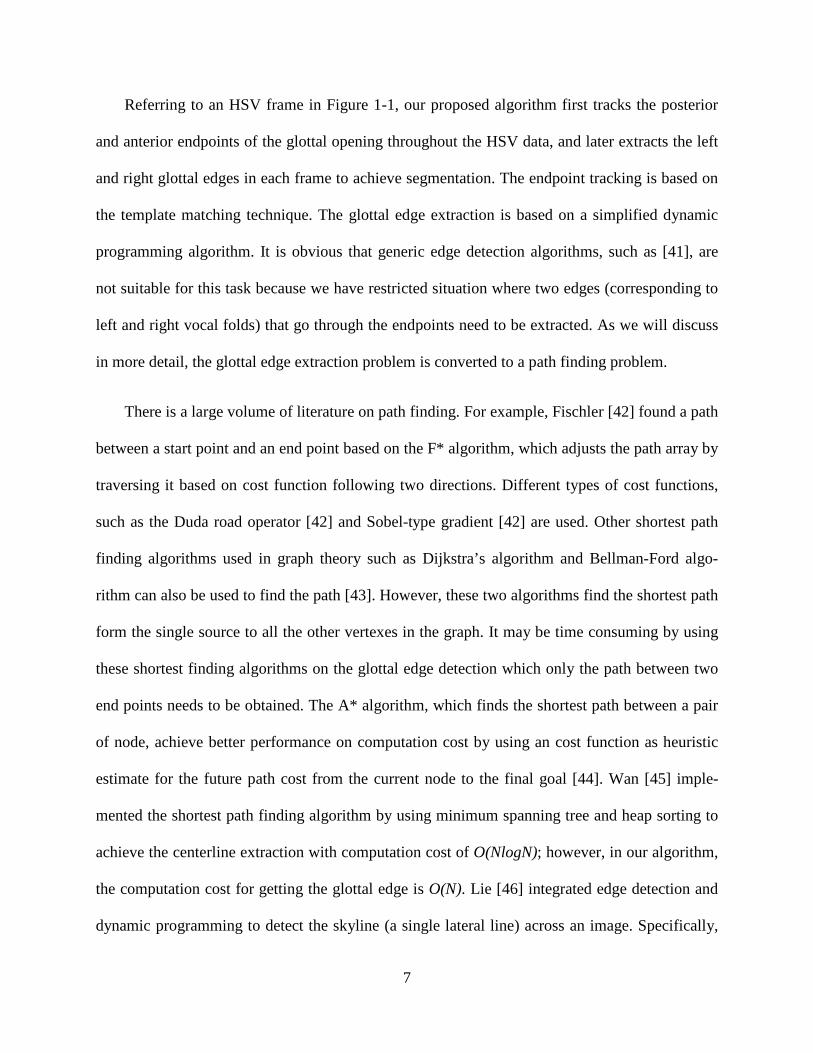
Referring to an HSV frame in Figure 1-1, our proposed algorithm first tracks the posterior
and anterior endpoints of the glottal opening throughout the HSV data, and later extracts the left
and right glottal edges in each frame to achieve segmentation. The endpoint tracking is based on
the template matching technique. The glottal edge extraction is based on a simplified dynamic
programming algorithm. It is obvious that generic edge detection algorithms, such as [41], are
not suitable for this task because we have restricted situation where two edges (corresponding to
left and right vocal folds) that go through the endpoints need to be extracted. As we will discuss
in more detail, the glottal edge extraction problem is converted to a path finding problem.
There is a large volume of literature on path finding. For example, Fischler [42] found a path
between a start point and an end point based on the F* algorithm, which adjusts the path array by
traversing it based on cost function following two directions. Different types of cost functions,
such as the Duda road operator [42] and Sobel-type gradient [42] are used. Other shortest path
finding algorithms used in graph theory such as Dijkstra’s algorithm and Bellman-Ford algo-
rithm can also be used to find the path [43]. However, these two algorithms find the shortest path
form the single source to all the other vertexes in the graph. It may be time consuming by using
these shortest finding algorithms on the glottal edge detection which only the path between two
end points needs to be obtained. The A* algorithm, which finds the shortest path between a pair
of node, achieve better performance on computation cost by using an cost function as heuristic
estimate for the future path cost from the current node to the final goal [44]. Wan [45] imple-
mented the shortest path finding algorithm by using minimum spanning tree and heap sorting to
achieve the centerline extraction with computation cost of O(NlogN); however, in our algorithm,
the computation cost for getting the glottal edge is O(N). Lie [46] integrated edge detection and
dynamic programming to detect the skyline (a single lateral line) across an image. Specifically,
8
edge detection is applied on image first in their study, then dynamic programming is used to link
edges based on certain cost criterion. However, we have stated that both glottal and non-glottal
edge segments could be got by simply applying edge detection on HSV image. Those false seg-
ments can be very close to the real glottal edge, which brings difficulty on linking the real glottal
edge segments.
In our study, line detection is accomplished by a simplified dynamic programming method,
which is proved to be a both efficient and accurate segmentation approach.
2.2 Glottis Segmentation Based on Vocal Fold Edges
As shown in Figure 1-1, the glottal opening is bordered with the left and right vocal fold
edges extending from a common posterior endpoint to a common anterior endpoint. The pro-
posed segmentation method first finds the posterior and anterior endpoints in each frame of the
HSV data to define the region of interest. It is possible that left and right vocal fold edges touch
each other inside the glottal opening. To handle such cases, a closed portion determination step is
applied to detect such regions. Finally, a dynamic programming based algorithm is employed to
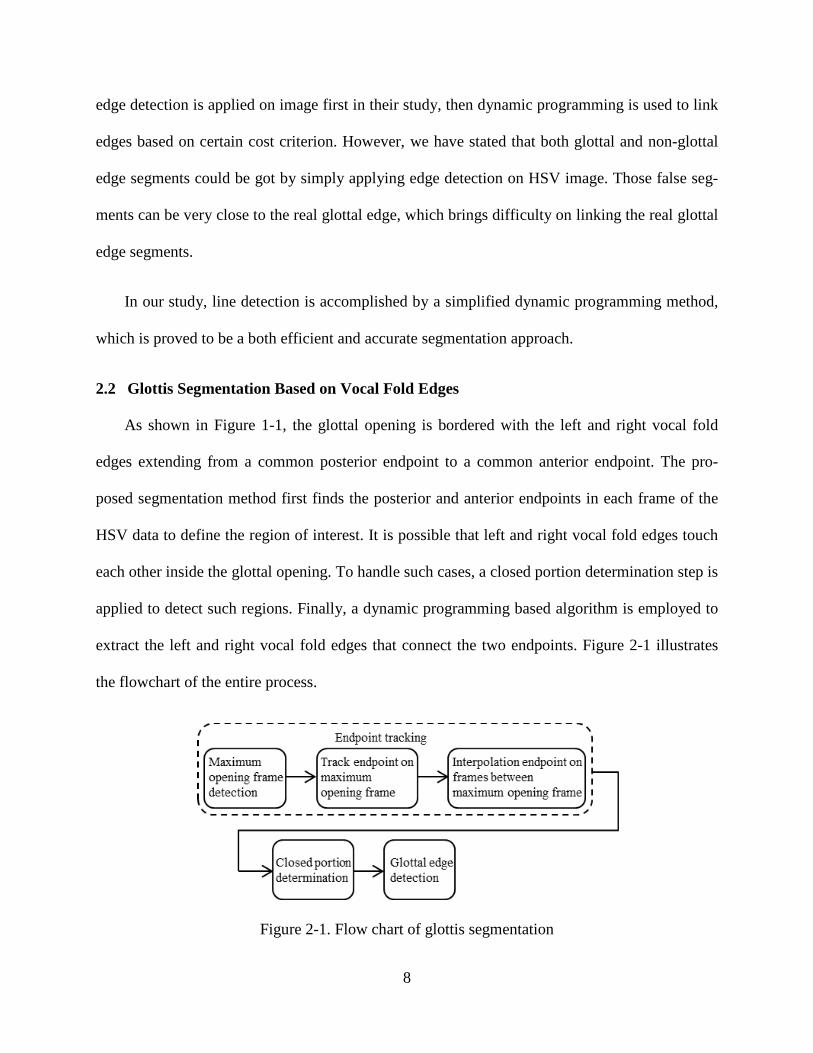
extract the left and right vocal fold edges that connect the two endpoints. Figure 2-1 illustrates
the flowchart of the entire process.
Figure 2-1. Flow chart of glottis segmentation
9
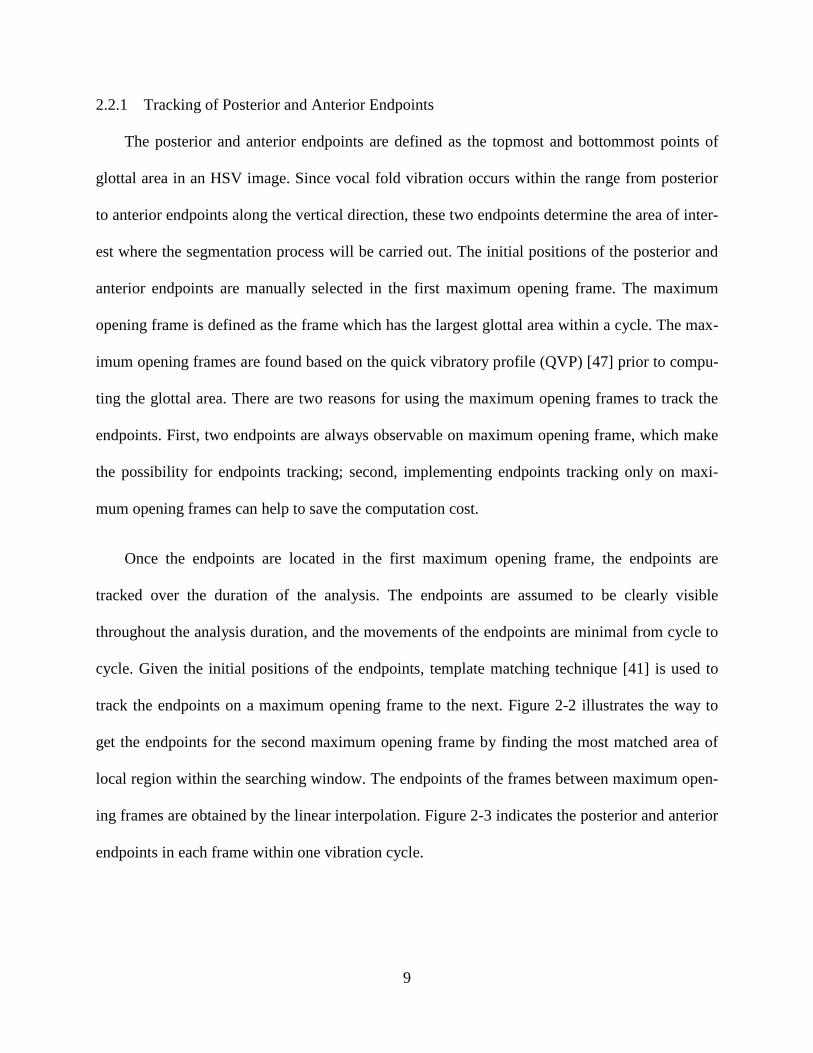
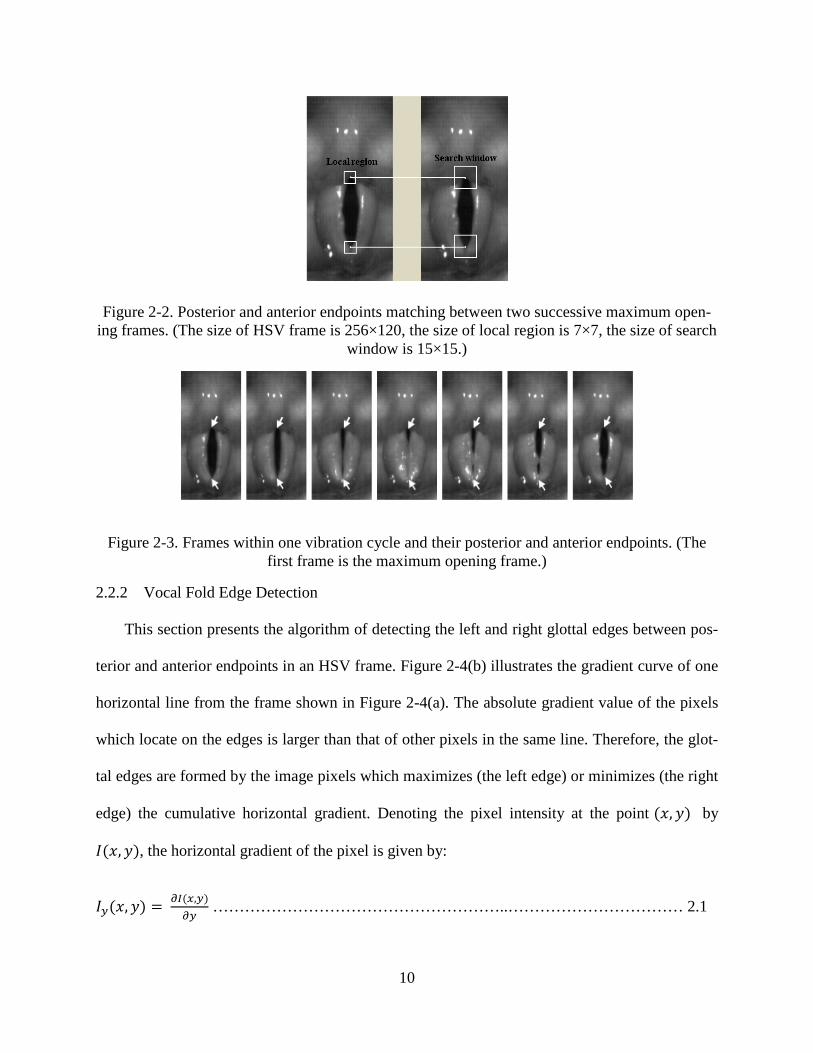
2.2.1 Tracking of Posterior and Anterior Endpoints
The posterior and anterior endpoints are defined as the topmost and bottommost points of
glottal area in an HSV image. Since vocal fold vibration occurs within the range from posterior
to anterior endpoints along the vertical direction, these two endpoints determine the area of inter-
est where the segmentation process will be carried out. The initial positions of the posterior and
anterior endpoints are manually selected in the first maximum opening frame. The maximum
opening frame is defined as the frame which has the largest glottal area within a cycle. The max-
imum opening frames are found based on the quick vibratory profile (QVP) [47] prior to compu-
ting the glottal area. There are two reasons for using the maximum opening frames to track the
endpoints. First, two endpoints are always observable on maximum opening frame, which make
the possibility for endpoints tracking; second, implementing endpoints tracking only on maxi-
mum opening frames can help to save the computation cost.
Once the endpoints are located in the first maximum opening frame, the endpoints are
tracked over the duration of the analysis. The endpoints are assumed to be clearly visible
throughout the analysis duration, and the movements of the endpoints are minimal from cycle to
cycle. Given the initial positions of the endpoints, template matching technique [41] is used to
track the endpoints on a maximum opening frame to the next. Figure 2-2 illustrates the way to
get the endpoints for the second maximum opening frame by finding the most matched area of
local region within the searching window. The endpoints of the frames between maximum open-
ing frames are obtained by the linear interpolation. Figure 2-3 indicates the posterior and anterior
endpoints in each frame within one vibration cycle.
10
Figure 2-2. Posterior and anterior endpoints matching between two successive maximum open-ing frames. (The size of HSV frame is 256×120, the size of local region is 7×7, the size of search
window is 15×15.)
Figure 2-3. Frames within one vibration cycle and their posterior and anterior endpoints. (The first frame is the maximum opening frame.)
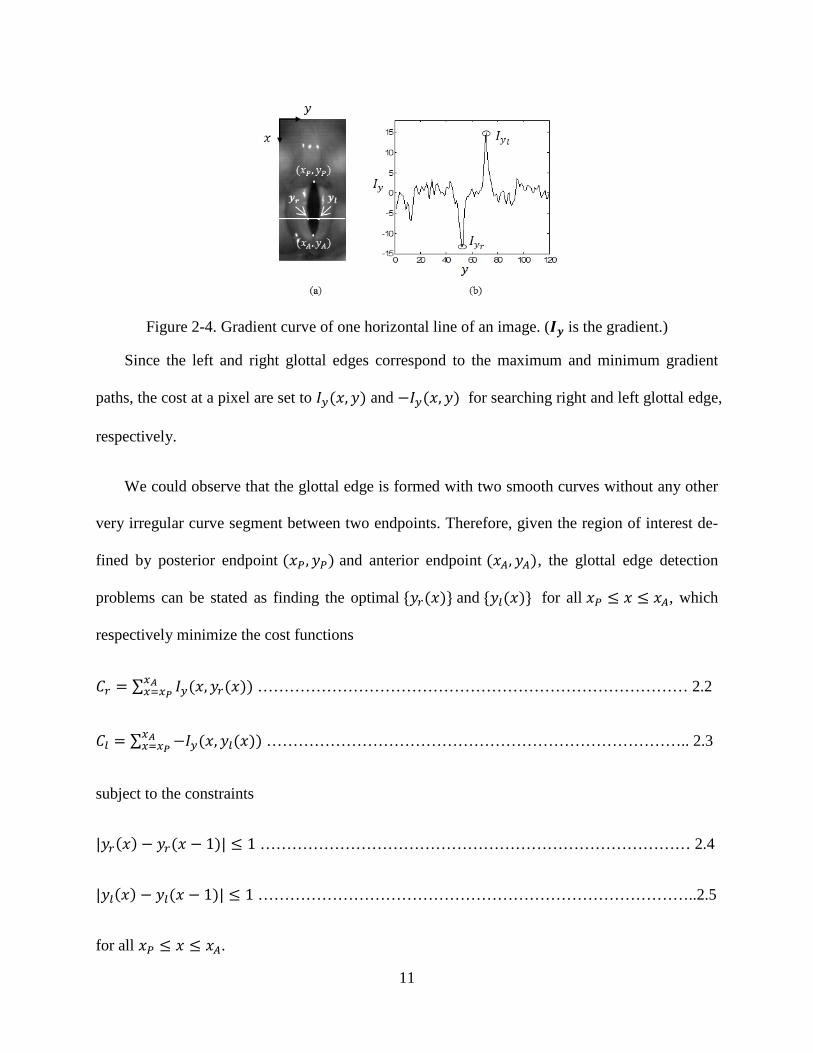
2.2.2 Vocal Fold Edge Detection
This section presents the algorithm of detecting the left and right glottal edges between pos-
terior and anterior endpoints in an HSV frame. Figure 2-4(b) illustrates the gradient curve of one
horizontal line from the frame shown in Figure 2-4(a). The absolute gradient value of the pixels
which locate on the edges is larger than that of other pixels in the same line. Therefore, the glot-
tal edges are formed by the image pixels which maximizes (the left edge) or minimizes (the right
edge) the cumulative horizontal gradient. Denoting the pixel intensity at the point (𝑥,𝑦) by
𝐼(𝑥,𝑦), the horizontal gradient of the pixel is given by:
𝐼𝑦(𝑥,𝑦) = 𝜕𝐼(𝑥,𝑦)𝜕𝑦
………………………………………………..…………………………… 2.1
11
Figure 2-4. Gradient curve of one horizontal line of an image. (𝑰𝒚 is the gradient.)
Since the left and right glottal edges correspond to the maximum and minimum gradient
paths, the cost at a pixel are set to 𝐼𝑦(𝑥,𝑦) and −𝐼𝑦(𝑥,𝑦) for searching right and left glottal edge,
respectively.
We could observe that the glottal edge is formed with two smooth curves without any other
very irregular curve segment between two endpoints. Therefore, given the region of interest de-
fined by posterior endpoint (𝑥𝑃,𝑦𝑃) and anterior endpoint (𝑥𝐴,𝑦𝐴), the glottal edge detection
problems can be stated as finding the optimal {𝑦𝑟(𝑥)} and {𝑦𝑙(𝑥)} for all 𝑥𝑃 ≤ 𝑥 ≤ 𝑥𝐴, which
respectively minimize the cost functions
𝐶𝑟 = ∑ 𝐼𝑦(𝑥,𝑦𝑟(𝑥))𝑥𝐴𝑥=𝑥𝑃 ……………………………………………………………………… 2.2
𝐶𝑙 = ∑ −𝐼𝑦(𝑥,𝑦𝑙(𝑥))𝑥𝐴𝑥=𝑥𝑃 …………………………………………………………………….. 2.3
subject to the constraints
|𝑦𝑟(𝑥) − 𝑦𝑟(𝑥 − 1)| ≤ 1 ……………………………………………………………………… 2.4
|𝑦𝑙(𝑥) − 𝑦𝑙(𝑥 − 1)| ≤ 1 ………………………………………………………………………..2.5
for all 𝑥𝑃 ≤ 𝑥 ≤ 𝑥𝐴.

12
The minimizing solutions can be acquired with the simplified dynamic programming [48].
The algorithm first constructs cumulative energy function, 𝐸𝑟 and 𝐸𝑙, by traversing the individual
pixel cost functions 𝐼𝑦(𝑥,𝑦) and −𝐼𝑦(𝑥,𝑦), from the first row (which contains the posterior end-
point) to the last row (with the anterior endpoint). The 𝑥𝑦-th elements of the energy functions are
computed by
𝐸𝑟(𝑥,𝑦) = 𝐼𝑦(𝑥,𝑦) + min (𝐸𝑟(𝑥 − 1,𝑦 − 1),𝐸𝑟(𝑥 − 1,𝑦),𝐸𝑟(𝑥 − 1,𝑦 + 1) ……………… 2.6
𝐸𝑙(𝑥, 𝑦) = −𝐼𝑦(𝑥,𝑦) + min (𝐸𝑙(𝑥 − 1,𝑦 − 1),𝐸𝑙(𝑥 − 1,𝑦),𝐸𝑙(𝑥 − 1,𝑦 + 1)……………….2.7
with 𝐸𝑟 and 𝐸𝑙 are set to 0 outside the defined range of 𝑥𝑃 ≤ 𝑥 ≤ 𝑥𝐴 and 𝑦. The principle is illus-
trated in Figure 2-5. Each grid in right image of Figure 2-5 represents a pixel from the left image.
Figure 2-5. Illustration of obtaining the cumulative minimum energy function
After getting the cumulative minimum energy function, the glottal edges are obtained by
back tracing the minimum value in each row of 𝐸𝑟 and 𝐸𝑙. Figure 2-6 shows an example of 𝐼𝑦-
value, 𝐸𝑟-value and the traced right edge. The back tracing begins from the predetermined ante-
rior endpoint (𝑥𝐴,𝑦𝐴), and we denote the minimizing solutions as 𝑦𝑟∗(𝑥) and 𝑦𝑙∗(𝑥), which are
the lateral coordinates of the back-traced vocal fold edges. The back traced most posterior points,
(𝑥𝑃,𝑦𝑟(𝑥𝑃)) and (𝑥𝑃,𝑦𝑙(𝑥𝑃)), are usually close to the posterior endpoint (𝑥𝑃,𝑦𝑃). The glottal
13
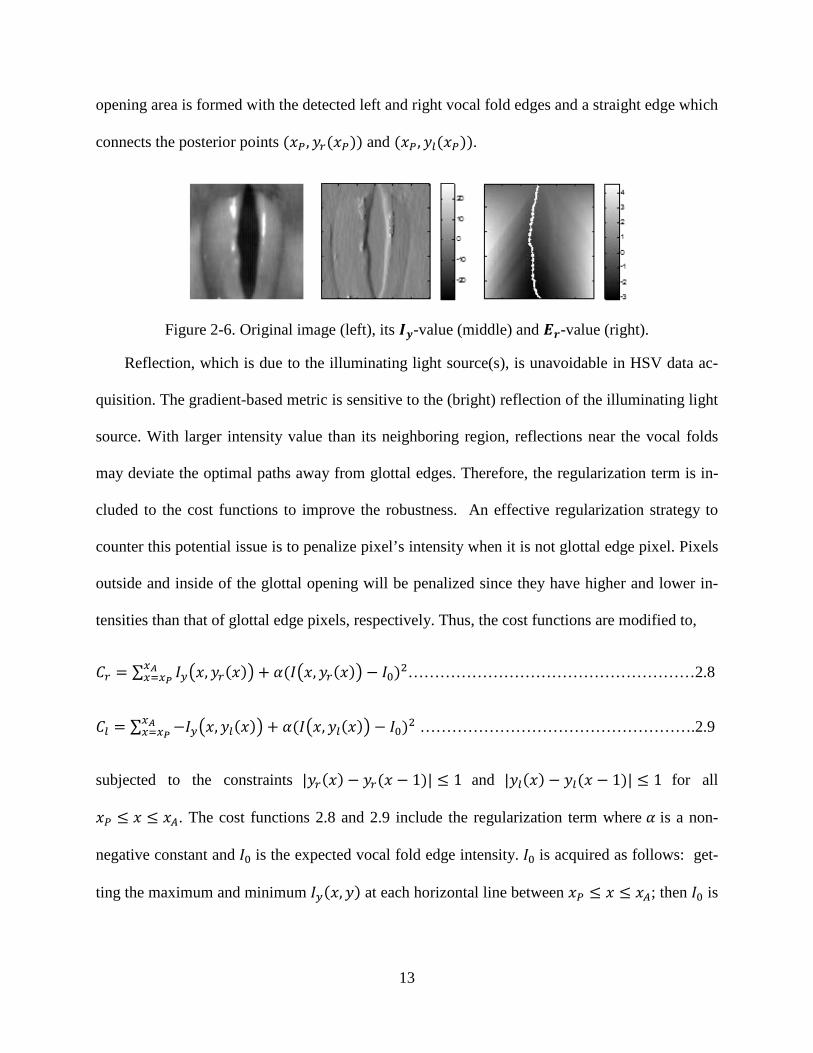
opening area is formed with the detected left and right vocal fold edges and a straight edge which
connects the posterior points (𝑥𝑃,𝑦𝑟(𝑥𝑃)) and (𝑥𝑃,𝑦𝑙(𝑥𝑃)).
Figure 2-6. Original image (left), its 𝑰𝒚-value (middle) and 𝑬𝒓-value (right).
Reflection, which is due to the illuminating light source(s), is unavoidable in HSV data ac-
quisition. The gradient-based metric is sensitive to the (bright) reflection of the illuminating light
source. With larger intensity value than its neighboring region, reflections near the vocal folds
may deviate the optimal paths away from glottal edges. Therefore, the regularization term is in-
cluded to the cost functions to improve the robustness. An effective regularization strategy to
counter this potential issue is to penalize pixel’s intensity when it is not glottal edge pixel. Pixels
outside and inside of the glottal opening will be penalized since they have higher and lower in-
tensities than that of glottal edge pixels, respectively. Thus, the cost functions are modified to,
𝐶𝑟 = ∑ 𝐼𝑦�𝑥,𝑦𝑟(𝑥)� + 𝛼(𝐼�𝑥,𝑦𝑟(𝑥)� − 𝐼0)2𝑥𝐴𝑥=𝑥𝑃 ………………………………………………2.8
𝐶𝑙 = ∑ −𝐼𝑦�𝑥,𝑦𝑙(𝑥)� + 𝛼(𝐼�𝑥,𝑦𝑙(𝑥)� − 𝐼0)2𝑥𝐴𝑥=𝑥𝑃 …………………………………………….2.9
subjected to the constraints |𝑦𝑟(𝑥) − 𝑦𝑟(𝑥 − 1)| ≤ 1 and |𝑦𝑙(𝑥) − 𝑦𝑙(𝑥 − 1)| ≤ 1 for all
𝑥𝑃 ≤ 𝑥 ≤ 𝑥𝐴. The cost functions 2.8 and 2.9 include the regularization term where 𝛼 is a non-
negative constant and 𝐼0 is the expected vocal fold edge intensity. 𝐼0 is acquired as follows: get-
ting the maximum and minimum 𝐼𝑦(𝑥,𝑦) at each horizontal line between 𝑥𝑃 ≤ 𝑥 ≤ 𝑥𝐴; then 𝐼0 is
14
the mean intensity of corresponding pixels obtained in last step. In this way, we force the path to
go through the actual edge and avoid crossing the strong reflection edges.
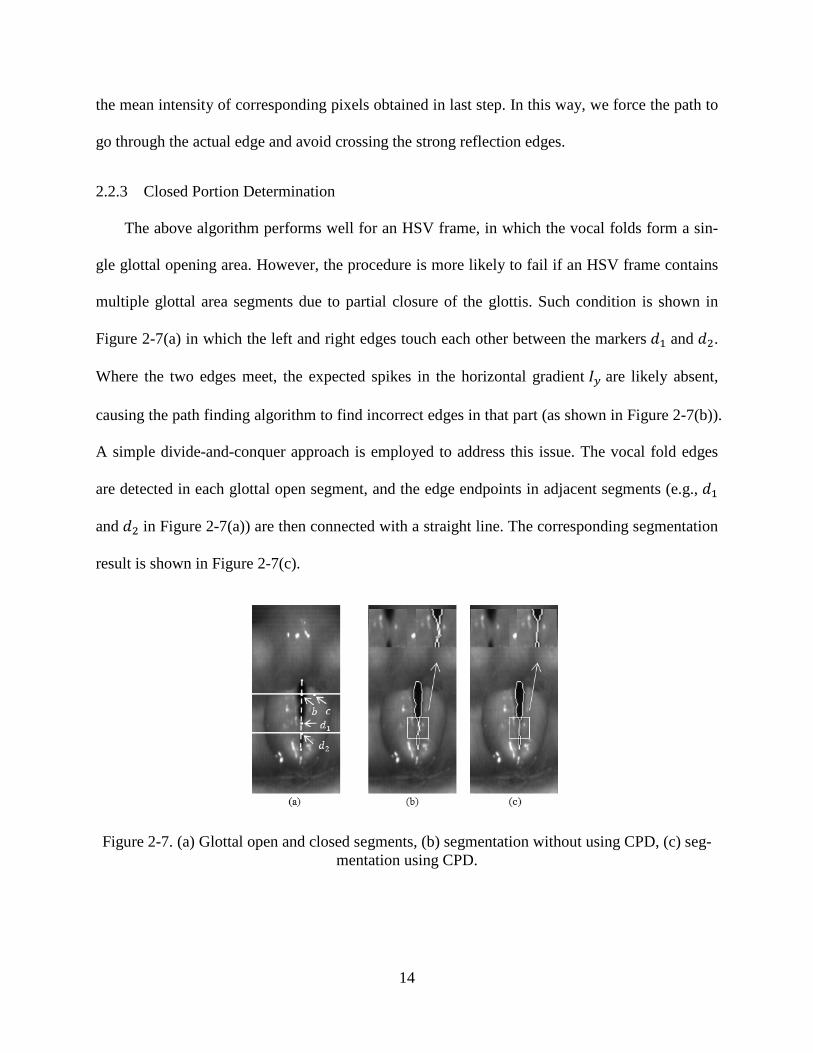
2.2.3 Closed Portion Determination
The above algorithm performs well for an HSV frame, in which the vocal folds form a sin-
gle glottal opening area. However, the procedure is more likely to fail if an HSV frame contains
multiple glottal area segments due to partial closure of the glottis. Such condition is shown in
Figure 2-7(a) in which the left and right edges touch each other between the markers 𝑑1 and 𝑑2.
Where the two edges meet, the expected spikes in the horizontal gradient 𝐼𝑦 are likely absent,
causing the path finding algorithm to find incorrect edges in that part (as shown in Figure 2-7(b)).
A simple divide-and-conquer approach is employed to address this issue. The vocal fold edges
are detected in each glottal open segment, and the edge endpoints in adjacent segments (e.g., 𝑑1
and 𝑑2 in Figure 2-7(a)) are then connected with a straight line. The corresponding segmentation
result is shown in Figure 2-7(c).
Figure 2-7. (a) Glottal open and closed segments, (b) segmentation without using CPD, (c) seg-mentation using CPD.
15
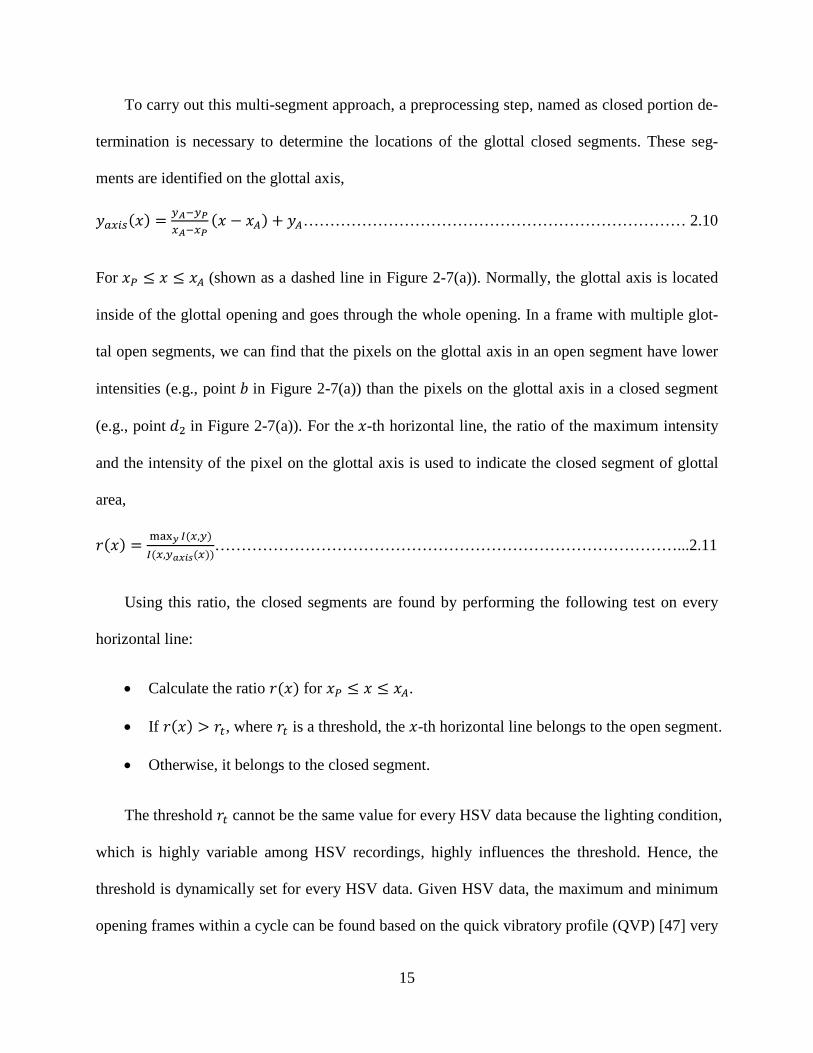
To carry out this multi-segment approach, a preprocessing step, named as closed portion de-
termination is necessary to determine the locations of the glottal closed segments. These seg-
ments are identified on the glottal axis,
𝑦𝑎𝑥𝑖𝑠(𝑥) = 𝑦𝐴−𝑦𝑃𝑥𝐴−𝑥𝑃
(𝑥 − 𝑥𝐴) + 𝑦𝐴……………………………………………………………… 2.10
For 𝑥𝑃 ≤ 𝑥 ≤ 𝑥𝐴 (shown as a dashed line in Figure 2-7(a)). Normally, the glottal axis is located
inside of the glottal opening and goes through the whole opening. In a frame with multiple glot-
tal open segments, we can find that the pixels on the glottal axis in an open segment have lower
intensities (e.g., point 𝑏 in Figure 2-7(a)) than the pixels on the glottal axis in a closed segment
(e.g., point 𝑑2 in Figure 2-7(a)). For the 𝑥-th horizontal line, the ratio of the maximum intensity
and the intensity of the pixel on the glottal axis is used to indicate the closed segment of glottal
area,
𝑟(𝑥) = max𝑦 𝐼(𝑥,𝑦)𝐼(𝑥,𝑦𝑎𝑥𝑖𝑠(𝑥))
……………………………………………………………………………...2.11
Using this ratio, the closed segments are found by performing the following test on every
horizontal line:
• Calculate the ratio 𝑟(𝑥) for 𝑥𝑃 ≤ 𝑥 ≤ 𝑥𝐴.
• If 𝑟(𝑥) > 𝑟𝑡, where 𝑟𝑡 is a threshold, the 𝑥-th horizontal line belongs to the open segment.
• Otherwise, it belongs to the closed segment.
The threshold 𝑟𝑡 cannot be the same value for every HSV data because the lighting condition,
which is highly variable among HSV recordings, highly influences the threshold. Hence, the
threshold is dynamically set for every HSV data. Given HSV data, the maximum and minimum
opening frames within a cycle can be found based on the quick vibratory profile (QVP) [47] very
16
easily. Normally, the whole glottal area or the most of glottal area is fully open in maximum
opening frame; while it is closed in minimum opening frame. Therefore we randomly choose
five maximum and minimum opening frame, and calculate the average value of 𝑟(𝑥) for open
and closed segments respectively, denoted by 𝑟𝑜𝑝𝑒𝑛 and 𝑟𝑐𝑙𝑜𝑠𝑒𝑑. The threshold 𝑟𝑡 is chosen from
the range of [𝑟𝑐𝑙𝑜𝑠𝑒𝑑, 𝑟𝑜𝑝𝑒𝑛] by:
𝑟𝑡 = 𝑟𝑐𝑙𝑜𝑠𝑒𝑑 + 𝛾(𝑟𝑜𝑝𝑒𝑛 − 𝑟𝑐𝑙𝑜𝑠𝑒𝑑)……………………………………………………………... 2.12
where 0 < 𝛾 < 1, and 𝛾=0.2 is used in this study.
2.3 Results and Discussion
2.3.1 Endpoints Tracking
To examine the effectiveness of endpoints tracking method, the endpoints of four randomly
selected HSV recordings with length of 500 frames are tracked. The tracked endpoint locations
are validated against manually selected endpoints at each frame. Note that the endpoints of some
intra frames between each two maximum opening frames are invisible, therefore, only the end-
points of maximum opening frames are manually picked; while those of the intra frames are ob-
tained via interpolation. To assess the accuracy of endpoints tracking, we compute the mean dis-
tance between manually selected endpoints and tracked endpoints and show them in Table 2-1.
The mean distance is the mean value of the distance between two posterior endpoints and the dis-
tance between two anterior endpoints for those 500 frames. As can be seen from Table 2-1, the
tracking result is accurate with largest difference of 1.71 pixels averaged on 500 frames vibration.
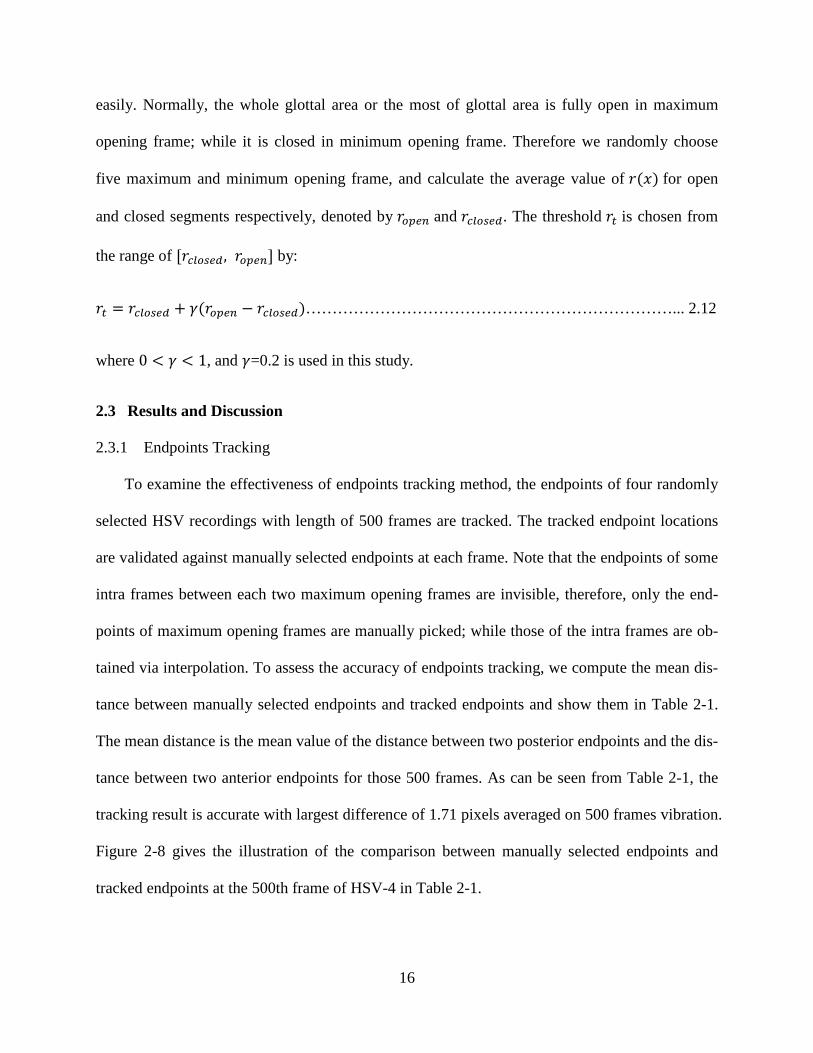
Figure 2-8 gives the illustration of the comparison between manually selected endpoints and
tracked endpoints at the 500th frame of HSV-4 in Table 2-1.
17
Table 2-1. Posterior and anterior endpoints tracking error
HSV recordings HSV-1 HSV-2 HSV-3 HSV-4 Mean Distance 0.61 0.93 1.35 1.71
Figure 2-8. (a) Manually selected endpoints at the 500th frame; (b) automatically tracked end-points at the 500th frame.
2.3.2 Effect of the Regularization Term
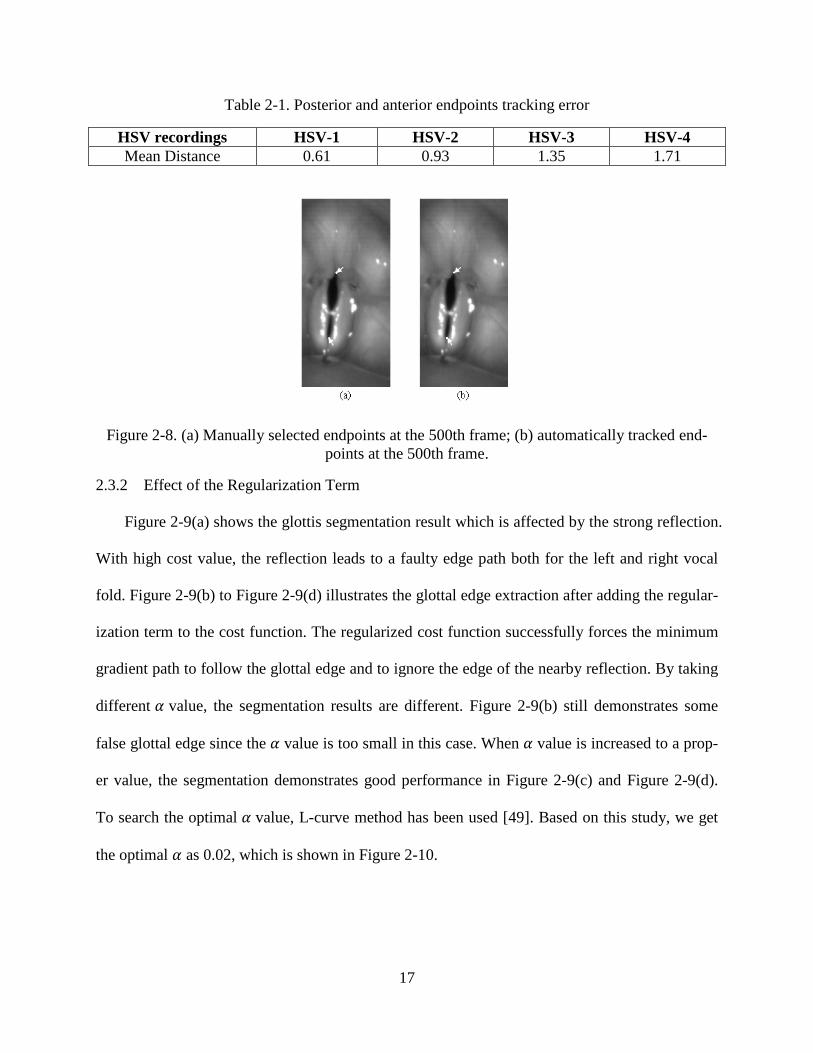
Figure 2-9(a) shows the glottis segmentation result which is affected by the strong reflection.
With high cost value, the reflection leads to a faulty edge path both for the left and right vocal
fold. Figure 2-9(b) to Figure 2-9(d) illustrates the glottal edge extraction after adding the regular-
ization term to the cost function. The regularized cost function successfully forces the minimum
gradient path to follow the glottal edge and to ignore the edge of the nearby reflection. By taking
different 𝛼 value, the segmentation results are different. Figure 2-9(b) still demonstrates some
false glottal edge since the 𝛼 value is too small in this case. When 𝛼 value is increased to a prop-
er value, the segmentation demonstrates good performance in Figure 2-9(c) and Figure 2-9(d).
To search the optimal 𝛼 value, L-curve method has been used [49]. Based on this study, we get
the optimal 𝛼 as 0.02, which is shown in Figure 2-10.
18
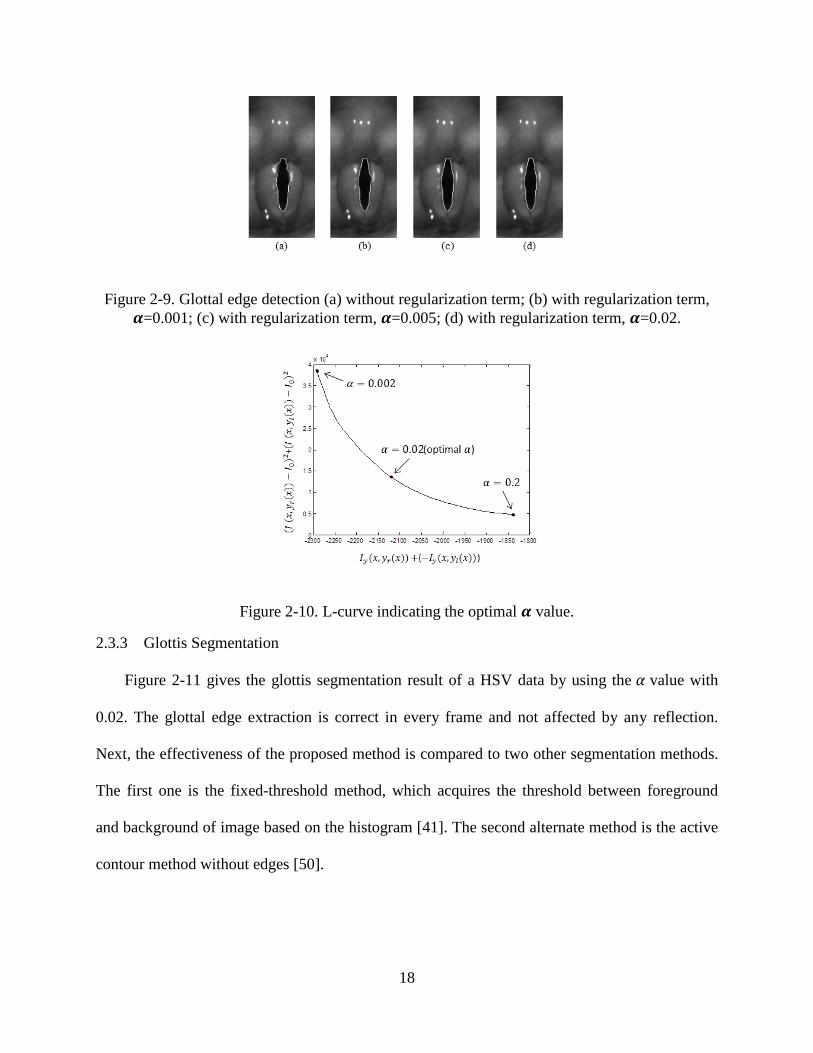
Figure 2-9. Glottal edge detection (a) without regularization term; (b) with regularization term, 𝜶=0.001; (c) with regularization term, 𝜶=0.005; (d) with regularization term, 𝜶=0.02.
Figure 2-10. L-curve indicating the optimal 𝜶 value.
2.3.3 Glottis Segmentation
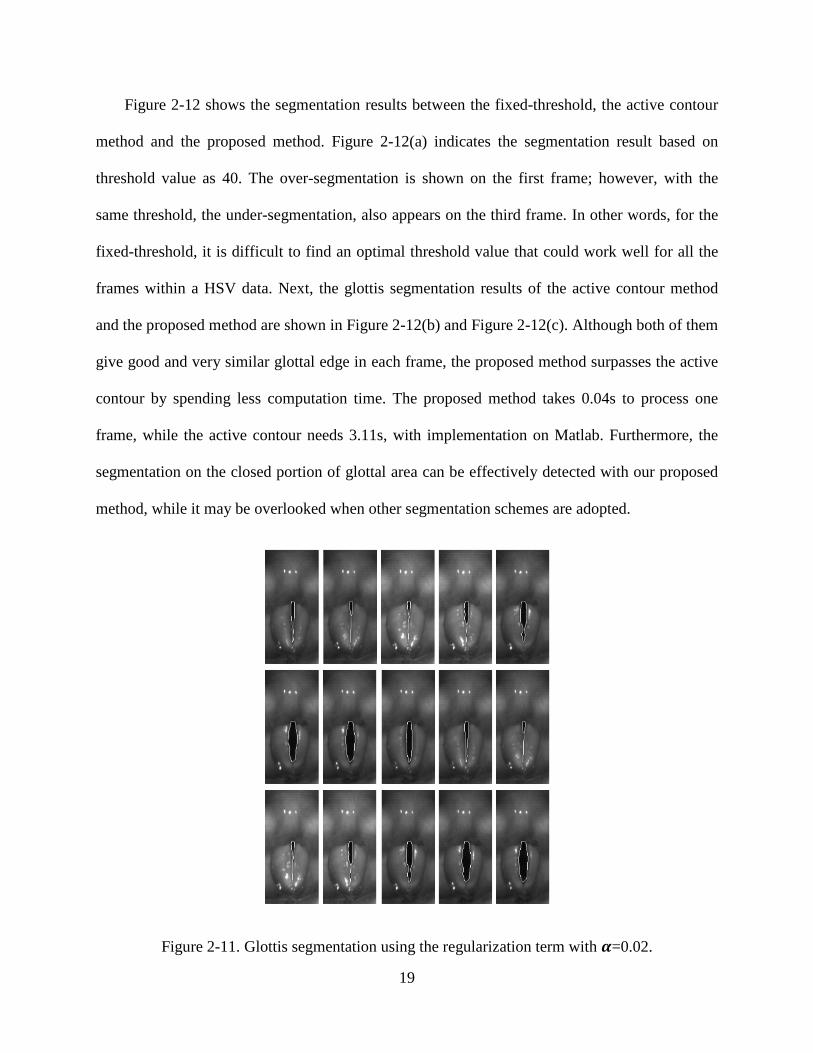
Figure 2-11 gives the glottis segmentation result of a HSV data by using the 𝛼 value with
0.02. The glottal edge extraction is correct in every frame and not affected by any reflection.
Next, the effectiveness of the proposed method is compared to two other segmentation methods.
The first one is the fixed-threshold method, which acquires the threshold between foreground
and background of image based on the histogram [41]. The second alternate method is the active
contour method without edges [50].
19
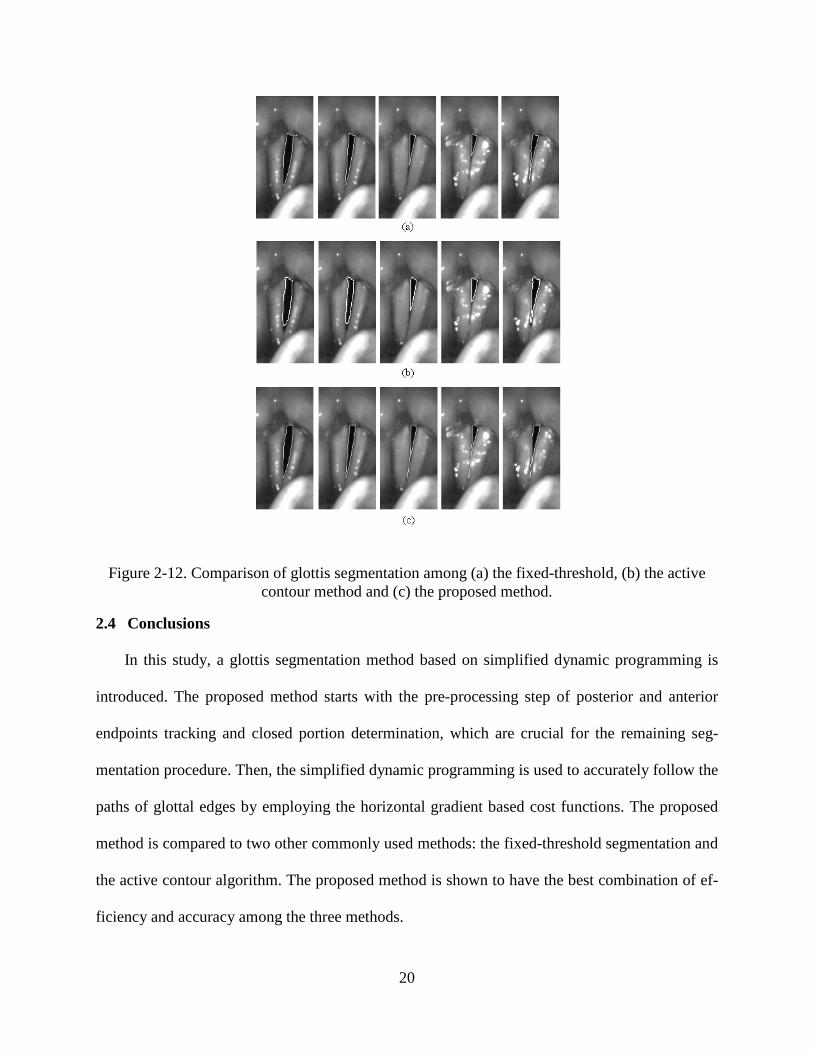
Figure 2-12 shows the segmentation results between the fixed-threshold, the active contour
method and the proposed method. Figure 2-12(a) indicates the segmentation result based on
threshold value as 40. The over-segmentation is shown on the first frame; however, with the
same threshold, the under-segmentation, also appears on the third frame. In other words, for the
fixed-threshold, it is difficult to find an optimal threshold value that could work well for all the
frames within a HSV data. Next, the glottis segmentation results of the active contour method
and the proposed method are shown in Figure 2-12(b) and Figure 2-12(c). Although both of them
give good and very similar glottal edge in each frame, the proposed method surpasses the active
contour by spending less computation time. The proposed method takes 0.04s to process one
frame, while the active contour needs 3.11s, with implementation on Matlab. Furthermore, the
segmentation on the closed portion of glottal area can be effectively detected with our proposed
method, while it may be overlooked when other segmentation schemes are adopted.
Figure 2-11. Glottis segmentation using the regularization term with 𝜶=0.02.
20
Figure 2-12. Comparison of glottis segmentation among (a) the fixed-threshold, (b) the active contour method and (c) the proposed method.
2.4 Conclusions
In this study, a glottis segmentation method based on simplified dynamic programming is
introduced. The proposed method starts with the pre-processing step of posterior and anterior
endpoints tracking and closed portion determination, which are crucial for the remaining seg-
mentation procedure. Then, the simplified dynamic programming is used to accurately follow the
paths of glottal edges by employing the horizontal gradient based cost functions. The proposed
method is compared to two other commonly used methods: the fixed-threshold segmentation and
the active contour algorithm. The proposed method is shown to have the best combination of ef-
ficiency and accuracy among the three methods.
21
CHAPTER 3. GLOTTAL AXIS DETERMINATION TECHNIQUES
3.1 Background
We have stated that a key step in computing quantitative vocal fold vibratory characteristics
is glottal axis determination. Obtaining reliably certain HSV features hinges on consistent and
dependable determination of glottal axis both within each HSV data and across different HSV
data. The most reliable determination method would be to determine the axis manually on frame
by frame or glottic cycle by cycle basis. However, for practical reasons, due to the vast HSV data
generated, such manual operation is not feasible, and the axis determination has to be automated.
Therefore, an accurate and automatic glottal axis determination technique is a critical require-
ment in analyses of objective axes-based HSV features.
The existing automatic glottal axis determination methods can be classified into two catego-
ries: the anterior-posterior extreme glottal area points based method and linear regression line
based method. The first method detects the glottal axis by connecting the most posterior and an-
terior points within glottal area [11][27][29][51]. One explicit approach to determine the most
anterior and posterior points of glottal area is to get the two points which are the vertical ex-
tremes of the segmented glottis pixels of vocal fold image [15]. The drawback of this method is
that the positions of those two extreme points on distinct frames can vary greatly due to the glot-
tis size. To alleviate this potential problem, Wittenberg in [15] calculated the average values of
those two positions over several consecutive frames in a video. However, the use of the posterior
extreme point may create problem when arytenoids fold posteriorly during phonation. The other
automatic axis determination method is based on linear regression. In this strategy, the glottal
axis is defined by the linear regression line of the glottal area pixels [2][23]-[24][30] or of the
midpoints of the glottal edges [28].
22
Considering that some disordered voice with irregular vocal fold shape may lead to the dif-
ficulty in finding glottal axis, we propose to integrate the most anterior glottal edge point into
linear regression to find the glottal axis, since the most anterior glottal edge point is stable and
visible in HSV data. Besides, in this study, we also introduce the principal component analysis
(PCA) to determine the glottal axis to make the comparison. In addition, this study presents the
performances of the automatic glottal axis determination techniques (both the proposed and ex-
isting techniques) in differentiating normal vocal fold vibratory patterns from the vibratory pat-
tern of vocal folds with polyp (pre-surgery). The glottal axis based features are computed and
statistically analyzed for each automatic glottal axis determination technique individually.
3.2 Methodology
3.2.1 Subject and HSV Data Acquisition
The study data includes HSV recordings of 13 subjects with vocal fold polyp (both pre- and
post-surgery) and 20 subjects with normal vocal fold (10 males and 10 females). All HSV data
used in these studies are recorded at 2000 frames per second with KayPENTAX HSV system
(Model 9700, Montvale, NJ). Each frame of HSV data is a black-white image, 120 pixels wide
by 256 pixels high. For every recording, a segment of 2000 frames is selected from sustained
phonation for the study.
3.2.2 Glottal Axis Determination (GAD) Techniques
All the glottal axis determination techniques presented in this study are based on the loca-
tions of the glottal edge pixels in each HSV frame. The following mathematical notations are in-
troduced for the proceeding section describing the glottal axis determination techniques. Assum-
ing glottal edge pixels are found for an HSV frame, the edge pixel locations are defined by
, , where and
23
represent the vertical and horizontal pixel indices, respectively. The origin of the coordinate is
located at the upper left corner of the frame. The set of edge pixels are defined as
. Also, the coordinate points of the edge pixels are given by two vectors:
for the -coordinates and for the -coordinates.
The glottal axis is defined as the line between the most posterior and anterior of glottal area.
In detail, the location of posterior glottal axis is determined by ensuring the line is passed be-
tween the mid-point of vocal processes of the right and left true vocal folds. The location of ante-
rior glottal axis is defined as the most anterior point of the glottal area. However, without any
manual guidance, it is hard to correctly and automatically extract the mid-point between vocal
processes in each frame of HSV data. Further, the substitution of posteriorly extreme point as the
mid-point may create problem when arytenoids fold posteriorly during phonation. Therefore,
five automatic axis determination techniques are evaluated in this study, including extreme point
technique (EP), linear regression technique (REG), the modified linear regression technique
(MREG), principal component analysis technique (PCA), and the modified PCA technique
(MPCA). The details of each method are given in the subsections.
In each HSV frame, the glottal axis is defined as a function of the vertical axis 𝑥. For the 𝑖-
th frame, it is given by:
𝑦 = 𝑚𝑖𝑥 + 𝑏𝑖…………………………………………………………………………………... 3.1
where 𝑚𝑖 is the slope and 𝑏𝑖 is the 𝑦-intercept.
With the assumption that the glottal axis hardly change within one vibration cycle, each
GAD technique is applied only on the maximum opening frame of each vibration cycle to get
24
their axes. Then, linear interpolation is utilized on the axis of maximum opening frames to ac-
quire the axes of the rest frames.
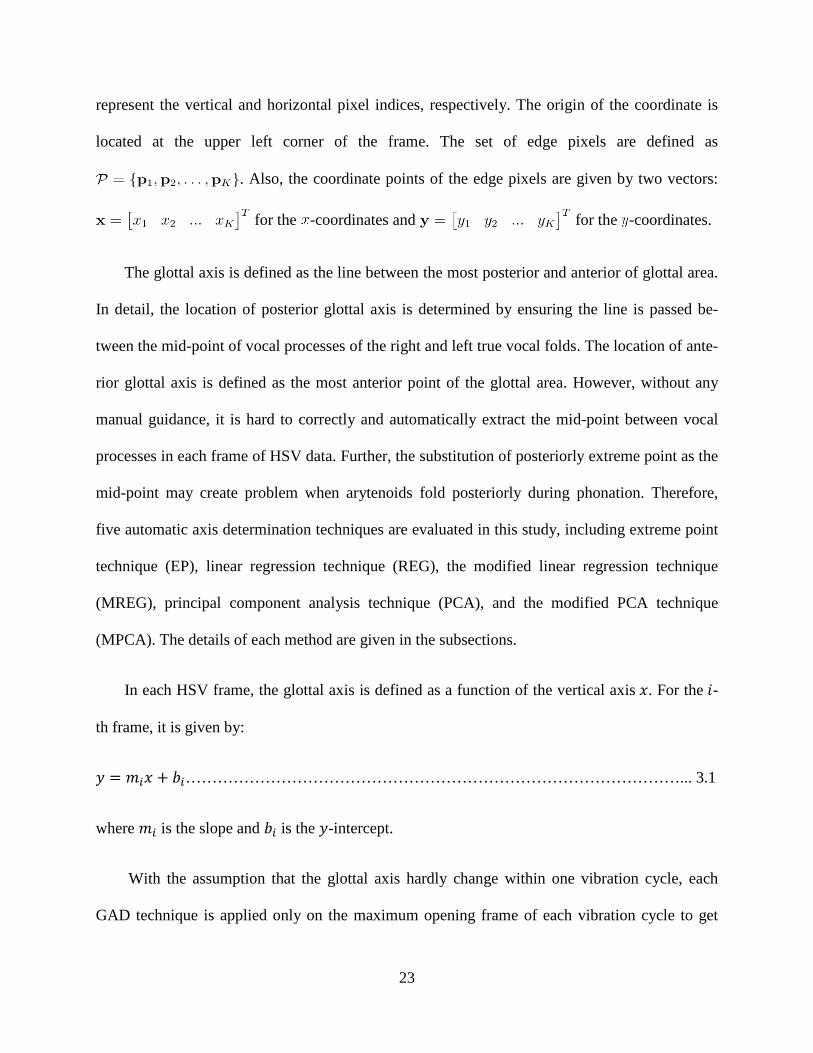
• Extreme Points (EP) Technique
For the maximum opening frame in each vibration cycle, the glottal axis is obtained by con-
necting the two extreme points along vertical direction. Figure 3-1 gives the illustration of this
method. Suppose the extreme points are and in a
frame. Then, the slope and 𝑦-intercept of the glottal axis are calculated by
……………………………………………………………………………….. 3.2
……………………………………………………………………… 3.3
Figure 3-1. Axis determination method-EP
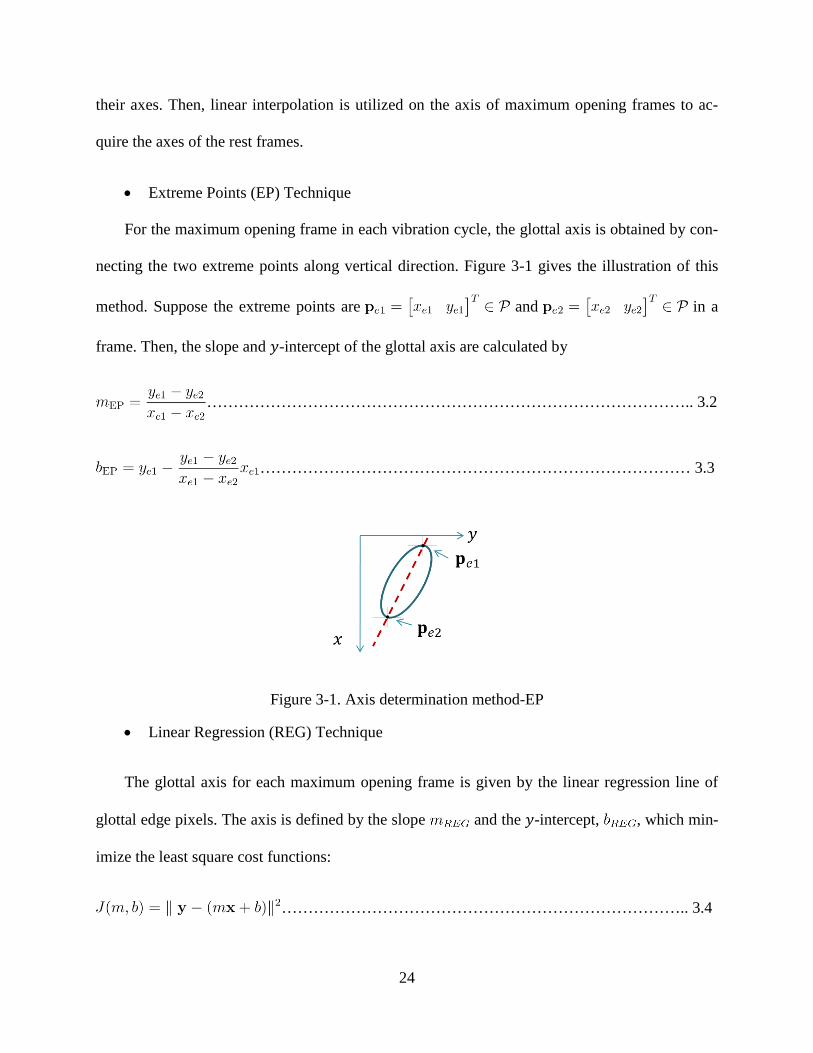
• Linear Regression (REG) Technique
The glottal axis for each maximum opening frame is given by the linear regression line of
glottal edge pixels. The axis is defined by the slope and the 𝑦-intercept, , which min-
imize the least square cost functions:
………………………………………………………………….. 3.4
25
……………………………………………………………. 3.5
The and can be found from Figure 3-2.
Figure 3-2. Axis determination method-REG
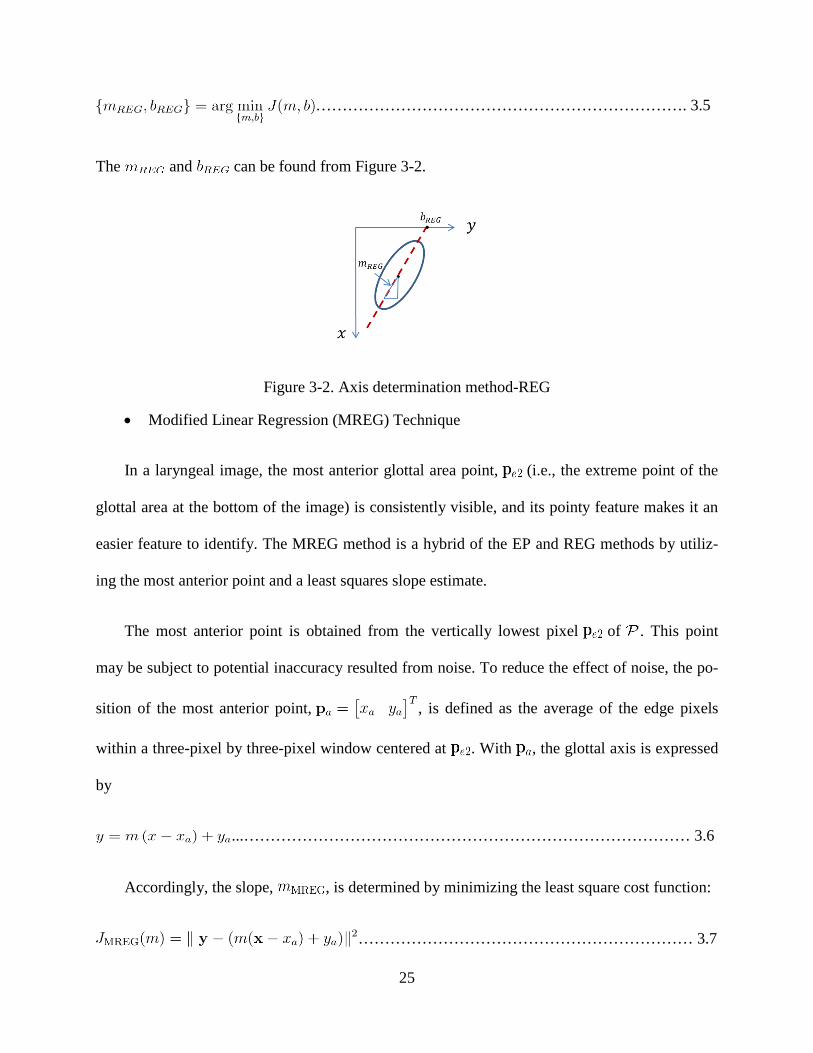
• Modified Linear Regression (MREG) Technique
In a laryngeal image, the most anterior glottal area point, (i.e., the extreme point of the
glottal area at the bottom of the image) is consistently visible, and its pointy feature makes it an
easier feature to identify. The MREG method is a hybrid of the EP and REG methods by utiliz-
ing the most anterior point and a least squares slope estimate.
The most anterior point is obtained from the vertically lowest pixel of . This point
may be subject to potential inaccuracy resulted from noise. To reduce the effect of noise, the po-
sition of the most anterior point, , is defined as the average of the edge pixels
within a three-pixel by three-pixel window centered at . With , the glottal axis is expressed
by
...………………………………………………………………………… 3.6
Accordingly, the slope, , is determined by minimizing the least square cost function:
……………………………………………………… 3.7
26
Finally, the -intercept is obtained by
………………………………………………………………………. 3.8
The illustration of , and can be found from Figure 3-3.
Figure 3-3. Axis determination method-MREG
• Principal Component Analysis (PCA) Technique
Principal Component Analysis (PCA) is a mathematical procedure that can convert a set of
observations of possibly correlated variables into a set of observations of uncorrelated variables,
which are called principal components, without losing significant information [52]. The number
of principal components is less than or equal to the number of original variables. Therefore, PCA
is mainly used for dimensionality decrease of high-dimensional data. With this idea, the data
points of two dimensions can be easily decreased into one dimension by applying PCA. In other
words, the two dimensionality dataset can be transferred to a line, which conserves most of in-
formation of the original dataset. Corresponding to glottal axis determination, for a frame, all
points on the vocal fold edge can be regarded as the original data points. The line obtained from
applying PCA on edge pixels could be considered as the glottal axis.
27
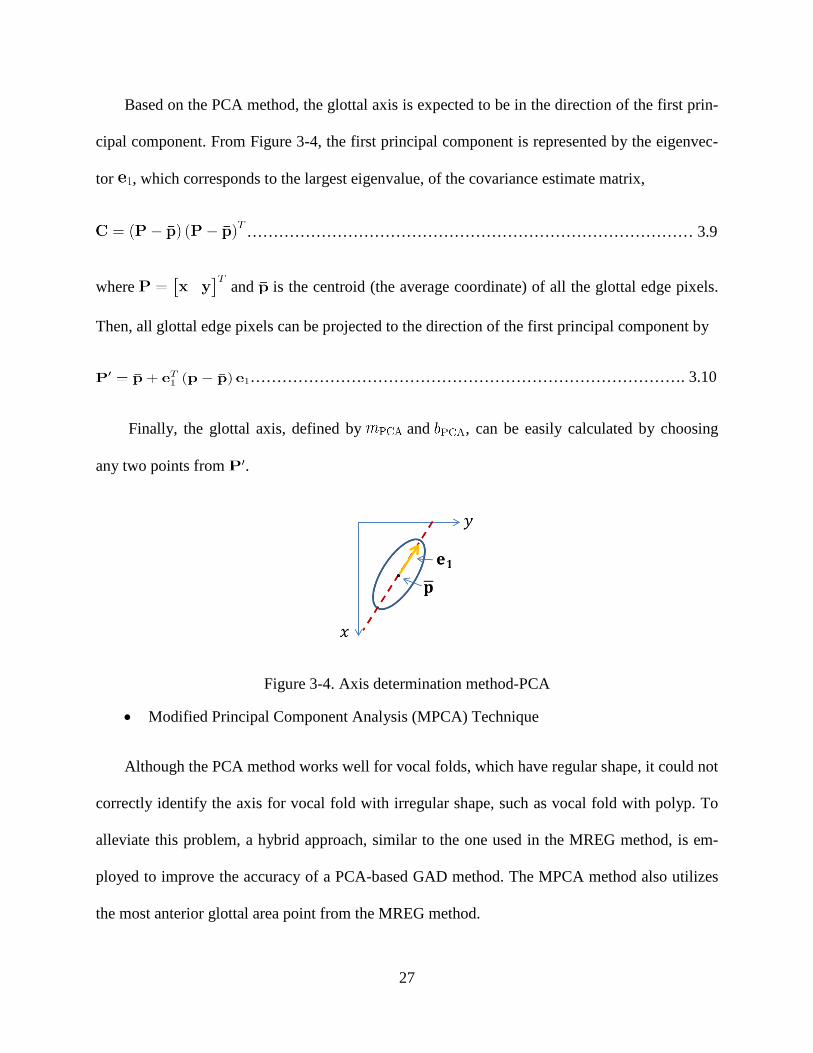
Based on the PCA method, the glottal axis is expected to be in the direction of the first prin-
cipal component. From Figure 3-4, the first principal component is represented by the eigenvec-
tor , which corresponds to the largest eigenvalue, of the covariance estimate matrix,
………………………………………………………………………… 3.9
where and is the centroid (the average coordinate) of all the glottal edge pixels.
Then, all glottal edge pixels can be projected to the direction of the first principal component by
………………………………………………………………………. 3.10
Finally, the glottal axis, defined by and , can be easily calculated by choosing
any two points from .
Figure 3-4. Axis determination method-PCA
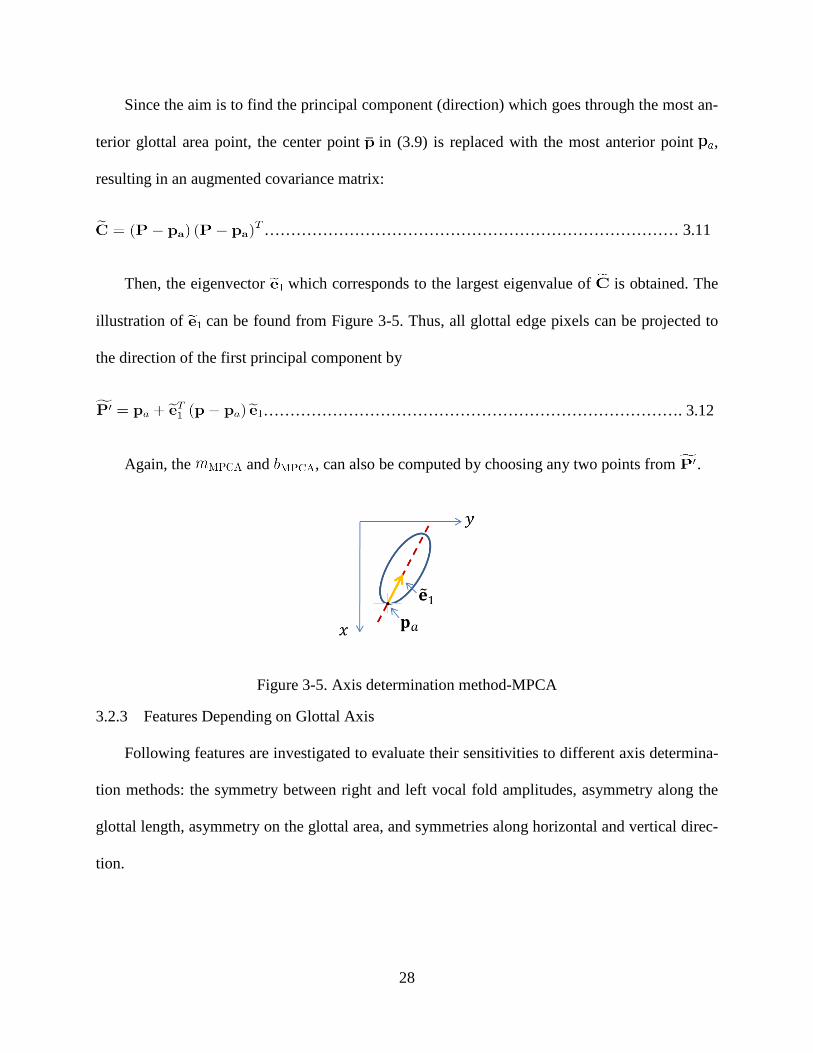
• Modified Principal Component Analysis (MPCA) Technique
Although the PCA method works well for vocal folds, which have regular shape, it could not
correctly identify the axis for vocal fold with irregular shape, such as vocal fold with polyp. To
alleviate this problem, a hybrid approach, similar to the one used in the MREG method, is em-
ployed to improve the accuracy of a PCA-based GAD method. The MPCA method also utilizes
the most anterior glottal area point from the MREG method.
28
Since the aim is to find the principal component (direction) which goes through the most an-
terior glottal area point, the center point in (3.9) is replaced with the most anterior point ,
resulting in an augmented covariance matrix:
…………………………………………………………………… 3.11
Then, the eigenvector which corresponds to the largest eigenvalue of is obtained. The
illustration of can be found from Figure 3-5. Thus, all glottal edge pixels can be projected to
the direction of the first principal component by
……………………………………………………………………. 3.12
Again, the and , can also be computed by choosing any two points from .
Figure 3-5. Axis determination method-MPCA
3.2.3 Features Depending on Glottal Axis
Following features are investigated to evaluate their sensitivities to different axis determina-
tion methods: the symmetry between right and left vocal fold amplitudes, asymmetry along the
glottal length, asymmetry on the glottal area, and symmetries along horizontal and vertical direc-
tion.
29
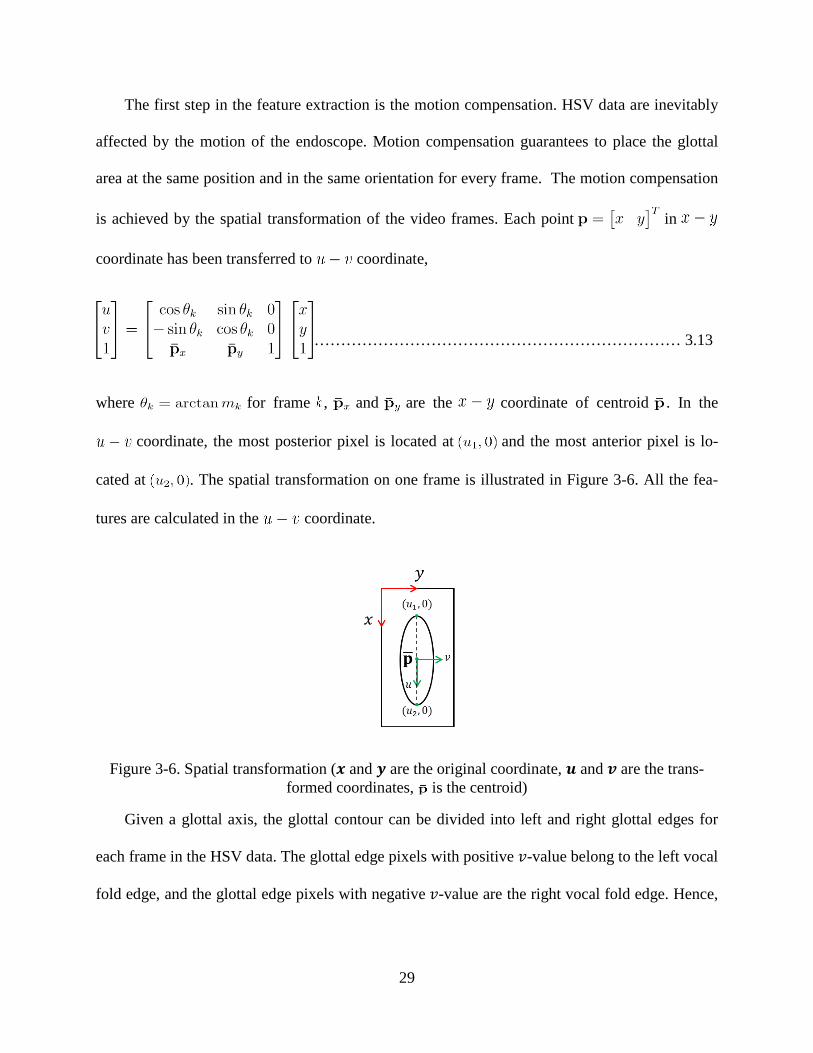
The first step in the feature extraction is the motion compensation. HSV data are inevitably
affected by the motion of the endoscope. Motion compensation guarantees to place the glottal
area at the same position and in the same orientation for every frame. The motion compensation
is achieved by the spatial transformation of the video frames. Each point in
coordinate has been transferred to coordinate,
…………………………………………………………… 3.13
where for frame , and are the coordinate of centroid . In the
coordinate, the most posterior pixel is located at and the most anterior pixel is lo-
cated at . The spatial transformation on one frame is illustrated in Figure 3-6. All the fea-
tures are calculated in the coordinate.
Figure 3-6. Spatial transformation (𝒙 and 𝒚 are the original coordinate, 𝒖 and 𝒗 are the trans-formed coordinates, is the centroid)
Given a glottal axis, the glottal contour can be divided into left and right glottal edges for
each frame in the HSV data. The glottal edge pixels with positive 𝑣-value belong to the left vocal
fold edge, and the glottal edge pixels with negative 𝑣-value are the right vocal fold edge. Hence,

30
the glottal edges are represented by the 𝑣-coordinate values of the left and right glottal edge pix-
els, denoted by 𝑒𝑙(𝑢) and 𝑒𝑟(𝑢), respectively.
• Symmetry between right and left vocal fold amplitudes
For each frame, |𝑒𝑙(𝑢)| and |𝑒𝑟(𝑢)| are also represent the left and right amplitude values
from glottal axis to the glottal edges at each vertical point (along the 𝑢 axis), which is shown in
Figure 3-7.
If the left and right edges are perfectly symmetrical about the glottal axis, |𝑒𝑙(𝑢)| = |𝑒𝑟(𝑢)|
for . To assess the overall symmetry of the edges about the glottal axis, the
difference of the distances is accumulated. The amplitude symmetry is defined as follows:
𝑆 =∑ |𝑒𝑟(𝑢)+𝑒𝑙(𝑢)|𝑢2𝑢=𝑢1
𝐴…………………………………………………………………………. 3.14
The sum of the differences is normalized by the glottal area,
𝐴 = ∑ |𝑒𝑙(𝑢) − 𝑒𝑟(𝑢)|𝑢2𝑢=𝑢1 …………………………………………………………………... 3.15
to make the feature comparable among recordings. The range of this feature is from zero to infi-
nite, and zero indicates the perfect symmetry.
Figure 3-7. The distances from glottal axis to left and right glottal edge, (a) is the normal vocal fold and (b) is the vocal fold with polyp ( 𝒖=vertical coordinate, −𝒆𝒓(𝒖)=right vocal fold ampli-
tude, 𝒆𝒍(𝒖)=left vocal fold amplitude)

31
• Asymmetry along the glottal length
Asymmetry in length 𝐴𝑙 describes the symmetry attribute along the glottal length,
𝐴𝑙 = 𝑚𝑐𝑚
……………………………………………………………………………………….. 3.16
where 𝑚𝑐 = ∑ 1𝑢2𝑢=𝑢1 . 𝑒𝑙(𝑢) < 0 or 𝑒𝑟(𝑢) > 0 is the length of the part of vocal fold which cross-
es the glottal axis as illustrated in Figure 3-8(a), and 𝑚 = 𝑢2 − 𝑢1 is the total length of glottal
opening. The range of this feature is from zero to one. The smaller the value, the better the sym-
metry in length is.
• Asymmetry on the glottal area
Asymmetry in area 𝐴𝑎 represents the symmetry attribute for glottal area,
𝐴𝑎 = 𝐴𝑐𝐴
……………………………………………………………………………………….. 3.17
where 𝐴𝑐 = 𝐴𝑙 + 𝐴𝑟, 𝐴𝑙 = ∑ 𝑒𝑙(𝑢)𝑢2𝑢=𝑢1 , when 𝑒𝑙(𝑢) < 0; and 𝐴𝑟 = ∑ 𝑒𝑟(𝑢)𝑢2
𝑢=𝑢1 , when 𝑒𝑟(𝑢) >
0 is the area of glottal opening which crosses the glottal axis as illustrated in Figure 3-8(b), and 𝐴
is the area of glottal opening. This feature takes values from zero to one. The smaller the value,
the better the symmetry in area is.
Figure 3-8. Asymmetry along the glottal length and asymmetry on glottal area (𝒎𝒄=the length of the part of vocal fold which crosses the glottal axis, 𝒎=the total length of glottal opening, 𝑨𝒄=the area of glottal opening which crosses the glottal axis, 𝑨=the area of glottal opening)

32
• Symmetries along horizontal and vertical direction
The last pair of features—symmetries along horizontal (𝑆ℎ) and vertical (𝑆𝑣) directions—are
based on the glottal area’s centroid . First, the horizontal line 𝑙ℎ and vertical line 𝑙𝑣 which cross
the centroid are obtained. Then, the distances from the centroid to the four intersected points re-
sulted from the intersection of 𝑙ℎ, 𝑙𝑣 and glottal edge have been determined. Two features includ-
ing 𝑆𝑣 and 𝑆ℎ have been calculated based on 𝑙1, 𝑙2, 𝑙3 and 𝑙4, which are shown in Figure 3-9. In
ideal case, the distance 𝑙1 and 𝑙2 in Figure 3-9 should be the same, and 𝑙3 and 𝑙4 should also be
the same. Therefore, the values of 𝑆𝑣 and 𝑆ℎ should be closed to zero for vocal fold with normal
voice; however, when comes to vocal fold with polyp, the difference between 𝑙1 and 𝑙2, 𝑙3 and 𝑙4
will increase, which, of course, lead to the increase of 𝑆𝑣 and 𝑆ℎ. 𝑆𝑣 and 𝑆ℎ can be acquired by
following equations.
𝑆𝑣 = |𝑙1−𝑙2|𝑙1+𝑙2
……………………………………………………………………………………. 3.18
𝑆ℎ = |𝑙3−𝑙4|𝑙3+𝑙4
……………………………………………………………………………………. 3.19
Figure 3-9. Distances from centroid to other four extreme points (𝒍𝟏 and 𝒍𝟐, 𝒍𝟑 and 𝒍𝟒 are the ver-tical and horizontal distance from centroid to glottal edge)
33
3.3 Analysis
3.3.1 Accuracy Analysis
To evaluate the accuracy of automatic determination technique, the glottal axis obtained
from each GAD technique is compared with the axis selected by a speech language pathologist
(SLP) who has an extensive experience in looking at the endoscopic images of vocal folds. We
select 10 vibration cycles from each HSV data and got their glottal axes, which obtained by us-
ing six GAD techniques (five automatic and one manual). Then, the mean square error between
manual selected glottal axis and each automatic selected axis has been calculated. For one frames
of HSV data, given its manually selected glottal axis with slope and intercept as 𝑚𝑚 and 𝑏𝑚 and
automatic glottal axis with 𝑚𝑎 and 𝑏𝑎. The mean square error will be computed as follows:
𝑒 =∑ (𝑚𝑚𝑥+𝑏𝑚−𝑚𝑎𝑥−𝑏𝑎)2𝑥𝑒2𝑥=𝑥𝑒1
𝑥𝑒2−𝑥𝑒1………………………………………………………………… 3.20
The mean square error is calculated for every frame within the 10 vibration cycles selected
before and the average value is set as the final mean square error for one automatic GAD tech-
nique. The assumption is that the smaller the mean square error between axis from manual selec-
tion and automatic determination, the more accurate the GAD technique is.
3.3.2 Glottal Axes’ Capability to Differentiate Vocal Fold Vibratory Pattern of Normal and Disordered Voices In this study, HSV data from 20 subjects with normal vocal fold (10 males and 10 females),
and 13 subjects with vocal fold polyp (pre- and post-surgery) have been investigated. First, for
each HSV data, 10 vibration cycles from its sustained phonation have been randomly selected.
Then all five GAD techniques are applied on those selected cycles. For one GAD technique, the
glottal axes of the selected vibration cycles could be obtained and all the symmetry features can
34
be calculated based on those glottal axes. Only maximum opening frame of each cycle is used
while computing the symmetry features. Finally, the average value among those 10 maximum
opening frames is computed and set as the final value for each feature of every HSV data. The
same feature extraction has been done for the other four GAD techniques.
Consequently, five groups of symmetry features corresponding to five GAD techniques are
acquired. Each group includes features extracted from three vibratory patterns of vocal folds
(normal vocal fold, vocal folds with polyp of pre- and post-surgery). The five GAD techniques’
capability for differentiating the vocal fold vibratory pattern of normal and disordered voices are
compared based on these symmetry features.
The statistical analysis of two-way ANOVA with significant level of 0.05 has been used to
identify the features’ stability across different GAD techniques.
The statistical analysis of MANOVA with significant level of 0.05 has been adopted in
comparison between normal vocal fold vibratory patterns and the vibratory pattern of vocal folds
with polyp (pre-surgery). In addition to p-value, MANOVA analysis also provides a parameter
of group mean distance (𝑔𝑚𝑑𝑖𝑠𝑡) between two groups. In this study, 𝑔𝑚𝑑𝑖𝑠𝑡 is adopted to rep-
resent glottal axis ability to differentiate different vocal folds.
3.4 Results
3.4.1 Results on Accuracy Analysis
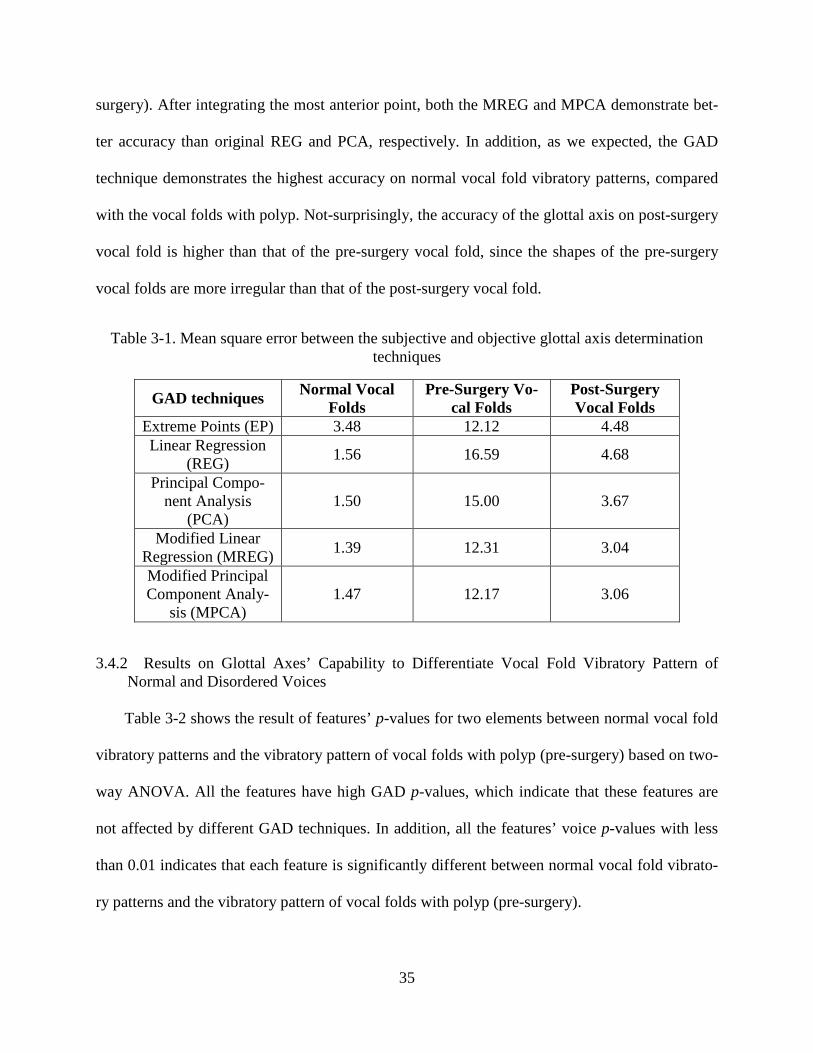
The result of the mean square error for each GAD technique is shown in Table 3-1. It can be
seen that the modified linear regression (MREG) technique gives the best performance on nor-
mal vocal fold vibratory patterns, as well as the vibratory pattern of vocal folds with polyp (post-
surgery). MPCA shows the most accuracy on the vibratory pattern of vocal fold with polyp (pre-
35
surgery). After integrating the most anterior point, both the MREG and MPCA demonstrate bet-
ter accuracy than original REG and PCA, respectively. In addition, as we expected, the GAD
technique demonstrates the highest accuracy on normal vocal fold vibratory patterns, compared
with the vocal folds with polyp. Not-surprisingly, the accuracy of the glottal axis on post-surgery
vocal fold is higher than that of the pre-surgery vocal fold, since the shapes of the pre-surgery
vocal folds are more irregular than that of the post-surgery vocal fold.
Table 3-1. Mean square error between the subjective and objective glottal axis determination techniques
GAD techniques Normal Vocal Folds
Pre-Surgery Vo-cal Folds
Post-Surgery Vocal Folds
Extreme Points (EP) 3.48 12.12 4.48 Linear Regression
(REG) 1.56 16.59 4.68
Principal Compo-nent Analysis
(PCA) 1.50 15.00 3.67
Modified Linear Regression (MREG) 1.39 12.31 3.04
Modified Principal Component Analy-
sis (MPCA) 1.47 12.17 3.06
3.4.2 Results on Glottal Axes’ Capability to Differentiate Vocal Fold Vibratory Pattern of Normal and Disordered Voices
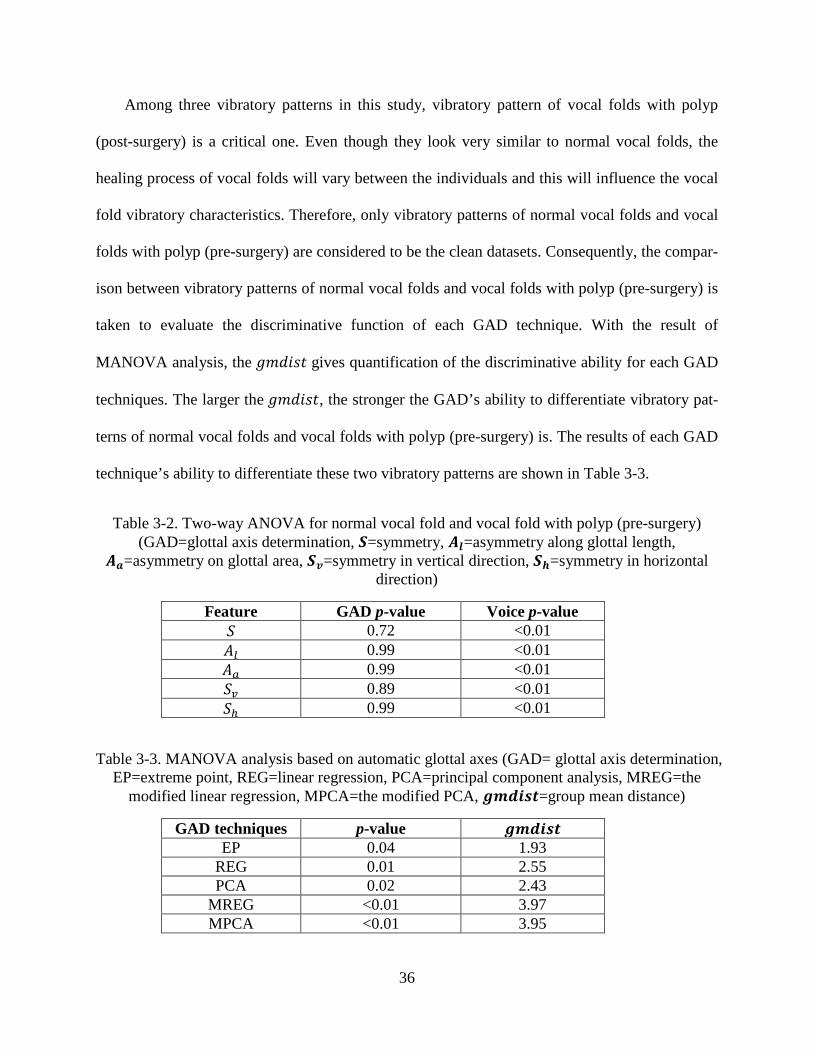
Table 3-2 shows the result of features’ p-values for two elements between normal vocal fold
vibratory patterns and the vibratory pattern of vocal folds with polyp (pre-surgery) based on two-
way ANOVA. All the features have high GAD p-values, which indicate that these features are
not affected by different GAD techniques. In addition, all the features’ voice p-values with less
than 0.01 indicates that each feature is significantly different between normal vocal fold vibrato-
ry patterns and the vibratory pattern of vocal folds with polyp (pre-surgery).
36
Among three vibratory patterns in this study, vibratory pattern of vocal folds with polyp
(post-surgery) is a critical one. Even though they look very similar to normal vocal folds, the
healing process of vocal folds will vary between the individuals and this will influence the vocal
fold vibratory characteristics. Therefore, only vibratory patterns of normal vocal folds and vocal
folds with polyp (pre-surgery) are considered to be the clean datasets. Consequently, the compar-
ison between vibratory patterns of normal vocal folds and vocal folds with polyp (pre-surgery) is
taken to evaluate the discriminative function of each GAD technique. With the result of
MANOVA analysis, the 𝑔𝑚𝑑𝑖𝑠𝑡 gives quantification of the discriminative ability for each GAD
techniques. The larger the 𝑔𝑚𝑑𝑖𝑠𝑡, the stronger the GAD’s ability to differentiate vibratory pat-
terns of normal vocal folds and vocal folds with polyp (pre-surgery) is. The results of each GAD
technique’s ability to differentiate these two vibratory patterns are shown in Table 3-3.
Table 3-2. Two-way ANOVA for normal vocal fold and vocal fold with polyp (pre-surgery) (GAD=glottal axis determination, 𝑺=symmetry, 𝑨𝒍=asymmetry along glottal length,
𝑨𝒂=asymmetry on glottal area, 𝑺𝒗=symmetry in vertical direction, 𝑺𝒉=symmetry in horizontal direction)
Feature GAD p-value Voice p-value 𝑆 0.72 <0.01 𝐴𝑙 0.99 <0.01 𝐴𝑎 0.99 <0.01 𝑆𝑣 0.89 <0.01 𝑆ℎ 0.99 <0.01
Table 3-3. MANOVA analysis based on automatic glottal axes (GAD= glottal axis determination, EP=extreme point, REG=linear regression, PCA=principal component analysis, MREG=the
modified linear regression, MPCA=the modified PCA, 𝒈𝒎𝒅𝒊𝒔𝒕=group mean distance)
GAD techniques p-value 𝒈𝒎𝒅𝒊𝒔𝒕 EP 0.04 1.93
REG 0.01 2.55 PCA 0.02 2.43
MREG <0.01 3.97 MPCA <0.01 3.95
37
3.5 Discussions
The main goal of this study is to find the best glottal axis determination technique. To reach
this goal, two evaluation methods are conducted. First we identify and modified five GAD tech-
niques and compared them to subjective determination of glottal axis. It can be found from Table
3-1 that the MREG give the best accuracy on glottal axis detection since it has the smallest error
when comparing to the subjective determination result. Second, we develop symmetry features
which are dependent on the use of the glottal axis and determine performances of each GAD
techniques in differentiating vibratory patterns of normal vocal folds and vocal folds with polyp
(pre-surgery) using these symmetry features. Based on Table 3-3, we can also find that the
MREG still demonstrates the best performances with the largest 𝑔𝑚𝑑𝑖𝑠𝑡 value, which indicates
that MREG makes the largest separation between vibratory patterns of normal vocal folds and
vocal folds with polyp (pre-surgery).
Another goal of this study is to determine if the glottal axis dependent variables such as
symmetry features of true vocal fold vibratory patterns are affected by the implementation of dif-
ferent GAD techniques or not. The symmetry features, including the symmetry between right
and left vocal fold amplitudes, asymmetry along the glottal length, asymmetry on the glottal area,
and symmetries along horizontal and vertical direction, can be affected by two elements in this
study. One is different GAD techniques, and the other is the presence or absence of a polyp on
vocal fold. Reliable use of symmetry features will depend upon, first their ability to differentiate
between true vocal fold with and without polyp and second, not being affected by different GAD
techniques. A two-way ANOVA is demonstrated (Table 3-2) that all the symmetry features are
not affected by different GAD techniques (with GAD’s p-values are larger than 0.05) and could
38
differentiate vibratory patterns of normal vocal folds and vocal folds with polyp (pre-surgery)
(with voice’s p-values are smaller than 0.05).
In addition to 𝑔𝑚𝑑𝑖𝑠𝑡, MANOVA analysis also provides canonical variable, which is a line-
ar combination of the mean-centered original features, using coefficients from the eigenvector
matrix. This information can be used to demonstrate visualization details on differentiation of
vibratory patterns of normal vocal folds and vocal folds with polyp (pre-surgery). The distribu-
tion of the HSV data for these two vibratory patterns following the first two canonical variables
based on MREG and EP are shown in Figure 3-10 and Figure 3-11. Corresponding to the result
shown in Table 3-3, MREG with the largest 𝑔𝑚𝑑𝑖𝑠𝑡 gives a very clear division on these two vi-
bratory patterns; on the contrary, EP with the smallest 𝑔𝑚𝑑𝑖𝑠𝑡 shows a poor ability to differenti-
ate these two vibratory patterns. In addition, Figure 3-12 and Figure 3-13 demonstrate the distri-
bution of vibratory patterns of “pre- vs. post- surgery” and “normal vs. post-surgery” vocal fold,
respectively. Compared to “normal vs. pre-surgery”, there is more overlap between vibratory
patterns of pre- and post-surgery vocal fold. The distribution of vibratory patterns of normal and
post-surgery vocal fold has the largest overlap among these three comparisons. From clinical
perspective, the overlap between the vibratory patterns of pre and post-surgery vocal fold may
indicate the different level of healing of vocal folds in individuals with varying degree of polyp
size and type. The more desired overlap between the vibratory patterns of normal and post-
surgery vocal fold indicates the vibratory patterns of vocal folds with polyp reaching to more
normal vocal fold vibratory patterns found in normal voices after surgery.
In addition, the GAD technique of MREG demonstrated the best performance in differentiat-
ing the vibratory patterns of normal vocal folds and vocal folds with polyp (pre-surgery) in this
study with 𝑔𝑚𝑑𝑖𝑠𝑡 of 3.97. The MPCA, which has very close mean square error and 𝑔𝑚𝑑𝑖𝑠𝑡
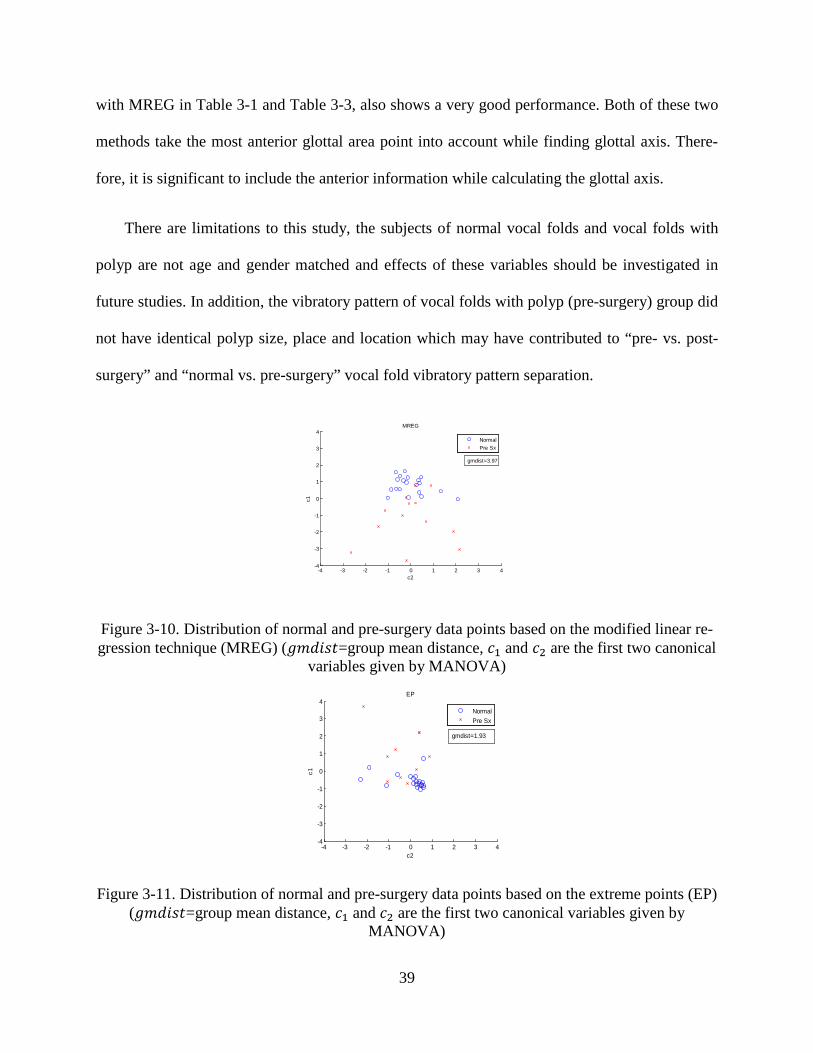
39
with MREG in Table 3-1 and Table 3-3, also shows a very good performance. Both of these two
methods take the most anterior glottal area point into account while finding glottal axis. There-
fore, it is significant to include the anterior information while calculating the glottal axis.
There are limitations to this study, the subjects of normal vocal folds and vocal folds with
polyp are not age and gender matched and effects of these variables should be investigated in
future studies. In addition, the vibratory pattern of vocal folds with polyp (pre-surgery) group did
not have identical polyp size, place and location which may have contributed to “pre- vs. post-
surgery” and “normal vs. pre-surgery” vocal fold vibratory pattern separation.
Figure 3-10. Distribution of normal and pre-surgery data points based on the modified linear re-gression technique (MREG) (𝑔𝑚𝑑𝑖𝑠𝑡=group mean distance, 𝑐1 and 𝑐2 are the first two canonical
variables given by MANOVA)
Figure 3-11. Distribution of normal and pre-surgery data points based on the extreme points (EP) (𝑔𝑚𝑑𝑖𝑠𝑡=group mean distance, 𝑐1 and 𝑐2 are the first two canonical variables given by
MANOVA)
-4 -3 -2 -1 0 1 2 3 4-4
-3
-2
-1
0
1
2
3
4
c2
c1
MREG
NormalPre Sx
gmdist=3.97
-4 -3 -2 -1 0 1 2 3 4-4
-3
-2
-1
0
1
2
3
4
c2
c1
EP
NormalPre Sx
gmdist=1.93
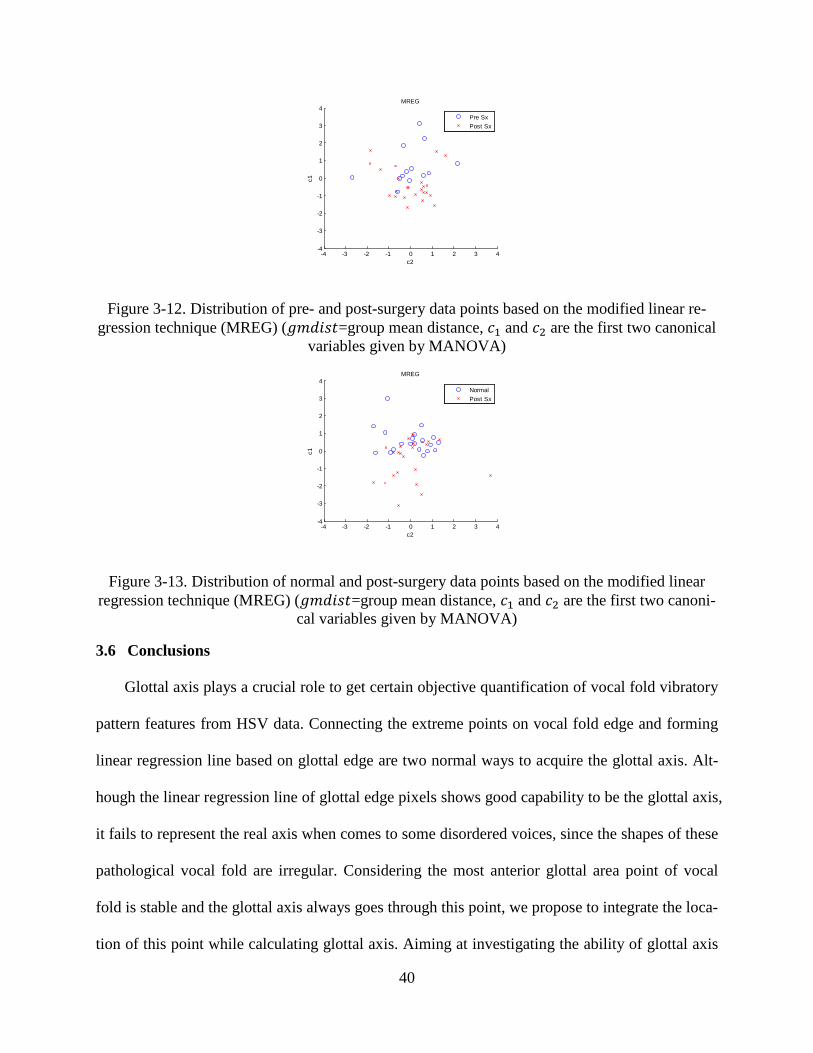
40
Figure 3-12. Distribution of pre- and post-surgery data points based on the modified linear re-gression technique (MREG) (𝑔𝑚𝑑𝑖𝑠𝑡=group mean distance, 𝑐1 and 𝑐2 are the first two canonical
variables given by MANOVA)
Figure 3-13. Distribution of normal and post-surgery data points based on the modified linear regression technique (MREG) (𝑔𝑚𝑑𝑖𝑠𝑡=group mean distance, 𝑐1 and 𝑐2 are the first two canoni-
cal variables given by MANOVA)
3.6 Conclusions
Glottal axis plays a crucial role to get certain objective quantification of vocal fold vibratory
pattern features from HSV data. Connecting the extreme points on vocal fold edge and forming
linear regression line based on glottal edge are two normal ways to acquire the glottal axis. Alt-
hough the linear regression line of glottal edge pixels shows good capability to be the glottal axis,
it fails to represent the real axis when comes to some disordered voices, since the shapes of these
pathological vocal fold are irregular. Considering the most anterior glottal area point of vocal
fold is stable and the glottal axis always goes through this point, we propose to integrate the loca-
tion of this point while calculating glottal axis. Aiming at investigating the ability of glottal axis
-4 -3 -2 -1 0 1 2 3 4-4
-3
-2
-1
0
1
2
3
4
c2
c1
MREG
Pre SxPost Sx
-4 -3 -2 -1 0 1 2 3 4-4
-3
-2
-1
0
1
2
3
4
c2
c1
MREG
NormalPost Sx
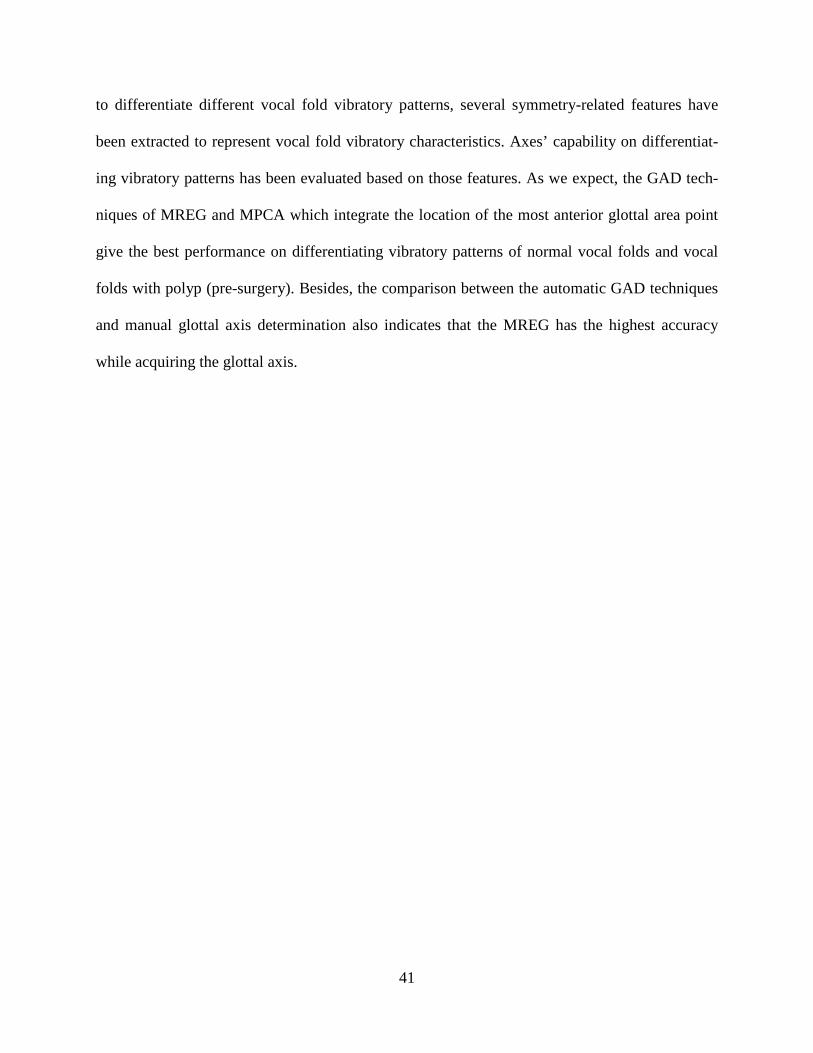
41
to differentiate different vocal fold vibratory patterns, several symmetry-related features have
been extracted to represent vocal fold vibratory characteristics. Axes’ capability on differentiat-
ing vibratory patterns has been evaluated based on those features. As we expect, the GAD tech-
niques of MREG and MPCA which integrate the location of the most anterior glottal area point
give the best performance on differentiating vibratory patterns of normal vocal folds and vocal
folds with polyp (pre-surgery). Besides, the comparison between the automatic GAD techniques
and manual glottal axis determination also indicates that the MREG has the highest accuracy
while acquiring the glottal axis.
42
CHAPTER 4. CLASSIFICATION OF VOCAL FOLD VIBRATION IN VOICE DISORDERS WITH VARYING ETIOLOGY
4.1 Background
One of the most important goals of vocal fold analysis is to investigate the vocal fold func-
tion for voice disorders with different etiology. The examination of vocal fold vibratory function
is one of the essential parts of clinical voice assessment in determining effects of a vocal pathol-
ogy. The investigation of symmetry and regularity of vocal fold vibration patterns are two im-
portant measurements [53]. High speed videoendoscopy with large frame rate makes the obser-
vation of irregular vibration feasible. However, the most used technique to evaluate HSV data is
the perceptual evaluation of its data. Currently available HSV system with their increased tem-
poral and spatial resolutions allows the use of image processing techniques to quantify HSV data
objectively. This enables the quantitative analysis for the symmetry and regularity features of
vocal fold vibratory features.
The objective analysis that quantifies the vibration characteristics of vocal fold has been ex-
plored for a long time. There are a large body of literatures addressing the features which can be
used to do the objective analysis. The most commonly used features are based on the glottal area
waveform. For this type of features, we need to calculate the glottal area for each frame at first,
and then get the one dimensional glottal area waveform [7]. The oscillation cycle can be deter-
mined by choosing the frame from a maximum/minimum glottal opening to the next one. There-
fore, the features such as the open quotient which describe the proportion of time the glottis is
open during a vibration cycle [54], the glottal insufficiency which captures the relation between
the maximum and minimum glottal opening for each cycle [55], and amplitude periodicity that
computes a vocal fold’s deflection stability [16] can be extracted from the glottal area waveform.
43
In addition, similar to extracting features from glottal area waveform, we could also explore fea-
tures such as lateral peaks, mucosal waves, and medial peaks [10][56] based on
videokymography data, which is one dimensional data obtained from a certain position in each
frame. However, unless we have an extremely stable vocal fold and high speed camera while
collecting the high speed data, getting these features is highly challenging since it is not easy to
capture the same position of vocal fold in each frame. On the other hand, some biomechanical
model parameters can be used as good objective features too. Specifically, a biomechanical
model is investigated to fit vocal fold vibration [11][29]. Besides, the aforementioned PVG pa-
rameters can be good features [57]. While most of features are obtained based on the sustained
phonation period, the parameters computed from vocal fold onset and offset period can be anoth-
er type of features [58]. Unlike the sustained phonation period which implies a stable stage, the
onset that represents the initiation of phonation and the offset corresponding to the ending of
phonation also may convey valuable vibration information. In this study, we explore new fea-
tures in addition to some traditional features such as symmetry and open quotient [54]; with a
particular focus on features that could represent the information within one vibration cycle and
the shape of glottal area.
For a vocal fold, we could have a feature vector to demonstrate its oscillation pattern after
getting features from its HSV recording. According to this feature vector, classification could be
achieved to differentiate healthy and pathological vocal fold. However, some features may give
similar values while evaluating two different types of vocal folds. In other word, this feature is
not discriminant enough for the purpose of classification. In contrast, it will decrease the effi-
ciency of classification. Therefore, principal component analysis (PCA) is adopted to decrease
the dimensionality of feature vectors and get rid of the useless information.
44
In this study, the HSV data of 60 subjects including normal vocal fold, unilateral vocal fold
paralysis and unilateral vocal fold polyp has been used to do the classification. After getting the
final feature vector for each HSV data, both the support vector machine (SVM) and neural net-
work have been used to test the classification rate. Different classification tasks have been set
and analyzed. The result of this study will be discussed in the following section.
4.2 Data
In this study, we have HSV recording collected from 60 different subjects, including 20
subjects with normal vocal fold, 20 subjects with unilateral vocal fold polyp and 20 subjects with
unilateral vocal fold paralysis. All HSV data used in this study is recorded by the same system
mentioned in chapter 3. For every recording, a segment of 100 oscillation cycles is selected from
sustained phonation for the study.
4.3 Feature Extraction
Finding a salient feature is a key step to achieve satisfying result for classification. A dis-
criminant feature could easily improve the classification rate among different types of vocal
folds. In this study, we explore traditional features and also developed new features to test the
classification among different types of vocal folds. The features we investigate are discussed as
follows.
All the features discussed in this study are calculated based on the locations of the glottal
edge pixels in each HSV frame. The same as above chapter, the edge pixel locations are defined
by , , where and
represent the vertical and horizontal pixel indices, respectively.
• Maximum opening index difference (𝑠𝑦𝑛𝑙𝑟)
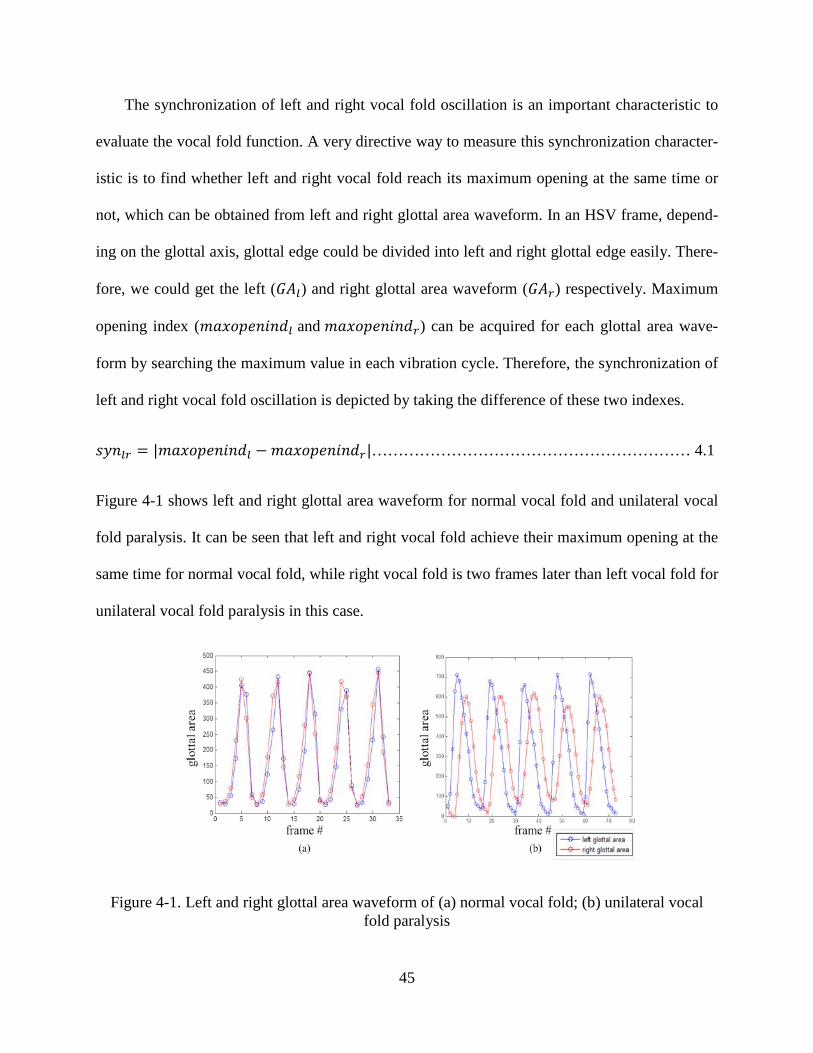
45
The synchronization of left and right vocal fold oscillation is an important characteristic to
evaluate the vocal fold function. A very directive way to measure this synchronization character-
istic is to find whether left and right vocal fold reach its maximum opening at the same time or
not, which can be obtained from left and right glottal area waveform. In an HSV frame, depend-
ing on the glottal axis, glottal edge could be divided into left and right glottal edge easily. There-
fore, we could get the left (𝐺𝐴𝑙) and right glottal area waveform (𝐺𝐴𝑟) respectively. Maximum
opening index (𝑚𝑎𝑥𝑜𝑝𝑒𝑛𝑖𝑛𝑑𝑙 and 𝑚𝑎𝑥𝑜𝑝𝑒𝑛𝑖𝑛𝑑𝑟) can be acquired for each glottal area wave-
form by searching the maximum value in each vibration cycle. Therefore, the synchronization of
left and right vocal fold oscillation is depicted by taking the difference of these two indexes.
𝑠𝑦𝑛𝑙𝑟 = |𝑚𝑎𝑥𝑜𝑝𝑒𝑛𝑖𝑛𝑑𝑙 − 𝑚𝑎𝑥𝑜𝑝𝑒𝑛𝑖𝑛𝑑𝑟|…………………………………………………… 4.1
Figure 4-1 shows left and right glottal area waveform for normal vocal fold and unilateral vocal
fold paralysis. It can be seen that left and right vocal fold achieve their maximum opening at the
same time for normal vocal fold, while right vocal fold is two frames later than left vocal fold for
unilateral vocal fold paralysis in this case.
Figure 4-1. Left and right glottal area waveform of (a) normal vocal fold; (b) unilateral vocal fold paralysis

46
• Oscillation synchronization of left and right glottal edge (𝑟𝑡𝑖𝑜𝑓𝑒𝑞𝑑𝑖𝑟𝑐1, 𝑟𝑡𝑖𝑜𝑓𝑒𝑞𝑑𝑖𝑟𝑐2,
𝑟𝑡𝑖𝑜𝑓𝑒𝑞𝑑𝑖𝑟𝑐3)
The feature of maximum opening index difference generally illustrates how the synchroniza-
tion of left and right glottal opening reach their maximum openings for a vocal fold. However,
this feature only considers the glottal area in each maximum opening frame. For a vocal fold, the
asynchronization may happen from one frame to the next frame, or it may only happen in some
certain portion of vocal fold. In this case, the feature of maximum opening index difference will
miss this information. Aiming at catching the asynchronization from one frame to the next one,
we select three different positions on glottal area first (refers to Figure 4-2), which will guarantee
that different portion of vocal fold is tested for the synchronization. Then the displacement of
glottal edge from one frame to the next one is calculated for left and right vocal fold respectively.
If the left and right vocal folds are synchronization with each other, the displacements should
have different signs with one positive and one negative. In other words, if left and right vocal
folds are asynchronization, which means one glottal area is opening while the other one is clos-
ing, the two displacements will have the same signs. For example, in Figure 4-2, four glottal
edge pixels , , , are got from two
continued frames in the middle position of glottal area. Two displacements can be computed by,
𝑑1 = 𝑦2 − 𝑦1…………………………………………………………………………………… 4.2
𝑑2 = 𝑦3 − 𝑦4…………………………………………………………………………………… 4.3
For exploring the synchronization between these two HSV frames, the sign of 𝑑1 and 𝑑2 is com-
pared at these three positions (𝑟𝑡𝑖𝑜𝑓𝑒𝑞𝑑𝑖𝑟𝑐1, 𝑟𝑡𝑖𝑜𝑓𝑒𝑞𝑑𝑖𝑟𝑐2, 𝑟𝑡𝑖𝑜𝑓𝑒𝑞𝑑𝑖𝑟𝑐3)) respectively.
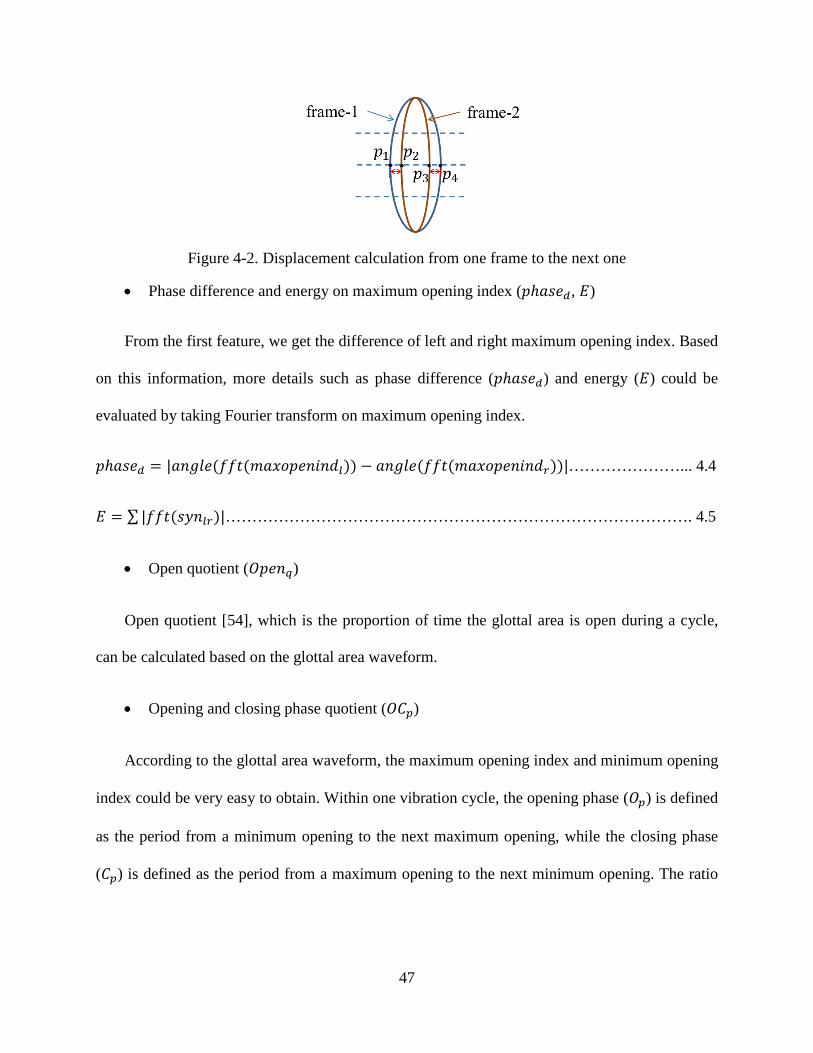
47
Figure 4-2. Displacement calculation from one frame to the next one
• Phase difference and energy on maximum opening index (𝑝ℎ𝑎𝑠𝑒𝑑, 𝐸)
From the first feature, we get the difference of left and right maximum opening index. Based
on this information, more details such as phase difference (𝑝ℎ𝑎𝑠𝑒𝑑) and energy (𝐸) could be
evaluated by taking Fourier transform on maximum opening index.
𝑝ℎ𝑎𝑠𝑒𝑑 = |𝑎𝑛𝑔𝑙𝑒(𝑓𝑓𝑡(𝑚𝑎𝑥𝑜𝑝𝑒𝑛𝑖𝑛𝑑𝑙)) − 𝑎𝑛𝑔𝑙𝑒(𝑓𝑓𝑡(𝑚𝑎𝑥𝑜𝑝𝑒𝑛𝑖𝑛𝑑𝑟))|…………………... 4.4
𝐸 = ∑ |𝑓𝑓𝑡(𝑠𝑦𝑛𝑙𝑟)|……………………………………………………………………………. 4.5
• Open quotient (𝑂𝑝𝑒𝑛𝑞)
Open quotient [54], which is the proportion of time the glottal area is open during a cycle,
can be calculated based on the glottal area waveform.
• Opening and closing phase quotient (𝑂𝐶𝑝)
According to the glottal area waveform, the maximum opening index and minimum opening
index could be very easy to obtain. Within one vibration cycle, the opening phase (𝑂𝑝) is defined
as the period from a minimum opening to the next maximum opening, while the closing phase
(𝐶𝑝) is defined as the period from a maximum opening to the next minimum opening. The ratio
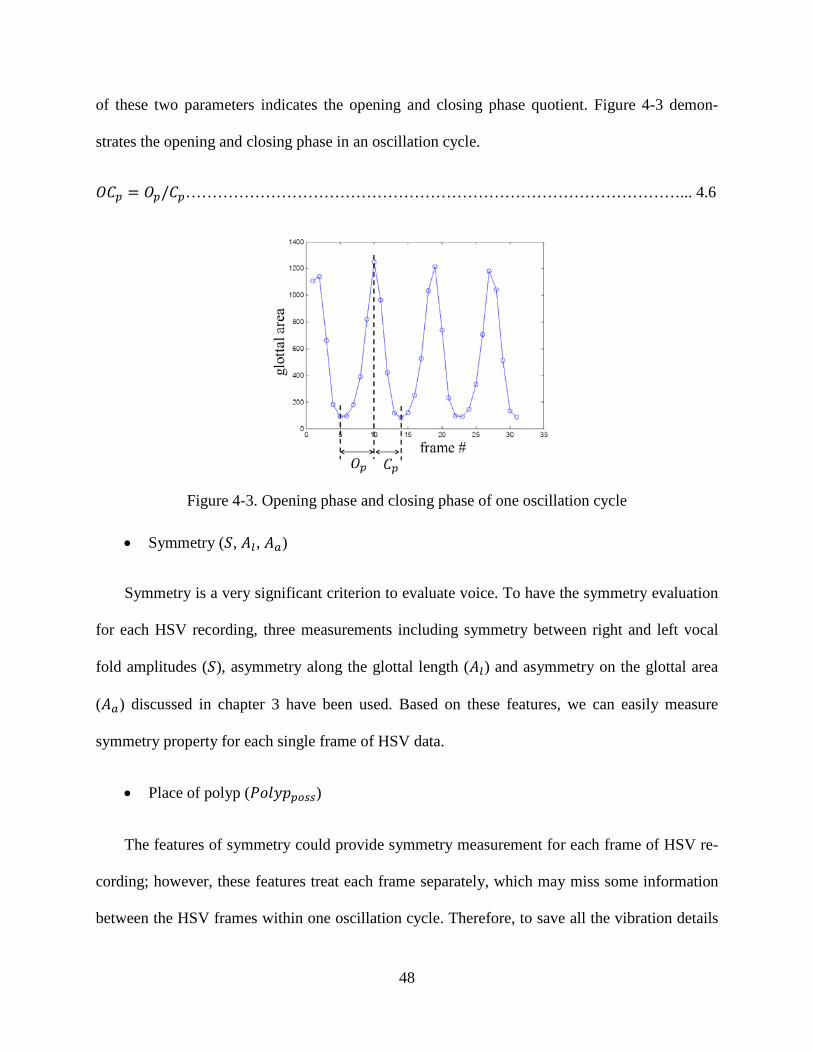
48
of these two parameters indicates the opening and closing phase quotient. Figure 4-3 demon-
strates the opening and closing phase in an oscillation cycle.
𝑂𝐶𝑝 = 𝑂𝑝/𝐶𝑝…………………………………………………………………………………... 4.6
Figure 4-3. Opening phase and closing phase of one oscillation cycle
• Symmetry (𝑆, 𝐴𝑙, 𝐴𝑎)
Symmetry is a very significant criterion to evaluate voice. To have the symmetry evaluation
for each HSV recording, three measurements including symmetry between right and left vocal
fold amplitudes (𝑆), asymmetry along the glottal length (𝐴𝑙) and asymmetry on the glottal area
(𝐴𝑎) discussed in chapter 3 have been used. Based on these features, we can easily measure
symmetry property for each single frame of HSV data.
• Place of polyp (𝑃𝑜𝑙𝑦𝑝𝑝𝑜𝑠𝑠)
The features of symmetry could provide symmetry measurement for each frame of HSV re-
cording; however, these features treat each frame separately, which may miss some information
between the HSV frames within one oscillation cycle. Therefore, to save all the vibration details
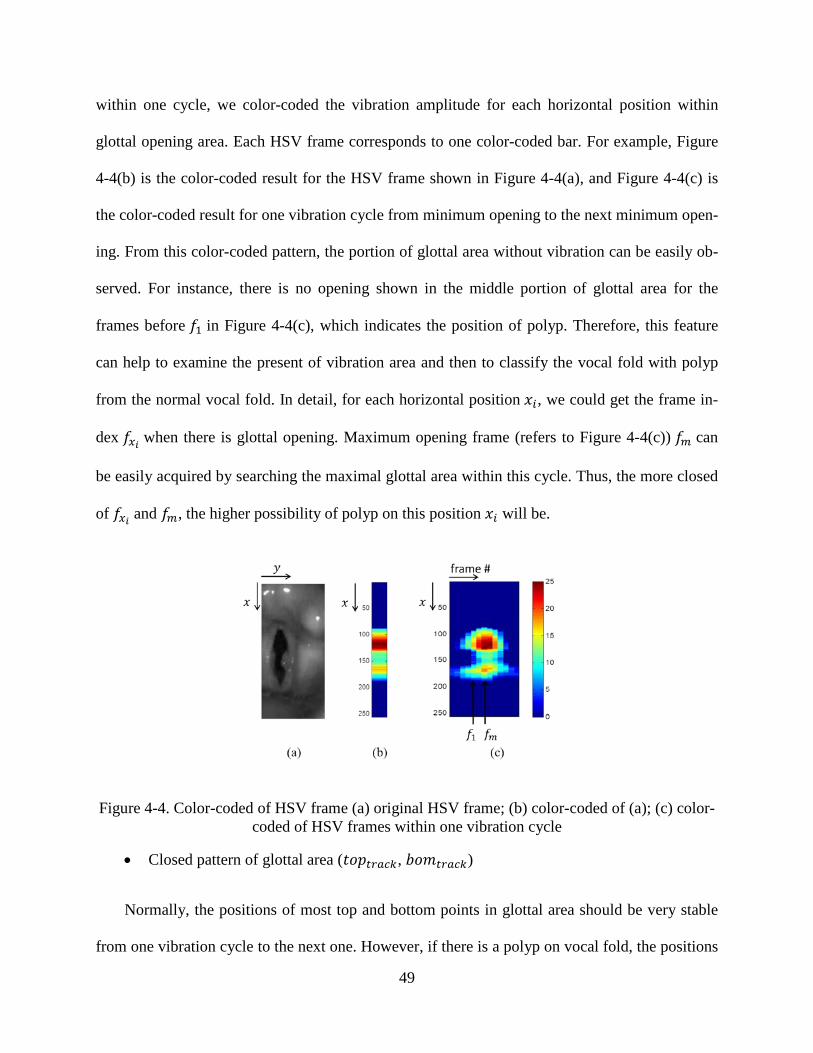
49
within one cycle, we color-coded the vibration amplitude for each horizontal position within
glottal opening area. Each HSV frame corresponds to one color-coded bar. For example, Figure
4-4(b) is the color-coded result for the HSV frame shown in Figure 4-4(a), and Figure 4-4(c) is
the color-coded result for one vibration cycle from minimum opening to the next minimum open-
ing. From this color-coded pattern, the portion of glottal area without vibration can be easily ob-
served. For instance, there is no opening shown in the middle portion of glottal area for the
frames before 𝑓1 in Figure 4-4(c), which indicates the position of polyp. Therefore, this feature
can help to examine the present of vibration area and then to classify the vocal fold with polyp
from the normal vocal fold. In detail, for each horizontal position 𝑥𝑖, we could get the frame in-
dex 𝑓𝑥𝑖 when there is glottal opening. Maximum opening frame (refers to Figure 4-4(c)) 𝑓𝑚 can
be easily acquired by searching the maximal glottal area within this cycle. Thus, the more closed
of 𝑓𝑥𝑖 and 𝑓𝑚, the higher possibility of polyp on this position 𝑥𝑖 will be.
Figure 4-4. Color-coded of HSV frame (a) original HSV frame; (b) color-coded of (a); (c) color-coded of HSV frames within one vibration cycle
• Closed pattern of glottal area (𝑡𝑜𝑝𝑡𝑟𝑎𝑐𝑘, 𝑏𝑜𝑚𝑡𝑟𝑎𝑐𝑘)
Normally, the positions of most top and bottom points in glottal area should be very stable
from one vibration cycle to the next one. However, if there is a polyp on vocal fold, the positions
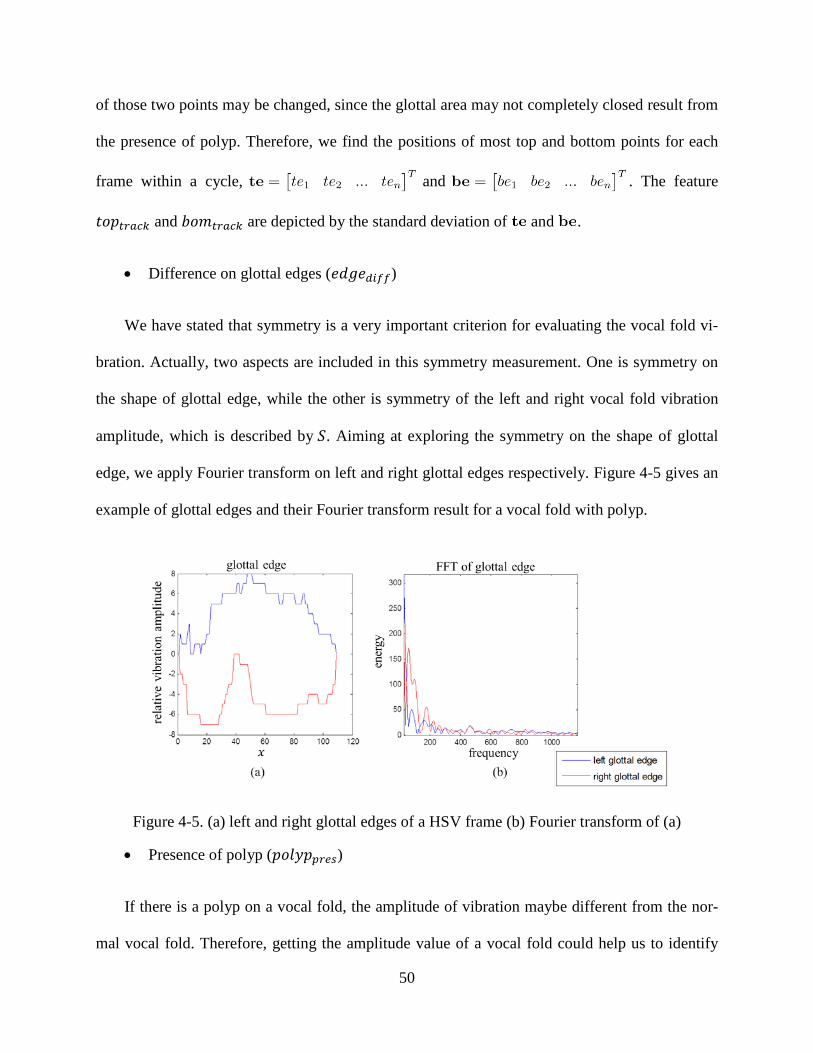
50
of those two points may be changed, since the glottal area may not completely closed result from
the presence of polyp. Therefore, we find the positions of most top and bottom points for each
frame within a cycle, and . The feature
𝑡𝑜𝑝𝑡𝑟𝑎𝑐𝑘 and 𝑏𝑜𝑚𝑡𝑟𝑎𝑐𝑘 are depicted by the standard deviation of and .
• Difference on glottal edges (𝑒𝑑𝑔𝑒𝑑𝑖𝑓𝑓)
We have stated that symmetry is a very important criterion for evaluating the vocal fold vi-
bration. Actually, two aspects are included in this symmetry measurement. One is symmetry on
the shape of glottal edge, while the other is symmetry of the left and right vocal fold vibration
amplitude, which is described by 𝑆. Aiming at exploring the symmetry on the shape of glottal
edge, we apply Fourier transform on left and right glottal edges respectively. Figure 4-5 gives an
example of glottal edges and their Fourier transform result for a vocal fold with polyp.
Figure 4-5. (a) left and right glottal edges of a HSV frame (b) Fourier transform of (a)
• Presence of polyp (𝑝𝑜𝑙𝑦𝑝𝑝𝑟𝑒𝑠)
If there is a polyp on a vocal fold, the amplitude of vibration maybe different from the nor-
mal vocal fold. Therefore, getting the amplitude value of a vocal fold could help us to identify
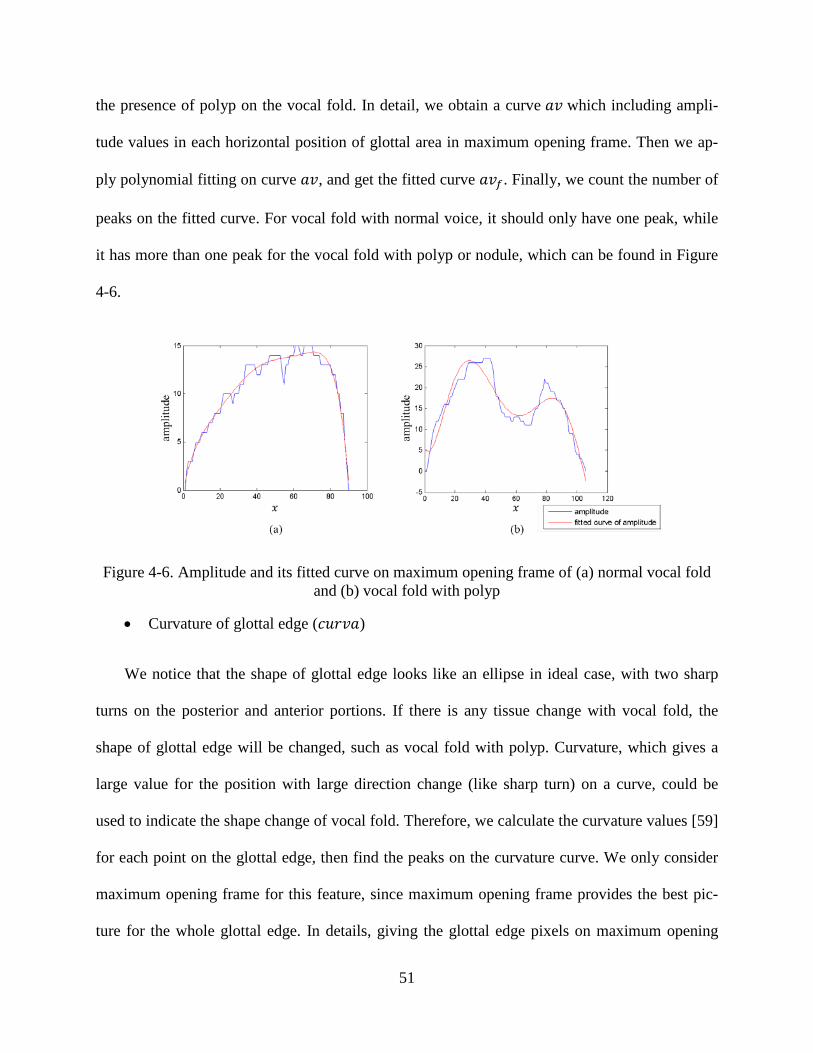
51
the presence of polyp on the vocal fold. In detail, we obtain a curve 𝑎𝑣 which including ampli-
tude values in each horizontal position of glottal area in maximum opening frame. Then we ap-
ply polynomial fitting on curve 𝑎𝑣, and get the fitted curve 𝑎𝑣𝑓. Finally, we count the number of
peaks on the fitted curve. For vocal fold with normal voice, it should only have one peak, while
it has more than one peak for the vocal fold with polyp or nodule, which can be found in Figure
4-6.
Figure 4-6. Amplitude and its fitted curve on maximum opening frame of (a) normal vocal fold and (b) vocal fold with polyp
• Curvature of glottal edge (𝑐𝑢𝑟𝑣𝑎)
We notice that the shape of glottal edge looks like an ellipse in ideal case, with two sharp
turns on the posterior and anterior portions. If there is any tissue change with vocal fold, the
shape of glottal edge will be changed, such as vocal fold with polyp. Curvature, which gives a
large value for the position with large direction change (like sharp turn) on a curve, could be
used to indicate the shape change of vocal fold. Therefore, we calculate the curvature values [59]
for each point on the glottal edge, then find the peaks on the curvature curve. We only consider
maximum opening frame for this feature, since maximum opening frame provides the best pic-
ture for the whole glottal edge. In details, giving the glottal edge pixels on maximum opening

52
frame, we find the centroid of glottal area first. For each glottal edge pixel 𝑝(𝑥𝑖, 𝑦𝑖), the value of
angle 𝜃𝑖 is calculated (refers to Figure 4-7). Then, to make sure edge pixels’ coordinates are in
the order of their corresponding angles from 0 to 360, interpolation is applied on angles to sort
the coordinate and . With this information, the
curvature is calculated by,
𝑐𝑡(𝑖) = 𝑋𝑖(𝑖,𝜎)𝑌𝑖𝑖(𝑖,𝜎)−𝑋𝑖𝑖(𝑖,𝜎)𝑌𝑖(𝑖,𝜎)(𝑋𝑖(𝑖,𝜎)2+𝑌𝑖(𝑖,𝜎)2)3/2 ……………………………………………………………… 4.7
…………………………………………………….. 4.8
…………………………………………………... 4.9
………………………………………………...........4.10
…………………………………………………... 4.11
Figure 4-7. Curvature calculation
• Convex hull of glottal edge (𝑐𝑜𝑛𝑣𝑟𝑎𝑡𝑖𝑜)
Furthermore, aiming at describing the shape of glottal area, the convex hull of glottal area is
obtained. Based on Figure 4-8, we can find the convex hull of vocal fold with normal voice and
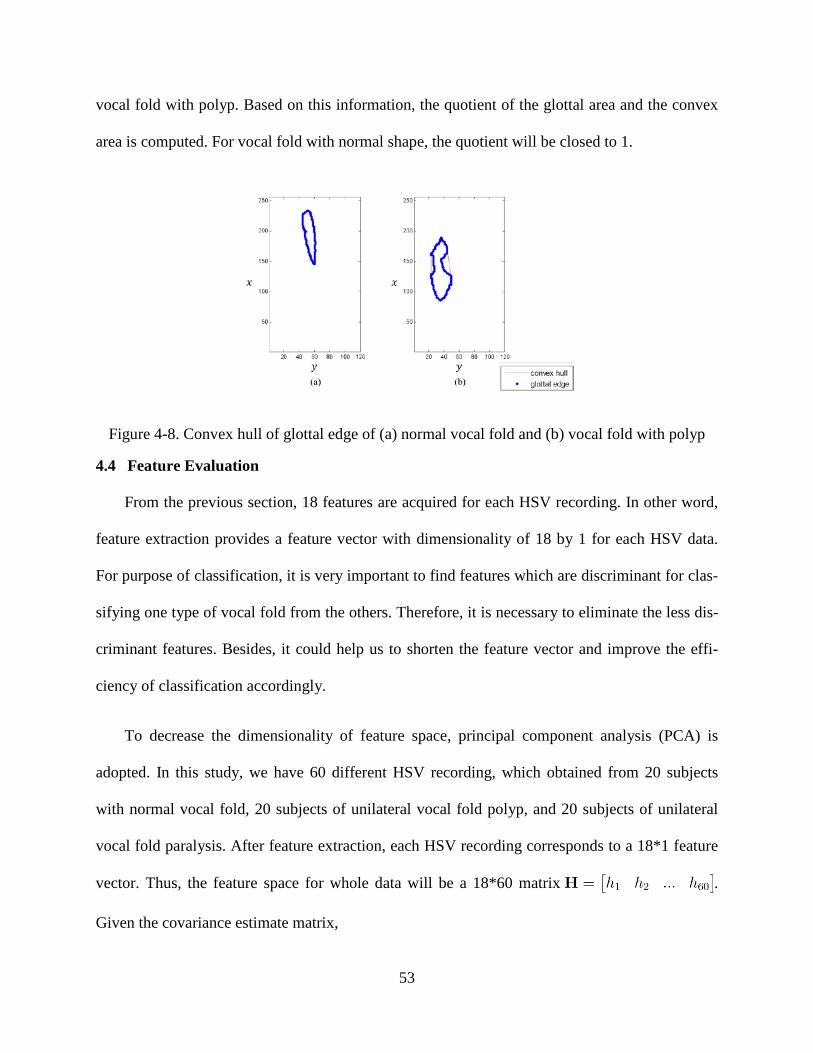
53
vocal fold with polyp. Based on this information, the quotient of the glottal area and the convex
area is computed. For vocal fold with normal shape, the quotient will be closed to 1.
Figure 4-8. Convex hull of glottal edge of (a) normal vocal fold and (b) vocal fold with polyp
4.4 Feature Evaluation
From the previous section, 18 features are acquired for each HSV recording. In other word,
feature extraction provides a feature vector with dimensionality of 18 by 1 for each HSV data.
For purpose of classification, it is very important to find features which are discriminant for clas-
sifying one type of vocal fold from the others. Therefore, it is necessary to eliminate the less dis-
criminant features. Besides, it could help us to shorten the feature vector and improve the effi-
ciency of classification accordingly.
To decrease the dimensionality of feature space, principal component analysis (PCA) is
adopted. In this study, we have 60 different HSV recording, which obtained from 20 subjects
with normal vocal fold, 20 subjects of unilateral vocal fold polyp, and 20 subjects of unilateral
vocal fold paralysis. After feature extraction, each HSV recording corresponds to a 18*1 feature
vector. Thus, the feature space for whole data will be a 18*60 matrix .
Given the covariance estimate matrix,
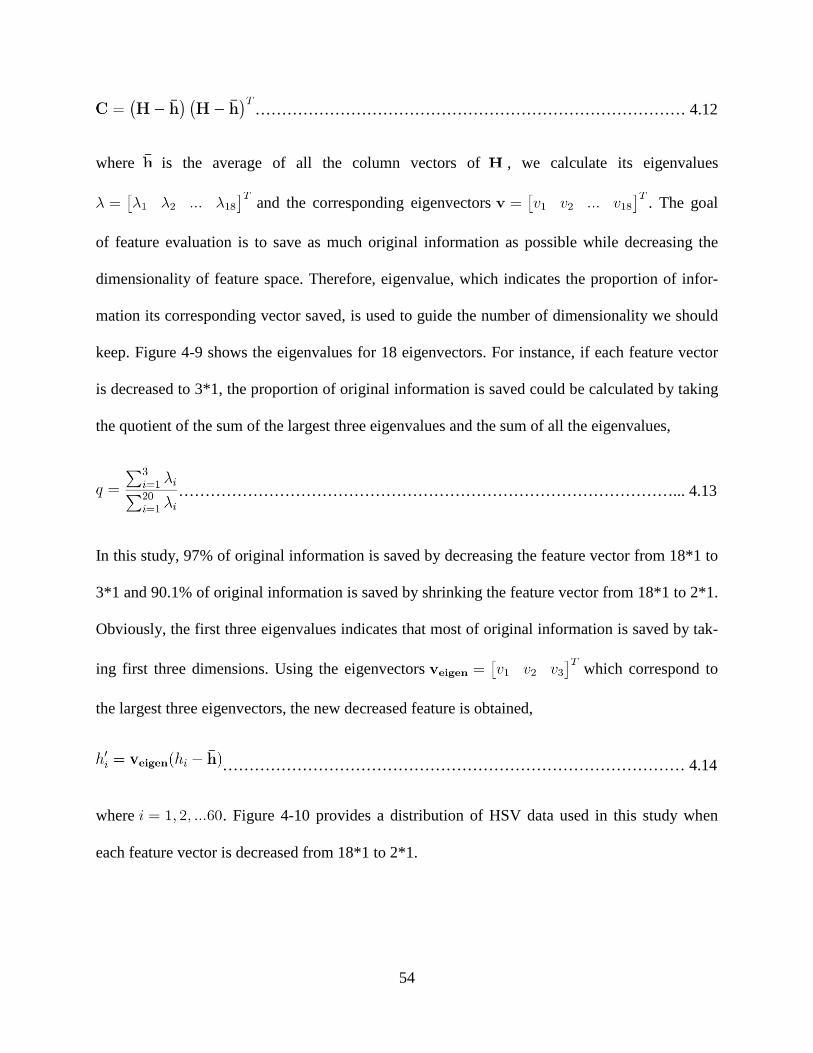
54
……………………………………………………………………… 4.12
where is the average of all the column vectors of , we calculate its eigenvalues
and the corresponding eigenvectors . The goal
of feature evaluation is to save as much original information as possible while decreasing the
dimensionality of feature space. Therefore, eigenvalue, which indicates the proportion of infor-
mation its corresponding vector saved, is used to guide the number of dimensionality we should
keep. Figure 4-9 shows the eigenvalues for 18 eigenvectors. For instance, if each feature vector
is decreased to 3*1, the proportion of original information is saved could be calculated by taking
the quotient of the sum of the largest three eigenvalues and the sum of all the eigenvalues,
…………………………………………………………………………………... 4.13
In this study, 97% of original information is saved by decreasing the feature vector from 18*1 to
3*1 and 90.1% of original information is saved by shrinking the feature vector from 18*1 to 2*1.
Obviously, the first three eigenvalues indicates that most of original information is saved by tak-
ing first three dimensions. Using the eigenvectors which correspond to
the largest three eigenvectors, the new decreased feature is obtained,
…………………………………………………………………………… 4.14
where . Figure 4-10 provides a distribution of HSV data used in this study when
each feature vector is decreased from 18*1 to 2*1.
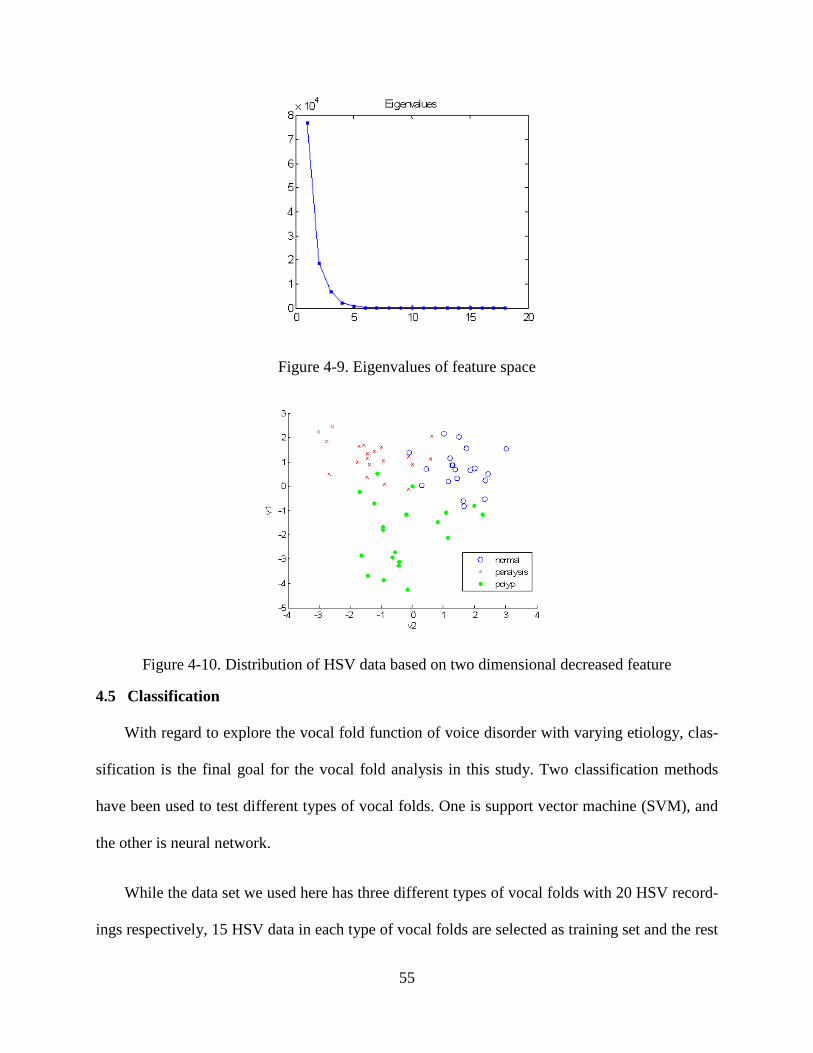
55
Figure 4-9. Eigenvalues of feature space
Figure 4-10. Distribution of HSV data based on two dimensional decreased feature
4.5 Classification
With regard to explore the vocal fold function of voice disorder with varying etiology, clas-
sification is the final goal for the vocal fold analysis in this study. Two classification methods
have been used to test different types of vocal folds. One is support vector machine (SVM), and
the other is neural network.
While the data set we used here has three different types of vocal folds with 20 HSV record-
ings respectively, 15 HSV data in each type of vocal folds are selected as training set and the rest
56
5 of them is used as testing set. To get robust classification result, cross-validation is adopted.
Therefore, we take 30 testing trails. Each trial, we randomly choose 15 HSV data from 20 for
each type of vocal fold as the training set. The average of 30 classification rate is used as the fi-
nal classification result for each classification task.
In this study, four different classification tasks are set, including ‘normal vocal folds vs uni-
lateral vocal fold polyp’, ‘normal vocal folds vs unilateral vocal fold paralysis’, ‘unilateral vocal
fold paralysis vs unilateral vocal fold polyp’, and ‘normal vocal folds vs unilateral vocal fold
polyp vs unilateral vocal fold paralysis’. For the support vector machine approach, linear SVM is
used here. When it comes to classify all three types of vocal fold together (‘normal vocal fold vs
unilateral vocal fold polyp vs unilateral vocal fold paralysis), multi-SVM is implemented. Spe-
cifically, we could build three SVM models, with each model treating one type of vocal fold as
one class and the other two types of vocal fold as another class. For instance, model 𝑚1 is used
to classify normal vocal fold from the other two vocal folds, model 𝑚2 is used to classify unilat-
eral vocal fold polyp from the rest two vocal folds, and model 𝑚3 is used to classify unilateral
vocal fold paralysis from the other two vocal folds. For neural network approach, we train a net-
work with three layers and each layer with 7 nodes.
4.6 Result and Discussion
We have stated above that there are four classification tasks in this study, which are noted as
follows:
• Classification task 1: normal vocal fold vs unilateral vocal fold polyp.
• Classification task 2: normal vocal fold vs unilateral vocal fold paralysis.
• Classification task 3: unilateral vocal fold paralysis vs unilateral vocal fold polyp.
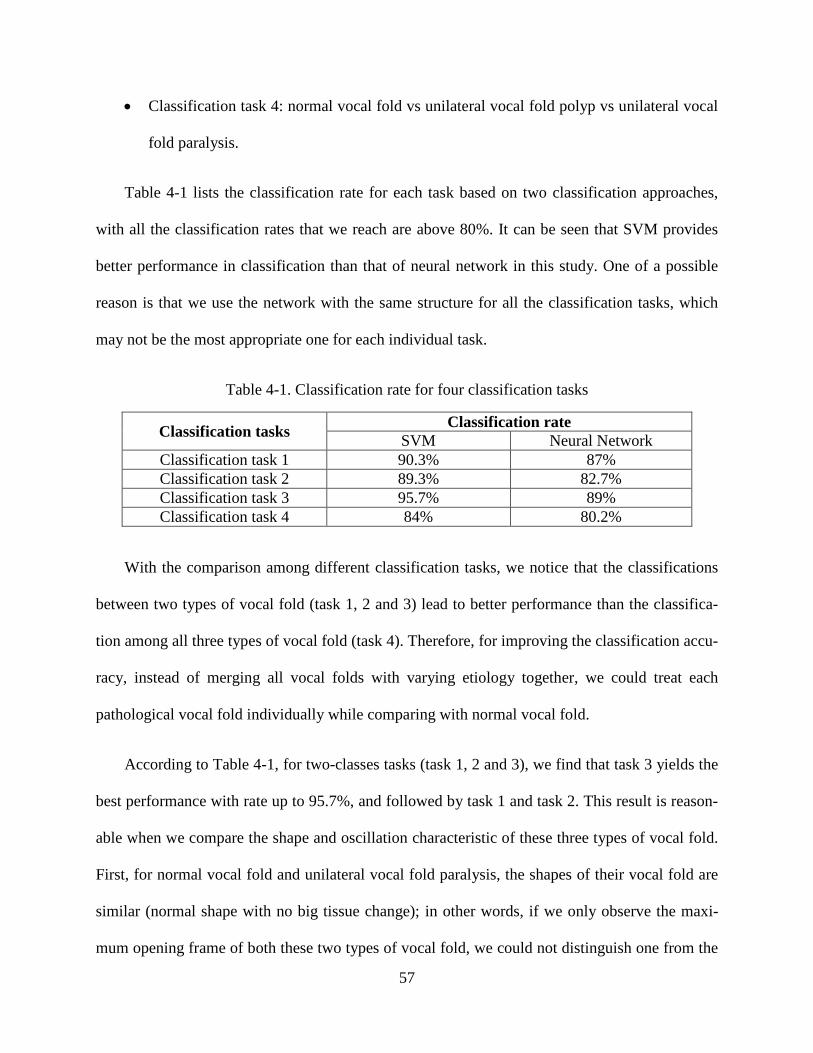
57
• Classification task 4: normal vocal fold vs unilateral vocal fold polyp vs unilateral vocal
fold paralysis.
Table 4-1 lists the classification rate for each task based on two classification approaches,
with all the classification rates that we reach are above 80%. It can be seen that SVM provides
better performance in classification than that of neural network in this study. One of a possible
reason is that we use the network with the same structure for all the classification tasks, which
may not be the most appropriate one for each individual task.
Table 4-1. Classification rate for four classification tasks
Classification tasks Classification rate SVM Neural Network
Classification task 1 90.3% 87% Classification task 2 89.3% 82.7% Classification task 3 95.7% 89% Classification task 4 84% 80.2%
With the comparison among different classification tasks, we notice that the classifications
between two types of vocal fold (task 1, 2 and 3) lead to better performance than the classifica-
tion among all three types of vocal fold (task 4). Therefore, for improving the classification accu-
racy, instead of merging all vocal folds with varying etiology together, we could treat each
pathological vocal fold individually while comparing with normal vocal fold.
According to Table 4-1, for two-classes tasks (task 1, 2 and 3), we find that task 3 yields the
best performance with rate up to 95.7%, and followed by task 1 and task 2. This result is reason-
able when we compare the shape and oscillation characteristic of these three types of vocal fold.
First, for normal vocal fold and unilateral vocal fold paralysis, the shapes of their vocal fold are
similar (normal shape with no big tissue change); in other words, if we only observe the maxi-
mum opening frame of both these two types of vocal fold, we could not distinguish one from the
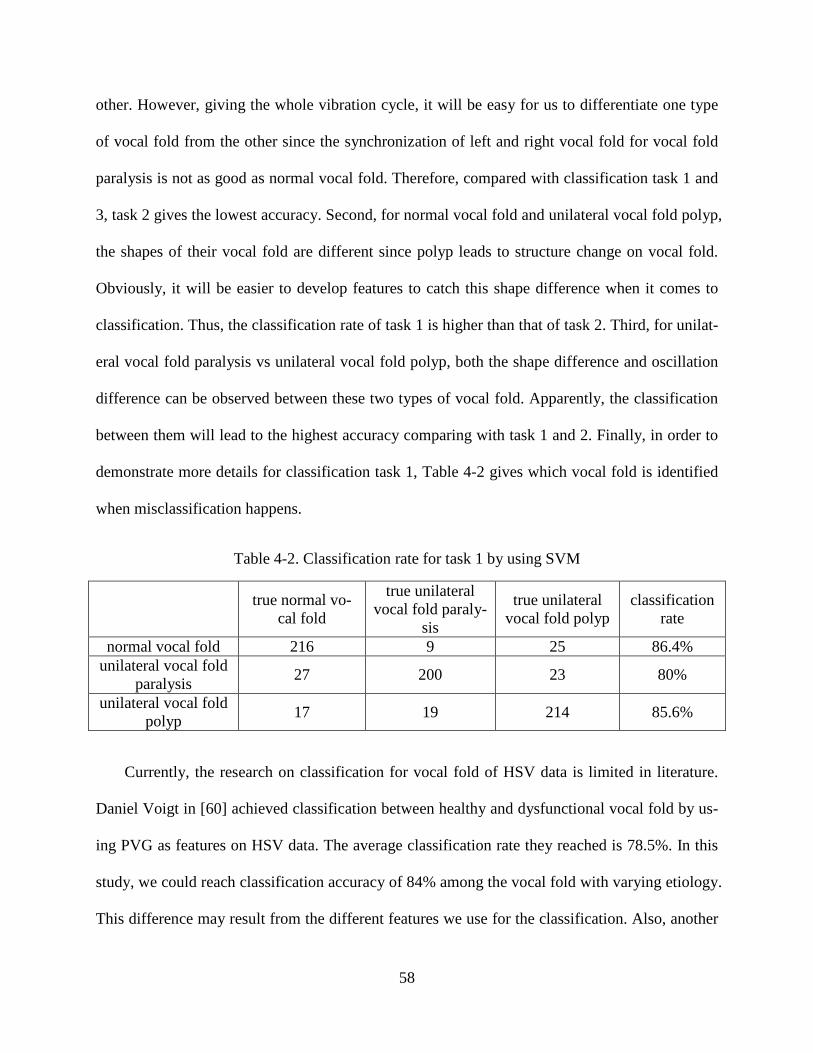
58
other. However, giving the whole vibration cycle, it will be easy for us to differentiate one type
of vocal fold from the other since the synchronization of left and right vocal fold for vocal fold
paralysis is not as good as normal vocal fold. Therefore, compared with classification task 1 and
3, task 2 gives the lowest accuracy. Second, for normal vocal fold and unilateral vocal fold polyp,
the shapes of their vocal fold are different since polyp leads to structure change on vocal fold.
Obviously, it will be easier to develop features to catch this shape difference when it comes to
classification. Thus, the classification rate of task 1 is higher than that of task 2. Third, for unilat-
eral vocal fold paralysis vs unilateral vocal fold polyp, both the shape difference and oscillation
difference can be observed between these two types of vocal fold. Apparently, the classification
between them will lead to the highest accuracy comparing with task 1 and 2. Finally, in order to
demonstrate more details for classification task 1, Table 4-2 gives which vocal fold is identified
when misclassification happens.
Table 4-2. Classification rate for task 1 by using SVM
true normal vo-cal fold
true unilateral vocal fold paraly-
sis
true unilateral vocal fold polyp
classification rate
normal vocal fold 216 9 25 86.4% unilateral vocal fold
paralysis 27 200 23 80%
unilateral vocal fold polyp 17 19 214 85.6%
Currently, the research on classification for vocal fold of HSV data is limited in literature.
Daniel Voigt in [60] achieved classification between healthy and dysfunctional vocal fold by us-
ing PVG as features on HSV data. The average classification rate they reached is 78.5%. In this
study, we could reach classification accuracy of 84% among the vocal fold with varying etiology.
This difference may result from the different features we use for the classification. Also, another
59
possibility is that we use different HSV data for the study. Döllinger in [4] investigated the clas-
sification on HSV data with different frequency and intensity obtained from one subject with
normal vocal fold. The classification accuracy up to 96% is achieved based on PVG features. In
this work, we use the HSV data collected from the normal frequency. The classification on dif-
ferent frequency of pathological vocal fold will be a good future work. Most of the classifica-
tions are based on the acoustic data instead of HSV data. Linder in [61] reached the classification
rate of 80% by using neural network to differentiate healthy and hoarse voice on acoustic data.
The acoustical features such as jitter, shimmer, standard deviation of fundamental frequency and
the glottal-to-noise excitation ratio are used. Besides, with discriminant analysis, Awan in [62]
gives the categorization between healthy and functionally dysphonic voice such as breathy,
hoarse and rough with accuracy of 74.6% according to the spectral-based acoustic measures.
However, giving the HSV data of the normal and functionally dysphonic voice, we may reach to
a better performance on the classification since HSV data providing detailed information of vi-
bratory characteristics of vocal fold. Therefore, the comparison of acoustic feature and HSV fea-
ture on the pathological vocal fold can be a new study to investigate.
In addition to reach the classification among vocal fold with different etiology, we also want
to explore the discrimination of each single feature. Thus, each single feature is set as input of
SVM approach to achieve the classification between “normal vocal fold vs unilateral vocal fold
polyp”, “normal vocal fold vs unilateral vocal fold paralysis”, “unilateral vocal fold polyp vs uni-
lateral vocal fold paralysis”. The result is demonstrated in Table 4-2. In this study, in addition to
four traditional features (𝑠𝑦𝑛𝑙𝑟, 𝑆, 𝑂𝑝𝑒𝑛𝑞, 𝑂𝐶𝑝), we develop fourteen pathologically specific fea-
tures. Based on different purpose, these new developed features can be divided into three groups.
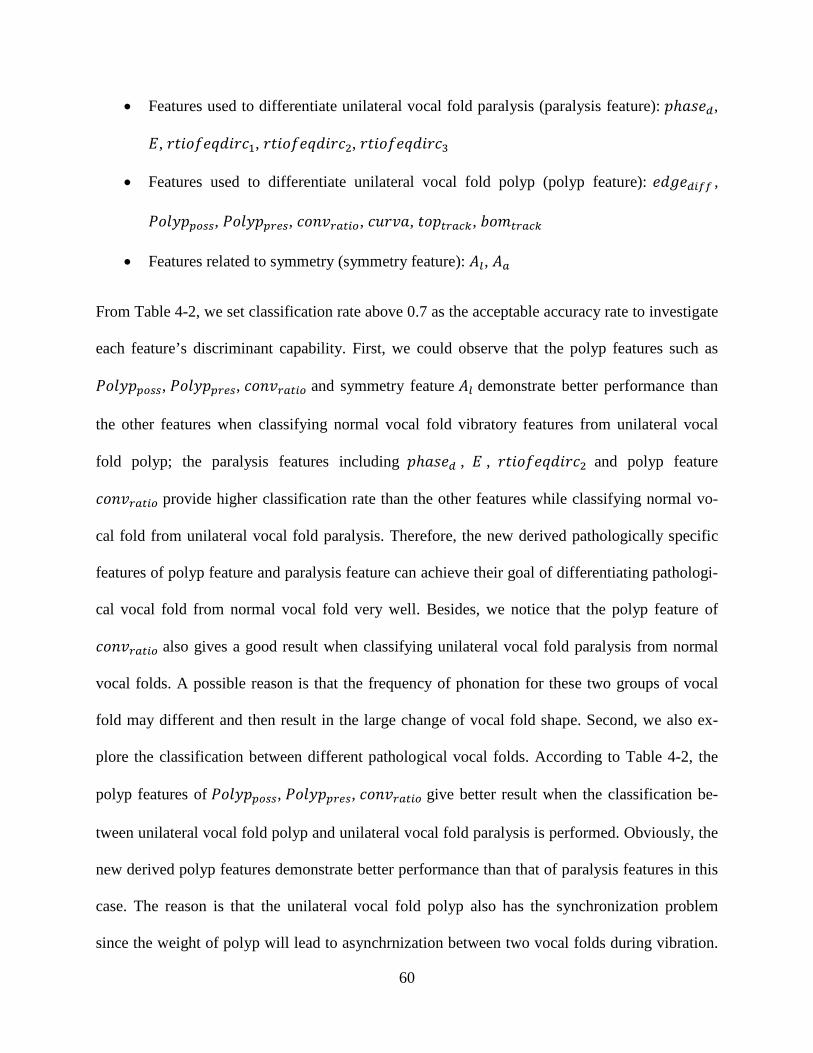
60
• Features used to differentiate unilateral vocal fold paralysis (paralysis feature): 𝑝ℎ𝑎𝑠𝑒𝑑,
𝐸, 𝑟𝑡𝑖𝑜𝑓𝑒𝑞𝑑𝑖𝑟𝑐1, 𝑟𝑡𝑖𝑜𝑓𝑒𝑞𝑑𝑖𝑟𝑐2, 𝑟𝑡𝑖𝑜𝑓𝑒𝑞𝑑𝑖𝑟𝑐3
• Features used to differentiate unilateral vocal fold polyp (polyp feature): 𝑒𝑑𝑔𝑒𝑑𝑖𝑓𝑓 ,
𝑃𝑜𝑙𝑦𝑝𝑝𝑜𝑠𝑠, 𝑃𝑜𝑙𝑦𝑝𝑝𝑟𝑒𝑠, 𝑐𝑜𝑛𝑣𝑟𝑎𝑡𝑖𝑜, 𝑐𝑢𝑟𝑣𝑎, 𝑡𝑜𝑝𝑡𝑟𝑎𝑐𝑘, 𝑏𝑜𝑚𝑡𝑟𝑎𝑐𝑘
• Features related to symmetry (symmetry feature): 𝐴𝑙, 𝐴𝑎
From Table 4-2, we set classification rate above 0.7 as the acceptable accuracy rate to investigate
each feature’s discriminant capability. First, we could observe that the polyp features such as
𝑃𝑜𝑙𝑦𝑝𝑝𝑜𝑠𝑠, 𝑃𝑜𝑙𝑦𝑝𝑝𝑟𝑒𝑠, 𝑐𝑜𝑛𝑣𝑟𝑎𝑡𝑖𝑜 and symmetry feature 𝐴𝑙 demonstrate better performance than
the other features when classifying normal vocal fold vibratory features from unilateral vocal
fold polyp; the paralysis features including 𝑝ℎ𝑎𝑠𝑒𝑑 , 𝐸 , 𝑟𝑡𝑖𝑜𝑓𝑒𝑞𝑑𝑖𝑟𝑐2 and polyp feature
𝑐𝑜𝑛𝑣𝑟𝑎𝑡𝑖𝑜 provide higher classification rate than the other features while classifying normal vo-
cal fold from unilateral vocal fold paralysis. Therefore, the new derived pathologically specific
features of polyp feature and paralysis feature can achieve their goal of differentiating pathologi-
cal vocal fold from normal vocal fold very well. Besides, we notice that the polyp feature of
𝑐𝑜𝑛𝑣𝑟𝑎𝑡𝑖𝑜 also gives a good result when classifying unilateral vocal fold paralysis from normal
vocal folds. A possible reason is that the frequency of phonation for these two groups of vocal
fold may different and then result in the large change of vocal fold shape. Second, we also ex-
plore the classification between different pathological vocal folds. According to Table 4-2, the
polyp features of 𝑃𝑜𝑙𝑦𝑝𝑝𝑜𝑠𝑠, 𝑃𝑜𝑙𝑦𝑝𝑝𝑟𝑒𝑠, 𝑐𝑜𝑛𝑣𝑟𝑎𝑡𝑖𝑜 give better result when the classification be-
tween unilateral vocal fold polyp and unilateral vocal fold paralysis is performed. Obviously, the
new derived polyp features demonstrate better performance than that of paralysis features in this
case. The reason is that the unilateral vocal fold polyp also has the synchronization problem
since the weight of polyp will lead to asynchrnization between two vocal folds during vibration.
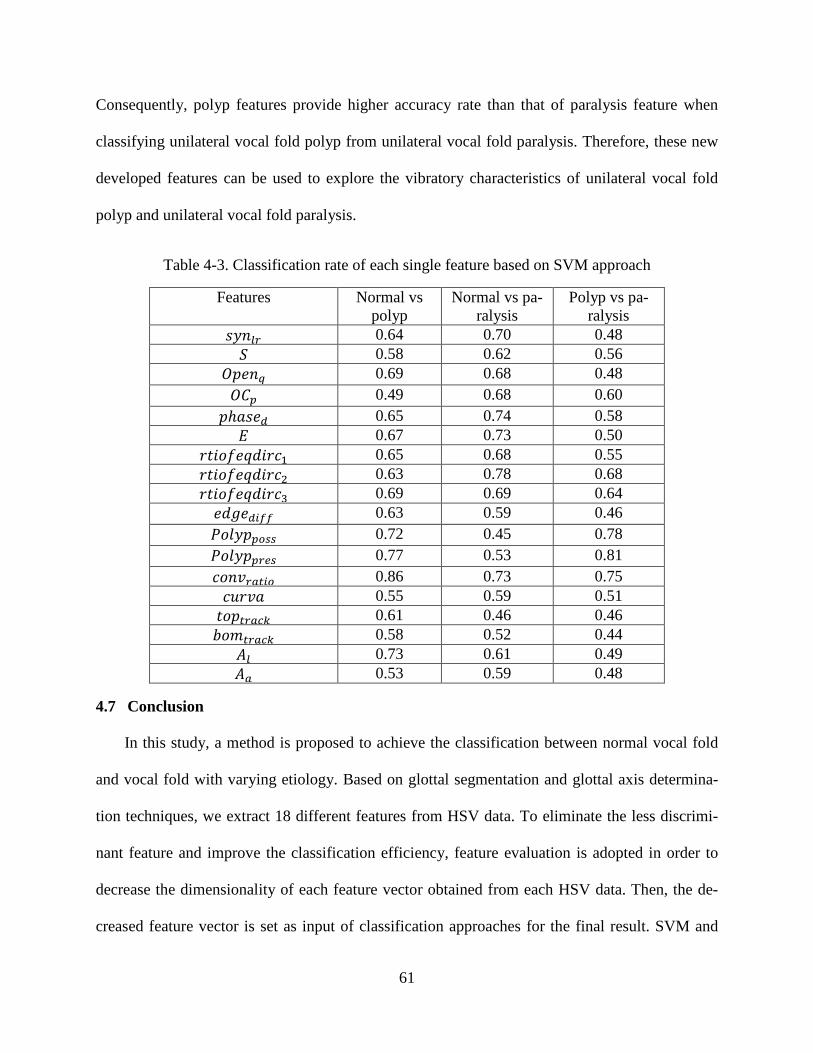
61
Consequently, polyp features provide higher accuracy rate than that of paralysis feature when
classifying unilateral vocal fold polyp from unilateral vocal fold paralysis. Therefore, these new
developed features can be used to explore the vibratory characteristics of unilateral vocal fold
polyp and unilateral vocal fold paralysis.
Table 4-3. Classification rate of each single feature based on SVM approach
Features Normal vs polyp
Normal vs pa-ralysis
Polyp vs pa-ralysis
𝑠𝑦𝑛𝑙𝑟 0.64 0.70 0.48 𝑆 0.58 0.62 0.56
𝑂𝑝𝑒𝑛𝑞 0.69 0.68 0.48 𝑂𝐶𝑝 0.49 0.68 0.60
𝑝ℎ𝑎𝑠𝑒𝑑 0.65 0.74 0.58 𝐸 0.67 0.73 0.50
𝑟𝑡𝑖𝑜𝑓𝑒𝑞𝑑𝑖𝑟𝑐1 0.65 0.68 0.55 𝑟𝑡𝑖𝑜𝑓𝑒𝑞𝑑𝑖𝑟𝑐2 0.63 0.78 0.68 𝑟𝑡𝑖𝑜𝑓𝑒𝑞𝑑𝑖𝑟𝑐3 0.69 0.69 0.64 𝑒𝑑𝑔𝑒𝑑𝑖𝑓𝑓 0.63 0.59 0.46 𝑃𝑜𝑙𝑦𝑝𝑝𝑜𝑠𝑠 0.72 0.45 0.78 𝑃𝑜𝑙𝑦𝑝𝑝𝑟𝑒𝑠 0.77 0.53 0.81 𝑐𝑜𝑛𝑣𝑟𝑎𝑡𝑖𝑜 0.86 0.73 0.75 𝑐𝑢𝑟𝑣𝑎 0.55 0.59 0.51 𝑡𝑜𝑝𝑡𝑟𝑎𝑐𝑘 0.61 0.46 0.46 𝑏𝑜𝑚𝑡𝑟𝑎𝑐𝑘 0.58 0.52 0.44
𝐴𝑙 0.73 0.61 0.49 𝐴𝑎 0.53 0.59 0.48
4.7 Conclusion
In this study, a method is proposed to achieve the classification between normal vocal fold
and vocal fold with varying etiology. Based on glottal segmentation and glottal axis determina-
tion techniques, we extract 18 different features from HSV data. To eliminate the less discrimi-
nant feature and improve the classification efficiency, feature evaluation is adopted in order to
decrease the dimensionality of each feature vector obtained from each HSV data. Then, the de-
creased feature vector is set as input of classification approaches for the final result. SVM and
62
neural network are two classification approaches used here. The classification rate of all the dif-
ferent classification tasks designed in this study are above 80%. It shows that SVM provides bet-
ter performance than that of neural network. In addition, for classification, the two-class tasks
demonstrate higher accuracy than that of three-class task. In [60], it is stated that the phonation
frequency impacts the measurement of vocal fold vibration. Therefore, it will impose influence
on the classification too. In this study, the HSV recordings we used are recorded based on the
normal phonation frequency. The frequency should not be a problem. However, for future study,
for each subject, we can take the HSV data with different phonation frequency, and then explore
the classification among HSV data with different frequency.
63
CHAPTER 5. SUMMARY AND FUTURE WORK
5.1 Summary
Providing detailed imaging system with high frame rate, high speed videoendoscopy has
driven the development of the analysis on HSV data of vocal fold. Many approaches such as
Phonovibrogram (PVG) and videokymography give quantitative analysis on vocal fold vibration.
However, a sophisticated quantitative analysis on voice disordered with varying etiology is still
demanded. This research presents a series of studies addressing this problem.
First, the glottis segmentation, which is a very significant pre-processing step of objective
assessment of vocal fold vibration behavior, is explored. We propose a new glottis segmentation
approach based on the simplified dynamic programming. The evaluation results demonstrate that
our proposed method could give a very good performance on both efficiency and accuracy com-
pared with two kinds of currently used segmentation methods such as the fixed-threshold method
and the active contour method.
Second, followed by the segmentation, we illustrate glottal axis determination technique,
which is very significant for acquiring some vibratory features. We present five different glottal
axis determination techniques including the existing and the proposed ones. Two ways have been
used to evaluate those techniques. One is to compare the glottal axis acquired by each technique
with the manually selected glottal axis. The other one is to compare their performance on differ-
entiating vocal fold with polyp from normal vocal fold. The glottal axis determination technique
using the anterior endpoint information is considered as the best one based on both two evalua-
tion methods.
64
The third study presented in this research pays attention to the classification among different
types of vocal fold. According to the glottal edge and glottal axis obtained from the first two
steps, we extract several features for each HSV data. Then, feature evaluation is followed to get
the discriminant features. At last, the final goal is reached by inputting the feature vectors to
classification approaches of SVM and neural network. The classification rate for all the tasks are
above 80%, with highest of 95.7% for the differentiation between unilateral vocal fold paralysis
and unilateral vocal fold polyp.
5.2 Future Work
While the research presented in this dissertation focuses on the HSV data obtained from sub-
jects with normal frequency, the HSV data with different range of frequency can be another topic
to be investigated. In the near future, for the voice disordered with certain etiology, we could col-
lect its HSV data at three different frequencies such as low, normal and high. Thus, features ex-
tracted from these HSV data will be explored for the purpose of classification. As a consequence,
we could figure out whether these features will be affected by the change of frequency of phona-
tion.
On the other aspect, in this presented work, the features we extracted are from sustained
phonation of each HSV data. However, the voice onset period and voice offset period can be an-
other valuable segment to be explored. The voice onset period which represents voice initiation
of the phonation and the voice offset period that demonstrates the ending of the phonation both
are very short segments. The vocal fold vibration within these two periods is not as regular as
that in the sustained phonation. Whether there is relationship between these irregular vibration
periods and certain etiology is yet to be determined. Therefore, feature extraction on voice onset
period and voice offset period could be explored and then, the investigation of the vibration

65
characteristics on these two periods will be acquired based on the classification for voice disor-
dered with varying etiology.
66
REFERENCES
[1] O. Fujimura, “Body-cover theory of the vocal fold and its phonetic implications,” in Vocal Fold Physiology, K. Stevens and M. Hirano(Eds.), Tokyo, University of Tokyo Press, ch.19, pp. 271–288, 1981.
[2] J. Lohscheller, U. Eysholdt, H. Toy, and M. Dollinger, “Phonovibrography: Mapping High-Speed Movies of Vocal Fold Vibrations Into 2-D Diagrams for Visualizing and Ana-lyzing the Underlying Laryngeal Dynamics,” IEEE Trans. on Medical Imaging, vol. 27, pp. 300-309, 2008.
[3] I. R. Titze, “Current topics in voice production mechanisms,” Acta Otolaryngol., 113, 421-
427, 1993. [4] M. Döllinger, J. Lohscheller, J. Svec, A. McWhorter, and M. Kunduk, “Support Vector
Machine Classification of Vocal Fold Vibrations Based on Phonovibrogram Features,” Advances in Vibration Analysis Research, Ed: Farzad Ebrahimi, ISBN: 978-953-307-209-8, Publisher: In Tech, 2011, 435-456. Online:http://www.intechopen.com/articles/show/title/support-vector-machine-classification-of-vocal-fold-vibrations-based-on-phonovibrogram-features.
[5] D. D. Deliyski, “Endoscope Motion Compensation for Laryngeal High-Speed
Videoendoscopy,” Journal of Voice, vol. 19, no. 3, pp. 485-496, 2005.
[6] R. J. Baken, “Clinical measurement of speech and voice,” San Diego, CA: Singular, 1993. [7] Y. L. Yan, K. Ahmad, M. Kunduk, and D. Bless, “Analysis of vocal-fold vibrations from
high-speed laryngeal images using a Hilbert transform-based methodology,” Journal of Voice, vol. 19, no. 2, pp. 161-175, 2005.
[8] G. Schade and F. Müller, “High speed glottographic diagnostics in laryngology,” HNO, vol. 53, no. 12, pp. 1085–1091, Dec. 2005.
[9] S. Hertegard, “What have we learned about laryngeal physiology from high-speed digital
videoendoscopy?,” Curr. Opin Otolaryngol. Head Neck Surg., vol. 13, no. 3, pp. 152–156, Jun. 2005.
[10] J. Svec, F. Sram, and H. Schutte, “Videokymography in voice disorders: what to look for?,”
Ann Otol Rhinol Laryngol, 116, pp.172–80, March, 2007.
[11] R. Schwarz, M. Döllinger, T. Wurzbacher, U. Eysholdt, and J. Lohscheller, “Spatio-temporal quantification of vocal fold vibrations using high-speed videoendoscopy and a biomechanical model,” Journal of the Acoustical Society of America, vol. 123, pp. 2717–2732, 2008.
67
[12] S. Schuberth, U. Hoppe, M.Döllinger, L. Lohscheller, and U. Eysholdt, “High-precision
measurement of the vocal fold length and vibratory amplitudes,” Laryngoscope, vol. 112, pp. 1043–1049, 2002.
[13] H. Larsson, S. Hertegard, P. A. Lindestad, and B. Hammarberg, “Vocal fold vibrations:
High-Speed imaging, kymography, and acoustic analysis: A preliminary report,” Laryngo-scope, vol. 110, no. 12, pp. 2117–2122, Dec. 2000.
[14] S. Allin, J. Galeotti, G. Stetten, and S. Dailey, “Enhanced snake based segmentation of vo-
cal folds,” Biomed. Imag.: Macro Nano, vol. 1, pp. 812–815, Apr. 2004. [15] T. Wittenberg, M. Moser, M. Tigges, and U. Eysholdt, “Recording, processing and analy-
sis of digital highspeed sequences in glottography,” Mach. Vis. Appl., vol. 8, no. 12, pp. 399–404, 1995.
[16] Q. Qiu, H. K. Schutte, L. Gu, and Q. Yu, “An automatic method to quantify the vibration
properties of human vocal folds via videokymography,” Folia Phoniatrica Et Logopaedica, vol. 55, no. 3, pp. 128–136, 2003.
[17] P. Mergell, H. P. Herzel, and I. R. Titze, “Irregular vocal-fold vibration–High speed obser-
vation and modeling,” Journal of the Acoustical Society of America, vol. 108, no. 6, pp. 2996–3002, Dec. 2000.
[18] U. Eysholdt, F. Rosanowski, and U. Hoppe, “Measurement and interpretation of irregular
vocal cord fold vibrations,” HNO, vol. 51, no. 9, pp. 710–716, Sep. 2003. [19] I. Tokuda and H. Herzel, “Detecting synchronizations in an asymmetric vocal fold model
from time series data,” Chaos, vol. 15, p. 013702, 2005. [20] M. Doellinger, U. Hoppe, F. Hettlich, J. Lohscheller, S. Schubert, and U. Eysholdt, “Vibra-
tion parameter extraction from endoscopic image series of the vocal folds,” IEEE Trans. on Biomed. Eng., vol. 49, no. 8, pp. 773–781, Aug. 2002.
[21] R. Schwarz, U. Hoppe, T.Wurzbacher, U. Eysholdt, and J. Lohscheller, “Classification of
unilateral vocal fold paralysis by endoscopic digital high-speed recordings,” IEEE Trans. Biomed. Eng., vol. 53, no. 6, pp. 1099–1108, Jun. 2006.
[22] T. Wurzbacher, R. Schwarz, M. Döllinger, U. Hoppe, U. Eysholdt, and J. Lohscheller,
“Model-based classification of non-stationary vocal fold vibrations,” Journal of the Acous-tical Society of America, vol. 120, no. 2, pp. 1012–1027, 2006.
[23] J. Lohscheller, H. Toy, F. Rosanowski, U. Eysholdt, and M. Döllinger, “Clinically evaluat-
ed procedure for the reconstruction of vocal fold vibrations from endoscopic digital high-speed videos,” Medical Image Analysis, vol. 11, no. 4, pp. 400-413, 2007.
68
[24] S. Z. Karakozoglou, N. Henrich, C. D'Alessandro, and Y. Stylianou, “Automatic glottal segmentation using local-based active contours and application to glottovibrography,” Speech Communication, vol. 54, no. 5, pp. 641-654, 2012.
[25] Y. L. Yan, G. Du, C. Zhu, and G. Marriott, “Snake based automatic tracing of vocal-fold
motion from high-speed digital images,” IEEE International Conference on Acoustics, Speech and Signal Processing, pp. 593-596, 2012.
[26] J. Lohscheller and U. Eysholdt, “Phonovibrogram Visualization of Entire Vocal Fold Dy-
namics,” The Laryngoscope, vol. 118, pp. 753-758, 2008. [27] U. Eysholdt, F. Rosanowski, and U. Hoppe, “Vocal fold vibration irregularities caused by
different types of laryngeal asymmetry,” European Archives of Oto-Rhino-Laryngology, vol. 260, pp. 412–417, 2003.
[28] J. Neubauer, P. Mergell, U. Eysholdt, and H. Herzel, “Spatio-temporal analysis of irregular
vocal fold oscillations: Biphonation due to desynchronization of spatial modes,” Journal of the Acoustical Society of America, vol. 110, pp. 3179–3192, 2001.
[29] T. Wurzbacher, M. Döllinger, and R. Schwarz, “Spatiotemporal classification of vocal fold
dynamics by a multimass model comprising time-dependent parameters,” Journal of the Acoustical Society of America, vol. 123, pp. 2324–2334, 2008.
[30] T. Wurzbacher, R. Schwarz, M. Döllinger, U. Hoppe, U. Eysholdt, and J. Lohscheller,
“Model-based classification of nonstationary vocal fold vibrations,” Journal of the Acous-tical Society of America, vol. 120, pp. 1012–1027, 2006.
[31] U. Eysholdt, F. Rosanowski, and U. Hoppe, “Vocal fold vibration irregularities caused by
different types of laryngeal asymmetry,” Eur. Arch. Otorhinolaryngol., vol. 260, no. 8, pp. 412–417, Sep. 2003.
[32] K. A. Kendall, M. M. Browning, and S. M. Skovlund, “Introduction to high-speed imaging
of the larynx,” Curr. Opinion Otolaryngol. Head Neck Surg., vol. 13, no. 3, pp. 135–137, Jun. 2005.
[33] Y. L. Yan, X. Chen, and D. Bless, “Automatic tracing of vocal-fold motion from high-
speed digital images,” IEEE Trans. on Biomedical Engineering, vol. 53, no. 7, pp. 1394–1400, 2006.
[34] W. Boecker, W. U. Muller, and C. Streffer, “Comparison of different automatic threshold
algorithms for image segmentation in microscope images,” Proceedings of the SPIE - The International Society for Optical Engineering, vol. 2564, pp.230-241, 1995.
[35] R. Kohler, “A segmentation system based on thresholding,” Comput. Graph. Image Pro-
cess, 15, 319–338, 1981.
69
[36] R. Haralick and L. Shapiro, “Image segmentation techniques,” Comput. Graph. Image Pro-cess, 29, 100–132, 1985.
[37] R. Adams and L. Bischof, “Seeded region growing,” IEEE Trans. Pattern Anal. Mach.
Intell., 16, 641–647, 1994. [38] A. Mehnert and P. Jackway, “An improved seeded region growing algorithm,” Pattern
Recognition Letter, 18, 1065–1071, 1997. [39] H. Moukalled, D. Deliyski, R. Schwarz, and S. Wang, “Segmentation of laryngeal High-
Speed Videoendoscopy in temporal domain using paired active contours,” MAVEBA, 1, 137–140, 2009.
[40] J. Lohscheller, M. Dollinger, M. Schuster, R. Schwarz, U. Eysholdt, and U. Hoppe, “Quan-
titative investigation of the vibration pattern of the substitute voice generator,” IEEE Trans. Biomed. Eng., 51, 1394–1400, 2004.
[41] R. C. Gonzalez, Digital Image Processing. Tom Robbins, 2001. [42] M. A. Fischler, J. M. Tenenbaum, and H. C. Wolf, “Detection of roads and linear struc-
tures in low-resolution aerial imagery using a multisource knowledge integration tech-nique,” Computer Graphics and Image Processing, vol. 15, pp. 201-223, 1981.
[43] T. H. Cormen, C. E. Leiserson, R. L. Rivest, and C. Stein, “Single-Source Shortest Paths
and All-Pairs Shortest Paths,” Introduction to Algorithms (2nd ed.). MIT Press and McGraw-Hill. pp. 580-642. ISBN 0-262-03293-7.
[44] P. E. Hart, N. J. Nilsson, and B. Raphael, “A Formal Basis for the Heuristic Determination
of Minimum Cost Paths,” IEEE Transactions on Systems Science and Cybernetics, 4, pp.100-107, 1968.
[45] M. Wan, F. Dachille, and A. Kaufman, “Distance-Field Based Skeletons for Virtual Navi-
gation,” Proc. of the conference on Visualization, pp. 239-246, 2001. [46] W. N. Lie, T. C. I. Lin, T. C. Lin, and K. S. Hung, “A robust dynamic programming algo-
rithm to extract skyline in images for navigation,” Pattern Recognition Letters, vol. 26, no. 2, pp. 221-230, 2005.
[47] T. Ikuma, M. Kunduk, and A. J. McWhorter, "Quick Vibratory Profile of High-Speed
Videoendoscopy Data and Its Applications," Voice Foundation, Philadelphia, PA, June, 2012.
[48] S. Avidan and A. Shamir, “Seam carving for content-aware image resizing,” Proceeding of
SIGGRAPH, no. 10, 2007.
70
[49] P. C. Hansen. “The L-Curve and its Use in the Numerical Treatment of Inverse Problems,” Computational Inverse Problems in Electrocardiology. WIT Press. pp: 119-142, 2001.
[50] T. F. Chan and L. A. Vese, “Active contours without edges,” IEEE Transactions on Image
Processing, vol. 10, no. 2, pp. 266-277, 2001. [51] M. W. Sung, K. H. Kim, T. Y. Koh, T. Y. Kwon, J. H. Mo, S. H. Choi, J. S. Lee, K. S.
Park, E. J. Kim, and M. Y. Sung, “Videostrobokymography: A New Method for the Quan-titative Analysis of Vocal Fold Vibration,” The Laryngoscope, vol. 109, pp. 1859–1863, 1999.
[52] I.T. Jolliffe, Principal Component Analysis, Series: Springer Series in Statistics, 2nd ed.,
Springer, NY, 2002, XXIX, 487 p. 28 illus. ISBN 978-0-387-95442-4. [53] U. Hoppe, “Mechanisms of hoarseness—visualization and interpretation by means of non-
linear dynamics,” Aachen, Germany: Shaker; 2001. [54] N. Henrich, C. D’Alessandro, B. Doval, and M. Castellengo, “Glottal open quotient in
singing: measurements and correlation with laryngeal mechanisms, vocal intensity, and fundamental frequency,” Journal of the Acoustical Society of America, 117, 1417–30, March, 2005.
[55] S. Bielamowicz, R. Kapoor, J. Schwartz, and SV. Stager, “Relationship among glottal area,
static supraglottic compression, and laryngeal function studies in unilateral vocal fold pa-resis and paralysis,” J. Voice, 18, pp. 138-45, March, 2004.
[56] J. Svec and H. Schutte, “Videokymography: high-speed line scanning of vocal fold vibra-
tion,” J. Voice, 10, pp201–5, June, 1996. [57] M. Kunduk, M. Dollinger, A. McWhorter, J. Svec and J. Lohscheller, “Vocal Fold Vibra-
tory Behavior Changes Following Surgical Treatment of Polyps Investigated With High-Speed Videoendoscopy and Phonovibrography,” The Annals of otology, rhinology and laryngology, 121, pp.355-63. June, 2012.
[58] M. Kunduk, Y. Yan, A. McWhorter, and D. Bless, “Investigation of Voice Initiation and
Voice Offset Characteristics with High-Speed Digital Imaging,” Logopedics Phoniatrics Vocology, 31, pp.139-44. October, 2006.
[59] M. Farzin and K. M. Alan, “A theory of multiscale, curvature-based shape representation
for planar curves,” IEEE transactions on pattern analysis and machine intelligence, VOL. 14, NO. 8, August 1992.
[60] D. Voigt, M. Dollinger, T. Braunschweig, A. X. Yang, U. Eysholdt, and J. Lohscheller,
“Classification of functional voice disorders based on phonovibrograms,” Artificial Intelli-gence in Medicine, 49, pp. 51-59, 2010.

71
[61] R. Linder, A. Albers, M. Hess, S. Poppl, and R. Schonweiler, “Artificial neural network based classification to screen for dysphonia using psychoacoustic scaling of acoustic voice features,” J. Voice, 22, pp.155-63, March, 2008.
[62] S. Awan and N. Roy, “Acoustic prediction of voice type in women with functional dys-
phonia,” J. Voice, 19, pp.268–82, June, 2005.
72
APPENDIX AUTHOR’S PUBLICATIONS
• Jing Chen, Bahadir Gunturk, and Melda Kunduk, “Glottis segmentation using dynamic programming,” SPIE Medical Imaging, Orlando, FL, Feb. 2013.
• Jing Chen, Melda Kunduk, Takeshi Ikuma, Andrew J. McWhorter, and Bahadir Gunturk, “Glottal axis determination techniques and their effects on the quantification of high-speed videoendoscopic parameters in normal and disordered voices,” The Voice Founda-tion’s 41st annual symposium: care of the professional voice, Philadelphia, PA, June, 2012.
• Melda Kunduk, Jing Chen, Andrew J. McWhorter, and Bahadir Gunturk, “Effects of Pitch, Loudness and Phonation Types on Voice Initiation and Offset Investigated with High-Speed Videoendoscopy,” 10th International Conference on Advances in Quantita-tive Laryngology, Voice and Speech Research, Cincinnati, OH, June 3-4, 2013.
• Melda Kunduk, Jing Chen, Andrew J. McWhorter, and Bahadir Gunturk, “A study of voice offset patterns in young female voices with high-speed viceoendoscopy," The Voice Foundation’s 41st annual symposium: care of the professional voice, Philadelphia, PA, June, 2012.
• Zhenyi Wei, Marcio de Queiroz, Jing Chen, Bahadir K. Gunturk, and Melda Kunduk, “A new Model of Vocal Fold Vibrations: Preliminary Experimental Validation,” In Pro-ceedings of the 4th Annual Dynamic Systems and Control Conference, Arlington, VA. Oct 31 – Nov 2, 2011.
• Melda Kunduk, Jing Chen, Andrew J. McWhorter, Bin Li, and Bahadir Gunturk, “Inves-tigation of Voice Initiation Characteristics in Young Females with High-Speed Digital Imaging,” 9th International Conference on Advances in Quantitative Laryngology, Voice and Speech Research, Erlangen, Germany, September 10-11, 2010.
73
VITA Jing Chen was born in 1985, in Huanggang, Hubei, China. She received her Bachelor’s,
Master’s degree in Electronics and Information Engineering, Pattern Recognition and Intelligent
System from Huazhong University of Science and Technology respectively in June 2007 and
March 2010. Since then, she has been enrolled in the Department of Electrical and Computer
Engineering at Louisiana State University, Baton Rouge, Louisiana, to pursue her doctorate de-
gree. During this period, she passed her qualify exam in Fall 2011 and general exam in April
2013, respectively. She anticipates graduating with her Doctor of Philosophy degree in Summer
2014.
Jing’s research interests broadly lie in imaging processing, pattern recognition, and vocal
fold vibratory behavior analysis on high speed videoendoscopy. She has published a series of
papers on these topics in various image processing and voice analysis conferences.
Recommended


