
1
WEATHERING BASED DATING-TECHNIQUES. The use of measures of degree of chemical weathering, and of other indicis of post-glacial differentiantions of glacial depostis has a long tradition in North America (McCarroll, 1985). The earliest attemts at using these relative-datings (RD) techniques were made alreaddy in the 1930th in the Sierra Nevada (e.g., Matthews, 1930; Blackwelder, 1931). The RD-technique used today (e.g., Sharp & Birman, 1963; Birman, 1964) were developed largely in the same area. The RD-technique can be devided into multi-parameter and single-parameter approaches of the physical and chemical alternations of the studied boulder-material. Techniques which have been used to assign a more precise (numerical) age of the deposits are often termed "absolute." A term that is not realistic in terms of error limits of the technique used (McCarroll, 1985). RELATIVE AGE-DATING BY MULTI-PARAMETER TECHNIQUES. In relative age-dating by multi-parameter technique several methods have been used, as measurments of weathering rinds, boulder classifications, micro relief measurments, studies of soil development, studies of boulder frequencies, measurments of clast roundness in tills, studies of weathered macroforms as tors, weathering pits etc. These multi-parameter studies have mostly been used in the way that several techniques have been combined with each other, table 1. Table 1. Multi-parameter relative-age dating studies (McCarroll, 1985) Weathering-based RD Techniques Other age indicators. Weathering rinds Lichenometry , Boulder classification Radiocarbon Micro-relied measrmets Other radiometric Soil development (e.g., testhammer) Clast roundness Boulder frequency Macro-weathering features EARLIER STUDIES WITH THE SCHMIDT TESTHAMMER. The Schmidt testhammer was originally designed as an apparatus for non-destructive in situ testing of the surface hardness of concrete. The instrument measures the distance of rebound (R) of a spring-loaded mass affecting a surface. The distance of rebound (R) is dependent of the elastic recovery of the surface, which in turn is related to its hardness, and thus its compressive strength. The Schmidt test hammers, used by us are of type N and L, are light (2.3 and 2 kgs.) and give an impact energy of 0.225 respectively 0.075 kgm. The R-value is indicated by a rider on a scale on the side of the instrument. The reading of the rider position gives the rebound in percent of the forward movement of the hammer mass. As the testhammer is light, somewhat cheap and robust a sufficient large number of samples can be tested in a small area in a short period (Day & Goudie, 1977). Day & Goudie mean that the surface hardness, as measured by the hammer, may be a better measure of resistance to erosion than the compressive strength. Besides tests have established that there is relatively very little operator varience. Still, certain differences in measured values can be found between different instruments, as a certain detoriation

2
of the hammer mecanism appears during intensive use. These sources of error can be avoided if the instrument is calibrated regularely (McCarroll, 1987). Green (1954) compared the instrument with a compression machine. He found that the coefficient of variation for the test hammer averaged 8.95% with 6.05% for the compression machine. In geomorphological studies the instrument was first used in 1966 by Monroe to study karst-phenomena on lime-stone in humid tropical areas as Indonesia and Puerto Rico, were case-hardening is an important control of landform development. Monroe found that the Schmidt Hammer enabled a quick field assessment to be made of the extent and the depth of induration and weathering. By using the instrument Monroe (1966) could draw conclusions that could not be reached from visual inspection. Yaalon & Singer (1974) made studies on Nari (calcrete) in Israel and the Schmidt Hammer offered a way to asess the degree of change in rock strength caused by one weathering process: Calcretisation. They stated that: "The measurments are especially useful and valuable where the change in induration with depth is difficult to recognice by the eye and may be applicable to other rocks where the recognition of the degree of induration or hardness is of significance and where it is correlated with other less easily determined properties" Selby (1980) proposed a Geomorphic Rock Mass Classification and Rating using hammer tests from Antarctica and New Zeeland. His results were summarized in a table, adopted in Ford & Williams (1989:39): Geomorphic Rock Mass Strength and Ratings (r= rating of parameter) Parameter 1 2 3 4 5 Very strong Strong Moderate Weak Very weak Intackt rock 100-60 60-50 50-40 40-35 35-10 Strength(N-type Schmidt Hammer,R r:20 r:18 r:14 r:10 r:5 Weathering unweathered slightly mederately highly completely weathrered weathered weathered Selby (1982) and Selby & Moon (1983) also studied rock mass strength for geomorphic purposes in Antarctica, New Zeeland and southern Africa, where the rock mass strenth classification uses eight parameters, and the strength of intact rock was measured by the Schmidt Hammer. McCarroll (1987) also mentions a statement by M. Summerfield, who used the Schmidt Hammer in studies of silcrete profiles in southern Africa and Sarsen stones in southern England. These studies are especially interesting as they draw attention to the important fact that the Schmidt Hammer tests reflect the surface strength of the sample, not the bulk strength. Williams & Robinson (1983) and Robinson & Williams (1986) used the Schmidt Hammer to study the effect of surface texture on the determination of the surface hardness of Ashover Grit in Derbyshire, and on sandstones in southern England. The main contribution by these papers is that: "In all uses, the readings obtained with a

3
Schmidt hammer are representative only of a given rock and a given surface texture of that rock" (Williams & Robinson, 1983). Matthew & Shakesby (1984) dated 3 of 34 moraines in Jotunheimen, Norway, as older than the "Little Ice Age." This study is especially valuable in this context as it was carried out parallell to lichenometric studies in the area. They concluded that: " This first application of the Schmidt hammer to glacial chronological problems suggests a considerable potensial for the intrument in the differentiation of ages of Holocene deposits, particulary when applied with other relative-dating techniques, such as lichenometry." The authors also note that two major sources of error have been identified that require forther investigation. First, the incorporation of weathered boulders into more recent deposits could, if not recognised, result in overestimates of age. Second, variations in the initial surface texture of boulders originating from different processes can cause large systematic variations in R-values that need to be controlled to avoid erroneous relative-age determinations. Matthews and Shakesby, now with Dawson (Dawson, Matthews & Shakeby, 1986) describe and evaluate the formation of a huge roch avalance in Rondane, Norway. Here, the Schmidt hammer is used to find differences in the weathering of boulders within and ouside the feature, combined with lichenometric measurments for absolute datings. The lowest R-values were measured outside the avalance. The small differences in the measured mean R-values between the sites showed that it is only possible to state from this evidence that the feature is of a younger age than debris on the surrounding slopes. The same authors (Dawson, Matthews & Shakesby, 1987) also researched rock glaciers, protalus ramparts and related phenomena where the Schmidt hammer combined with lichenometry was used to showed the relative age of the features. The Schmidt hammer results implied that the protalus ramparts are older or have been stable for longer time than rock glaciers. McCarroll (1989) made hammer tests on Leirbreen in Jotunheimen, Norway. His results show that a comparison of R-values from boulders of carefully speciefied lithologies reveal that boulders on the ridge are no more weathered than those elsewhere on the foreland and considerably less weathered than those beyond the moraine limits. The results are consistant with formation during the "Little Ice Age." when other southern Norwegian glaciers reached their maximum extent. McCarrol states that R-values do not provide a direct measure of the boulder-surface weathering, and the influence of other factors must be assessed critically before results can be interpreted. Such factors are surface roughness and boulder roundness, where well-rounded boulders normally have lower R-values than angular (McCarroll, 1989a). In particulary, care must be taken to minimiae the lithological variation between sites.

4
OPERATING INSTRUCTIONS FOR THE SCHMIDT TEST-HAMMER AND SOURCES OF INSTRUMENT ERROR. The construction of the Schmidt hammer shows on fig. 1.
Fig. 1. The construction of the Schmid Test-hammer. The hammer is operated in the following way (Proceq, 1977): 1. By ligthly pressing on the head of the impact plunger (1) the plunger is released and will slide out of
the housing (3) by itself. 2. The plunger is pressed against the tested material. Just before it disappears completely into the
housing the hammer is released. Release must be affected by slowly increasing the preassure on the housing. At the moment of impact the hammer must be helt exactly at right angle to the surface.
3. After the impact the hammer mass (4) rebounds by a certain amount that is suggested on the scale (19) by the rider (4). The reading of the rider position gives the rebound value in percent of the forward movement of the hammer mass. The reading is kept by a push-buttom (6) that is pressed slowly durint the impact.
4. By removing the hammer from the spot tested, it resets for a further test and simultaneously the inidication is canselled.
5. After having finished the tests, the plunger (1) with its quide bar (7) and quide disk (8) is locked in its rear position by the push-buttom (6).
6. The test hammer is calibrated for horizontal impact direction, i.e., for testing vertical surfaces. When using it on inclined or horizontal surfaces the rebound value Rα must be corrected according to table 1.
Table 1. Correction of the Test-hammer indications for non-horizontal impacts.
Rebound Correction for inclination angle a value upwards downwards

5
Rα +90° +45° -45° -90° 10 +2.4 +3.2 20 -5.4 -3.5 +2.5 +3.4 30 -4.7 -3.1 +2.3 +3.1 40 -3.9 -2.6 +2.0 +2.7 50 -3.1 -2.1 +1.6 +2.2 60 -2.3 -1.6 +1.3 +1.7
According to the manual 5, or better 10 points should be tested at each area (Proceq, 1977). The R-value is calculated as a mean of these 5 to 10 impacts. All the individual readings of the test hammer must be considered; only obvious "off shots" are to be eliminated and replaced by further impact tests. Experiance shows that they occur when the impact hits an aggregate particle or a pore lying close to the surface. Day & Goudi (1977) state that the following points need to be observed when using the test hammer: 1. The test site should not be too near the edge of a rock mass or near a void or joint It is desirable that
readings be taken more than 6 cm from edges or joints. 2. Surfaces should be flat and free from flakes or dirt. R values on a rough surface will be lower than
those on a smooth surface. 3. A repeated test on the same spot or near it will result in increased readings, owing, presumely, to
local partial crushing of the rock. Thus for greatest accuracy the hammer must be moved to a new spot for each test.
4. The number of impacts made at a site should be 10 or 15. with a highly variable material a greater sample size may be desirable.
McCarroll (1987) studied possibel sources of instrument error that may influence Schmidt hammer R-values. These are: 1. The calibration certificate results supplied by the manufacturers cannot be taken as an accurate measure
of hammer condition on receipt. 2. Poor adjustment or wear may produce some values that are anomalously low, and these will seriously
influence the descriptive statistics used to summarize the distribution of results. 3. The R-values obtained in the field will vary with the amount of use to which the hammer has been
subjected. 4. The standard calibration equation does not apply to the R-values obtained from all hammers. 5. As a hammer deteriorates, the frequency distribution characteristics of samples of R-values will
change. In particular the dispertion of R-values tends to increase with use. McCarroll means that these errors can be avoided by regular service and regular calibration of the test hammer. SCHMIDT HAMMER MEASURMENTS AND CALIBRATIONS OF WEATHERING PROCESSES ON WAVE WASHED MORAINE AND BEDROCK ON THE UPPER NORRLAND COAST. Introduction The starting point for this work was earlier lichenometric investigations in the area (Broadbent & Bergqvist, 1986; Broadbent (this volume)). As the growth of lichens also is dependent on weathering an attemt must be made to measure the weathering through a quantifiable method. The Schmidt hammer was used for this purpose The initial question was therefore: - Is it possible by using the Schmidt hammer to calibrate the weathering in the same way as lichen growth along raised boulder beaches and coastal rocks from sea-level and upwards?

6
To research this, hammer-tests were carried out first on previously levelled sites on raised boulder beaches used in the lichenometry project. The sites were: the Grundskataräften and Klubben on the Bjuröklubb peninsula, and the islands Stora Fjäderägg and Snöan in the Bothnian sea. Methodological development. The initial tests were carried out as follows. On each level a minimum of three to five boulders were tested both on the upper and the lower side to find out if there was any difference of weathering on exposed and non-exposed surfaces of the boulders. The mean R-values of each level (n=15-25) was calculated as well as standard deviation of the R-values for each level. The elevation and the mean R-value for each level was correlated against each other by simple regression, and the equation and the correlation coefficient was calculated. As an example of these first attemts a raised boulder-beach at the island Stora Fjäderägg is chosed. A raised boulder beach on the island Stora Fjäderägg. The island Stora Fjäderägg is in the outer parts of the coast of Västerbotten, east of the Holmö arcipelago. The bedrock and the boulder material mainly consists of gneiss-granites. The present relative uplift in the area is 8.7 mm/year. The tested site is a huge raised boulder beach, facing S, reaching from sea-level up to 17 m. a.s.l. On this site 12 elevated levels, adjusted to the present mean
7
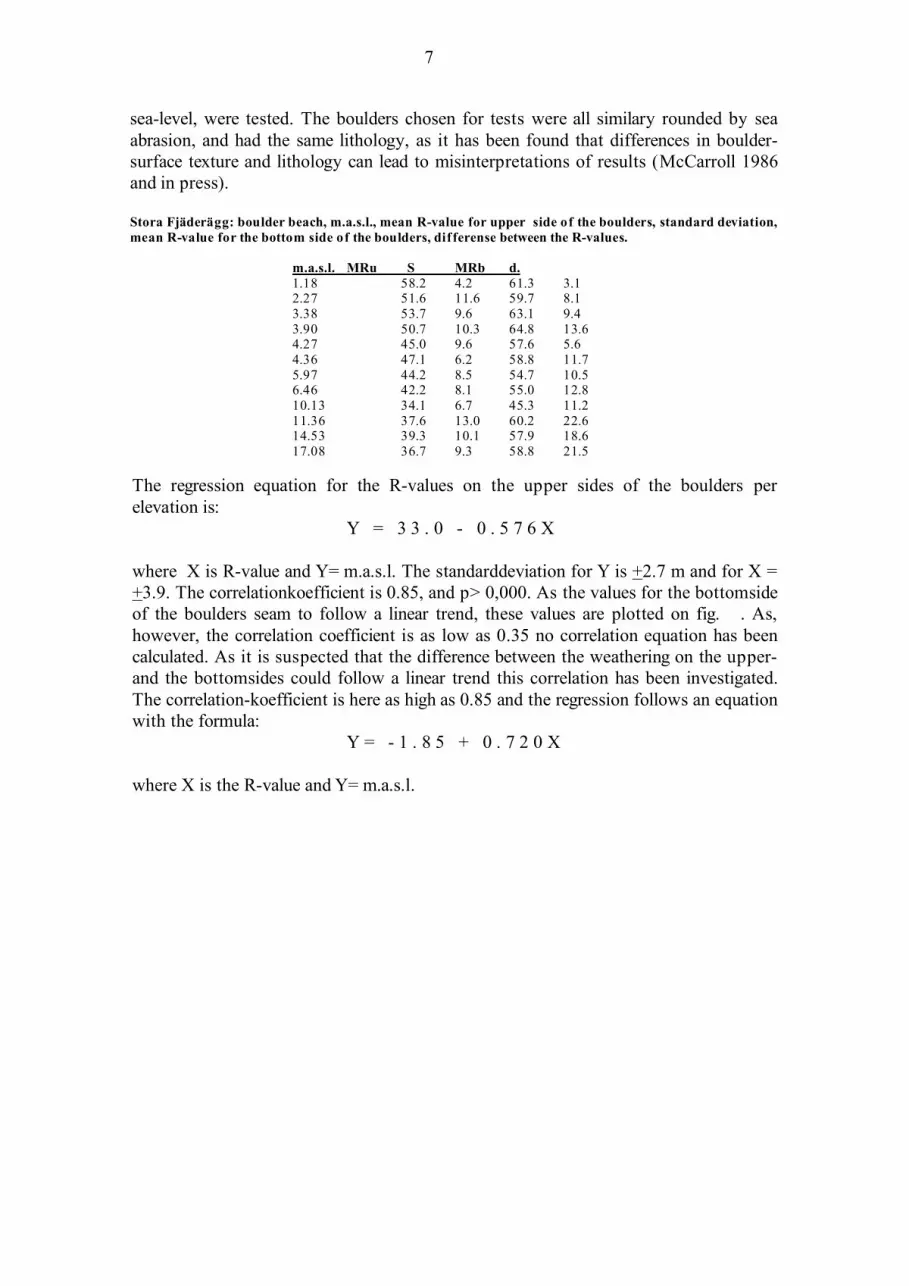
sea-level, were tested. The boulders chosen for tests were all similary rounded by sea abrasion, and had the same lithology, as it has been found that differences in boulder-surface texture and lithology can lead to misinterpretations of results (McCarroll 1986 and in press). Stora Fjäderägg: boulder beach, m.a.s.l., mean R-value for upper side of the boulders, standard deviation, mean R-value for the bottom side of the boulders, differense between the R-values.
m.a.s.l. MRu S MRb d. 1.18 58.2 4.2 61.3 3.1 2.27 51.6 11.6 59.7 8.1 3.38 53.7 9.6 63.1 9.4 3.90 50.7 10.3 64.8 13.6 4.27 45.0 9.6 57.6 5.6 4.36 47.1 6.2 58.8 11.7 5.97 44.2 8.5 54.7 10.5 6.46 42.2 8.1 55.0 12.8 10.13 34.1 6.7 45.3 11.2 11.36 37.6 13.0 60.2 22.6 14.53 39.3 10.1 57.9 18.6 17.08 36.7 9.3 58.8 21.5
The regression equation for the R-values on the upper sides of the boulders per elevation is: Y = 3 3 . 0 - 0 . 5 7 6 X where X is R-value and Y= m.a.s.l. The standarddeviation for Y is +2.7 m and for X = +3.9. The correlationkoefficient is 0.85, and p> 0,000. As the values for the bottomside of the boulders seam to follow a linear trend, these values are plotted on fig. . As, however, the correlation coefficient is as low as 0.35 no correlation equation has been calculated. As it is suspected that the difference between the weathering on the upper- and the bottomsides could follow a linear trend this correlation has been investigated. The correlation-koefficient is here as high as 0.85 and the regression follows an equation with the formula: Y = - 1 . 8 5 + 0 . 7 2 0 X where X is the R-value and Y= m.a.s.l.

8
0 20 40 60 800
5
10
15
20
Rö
Fjä.möh
R
Stora Fjäderägg. Plot showing the R-values on the upper sides of the boulders, the lower side and the differences between these values. The regressionlines for the correlations between m.a.s.l. and the R-values for the upper sides of the boulder, and the difference between the upper sides and the lower sides are also shown. For the R-values on the upper sides of boulders r= .85 and p> 0.000 This example shows clearly that the softening of the boulder surface, the weathering, on a raised boulder-beach, where each elevation above sea-level represents a specific age B.P. can be measured with the Schmidt hammer. It also shows that the upper exposed sides of the boulders weather faster than the unexposed bottomsides. This discovery was shown to be of importance for other applications of the method (see below). All four raised boulder-beaches in the initial study showed a very similar pattern with very high correlation coefficients between R-value on the upper sides of the boulders and the elevation above sea-level.
Site rxy p> St. Fjäderägg 0.85 0.000 Snöan 0.92 0.003 Grundskatan 0.69 0.006 Bjuröklubb 0.97 0.001 Tot. 0.85 0.000
The angle of inclination of the regressionslines for a simple regression was also very similar for the investigated sites, as is shown by the regression-equations (data in app. A):

9
Site Regression-equation. 1.Stora Fjäderägg Y=33.0-0.576x 2.Snöan Y=36.8-0.606x 3.Grundskatan Y=30.5-0.472x 4.Bjuröklubb Y=42.9-0.697x 1-4 Y= 34.9- 0.581x
The regression-lines for the localities are shown on fig. ---.
30 40 50 60 700
10
20 S.Fj.äggSnöanGrundskatanBjuröklubb.mAC
1
2
3
4
5
12345
m.a.s.l.
R
Regressionlines for 4 raised boulder-beaches and regression line for the total material (5). Measurments on raised coastal rocks. Parallell to the investigations on raised boulder beaches measurments were done on adjasent raised coastal rocks, formed by the same rock as the boulder beaches. These studies were primarly done to find out which substrate gave the clearest results with the Schmidt hammer, and secondary to find out which substrate weathered faster, boulders or rocks. The method used on coastal rocks varied a little compared to the boulder-beaches. The levels were measured by aneroid barometer, which was calibrated on each measured level, the number of tests on each level was a minimum of 15. The statistic mean for each level was calculated and the value was corrected to the test-angle, as it on coastal rocks is impossible to keep the same test-angle on the hammer at each elevation. These corrected R-values were correlated to the altitude. Finally the correlation-equation, and the standard-deviation for the regression-line was calculated. As an example a coastal cliff on the island Stora Fjäderägg is used.

10
Raised coastal rock on the island Stora Fjäderägg. The test site is one of the few sites with bedrock on this island dominated by raised boulder beaches. The site is on the northern side of the island and reaches from sea-level up to the lighthouse on the middle of the island. The surface of the rock is glacially polished. Nine levels between 0 and 20 m.a.s.l. were tested with more than 18 tests on each level. Stora Fjäderägg. Raised coastal rock. m.a.s.l., statistical mean and standard deviation.
m.a.s.l. mR s 0 62.1 4.3 2 57.3 6.3 6 55.1 4.1 10 48.8 7.9 13 52.9 9.8 14 48.5 12.0 17 48.7 11.2 18 40.1 7.5 20 42.3 8.7
The very high standard deviations for level 13, 14 and 17 m cannot be explained otherways, than by varying petrological content of the gneiss-granitic rock on those levels compared to the rest of the rock. The regression-equation for this site is: Y = 5 8 . 6 x 0 . 9 3 8 X where Y is m.a.s.l and X is R-value. The standard deviation for Y is +2.9, the correlationcoefficient is 0.922 with p> 0.000. The regressionline for this equation is shown on fig....

11
0 10 20 30 40 50 60 700
10
20
30
Fjäderägg
m.a
.s.l.
R
y = 58,6352 - 0,9384x R = 0,92
Strora Fjäderägg: coastal rock, regression line with mean R-values for measured levels. This example shows that the Schmidt hammer works as good on both the raised boulder beach and the coastal rock. Fig.... shows a plot to compare the regression lines for the raised boulder beach and the coastal cliff.
0 10 20 30 40 50 60 700
10
20
Fjäderägg bbFjäderägg cc
Regression lines for tested boulder beach (bb) and coastal cliff (cc) on the island Stora Fjäderägg.

12
On the graph, fig. .., it shows that the regression line for the coastal cliff has a steaper inclination than that for the boulder beach. This shows that the R-values on each level of the tested rock are higher, than those on the boulder field. This can be interpreted, as that the weathering on bedrock is slower than that on boulders though the type of rock is the same. As the surfaces on both are equally polished by glaciations and abrasion, the larger surface of the boulders per square unit, compared to the rock, seems to make the boulders more exposed to weathering. During these first attemts the following sites with coastal rocks were tested using the same method: Sikskärsudden, Holmsund, Västerbotten (0-15m.a.s.l) and Bjuröklubb, Västerbotten (0-43 m.a.s.l.). The rock in these areas consists of gneisses and gneiss-granites The present relative uplift at the tested sites varies between 0.84 mm in the south and 0.90 in the north. All three sites showed a very similar pattern with very high correlations between R-values and altitude.
Site rxy p> Stora Fjäderägg 0.922 0.000 Sikskärsudden 0.886 0.008 Bjuröklubb 0.977 0.000 tot 0.806 0.000
The angle of inclination for the regression lines for simple regression are more variated than those for the boulder fields (data in app. B).
Site Regression equation Stora Fjäderägg Y=58.6-0.932x Sikskärsudden Y=45.4-0.696x Bjuröklubb Y= 118 -1.870x
As this marked difference could be due to that the lithology and petrology of the gneissic bedrock varied from site to site and within the sites, further measurments were done on sites with petrologically more defiened types of rock. For this purpose coastal rocks and raised boulder beaches were measured in the Nordingrå region where the bedrock consists of magmatic rocks such as red Nordingrå granite, anorthosite and dolerite. The present relative uplift in the area is somewhat smaller than in the previously researched areas, 0.79 cm per year. One boulder beach and one coastal rock were measured on each type of rock. The altitudes of the levels were measured with aneroid barometer, which was calibrated on each level. On red Nordingrå granite a boulder-beach at Ytternäsan-Norrfällsviken reaching from sea-level up to 47 m.a.s.l. and an adjacent rock at Trollarviksberget reaching from sea-level up to 58 m.a.s.l. were chosen. Both sites are exposed to a long fetch toward south. Tested sites on Nordinrå granite. This boulder-beach, which is one of the largest along the northern Swedish coast, consists of washed short-transported moraine. The boulders varying in size from 0.2-1.0 m and are mostly well rounded. On this boulder-beach more than two meter high ridges, (the highest now active ridge at the present sea-level is five meter high), and

13
interjacent paleolagunes have been formed by southerly storms. Twelve levels were tested (data C.1 in app. C.). The equation describing R-value for the upper sides, the bottom sides of the boulders, and the difference between these values per elevation was calculated, were X equals R-value and Y elevation.

14
The regression equation for the upper sides of the boulders are: Y = 1 7 8 . 8 7 - 3 . 1 8 X Rxy is 0.94, p> 0.000, and the standard deviation for Y= +4.59. m. For the R-values on the bottom sides of the boulders the regression equation is: Y = 2 6 4 . 4 1 . - 4 . 4 5 X Rxy = 0.53 For the difference between the R-values the equation is: Y = 6 . 2 9 7 + 3 . 9 0 X Rxy = 0.87 On this site nine levels between 0 and 58 m.a.s.l. were tested. The tested surfaces chosen were mostly vertical. The initial data can therefore be used without rectifiation to test-angle. (Data in app. C.2). The regression-equation for R-value (x) per elevation (y) is: Y = 2 1 7 - 3 . 3 1 X which has a standard-deviation of +12.4 , Rxy = 0.82 and P> 0.007. The combined data for the boulder beach and the rock are shown on fig.... As can be seen on the graph the boulder material starts to weather faster than the rock, but the speed of weathering is the same, depending on a similar petrology of the substrate.
30 40 50 60 700
10
20
30
40
50
60Yttern.67bbTrollarv ccboulder-beachbedrock
Weathering regression lines for Nordingrå-granite. The upper line shows weathering on bedrock, and the lower line weathering on raised boulder-beach. The bedrock starts to weather later than 'the boulders, but the speed of weathering is the same.

15
Tested sites on anorthosite rock. Anorthosite rock covers the eastern parts of the Nordingrå region. The hills built up by anorthosite rearly exceed 75 m in elevation. Few boulder-beaches containing anorthosite boulders reach a higher elevation than 10 m in the area. The sites tested are situated close to each other and are exposed toward south. The boulder beach consists of round abraded anorthosite boulders mixed with boulders of dolerite. Seven levels from sea-level up to 9.5 m.a.s.l. have been tested (data in app. C.3). The regression equation for the upper sides of the boulders is: Y = 2 6 . 9 - 0 . 4 5 4 X where Y is m.a.s.l. and X the R-value. The standarddeviation for Y is +2.1 m , Rxy is 0.821, and P> 0.023. For the bottom sides of the boulders the regression equation is: Y = 6 6 . 1 0 - 1 . 6 7 6 X Rxy = 0.76 and for the difference between the upper- and under sides of the boulders the regression equation is: Y = 2 . 9 0 9 + 0 . 5 6 2 X Rxy = 0.74 On an adjacent rock, exposed to the south, and reaching from sea-level up to 26 m.a.s.l., before being covered by forest, nine levels have been tested on vertical surfaces (data in app. C.4.). The regression equation on bedrock is: Y = 5 7 . 2 5 - 0 . 9 9 x Where Y is altitude and X is R-value. The standard deviation for Y is +5.1 m and Rxy = 0.76. On the combined regression line for the anorthosite boulder beach and the bedrock, fig...., it can be seen that, in contrary to the Nordingrå-granite, anorthosite boulders seem to weather faster than the bedrock. A fact which also can be interpretated by visual examination in the field.

16
30 40 50 600
10
20
30Bönhamn ccBönhamn bb
m.a
.s.l.
R
Regression lines for anorthosite rock (above) and boulder beach (below) at Bönhamn, Nordingrå. The boulders weather faster than the bedrock. Tested sites on dolerite rock. Though dolerite rock covers huge areas in the Nordingrå region, very few rocks reach all the way down to the sea, and no boulder beaches are formed solely of dolerite rock. Thus, the boulder beach tested is the same as for anorthosite, where the mixed in round abraded dolerite boulders could not be misstaken from those of anorthosite. The 7 tested levels are also the same (data in app. C.5.). The site for bedrock tests is a coastal rock on the island Norra Ulvön, NE of Nordingrå. (Data in app. C.6). The regression-equation for R-values on the upper side of the boulders is: Y = 2 9 . 3 9 4 - 0 . 4 9 2 X where Y = m.a.s.l. and X = R-value and has a standard deviation for Y= +2.11 m, Rxy = 0.82, P> 0.023. The regression equation for the bottom sides of the boulders has a Rxy as low as 0.35. The regression equation for the site on bedrock is: Y = 75.71 - 1.246X s= +6.9m, Rxy= 0.89 , P> 0.04. Fig. .. shows a graph of the combined regression-lines for the boulder beach and the bedrock. Here it is guite clear that the boulders weather at a higher degree than the bedrock.

17
20 30 40 50 60 700
20
40Bönhamn bbm ulvö
m.a
.s.l.
R
y = 75,7104 - 1,2465x R = 0,89
Ulvön cc
Regression lines for a tested boulder beach (bb) and a coastal cliff of dolerite, Nordingrå. The boulders weather remarcably faster than the bedrock. Discussion. These first attempts, to investigate if the test hammer could be used to measure weathering on boulder beaches and coastal rocks in an area effected by a relative land uplift caused by isostaty and of mesospheric motions (Mörner, 1981), clearly showed that the R-values became lower on higher altitudes. As each level above the present sea-level represents a certain age before now, which varies depending on varying relative uplift, the lowering of the R-values really seems to show an alternation, weathering (chemical or biochemical), of the surface of the tested boulders or bedrock. These attempts also showed that the lines for simple regression on boulders have a lower angle than those of bedrock. This angle varies depending on type of bedrock. But it shows clearly that the surface of a boulder weather faster than a bedrock surface. This is certainly due to that the surface of a boulder is somewhat larger per square unit than that on bedrock, which makes the boulder more exposed to weathering primarly by meteoric water, which first effects the darker minerals of the rock, such as olivine, augite, hornblende, anorthite and biotite. These tests also revealed that the bottom sides of the boulders have higher R-values than the upper sides, even if some boulders were almost free-lying upon other boulders on the beach. This was a significant discovery that opened a new field for relative dating (see applications below). These higher values can be explained by the lower degree of exposure to chemical weathering on the under sides compared to the upper sides. The results show that the speed of weathering, as described by R-values and the simple-regression lines, is different depending on type of rock, petrology and lithology. Thus rocks with a greater content of hard weathered minerals as quartz and orthoclase

18
feltspar, such as the Nordingrå granite, weather at a very slow rate as is seen on fig . As the amount of dark minerals is so small the speed of weathering is undepending of the substrate. Bedrock and boulders weather at the same speed. Whilst rocks as anorthosite and dolerite, containing a high amount of dark minerals such as olivine, augite amphiboles and anorthite, are weathering comparatively fast, and the boulders weather faster than the bedrock. The sites with gneissic rock which is an itermediant rock, in the mineralogic content, also have regression lines in angles between the Nordingrå granite and the anorthosite/dolerite. From this it can be stated that it is impossible to compare R-values from sites with different petrologic content with each other. It has also been found, during the field work, that the size of the mineral grains, the texture, also effects the result of the test hammer readings. Thus, rocks and boulders that consist of fine grained minerals give higher R-values than those of medium and large grained materials, though the petrology is the same. Chorley (Chorley & all 1984: table 9.7) also show that fine grained rocks are more resistant to physical and chemical weathering than coarse grained rocks. The surface texture is also of importance for the interpretations of the R-values (McCarroll 1986). Surfaces with a rough or grainy surface give lower values than those with a smoth and polished surface. In the case of glacially, and abrasionally effected bedrock and abraded boulders, which by the morphological processes originally have a smoth surface, the roughening of the surface also is a visible sign of weathering. The morphology, structure, of the boulders is also of importance. During field work it has been found that flatened, elongated boulders mostly give higher R-values than rounded boulders. The reason might be the square unit area mentioned above. Thus, it is of great importance, when comparing different R-values with each other, that the tested materials have the same type of bedrock, internal and surface texture and structure.

19
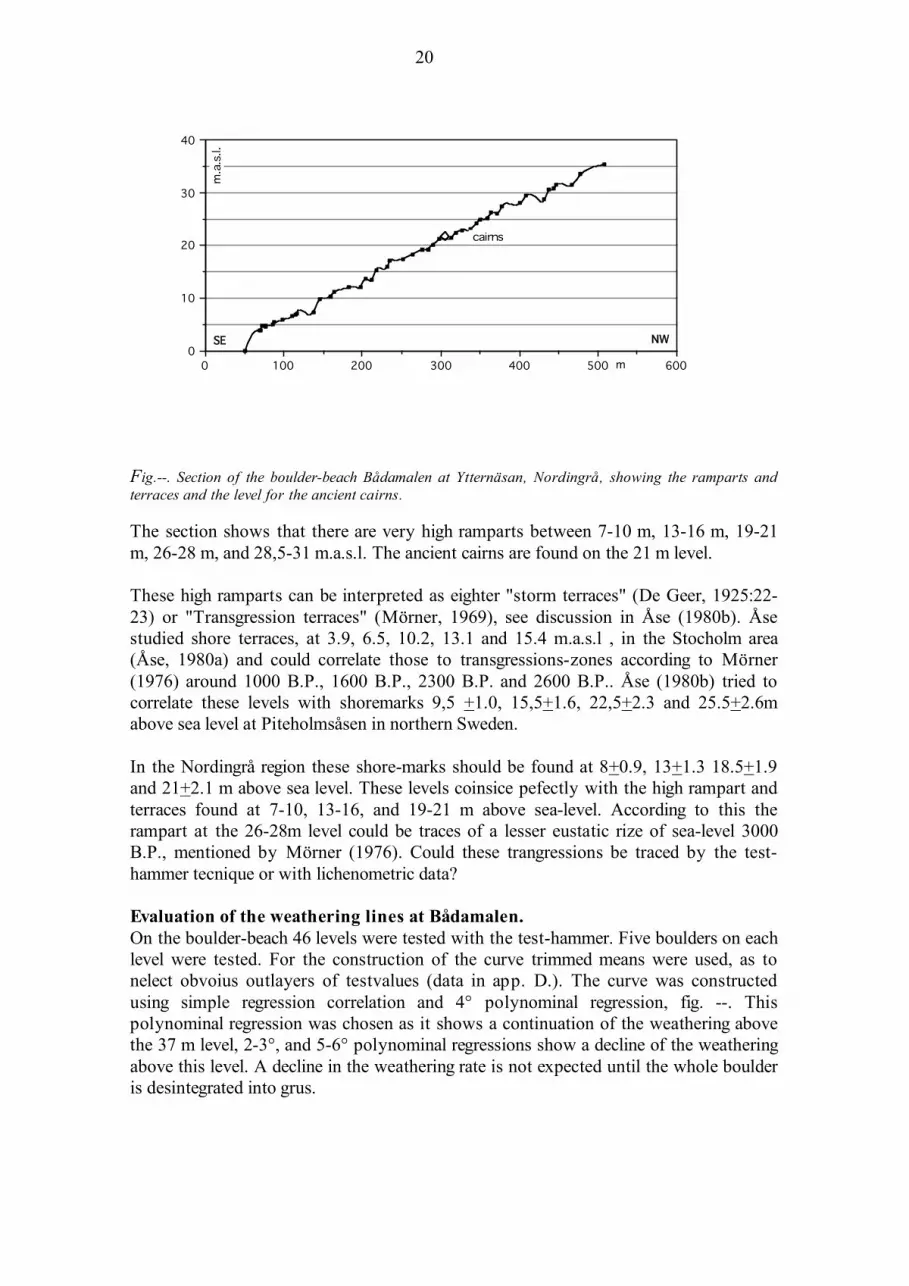
THE BOULDERFIELD "BÅDAMALEN" AT YTTERNÄSAN, NORDINGRÅ.- a methodological study. Introduction. To make a more thoroughly study of the method the raised boulder beach "Bådamalen" at Ytternäsan on the NE Nordingrå peninsula on the northern Swedish coast was chosen. The local bedrock consists solely of red orthoclase rich granite, which also has been the source for the boulder material on the boulder beach. The present relative uplift in the area is 8 mm per year and the site is less than 10 km south of the locality with the highest post-glacial shoreline in Sweden at 285 m a.s.l. The boulder beach which raises from sea-level up to 45 m.a.s.l. is 600 m long in SE-NW direction, and around 200 m broad. The boulder-material is mostly well rounded, with diameters up to 0.5 m. At certain levels these well rounded boulders are mixed up with more flatened, elongated boulders. At sea-level the boulder-field has an almost 4 m high active rampart, followed by a beach terrace Similary high ramparts with beach terraces occur at different levels. Between and above these high ramparts are smaller ramparts (<1 m high) On a beach terrace at the 21 m level a couple of huge cairns, which are supposed to be graves from the bronze-, or iron-age, are found. As this boulder-beach is one of the largest in northern Sweden, and has a very homogene, and hard weathered bedrock material, it was thought to be a good choise for a more thoroughly methodological study concerning the test-hammer technique. The high ramparts also raise guestions concerning postglacial transgressions in the area. Is it possible with the test-hammer to find disterbances in the weathering, which could be caused by a standstill of the shore-line? Methodical approach. The boulder beach was first thoroughly levelled with an electronic lacer theodolite, using 48 stations (levels) over a distance of 507 m, from sea-level up to 35.36 m.a.s.l. These level were adjusted to present mean sea-level. A very accurate profile of the boulder-beach could thus be constructed, fig. --. Of these levels 46 were tested with the test-hammer, using the method described above. Obtained data were processed by several statistical methods to test the model. Analyse of the levelling of the boulder-beach. The constructed section of the boulder-beach is shown on fig.--.
20
0 100 200 300 400 500 6000
10
20
30
40
m.a.s.
l.
SE NW
m
cairns
Fig.--. Section of the boulder-beach Bådamalen at Ytternäsan, Nordingrå, showing the ramparts and terraces and the level for the ancient cairns. The section shows that there are very high ramparts between 7-10 m, 13-16 m, 19-21 m, 26-28 m, and 28,5-31 m.a.s.l. The ancient cairns are found on the 21 m level. These high ramparts can be interpreted as eighter "storm terraces" (De Geer, 1925:22-23) or "Transgression terraces" (Mörner, 1969), see discussion in Åse (1980b). Åse studied shore terraces, at 3.9, 6.5, 10.2, 13.1 and 15.4 m.a.s.l , in the Stocholm area (Åse, 1980a) and could correlate those to transgressions-zones according to Mörner (1976) around 1000 B.P., 1600 B.P., 2300 B.P. and 2600 B.P.. Åse (1980b) tried to correlate these levels with shoremarks 9,5 +1.0, 15,5+1.6, 22,5+2.3 and 25.5+2.6m above sea level at Piteholmsåsen in northern Sweden. In the Nordingrå region these shore-marks should be found at 8+0.9, 13+1.3 18.5+1.9 and 21+2.1 m above sea level. These levels coinsice pefectly with the high rampart and terraces found at 7-10, 13-16, and 19-21 m above sea-level. According to this the rampart at the 26-28m level could be traces of a lesser eustatic rize of sea-level 3000 B.P., mentioned by Mörner (1976). Could these trangressions be traced by the test-hammer tecnique or with lichenometric data? Evaluation of the weathering lines at Bådamalen. On the boulder-beach 46 levels were tested with the test-hammer. Five boulders on each level were tested. For the construction of the curve trimmed means were used, as to nelect obvoius outlayers of testvalues (data in app. D.). The curve was constructed using simple regression correlation and 4° polynominal regression, fig. --. This polynominal regression was chosen as it shows a continuation of the weathering above the 37 m level, 2-3°, and 5-6° polynominal regressions show a decline of the weathering above this level. A decline in the weathering rate is not expected until the whole boulder is desintegrated into grus.

21
20 30 40 50 60 700
10
20
30
40 m.a.s.l.m.a.s.l.
m.
m.a.s
.l.
y = - 5010,7439 + 513,2338x - 20,617x^2 + 0,4094x^3 - 0,004x^4 + 1,567e-5x^5 R = 0,94
y = 82,1989 - 1,1815x R = 0,94
simple + 4• polyniminal regr.
Fig.--. Weathering lines of the boulder beach Bådamalen, Nordingrå. The streight line shows a simple regression with Rxy= 0.94 and the curve is a 4° polynominal regression with Rxy= 0.94, p>0.00. x-bars for+5%. of the Rm value. Both these curves were tested with a standard residual-test, which showed no pattern in the distribution of the residuals, when plotted versus level, and that the residuals for the m values for the 22.92 and 24.24 m level were >+2 and thus are real outliers, which needed to be checked, and explained. The two residuals at the 22.92 and 24.24 m level had Rm (M) values for the testsamples equivalent to 57.8 (60) and 56 (56). The 22.92 m value represents a shore-terrace, and the 24.24 m value the lower part of a rampart. On the 21.40 m level the ancient cairns, mentioned above, are found. This level also has a very high value for Rm(M)= 55.5 (56). This value has yet not a residual >+2. It seems that the boulder-material for the cairns was taken from these three levels. That also could show that the cairns were constructed close to the sea, and well above the highest levels of the breakers, and that it was more convinient to take the construction material from the same, or higher levels than the cairns, which means that they did not have to carry the boulders uphill. This level of the cairns also show that they were build during the Iron-age around 1000-2000 B.P., and not during the Bronze-age as most coastal cairns. This explanation explains the value of the residuals for the mentioned levels, and gives a new application to the test-hammer method. The supposed levels for transgressions mentioned above were tested with paired t-tests level for level. For the presumed transgression 1000 B.P. ranging between 7-9 m.a.s.l. a significant lowering of the Rm values with t= 2.156 on the 0.05 signifcance level were found between 6.95 and 12.01 m.a.s.l. between these values t varied between -2.39 - +1.71 with a signifcance between 0.027 - 0.11. which shows a clear disturbance in the Rm values for this interval. For the interval 12-14.5 m.a.s.l., which correspond to the 1600 B.P transgression, a significant lowering of the Rm values was found with t= 3.554 on the 0.005 significance level between 12.01-15.36 m levels. The significance level for interjacent levels varied between 0.28 and 0.83. This shows a disturbance in the Rm values for the interval 12.01-13.39 m.a.s.l.

22
The next interval 17-20 m a.s.l. shows great disterbances with varying + and - t-values and p values varying from 0.69-0.08 between the different levels on the 15.36-20.09 m.a.s.l. interval. The following six levels up to 24.91 m.a.s.l. are probably disturbed by the removal of boulders to the big cairns, which hide presumed tendences on this uppermost sign of a transgression. For the highest interval with a presumed transgression 3000 B.P, 26-32 m.a.s.l., the t-values varies between positive and negative values, and no significance (p= 0.001) is reached until the interval between 26.15 to 35.36 m.a.s.l. that might suggest a transgression. Lichenometric studies at Bådamalen. The lichenometric studies were carried out according to a method by Broadbent (Broadbent & Bergqvist, 1986, Broadbent, 1987, and this volume). On each level the largest five circular lichens (Rhizocarpon geograficum) were recorded. The diameter in cm for the largest of these were used for the growth curve (app. D), which was constructed by correlating the lichen-diameter to altitude, fig.---.
0 10 20 30 400
10
20
30m.a.s.l.m.a.s.l.
lichen cm
m.a
.s.l.
y = 1,6262 + 0,5654x R = 0,95
lichendo. outlayers
Fig.--. Maximum thallus diameters and elevations above sea-level, Bådamalen, Nordingrå. Black squares show lichens used for the growth curve. Rxy= 0.95, p < 0.005. The growth curve was constructed using the maximum thallus diameters up to the 21 m level, as data showed a decline of thallus sizes above this level, fig. --. This probably shows the growing up of a second generation of lichens. Compared to studied sites along the Northern Bothnian coast the growth curve seems very slow, as the 30 cm diameter lichen first appears on the 19 m level, compared to the 12 m level (Broadbent, 1987), on several northern sites, with higher relative uplift. This fact has earlier been mentioned by Sjöberg (1988), and can partially be explained by the lower Ph on the orthoclase-granite, compared to the sediment-gneisses further north. Other factors, or combinations of these, also can the lower growth rate, as: 1. the higher salinity in the Bothnian Sea, compared to the Bothnian Bay.

23
2. the somewhat smaller amount of sun-hours in the Bothnian Sea region, compared to that at the Bothnian Bay.
3. other climatic circumstances. When the sizes of the lichens are compared to the levelling of the boulder-field, it is possible to see that the lichens grow at different speed on different parts of the boulder-field. On the beach-terraces the lichens grow faster than on the rampart ridges, fig. ---.
0 100 200 300 400 5000
10
20
30
40
m.a.s.l.lichen cm
dist.
m.a
.s.l.
boulder-field
/lich
.diam
.
Fig.--. The sizes of lichens compared to the levelling of the boulder-field. The graph, where the Y-axes both represent m.a.s.l. and thallus diameter in cm, shows that the lichens grow faster on the beach-terraces, than on the rampart ridges. Regarding the transgressions no real sign could be interpreted by lichenometry, except the 7-9 m interval, were lichenometric data are confused, fig. .., and not linear as below this level. Higher up on the boulder field second generation lichens disterb the data. However, around the 20 m level, missing of larger thallus diameters could be caused by removal of boulders to the iron-age cairns. Conclusions. This study shows that the Schmidt test-hammer tecnique not only is useful to investigate regular weathering patterns, but is also useful to detect irregularities in this pattern, as here supposed transgressions. Lichenometric studies confirm these results on lower altitudes, where not a second generation of lichens confuses the growth curve.

24
ARCHAEOLOGICAL IMPLICATIONS OF THE TEST-HAMMER METHOD. Introduction. On the raised boulder-beaches, along the coast of northern Bothnian region, there are many ancient stone constructions, such as foundations of primitive dwellings, different types of cairns, labyrints etc., made of boulders. The origin, and the age of which has been very difficoult to estimate (Broadbent, 1987). The use of the Schmidt Test-hammer to investigate both the relative and the "exact" age of these was found by a pure insident. On the island of Stora Fjäderägg, in the Holmö archipelago, east of the city of Umeå, there are, except constructions mentioned above the remnants of an old fisherman's village with the hardly visible remnants of a long ago burnt down wooden fisherman's chapel, close to the former shore. Just for joy, three of the boulders of the old steps into the church were tested. The tests were done on the uppersides of the boulders. The results showed that the Rm values of these boulders had remarkably higher Rm-values than those on the adjacent boulder-beach at the same level. The Rm-value on these boulders (Rm=55.7) corresponded to the Rm-value on the 2 m level on the boulder-field. Our interpretation of this result was that the boulders of the primitive steps to the chapel had been placed upside down, so that the originally flat underside of the boulders, which are more favourable to step on, now had been the upside. Thus, the Rm-values corresponded to the weathering that had taken place since the boulders were put into the steps, in the middle of the 18th century, which with the present relative uplift in the area (9 mm/year) correspond to the 2 m level on the beach. This interpretation gave us a clue of the potensial for test-hammer investigations in archaeology, and initiated further studies. Initial studies. 1. Close to the remnants of the old fishermen's village there is a huge area with net-cairns and net-walls (net-cairns meens cairns constructed for supporting stand for the drying of fishing-nets, and net-walls are made of boulders for the same purpose). These walls are constructed parallell to present and former shore-lines. On the lowest net-wall, on the 1.5 m level, tree boulders were tested. The upper sides of these boulders had a Rm-value of 58.8, and the bottom-sides Rm = 60.0. On the 4 m level the tested boulders had an upper side Rm= 45.3. On the 7 m level the upper sides of the boulders had a Rm= 40.3, and the bottom sides Rm= 58.3. The diminishing Rm values on the upper sides of the boulders, on higher levels, must be interpreted such as the net-walls became older toward higher altitudes, an interpretation that also could be verified with lichenometrical datings. 2. This is a foundation, with remarcably high walls, found on the 13 m level of the island. The test-value for the tested boulders on the uppermost parts of the walls was measured to Rm=45.0. The boulders on the lower parts of the walls had Rm=35. Our

25
interpretation is that this wall had been reconstructed. This also could be verified by lichenometry, which showed that the lichens on the upper parts of the walls had thallus diameters <4 cm, while the thallus diameters on the lower parts were measured to 6 cm. These initial results were so promising that it was decided to try as many implications of the method as possible. The results are described in the following. Further implications. 1. Two stone foundations "tomtningar", Grundskataräften, Lövånger, Västerbotten. Grundskataräften is a large raised boulder-beach, at the Bjuröklubb peninsula in the county of Västerbotten, N. Sweden. On this site there are several stone foundations to primitive huts "tomtningar", made of boulders and built by iron age seal-hunters. Initially, in our research with the Schmidt test-hammer, we found that the Rm values on the bottom sides of the boulders differed from those on the upper sides. As the stone foundations were built by boulders from the beach, the boulders must have been put into the construction with care. That meens, that a specific boulder must fit into a specific place in the construction. Hypotheticly, some boulders fit better with their original bottom side downworth, while others fit better, when turned upside down. In this investigation our aim was to find out if it was possible with the testhammer to discern and to calculate the proportion of turned boulders in the foundations. Method. Two "tomtningar" were chosen for this investigation. These were site nr. 3 and site nr. 5, on the 14-15 m level. In site nr. 3 a number of 53 boulders all-round the foundation were tested, on site nr. 5, 57 boulders were tested. The Rm for each boulder was calculated and plotted on a histogram showing the percentual distribution of the Rm values (app. table E1), fig. ---. The normal R-value for the level on the boulder-field could be calculated, using a regression-equation earlier calculated for the boulder-beach. (Y= 34.9 - 0.78X, where Y is m.a.s.l. and X is Rm-value). The R-value for the 14 m level is Rm=40 (+4.8). Results.

26
25 30 35 40 45 50 55 60 65 700
10
20
30G site 3G site 5
R
%
Fig.--. Histogram of the percentual distribution of Rm values on 53 tested boulder on site 3, and 57 tested boulders on site 5, on Grundskataräften. Data in app. E1. The percentual distribution is shown on fig. --. For both sites the Rm-value for the level (Rm=40(+4.8) agrees strongly with the m-values for the distributions. Thus, boulders with Rm values higher than R=45 ought to have been turned when the foundations was built, or have turned over when they have rolled down from their original position. If Rm=55 is taken as a statistical break-level 15.8% of the tested boulders on site 3, and 24.6% in site 5, belong to the cathegory "turned boulders". Discussion. The distribution of the Rm values, as shown by the diagram, gives a somewhat god evidence of the amount of turned boulder. These foundations had been partly covered by soil and litter, which had been dug away a couple of days earlier. This covering of the boulders may result in a lower speed of weathering. This is a built in source of error, which might influence the results . To pass this problem the Rm-values of the boulders in site nr. 5 were chequed with the situation of the boulders in the foundation. See table. 1.

27
Rm-value 34 35-49 50 Sum. Boulders on surface 3 8 3 14 21.5% 57.1% 21.5% Cov. Boulders inside found. 1 8 6 15 6% 54% 40% Covered boulders on walls 5 15 9 29 17.2 51.7% 31% 9 31 18 % 15.5 53.4 31 This table can be evaluated in the following way. Boulders which previously had been covered correspond fairly well to the situation shown in the diagram. Previously uncovered boulders, still, differ a lot from what is shown on the diagram. This could be caused by the longer period during which they have been effected by weathering. Boulders with extremely low values may in several cases have been effected by fire, before, during, or after that they were put on the foundation. Any other explanation, than the turning upside down, cannot be found for boulders with extremely high Rm-values, as the type of bedrock is the same in all the boulders. 2. Boulder labyrinth on mount Högberget, Jävre S. Norrbotten. Mount Högberget, 85 m high, is situated close to the coast in Jävre comunity in southern Norrbotten. Högberget is formed by a 1.9 milard years old granite, Revsundsgranit. Morphologically Högberget is an elongated, fairly steep hill earlier washed by breakers from north, east and south. The hill is surrounded by wash-sediments, where the upper layers consist solely of the coarser fraktions in form of raised boulder-beaches. The present relative uplift in the area is 0.9 cm per year. The bedrock is easily weathered, and fairly big quantities of weathered grus are transported by meteoric water, and collected in pockets on the upper parts of the hill. On the top of the hill there is a well known ancient monument in form of a huge bronze age cairn and a boulder-labyrinth. The labyrinth is the highest situated, out of several labyrinths, along the northern Bothnian coast. The vicinity of the labyrinth to the cairn, as the altitude, speek for a contemporaneousness in time for the construction of these two monuments. That is the bronze age. The aim of the investigation, was to find out wether it was possible or not, with the test-hammer method to proof, or counter-proof this contemporaneousness

28
Method. The site was first investigated by testing the bedrock to get comparative data of the local weathering. Secondly, six boulders in the labyrinth were tested both on the upper- and the under-sides, as well as the bedrock below these boulders. The last measures were done because of the hypothesis, the boulders would protect the underlaying bedrock from weathering, and that the difference in Rm-values between the bedrock below the boulders, and the local exposed bedrock could tell something about the absolute age of the labyrinth. Finally four boulders on the cairn were tested on the upper side, and three of these on the under-side. Results. The results of the measurments are shown on fig. --
15 20 25 30 35 40 45 50 55 60 650
10
20
30
40abcde
R
%
Fig. --. Graph showing weathering values on mount Högberget. a= local bedrock; b= bedrock below labyrinth boulders; c= upper side of labyrinth bouldes; d= under side of labyrinth boulders and e= upper side of boulders in cairn. The exposed bedrock has a Rm-value of 36.7 (+6.1), n= 11, with a highest value of 46 (a on fig. --). Below the boulders of the labyrinth the bedrock has a Rm-value of 36.0 (+10.2), n= 33, with a highest value of 54 (b on fig.--). These two Rm-values are not in favour of the hypotesis. The boulders in the labyrinth showed a similarity in the Rm-values on the upper- and under-sides of the boulders (Rm= 36.2/37.7), n= 39/27. In both cases the spreading of the R-values is very big (c and d, fig. --). The Rm-values of the tested boulders on the cairn showed a higher statistical mean, on both the upper- and the under-sides (R= 47.0/43.5), than those of the labyrinth (e, fig. --).

29
Discussion. The equal means of the Rm-values of the exposed bedrock, and the bedrock below the boulders of the labyrinth gives no clues to wether the boulders protect the underlaying bedrock from weathering or not. A closer examination of the diagram, fig.--, shows that 18% of the R-values on the underlaying bedrock are higher than those on the exposed bedrock, which is in favour for the hypothesis. But, normally such amounts of weathered grus and litter have been colected around, and below rounded boulders that it might have intensed the speed of weathering, which also can be interpreted by the lower R-values on the diagram, fig.--. The spread of the R-values on the boulders in the labyrinth, speak for that very few of these boulders now have the same side up, as they had in the boulder-field, from which they were taken. These results can be interpreted in two ways. First, the lower Rm-value on the labyrinth could be interpreted as the labyrinth being older than the cairn. A factor speeking in favour for this is, that the Rm-value is almost the same as that on the exposed rock. Secondly, that the boulders in the labyrinth are taken from the cairn. These boulders should, according to this interpretation, have been the material that covered the bigger inner boulders of the cairn. This interpretation, which is the most probable, is favoured by the fact, that these bigger boulders of the cairn have comparatively high R-values, which can be seen on fig. --. The partly high values on the rock, which is covered by the boulders in the labyrinth, are too few to form the base for a strong interpretation. If these data are optimally interpreted, the difference in the higher R-values between covered and exposed rock agree with a difference in altitude corresponding to 5 m at two other tested localities with similar petrology, namely Bjuröklubb and Stora Fjäderägg. This should vagely hint at an age of 500 years. On the labyrinth there are also many measurable lichen (Rhizocarpon geographicum). The largest lichen has a thallus diameter of 115 mm. Several thallus diameters are measured to 61-81 mm. The largest lichen suggests an age of 547+35 years, while the 70 mm value gives the feature an age of 390+35 years, according to the equation Y = 147+3.48X (where X is thallus-diameter in mm, which have been calculated for the sites Grundskatan and Bjuröklubb (Broadbent & Bergqvist, 1986). Other facts, which speak in favour for that the boulders to the labyrinth are taken from the cairn are, that by the displacement of the shores no boulder-beach could have been formed on the top of a steep hill, in this exposed position. All the boulders to the cairn must have been taken from the boulder-beaches at the foot of the hill, or from the isolated boulder-beach below, and a couple of hundred meters away. If, which is most probable, the labyrinth is younger than the cairn, it is logical to believe, that man did not carry boulders from far away, when there were aboundant of material close by, on the cairn.

30
RESEARCH WITH THE SCHMIDT HAMMER OF TERRACED HOUSE-FOUNDATIONS IN FORSA PARISH, PROVINCE OF HÄLSINGLAND Introduction. In Forsa parish in Hälsingland, middle Sweden, several localities with terraced house-foundations, dating to the centuries around A.D., have been investigated, using the Schmidt hammer, to decide whether stone constructions on each site are contemporaneous. These investigations follow the method based on statistical processing of test-hammer data enabling comparions of different sites (Sjöberg, 1987, 1988), described above. Reseach area. The researched localities are in a radius of 2 kms around Forsa church, ten kilometers west of the city center of Hudiksvall, in middle Sweden. The landscape around Forsa is characterized by a zone combining a vagely undulating coastal plain with hills reaching 75 m a.s.l. and the mountainious Norrlands-terrain, which in the area is very broken, with topp-levels up to 360 m a.s.l. The area is drained by the creek Rolfstaån, which in the researched area flows through lake Kyrksjön, with a present level of 34,7 m a.s.l. The highest postglacial sea-level in the area is measured to 250 m. a.s.l. (Lundqvist, 1963). All localities are in a relatively coarse fractioned morain. The bedrock in the research area consists in the northern part of gneissgranites, which around Trogsta (se map, fig. --) turns into ögongneisgraniter (granites of Augengneiss type). The latter forms the bedrock around the southern parts of lake Kyrksjön. Between the two big lakes Södra and Norra Dellen there is a geological site with vulcanic rock, Dellenit. This bedrock has partly affected the content of bedrock types of the till in the Forsa-region, as the prevaling direction of the inland ice was toward south-east. Researched localities. Five localities with a total of 36 foundations were researched (Sjöberg, 1987a). These were: 1. Raä Forsa nr. 98. Forsa parish. The locality is situated on the north-eastern shore of Rolfstaån, 1 km NW Forsa church, and consist of a farm foundation with two terraced houses and grave in form of a cairn. The locality was together with nr. 99 archaeologically researched in 1987 by the county museum in Gävle (Melander, 1989). 2. Raä Forsa nr. 99 Forsa parish. This locallity is situated emediatly N of nr. 98. It consists of a couple of terraced houses, several cairns and a number of field cairns. 3. Raä Forsa nr. 97 Forsa parish. This locality is situated emediatly SE of nr. 98. It consists of the foundation to a big house, two smaller house-foundations and strings of boulders. It is considered to be of medieval age. 4. Raä Trogsta nr. 71. Forsa parish.

31
This locality is situated close to Trogsta village, on the western shore of lake Kyrksjön. It consists of the foundations of five terraced houses, a couple of smaller houses, twelve grave-cairns of which two are fairly big and seven field-cairns. The site has been excavated 1976-1981 by the Archaeological institute, Umeå university (Liedgren, 1984). Carbon 14 analyses of charcoal from houses C and H point toward an age of 1900+170 years, respectively 1825+105 years B.P. Similar analyses from house A points toward migration time. 5. Raä Tövsätter nr.160. Forsa parish. The locallity consists of the foundations of a 46 m long terrace to a house, several cairns and field-cairns. House A is one of the longest in the province of Hälsingland. Method. As a norm for the localities 97, 98 and 99 ten bigger erratics in the coarse bouldery till above the localities were tested with a number of 91 impacts. On each foundation, cairn etc., a minimum of five boulders were tested, with a minimum of five impacts on each boulder. The statistical mean and median values, as well as the standard deviation, were calculated for the total number of R-values. Histograms for the percentual distribution of the R-values were constructed. Results. The results of the investigation are summarized in table 1.

32
Table 1. Researched objects in Forsa parish, Hälsingland. Statistical mean and median values, standard deviations and number of tested boulders and impacts. Site m M sd. n.boulders/n tests eratics 39.2 38.0 10.3 10/91 FORSA 97 House 1. 40.3 42.0 9.3 5/32 terrace 42.0 42.0 5.9 5/39 house 4. 42.5 44.0 6.5 5/39 FORSA 98. house 1 36.7 36.0 8.3 5/41 stepps into house 43.4 46.0 7.6 5/34 cairn 4 44.2 44.0 8.2 15/170 house 6 36.3 37.0 8.8 7/66 boulders in wall 28.9 28.0 5.7 7/47 farm cairn 9 35.2 35.0 10.2 11/104 FORSA 99 cairn 11 36.1 34.0 9.3 5/35 monolite in do. 29.5 30.0 5.9 1/14 farm cairn 14 46.7 52.0 12.9 10.105 farm cairn 16 41.9 42.0 8.9 7/69 farm cairn 17 42.7 45.0 12.1 7/72 house 21 41.4 43.5 14.5 5/55 TROGSTA 71 House A 35.3 35.0 8.2 5/33 house C 39.4 39.5 19.0 6.44 house D 36.6 38.0 8.7 5/40 house F 41.3 43.0 7.8 5/35 house H 35.1 34.0 6.7 5/43 edge of terrace A/B 39.9 39.5 7.8 5/40 cairn 11 30.8 30.0 8.6 5/42 cairn 12 35.4 35.0 12.4 5/43 cairn 13 41.8 44.0 9.6 5/35 farm cairn 15 35.2 34.0 6.1 5/30 farm cairn 16 36.9 35.0 6.0 5/28 farm cairn 17 30.1 28.5 6.9 5/37 erratic at B 34.0 33.0 10.6 1/31 TÖVSÄTTER 160 house W side 31.3 30.0 6.9 5/34 house E side 34.6 35.0 7.9 5/50 cairn 33.5 31.5 8.2 6/42 cairn+grave+house 33.7 33.0 5.7 5/33

33
Interpretations. Forsa 98, 99 and 97. The results of the tested erratics show a normal distribution around a mean of Rm= 39.2, RM= 40, and a standard deviation of +10.3, fig. --. The standard deviation, table 1, is always great on metamorphic and magmatic bedrocks, which is explained by the different hardness of the containing minerals.
20 25 30 35 40 45 50 55 60 650
10
20
30erratic
R
%
Fig.--. Percentual distribution of R-values from ten erractics, above Forsa 98 and 99

34
20 25 30 35 40 45 50 55 60 650
10
20
30
4098:198:1ramp.98:4
R
Fig.--. Percentual distribution of R-values in house-foundation nr 98:1, rampart of 98:1 and grave cairn 98:4. Locality nr. 98 is somewhat difficult to interprete and shows partly contradictory values. Some interpretations are, still, possible to make. The boulders on the terrace to house 98:1, fig.--, show values, which are clearly below those of the erratics, and especially the boulder to what is thought to be the entrance to the house show a very interesting oblique distribution of the R-values, fig.--. Two obtima at R= 35 and R= 50 are clearly recognized (Sjöberg, 1987a:fig. 2b). The lower value may, compared to the localities Trogsta and Tövsätter, and nr. 98:1 above, be thought upon as a normal value. The higher value can be interpreted as the surfaces of secondary polished boulders, where the originally weathered surfaces have been rubbed away by feet etc. The Rm-value of a fresh polished boulder surface, e.g. at shore level, is around 60. This lower value (Rm= 50) might show the degree of weathering since the house was abandoned. Site 98:4 has been interpreted as a grave-cairn contemporary to the house-terrace. The distributions of the R-values, fig.--, can be interpreded as if new boulders have been put onto the cairn later. Locality nr 99 is situated nearby to the latter, and is only devided from this by a small creek. It has been regarded as contem-poraneous to locality 98. One terraced house (99:21) shows a very split distribution of the R-values, out of which it is not possible to draw any conclusions. Three of the tested field-cairns (98:14, 16 and 17) initiated interesting interpretations. Field-cairn 99:11 show a double-peak distribution that probably suggest that a contemporary cairn has been covered by younger material. Cairn nr 99:14 show a clear oblique distribution, which might be interpreted as a contemporary cairn, on which new

35
boulders, dug out from the ground, have been put at a much later occasion. Similar, but not as clear oblique distributions are found on cairns 16 and 17.
20 25 30 35 40 45 50 55 60 650
10
20
30
99:1499:1799:11
R
%
Fig.--. Percentual distribution of R-values in field-carns 99:11, 14 and 17. On locality nr 97 the tests show clearly higher results than those on nr. 98 and 99, with a Rm= 42. This must be interpreted as the locality is younger than the previous ones. The locality has not been excavated, but archaeologists interpret the locality to be of medi-eval age. Trogsta nr. 71. The tested foundations of houses A, D and H show very similar Rm-values, varying between 35.1 and 36.5, fig. --. The distribution of the R-values for house A and D show a optimum around R=40 The test-value for house C is Rm= 39.4, which is comparable to the edge of a terrace beween house A and B (Rm= 39.8). A higher value is found on house F (Rm= 41.3). As in houses A and D the optimum value is around R= 40. From the distribution of R-values and statistical means it can be evaluated that, all these houses, except for B and F, are contemporaneous.

36
20 25 30 35 40 45 50 55 60 650
10
20
30
4071:A71:D71:H71:F
R
%
Fig.--. Percentual distribution of R-values in foundations of the houses Trogsta 71:A, D, H and F. Of the researched field-cairns (nr. 13-17), number 15-17 show similar means (Rm= 30-35), as well as optimas in the distribution of the R-values. Totally different is the little cairn nr. 13, with Rm= 41.8 and an optimum in the distribution at R= 45, fig. --.
20 25 30 35 40 45 50 55 60 650
10
20
30
40
5071:1571:1671:1771:13
R
%
Fig.--. Percentual distribution of R-values in field-cairns nr. 13-17, Trogsta.

37
The interpretation of the results from Trogsta, should be that house H, which is partly built over by a grave-cairn is the oldest, and the small houses B and F are the youngest. The field-cairns ought to be contemporaneous with the investigated houses, except for field-cairn nr. 13, which seems to be definitely younger. The morphology of this cairn is also different from the others. Tövsätter nr. 160. This 46 m long terraced-house was tested both on the eastern, and the western short-side. Even though the Rm-values are similar (34.6 and 31.3) the distribution of the R-values is very different, fig.--. The values from the eastern short-side show a very oblique distribution, while the distribution of data from the western side have a normal distribution, gathered around an optimal value of R= 30. The two investigated cairns show similar distributions, fig.--, and Rm-values (R= 33.5 and 33.7). This inidicate, that the different foundations at Tövsätter ought to be contemporaneous.
20 25 30 35 40 45 50 55 60 650
10
20
30
40160:E160:Wcairn 1cairn 2
R
%
Fig.--. Percentual distribution of R-values from two terraced house-foundation and two cairns at Tövsätter nr. 160. If these results are used for a relative dating of the localities and the tested sites, it seems as the foundations of the terraced houses and the cairns at Trogsta and Tövsätter are contemporaneous and older than the terraced houses in Forsa, where Forsa 97 obvious is younger than Forsa 98 and 99. "Absolute" datings of the localities. As the investigated localities are situated inland, and too far from the coast, and as the building-material is mixed up with too many boulders containing bedrock from the Dellen-formation, compared to raised boulder-beaches along the coast, a local weathering regression line had to be constructed.

38
To construct a local weathering regression line, previously dated features made of stone had to be used. Thus, the sites, dated by C 14 to the first centuries A.D at Trogsta, were used as the lower part of the regression line. For the middle part the medi-eval site Forsa nr. 97 was used, combined with a late medi-eval house close to the church at Forsa. The old medi-eval church in Forsa was not useful for testing, as it is plastered. Crossing the river Rolfstaån, at Forsa, is an old bridge, the fundaments of which can typologically be dated to the 18th century. This brigde has been reconstructed with stone-material in the 19th and early 20th centuries. A wall made of bedrock material was constructed around the church-yard in the 19th century, and was rebuilt in early 20th century. These latter features were used to construct the upper part of the regression line. All the sites were tested, using the same method. Table 2. Features used for "absolute" datings, Rm-value and age. Site Rm age A.D. remarks Trogsta 71:A 35.3 400 14-C " 71C 36.6 100 " " 71:H 41.3 100 " Forsa 97 40.3 1300 typolog " 97 42.0 1300 " " 97 42.5 1300 " Forsa late medi-eval. house 46.5 1400 " Forsa, bridge 42.8 1750 " " " 44.8 1800 " " " 50.0 1900 Wall around Forsa church 47.3 1800 " 42.4 1900 The regression-line constructed of these features follows the equation
Y= -3946+121.9X
where X= Rm-value, Rxy= 0.75, with p> 0.005. The equation has however the very high standard deviation of +469 for years. The "absolute" age of the tested terraced houses and cairns where calculated, table 3, and plotted against this regression-line, fig.--.

39
30 40 500
500
1000
1500
2000
yearsForsa TövsätterTrogsta
Rm
year
s
y = - 3946,0417 + 121,9108x R = 0,75
Fig.--. Regression line for "absolute" datings in Forsa parish, and attempts to use the test-hammer method for "absolute" datings of investigated sites. Table 3. "Absolute" datings of investigated sites in Forsa parish, site, Rm, calculated age A.D., and 14-C datings. Site Rm A.D. 14-C date Forsa 98:1 house 36 400 200-400 98:9 house 36 400 99:1.cairn 36 400 99:21 house 41 1000 Tövsätter house 33 100 cairn 33 100 cairn 33 100 Trogsta 71:D house 36 400 71:F house 41 1000 71:12 cairn 35 300 71:13 cairn 41 1000 71:15-17 cairns 33 100 Discussion. The constructed weathering regression line shall not be regarded as definite, as several sources of error is built into the data. So, are the boulders of the medieval house at Forsa church more of Dellen-vulcanics type, than of Augengneiss-granite or Gneissgranite, which are dominant in the researched localities. The building material in the old bridge might not be of local bedrock. The upper, somewhat new parts of the wall around the church-yard have too low values for the boulders to be cut when the wall was reconstructed. It might very well be built of material from an older wall around the church. This is too probable, compared to the Rm-value of the older parts of the bridge. And, as previously stated, all Rm-values of metamorphic and metamorphic rocks have a high standard deviation.

40
Despite this, the results and interpretations of the relative and absulute datings can be discussed. Carbon-14 analyses from Trogsta points toward a use of the houses C and H around A.D. 100-200, and house A around 400 A.D (Liedgren, 1984). Similar analyses from Forsa show a use of these houses around A.D. 200-400 for house 98:1, around 300 A.D. for house 98:3 and 99.4. (Liedgren, 1989:70, Melander, 1989). Test-hammer values give, according to the local weathering regression line, the site at Forsa an age of 400 A.D., with one extreme-value of 1000 A.D. for a field-cairn. These datings are surpricingly correspondent to the 14-C datings. This also include the field-cairn (nr. 98:11) where the distribution of samples shows a double peak, and the lower peak with R-values around 30, suggest an age of 200 A.D. House D at Trogsta is, by this method, dated to 400 A.D. This value is also very probable in view of the 14-C datings of neigbouring houses. So are the values for the cairns nr. 12 and 15-17. House F is dated to 1000 A.D., this value is out of order, compared to the 14-C dating of the same house (400 A.D.). The test-hammer dating of cairn nr. 13 to 1000 A.D. looks out of order compared to the other constructions at the locallity. As the morphology of this cairn is very different from other cairns at this locality the dating at least tells us that this cairn might differ in age from other features at Trogsta. Despite all the sources of error in this method, Schmidt hammer tests seem to give very valuable, fast, and not at least unexpensive, directing datings of archaeological features, were no dateable artifacts give a more secure dating.

41
GRUNDSKATAN AND HORNSLANDSUDDE. A comparative attempt to date foundations on two raised boulderbeaches by test-hammer - and lichenometric dating methods. The raised boulder-beach Grundskataräften, on the Bjuröklubb peninsula in northern Sweden, was used for early studies with the Schmidt-hammer, p. - . As the boulder foundations on this beach, in form of primitive huts, labyrinths and cairns, have been archaeologically investigated and dated by Carbon-14 (Broadbent, in print), the site has been chosen for a thorough study of these features and a couple of pits at lower altitudes of the same beach, with both the Schmidt-hammer method and lichenometry to find out the possibility of using these methods for absolute datings of similar objects. The same type of study has also been carried out on the raised boulder-beach at Hornslandsudde, further south on the Bothnian coast, were similar features are found, but no C-14 datings have been carried out by archaeologists. Grundskatan, Lövånger, N. Sweden. The investigated area is situated on the NE coast in the county of Västerbotten, at ca. latitude 64°28'N, longitude 21°25'E. The Grundskatan site is situated on the northern portion of a NNW-SSE oriented wave-washed drumlin. The moraine material consists of gravel and even-sized, well-rounded boulders, mostly under 1 m in diameter. The bedrock material in the boulders are mostly metasediments (gneisses), but some easily recognized boulders consist of fast weathering rocks with a high iron and sulphurus content The exposed beach consits of some 9 terrace formations up to an elevation of 16,5 m a.s.l. The present relative uplift in the area is 9 mm per year. Exposure is toward E swinging to SE. Topgraphically the Grundkatan was once a small peninsula corresponding to the 10 m contour. Vegetation on the wave washed till consists dominantly of lichens, mosses and low bushes of Vaccinium, Empetrum and Rubus type. The climate of this region is continental with a local maritime influence and a positive temperature anomaly. Average June temperature is 12°C and the average temperature in December is -7°C. Coastal ice forms in mid-November and ice cover lasts to late May. The annual percipitation is as low as around 450 mm. Growing season is about 5.5 months, and snow cover about 5 months.

42
Method Both a weathering regression line for the upper and under sides of the boulders, and a lichen growth curve for Rhizocarpon geographicum have previously been constructed for this site (Sjöberg, 1987, Broadbent & Bergqvist, 1986, Broadbent,1987). These data (App. A3) were used as a base for this study. The constructed weathering regression line follows the equation:
Y = 30.5 - 0.47x where X is Rm-value and Y is elevation above sea-level, r= 0.73 and p> 0.006, s for the Rm values is +4.8.and for elevation +3.3 m. For lichens the equation describing diameter with elevation is:
Y= -27.5 + 28.7x r.= 0.98, p< .001 and s for diameter is +12 mm. On this beach seven foundations were tested with the Schmidt hammer. These were four foundations to huts (nr. 1, 12, 13 and 14) on the 13 m level, two cairns at the 11 and 10 m level (B,C), and a shooting blind at the 8 m level (A), fig. --. All these features were tested using the mean (m) and the median (M) value for 5 tests on the upper side of 20 boulders..All the m and M values for each feature were first treated statisticaly to get a total m and a M value for the whole sample. Secondly they were transformed into five unit intervalls and a frequence histogram for each feature was constructed to find out if there was a second peak in the distribution that could suggest turned boulders (see above), or other deviations from a normal distribution, which, when compared with the weathering regression line, could be dateable by the testhammer method. For lichenometry, the diameter of the largest thallus of Rhizocarpon geographicum on the group of features of the investigated level was measured. The boulder-surfaces for the largest lichens on each foundation were tested with the Schmidt-hammer to find if the lichen was growing on a supposed turned boulder, or not. The age of the lichens was calculated using a linear regression equation for estimating age for lichens in the area (Broadbent, 1987:41). Results. Feature 1. This is the middle foundation in a row of five huts (tomtning) (Broadbent, 1987:13-15) on the 13 m level, fig.--. The, up to 0.8 m high, walls are formed by boulders of gneiss and quartzite rich gneiss-granite A carbon sample from the hearth was radiocarbon dated to 1160+70 B.P. (St.10787). The results of the hammer tests are shown in fig. --.

43
25 30 35 40 45 50 55 60 650
10
20
30
40
1m%1M%
1m%
R
Fig. --. Histogram of Rm and RM values of 20 tested boulders in feature 1, Grundskatan. The oblique distributions of both the Rm and the RM values are clearly shown by the histogram. This oblique distribution is partly explained by the high amount of quartzite boulders The sample has a mean-value for the Rm-values = 50.8, (M=51.4). For the 13 m level on this beach a Rm value of 42+4.5 is expected. The largest lichen on a feature on this level has a thallus diameter of 180 mm., the second largest 150 mm. Feature 12. This is a foundation to a hut (tomtning) on the 13 m level. The up to 0.4 m high walls are formed by boulders of gneiss. The hut is radiocarbon dated to a calibrated 14C age of 540-670 A.D. (Nilsson, 1989:23). The Rm and RM values show mainly a normal distribution around a mean value of 47.5, but with a marked secondary peak at Rm=50, RM=55. Normal value for the level is Rm= 42 Lichenometry as on feature 1. Feature 13. This is a foundation to a hut (tomtning) on the 12 m level. The material of the walls consists of boulders of gneiss. The hut is radiocarbon dated to a calibrated 14C age of 990-1280 A.D. (Nilsson, 1989:23). The Rm and RM values show a normal distribution around a mean value of 48.6, with a marked secondary peak at Rm, RM=55. Lichenometry as on feature 1 and 12. Feature 14. This is another foundation to a hut (tomtning) made of gneissic boulders on the 13 m level, with up to 0.5 m high walls. Above the hut a labyrinth was constructed in the 16th century according to lichenometric datings (Broadbent & Sjöberg, 1990) Two radiocarbon dates from the hut give the feature an age of 770-1230 A.D. (Nilsson, 1989:23) The distribution of the Rm and RM values is scattered around a mean value of 47, with a marked secondary peak at Rm=55. This peak is even more marked when the sample is divided into two unit intervalls. Lichenometry as on previous features.

44
Feature C. This is a one meter high cairn on the 11 m level. The distribution of the Rm values is scattered around a primary peak at Rm= 45, and with a marked secondary peak at Rm= 50. The normal Rm value for the level is 44. The largest lichen on the feature is measured to 100 mm. Feature B. This is a small cairn (shooting blind?) on the 10 m level. The distribution of the Rm values are almost normaly distributed around a mean-value of 49, with a secondary terminating peak at Rm= 55. The normal Rm-value for the 10 m level is 45. The largest lichen on the feature is measured to 100 mm. Feature A. This is a pit among boulders with a 0.4 m high front-wall (shooting blind?). The distribution of the Rm-values are normaly distributed around a mean of 50. When divided into two unit intervals a secondary peak at Rm= 58 is clearly recognized. Normal Rm value for the level is 47. The largest lichen on the feature is measured to 80 mm. Hornslandsudde, Hudiksvall, middle Sweden. Hornslandsudde is situated on the E coast in the county of Gävleborg, at ca. latitude 61°40'N, longitude 17°25'E. The site is the southernmost part of a hilly peninsula, island corresponding to the 5 m contour, with the shores facing S and E covered by washed tills. The till material consists of coarse gravel and even-sized, well-rounded boulders mostly smaller than 0.5 m in diameter. The bedrock material in the boulders are sedimentary gneiss. The exposed beach reaches from sea-level up to around 30 m.a.s.l. Exposure is toward S swinging to E. The present relative uplift in the area is 0.75 cm per year (Mörner, 1976). Vegetation on the wave washed till is similar to that on Grundskatan. The climate at Hornslandsudde is also similar to that at Grundskatan, but with a somewhat longer growing season, and shorter period of snow cover. Method. A weathering regression line for the upper- and under sides of the boulders, and a lichen growth curve for Rhizocarpon geograficum had previously been constructed for this site (Sjöberg, 1987a:23,29, 1988:24,45). These data (app., F1.) were used as a base for this study. The weathering regression line follows the equation:
Y = 49.53 - 0.86x were x is the Rm value and Y is elevation above sea-level, r= .97, p= 0.000, s for Rm=+4.6. For lichens the equation describing diameter with elevation is:
Y = 0.041 + 0.05x r= .99, p< .000 and s for elevation is +2.5 m. On the southernmost point of Hornslandsudde, there are about fifty foundations made of boulders to primitive huts, fig.---, similar to those on Grundskatan. Seven of those were tested with the Schmidt hammer, and data were treated as on Grundskatan, which

45
means that the number of tests per foundation is n= 100. The foundations, together with 13 other, were investigated for lichenometric purpose. To enable "absolute" datings of the features a shore displacement curve was constructed, using carbon 14 data presented by Lundqvist (1963:181), fig. --..
Fig.--. Hornslandsudde, hut foundations and enclosures on raised boulder-beach. Results. Of the foundations investigated with the Schmidt-hammer two are situated on the 24-25 m level, two on the 19-21 m level, two on the15 m level, and one on 13 m level. The foundations are numbered from the highest altitude and downworth. Feature 1. This is the uppermost foundation (tomtning) on the boulder beach. The low, up to 0.5 m high, partly well preserved walls are situated on the 25 m level The gneissic boulders in the well-preserved parts are mostly angular, in other parts of the foundation rounded. The distribution of the Rm and RM values are normally distributed around a mean-value of 32. For the 25 m level on this beach a normal Rm value of 27 is expected. The largest lichen of this feature has a thallus diameter of 108 mm. Feature 2. This is a foundation to a hut (tomtning) on the 24 m level, with rounded walls, up to 0.5 m high, .formed mostly by rounded boulders of gneiss. The distribution

46
of the Rm and RM values are obliquely distributed around a mean value of 35, with a low secondary peak at Rm= 25. The normal Rm value for the altitude is 27 as above. Largest lichen thallus diameter is 150mm. Feature 3. This is a well-preserved foundation with up to 0.7 m high wall, situated in conjunction with a rock outcrop on the 21 m level. The oblique distribution of the Rm and RM values are distributed around a mean value of 43 with to marked tops at Rm= 35 and 45. The normal Rm value for the altitude is 34. Largest lichen thallus diameter is 110 mm. Feature 4. This is a dominant foundation which is a combination of two huts with almost meter-high walls on the 19 m level. The distribution of the Rm and RM values is oblique with a mean value of 40. The distribution has a marked lower secondary maximum at Rm= 30. The largest lichen thallus diameter is 150 mm. Feature 5. This is a foundation to a pair-hut with up to 0.5 m high walls on the 15 m level. The distribution of the Rm values are normally distributed around a mean value of 43. The normal Rm value for the altitude is Rm= 38. There are no lichens on this feature. Feature 6. This is a long, up to 0.5 m high wall perpendicular to the shore-line. The distribution of the Rm values are normally distributed around a Rm value of 43. No lichens are recorded. Feature 7. This is a small foundation, on the 13 m level, with low walls, which seems to have been archaeologically excavated, probably by Ambrosiani (1971). The distribution of the Rm values is normally distributed around a Rm value of 41.5. The normal Rm value for the altitude is Rm= 39. The largest lichen thallus diameter is 120 mm. Datings. Shore displacement curves for Grundskatan and Hornslandsudde were constructed as a base for the datings, fig. --. The curves were constructed as 2°-polynominal regression curves, based on data from Broadbent (1979) and Lundqvist (1963).

47
-6000 -4000 -2000 00
10
20
30
40
50
m.a.s.l.m.a.s.l.Grundsk.m
m.a
.s.l.
y = - 0,9553 - 0,0093x R = 0,97 y = 0,1617 - 0,0061x + 9,366e-7x^2 R = 0,98
Hornslandet
Grundskatan
y = 0,0976 - 0,0082x + 6,374e-7x^2 R = 1,00
Yrs.BP.
Shore displacement curves for Hornslandsudde ,below, and Grundskatan, above. Data after Lundqvist (1963) and Broadbent (1979). The upper left equation is a simple regression for Hornslandsudde, the upper right a second degree polynominal regression for the same area. Below a second degree polynominal equation for Grundskatan. As is found in earlier studies of similar features a certain number of the boulders are turned upside down, and thus have higher R-values, compared to the original upside R-value in the boulder beach. That meens that the Rm value for the whole sample is higher than expected for the specific level. This value also should be lowered with a couple of R units, for the weathering that took place before the turned boulder was removed from the beach. This lowered Rm value for the sample should therefore give us an indication of the age of the feature. Grundskatan The results of hammer tests and lichenometry on the features on the 13 m level give the following datings. Feature 1 has a Rm value of 51, which coincides with a shore-level of 5.7 m above present sea-level. This was the shore-level 640 years BP (1350 A.D ), and should be the minimum age of the feature according to the Rm-values. Lichenometry gives an age of 1300 B.P. 14C dating of carbon from the hearth gives the feature an age of 780-969 A.D. The Rm= 47.5 value for feature 12 gives the feature an age of around 1100 A.D., lichenometry 1300 A.D. The feature is carbon-14 dated to 510-670 A.D. Similar values are found for both Rm and lichenometry for feature 14. Compared to this, both the age calculated from Rm and lichenometry is too low. For feature 13, with a Rm value of 48.6, the calculated age is around 1200 A.D. Lichenometric age is 1300 A.D. The 14C date for this feature is 990-1280 A.D. In this case all the datings coincide.

48
On the 10 m level, which has a normal Rm value around 44, the cairn, feature C, has a Rm= 48.7. This value gives the cairn a similar age as feature 13, above. That is around 1200 A.D. Lichenometric age is around 1500 A.D. This age is however more in accordence to the secondary peak at 55 in the Rm distribution For the shooting-blind, feature B, the distribution of the test-hammer values is very similar to the previous one, and so is the size of the largest lichen. Both these dating methods speak for a similarity in age of these two features, which according to shore displacement cannot be older than 1000 B.P. On the 8 m level, which was shore level around 800 years ago, feature A have a Rm value of 51, which give an age of 1300 A.D. The lichenometric age is calculated to 1600 A.D. These datings are summarized in table -- . Table --. Investigated features at Grundskatan, Rm-value, lichen size, testhammer age, lichenometric age and carbon 14 age. Feature m.a.s.l. Rm lichen mm.Rm age l.age 14C age. 1. hut 13 51 150 1300 1300 780-969 12. hut 13 47 150 1100 1300 510-570 13 hut 12 48 150 1200 1300 990-1280 14 hut 13 47 150 1100 1300 770-1000 C cairn 11 48 100 1200 1500 B blind 10 48 100 1200 1500 A blind 8 49 80 1300 1600 Hornslandsudde. The highest elevated feature on Hornslandsudde, nr. 1, at 25 m.a.s.l. has a Rm value of 31.9, which coincises with a shore-level of 22 m a.s.l. According to the shore-displacement curve, fig. --, this was shore-level at 2590 B.P. Lichenometry gives an age of 800 B.P, table --. Feature 2, on the 24 m level, with a Rm value of 35.3, coincises with a shorelevel 2300 B.P. Lichenometry here gives an age of 1050 B.P. On the 21 m level, feature 3, with a Rm value of 43.2 coincises with a shore-level 1632 B.P., with a lichenometric age of 800 B.P. Feature 4, on the 19 m level, with a Rm of 39.8 coincises with the shore-level at 1950 B.P. The lichenometric age is calculated to 1050 B.P. Both investigated features on the 15 m level, nr. 5 and 6, has Rm values (43.1, 43.3) that correspont to an age of 1600 B.P. Feature 7 on the 13 m level (Rm=41.5) has a calculated test-hammer age of 1800 B.P., and a lichenometric age of 900 B.P. The dating results are summarized in table --. Table --. Investigated features at Hornslandsudde, Rm-value, lichen size, testhammer age, lichenometric age and carbon 14 age. Feature m.a.s.l. Rm lichen mm Rm.age l.age 14C age 1. hut 25 31.9 108 -600 1200 - 2. hut 24 35.3 150 -300 900 - 3. hut 21 43.2 110 400 1200 - 4. hut 19 39.8 150 00 900 - 5. wall 15 43.1 - 400 - -

49
6. hut 15 43.3 - 400 - - 7. hut 13 41.5 120 200 1100 - Discussion. As can be seen on fig.-- the meen values of hammer tests from the different investigated features on the Grundskatan site are clearly differenciated from the expected Rm-values for the specific levels (t-test p= 0.003-0.02 ). For the Hornslandsudde site, fig.-- this fact is not so clear (t-test p= 0.000-0.67), where the lowest significance is found on feature 7, on the 13 m level, and the highest is on feature 3 on the 19 m level.
30 40 50 60 700
10
20
möhhöh
m.a.s.l.
R
Fig. --. Rm values of investigated features on Grundskatan, compared to the weathering regression line for the raised boulder beach.
20 30 40 50 600
10
20
30
40möhhöh.feat
R
m.a.s.l.
Fig. --. Rm values of investigated features on Hornslandsudde compared to the weathering regression line for the raised boulder beach.

50
The same is the case with the thallus sizes of lichens growing on the investigated features at Grundskatan, fig.--. The largest thallus diameter (180 mm) was measured on a hut foundation which was not investigated with the Schmidt hammer.
0 100 200 3000
10
20
masl.G.skatanmasl.G.skat
lichens on features
m.a
.s.l.
thallus diam.mm.
Fig.--. Lichen growth linear regression line for Grundskatan and max. thallus diameters on 14 measured archaeological features The fact that hammer tests gave so much younger datings than those obtained by carbon 14 on the Grundskatan site, can be explained by a closer examination of the distributions of the Rm values for the different features. On all of the features, except for feature A, there is a marked secondary peak at Rm=50-55. This could be explained by, that these values show boulders which have rolled down, or have been removed, from their original position because of snow preasure and other external forces, after that the features were abandonned. This may also explain the differences in datings between lichenometry and carbon 14. In this case lichenometric datings only tell us how long time the feature has survived in the present state. Original lichens, contemporary with the specific feature, may have died when the host-boulder was removed. With this taken into account, the lichenometric datings in most cases coincide with the Schmidt hammer datings. Further more a comparison between the largest lichens on 15 features on Grundskatan, and the Rm value on the host-boulder show that most of the large lichens grow on boulder-surfaces with a high Rm value, which show that the surface is the former underside of the specific boulder, fig.--.

51
60 60 70 70 70 70 80 80 85 90 10010010015018030
40
50
60
Rmlich.mmRm
Fig.-- The Rm values of the boulders in foundations at Grundskatan shows that most of the largest lichens grow on boulders which have been turned upside down (Rm>50). This discussion on comparison of Rm and lichenometric datings can also be tranfered to the Hornslandsudde site, fig. -- where, as writen above, no 14 C datings are done.
0 100 200 300 4000
10
20
30
Hornsl.m.Horns.m.H.m
Hornsl.mm
m.a.s.l.
mm
Fig.--. Lichen growth linear regression line for Hornslandsudde and max. thallus diameters on discussed features (black square), and 20 other archaeological features (x).

52
However, this does not explain the very high ages of the features obtained by the test hammer method. Three of these datings are much too old, compared to the 14C dated features on Grundskatan, which are of the very same type, and thus ought to be contemporaneous. The only fact which speaks in favour of the obtained datings are the altitude of the features. The obtained high age of the foundations at Hornslandsudde can only be explained by, that most of the tested boulders on these features presumably are situated in the same position as they were situated on the boulder beach.

53
WEATHERING STUDIES ON PSEUDOKARST-CAVES ALONG THE NORTHERN SWEDISH COAST. 1. INTRODUCTION. 1. Around the Swedish rocky shores, up to the highest post-glacial shore-level, there are a number of secondary round-abraded isostatically raised crevice caves which have been studied by the author (Sjöberg, 1981; 1986; 1987). Even those caves which are now situated high above the present sea-level have as perfectly polished surfaces as those caves situated at, or around, the present sea-level. Is this seemingly non-existent weathering a fact or just ilusionary? 2. It has been suggested that several of the boulder-caves in Sweden, Bodagrottorna, Gillberga gryt, and Rövarklippan at Nordingrå, etc., were formed by earthquakes during the melting of the Weichselian glaciation about 10.000 years B.P., when the caves were situated more than 100 m below the surface of the Baltic sea (Sjöberg, 1987a). Could this neotectonical formation be confirmed by using the Schmidt hammer technique? What about caves of similar type situated above the highest post-glacial shore-lines? 3. In the mountaineous Skuleskogen National Park in NE Sweden, there are several caves formed in younger reddish granite (Nordingrå-granite). One of them, Slåttdalsgrottan, is formed among gigantic boulders among the breakdown of a collapsed mountains slope, close to the local highest postglacial shore-line. Nearby, is a shore-cave the entrance parts of which has collapsed to a big break-down. Is it possible with the method to find out if these break-downs happened simultanisly by some neotectonic event, and is it possible to date this event ? 1.2. Method. The general research-method is built on statistical calculations of field data received by Schmidt hammer tests. On each site, tested by the Schmidt hammer, 7 - 35 inpacts are done. The statistical mean and the standard deviation are calculated. These values are compared to a weathering regression-line from a nearby rocky shore, with the same type of bedrock. The regression lines are constructed as described in previous chapters. On a isostatically raised coast each level above the present sea-level represents a specific time B.P. (Mörner, 1979; e.a.). For each study the specific method used is described.

54
2. RESULTS. 2.1. Tunnelcaves at Lidberget, Nordmaling, N. Sweden. Three small raised tunnelcaves, Stora Lidbergsgrottan, cave nr. 9, and cave nr. 10, at the Nature Reserve "Lidbergsgrottorna" in Nordmaling, NE. Sweden, were investigated by testing the walls of the horizontal caves from the entrance to the inner parts (Sjöberg, 1987). The caves are situated at an elevation of around 100 m a.s.l. This investigation showed that the R-values increased toward the inner parts of the caves, fig. 1. This might be due to the fact, that even in caves as small as these, a local climate is formed which protects the caves against chemical weathering.
0,0 2,5 5,0 7,5 10,0 12,5 15,0 17,5 20,030
40
50
60
70
S.Lidbgsg.gr.9gr.10m
R
Fig. 1. Diagram showing the R-values inside three caves at Lidberget, N Sweden. It can clearly be seen that the R-values increase toward the interior of the caves, which indicates a lower rate of weathering . In the inner parts of the caves the R-values are above 60. What does that mean? To answer this question the weathering of a nearby rocky shore, formed by the same bedrock, was tested from sea-level up to 41 m a.s.l., which, with an isostacy of 0.9 cm per year, covers weathering of the bedrock during the last 4.000 years. This weathering is described by a simple regression-equation, with acorrelation-coefficient of Rxy= 0.92, fig. 2. This graph shows that R-

55
40 50 60 700
20
40
60
80
100
120
mas
l
y = 127,1855 - 1,9967x R = 0,92
Rmax caves Lidberget
R
Fig. 2. The highest (inner) R-value in three caves at Lidberget, compared to a weathering regression line on bedrock at Stavarehalla, 5 km S of the caves. values around 60 correspond to values on bedrock from around 10 m a.s.l. and downword on the weathering-curve. This shows that the caves, even though they are situated at 100 m a.s.l., have been protected against weathering. During the last 7 000 years, which is the time that has elapsed since the caves were elevated above sea-level, the inner parts of the caves have not weathered more than the sea-cliff, of similar bedrock, which have weathered no more than a 1000 years. How generally applicable are these results? To answer this question another 10 caves in different parts of the Bothnian coast were tested. The data for elevation, length and R-values in the outer(Rmin) and inner parts of the caves (Rmax) are given in table 1. Table 1. Tunnelcaves in the county of Ångermanland. Cave m.a.s.l. length Rmin Rmax S Lidbergsgrottan 85 23 42.9 58.4 Lidberget c.9 107 8 38.0 63.4 Lidberget c.10 107 10 43.0 63.8 Tjuvantes grotta 90 25 34.6 62.1 Räckebergskyrkan 180 34 41.7 46.3 L. Räckebergskyrkan 180 22 43.8 64.8 Södra grottan, Ulvön 5 8 55.3 63.7 Norra grottan, Ulvön 2 14 59.0 65.0 Härnöklubb 10 11 20 50.6 58.2 Härnöklubb 11 10 15 48.9 62.7 Härnöklubb 11a 10 5 48.9 60.0 Härnöklubb 14 0 10 59.1 60.4 Härnöklubb 15 1 14 50.9 52.3 1 the roof within the inner parts of the cave is open. On fig. 3 the big difference between Rmax and Rmin is seen. This difference is also independant of elevation. As most of the caves are formed in gneissic granites/sediment

56
gneisses the values from table 1 has also been compared with a weathering regression line. This is the one from Stavarhalla, described above.
30 40 50 60 700
25
50
75
100
125
150
175
200
masl.masl.masl
mas
l.
R
R maxR minRegr.line
Fig. 3. Diagram showing the lowest (external) and highest (internal) R-values from 12 elevated sea-caves in the province of Ångermanland, compared to the weathering-regression line from Stavarhalla in the northern part of the province. The diagram, fig. 3, indicates in accordence with the variables, m.a.s.l., Rmax and Rmin, that local climatological conditions in the inner parts of the caves protected these parts against weathering and that this protection is independent of the elevation above sea-level. Rmax values from the higher elevated caves do not differ much from those in the lower elevated caves. It can also be seen that the Rmin values in the lower elevated caves have values similar to Rmax values in the higher elevated caves. To further test the connection a three-dimensional graph was constructed from the values of table 1, were X= depth of the cave, Y= elevation, and Z= R-value, fig. 4.

57
-100
1020
30 3040
5060
70-100
0
100
200
m in cave R value
m.a.s.l.
Fig. 4. Three-dimensional graph showing the altitude, the lenghts and the R-values from the external and internal parts of the caves in table 1. From the graph it can be seen that elevation is an independent factor in reference to the R-values inside the caves. The dependent factor seems to be the depth of the cave. As the researched caves are formed in different bedrocks, such as sediment-gneiss and dolerite, the connection also seems to be independent to the type of bedrock. To further develop this problem more thorough speleo-climatological investigations has to be done. However, a previous study (Sjöberg, 1975) has shown, that immediately inside the entrances of small caves with one entrance, there exists a different climatological situation, than which exists outside the caves. This type of cave is in climatological sence called a static cave (Mattson, 1979:98) 2.2. The cave Bodagrottorna, Iggesund, N. Sweden. The cave Bodagrottorna is a neotectonically formed cave-system in a small hill of gneiss-granite, reaching up to 35 m. a.s.l. The cave-system, which is the longest pseudokarst cave in Sweden, with a length of more than 2600 m, is situated at the coast near the village of Iggesund in N. Sweden. In this case neotectonics means fairly huge earth-quakes, caused by a very fast isostatic uplift, which appeared below the margins of the ice at the end of the Weichselian glaciation. During that stage, the roches moutonnées, in which the cave was formed, were still situated far below the surface of the sea. The formation of the cave is described by Sjöberg (1987a). If the hypothesis of a submarine formation is correct, all sides of the huge, cave forming boulders released by the earth-quake ought to show similar weathering values, corresponding to the weathering which has taken place since the hill was elevated above sea-level. To investigate this five boulders on the 30 m level were tested on the striated upper side and on the lateral sides. Only boulders with a clear striated upper side were chosen. As the lateral sides of the boulders were exposed to different quarters, a certain difference in the R-values was expected, depending on local-climatological situations. The results of this study is shown in table 2. Table 2. Bodagrottorna. R-values on upper-, and lateral sides of five tested boulders.

58
Boulder upper side N side S side 1 43.1 48.8 - 2 42.6 50.2 - 3 45.6 47.1 51.0 4 44.8 42.1 47.3 5 41.4 44.0 42.1 Rect. mean 46.2 46.3 46.5 The results show that the expected variance between the R-values of the lateral-sides of the boulders did not occure. Instead a clear similarity between the upper- and lateral sides is shown, after that the values are rectified to the angle of impact. The values in table 2 have been plotted in fig. 5, where a romboid symbol shows the values of the upper sides of the boulders, and a black square symbol shows the values of the lateral sides. To test the hypothesis that the weathering on the upper and lateral sides of the boulders should corresponded to the expected R-value of the 30 m level, a couple of weathering regression lines from adjacent localities were used. These were taken from a bedrock cliff and a raised boulder beach, both at Hornslandet, 15 kms E of the cave. Hypothetically, the values from Bodagrottorna should correspond to a value for the 30 m level at the bedrock locality, or with the 30 m value at the boulderfield. The results of this investigation are shown in fig. 5. Here it is shown that the values from the Bodagrottorna do not correspond to the 30 m level on the weathering regression lines, but rather to a level of 7 - 12 m.a.s.l. The reason for this might be that the bedrock at Bodagrottorna differ more from the one at Hornslandet, than a visual examination of the bedrock indicates. Another explanation could be that the localities at Hornslandet are situated in a more exposed position, whilst the cave Bodagrottorna has for a long time been situated in the inner part of a protected bay. The difference in exposion can be the cause of the different weathering conditions. Another minor study was done on a well rounded erratic, situated on the crevice-rich upper part of the hill. The situation of the boulder speaks against its deposition by a melting glacier, but for its dropping from the bottom of an iceberg, after that the hill had been split by an earthquake. The following R-values were noted from the erratic: upper-side R= 32.3, northern side R= 34.0, and southern side R= 37.4. These values show that the boulder, in spite of its roundness, and like the cave-boulders, has higher values on its upper side, compared to the value on its lateral sides. The values are more in accordance with the values from the similar level at Hornslandet, fig. 5. However, it is possible that the proportionately low R-values on the erratic show that the R-values on the boulder do not only depend on postglacial terrestric weathering. The well rounded form of the erratic indicates that the boulder might have been a core-stone, removed in its existing scape by the glacier.

59
20 30 40 50 600
10
20
30
40y = 52,4142 - 0,9407x R = 0,97
y = 49,1283 - 0,8521x R = 0,97
erratic boulders
solid rock
cobble field R
m.a
.s.l.
Fig 5. Graph showing the R-values from upper-, and lateral sides of surface boulders at the Bodagrottorna, and R-values from an adjacent erratic. These values are compared to the w eathering regression lines from a bedrock and a cobble-field at Hornslandet. 2.3. The cave Rövarklippan, Nordingrå, N. Sweden. This cave is situated on the southern side of a steep hill in anothosite, formed as a roches moutonnées. The hill is 68 m high, and the base-level for the cave is 47 m.a.s.l. The cave, which consists of several big rooms and passages between gigantic boulders, was formed when the southern escarpment of the hill collapsed, probably due to a severe earthquake. Did this earthquake occur at the same period of time as the one described above, when the hill was situated deep below the present level of the sea? If this was the case, hypothetically the R-values from the outer part of the cleft, which divides the cave forming boulders from the mother-cliff, ought to be equivalent to the ones on bedrock outside the cave (with minor differences dependent on local- and microclima-tological conditions).

60
20 30 40 50 600
20
40
60
80
m.a.s.l.gr.m.gr.m.
y = 118,0937 - 2,2642x R = 0,91
Rövarklippanm
.a.s
.l.
R.
regr.linerecent exfoll.older exfoll.
Fig. 6. R-values from the inner crevice at the cave Rövarklippan, compared to a weathering regression line for the area. Two R-values for a recent exfolliation are marked with a black square-symbol. Harness-surfaces on recently, by frost-wedging, exfolliated boulders would also be able to differentiate from those contemporaneous with the cave, by higher R-values than normal for the level. Firstly, a weathering regression line was constructed from sea-level up to the top of the hill, fig. 6. This line has a high correlation coefficient, Rxy= 0.91. Secondly, the R-values from the big cleft which divides the boulders from the mother-cliff was tested. In the outer, western part of this cleft, the surface of a seemingly recent rockfall gave very high values (R= 52.1). Correspondent harness-surface on the mother-rock had the value R=53.5. These values corresponds to R-values for levels below 2 m.a.s.l., showing that these boulders were released about 200 years ago, calculated on an isostatic uplift of 0.85 cm per year. In the outer part of the big cleft a value of R=47.1 was measured on the bedrock, and R=50.4 on the boulder. Further into the crevice the R-values went down to R=38.9 on boulder and R= 44.9 on bedrock. Considering local climatological conditions these values are somewhat higher than expected for the level, fig. 6. R-values around 40 correspond to a level around 30 m.a.s.l. This could indicate that the earthquake, which formed the cave, appeared some 3-4000 years ago according to the shore displacement curve for the area (Miller, 1982). This shows that the cave could not have been formed during the period when neotectonic activity normally was to be expected, namely 10.000 years ago, when these parts of Sweden presumely had an isostatic uplift reaching rates of 20-50 cm per year (Sjöberg, 1987a). Instead, the cave seems to have been formed by an eartquake when the hill already had been raised to a terrester environment. This earthquake ought to have had a magnitude of around 7 on the Richter scale, which is considerably higher than those of contemporaneous earthquakes in the area.

61
2.4. The cave Vitterhuset, Åsele, N. Sweden. This cave is formed by gigantic rocks on the southern side of a roches moutonnée like hill in Revsund-granite, around 305 m above sea-level, in the inner parts of northern Sweden. The elevation is clearly above the local highest post-glacial shore-line. With an ice-movement from NW, during the Weichselian glaciation, the cave is situated on the lea-side of the hill. The cave forming rocks have one, or several, smooth harness-surfaces, showing that the rocks have been broken from the mother-rock, and that this breaking-up has occured along former joints in the bedrock. The question is wither the breaking-up of the rocks was formed by glacigen forces or by neotectonics. On the horisontal crest of the hill a R-value as low as 28.3 was measured. The very fast weathering of the Revsund-granite was also shown by recent grus-weathering close to the tested surface. In the cave two opposite vertical surfaces were tested. One on a bedrock surface exposed to the south (R=44.2), the other on a smooth, vertical rock-surface exposed to the north (R=52.7). The situation of the cave, on the lea-side of a glacigene roches moutonnée, would indicate a glacigen formation of the cave. The high R-values in the cave, especially the one on the exposed northern wall, compared to the low R-value on the crest, indicate that the cave was formed after the deglaciation of the area. Thus, the cave was most likely formed by neotectonics. 2.5. Caves in Skuleskogen National Park. Skuleskogen National Park is situated on the NE coast of Sweden. The region consists of a mountaineous area formed in younger red granites (Nordingrå-granite) in the form of a cluster of glacially eroded minor batholithes. The higher hills in the area reach the highest postglacial coast-line in the area, which is found on 285 m.a.s.l. The area is in the middle of what Mörner (1979) identifies as the central zone of isostatic uplift in Sweden. Two caves have been investigated in this are. One, Slåttdalsgrottan, is situated in a scree, formed of huge angular boulders, downslope the vertical northern face of mount Slåttdalsberget, around 250 m.a.s.l., fig. -- The cave is a typical example of what Sjöberg (1987) has identified as a neotectonic cave of type 2: "caves in collapsed mountain slopes". The second, Tärnettsgrottan, at 140 m.a.s.l., is a typical wide shore-abrasion cave, with polished floor, walls and roof. The cave was formed by abrasional excavation of the rock mass between horizontal joints and marine erosion. The wide entrance is partly covered by big angular boulders from the collapsed outer part of the cave and the overlaying bedrock, fig.--. The investigated problem is, if it is possible to date the two collapses at Slåttdalsgrottan and Tärnettsgrottan and if recieved data can tell wether these two collapses have occured at the same time, or not. Method. At Slåttdalsgrottan the following objects were measured with the Schmidt hammer: 1. horizontal glacially polished bedrock surface in level with, and outside of the scree area.

62
2. Horizontal sheet structure on the vertical wall of the hill. 3. Vertical fault scar of the hill, above the scree area. 5. a. former upper faces of three boulders in the scree with glacial strias. b. former vertical faces of the same boulders. Larger rounded lichens of Rhizocarpon geograficum were measured for a minimi age dating of the collapse. At Tärnettsgrottan the following points were measured: 1. Abrasionally polished treshold inside of the cave entrance 2. The vertical wall of the cave above 1. 3. Abrasionally polished floor in the inner part of the cave. 4. Abrasionally polished roof in the inner part of the cave. 5. Abrasionally polished wall in the inner part of the cave 6. Two sides of three angular boulders in the scree inside the cave 7. Two sides of three angular boulders in the scree outside the cave. 8. Glacially polished and marine abraded horizontal rock surface outside the cave. The recieved values were compared to each other to investigate similarities or differences. Similarities could indicate that e.g. surfaces on a boulder gentically could belong to the open vertical fault on the face of the hill. Indicating that the break-down of the hill appeared simultanisly. Differences would indicate that the break-down had happened during repeated occasions. In that case the process hardly could be neotectonics, but frost wedging..

63
Fig.--. The collapsed mountain slope above the cave Slåttdalsgrottan. The collapse follows vertical and subvertical joints in the rock-mass. Scale is given by the person at the left (photo. R. Sjöberg, 1989).
Fig.--. The cave Tärnettsgrottan from inside. Note the angular boulders to the right. (photo. R. Sjöberg, 1981).

64
Results: a. Slåttdalsgrottan. The results are summarized in table --. site Rm lichen mm 1. solid rock glac. polished surface 53.5 2. sheet structure 60.3 3. fracture surface 63.5 380 4. Boulder 1. glac. striated surface 52.1 fracture surface 70.0 5. boulder 2. glac. striated surface 48.0 fracture surface 61.7 370 6. boulder 3. glac. striated surface 51.7 fracture surface 63.6 7. boulders inside cave 65.1 68.5 The value on glacially striated solid rock (1) coinsize with the values on the striated surfaces of the boulders (4,5 and 6). The same is the case with the fracture surfaces on solid rock (3) and the fracture surfaces of the boulders (5 and 6). Boulder nr. 1, which is situated high up in the scree has a comparatively high value. b. Tärnettsgrottan. The rectified results of the hammer tests are summarized in table.--. sites in the cave rekt. Rm. n. 1. abraded treshold 69.0 21 2. vertical wall, above 1. 61.7 15 3. abraded floor in inner part 70.0 16 4. roof, above 3. 62.0 15 5. vertical wall, at 3. 60.8 14 7. boulder 1, 67.0 11 do. side. 67.4 11 8. boulder 2, 61.3 10 do. side. 55.5 10 9. boulder 3. 61.3 12 do. side 55.7 12 sites outside the cave 10. boulder 4. 63.3 12 do. side 62.4 12 11. boulder 5. 54.8 13 do. side 56.5 13 12. boulder 6 57.0 13 do. side 57.2 13 13. abraded solid rock 49.4 27 Discussion. a. Slåttdalsgrottan. The values from table -- are presented in a histogram, fig.--, to show the relations between the R-values at Slåttdalsgrottan.

65
'
48 50 52 54 56 58 60 62 64 66 680
1
2
3
4
5
n
R
Fig.--. Histogram of measured points at the Slåttdalsgrottan (n=16 [400]}. Values around 52-54 represent weathered rock surfaces in citu and values around 60-62 represent fresher fractured surfaces. The results, as shown on the histogram, show that the striated upper sides of the boulders and the glacially polished rock surface have similar R-values (R= 48.0-53.5.). The R-values on fractured surfaces on both the boulders 2 and 3, and the solid rock are similar (R= 61.7-63.6). This can be interpreeted as that the break-down of these two boulders, and most of the surrounding scree, happened simultanisly. This might indicate neotectonics. The R-value of boulder 1 is extremely high. This might indicate a fairly recent break-down of this boulder, probably by frost-wedging, as the boulder is situated high up in the scree. The R-values from the cave are, as expected, higher than those on the fractured surfaces. The reasons for this is discussed above. When did this collapse of the mountain-side at Slåttdalsberget occour? Lichenometric results, using a linear regression equation for estimating elevation from thallus diameter on Rhizocarpon geographicum, from the boulder-beach at Ytternäsan, less than 15 kms S of Slåttdalsberget (Sjöberg, this volume), reveals that the measured thalluses, found both on the vertical face of the solid rock, and on boulders in the scree, indicate that the collapse occured more than 2400 years ago. b. Tärnettsgrottan. For clearity the values in table -- are sorted as below. the cave floor roof walls innermost part 70 62 61 entrance part 69 - 62 angular boulders side 1/side 2

66
in the cave 67/67 61/55 61/56 outside the cave 63/62 55/56 57/57 solid rock 49.5 As the Nordingrå-granite is a typical granite with banking, the R-values indicate that the hanging faces, the roof of the cave, has a greater strength than the vertical and laying faces. And that the weathering is diminished emediatly inside the cave, as compared with the solid rock just ouside the cave. This phenomena has been discussed above, and in Sjöberg (1987:66). The angular boulders are breakdown from the cliff-face, emediatly above the cave mouth. Compared to the R-values on the solid rock outside the cave, and the R-values from the inside of the cave, it is quite clear that the breakdown has occured after that the cave was elevated above sea-level, some 7000 years ago, and that the lower R-values on the tested boulders show the original hanging, or vertical faces of the solid rock. The similarity between the R-values on these boulders, compared to those from the Slåttdals cave, also indicate a certain conteporaneousnes between the two collapses. No lichens of greater size were found on the boulders, which could have indicated a minimum age of the collapse. The sizes of the angular boulders, and the similarity of the R-values, at these two investigated sites, show that an earth-quake of important magnitude might have occured in the region in postglacial time. 3. Conclusion. The Schmidt test-hammer, originally constructed to measure the quality of concrete, has been used and proved to be useful for applied speleological reseach. The method is shown to be very useful as a relative dating technique, when comparable before and/or after data, as eg. lichenometric data, are available. The Bothnian Sea region, with its thoroughly studied postglacial isostatic uplift, has given almost laboratory-like circumstanses for this study, and has also shown that neotectonics in form of great magnitude earth quakes appeared in this region in postglacial time.
Recommended


