Embed Size (px)
Citation preview
Agro-Environmental Benefits of
Controlled Tile Drainage
Mark Sunohara
David R. Lapen
Agriculture and Agri-Food Canada
Ottawa, Ontario, Canada
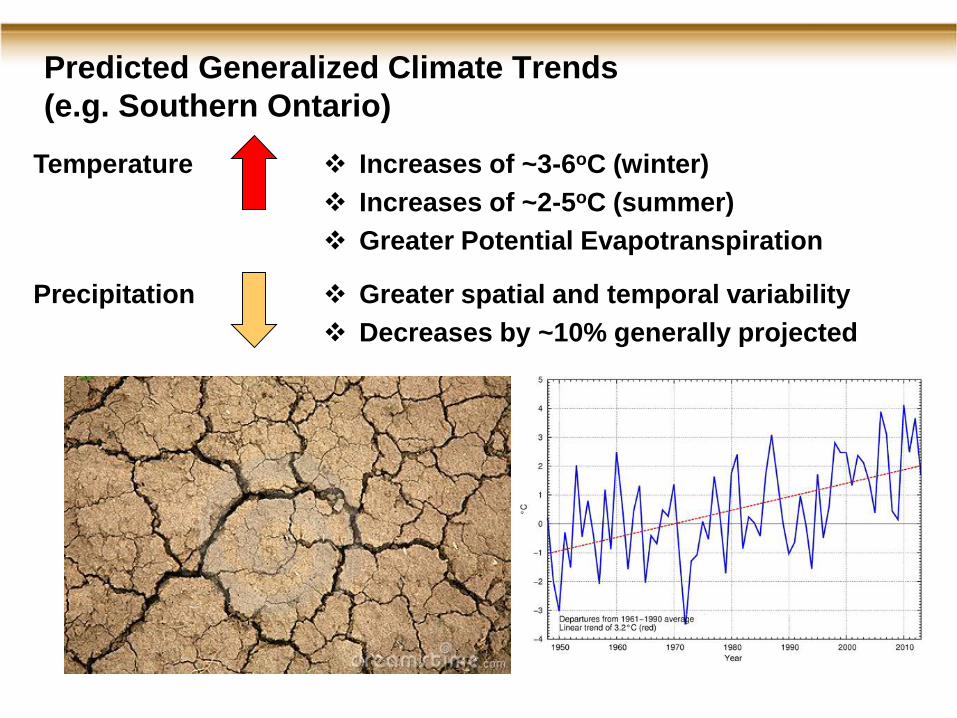
Predicted Generalized Climate Trends
(e.g. Southern Ontario)
Temperature Increases of ~3-6oC (winter)
Increases of ~2-5oC (summer)
Greater Potential Evapotranspiration
Precipitation Greater spatial and temporal variability
Decreases by ~10% generally projected
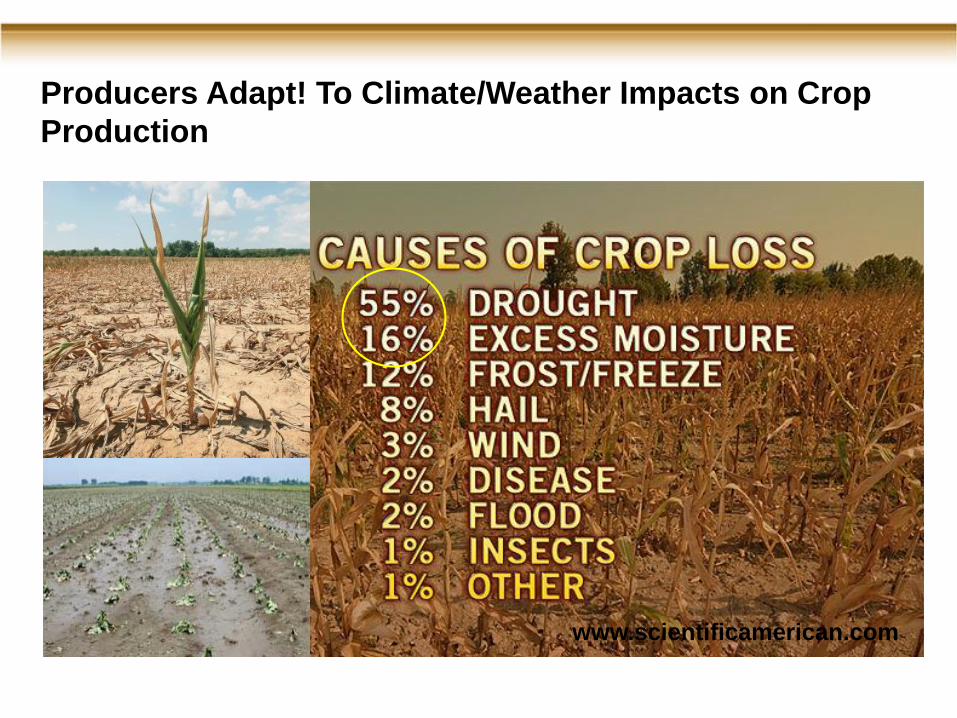
Producers Adapt! To Climate/Weather Impacts on Crop
Production
www.scientificamerican.com
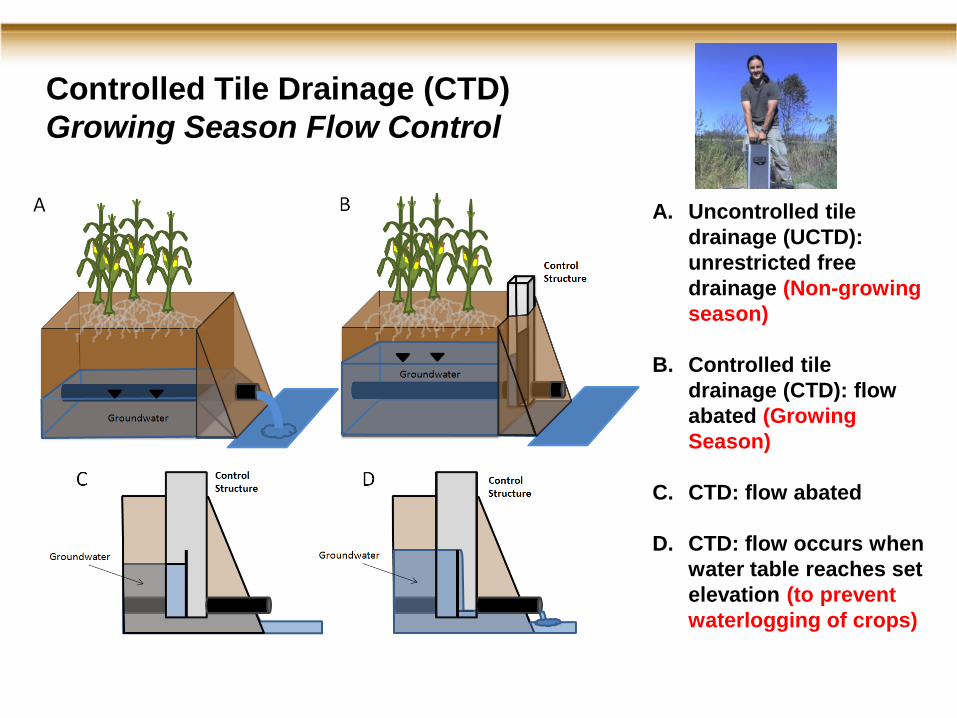
A. Uncontrolled tile
drainage (UCTD):
unrestricted free
drainage (Non-growing
season)
B. Controlled tile
drainage (CTD): flow
abated (Growing
Season)
C. CTD: flow abated
D. CTD: flow occurs when
water table reaches set
elevation (to prevent
waterlogging of crops)
Controlled Tile Drainage (CTD)
Growing Season Flow Control
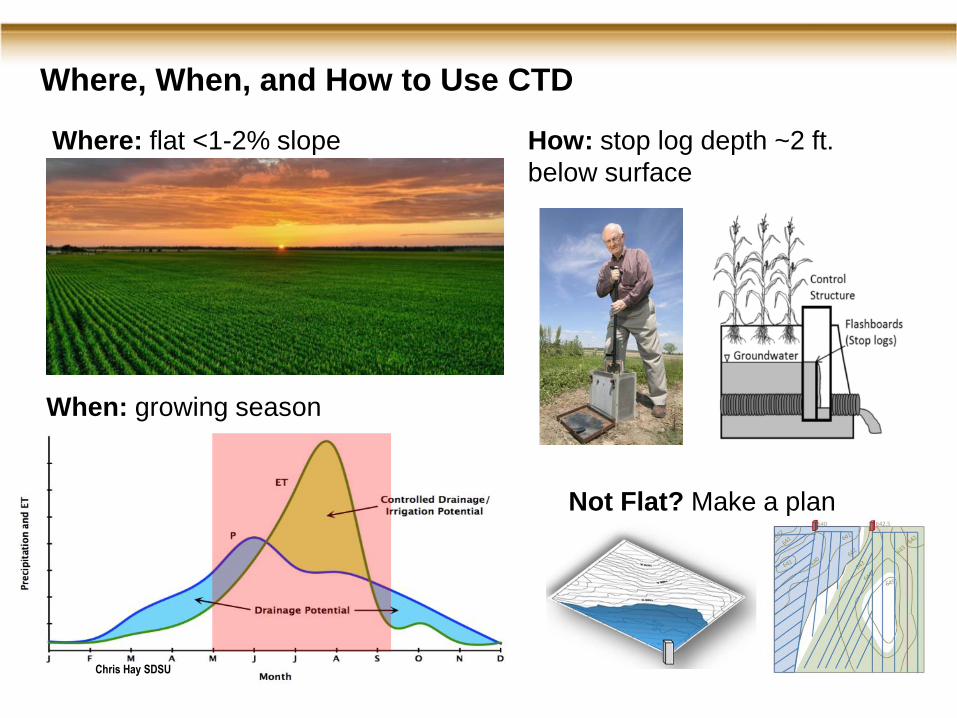
Where, When, and How to Use CTD
Not Flat? Make a plan
When: growing season
How: stop log depth ~2 ft.
below surface
Chris Hay SDSU
Where: flat <1-2% slope
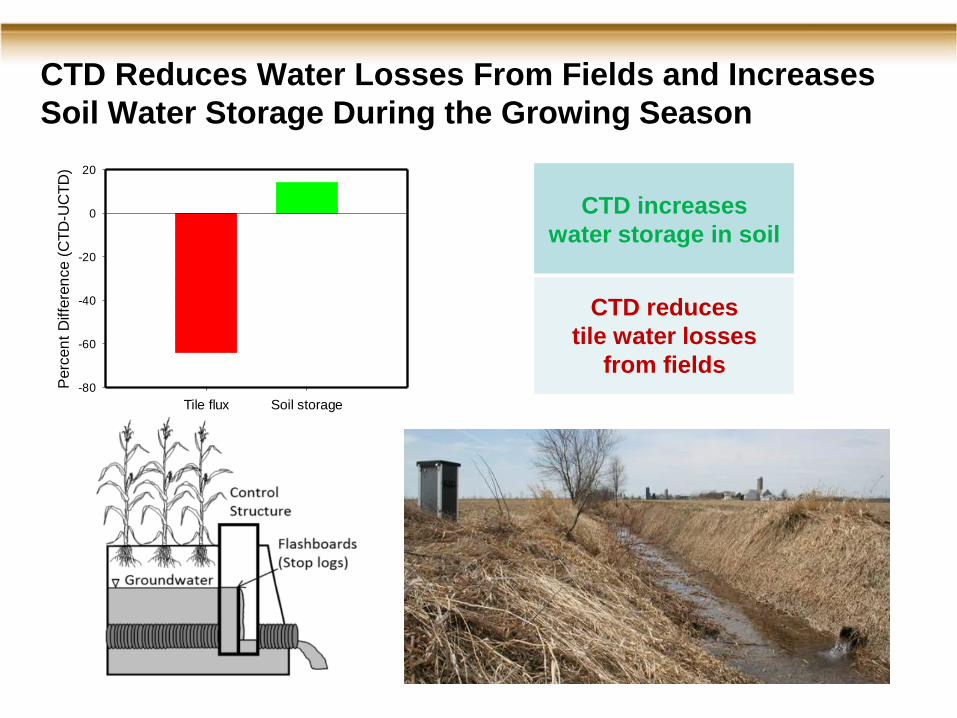
Tile flux Soil storage
Perc
en
t D
iffe
ren
ce (
CT
D-U
CT
D)
-80
-60
-40
-20
0
20
CTD Reduces Water Losses From Fields and Increases
Soil Water Storage During the Growing Season
CTD increases
water storage in soil
CTD reduces
tile water losses
from fields
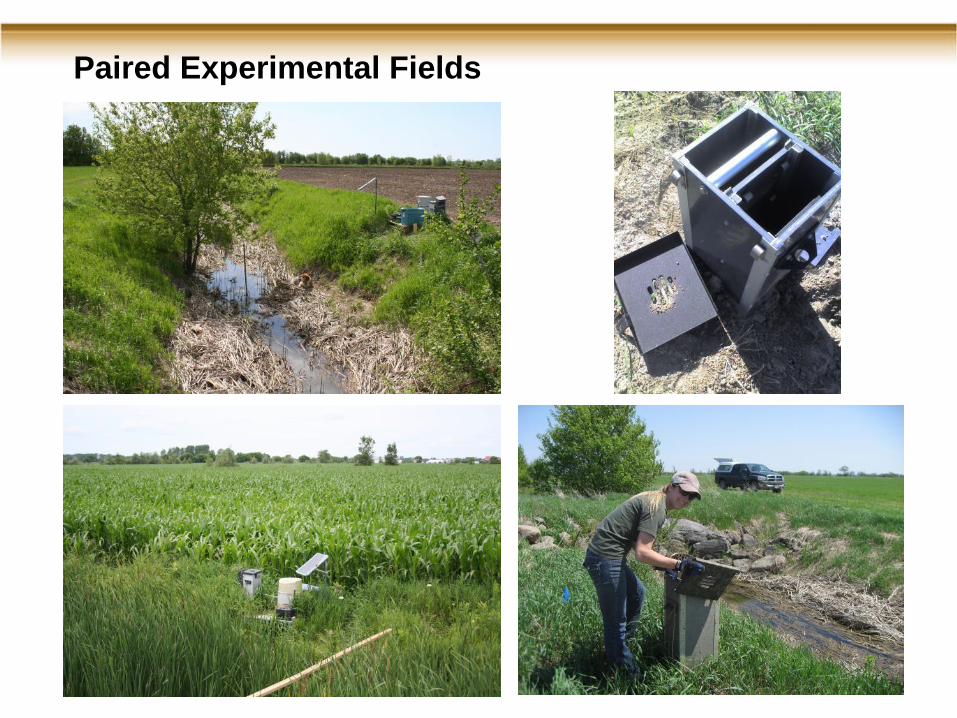
Paired Experimental Fields
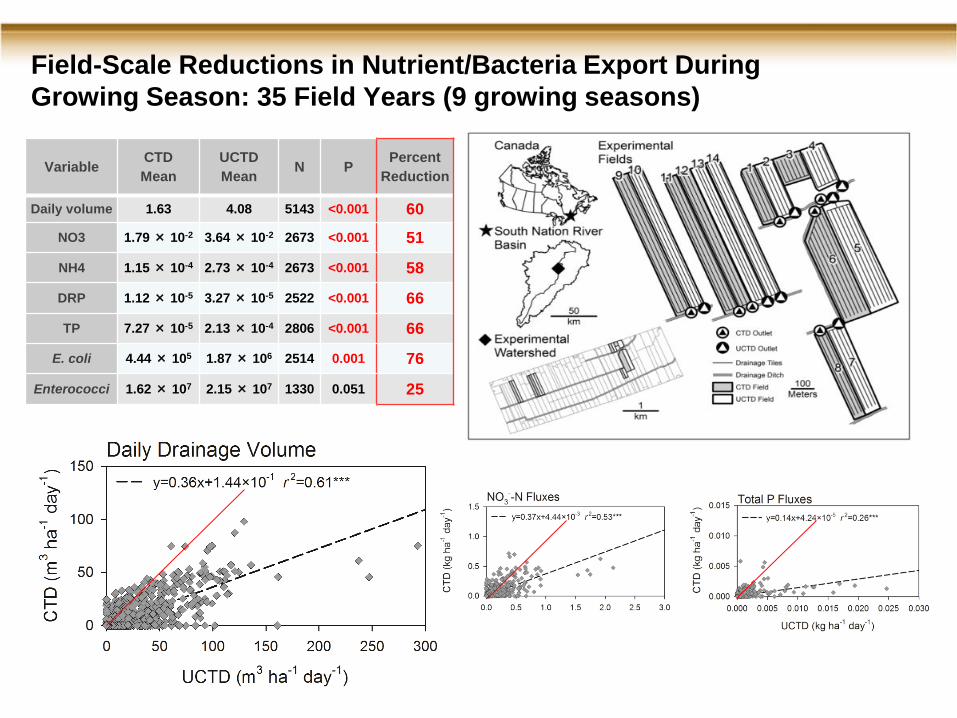
Field-Scale Reductions in Nutrient/Bacteria Export During
Growing Season: 35 Field Years (9 growing seasons)
VariableCTD
Mean
UCTD
MeanN P
Percent
Reduction
Daily volume 1.63 4.08 5143 <0.001 60
NO3 1.79 × 10⁻² 3.64 × 10⁻² 2673 <0.001 51
NH4 1.15 × 10⁻⁴ 2.73 × 10⁻⁴ 2673 <0.001 58
DRP 1.12 × 10⁻⁵ 3.27 × 10⁻⁵ 2522 <0.001 66
TP 7.27 × 10⁻⁵ 2.13 × 10⁻⁴ 2806 <0.001 66
E. coli 4.44 × 10⁵ 1.87 × 10⁶ 2514 0.001 76
Enterococci 1.62 × 10⁷ 2.15 × 10⁷ 1330 0.051 25
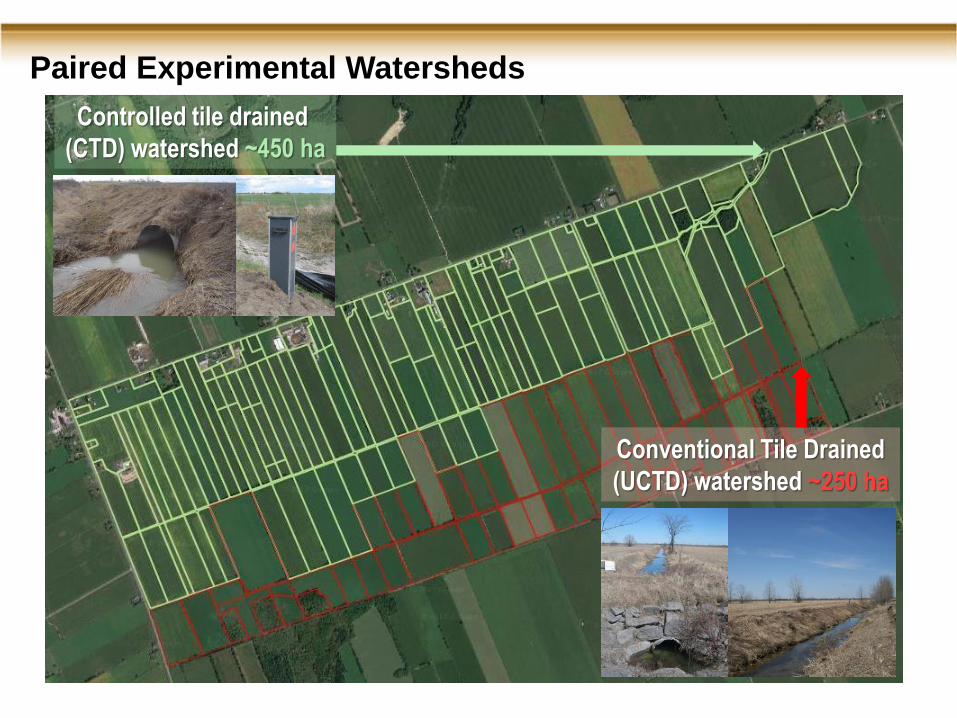
Controlled tile drained
(CTD) watershed ~450 ha
Conventional Tile Drained
(UCTD) watershed ~250 ha
Paired Experimental Watersheds
Stream
UCTD (m3 ha
-1 day
-1)
0 30 60 90 120 150 180
CT
D (
m3 h
a-1
day
-1)
0
30
60
90
120
150
180y=1.06x - 0.59
r2=0.95***
y=0.86x - 0.21
r2=0.89***
Nitrate
UCTD (kg ha-1
day-1
)
0.0 0.4 0.8 1.2C
TD
(kg h
a-1
da
y-1
)
0.0
0.4
0.8
1.2y=0.76x + 4.44×10
-3
r2=0.91***
y=0.63x + 1.45×10⁻³
r2=0.89***
Total P
UCTD (kg ha-1
day-1
)
0.00 0.01 0.02
CT
D (
kg h
a-1
da
y-1
)
0.00
0.01
0.02y=0.99x + 2.22×10
-4
r2=0.6***
y=0.72x + 4.89×10⁻⁵
r2=0.35***
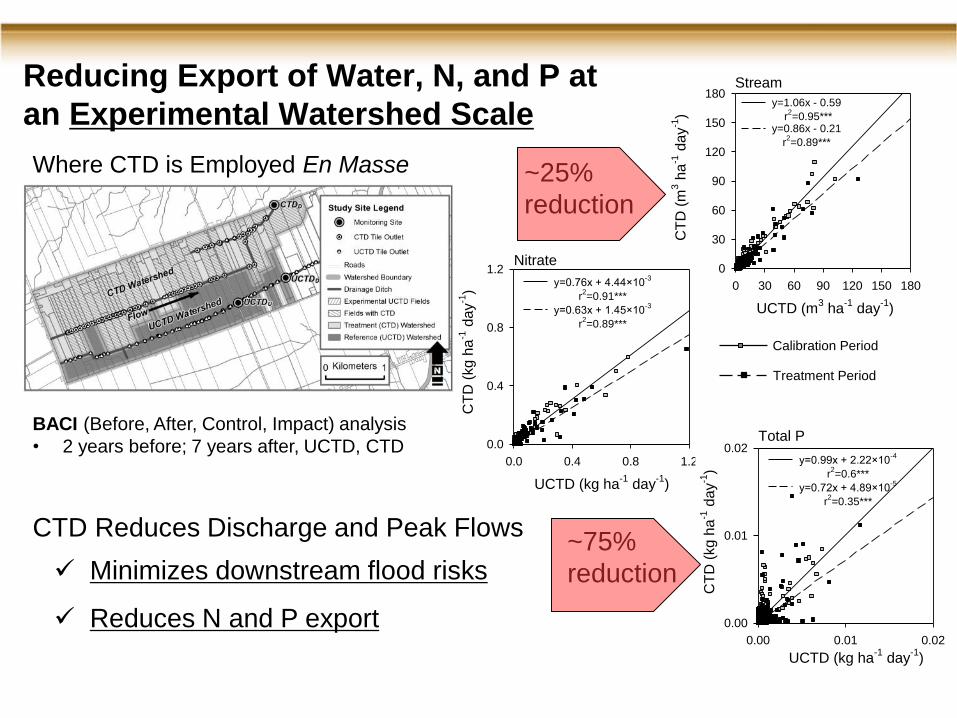
Reducing Export of Water, N, and P at
an Experimental Watershed Scale
Minimizes downstream flood risks
Reduces N and P export
Treatment Period
Calibration Period
Where CTD is Employed En Masse
CTD Reduces Discharge and Peak Flows
BACI (Before, After, Control, Impact) analysis
• 2 years before; 7 years after, UCTD, CTD
~25%
reduction
~75%
reduction
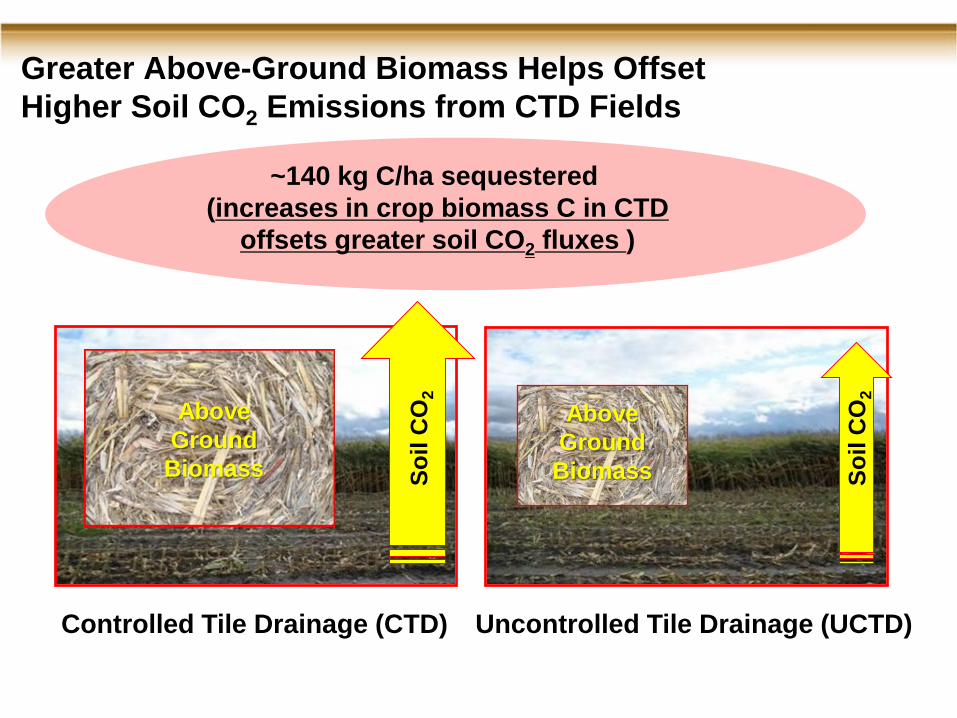
Greater Above-Ground Biomass Helps Offset
Higher Soil CO2 Emissions from CTD Fields
Controlled Tile Drainage (CTD) Uncontrolled Tile Drainage (UCTD)
~140 kg C/ha sequestered
(increases in crop biomass C in CTD
offsets greater soil CO2 fluxes )
So
il C
O2
So
il C
O2
Above
Ground
Biomass
Above
Ground
Biomass
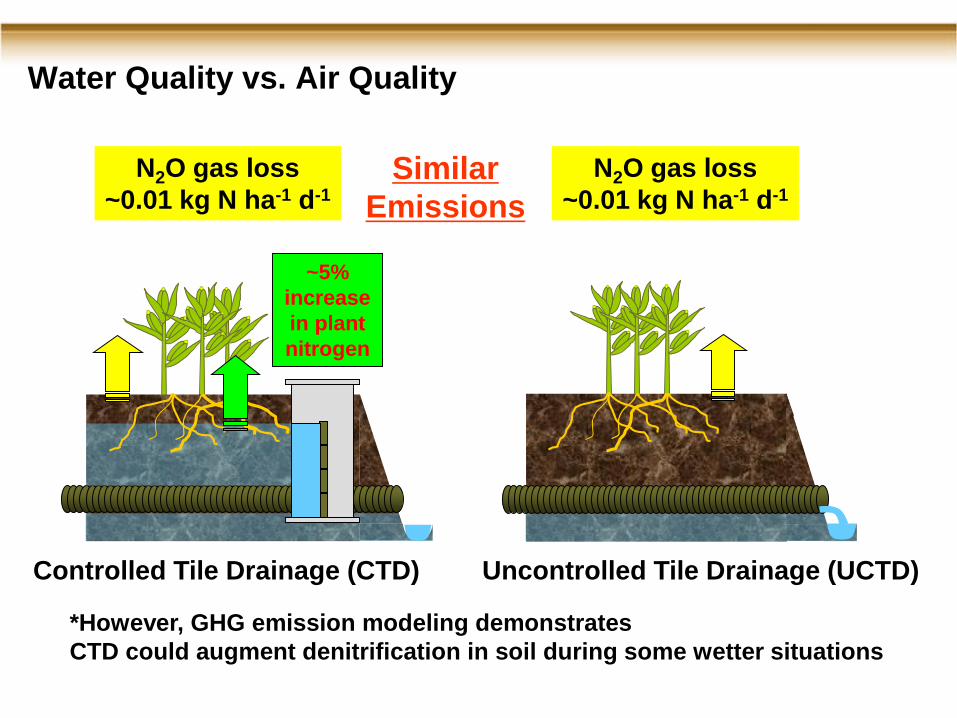
~5%
increase
in plant
nitrogen
Water Quality vs. Air Quality
N2O gas loss
~0.01 kg N ha-1 d-1
N2O gas loss
~0.01 kg N ha-1 d-1
Similar
Emissions
*However, GHG emission modeling demonstrates
CTD could augment denitrification in soil during some wetter situations
Controlled Tile Drainage (CTD) Uncontrolled Tile Drainage (UCTD)
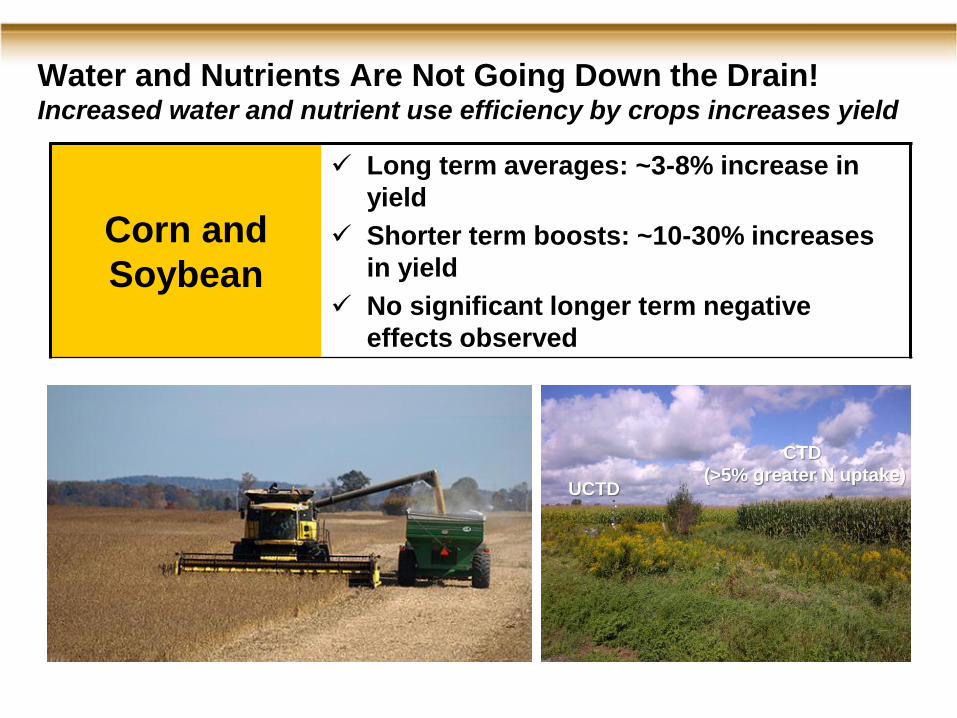
Water and Nutrients Are Not Going Down the Drain!Increased water and nutrient use efficiency by crops increases yield
Corn and
Soybean
Long term averages: ~3-8% increase in
yield
Shorter term boosts: ~10-30% increases
in yield
No significant longer term negative
effects observed
CTD
(>5% greater N uptake)UCTD
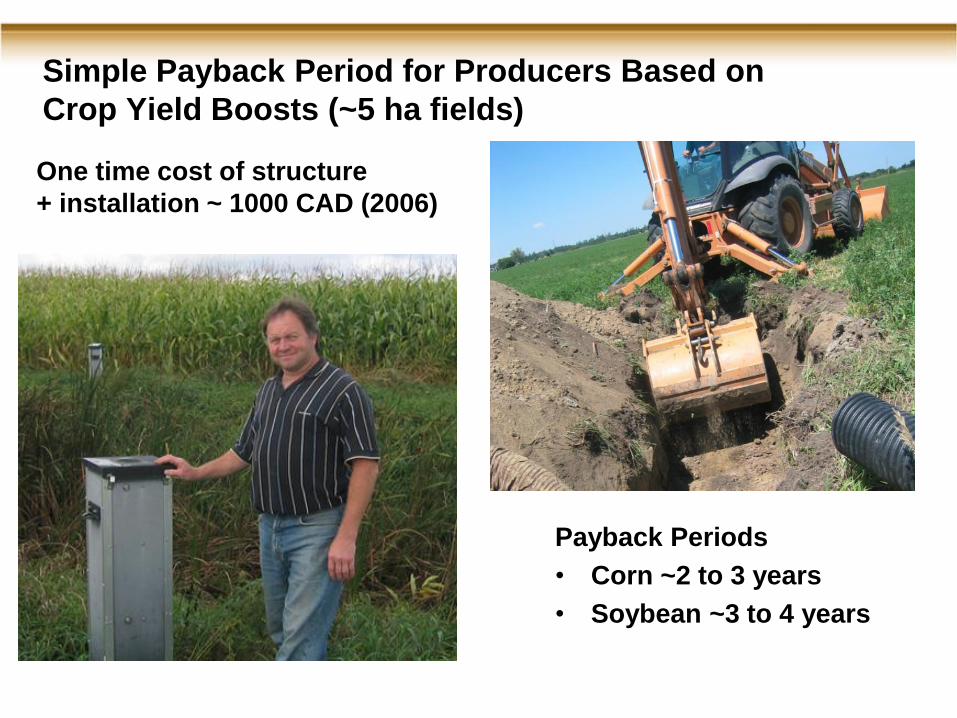
Simple Payback Period for Producers Based on
Crop Yield Boosts (~5 ha fields)
Payback Periods
• Corn ~2 to 3 years
• Soybean ~3 to 4 years
One time cost of structure
+ installation ~ 1000 CAD (2006)
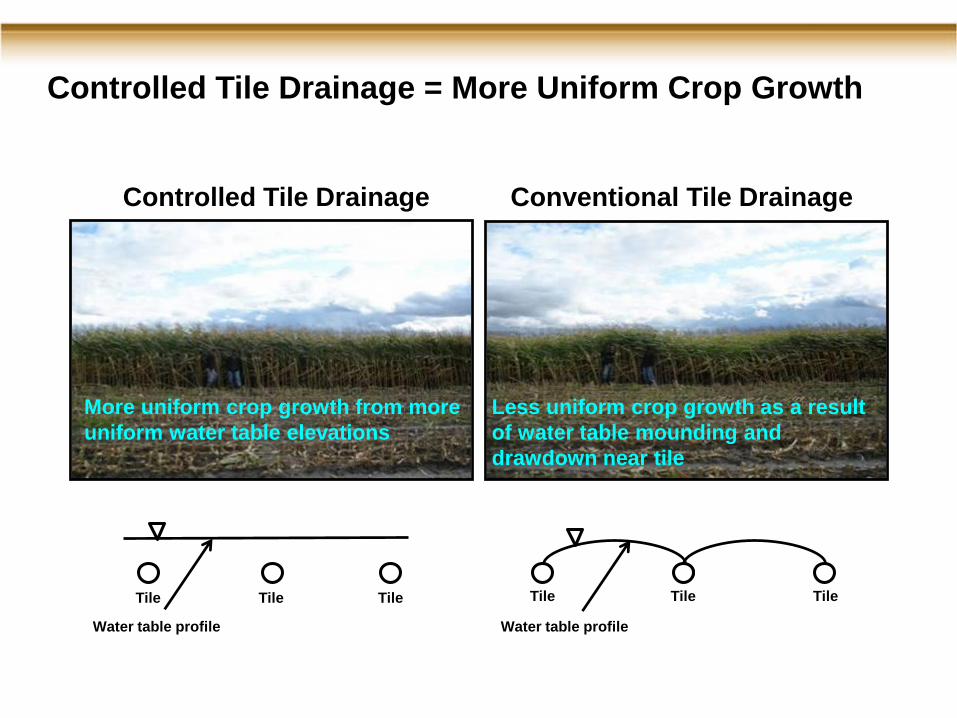
Controlled Tile Drainage Conventional Tile Drainage
More uniform crop growth from more
uniform water table elevations
Less uniform crop growth as a result
of water table mounding and
drawdown near tile
Controlled Tile Drainage = More Uniform Crop Growth
Tile
Water table profile
Tile
Water table profile
Tile TileTileTile
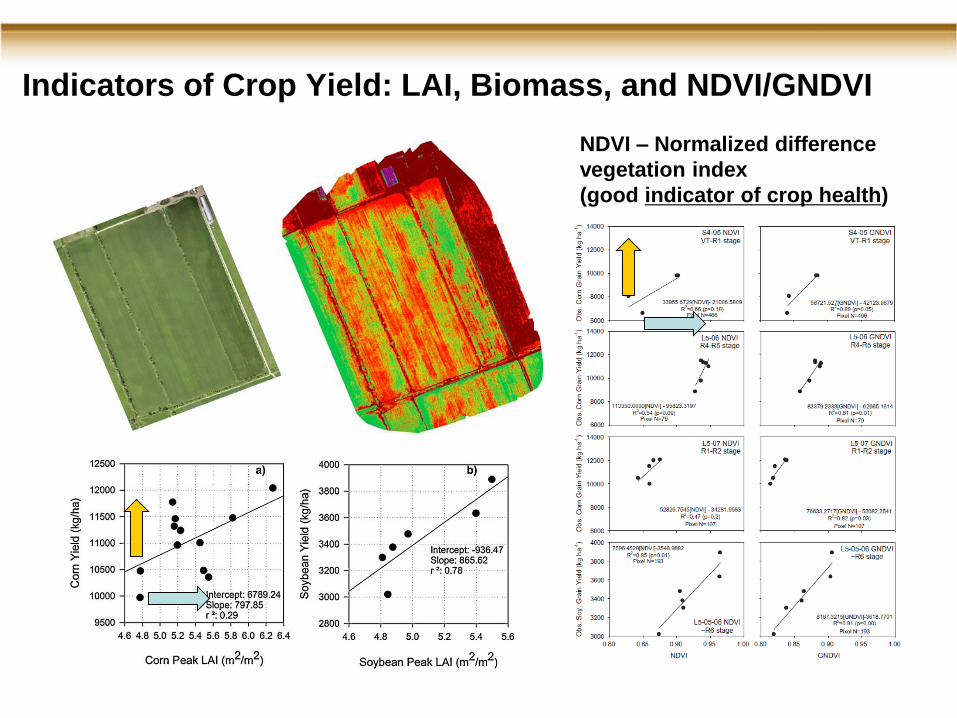
Indicators of Crop Yield: LAI, Biomass, and NDVI/GNDVI
NDVI – Normalized difference
vegetation index
(good indicator of crop health)
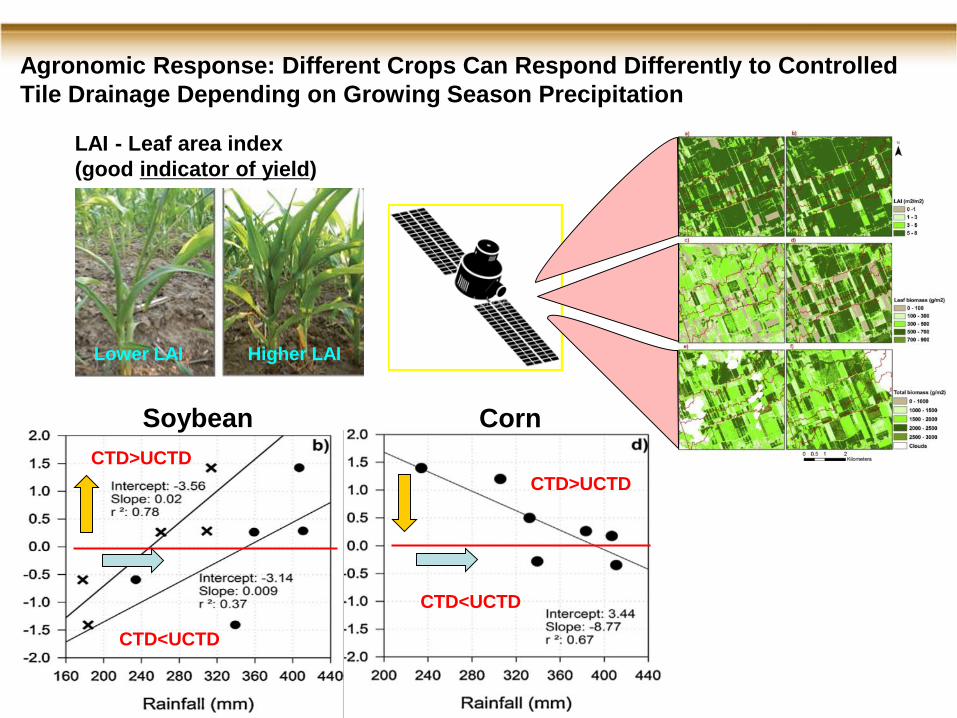
Agronomic Response: Different Crops Can Respond Differently to Controlled
Tile Drainage Depending on Growing Season Precipitation
LAI - Leaf area index
(good indicator of yield)
Lower LAI Higher LAI
CTD>UCTD
CTD<UCTD
CTD>UCTD
CTD<UCTD
Soybean Corn
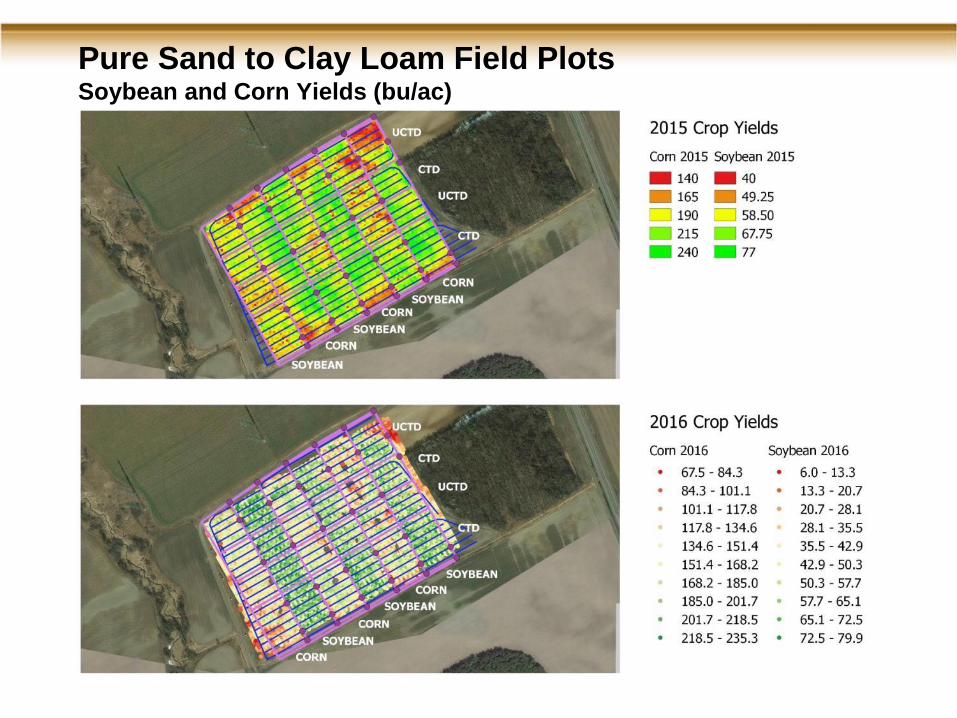
Pure Sand to Clay Loam Field PlotsSoybean and Corn Yields (bu/ac)
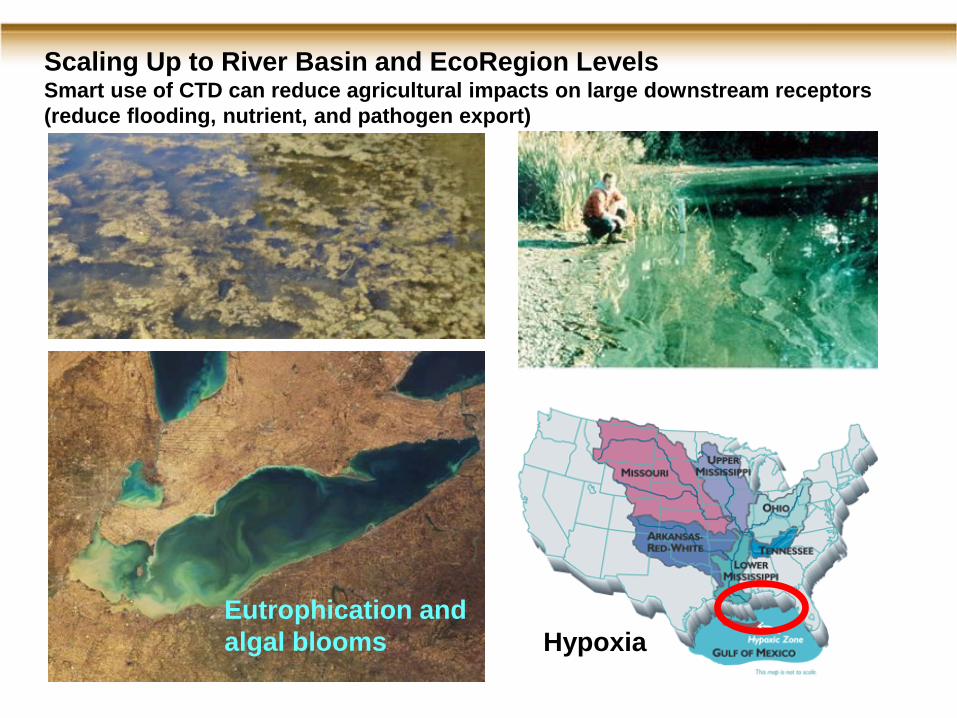
Scaling Up to River Basin and EcoRegion LevelsSmart use of CTD can reduce agricultural impacts on large downstream receptors
(reduce flooding, nutrient, and pathogen export)
Hypoxia
Eutrophication and
algal blooms
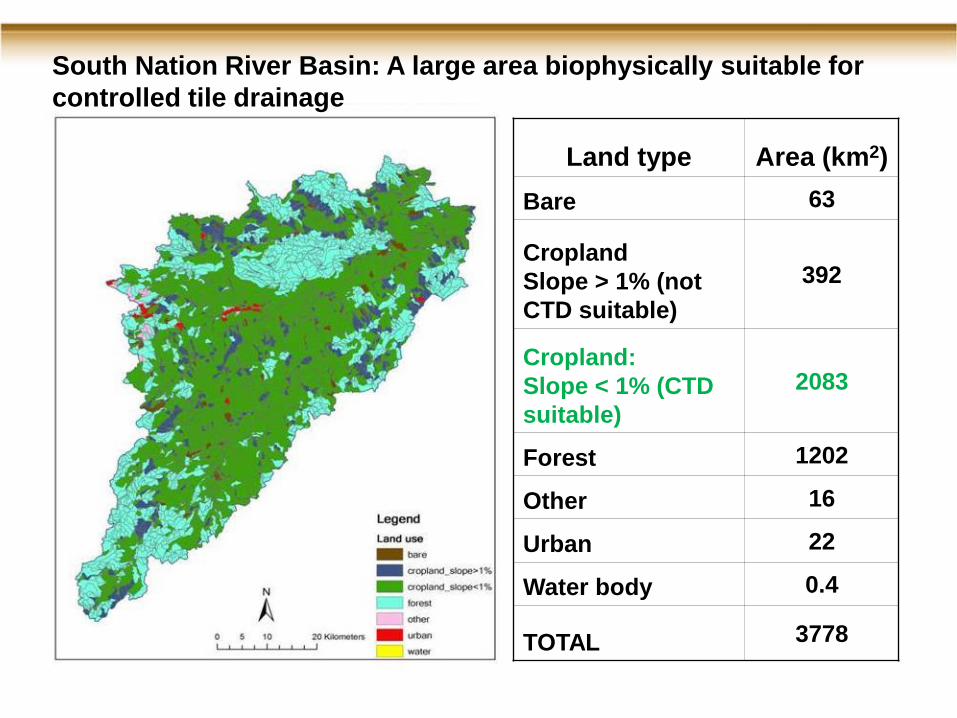
Land type Area (km2)
Bare 63
Cropland
Slope > 1% (not
CTD suitable)
392
Cropland:
Slope < 1% (CTD
suitable)
2083
Forest 1202
Other 16
Urban 22
Water body 0.4
TOTAL 3778
South Nation River Basin: A large area biophysically suitable for
controlled tile drainage
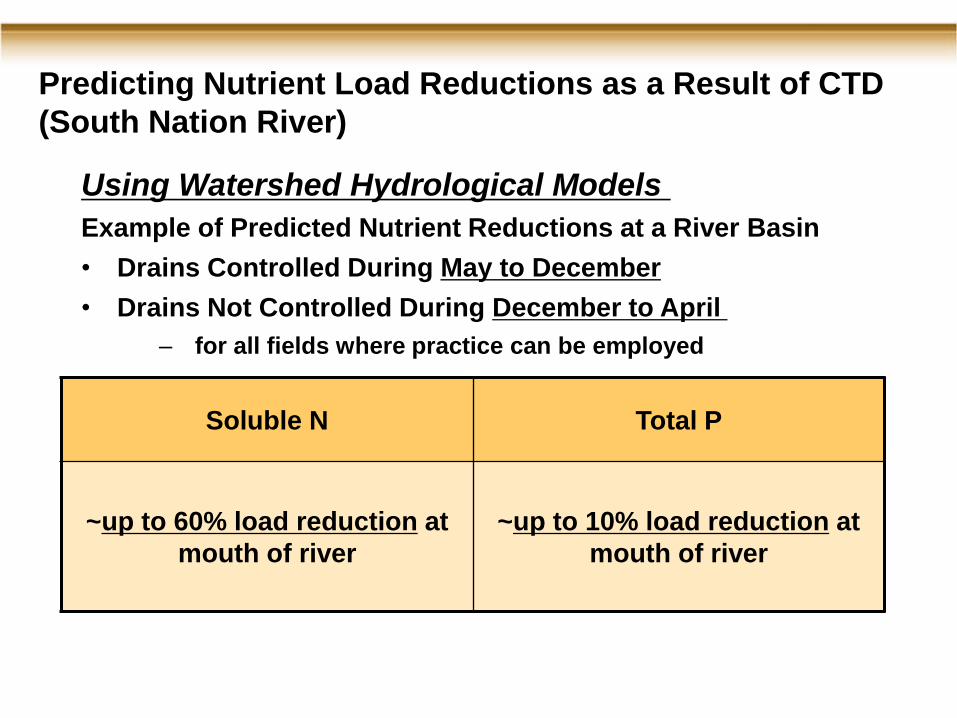
Predicting Nutrient Load Reductions as a Result of CTD
(South Nation River)
Using Watershed Hydrological Models
Example of Predicted Nutrient Reductions at a River Basin
• Drains Controlled During May to December
• Drains Not Controlled During December to April
– for all fields where practice can be employed
Soluble N Total P
~up to 60% load reduction at
mouth of river
~up to 10% load reduction at
mouth of river
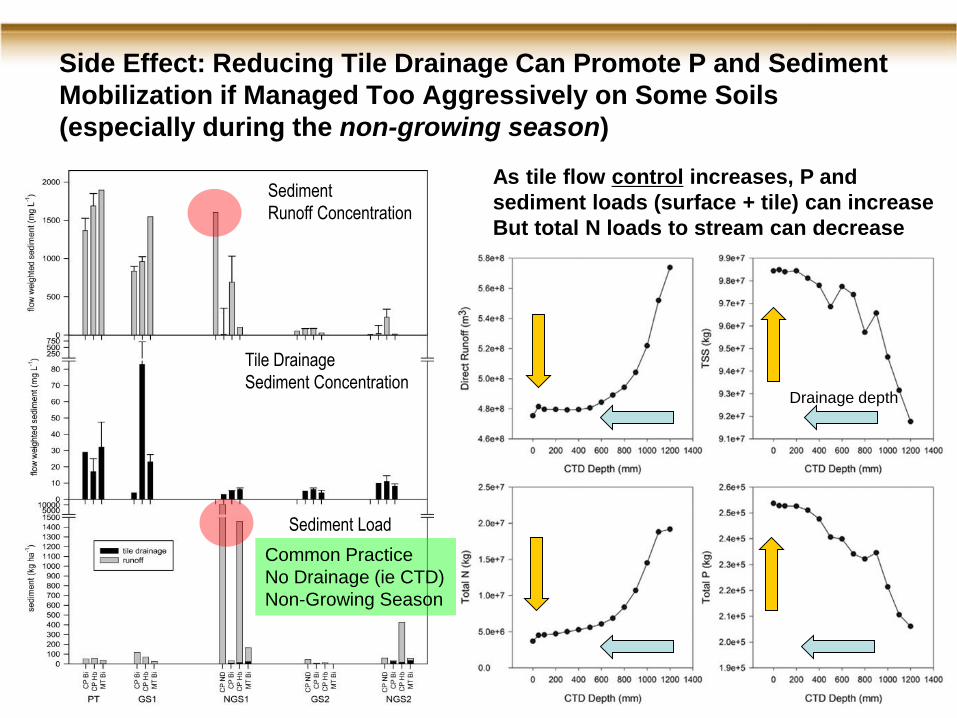
Side Effect: Reducing Tile Drainage Can Promote P and Sediment
Mobilization if Managed Too Aggressively on Some Soils
(especially during the non-growing season)
As tile flow control increases, P and
sediment loads (surface + tile) can increase
But total N loads to stream can decrease
Sediment
Runoff Concentration
Tile Drainage
Sediment Concentration
Sediment Load
Common Practice
No Drainage (ie CTD)
Non-Growing Season
Drainage depth
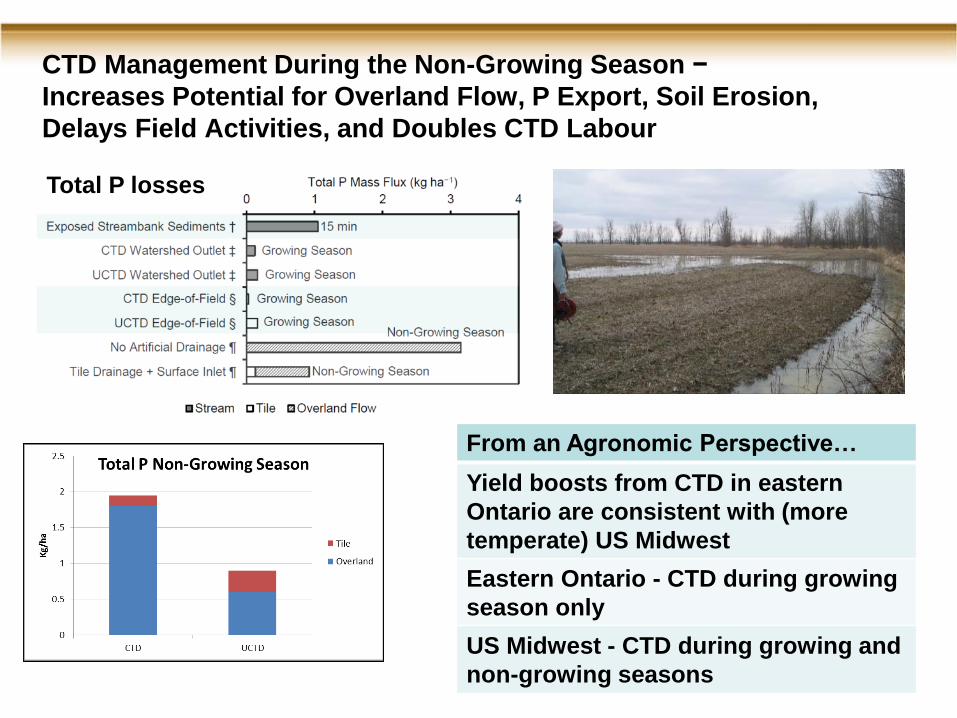
CTD Management During the Non-Growing Season −
Increases Potential for Overland Flow, P Export, Soil Erosion,
Delays Field Activities, and Doubles CTD Labour
Total P losses
From an Agronomic Perspective…
Yield boosts from CTD in eastern
Ontario are consistent with (more
temperate) US Midwest
Eastern Ontario - CTD during growing
season only
US Midwest - CTD during growing and
non-growing seasons
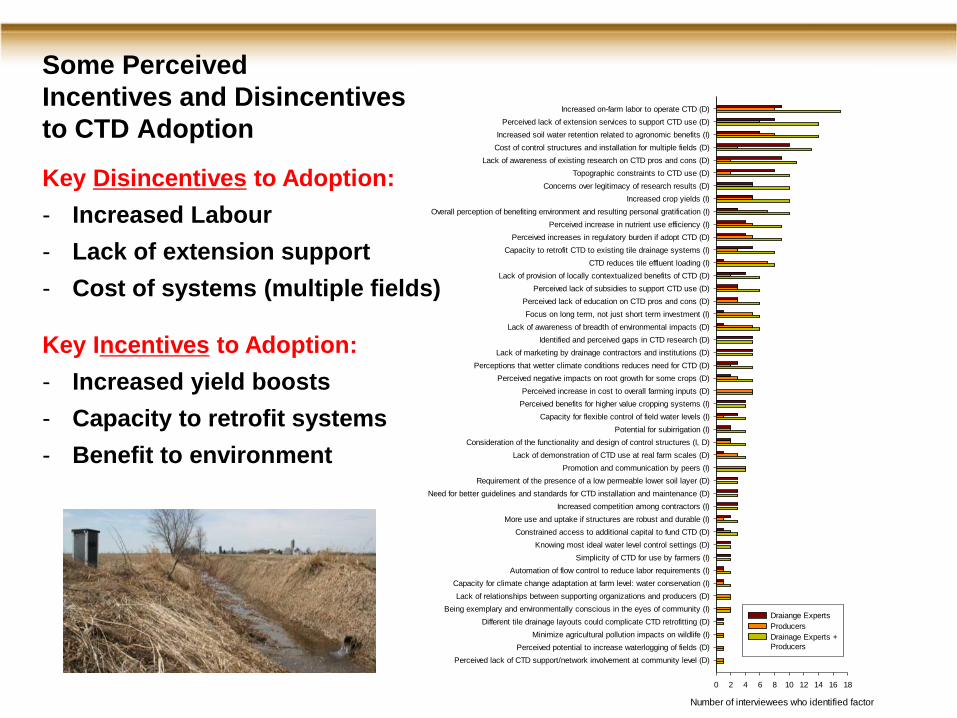
Number of interviewees who identified factor
0 2 4 6 8 10 12 14 16 18
Increased on-farm labor to operate CTD (D)
Perceived lack of extension services to support CTD use (D)
Increased soil water retention related to agronomic benefits (I)
Cost of control structures and installation for multiple fields (D)
Lack of awareness of existing research on CTD pros and cons (D)
Topographic constraints to CTD use (D)
Concerns over legitimacy of research results (D)
Increased crop yields (I)
Overall perception of benefiting environment and resulting personal gratification (I)
Perceived increase in nutrient use efficiency (I)
Perceived increases in regulatory burden if adopt CTD (D)
Capacity to retrofit CTD to existing tile drainage systems (I)
CTD reduces tile effluent loading (I)
Lack of provision of locally contextualized benefits of CTD (D)
Perceived lack of subsidies to support CTD use (D)
Perceived lack of education on CTD pros and cons (D)
Focus on long term, not just short term investment (I)
Lack of awareness of breadth of environmental impacts (D)
Identified and perceived gaps in CTD research (D)
Lack of marketing by drainage contractors and institutions (D)
Perceptions that wetter climate conditions reduces need for CTD (D)
Perceived negative impacts on root growth for some crops (D)
Perceived increase in cost to overall farming inputs (D)
Perceived benefits for higher value cropping systems (I)
Capacity for flexible control of field water levels (I)
Potential for subirrigation (I)
Consideration of the functionality and design of control structures (I, D)
Lack of demonstration of CTD use at real farm scales (D)
Promotion and communication by peers (I)
Requirement of the presence of a low permeable lower soil layer (D)
Need for better guidelines and standards for CTD installation and maintenance (D)
Increased competition among contractors (I)
More use and uptake if structures are robust and durable (I)
Constrained access to additional capital to fund CTD (D)
Knowing most ideal water level control settings (D)
Simplicity of CTD for use by farmers (I)
Automation of flow control to reduce labor requirements (I)
Capacity for climate change adaptation at farm level: water conservation (I)
Lack of relationships between supporting organizations and producers (D)
Being exemplary and environmentally conscious in the eyes of community (I)
Different tile drainage layouts could complicate CTD retrofitting (D)
Minimize agricultural pollution impacts on wildlife (I)
Perceived potential to increase waterlogging of fields (D)
Perceived lack of CTD support/network involvement at community level (D)
Draiange Experts
Producers
Drainage Experts +
Producers
Some Perceived
Incentives and Disincentives
to CTD Adoption
Key Disincentives to Adoption:
- Increased Labour
- Lack of extension support
- Cost of systems (multiple fields)
Key Incentives to Adoption:
- Increased yield boosts
- Capacity to retrofit systems
- Benefit to environment
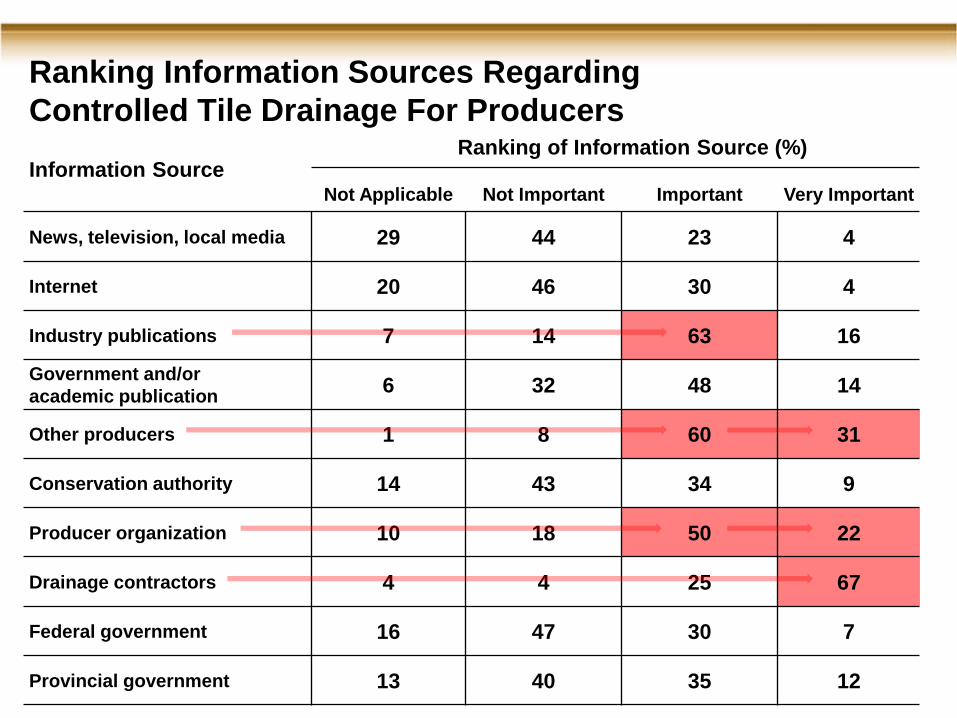
Ranking Information Sources Regarding
Controlled Tile Drainage For Producers
Information SourceRanking of Information Source (%)
Not Applicable Not Important Important Very Important
News, television, local media 29 44 23 4
Internet 20 46 30 4
Industry publications 7 14 63 16
Government and/or
academic publication6 32 48 14
Other producers 1 8 60 31
Conservation authority 14 43 34 9
Producer organization 10 18 50 22
Drainage contractors 4 4 25 67
Federal government 16 47 30 7
Provincial government 13 40 35 12
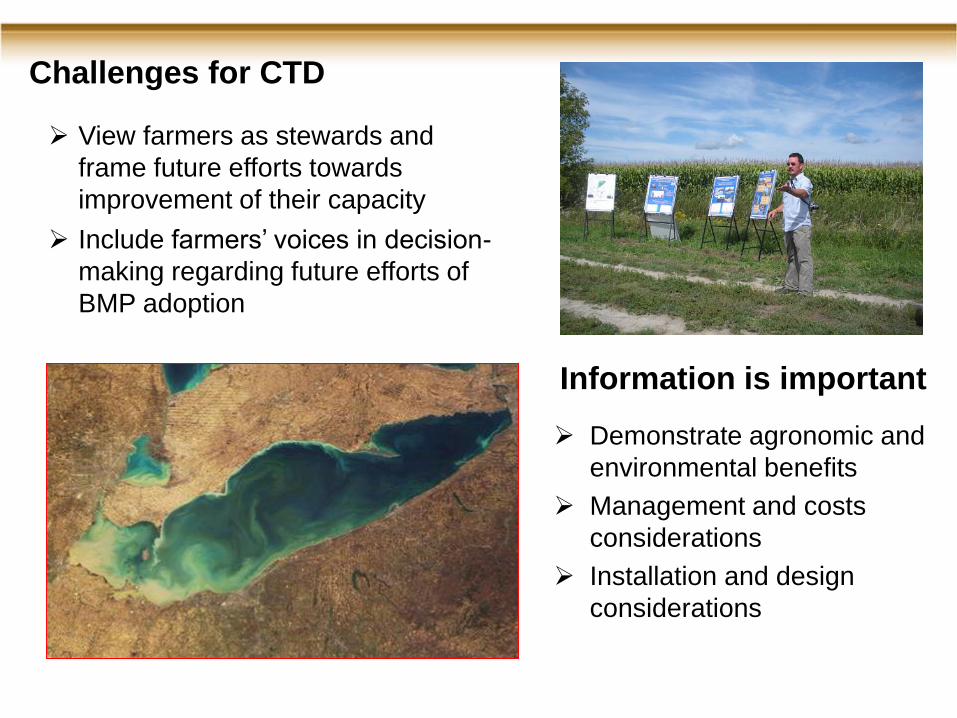
Information is important
Demonstrate agronomic and
environmental benefits
Management and costs
considerations
Installation and design
considerations
View farmers as stewards and
frame future efforts towards
improvement of their capacity
Include farmers’ voices in decision-
making regarding future efforts of
BMP adoption
Challenges for CTD