Embed Size (px)
Citation preview

GLOBAL FOOD POLICY REPORT
Africa Region
Ousmane Badiane
Director for Africa
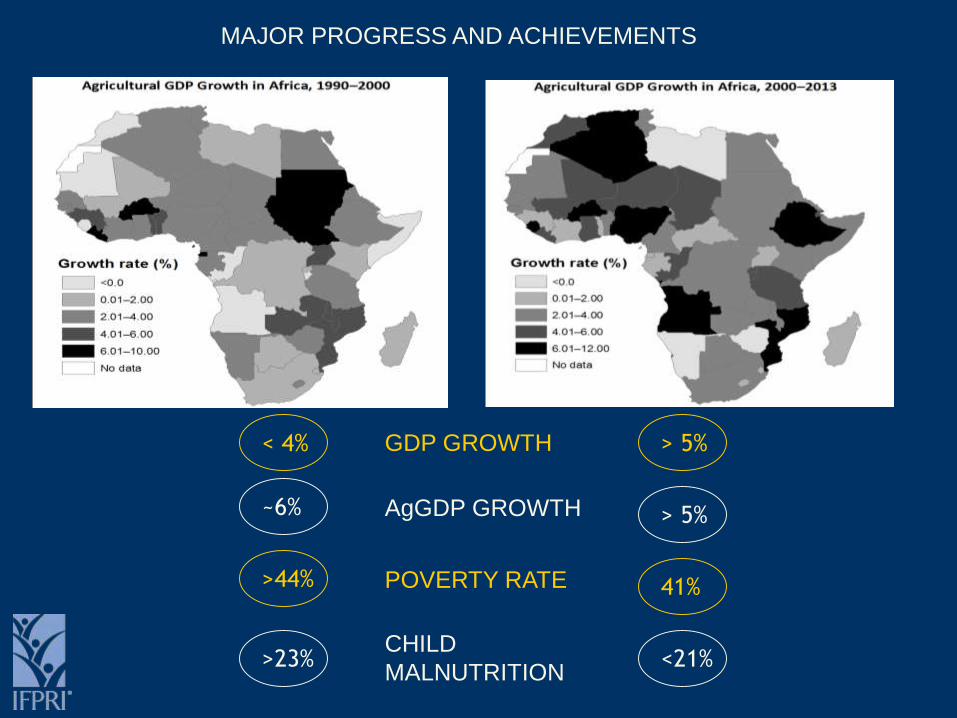
GDP GROWTH
AgGDP GROWTH
> 5%< 4%
> 5%~6%
POVERTY RATE 41%>44%
CHILD
MALNUTRITION<21%>23%
MAJOR PROGRESS AND ACHIEVEMENTS

Page <#>
Ag PE GROWTH -1.34%7.7%
Ag PE SHARE 3.1%3.7%
CHALLENGES AND OBSTACLES: GLOBAL ECONOMIC ENVIRONMENT
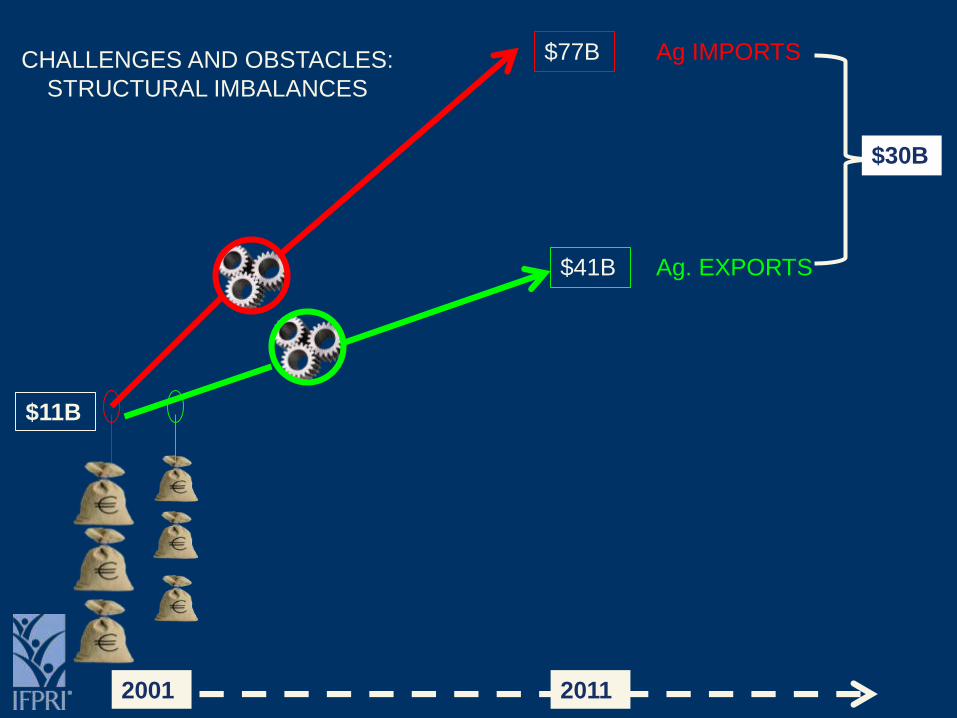
$11B
$77B
$41B
Ag IMPORTS
Ag. EXPORTS
2001 2011
$30B
CHALLENGES AND OBSTACLES:
STRUCTURAL IMBALANCES

Source: Epidemiological update of February 19, 2015” (Guinea and WHO, 2015); Cited in Fofana,
Ismael et al (2015)
Ebola in Guinea, February 19, 2015
CHALLENGES AND OBSTACLES: DISEASE AND CONFLICTS

REGION SCENARIO 1 SCENARIO 2 SCENARIO 3
Boke 0.0 -0.2 -0.7
Conakry -0.3 -1.2 -5.1
Faranah 0.0 -0.1 -0.3
Kankan 0.0 -0.2 -0.6
Kindia -0.1 -0.3 -1.1
Labe 0.0 0.0 0.0
Mamou 0.0 -0.1 -0.5
Nzerekore -0.2 -1.0 -4.2
Guinea -0.1 -0.3 -1.1
AGRICULTURAL LABOR SHOCK:
• Scenario 1: Reported cases & deaths x 2;
• Scenario 2: Reported cases & deaths x 2 + 1% displaced population;
• Scenario 3: Reported cases & deaths x 2 + 5% displaced population
Source: Fofana, Ismael et al (2015)
POTENTIAL IMPACT OF EBOLA ON AGRICULTURAL OUTPUT (%)

Page <#>
SUSTAINING THE MOMENTUM
RENEWED COMMITMENTS AT MALABO
Ending Hunger by 2025 – Nutrition
Halving Poverty by 2025
Triple Intra-African Trade by 2025
Climate Smart Agriculture – Resilience
Mutual Accountability – Sector Governance
Women Empowerment
Youth employment

Africa Net export outlook by products by 2030
Cereal
s
Veg.
OilsDairy
Processed
FoodsBeverages
TobaccoSugar
Red MeatWhite
Meat
Cash
Crops
Vegetables
and Fruits
Fibers

0
500
1000
1500
2000
2500
3000
2008 09 10 11 12 13 14 15 16 17 18 19 20 21 22 23 24 2025
Thousa
nd m
etr
ic
tons
CEREALS ROOTS OTHER FOODS ALL STAPLES OTHER CROPS
ECOWAS
Intra-trade outlook by 2025 under current trends

0.0
10.0
20.0
30.0
40.0
50.0
60.0
70.0
80.0
90.0
CEREALS ROOTS OTHER FOODS ALL STAPLES OTHER CROPS
% o
f Base
line Q
uanti
ty
10% reduction in trade costs Removal of harrassment costs 10% increase in crop yields
180
284259
1183
1154 1290
1464
3999
2544
101
2560
995 1809
5032 4706
Absolute numbers are in parentheses
ECOWAS
Changes in trading cost and yields and Intra-trade by 2025

Good Policies are not a solution for everything
Bad Policies are a problem for everything else
Policy Reversal would jeopardize ongoing growth
recovery across Africa
• Risk of return to failed policies of 60s and 70s
– No institutional memory
– New generation of leaders
– Stronger fiscal positions
– More open, democratic systems
– Populist pressures and tendencies
SECTOR GOVERNANCE AND QUALITY OF POLICY PROCESSES


0
50
100
150
200
250
Agricultural Price Index (Real), 1970-2013
0
5000
10000
15000
20000
25000
1970
1972
1974
1976
1978
1980
1982
1984
1986
1988
1990
1992
1994
1996
1998
2000
2002
2004
2006
2008
2010
2012
Yearly rainfall by region (mm)
Southern Eastern Central
Western Northern
0
2
4
6
8
10
12
14
16
18
1975
1977
1979
1981
1983
1985
1987
1989
1991
1993
1995
1997
1999
2001
2003
2005
2007
2009
2011
2013
Number of African countries with armed conflict, 1975-2013
0
50
100
150
200
1970
1972
1974
1976
1978
1980
1982
1984
1986
1988
1990
1992
1994
1996
1998
2000
2002
2004
2006
2008
2010
2012
Oil and Mining Price Index (Real), 1970-2013
Crude oil Metals and minerals

Page <#>
0
10
20
30
40
501970
1972
1974
1976
1978
1980
1982
1984
1986
1988
1990
1992
1994
1996
1998
2000
2002
2004
2006
Inflation, consumer prices (annual %)
East Africa Southern Africa West Africa
0
5
10
15
20
25
30
35
1970
1972
1974
1976
1978
1980
1982
1984
1986
1988
1990
1992
1994
1996
1998
2000
2002
2004
2006
International Reserves as Percentage of Total GDP (%)
East Africa Southern Africa
West Africa Sub-Saharan Africa
0
2
4
6
8
10
12
14
1974
1976
1978
1980
1982
1984
1986
1988
1990
1992
1994
1996
1998
2000
2002
2004
2006
Share
(%
)
Net Direct Investment as Share of GDP (%)
Southern Africa East Africa West Africa
Nominal Rate of Assistance to African Agriculture
Source: Anderson and Masers (2007)

Transition to improved review and dialogue processes
Completed country JSR Assessment Reports
SECTOR GOVERNANCE AND QUALITY OF POLICY PROCESSES

14 Country Needs Assessments completed
CNAs
SECTOR GOVERNANCE AND QUALITY OF POLICY PROCESSES