Embed Size (px)
Citation preview
‹#›
Vietnam Coffee Industry 2015Author: DEPOCEN | Reviewed by: StoxPlus JSC
Date of report: 28 March 2016
Part of StoxPlus’ Market Research Report Series for Vietnam
@ 2015 StoxPlus Corporation.
All rights reserved. All information contained in this publication is copyrighted in the name of StoxPlus, and as such no part of this publication may be
reproduced, repackaged, redistributed, resold in whole or in any part, or used in any form or by any means graphic, electronic or mechanical, including
photocopying, recording, taping, or by information storage or retrieval, or by any other means, without the express written consent of the publisher.
www.stoxresearch.com
2
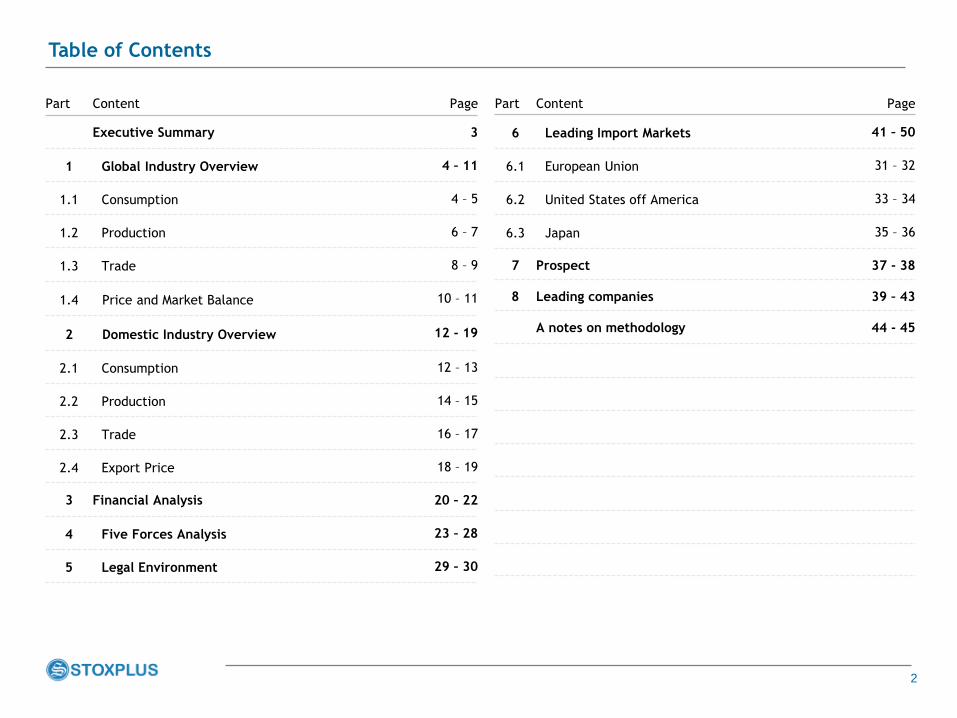
Table of Contents
Part Content Page
Executive Summary 3
1 Global Industry Overview 4 – 11
1.1 Consumption 4 – 5
1.2 Production 6 – 7
1.3 Trade 8 – 9
1.4 Price and Market Balance 10 – 11
2 Domestic Industry Overview 12 - 19
2.1 Consumption 12 – 13
2.2 Production 14 – 15
2.3 Trade 16 – 17
2.4 Export Price 18 – 19
3 Financial Analysis 20 – 22
4 Five Forces Analysis 23 – 28
5 Legal Environment 29 – 30
Part Content Page
6 Leading Import Markets 41 – 50
6.1 European Union 31 – 32
6.2 United States off America 33 – 34
6.3 Japan 35 – 36
7 Prospect 37 - 38
8 Leading companies 39 – 43
A notes on methodology 44 - 45
3
Executive Summary
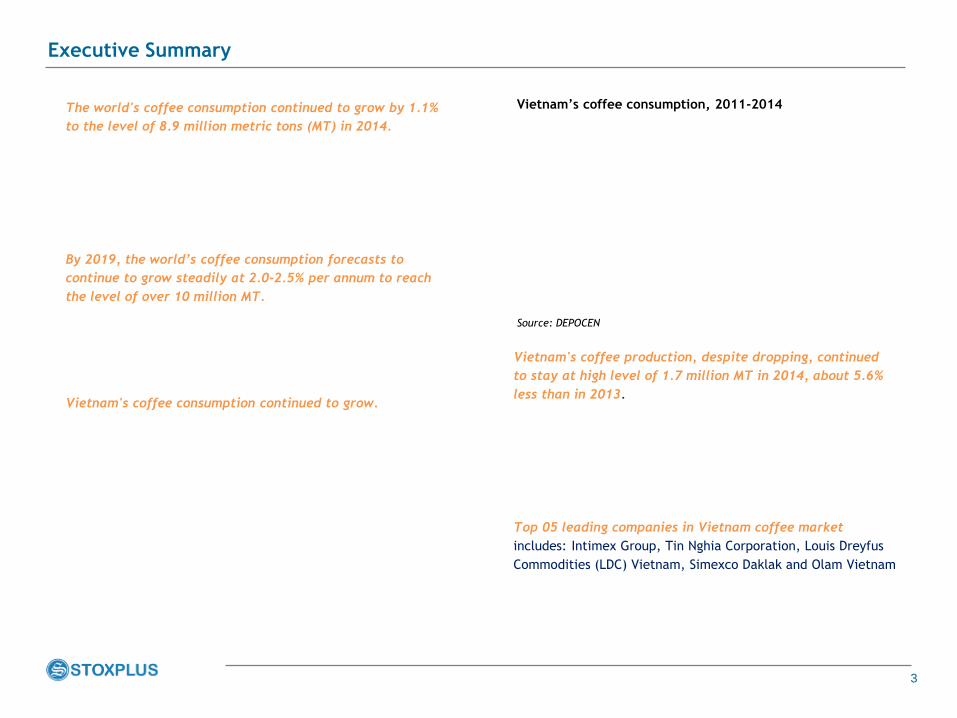
The world's coffee consumption continued to grow by 1.1%
to the level of 8.9 million metric tons (MT) in 2014.
By 2019, the world’s coffee consumption forecasts to
continue to grow steadily at 2.0-2.5% per annum to reach
the level of over 10 million MT.
Vietnam's coffee consumption continued to grow.
Vietnam's coffee production, despite dropping, continued
to stay at high level of 1.7 million MT in 2014, about 5.6%
less than in 2013.
Top 05 leading companies in Vietnam coffee market
includes: Intimex Group, Tin Nghia Corporation, Louis Dreyfus
Commodities (LDC) Vietnam, Simexco Daklak and Olam Vietnam
Vietnam’s coffee consumption, 2011-2014
Source: DEPOCEN
4
Contents
Section 1: Global Industry Overview
1.1 Consumption
1.2 Production
1.3 Trade
1.4 Price and Market Balance
5
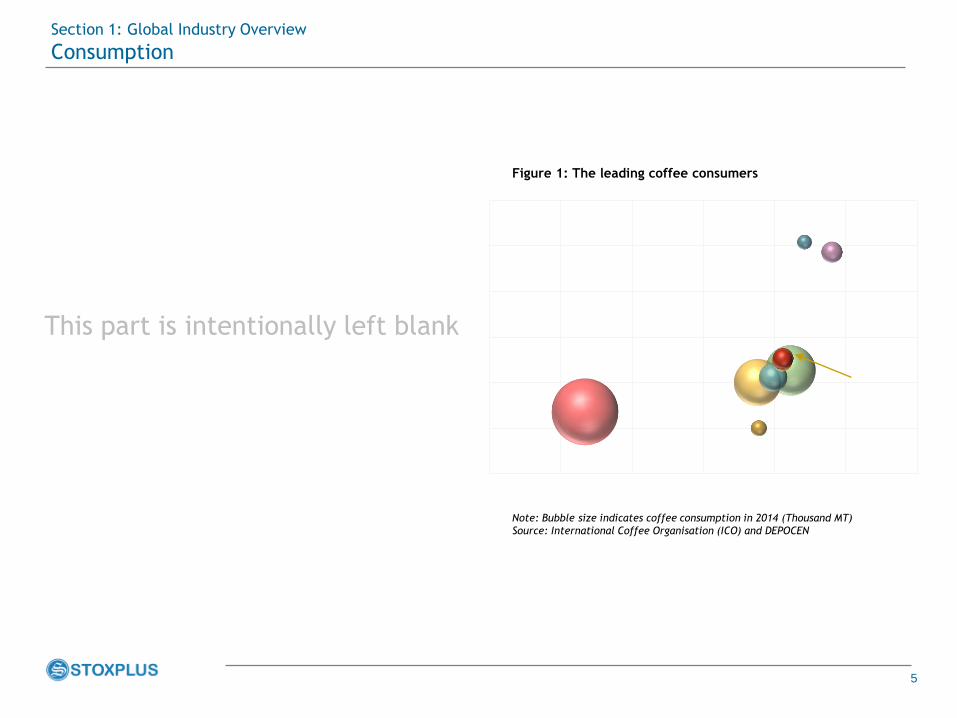
Section 1: Global Industry Overview
Consumption
Figure 1: The leading coffee consumers
Note: Bubble size indicates coffee consumption in 2014 (Thousand MT)
Source: International Coffee Organisation (ICO) and DEPOCEN
This part is intentionally left blank
6
Contents
Section 1: Global Apparel Industry Overview
1.1 Consumption
1.2 Production
1.3 Trade
1.4 Price and Market Balance
7
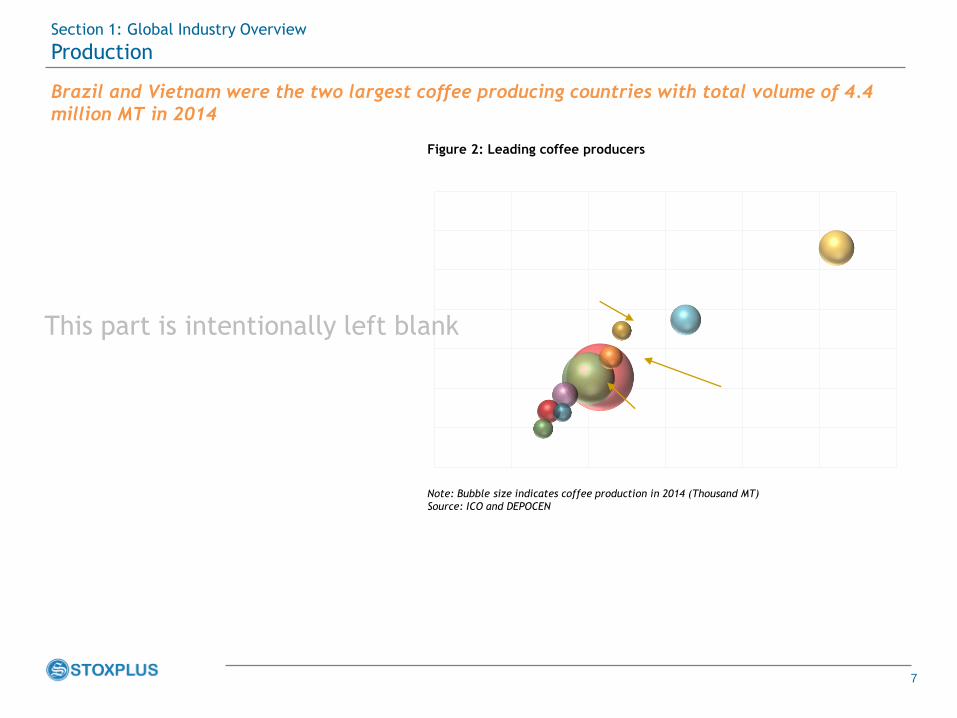
Brazil and Vietnam were the two largest coffee producing countries with total volume of 4.4
million MT in 2014
Section 1: Global Industry Overview
Production
Figure 2: Leading coffee producers
Note: Bubble size indicates coffee production in 2014 (Thousand MT)
Source: ICO and DEPOCEN
This part is intentionally left blank
8
Contents
Section 1: Global Apparel Industry Overview
1.1 Consumption
1.2 Production
1.3 Trade
1.4 Price and Market Balance
9
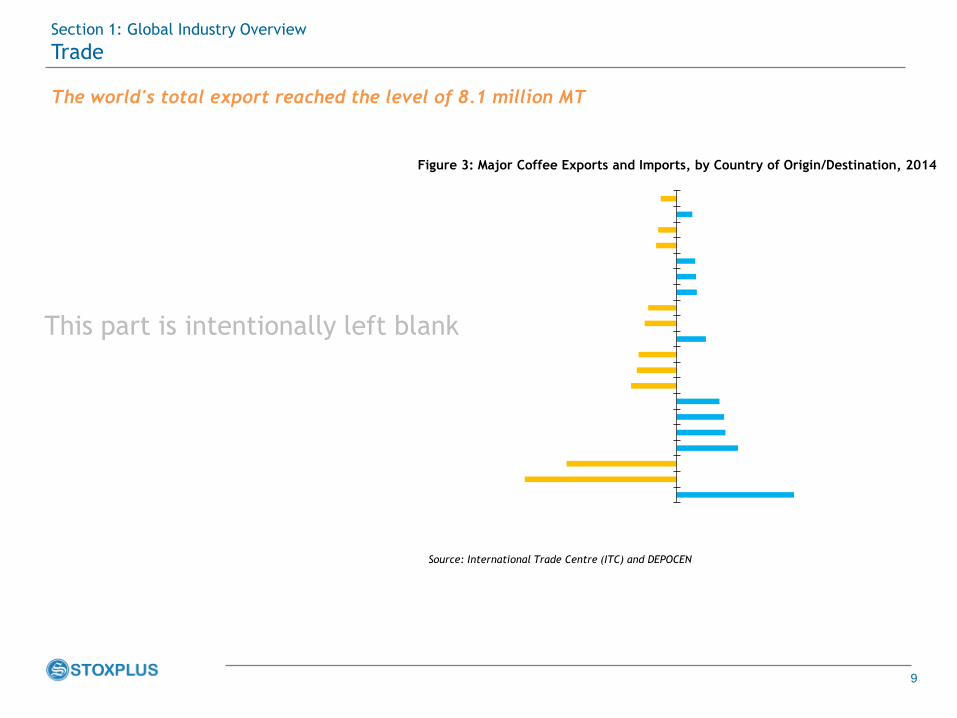
The world's total export reached the level of 8.1 million MT
Section 1: Global Industry Overview
Trade
Figure 3: Major Coffee Exports and Imports, by Country of Origin/Destination, 2014
Source: International Trade Centre (ITC) and DEPOCEN
This part is intentionally left blank
10
Contents
Section 1: Global Apparel Industry Overview
1.1 Consumption
1.2 Production
1.3 Trade
1.4 Price and Market Balance
11
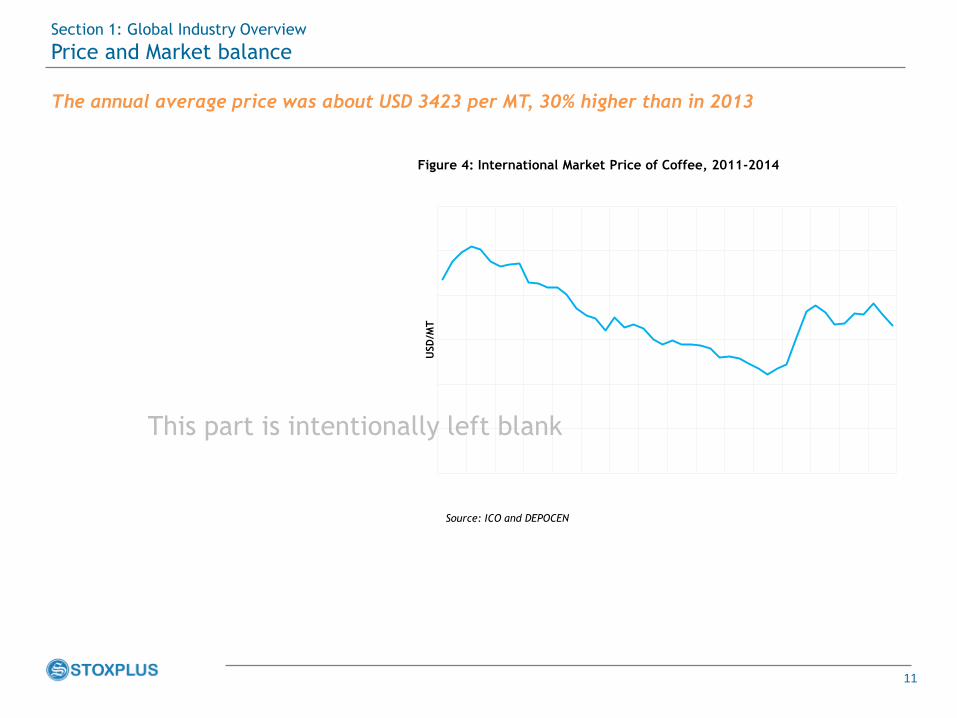
The annual average price was about USD 3423 per MT, 30% higher than in 2013
Section 1: Global Industry Overview
Price and Market balance
Figure 4: International Market Price of Coffee, 2011-2014
Source: ICO and DEPOCEN
USD
/MT
This part is intentionally left blank
12
Contents
Section 2: Domestic Industry Overview
2.1 Consumption
2.2 Production
2.3 Trade
2.4 Export price
13
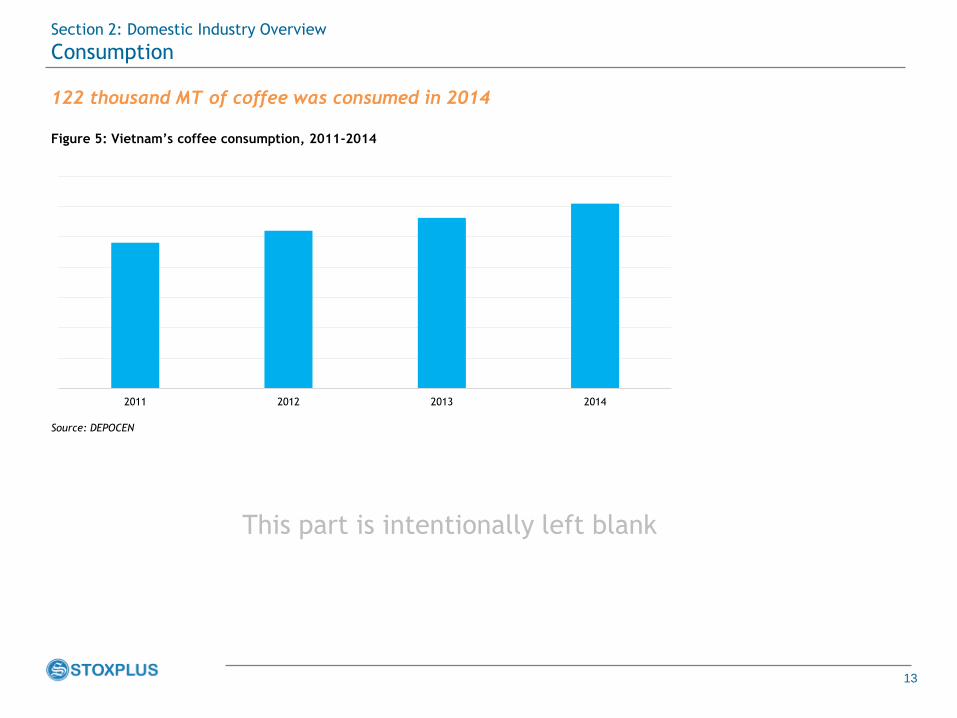
122 thousand MT of coffee was consumed in 2014
Section 2: Domestic Industry Overview
Consumption
2011 2012 2013 2014
Figure 5: Vietnam’s coffee consumption, 2011-2014
Source: DEPOCEN
This part is intentionally left blank
14
Contents
Section 2: Domestic Industry Overview
2.1 Consumption
2.2 Production
2.3 Trade
2.4 Export price
15
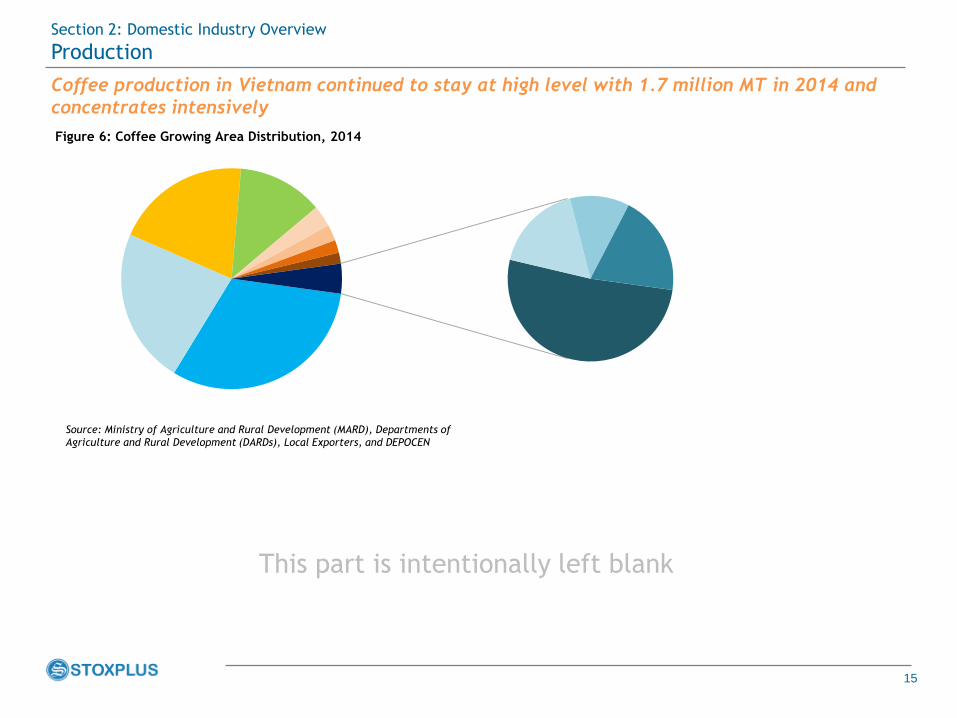
Coffee production in Vietnam continued to stay at high level with 1.7 million MT in 2014 and
concentrates intensively
Section 2: Domestic Industry Overview
Production
Figure 6: Coffee Growing Area Distribution, 2014
Source: Ministry of Agriculture and Rural Development (MARD), Departments of
Agriculture and Rural Development (DARDs), Local Exporters, and DEPOCEN
This part is intentionally left blank
16
Contents
Section 2: Domestic Industry Overview
2.1 Consumption
2.2 Production
2.3 Trade
2.4 Export price
17
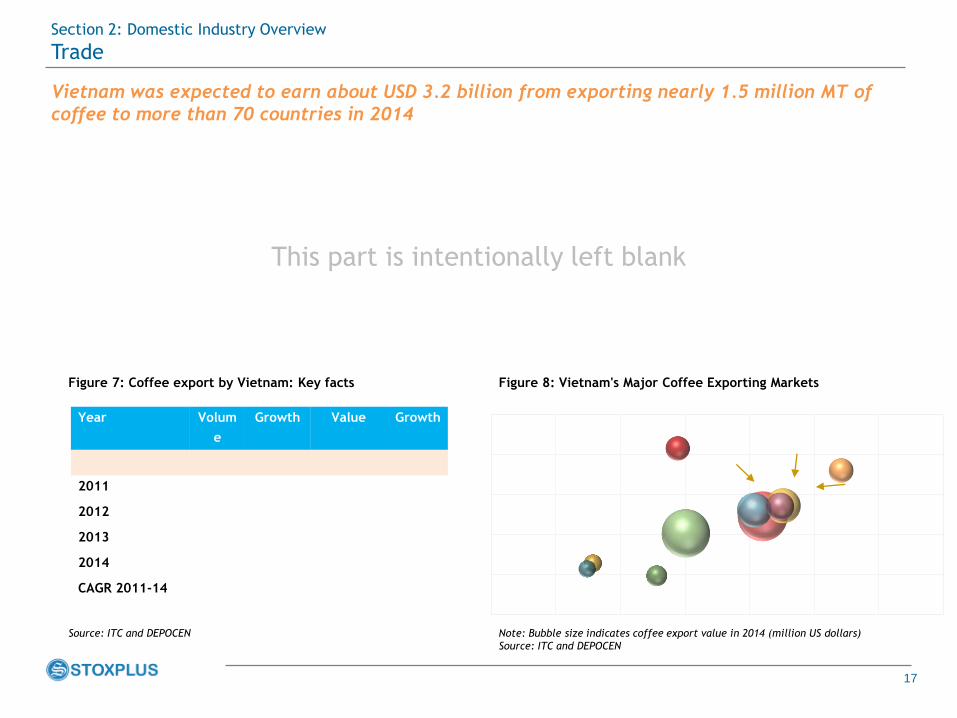
Vietnam was expected to earn about USD 3.2 billion from exporting nearly 1.5 million MT of
coffee to more than 70 countries in 2014
Section 2: Domestic Industry Overview
Trade
Figure 7: Coffee export by Vietnam: Key facts
Source: ITC and DEPOCEN
Year Volum
e
Growth Value Growth
2011
2012
2013
2014
CAGR 2011-14
Figure 8: Vietnam's Major Coffee Exporting Markets
Note: Bubble size indicates coffee export value in 2014 (million US dollars)
Source: ITC and DEPOCEN
This part is intentionally left blank
18
Contents
Section 2: Domestic Industry Overview
2.1 Consumption
2.2 Production
2.3 Trade
2.4 Export price
19
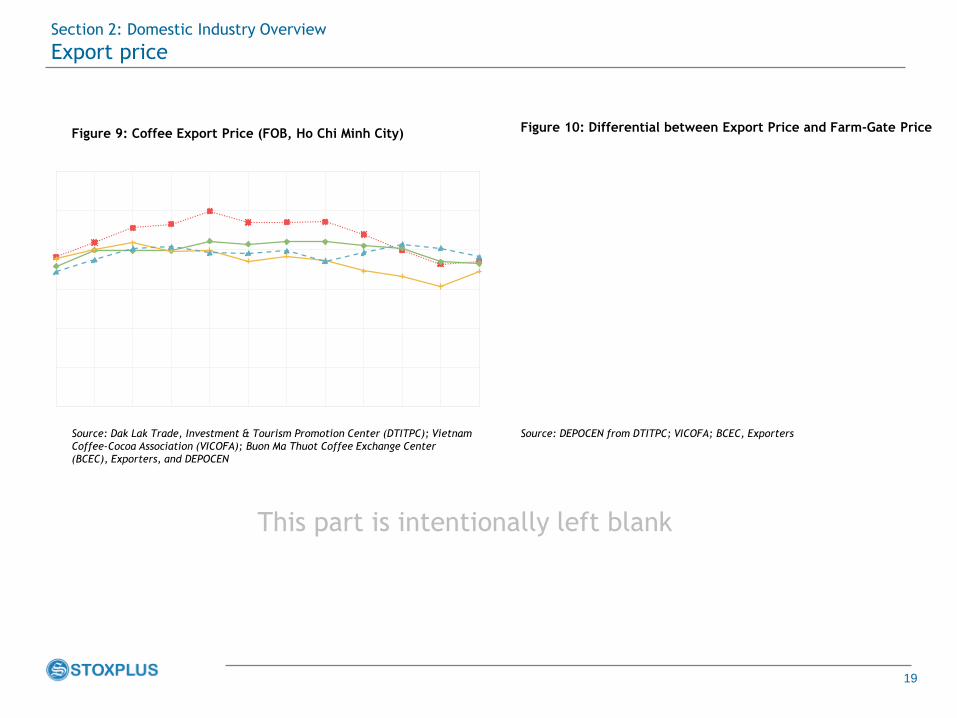
Section 2: Domestic Industry Overview
Export price
Figure 9: Coffee Export Price (FOB, Ho Chi Minh City)
Source: Dak Lak Trade, Investment & Tourism Promotion Center (DTITPC); Vietnam
Coffee-Cocoa Association (VICOFA); Buon Ma Thuot Coffee Exchange Center
(BCEC), Exporters, and DEPOCEN
Figure 10: Differential between Export Price and Farm-Gate Price
Source: DEPOCEN from DTITPC; VICOFA; BCEC, Exporters
This part is intentionally left blank
20
Contents
Section 3: Financial Analysis
21
The financial ratios indicate the low and instable degree of profitability over the period 2009-
2013
Section 3: Financial Analysis
Figure 11: Financial ratios in coffee trading subsector
Source: General Statistics Office of Vietnam (GSO) and DEPOCEN
Financial Ratios 2009 2010 2011 2012 2013
Profitability
Net income
Return on Equity
Return on Asset
Gross Profit Margin
Debt-to-Asset Ratio
Debt-to-Equity Ratio
Current Ratio
Quick Ratio
Cost of Goods Sold
Business Cost
Interests
Corporate Income Tax
Other Costs
This part is intentionally left blank
22
The financial ratios indicate the low and instable degree of profitability over the period 2009-
2013 (con’t)
Section 3: Financial Analysis
This part is intentionally left blank
23
Contents
Section 4: Five Forces Analysis of Vietnam Apparel Industry
24
Threat of Entry: Degree: Week
Section 4: Five Forces Analysis
Threat of Entry
Capital
requirementLocation Relationship
This part is intentionally left blank
25
Power of Suppliers: Degree: Moderate
Section 4: Five Forces Analysis
Power of Suppliers
Input
Coffee cherry
and parchment
Export
This part is intentionally left blank
26
Power of Buyers: Degree: Strong
Section 4: Five Forces Analysis
Power of Buyers
Export
Market concentration
Undifferentiated coffee
Integration
This part is intentionally left blank
27
Threat of Substitutes: Degree: Moderate
Section 4: Five Forces Analysis
Threat of Substitutes
Tea Arabica and Robusta
This part is intentionally left blank
28
Rivalry among Existing Competitors: Degree: Strong
Section 4: Five Forces Analysis
Rivalry among Existing Competitors
Driver up
Supply
This part is intentionally left blank
29
Contents
Section 5: Legal Environment
30
Over the past few years, there have been many strategies and policies issued in order to
facilitate the development of coffee sector
Section 5: Legal Environment
Decision No. 124/QD-TTg National program
This part is intentionally left blank
31
Contents
Section 6: Leading Import Markets
6.1 European Union
6.2 United States of America
6.3 Japan
32
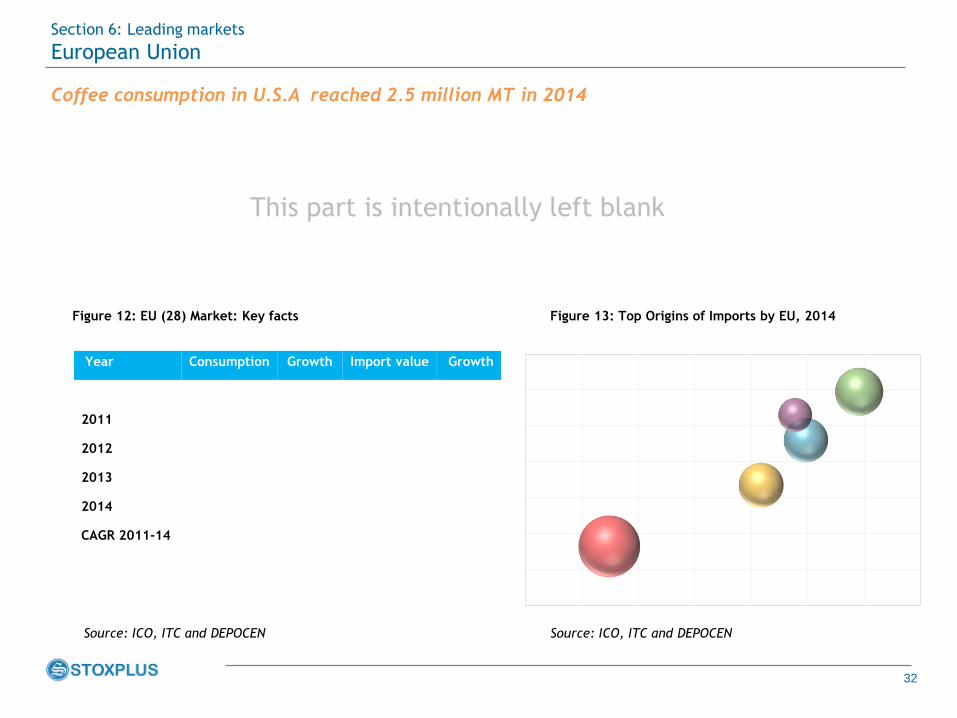
Figure 12: EU (28) Market: Key facts
Source: ICO, ITC and DEPOCEN
Section 6: Leading markets
European Union
Coffee consumption in U.S.A reached 2.5 million MT in 2014
Year Consumption Growth Import value Growth
2011
2012
2013
2014
CAGR 2011-14
Figure 13: Top Origins of Imports by EU, 2014
Source: ICO, ITC and DEPOCEN
This part is intentionally left blank
33
Contents
6.1 European Union
6.2 United States of America
6.3 Japan
Section 6: Leading Import Markets
34
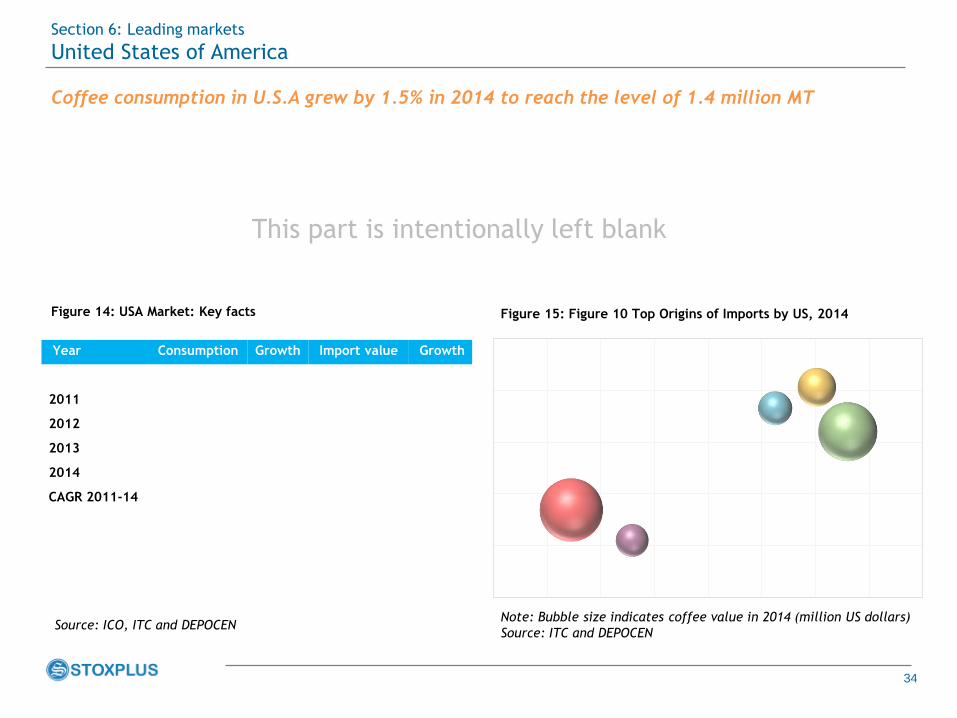
Figure 14: USA Market: Key facts
Coffee consumption in U.S.A grew by 1.5% in 2014 to reach the level of 1.4 million MT
Source: ICO, ITC and DEPOCEN
Section 6: Leading markets
United States of America
Figure 15: Figure 10 Top Origins of Imports by US, 2014
Note: Bubble size indicates coffee value in 2014 (million US dollars)
Source: ITC and DEPOCEN
Year Consumption Growth Import value Growth
2011
2012
2013
2014
CAGR 2011-14
This part is intentionally left blank
35
Contents
6.1 European Union
6.2 United States of America
6.3 Japan
Section 6: Leading Import Markets
36
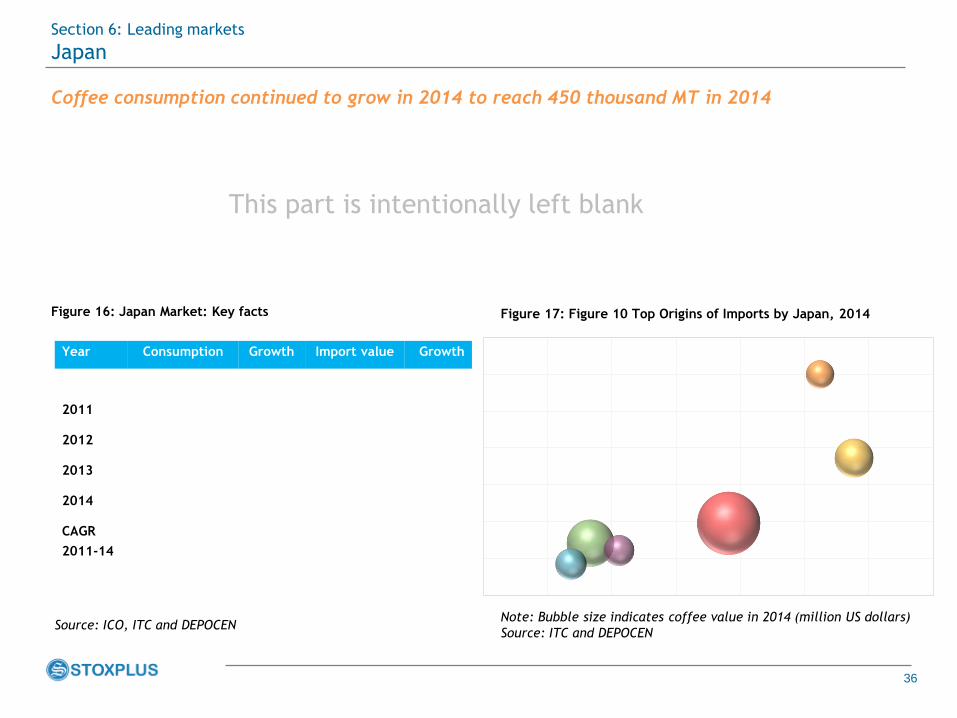
Figure 16: Japan Market: Key facts
Coffee consumption continued to grow in 2014 to reach 450 thousand MT in 2014
Source: ICO, ITC and DEPOCEN
Section 6: Leading markets
Japan
Figure 17: Figure 10 Top Origins of Imports by Japan, 2014
Note: Bubble size indicates coffee value in 2014 (million US dollars)
Source: ITC and DEPOCEN
Year Consumption Growth Import value Growth
2011
2012
2013
2014
CAGR
2011-14
This part is intentionally left blank
37
Contents
Section 7: Prospect
38
By 2019, the coffee consumption is forecast to continue to grow steadily at 2.0-2.5% per annum
to reach the level of over 10 million MT
Section 7: Prospects
This part is intentionally left blank
39
Contents
Section 8: Leading Companies Profiles
8.1 Intimex Group
8.2 Tin Nghia Corporation
8.3 Louis Dreyfus Commodities (LDC) Vietnam
8.4 Simexco Daklak
8.5 Olam Vietnam
40
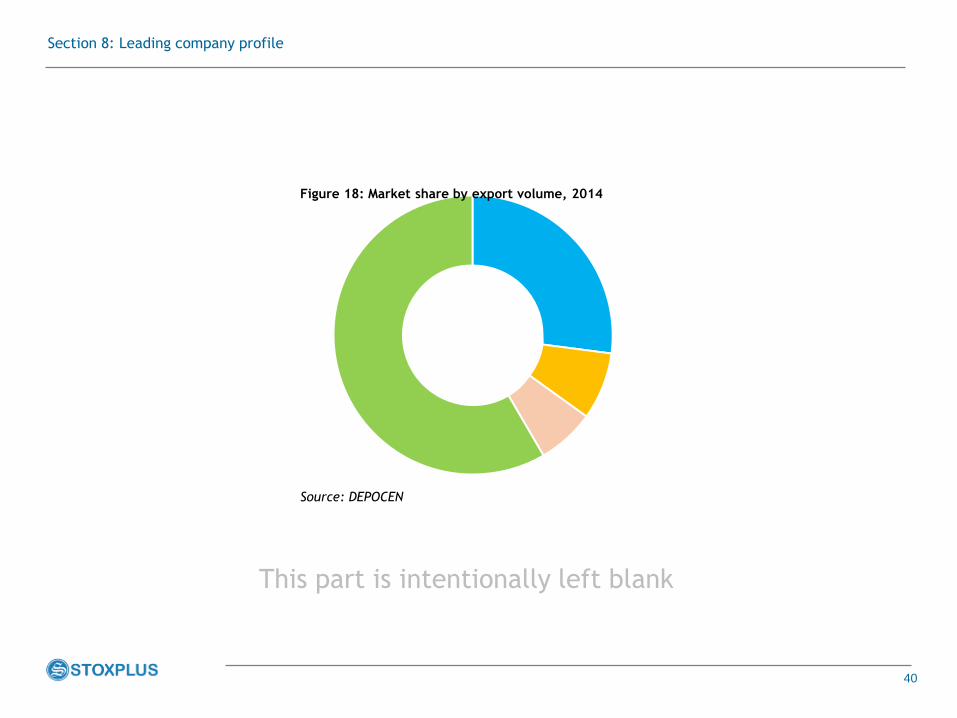
Section 8: Leading company profile
Figure 18: Market share by export volume, 2014
Source: DEPOCEN
This part is intentionally left blank
41
Intimex Group
Section 8: Leading company profile
Source: Company Website
BUSINESS PROFILE
Head Office
Website
Phone
Founded year
Source: Company Website
BUSINESS PROFILE
Head Office
Website
Phone
Founded year
Tin Nghia Corporation
This part is intentionally left blank
42
Louis Dreyfus Commodities (LDC) Vietnam
Section 8: Leading company profile
Source: Company Website
BUSINESS PROFILE
Head Office
Website
Phone
Founded year
Source: Company Website
BUSINESS PROFILE
Head Office
Website
Phone
Founded year
Simexco Daklak
This part is intentionally left blank
43
Olam Vietnam
Section 8: Leading company profile
Source: Company Website
BUSINESS PROFILE
Head Office
Website
Phone
Founded year
This part is intentionally left blank
44
Contents
A Note on Methodology
45
Primary
sources
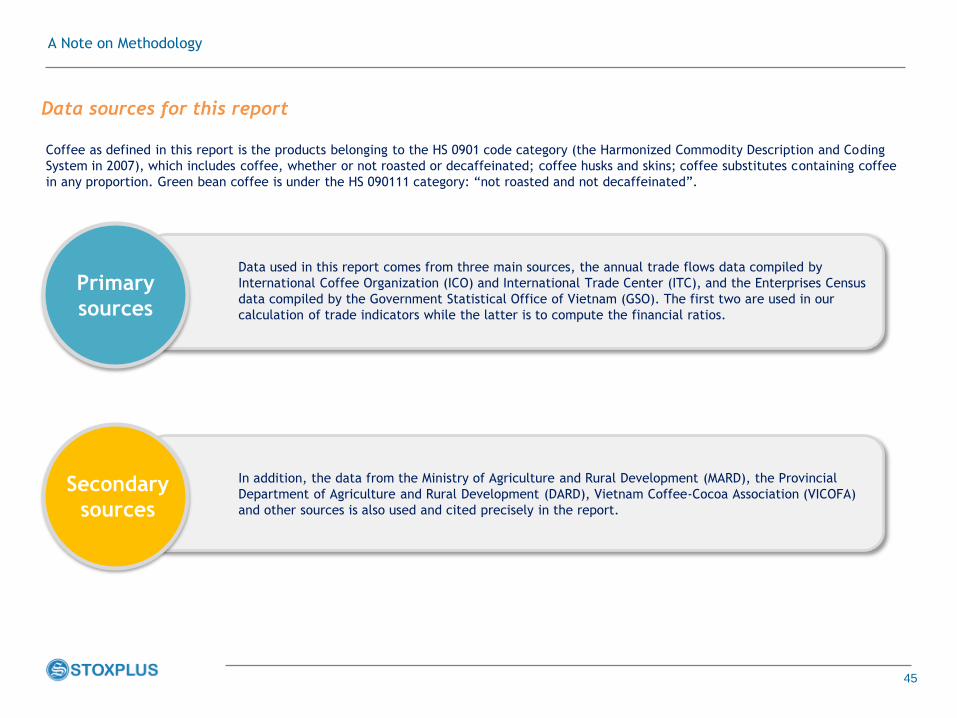
Data sources for this report
Data used in this report comes from three main sources, the annual trade flows data compiled by
International Coffee Organization (ICO) and International Trade Center (ITC), and the Enterprises Census
data compiled by the Government Statistical Office of Vietnam (GSO). The first two are used in our
calculation of trade indicators while the latter is to compute the financial ratios.
In addition, the data from the Ministry of Agriculture and Rural Development (MARD), the Provincial
Department of Agriculture and Rural Development (DARD), Vietnam Coffee-Cocoa Association (VICOFA)
and other sources is also used and cited precisely in the report.
Coffee as defined in this report is the products belonging to the HS 0901 code category (the Harmonized Commodity Description and Coding
System in 2007), which includes coffee, whether or not roasted or decaffeinated; coffee husks and skins; coffee substitutes containing coffee
in any proportion. Green bean coffee is under the HS 090111 category: “not roasted and not decaffeinated”.
A Note on Methodology
Secondary
sources
46
This page was intentionally left blank