Embed Size (px)
Citation preview

Integrating a Health Impact Assessment into a Road Safety Audit:
Lessons from a Case Study in Clackamas County, Oregon
2016 Oregon Active Transportation Summit
Joseph F. Marek, PE, PTOE Steve White, MURPTransportation Safety Program Manager Oregon Public Health Institute
Clackamas County, OR Portland, OR
March 14, 2016

You are Here
Clackamas County, Oregon

Clackamas County, Oregon
1839 sq. miles/385,000 people
1,400 miles of County maintained roads
Over 2,200 total miles
17 cities
Summit of Cascade Mountains to fertile Willamette Valley

Crashes In Clackamas County
Each Year - All Roads
26 deaths average
128 serious injury crashes
One death every 13 days
One serious injury every 3 days

What is a Road Safety Audit (RSA)?
• Formal safety performance study
• Independent audit team
• Discrete geographic focus
• Qualitatively estimates and reports on potential safety issues
• Identifies improvements for all users
• VERY COMMON!

What is a Health Impact Assessment (HIA)?
A structured process that uses scientific data, professional expertise, and stakeholder input
to identify and evaluate public health consequences of proposals and suggests actions that could be taken to minimize
adverse health impacts and optimize beneficial ones
Source: “Improving Health in the United States: The Role of Health Impact Assessments” by the National Research Council, September 2011

RSA + HIA Project Overview
• RSA: Examine a portion of McLoughlin Blvd. (Hwy 99E) in Jennings Lodge, OR
• Focus on the safety of pedestrians and bicycles primarily related to roadway crossings
• HIA: Take outputs from RSA and use them as inputs into HIA
• Examine results


Wide pedestrian crossings
Unsignalized crossings
High transit use
Intermittent street
lighting

Project Rationale
ISSUE #1: How can we improve safety for bicyclists and pedestrians who need to access resources along and across McLoughlin Blvd?
– Road Safety Audit
ISSUE #2: How might the safety improvements impact other active transportation-related health determinants?
– Health Impact Assessment

HIA Project Goals
• Provide DTD and ODOT staff with information about the potential health impacts of the RSA recommendations
• Build capacity for HIA and other HiAP strategies in CCPH and DTD
• Develop replicable model for integrating health considerations into other transportation projects

Process
Road Safety AuditHealth Impact
AssessmentConclusions/Recomme
ndations

RSA Outputs
• Identified and prioritized 11 primary safety issues
– Left turn crossing movements
– Night time visibility
– Sidewalk quality
– Etc.

RSA Outputs
• 46 Recommended solutions
– For “Sidewalk quality”:• Fill gaps in sidewalk network.
• Add reflective tape to improve visibility at nighttime.
• Create delineation to prevent pedestrians from falling off sidewalk edge.
• Improve sidewalk grade and increase sidewalk width.

RSA + HIA Process
1. Convene knowledgeable stakeholders:a. Transportation planners and engineers
b. Public health professionals
c. Community members
2. Identify potentially impacted health determinants (other than safety)
3. Determine how to assess and rate potential impacts
4. Conduct assessment
5. Findings and recommendations

Impacted HealthDeterminants
RSA Recommendations
Crash Safety
Exposure to Air Pollutants
Access to resources
Opportunities for Physical Activity
Noise
Injury
Asthma
Cardiovascular health
Diabetes
Obesity
Stress
Cancer

How to Assess Impacts?
• Physical Activity:– Does the recommendation
improve access to the Trolley Trail?
– Does the recommendation encourage walking, biking, or transit use?
– Does the recommendation improve access to schools and parks?

How to Assess Impacts?
• Exposure to Air Toxics and Noise– Does the recommendation encourage
walking/biking along streets/paths parallel to McLoughlin?
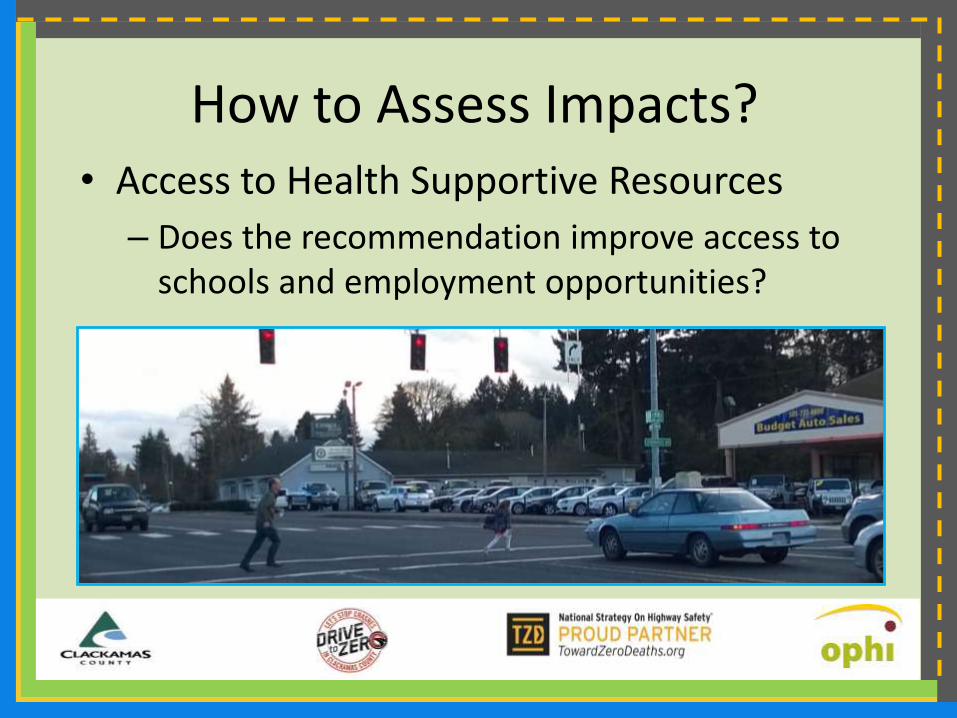
How to Assess Impacts?• Access to Health Supportive Resources
– Does the recommendation improve access to schools and employment opportunities?

Scoring Impacts
Scoring
-2 relatively strong negative impact
-1 relatively minor negative impact
0 no impact
+1 relatively minor positive impact
+2 relatively strong positive impact
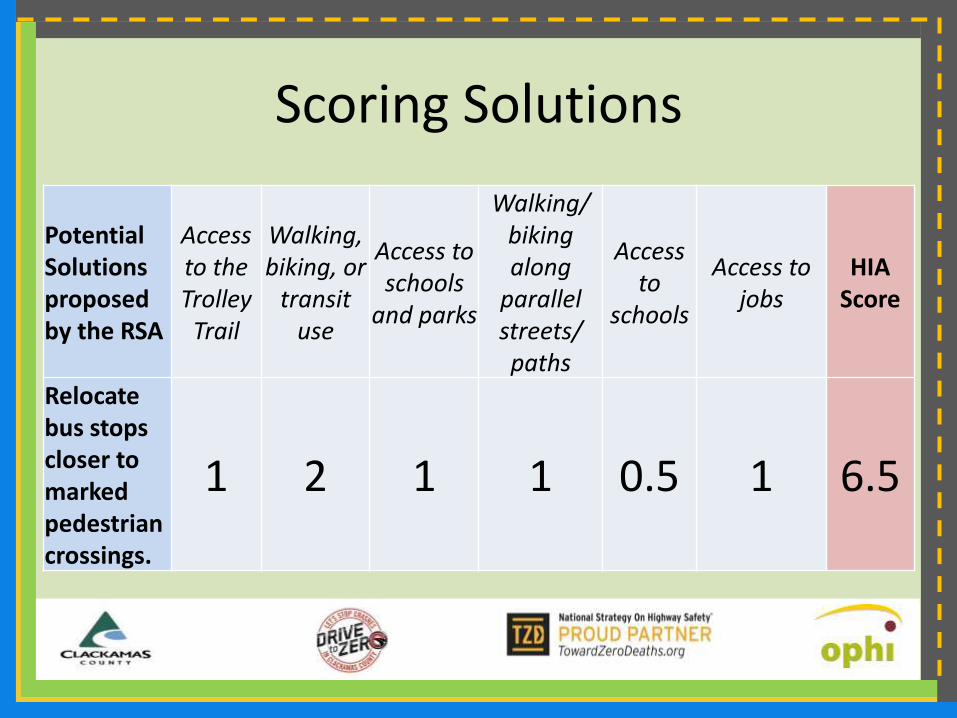
Scoring Solutions
Potential Solutions proposed by the RSA
Access to the Trolley
Trail
Walking, biking, or
transit use
Access to schools
and parks
Walking/ biking along
parallel streets/ paths
Access to
schools
Access to jobs
HIA Score
Relocate bus stops closer to marked pedestrian crossings.
1 2 1 1 0.5 1 6.5

Table 2: HIA raw and average scores for each health determinant
PHYSICAL ACTIVITY
EXPOSURE TO
AIR AND NOISE
POLLUTION
ACCESS TO
RESOURCES AVERAGE SCORES
Potential Solutions proposed by
the RSA
HIA
Score
RSA
Risk
score
Access
to the
Trolle
y Trail
Walkin
g,
biking,
or
transit
use
Access
to
schools
and
parks
Walking/biking
along parallel
streets/paths
Access
to
school
s
Acces
s to
emplo
yment
Physic
al
Activit
y
Exposur
e to Air
and
Noise
Pollutio
n
Access
to
resourc
es
HIGH IMPACT
Build sidewalks 12 2 2 2 2 2 2 2 2.0 2.0 2.0
Improve lighting 12 2 2 2 2 2 2 2 2.0 2.0 2.0
Provide additional crossing
enhancements to increase
visibility and attract pedestrians
(e.g. warning signs, crosswalk
markings, reflectors, advanced
stop bars)
12 2 2 2 2 2 2 2 2.0 2.0 2.0
Flashing Beacons, RRFB, etc. 11.5 2 2 2 2 1.5 2 2 2.0 1.5 2.0
Add street lighting to remove
contrast with private illuminated
signs.
9.5 2 2 2 0.5 2 1 2 1.5 2.0 1.5

Findings
- Most of the 42 RSA solutions would improve multiple health issues
- Physical activity is the health determinant impacted by most RSA solutions
- The “high impact” solutions are relatively large pedestrian infrastructure projects that both improve pedestrian mobility and encourage changes in driver behavior

Lessons Learned
• The HIA helped:– Identify additional benefits for safety
improvements– Prioritize investment decisions– Highlight transportation equity– Stakeholders discuss and articulate preferences
and advocate for action– Staff articulate benefits of investments– Develop partnerships between county
departments

Lessons Learned
• Future RSAs could (and should) easily be designed to include consideration of potential impacts on multiple health determinants, especially:
– Opportunities for physical activity
– Access to health supportive resources
– Exposure to air/noise pollution
– Health equity
Moving Forward – Post HIA/RSA

County Strategic Priorities
• Build public trust through good government
• Grow a vibrant economy• Build a strong
infrastructure• Ensure safe, healthy and
secure communities• Honor, utilize, promote
and invest in our natural resources
Safe Roads
Vibrant Economy
Healthy
People
29
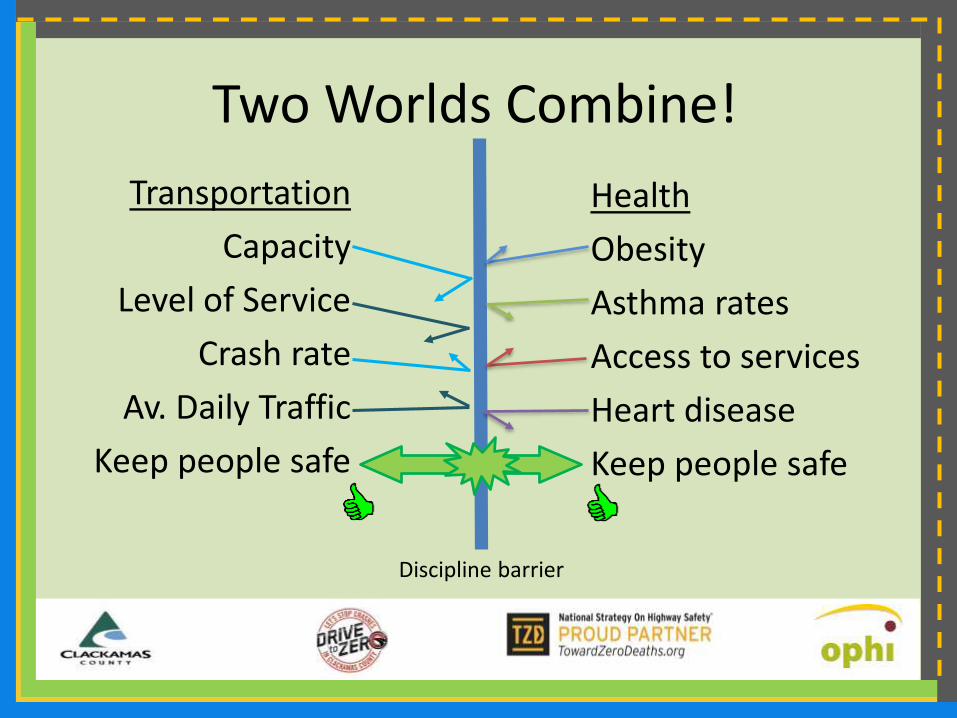
Two Worlds Combine!
Transportation
Capacity
Level of Service
Crash rate
Av. Daily Traffic
Keep people safe
Health
Obesity
Asthma rates
Access to services
Heart disease
Keep people safe
Discipline barrier

Organizational Elements
• At some point – need transportation and health professionals talking to each other

Organizational Structure
County Commissioners
Engineering/Planning
Health, Housing, Human Services
Law Enforcement

Transportation System Plan
• Goal 4: Promote a transportation system that maintains or improves our safety, health, and security
• Had County Health Officer on project team
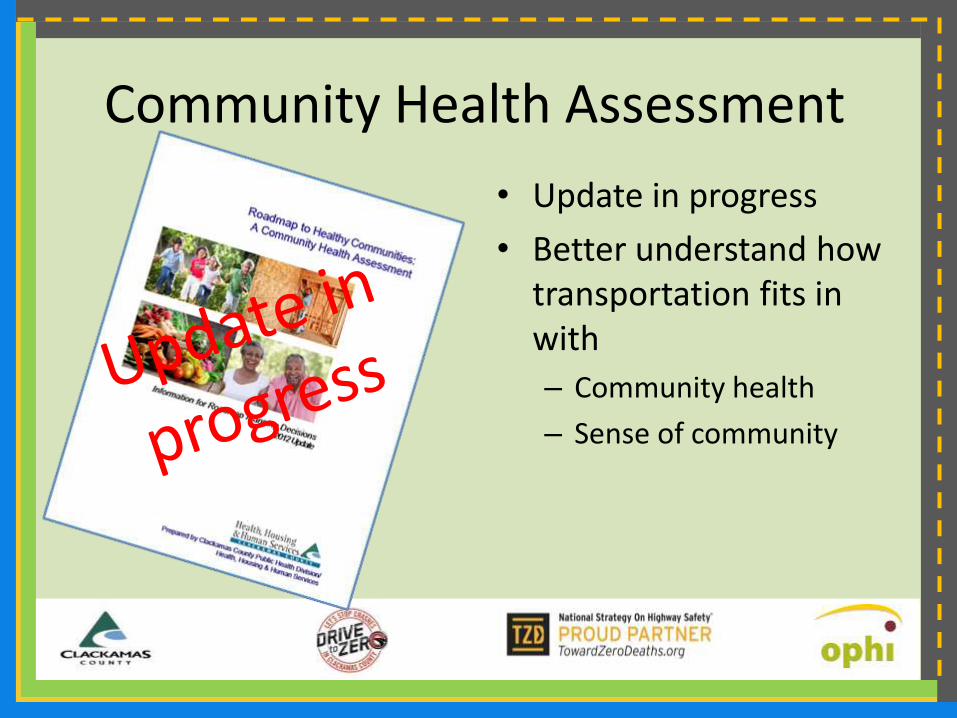
Community Health Assessment
• Update in progress
• Better understand how transportation fits in with
– Community health
– Sense of community
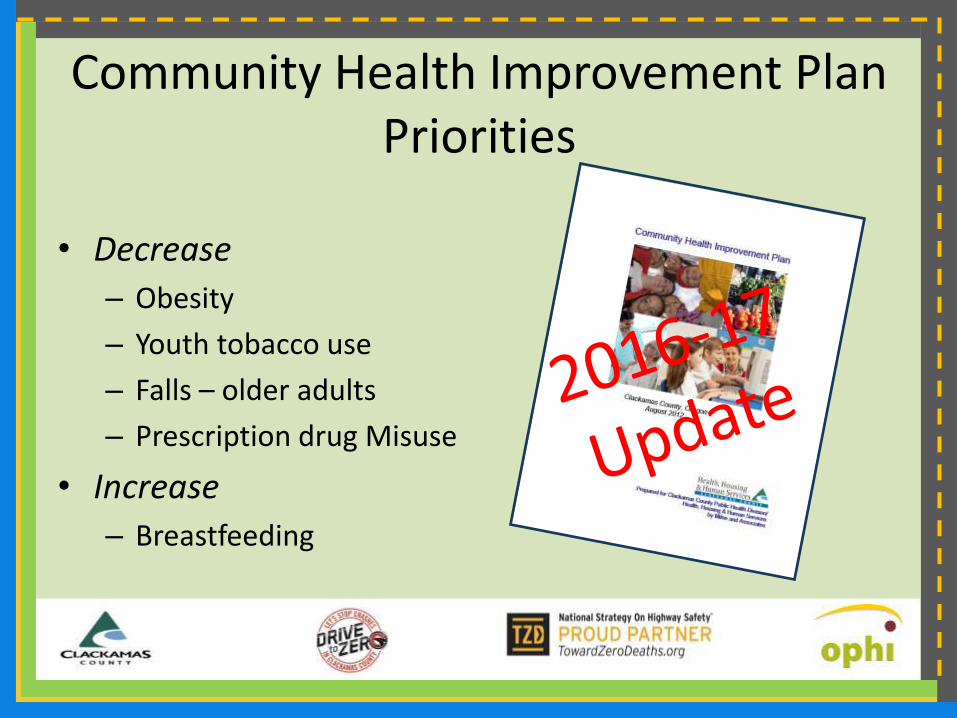
Community Health Improvement Plan Priorities
• Decrease
– Obesity
– Youth tobacco use
– Falls – older adults
– Prescription drug Misuse
• Increase
– Breastfeeding

Organizational Integration of Health, Transportation and Safety

Most Policy Decisions HaveHealth Impact
• County Commission decisions in 2014
– 527 policy decisions
– 78% - impact to health and safety

Health and Safety in All Policies
• Pilot project FY 2016/17
– Select several policy proposals
– Assess health and safety consequences of options within policy development process
– Promote cross-sector collaboration and policy conversations


Many Puzzle Pieces!

Growing and Learning Together!
• Building relationships
• Opening minds
• Change our lens
• Creating positive impact
• Always considering how we can help our customers

And … Out of the Toolbox!
• A new way to help us improve our communities!
• www.transportation.gov/transportation-health-tool

A Transportation and Health Tool!
• A set of transportation and public health indicators to help show how an area compares based on several transportation and health metrics
• A resource to help understand the links between transportation and health
• A set of strategies to improve public health through transportation programs and policies

14 Key IndicatorsTr
ansp
ort
atio
n 1. Commute Mode Share
2. Housing and Transportation Affordability
3. Land Use Mix
4. Person Miles Traveled by Mode
5. Proximity to Major Roadways
6. Public Transportation Trips per Capita
7.VMT Per Capita
Hea
lth 8. Alcohol-Impaired
Fatalities
9. Physical Activity from Transportation
10. Road Traffic Fatalities by Mode
11. Road Traffic Fatalities Exposure Rate
Polic
y 12. Complete Streets Policies
13.Seat Belt Use
14. Use of Federal Funds for Bicycle and Pedestrian Efforts

SAFE and HEALTHY COMMUNITIESSTART WITH YOU!
Thank YouQuestions?Joseph Marek [email protected] [email protected]

Person
Roadway
22%
70%
<1%<1%
<1%
6%1%
Clackamas County Crash Cause Diagram
>99% (Person as a cause factor)
8% (Vehicle as a cause factor)
24% (Roadway as a cause factor)
Crash Cause Factor %
Person >99
Roadway 24
Vehicle 8
Sole Crash Cause Factor %
Person 70
Roadway <1
Vehicle <1
Combination Crash Cause Factors %
Person & Roadway 22
Person & Vehicle 6
Roadway & Vehicle <1
Roadway & Vehicle & Person 1
Source: Oregon DOT crash data, 2009-2013