Embed Size (px)
Citation preview
Mar
ch 2
015
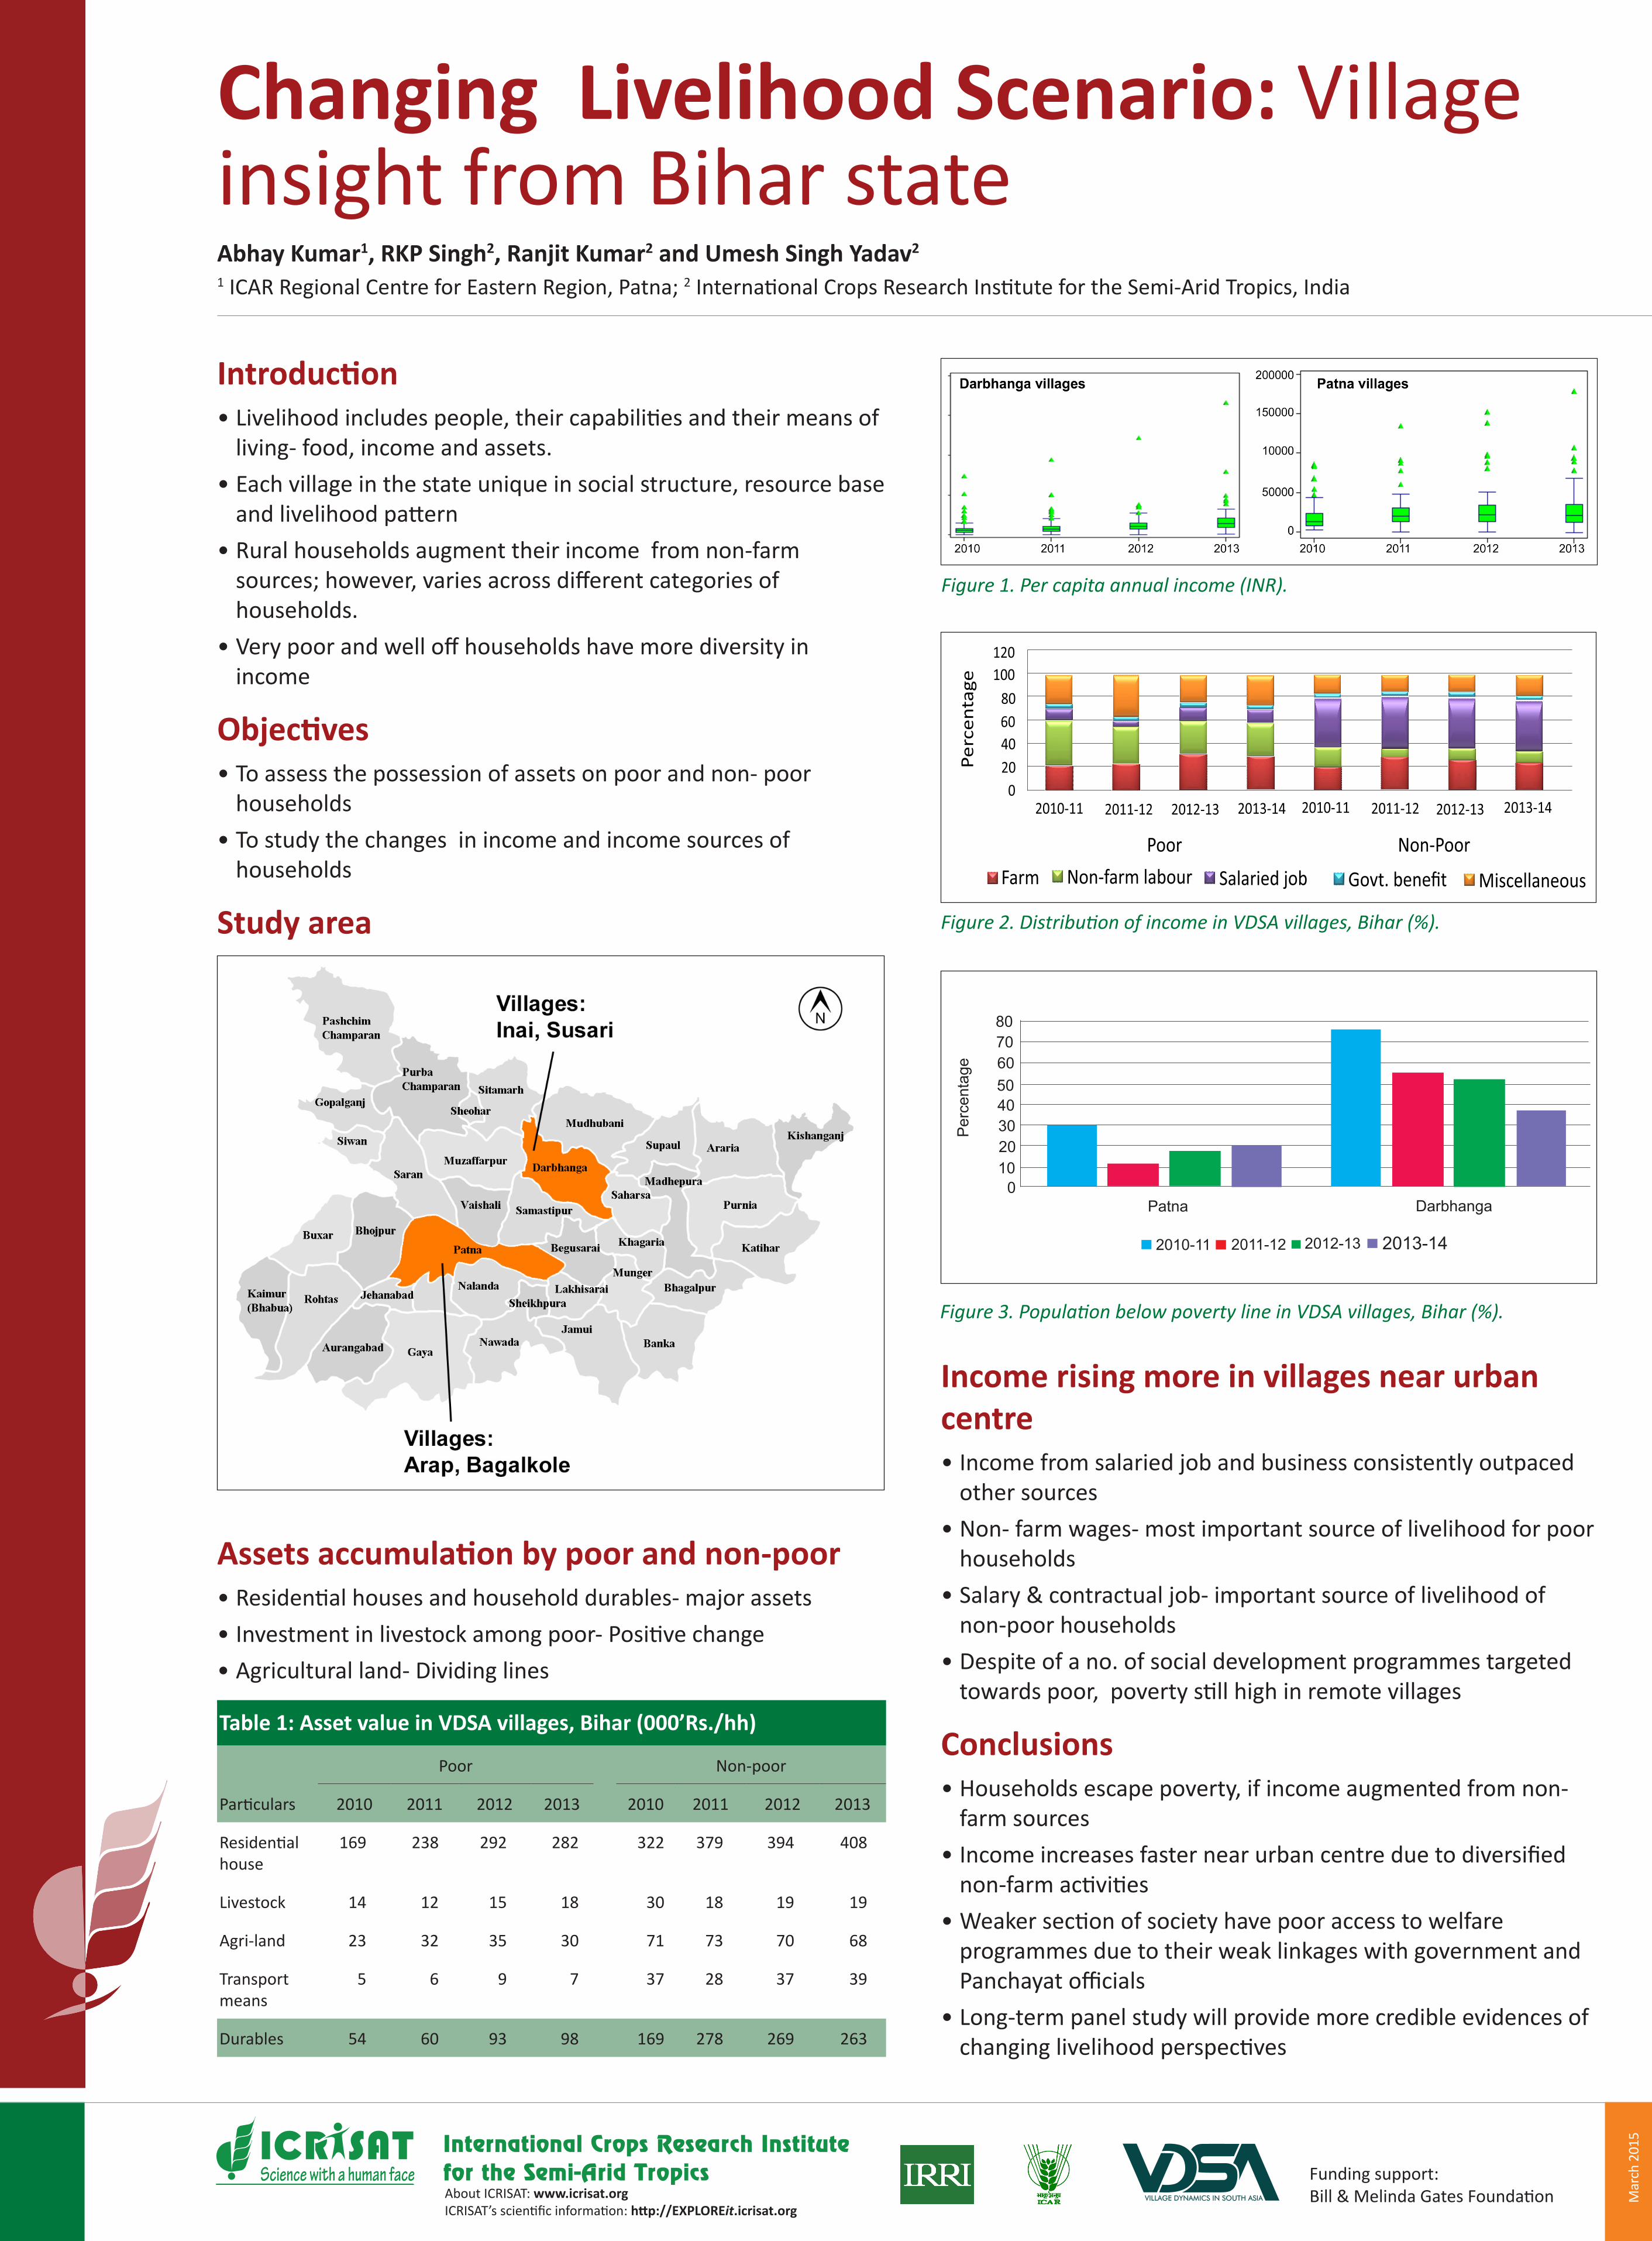
Changing Livelihood Scenario: Village insight from Bihar stateAbhay Kumar1, RKP Singh2, Ranjit Kumar2 and Umesh Singh Yadav2
Introduction•Livelihoodincludespeople,theircapabilitiesandtheirmeansof
living- food, income and assets. •Each village in the state unique in social structure, resource base andlivelihoodpattern
•Rural households augment their income from non-farm sources;however,variesacrossdifferentcategoriesofhouseholds.
•Verypoorandwelloffhouseholdshavemorediversityinincome
Objectives•To assess the possession of assets on poor and non- poor
households•To study the changes in income and income sources of
households
Study area
Income rising more in villages near urban centre•Income from salaried job and business consistently outpaced
other sources•Non- farm wages- most important source of livelihood for poor
households•Salary & contractual job- important source of livelihood of
non-poor households•Despite of a no. of social development programmes targeted towardspoor,povertystillhighinremotevillages
Conclusions•Households escape poverty, if income augmented from non-
farm sources•Incomeincreasesfasternearurbancentreduetodiversifiednon-farmactivities
•Weakersectionofsocietyhavepooraccesstowelfareprogrammes due to their weak linkages with government and Panchayatofficials
•Long-term panel study will provide more credible evidences of changinglivelihoodperspectives
Figure 2. Distribution of income in VDSA villages, Bihar (%).
Figure 3. Population below poverty line in VDSA villages, Bihar (%).
Science with a human faceAbout ICRISAT: www.icrisat.orgICRISAT’sscientificinformation:http://EXPLOREit.icrisat.org
VILLAGE DYNAMICS IN SOUTH ASIA
Funding support:Bill&MelindaGatesFoundation
1 ICAR Regional Centre for Eastern Region, Patna; 2InternationalCropsResearchInstitutefortheSemi-AridTropics,India
Assets accumulation by poor and non-poor•Residentialhousesandhouseholddurables-majorassets•Investmentinlivestockamongpoor-Positivechange•Agricultural land- Dividing lines
Table 1: Asset value in VDSA villages, Bihar (000’Rs./hh)
Poor Non-poor
Particulars 2010 2011 2012 2013 2010 2011 2012 2013
Residentialhouse
169 238 292 282 322 379 394 408
Livestock 14 12 15 18 30 18 19 19
Agri-land 23 32 35 30 71 73 70 68
Transport means
5 6 9 7 37 28 37 39
Durables 54 60 93 98 169 278 269 263
Figure 1. Per capita annual income (INR).


![Agartala10 Jharkhand Bihar Bihar[1]](https://img.pdfslide.net/doc/110x75/557d1b01d8b42a4f498b4d72/agartala10-jharkhand-bihar-bihar1.jpg)