Embed Size (px)
Citation preview

283Characteristics and
labour marketperformance of the new member state
immigrants in Finland,Germany, the
Netherlands and theUnited Kingdom afterthe enlargement of
2004
Mari KangasniemiMerja Kauhanen

PALKANSAAJIEN TUTKIMUSLAITOS • TYÖPAPEREITA
LABOUR INSTITUTE FOR ECONOMIC RESEARCH • DISCUSSION PAPERS
Helsinki 2012
283Characteristics and labour market performance of the new member state immigrants in Finland, Germany, the Netherlands and the United Kingdom after the enlargement of 2004*
Mari Kangasniemi**Merja Kauhanen***
*This study is part of the project ”Migrant Diversity and Regional Disparity in Europe” funded by NORFACE. (NORFACE-496, MIDIREDIE). Financial support from NORFACE research programme on Migration in
Europe – Social, Economic, Cultural and Policy Dynamics is gratefully acknowledged. We are also grateful to the participants of the Waikatoo ‘Economic Impact of Immigration and Population Diversity’ international workshop, ERSA 2012 conference, the 2012 Summer Meeting of Finnish economists in Jyväskylä, and the
seminar of the Labour Institute for Economic Research for useful comments. Any errors remain our sole responsibility. We would also like to thank Ville Vento for good research assistance.
** Labour Institute for Economic Research, Pitkänsillanranta 3A, 00530 Helsinki, Finland, [email protected]
*** Labour Institute for Economic Research, Pitkänsillanranta 3A, 00530 Helsinki, Finland, [email protected]

TYÖPAPEREITA 283DISCUSSION PAPERS 283
Palkansaajien tutkimuslaitosPitkänsillanranta 3 A, 00530 HelsinkiPuh. 09−2535 7330Sähköposti: [email protected]
Labour Institute for Economic ResearchPitkänsillanranta 3 A, FI-00530 Helsinki, FinlandTelephone +358 9 2535 7330E-mail: [email protected]
ISBN 978–952–209–113–0 (pdf)ISSN 1795–1801 (pdf)

1
Tiivistelmä
Euroopan unionin laajentuminen lisäsi muuttoliikettä uusista jäsenmaista vanhoihin EU-
maihin. Vertailevaa tutkimusta siitä, minkälaisia uusista jäsenmaista kotoisin olevat maahan-
muuttajat ovat piirteiltään eri kohdemaissa ja kuinka he ovat pärjänneet isäntämaiden työ-
markkinoilla on tehty toistaiseksi yllättävän vähän. Tässä tutkimuksessa selvitetään uusista
jäsenmaista tulleiden maahanmuuttajien koostumusta ja työmarkkinamenestystä Suomessa,
Alankomaissa, Saksassa ja Isossa-Britanniassa. Näiden maiden työmarkkinainstituutiot poik-
keavat toisistaan ja voivat osin vaikuttaa myös uusista jäsenmaista tulleiden maahan-
muuttajien työmarkkinatulemiin, joita tutkimuksessa mitataan työvoimaan osallistumisella,
työllisyydellä, työpaikan tyypillä ja ammatilla. Analyyseissa käytetään laajoja, työikäistä
väestöä edustavia Euroopan unionin työvoimatutkimuksia vuosilta 2004-2009.
Tulosten mukaan uusista jäsenmaista kotoisin olevien maahanmuuttajien työllisyyden toden-
näköisyys on alhaisempi verrattuna samanlaisiin isäntämaiden omiin kansalaisiin Suomessa,
Alankomaissa ja Saksassa, mutta Isossa-Britanniassa suurempi. Odotetusti maassaoloajan
myötä erot työllisyydessä kuitenkin kaventuvat Suomessa, Alankomaissa ja Saksassa. Maa-
hanmuuttajien heikommasta asemasta kertoo myös se, että he tekevät enemmän työtä
määräaikaisissa työsuhteissa ja heidän todennäköisyytensä työskennellä alemman koulutus-
tason ammateissa on suurempi kuin isäntämaiden kansalaisilla, kun havaittavissa olevien
taustatekijöiden vaikutus on huomioitu. Kuitenkin maiden välillä löytyy mielenkiintoisia eroja
siinä, kuinka paljon uusista jäsenmaista tulleiden maahanmuuttajien työmarkkina-asema poik-
keaa isäntämaiden kansalaisista ja muista maahanmuuttajaryhmistä. Maiden erilaiset työ-
markkinainstituutiot voivat osin selittää näitä eroja.
Abstract
There is little previous comparative research on how new EU member state immigrants
(NMS12) and their labour market performance differ across the old member states. This paper
extends the earlier literature by investigating NMS12 immigrants’ composition and labour
market performance in Finland, Germany, the Netherlands, and the United Kingdom, which
are characterized by considerable differences in their labour market institutions. These
institutional structures might also influence the labour market outcomes of NMS12

2
immigrants and these countries’ abilities to absorb immigrants. As measures of labour market
performance we use labour force participation, employment, type of employment, and
occupational attainment. We use pooled cross-sectional data from the European Union Labour
Force Survey from the years 2004-2009 in the analyses.
We find that NMS12 immigrants have, on average, a lower probability of employment than
similar natives in all other countries except for the UK. As expected with the time spent in the
host country, the employment gap between NMS12 immigrants and natives narrows in
Finland, Germany and the Netherlands. NMS12 immigrants seem not only to suffer from
lower employment (except in the UK), but the disadvantage NMS12 immigrants have in the
labour market also shows itself in the type of employment and occupations they hold.
NMS12 immigrants work more often as self-employed (except in Finland) and in temporary
jobs which are often combined with poorer job quality than regular jobs. In addition, NMS12
immigrants’ likelihood of working in elementary occupations is higher in all four countries.
Nonetheless, we also detect interesting differences among the countries in how much the
NMS12 immigrants’ labour market position deviates from that of similar natives with regard
to the type of employment and occupational attainment which can partly be explained by
institutional differences among these countries.
Keywords: new EU member states, composition of immigrants, labour market outcomes,
labour force participation, employment, self-employment, occupational attainment, role of
institutions
JEL code: J61, F22
1. Introduction
The EU enlargement of 2004 in which eight Central and Eastern European countries together
with Cyprus and Malta joined the European Union considerably increased immigration from
the new member states to most of the old member states. From the year 2003 to the year 2007
the number of foreign residents from the EU8 in the EU15 countries increased from almost
893,000 to more than 1.91 million (Brücker et al., 2009). After the enlargement the old EU
member states could adopt so-called transitional arrangements that limited access of the EU8
citizens to the labour market of the old member states up to a maximum of seven years.

3
Despite these limitations to the free movement of the EU8 workers, the main determinants of
substantial East-West migration flows were labour market factors such as higher wages,
opportunities to find a suitable job, and better working conditions (e.g. Fouarge and Ester
2007; Bonin et al. 2008).
One of the most important policy issues related to immigration is the labour market
performance of immigrants in the host country. The more successful the immigrants are in the
host labour market, the higher will be their net economic and fiscal contribution to the host
economy (Algan et al., 2009). However, there is still surprisingly little research, especially
from a comparative perspective, on how immigrants from the new EU member states have
fared in the labour markets of the old member states and whether the composition of the
immigrants has varied across the old EU member states since the EU enlargement.
The existing empirical literature is mainly focused on some single countries and does not
typically consider the role of institutions in the host country’s ability to absorb immigrants
from the new member states. Yet, according to the previous empirical literature (see Arpaia
and Mourre 2009 for a review) labour market institutions have both direct and indirect
influences on a country’s labour market performance both alone and in interaction with
macroeconomic shocks. Institutions may also influence the assimilation of immigrants. For
example, Antecol et al. (2006) argue that labour market institutions are as likely to affect the
form that assimilation takes (in particular, the distinction between wage and employment
adjustments) as its overall level. Relatively inflexible wages and generous unemployment
insurance may therefore direct assimilation to occur primarily through employment and not
wages.
This paper contributes to the earlier literature by investigating the composition of the new
member state (NMS12 hereafter) immigrants and their labour market performance across four
old EU member states – Finland, Germany, the Netherlands, and the UK. The other
contribution is that we also consider the role that institutions of these countries might play in
this. We use several measures of labour market performance such as labour force participation,
employment, type of employment, and occupational attainment to study relative labour
market performance of the new member state immigrants in comparison to other immigrant
groups and natives. We also study the employment assimilation of NMS12 immigrants in
comparison to similar natives with the time spent in the country. The data used in the analyses

4
are pooled individual-level data from the European Union Labour Force Survey (ELFS) from
the years 2004-2009 for these four countries.
These four countries provide an interesting case for a country comparison as they are
characterized by different institutions as regards their labour market and welfare state. (See
Table 1 for different indicators.) The UK labour market can be described as flexible, with a
low level of employment protection and generally market-based wage setting, although there
is a set minimum wage level. In the UK and Germany the low wage intensity is also the
highest of the four countries. Germany is characterized by strict employment protection
(strictest of the four countries), industry-level bargaining, a relatively low union membership
density, and no national minimum wage. The Netherlands also features industry-level
bargaining, a relatively low union membership density, and a statutory minimum wage, but
the coverage of the collective bargaining is quite high. The level of employment protection is
higher than in the UK but lower than in Germany. Of these four countries Finland has the
highest coverage of collective bargaining and union density. The strictness of employment
protection is about the same as in the Netherlands. The level of unemployment benefits is
higher in Finland compared to the Netherlands and the UK, but quite similar to the level in
Germany. Finland also has the lowest incidence of low pay employment compared to the
other three countries.
(Table 1 around here)
In addition to institutional differences, these four countries adopted different transitional
arrangements that might influence not only the extent but also the composition of the
immigrants. After the 2004 EU enlargement the UK opened access to its labour markets
immediately with no or mild transitional restrictions from the beginning of 1 May 2004.
Finland and the Netherlands were among the eight old member states who during the second
phase, i.e. the three years from 2006 to 2009, gave EU8 workers free access to the labour
markets (Finland in 2006 and the Netherlands in 2007). Germany, together with Austria,
continued to apply substantial restrictions to labour market access until May 2011. (European
Commission)
The main findings of this study suggest that NMS12 immigrants have a lower probability of
employment than natives in all other countries except the UK, where NMS12 immigrants’

5
probability of employment is even higher than natives’. In the other three countries the
employment differential varies from 5.7 percentage points in Finland to 16.1 percent points in
the Netherlands. The disadvantage NMS12 immigrants have in the labour market also shows
in the type of employment and occupations they hold. In comparison to similar natives
NMS12 immigrants work more often as self-employed (except in Finland) and in temporary
jobs which are which are often combined with poorer job quality than regular jobs. They also
have a higher likelihood of working in low-skill jobs in comparison to similar natives in all
the four countries. Nonetheless, we also detect interesting differences among the countries in
how much the NMS12 immigrants’ labour market position deviates from that of similar
natives and other immigrant groups with regard to the type of employment and occupational
attainment which can partly be explained by institutional differences among these countries.
The paper proceeds in the following manner. Section 2 gives a brief summary of the previous
literature. Section 3 describes the data and the methodology used in the empirical analyses.
Section 4 presents results from the statistical models for the four countries. Section 5
concludes.
2. Previous literature
There is an extensive literature on immigrants’ labour market performance from different
countries, in particular from countries with large immigrant populations. The assimilation
literature beginning with the seminal studies of Chiswick (1978) and Borjas (e.g. 1985, 1995)
has typically measured the labour market performance of immigrants with earnings and/or
employment. In addition, labour force participation, the type of employment, and
occupational attainment has been studied in the earlier literature.
The assimilation hypothesis states that immigrants suffer an initial earnings/employment
disadvantage because they have lower host country-specific capital, which impacts their
productivity. With the years of residence in the host country this gap should get narrower
because immigrants obtain host country experience, learn the local labour market customs,
and learn the local language (e.g. Chiswick 1978, Borjas 1999). The speed of assimilation
depends on how much immigrants invest in this human capital. Comparing the labour market
outcomes between immigrants and natives is not, however, straightforward, due to selective
6
outmigration and differing selection into employment (Bellemare, 2003). The existence of
local networks may also impact immigrants’ success in host countries´ labour markets (Nekby,
2002). A large existing immigrant population from the same country (for example Poles in the
UK) may considerably ease the entry of the new immigrants because of lower psychic costs,
better information channels, and more efficient job search by using immigrant networks.
As regards the impact of language proficiency on labour market performance, interestingly,
earlier research has found differences among host countries. For example, Dustmann and
Fabbri’s (2003) results support the importance of language proficiency for the labour market
outcomes. With the UK data they find a positive relationship between language proficiency
and employment/earnings. Euwals and Dagevos (2007) find no effect of language proficiency
on employment probability in Germany, whereas good language skills improved immigrants´
labour market position in the Netherlands considerably. Good language proficiency in the
host country’s language was, nonetheless, significantly related to the quality of the job in both
countries measured by the wage level and the education required for the job.
There is very little previous research on the role of single institutional features on immigrants’
labour market performance. One of the few exceptions is Sa (2008), which studies the impact
of employment protection regulation (EPL) on natives’ and immigrants’ employment. The
paper presents evidence from the EU LFS that stricter EPL on permanent contracts reduces
the employment of natives. It has, however, a positive impact on the employment of
immigrants if they have resided in the country for more than six years. Unlike its effect on
natives, EPL does not have any effect on hiring and firing immigrants. Evidence from reforms
in Spain and Italy shows that reductions in EPL increase the hiring of natives but have a much
smaller impact on immigrants.
Regarding the labour market performance and composition of immigrants from the new
member states there are a few empirical studies and they mainly focus on a single country.
Some of the research also concerns the time before the EU enlargement of 2004. For example,
Nekby (2002) finds from Swedish annual data (1990-2000) that Eastern European immigrants
in Sweden have, on average, 13–15 per cent lower employment probability than similar
immigrants from the other Nordic countries. Nekby’s results suggest that with the time spent
in Sweden the employment probability of Eastern Europeans increases by up to 15–25 years

7
in the country, but even after that the employment probability remains lower than that of
comparable natives.
The majority of the studies on the labour market performance of immigrants from the new
member states (which also include the period after the EU enlargement) concern the UK (e.g.
Clark and Drinkwater 2008, Blanchflower and Shadforth 2009, Drinkwater et al. 2009,
Longhi and Rokicka 2012) and Germany (e.g. Brenke et al. 2009, Kogan 2011).
Recent studies with the UK data have found that the NMS immigrants do not suffer an
employment penalty in comparison to similar natives. Clark and Drinkwater (2008)
discovered that the employment rate of the recent A8 immigrants in 2004-2007 was not
significantly different to that of the native born. Blanchflower and Shadforth (2009) detected
that NMS8 immigrants had a higher probability of employment than the native population, in
particular the recent immigrants in the period 2004-2007. Although recent NMS immigrants
have not suffered from an employment penalty, they have had a disadvantaged position
compared to the comparable natives in terms of wages. Drinkwater et al.’s results show
(2009) that a majority of the NMS immigrants have found work in low-paying jobs despite
the fact that some immigrants (especially Poles) have relatively high levels of education. A
similar result has also been obtained by Anderson et al. (2006).
As regards results with German data, Brenke et al. (2008) found that recent EU8 immigrants
were substantially less likely to be employed as wage and salary earners, but, relative to
natives, they were clearly more likely to be self-employed. They also suffered from a
substantial wage penalty in comparison to similar natives. Algan et al.’s (2009) study of first
and second generation immigrants´ performance in Germany, the UK and France also
observes that Central and Eastern Europeans experience a substantial labour market
disadvantage in Germany compared to natives. For women the disadvantage is greater than it
is for men. In addition, Kogan’s (2011) results show that despite higher levels of education
immigrants coming from Eastern Europe have difficulties in getting their level of education
recognised and adequately rewarded in the German labour market. The difficulties of
transferring skills by highly educated immigrants have also been detected in earlier research
such as that by, for example, Bauer and Zimmermann (1999). Their study of the occupational
mobility of ethnic Germans suggests that highly educated immigrants experienced a
downward occupational mobility more often than the lower educated.

8
One of the few country comparisons is that by Münz (2008), which deals with the relative
labour market performance of NMS immigrants and other immigrants with the EU labour
force survey data from the year 2005 across different European countries. His descriptive
analysis suggests that immigrants (measured by country of birth) from the new member states
which joined the EU in 2004 have, on average, slightly higher employment rates as well as
participation rates than the EU15 immigrants. Münz also finds that while NMS8 immigrants
are under-represented in highly and medium skilled non-manual occupations, they are
overrepresented in skilled and especially non-skilled manual jobs. A high level of education
seems not to be linked to a higher employment rate among immigrant males. This supports
the hypothesis that NMS12 immigrants’ high level of education is less transferable than lower
levels of education.
3. Data and methodology
3.1 Data
To study the labour market performance and characteristics of the NMS12 population in
Finland, Germany, Netherlands, and the UK after the EU enlargement we use annual
individual-level European Union Labour Force Survey data (LFS) from the years 2004-20091
for the four countries. The EU labour force survey is a representative and continuous cross-
sectional survey which includes information on a wide range of variables like household and
personal characteristics, education, and labour market status. The survey is formed by putting
together the 15 national labour force surveys conducted by the Member States. We constrain
our analysis to individuals whose ages range from 15 to 64 years.
Due to the recording of the same set of characteristics in each country, a close correspondence
between the EU list of questions and the national questionnaires, the use of the same
definitions and common classifications for all countries, and Eurostat centrally processing the
data, the degree of comparability of the EU Labour Force Survey results is considerably
higher than that of any other existing set of statistics on employment or unemployment
1 As the data do not include information on NMS12 immigrants prior to 2004 we are not able to study the labour
market performance of NMS12 immigrants before and after the 2004 enlargement.

9
available for Member States (Charlier and Franco, 2001). The LFSs are also unique among
survey data for the length of the time-series they offer, for the rich set of economic and social
variables that are measured in conjunction with migration, and for the large sample sizes in
each country.
However, there are some limitations of the data when one analyses immigrant labour market
outcomes. First, a prerequisite for participating in the survey is that a person has lived or has
the intention to live in that country for at least a year. Therefore it is possible that this type of
survey under-samples recent immigrants (Clark and Drinkwater, 2008). Second, because of
confidentiality concerns and too few respondents from a single country there are only
aggregated country codes available for an immigrant’s country of birth or citizenship. This
implies that we have to analyse all new member state immigrants that joined the union in
2004 and in 2007 together. In addition, the data lack information on wages for most years and
countries. Due to this we are unable to study wage differentials and wage assimilation, which
are significant indicators of both labour market performance and assimilation. As LFS is a
cross-sectional data set in nature we are not able to control for the impact of unobserved
heterogeneity in our analyses.
We define immigrant status according to the nationality on which information is available for
all the countries we use in our analyses. We use this definition because the data do not include
information on the country of birth for Germany2. See Angrist and Kugler (2001) about the
implications of defining immigrant status based on nationality versus country of birth. Labour
market status is defined in the data on the basis of the ILO recommendations.
3.2 Methodology
In the empirical analysis we use several outcome variables such as labour force participation,
employment, type of employment, and occupational attainment to measure the labour market
performance of NMS12 immigrants in comparison to similar natives and other immigrant
groups. For this purpose we estimate simple probit binary response models with the following
structure:
2 We also used the alternative definition of immigrants’ status based on the country of birth for Finland, the
Netherlands and the UK in the analyses. The results did not change much.

10
yi*= βXi + εi,
yi*
is the latent outcome variable of y (denoting different labour market outcomes except for
occupational attainment), which is not observed. It is measured by binary categorical variable
yi which takes values 1 and 0:
yi = 1 if yi* > 0,
= 0 if yi* ≤ 0,
Xi is the vector of covariates which includes observable individual-specific characteristics
such as gender, age, marital status, educational level and immigrant status, and dummy
variables denoting urbanisation of the region, the region of residence3 and year dummies. β is
the vector of coefficients associated with the X. εi is the error term that is normally
distributed.
To study occupational attainment outcomes we reclassify occupations into three groups by
ISCO skill level: (i) 3rd and 4th skill level (‘high’) occupations corresponding to lower and
upper tertiary education, (ii) second skill level (‘medium’) occupations corresponding to
secondary education, and (iii) first skill level (‘low’) occupations corresponding to primary
education. As there are more than two occupational groups (i.e. occupational outcomes) we
use a multinomial logit model. The probability of being in occupational group j (j=1,2,3)
conditional on observed characteristics Xi that vary among individuals can be expressed as:
P(y = j| Xi )=exp(Xiβj)/1
exp( )J
i k
k
X β=
∑
4. Results
4.1 Trends in the shares of NMS12 immigrants and their composition
As can be seen in Figure 1, all the four countries experienced an increase in the NMS12
population after the EU enlargement in 2004. The increase in the share of immigrants from
3 As immigrants more often settle in areas where labour market outlook is the best, it is also important to control
for the region of residence in the regressions.

11
the accession countries has been largest in the UK, where the share increased over fourfold
during the period 2004-2009. The share of immigrants from the new accession countries has
also risen in Finland, Germany and the Netherlands, but the upward trend has not been as
steep as it has been for the UK. It is noteworthy that the share of NMS12 immigrants out of
the total immigrant population (mainly Estonian immigrants) was already relatively high in
Finland before the EU enlargement due to a fairly long history of Estonian immigration to
Finland (Kangasniemi and Kauhanen, 2012). Interestingly, East-West migration seems to
have increased even in Germany although it adopted the longest possible transition period and
did not allow free movement of workers from the new member states until the beginning of
May 2011.4
(Figure 1 around here)
In our country comparison we are particularly interested in investigating whether the
composition of NMS12 immigrants differ across the four countries. Economic theories such
as human capital theory, theories on skills transferability and on immigrant selection (Borjas
1987, Chiswick 1978) provide explanations on why and how migrants differ from natives,
how these differences depend on the characteristics of source and host countries. For example,
in the Roy model the choice of the country depends on the level of individual ability, how
returns to ability are correlated among countries, and how abilities are distributed in each
country. Borjas (1987) concluded that if the skills are transferable, immigrants from a lower
inequality country should be positively selected and immigrants from a higher income
inequality country negatively selected. Transferability of human capital may depend on
similarities and differences among countries, especially language and their education systems
as well as less well defined features such as culture. The human capital investment approach
also suggests that labour immigration is directed towards countries in which work experience
that is gained is most valued in the home country. (Tassinopoulos and Werner, 1999).
As has already been pointed out, the main motives for East-West migration have been work-
related, which might be expected to be reflected in the composition of NMS12 immigrants in
these four countries too. In addition, in the earlier research, language and cultural barriers
(Bonin et al., 2008) as well as geographical distances, migrant networks and scale (Zaizeva
4 The movement of workers from Malta and Cyprus was free from 2004 onwards. Bulgarians and Romanians
will have to wait until 2014 to work without a work permit in Germany.

12
and Zimmermann, 2008) have been found to play an important role in the selection of the host
country for the new member state immigrants.
Table 2 presents characteristics of NMS12 immigrants, EU15 immigrants and other
immigrants5, and natives in each country during 2004-2009, which have been calculated from
the European Union labour force survey data. It is good to remember that the characteristics
concern the whole of the NMS12 immigrant populations in the host countries, also including
those immigrants that have lived in the host country before the enlargement.
We can notice that in the UK there is a slight majority of men among NMS12 immigrants. In
contrast, females dominate NMS12 immigrants in the other three countries. In the
Netherlands even as many as three NMS12 immigrants out of four are women and in Finland
and Germany approximately two out of three NMS12 immigrants are women. The gender
division of EU15 immigrants and other immigrants is much more even in these countries
except for Finland where EU15 immigrants are predominantly men.
The age structure of the NMS12 immigrants is favourable regarding participation in the
labour force. NMS12 immigrants are, on average, younger compared to natives in all the
countries, the difference being around 8-10 years in the Netherlands and the UK and around
four years in Finland and Germany. The majority of the immigrants are at their best working
age, which is not surprising if the main motives for NMS12 immigrants to come to the
destination countries are work-related. NMS12 immigrants are also, on average, younger
compared to the other two immigrant groups, especially in comparison to EU15 immigrants.
There are more often married NMS12 immigrants in Finland and Germany than in the
Netherlands and the UK, which is partly explained by the younger average age of NMS12
immigrants in the latter two countries.
In the self-selection of the NMS12 immigrants with respect to education we can detect
interesting differences among the countries. The Netherlands and Germany seem to have
attracted relatively highly educated NMS12 immigrants in comparison to natives, whereas in
Finland and the UK the share of highly educated NMS12 immigrants is clearly lower and the
share of low educated higher than among the natives. The largest educational group of the
5 Includes all other immigrant groups apart from those that are citizens of the NMS12 or EU15 countries.

13
NMS12 immigrants is, however, those with ‘medium’ level education in all the four countries.
In comparison to EU15 immigrants, NMS12 immigrants are less educated in Finland and the
UK, but approximately as well educated in Germany and the Netherlands. On the other hand,
NMS12 immigrants are more educated than other immigrants in these two countries.
Selection of the NMS12 immigrants with respect to education can partly be related to existing
networks of immigrants in the host countries. For example, McKenzie and Rapoport (2007)
suggest that larger migration networks tend to increase the likelihood of negative self-
selection with respect to education. The transferability of skills may also play a role in this. In
the case of Germany the restrictions for free access to the German labour market and special
work permits for certain services are likely to have influenced the educational selection as
well.
It has to be borne in mind that only immigrants who have stayed or intend to stay in the host
country for at least a year are recorded in the LFS. Hence, it is possible that there are more
immigrants with a lower level of education in the work force than these figures show, since
many of those immigrants work only seasonally or irregularly abroad (Münz, 2008).
Immigrants tend to settle more often in areas where the labour market outlook is the best, i.e.
in densely populated areas, i.e. in cities. This also applies to NMS12 immigrants as well as to
two other immigrant groups in all four countries.
(Table 2 around here)
4.2 Employment and labour force participation
Employment
Figure 2 shows ‘raw’ employment rates for NMS12 immigrants, EU15 immigrants, other
immigrants, and natives for the years 2004–2009 in each of the four host countries without
controls. Apart from the UK, NMS12 immigrants’ employment rates are lower compared to
the native working-age population in all the three countries. However, the gap is not very

14
large in Finland6. Interestingly, NMS12 immigrants’ average employment rates in the UK
were higher than the natives’ rates during 2004-2009. NMS12 immigrants also have a lower
employment rate in comparison to EU15 immigrants in the other countries except the UK.
However, their employment rates are substantially higher than those of other immigrants in all
four countries.
(Figure 2 around here)
Controlling for the observable background characteristics, we still detect that NMS12
immigrants have a lower probability of employment in all other countries except the UK in
comparison to natives (see Figure 3). The employment differential varies from 5.7 percentage
points in Finland to 16.1 percent points in the Netherlands. In the UK the employment gap is
around seven percentage points in favour of the NMS12 immigrants. We also observe that
NMS12 immigrants have a lower employment probability in comparison to similar EU15
immigrants but a higher employment probability in comparison to similar ‘other’ immigrants.
Our results related to the UK are in accordance with Blanchflower and Shadforth (2009), for
example, who found NMS10 immigrants to have a clearly higher propensity to work than the
native population. They are also consistent with Brenke et al. (2009), who found a negative
wage differential between NMS8 immigrants and the native population in Germany.
How immigrants fare in terms of labour market outcomes is influenced by the extent to which
their existing levels of education, experience and training are valued in the host country. The
institutional differences among the countries and the knowledge of the host country language
may partly explain the different relative employment outcomes of the new member state
immigrants in the four countries. The results presented above suggest that NMS12 immigrants
in the UK have not suffered from an employment disadvantage in comparison to similar
natives, unlike the situation in the other three countries. It is plausible that NMS12
immigrants have at least some knowledge of English and therefore they may be in a slightly
more advantageous position in the UK compared to their peers in the other countries. On the
other hand, the UK has the highest incidence of low pay (together with Germany) of the four
6 Due to the fairly small number of immigrants in the LFS surveys, the standard errors of means are quite large,
especially in Finland’s case, which must be taken into account when one is looking at the annual employment
rates.

15
countries. According to Mason and Salverda (2010), a higher share of low wage jobs may
offer more opportunities to immigrants and serve as a stepping stone to the labour market.
In the case of Germany, NMS12 immigrants’ lower employment probability in comparison to
similar natives may be influenced by the German legal regulations such as the German
priority law whereby a native applicant takes priority over a foreigner when filling a job
vacancy. The same law may also partly explain the higher employment of the EU15
immigrants, as EU15 immigrants also enjoy preferential treatment according to this law
(Kogan, 2011). In Finland the NMS12 immigrants’ employment gap in comparison to natives
was not as big as in Germany and the Netherlands. The majority of NMS12 immigrants are
Estonians and they may also benefit from the proximity of the Finnish and Estonian languages,
which gives them better capabilities to learn Finnish. Information on the host country’s labour
market is important for the outcomes as well. The information problem for migrants may be
larger, the further apart, both in distance and in culture, the host and source countries are
(Bijwaard, 2008)7.
(Figure 3 around here)
Employment assimilation over time spent in the country
The relative employment performance of NSM12 immigrants evaluated at the average time of
stay in the host country during the period 2004-2009 does not give information about how
their adaptability in the host country labour market develops with the time spent in the host
country. We therefore also estimated an employment probability model which includes
dummy variables that group NMS12 immigrants by the years of residence in the host country
(under two years, 3-5 years, 6-10 years, and over 10 years). We use similar natives as a
comparison group. Table 3 outlines the results of the impact of time in the host country on the
7 We also estimated employment probability models where we included separate covariates for NMS12 arrival
cohorts that immigrated before the EU enlargement (in 2000-2003) and after it. Our results suggest that both
cohorts of NMS12 immigrants in the UK had a higher employment probability in comparison to similar natives,
especially the recent immigrant cohort. But this difference between the two cohorts was not statistically
significant. In Germany and Finland there was no statistically significant difference in the employment
probability between the arrival cohorts either. Instead, recent NMS12 immigrants in the Netherlands (who
arrived after the 2004 enlargement) had a lower probability of employment in comparison to similar natives.
This difference was around seven percentage points larger for the recent NMS12 cohort than the corresponding
difference for the earlier NMS12 cohort.

16
employment probability of the NMS12 immigrants in comparison to similar native-born
workers.
We find interesting differences in the assimilation profiles among the countries. The greatest
employment disadvantage for recent (under two years since entry) NMS12 immigrants is in
the Netherlands and the smallest in Finland in comparison to similar natives. Even recent
NMS12 immigrants in the UK have a higher employment probability compared to natives. As
predicted by the assimilation hypothesis with the time spent in the host country, the
employment gap between NMS12 immigrants and similar natives becomes narrower in
Finland, Germany and the Netherlands. However, the speed of assimilation seems to vary
among the three countries, because after ten years of residence the differences in the NMS12
immigrants’ employment probabilities are narrower among the countries.
In the UK the assimilation pattern is, however, different: recent immigrants have a higher
probability of employment in comparison to natives. After six to ten years of residence in the
UK the employment gap is no longer statistically significantly different. Those NMS12
immigrants that have stayed over ten years in the country have a lower probability of
employment compared to natives8.
It is important to bear in mind that these results should be interpreted with caution due to
limitations of our time effect analysis. First, we are not able to control for the impact of the
outmigration of immigrants, which might bias the adaptation results. Those who do not find a
job may leave the country, i.e. there might be selective outmigration of immigrants. Hence the
differences in employment rates can underestimate immigrants´ disadvantage in the host
country labour markets. In the case of the UK access to social benefits is restricted for the
citizens of the new member states, which may induce those who do not find a job to leave the
country. The results are also likely to be sensitive to cohort effects (the initial position of
immigrants who arrive at different times), which might also partly explain the UK results
above. The relatively small number of observations for immigrants might also influence the
dynamic analysis. Analysing employment assimilation does not take into account the quality
of jobs that immigrants hold either.
8 This might also be due to the differences between the immigrant cohorts.

17
(Table 3 around here)
Labour force participation
The ‘raw’ labour force participation rates of NMS12 immigrants are quite close to the
participation rates of the native population in Finland and Germany, while in the Netherlands
NMS12 immigrants have a distinctly lower participation rate, and in the UK they have a
higher participation rate (Figure 4). In comparison to EU15 immigrants, NMS12 immigrants
participate less in the labour market in other countries except the UK. Again, NMS12
immigrants have higher participation rates compared to other immigrants. The differences in
labour force participation rates are likely to be influenced by the differences in the age
structures of immigrants and natives and the gender division. Women tend to participate less
in the labour market than men, and the lower participation rates of the NMS12 immigrants
can partly be due to the higher share of women among the NMS12 population, in particular in
the Netherlands.
(Figure 4 around here)
Controlling for the impact of observable background characteristics we still find statistically
significant gaps in labour force participation between NMS12 and similar natives in all the
countries. The labour force participation differential is largest in the Netherlands, 11.4
percentage points in favour of the native population. In the UK the corresponding gap is
around six percentage points and in Finland 5.7 percentage points in favour of natives.
In comparison to EU15 immigrants, NMS12 immigrants have lower participation
probabilities in Germany and in the Netherlands, but distinctly higher participation
probabilities than other immigrants. The relatively high labour force participation rates of
NMS12 immigrants are not surprising, as (according to previous studies) the most important
reasons for migrating for the new member states’ immigrants are employment-related.
(Figure 5 around here)

18
4.3 Type of employment
Analysing employment performance does not take into account the quality of jobs that
immigrants hold and therefore is not sufficient to describe the immigrants’ labour market
position in the host country labour market. We also need to analyse the type of jobs (self-
employed/employee, permanent/temporary, full-time/part-time) that NMS12 immigrants have
for this purpose. The data show that, on average, NMS12 immigrants tend to work more often
than natives as self-employed or in less secure contractual arrangements such as temporary
jobs, which are often combined with poorer job quality. But there are interesting differences
among the countries to what degree this applies.
Regarding self-employment the shares of self-employed persons among the NMS12
population are higher than among the other two immigrant groups and natives in Germany,
the Netherlands and the UK. In Germany this is not surprising, as self-employed workers
from A8 countries were exempt from the immigration restrictions (Brenke et al., 2009).
Controlling for the observable characteristics, NMS12 immigrants have a 4.9 percentage
points higher probability to work as self-employed persons in comparison to similar natives in
Germany (see Table 4). Correspondingly, NMS12 immigrants in the Netherlands and in the
UK have 5.2 and 3.9 percentage points higher self-employment propensities. In turn, in
Finland, NMS12 immigrants’ propensity of working as self-employed persons is not
statistically significantly different from that of the natives. In Finland, of the three immigrant
groups only the group ‘other immigrants’ has a higher probability of self-employment
compared to similar natives. Self-employment can be an important aspect of the immigrant
experience in the labour market and may provide a channel for immigrant assimilation
(Borjas, 1986). The differences among the countries may reflect varying opportunities to
work as self-employed persons or the opportunities to become employed as an employee.
The overall level of temporary employment in the host country is influenced by the strictness
of employment protection legislation. The level of employment protection is also likely to
influence the type of jobs that are available for immigrants. It is well known that recently
arrived migrants are usually more likely to be in temporary employment, which is often a way
of entering the labour market (OECD, 2012). A high incidence of fixed-term employment
among specific groups such as immigrants, and young workers, etc. has also been interpreted

19
as a sign of labour market dualism with some workers able to find stable career and well-paid
jobs and others failing to do so (OECD, 2012). Temporary jobs also tend to pay less than
permanent jobs and offer weaker social security (less access to paid vacations, sick leave,
unemployment insurance and other benefits), and limited career prospects.
The shares of NMS12 immigrants in fixed-term jobs are substantially higher than for the
natives in Germany, the UK and the Netherlands. In the UK the share of temporary contracts
is over twice as high and in the Netherlands 2.6 times as high as the corresponding share of
those contracts among natives. However, the incidence of temporary employment among
NMS12 immigrants is lowest in the UK, which has the least strict employment protection
legislation of these four countries and the lowest overall level of temporary work.
When controlling for the impact of observable characteristics we find largest differences in
the probability of temporary employment between NMS12 immigrants and natives in the
Netherlands (20.3 percentage points) (see Table 4). The second highest difference is in
Finland, where NMS12 immigrants have a 9.6 percentage points higher likelihood of working
in a temporary job instead of a regular job in comparison to similar natives. In Germany and
the UK NMS12 immigrants have, respectively, a 7.8 and 5.9 percentage points higher
probability to work in temporary employment than natives.
Interestingly, the differential in the likelihood of temporary work between NMS12
immigrants and natives is closer to the corresponding differential between other immigrants
and natives in Germany, the Netherlands and the UK, whereas in Finland NMS12
immigrants’ and EU15 immigrants’ propensities are closer to each other. In terms of job
stability and job insecurity (as measured by temporary work) NMS12 immigrants’ labour
market position seems to more closely resemble that of the other immigrants in the other
countries except for Finland.
It is noteworthy that a temporary job may also be a voluntary choice if the immigrant plans to
return or re-migrate within a relatively short period of time, and this might also show in the
higher incidence of temporary work among the immigrant population.
Unlike the case of temporary work, NMS12 immigrants do not have a higher incidence of
part-time work in comparison to natives in all four countries. Part-time work among the

20
NMS12 immigrants is considerably higher than the corresponding share among native
workers in Germany, but the opposite is true in the Netherlands and particularly in the UK.
Including controls, NMS12 immigrants have a 5.3 percentage points higher likelihood of part-
time work in Germany and a 6 percentage points higher likelihood in Finland, whereas their
likelihood of part-time work in the Netherlands and the UK is 15.1 and 9.7 percentage points
lower (see Table 4). Similarly as in the case of temporary work in Germany, NMS12
immigrants’ propensity of part-time work resembles that of the other immigrants. In the
Netherlands and the UK NMS12 immigrants have the smallest propensity of part-time work
of all immigrant groups in comparison to natives.
(Table 4 around here)
4.4 Occupational attainment
Another indication of the position of the immigrants in the host country labour market is their
occupational attainment. Occupational distribution is one way to measure to what extent
similarly skilled immigrants and natives are exposed to comparable employment opportunities
(Card 2001, Amuedo-Dorantes and De la Rica 2008). For this purpose we first calculate the
Duncan Dissimilarity Index between NMS12 immigrants and natives:
,
1
1
2
kk k
i nj
I N
I ND
=
= −∑
where Ik/I is the percentage of NMS12 immigrants in occupation k and Nk/N is the
corresponding percentage of natives in occupation k. The index ranges from 0 (total
integration) to 1 (total segregation).
The higher the Duncan Dissimilarity Index, the more dissimilar is the occupational
distribution of immigrants and native population. Table 5 reports the dissimilarity index in
occupations (ISCO1D classification) by educational level in the four countries during 2004-
2009. The dissimilarity index shows that occupational differences between NMS12
immigrants and natives are greatest in the UK where the index obtains the value 0.36. This
means that 36 percent of the NMS12 immigrants in the sample would have to change their
21
occupation for immigrants and natives to have the same distribution. The lowest value of the
index is in Finland, where only 14 percent of the NMS12 immigrants would have to change
their occupation for immigrants and natives to have the same distribution.
The Duncan Dissimilarity Index calculated by educational levels shows that the differences in
occupations are highest among the highly educated in Finland and the UK and among those
with upper secondary level education in Germany and the Netherlands. In all the countries the
differences in occupations are smallest for the low educated group, which would seem to
indicate that highly educated NMS12 immigrants have more problems in their skills
transferability or they may choose ‘jobs with instant financial returns (i.e. ‘lower-status’ jobs)
if they do not intend to stay in the host country for a long time (Kogan, 2011).
(Table 5 around here)
The Duncan Dissimilarity Index showed that NMS12 immigrants’ occupational distribution
differs from that of the natives. Compared to natives, NMS12 immigrants are also over-
represented in elementary occupations as shown by Table 6. This cannot be solely explained
by the differences in educational composition between NMS12 immigrants and natives. Of
the four countries the share of the NMS12 immigrants in elementary occupations is largest in
the UK, where over a third of the NMS12 immigrants work in these occupations. They work
in elementary occupations over three times more often than natives. In Germany around one
fifth of the NMS12 immigrants work in elementary occupations, which is around 2.6 times
higher than the share of natives in these occupations. A possible explanation for the large
share of immigrants in elementary occupations is poor skills in the local language, a lack of
knowledge of institutions, and deficiency in the host-country-specific capital in general
(Zorlu, 2011). The degree of skill transferability may also have an impact on the occupational
alternatives immigrants have in the host country labour market.
(Table 6 around here)
In order to control for the impact of covariates on the occupational outcomes we also
estimated multinomial logit regressions for different immigrant groups of working in a
specified skill level occupation relative to working in the benchmark, a low skill occupational
group, in comparison to natives (see Table 7). As already mentioned previously in this

22
analysis, occupations were reclassified into three groups by ISCO skill level: (i) 3rd and 4th
skill level (‘high’) occupations corresponding to lower and upper tertiary education, (ii)
second skill level (‘medium’) occupations corresponding to secondary education, and (iii)
first skill level (‘low’) occupations corresponding to primary education.
The results of the multinomial logit regressions confirm the results of the descriptive
statistical analysis: NMS12 immigrants have a higher likelihood of working in a low
occupational group and a lower expected likelihood of being in a high occupational group in
all the countries.
To clarify the interpretation of the results, we also present the predicted probabilities of
the occupational attainment for different immigrant groups and the native population, which
were calculated on the basis of the multinomial logit regressions (see Figure 6). Holding other
variables at their mean, NMS12 immigrants’ predicted probability of being in a ‘low’
occupational group is six percentage points higher in Finland, whereas in the UK the
difference is over three times higher (21.4 percentage points). In the Netherlands and
Germany the corresponding differentials are 16.7 and 10.7 percentage points. As for the
predicted probability of being in a ‘high’ occupational group, the largest difference between
NMS12 and natives is detected in the UK, where natives have almost a 27 percentage points
higher probability of working in a ‘high’ occupational group. Again, we find the smallest
difference in Finland (8.1 percentage points).
It is noteworthy that of the other two immigrant groups NMS12 immigrants are closest to
other immigrants in occupational outcomes, particularly in Germany and the Netherlands. In
this respect our results for Germany are similar to Brenke et al. (2008), which finds that recent
EU8 immigrants are more likely to compete with immigrants from outside Europe for low-
skilled jobs than compete with natives in Germany. On the other hand, of the immigrant
groups EU15 immigrants also seem to do best in occupational outcomes. In Finland and in the
UK EU15 immigrants actually have a higher expected risk of being in the ‘high’ occupational
group compared to similar natives.
The results show that there are considerable differences among the four countries in the
relative position of NMS12 immigrants with respect to occupational outcomes. As expected,
the difference in the likelihood of working in elementary occupations is smallest in Finland,

23
which has the lowest incidence of low pay, and highest in the UK,9 which together with
Germany has the highest incidence of low pay.
The differences among the countries may partly be explained by the countries’ differing levels
at which bargaining takes place, the coverage of collective agreements, and the level of union
density. According to previous research, these institutional features together have been found
to play an important role in shaping a country’s incidence of low pay (e.g. Grimshaw, 2011
(Table 7 around here)
(Figure 6 around here)
5. Conclusions
Most EU15 countries experienced an increase in immigration from the new member states
after the EU enlargement of 2004 despite the transitional arrangements that restricted the free
movement of immigrants to the labour market of the old member states. However, there is
very little previous comparative research on how the new EU member state immigrant
population and their labour market performance differ across old member states. This paper
contributes to the earlier literature by investigating the labour market performance of the
immigrants from the new member states and whether their composition differs in Finland,
Germany, the Netherlands, and the United Kingdom, which are characterized by considerable
differences in their labour market institutions. The differences among the countries in labour
market and welfare institutions might also influence NMS12 immigrants’ labour market
outcomes and those countries’ abilities to absorb immigrants.
The main findings of this study suggest that NMS12 immigrants have a lower probability of
employment than natives in all other countries except the UK, where NMS12 immigrants’
probability of employment is even higher than that of natives. In the other three countries the
employment differential varies from 5.7 percentage points in Finland to 16.1 percent points in
9 Higher probabilities of working in routine occupations have also implied lower relative earnings in the UK for
new member state immigrants (e.g. Drinkwater et al., 2009). Similarly, Brenke et al. (2008) found that in
Germany recent EU8 immigrants work in low-paid jobs and work longer hours, and their monthly income is the
lowest on average among all the immigrant groups except recent non-EU immigrants.

24
the Netherlands. As expected with the time spent in the host country, the employment gap
between NMS12 immigrants and natives narrows in Finland, Germany and the Netherlands.
The disadvantage that NMS12 immigrants have in the labour market also shows in the type of
employment and occupations they hold. In comparison to similar natives, NMS12 immigrants
work more often as self-employed persons (except in Finland) and in temporary jobs which
are often combined with poorer job quality than regular jobs. They also have a higher
likelihood of working in low skill jobs in comparison to similar natives in all the four
countries.
Nonetheless, we also detect interesting differences among the countries in how much the
NMS12 immigrants’ labour market position deviates from that of the similar natives. These
differences may partly be explained by the level of NMS12 immigrants’ host-country-specific
capital including language capital and the institutional differences among these countries, as
suggested above. However, further research is required to disentangle the role of different
institutions in determining the labour market outcomes of immigrants.
How immigrants fare in the labour market influences the economic impact of immigration on
the host country. The more successful the immigrants are in the labour market, the higher will be
their net economic and fiscal contribution to the host economy (Algan et al., 2009). In the design
of future immigration and integration policies more attention should be paid to the causes of
the relative disadvantages of NMS12 immigrants in the host countries and whether these
disadvantages still exist in the long term.
References
Aeberhardt, R. and Pouget, J. (2007). National Origin Wage Differentials in France: Evidence
from Matched Employer-Employee Data. IZA Discussion Paper No. 2779. Institute for the
Study of Labor, Bonn.
Algan, Y., Dustmann, C., Glitz, A. and Manning, A. (2009). The Economic Situation of First-
and Second-Generation Immigrants in France, Germany, and the UK. IZA Discussion Paper
No. 4514. Institute for the Study of Labor, Bonn.

25
Anderson, B., Ruhs, M., Rogaly, B. and Spencer, S. (2006). Fair Enough? Central and East
European migrants in low-wage employment in the UK. Centre of Migration, Policy and
Society (COMPAS) report. University of Oxford.
Angrist, J. and Kugler, A. (2003). Protective or Counter-Productive? Labour Market
Institutions and the Effect of Immigration on EU Natives. The Economic Journal, Vol. 113,
No. 488 (June).
Antecol, H., Kuhn, P. and Trejo, S.J. (2003). Assimilation via Prices or Quantities? Labor
Market Institutions and Immigrant Earnings Growth in Australia, Canada, and the United
States. IZA Discussion Paper No.802. Institute for the Study of Labor, Bonn.
Arpaia, A. and Mourre, G. (2005). Labour Market Institutions and Labour Market
Performance: A Survey of the Literature. Economic Papers 238, European Economy.
Basilio, L. and Bauer, B. (2010). Transferability of Human Capital and Immigrant
Assimilation: An Analysis for Germany. IZA Discussion Paper No. 4716. Institute for the
Study of Labor, Bonn.
Bauer, T. and Zimmermann, K.F. (1999). Occupational Mobility of Ethnic Migrants. IZA
Discussion Paper No. 58. Institute for the Study of Labor, Bonn.
Bellemare, C. (2003), Identification and estimation of economic models of outmigration using
panel attrition. IZA Discussion paper No. 1065.
Bijwaard, G.E. (2008). Modeling Migration Dynamics of Immigrants. Tinbergen Institute
Discussion Paper TI 2008-070/4.
Blanchflower, D. G. and Shadforth, C. (2009). Fear, Unemployment and Migration. The
Economic Journal, 119(535), F136–F182.
Borjas, G.J. (1985). Assimilation, Changes in Cohort Quality, and the Earnings of Immigrants,
Journal of Labour Economics 3: 463-489.
Borjas, G.J. (1986). The Self-Employment Experience of Immigrants. NBER Working Paper
no.1942.
Borjas, G.J. (1987). Self-Selection and the Earnings of Immigrants. American Economic
Review, vol. 77(4), 531-553.
Borjas, G.J. (1995). Assimilation and Changes in Cohort Quality Revisited: What Happened
to Immigrant Earnings in the 1980s? Journal of Labor Economics, University of Chicago
Press, vol. 13(2), pages 201-45, April.
Borjas, G.J. (1999). The Economic Analysis of Immigration. In O. Ashenfelter & D. Card
(eds.) Handbook of Labor Economics, Elsevier, edition 1, volume 3, number 3.

26
Bonin, H., Eichhorst, W., Florman, C., Hansen M. O., Skiöld, L., Stuhler, J., Tatsiramos, K.,
Thomasen, L. and Zimmermann K.F. (2008). Geographic Mobility in the European Union:
Optimising its Economic and Social Benefits, IZA Research Report No. 19.
Brenke, K., Yuksel, M. and Zimmermann, K.F. (2009). EU Enlargement under Continued
Mobility Restrictions: Consequences for the German Labor Market, in M. Kahanec and K. F.
Zimmermann (eds.), EU Labor Markets After Post-Enlargement Migration. Berlin et al.,111-
129.
Brücker, H.et al. (2009). Labour Mobility within the EU in the Context of Enlargement and
the Functioning of the Transitional Arrangements. Final Report (IAB, CMR, fRDB, GEP,
WIFO, wiiw), Nürnberg.
Charlier, H. and Franco, A. (2001). The EU Labour Force Survey on the Way to Convergence
and Quality. Proceedings of Statistics Canada Symposium, Achieving Data Quality in a
Statistical Agency: A Methodological Perspective.
Chiswick, B. (1978). The Effect of Americanization on the Earnings of Foreign-born Men.
Journal of Political Economy vol. 86(5), 897-921.
Clark, K. and Drinkwater, S. (2008). The labour-marker performance of recent migrants.
Oxford Review of Economic Policy vol.24(3), 495-516.
Drinkwater, S., Eade, J. and Garapich, M. (2009). Poles Apart? EU Enlargement and the
Labour Market Outcomes of Immigrants in the United Kingdom. International Migration
47(1), 161–190.
Dustmann, C. and Fabbri, F. (2003). Language proficiency and labour market performance of
immigrants in the UK. The Economic Journal 113(489), 695–717.
Dustmann, C. and Fabbri, F. (2005). Immigrants in the British Labour Market. Fiscal Studies
26(4), 423–470.
Euwals, R., Dagevos, J., Gijsberts, M. and Roodenburg, H. (2007). The Labour Market
Position of Turkish Immigrants in Germany and the Netherlands: Reason for Migration,
Naturalisation and Language Proficiency. IZA Discussion paper No. 2683. Institute for the
Study of Labor, Bonn.
Fouarge, D., and Ester, P. (2007). Factors Determining International and Regional Migration
in Europe, European Foundation for the Improvement of Living and Working Conditions,
Dublin.
Grimshaw, D. (2011). What do we know about low-wage work and low-wage workers?
Analysing the definitions, patterns, causes and consequences in international perspective.
Conditions of Work and Employment Series No. 28. ILO.

27
Kahanec, M. and Zimmermann, K.F. (2008). Migration in an enlarged EU: A challenging
solution? European Economy. Economic Papers 363. Brussels.
Kahanec, M., Zaiceva, A. and Zimmermann, K.F. (2009). Lessons from Migration after EU
Enlargement. IZA Discussion Paper No. 4230. Institute for the Study of Labor, Bonn
Kangasniemi, M. and Kauhanen, M. (2012). Profiles of Estonian immigrants and their
participation in the Finnish welfare system, in P.Nijkamp, J. Poot and M. Sahin (eds.)
Migration Impact Assessment. New Horizons, Edward Elgar, 489-518.
Kogan, I. (2011). New Immigrants - Old Disadvantage Patterns? Labour Market Integration
of Recent Immigrants into Germany. International Migration 49(1), 91–117.
Longhi, S. and Rokicka, M. (2012). Eastern European Immigrants in the UK. Before and after
the 2004 European Enlargement. Manuscript. ISER. University of Essex.
Mason, G. and Salverda W. (2010). Low pay, earnings mobility, economic growth and wage
distribution in the US and Western Europe, in J. Gautié and J. Schmitt (eds.): Low Wage
Work in the Wealthy World (New York, Russell Sage Foundation).
McKenzie, D. and Rapoport, H. (2007). Self-selection patterns in Mexico-U.S. migration: The
role of migration networks. CReAM Discussion Paper Series 0701, Centre for Research and
Analysis of Migration (CReAM), Department of Economics, University College London.
Münz, R. (2008). Migration, Labor Markets, and Integration of Migrants: An Overview for
Europe. SP Discussion paper No. 0807. Social Protection Discussion Paper Series. World
Bank.
Nekby, L. (2002). How Long Does it Take to Integrate? Employment Convergence of
Immigrants and Natives in Sweden. FIEF Working Paper No 185.
Sa, F. (2008). Does Employment Protection Help Immigrants? Evidence from European
Labor Markets. IZA Discussion Paper No. 3414. Institute for the Study of Labor, Bonn.
Tassinopoulos, A. and Werner, H. (1999). To Move or Not to Move – Migration of Labour in
the European Union. IAB Labour Market Research Topics 35.
Wheatley Price, S. (2001). The employment adjustment of male immigrants to the English
labour market. Journal of Population Economics 14(1), 193–200.
Zaiceva, A. and Zimmermann, K.F. (2008). Scale, diversity, and determinants of labour
migration in Europe. Oxford Review of Economic Policy 24(3), 427–451.
Zorlu, A. (2011). Occupational adjustment of immigrants (mimeo).

28
Tables and figures
Table 1. Institutional indicators in 2009 (unless otherwise mentioned) and macroeconomic
indicators (average 2004-2008) for Finland, Germany, the Netherlands and the UK.
Finland Germany Netherlands UK
Collective bargaining
coverage, % 1)
90 62 82.3 32.7
Union density, %1)
69.2 18.8 19 27.5
The dominant level at which
bargaining takes place1)
sectoral or
industry level
sectoral or
industry level
sectoral or
industry level
firm level
Minimum wage legislation1)
no statutory
minimum
wage, agreed
by sectors
statutory
minimum
wage in some
sectors only
statutory
national
minimum
wage
statutory
national
minimum
wage
Strictness of employment
protection (summary index)
(2009) 2)
1.96 2.12 1.95 0.75
Incidence of low pay, %
(2008)3)
8.5 21.5 14.8 21.2
NRR summary measure4)
44 45 38 29
Macroeconomic indicators:
GDP growth (av. 2004-
2008), %
3.4 2.0 2.7 2.0
Employment growth (av.
2004-2008), %
2.0 0.9 1.6 0.5
Unemployment rate (av.
2004-2008)
7.4 9.5 4.1 5.3
Sources: 1)
ICTWSS Database, 2)
OECD database, 3)
OECD Employment Outlook 2010, 4)
OECD Database. The
NRR summary measure is defined as the average of the net unemployment benefit (including SA and cash
housing assistance) replacement rates for two earnings levels, three family situations and 60 months of
unemployment in 2009.

29
Table 2. Characteristics of NMS12 immigrants, EU15 immigrants, other immigrants and
natives (15–64- year-old population), distribution.
Finland NMS12
immigrants
EU15
immigrants
Other
immigrants
Natives
Male 37.7 71.1 46.2 50.6
Female 62.3 29.9 53.8 49.4
Age (average) 36.3 41.2 34.9 40.3
Age1524 18.5 5.3 20.0 18.7
Age2554 71.9 78.4 74.6 60.4
Age5564 9.6 16.4 5.4 20.9
Single 24.9 26.4 24.6 43.3
Married 50.8 56.8 60.9 44.7
Widowed/divorced 15.4 12.1 10.5 11.9
Marital status missing - - 4.0 -
Lower secondary education 35.8 21.6 40.5 25.7
Upper secondary education 46.7 51.2 38.4 44.8
Tertiary level education 17.5 27.4 21.1 29.5
Densely populated area 52.8 49.1 53.8 28.0
Intermediate area 12.7 11.7 16.8 16.1
Thinly populated area 34.5 39.2 14.8 55.8 Source: EU-LFS. Division into immigrants by nationality.
Notes: All figures are population weighted.
Germany NMS12
immigrants
EU15
immigrants
Other
immigrants
Natives
Male 36.6 55.5 50.2 50.5
Female 63.4 44.5 49.8 49.5
Age (average) 36.2 40.8 36.9 40.2
Age1524 14.1 13.5 18.5 17.9
Age2554 76.8 67.4 68.3 63.7
Age5564 9.0 19.0 13.1 18.4
Single 27.2 34.7 26.9 38.7
Married 61.6 56.1 64.7 52.0
Widowed/divorced 11.2 9.2 7.4 9.3
Lower secondary education 23.0 40.8 54.7 20.5
Upper secondary education 54.2 39.2 31.7 57.8
Tertiary level education 22.8 18.6 12.1 21.7
Education level missing - - 1.5 -
Densely populated area 73.0 67.8 73.0 47.5
Intermediate area 22.7 27.4 22.6 35.3
Thinly populated area 4.3 4.8 4.3 17.1 Source: EU-LFS. Division into immigrants by nationality.
Notes: All figures are population weighted.

30
Netherlands NMS12
immigrants
EU15
immigrants
Other
immigrants
Natives
Male 25.0 50.2 48.2 50.5
Female 75.0 49.8 51.8 49.5
Age (average) 32.6 40.8 34.4 40.0
Age1524 17.5 9.1 20.6 17.8
Age2554 79.7 74.9 73.1 63.3
Age5564 2.8 15.9 6.2 18.8
Single 44.9 37.1 26.9 39.9
Married 44.0 51.0 65.7 50.6
Widowed/divorced 11.1 11.8 7.4 9.4
Lower secondary education 26.7 18.6 51.1 32.1
Upper secondary education 40.0 42.9 30.4 40.9
Tertiary level education 30.8 34.9 16.0 26.6
Education level missing 2.4 3.5 2.4 0.4
Densely populated area 74.1 77.1 84.4 64.2
Intermediate area 23.7 21.1 14.6 33.4
Thinly populated area 2.2 1.8 0.9 2.3 Source: EU-LFS.
Notes: All figures are population weighted.
The UK NMS12
immigrants
EU15
immigrants
Other
immigrants
Natives
Male 51.0 46.8 50.2 49.8
Female 49.0 53.2 49.8 50.2
Age (average) 30.2 38.8 34.0 39.4
Age1524 26.6 12.7 18.5 19.8
Age2554 70.9 72.0 68.3 61.5
Age5564 2.5 15.3 13.1 18.6
Single 51.2 42.5 35.0 38.9
Married 40.6 45.9 55.6 48.8
Widowed/divorced 8.2 11.6 9.4 12.3
Lower secondary education 20.1 16.9 22.5 27.9
Upper secondary education 63.3 46.7 46.4 41.1
Tertiary level education 13.5 33.1 28.1 26.2
Education level missing 3.0 3.3 2.9 4.8
Densely populated area 82.9 81.0 88.9 65.1
Intermediate area 8.6 8.8 6.1 16.8
Thinly populated area 7.9 8.1 3.8 14.8
Type of area is missing 0.5 2.0 1.1 3.2 Source: EU-LFS.
Notes: All figures are population weighted.

31
Table 3. Effect of time in the host country on NMS12 immigrants’ employment probability in
comparison to natives (marginal effects) during 2004-2009.
Finland Netherlands Germany UK
NMS12
*Under 2 years since entry -0.150**
(0.077)
-0.270***
(0.036)
-0.237***
(0.018)
0.077***
(0.011)
* 3-5 years since entry -0.01
(0.070)
-0.165***
(0.025)
-0.198***
(0.018)
0.11***
(0.013)
*6-10 years since entry -0.096**
(0.049)
-0.146***
(0.026)
-0.162***
(0.016)
0.046
(0.021)
* Over ten years since entry -0.085**
(0.018)
-0.023
(0.043)
-0.084***
(0.013)
-0.067***
(0.027) Note: These are the marginal effects from a probit model. The outcome variable is an indicator that takes the
value 1 if an individual is employed and zero otherwise. Additional covariates of the model are gender, age, age
squared, marital status, educational level, regions of residence (NUTS2), degree of urbanisation. Standard errors
are in parenthesis. ***: difference significant at 1 % level, **: difference significant at 5% level, *: difference
significant at 10 % level.
Table 4. Probability of self-employment, temporary and part-time work by immigrant groups
during 2004-2009 (comparison group natives) –marginal effects (other covariates at their
means)
4a. Self-employment: Finland Germany Netherlands UK
NMS12
immigrants
-0.0016
(0.0199 )
0.0495***
(0.0113 )
0.0525***
(0.0189 )
0.0398***
(0.007 )
EU15
immigrants
0.009
(0.016)
0.040***
(0.0054)
0.0093**
(0.0049)
-0.0016**
(0.0046)
Other immigrants 0.041***
(0.015)
-0.0029
(0.0036)
-0.0141**
(0.0047)
-0.0296***
(0.0028) Note: These are the marginal effects from a probit model. The outcome variable is an indicator that takes the
value 1 if an individual is self-employed and zero if the individual is an employee. Additional covariates of the
model are gender, age, age squared, marital status, educational level, regions of residence (NUTS2), degree of
urbanisation. Standard errors are in parenthesis. ***: difference significant at 1 % level, **: difference
significant at 5% level, *: difference significant at 10 % level.
4b. Temporary employment: Finland Germany Netherlands UK
NMS12
immigrants
0.096***
(0.028 )
0.0786***
(0.0135)
0.2072***
(0.0246 )
0.0596***
(0.0054 )
EU15
immigrants
0.0812***
(0.025)
-0.0127***
(0.043)
0.0304***
(0.0049)
0.0273***
(0.0037)
Other immigrants 0.1847***
(0.209)
0.0365***
(0.045)
0.196***
(0.0078)
0.0797***
(0.0036) Note: These are the marginal effects from a probit model. The outcome variable is an indicator that takes the
value 1 if an individual is in temporary employment and zero otherwise. Additional covariates of the model are
gender, age, age squared, marital status, educational level, regions of residence (NUTS2), degree of urbanisation.
Standard errors are in parenthesis. ***: difference significant at 1 % level, **: difference significant at 5% level,
*: difference significant at 10 % level.

32
4c. Part-time employment: Finland Germany Netherlands UK
NMS12
immigrants
0.0604**
(0.0199)
0.0536***
(0.0142)
-0.1512***
(0.0252)
-0.0971***
(0.0063)
EU15
immigrants
0.0364*
(0.0221)
0.0001
(0.0071)
-0.0662***
(0.0094)
-0.0241***
(0.0062)
Other immigrants 0.1013***
(0.0179)
0.0503***
(0.0061)
-0.0163*
(0.0096)
0.0342***
(0.0053) Note: These are the marginal effects from a probit model. The outcome variable is an indicator that takes the
value 1 if an individual is in temporary employment and zero otherwise. Additional covariates of the model are
gender, age, age squared, marital status, educational level, regions of residence (NUTS2), degree of
urbanisation. Standard errors are in parenthesis. ***: difference significant at 1 % level, **: difference
significant at 5% level, *: difference significant at 10 % level.
Table 5. Duncan dissimilarity index across occupations by educational level: NMS12
immigrants and native population during 2004-2009.
All Low Medium High
Finland 0.141 0.168 0.164 0.230
Germany 0.199 0.211 0.233 0.149
Netherlands 0.167 0.221 0.262 0.140
UK 0.360 0.339 0.332 0.374
Source: EU-LFS.
Notes: All figures are population weighted. Low=lower secondary level education, medium=upper secondary
level education, high=tertiary level education.
Table 6. Share of immigrants and native population in elementary occupations in 2004-2009.
Finland Germany Netherlands UK
NMS12 immigrants -- 19.0 22.1 31.9
EU15 immigrants -- 11.2 9.1 10.7
Other immigrants 20.4 20.4 29.6 13.9
Natives 7.9 7.1 8.4 10.0
Source: EU-LFS.
Notes: All figures are population weighted.
. -- = not reported due to low number of observations
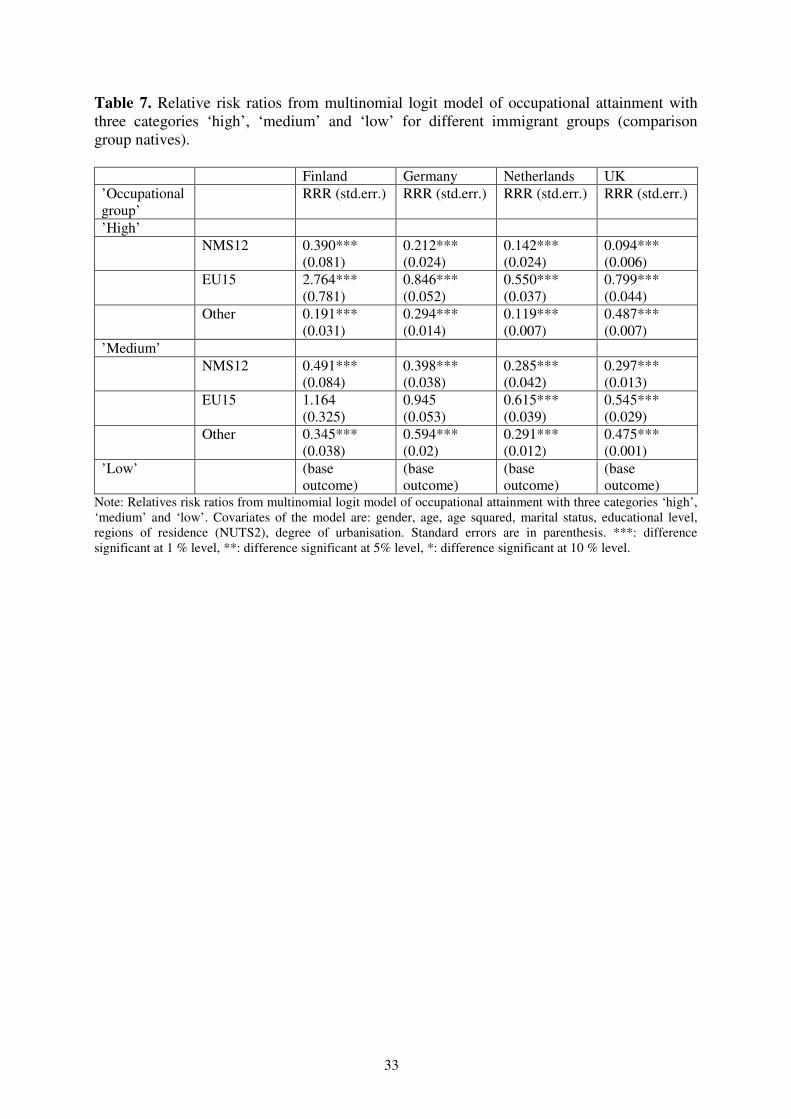
33
Table 7. Relative risk ratios from multinomial logit model of occupational attainment with
three categories ‘high’, ‘medium’ and ‘low’ for different immigrant groups (comparison
group natives).
Finland Germany Netherlands UK
’Occupational
group’
RRR (std.err.) RRR (std.err.) RRR (std.err.) RRR (std.err.)
’High’
NMS12 0.390***
(0.081)
0.212***
(0.024)
0.142***
(0.024)
0.094***
(0.006)
EU15 2.764***
(0.781)
0.846***
(0.052)
0.550***
(0.037)
0.799***
(0.044)
Other 0.191***
(0.031)
0.294***
(0.014)
0.119***
(0.007)
0.487***
(0.007)
’Medium’
NMS12 0.491***
(0.084)
0.398***
(0.038)
0.285***
(0.042)
0.297***
(0.013)
EU15 1.164
(0.325)
0.945
(0.053)
0.615***
(0.039)
0.545***
(0.029)
Other 0.345***
(0.038)
0.594***
(0.02)
0.291***
(0.012)
0.475***
(0.001)
’Low’ (base
outcome)
(base
outcome)
(base
outcome)
(base
outcome) Note: Relatives risk ratios from multinomial logit model of occupational attainment with three categories ‘high’,
‘medium’ and ‘low’. Covariates of the model are: gender, age, age squared, marital status, educational level,
regions of residence (NUTS2), degree of urbanisation. Standard errors are in parenthesis. ***: difference
significant at 1 % level, **: difference significant at 5% level, *: difference significant at 10 % level.

34
Figure 1. Share of NMS12 immigrants of total immigrant population
(15-64-year-old individuals)
0,0
5,0
10,0
15,0
20,0
25,0
2004 2005 2006 2007 2008 2009
Source: National population statistics (Finland), otherwise EU-LFS
%
Finland
Germany
Netherlands*
UK
Figure 2. Employment rates of NMS12 immigrants, EU15immigrants, other immigrants,
and the native population (15-64-year-old individuals), % (Source EU-LFS).
Finland
0
10
20
30
40
50
60
70
80
90
2004 2005 2006 2007 2008 2009
%
NMS12
EU15
Other
immigrantsNative
Germany
0
10
20
30
40
50
60
70
80
2004 2005 2006 2007 2008 2009
%
NMS12
EU15
Other
immigrantsNative
Netherlands
0
10
20
30
40
50
60
70
80
90
2004 2005 2006 2007 2008 2009
%
NMS12
EU15
Other
immigrantsNative
UK
0
10
20
30
40
50
60
70
80
90
2004 2005 2006 2007 2008 2009
%
NMS12
EU15
Other
immigrantsNative

35
Figure 3. Employment probability differentials of NMS12 immigrants, EU15 immigrants
and other immigrants in comparison to natives in 2004-2009 (15-64-year-old individuals),
% (background characteristics controlled for).
Finland
-35 %
-30 %
-25 %
-20 %
-15 %
-10 %
-5 %
0 %
5 %
10 %
NMS12 EU15 Other
Immigrant group
Germany
-35 %
-30 %
-25 %
-20 %
-15 %
-10 %
-5 %
0 %
5 %
10 %
NMS12 EU15 Other
Immigrant group
Netherlands
-35 %
-30 %
-25 %
-20 %
-15 %
-10 %
-5 %
0 %
5 %
10 %
NMS12 EU15 Other
Immigrant group
UK
-35 %
-30 %
-25 %
-20 %
-15 %
-10 %
-5 %
0 %
5 %
10 %
NMS12 EU15 Other
Immigrant group

36
Figure 4. Labour force participation rates of NMS12 immigrants, EU15 immigrants, other
immigrants and the native population (15-64-year-old individuals), % (Source EU-LFS)
(population weights used).
Finland
0
10
20
30
40
50
60
70
80
90
100
2004 2005 2006 2007 2008 2009
%
NMS12
EU15
Other
immigrantsNative
Germany
0
10
20
30
40
50
60
70
80
90
2004 2005 2006 2007 2008 2009
%
NMS12
EU15
Other
immigrantsNative
Netherlands
0
10
20
30
40
50
60
70
80
90
2004 2005 2006 2007 2008 2009
%
NMS12
EU15
Other
immigrantsNative
UK
0
10
20
30
40
50
60
70
80
90
100
2004 2005 2006 2007 2008 2009
%
NMS12
EU15
Other
immigrantsNative

37
Figure 5. Labour force participation differentials of NMS12 immigrants, EU15 immigrants
and other immigrants in comparison to natives in 2004-2009 (15-64-year-old individuals),
% (background characteristics controlled for). (Source EU-LFS)
Finland
-30 %
-25 %
-20 %
-15 %
-10 %
-5 %
0 %
5 %
10 %
NMS12 EU15 Other
Immigrant group
Germany
-30 %
-25 %
-20 %
-15 %
-10 %
-5 %
0 %
5 %
10 %
NMS12 EU15 Other
Immigrant group
Netherlands
-30 %
-25 %
-20 %
-15 %
-10 %
-5 %
0 %
5 %
10 %
NMS12 EU15 Other
Immigrant group
UK
-30 %
-25 %
-20 %
-15 %
-10 %
-5 %
0 %
5 %
10 %
NMS12 EU15 Other
Immigrant group

38
Figure 6. Occupational attainment probabilities by immigrant groups and native population
(1=natives, 2=NMS12 immigrants, 3=EU15 immigrants, 4=other immigrants) (other
covariates at their means)
Finland:
0.1
.2.3
.4.5
.6.7
Pr(
Occ==lo
w)
1 2 3 4immigrant group
Adjusted Predictions of immigrant groups with level(95)% CIs
0.1
.2.3
.4.5
.6.7
Pr(
Occ==m
ediu
m)
1 2 3 4immigrant group
Adjusted Predictions of immigrant group with level(95)% CIs
0.1
.2.3
.4.5
.6.7
Pr(
Occ==hig
h)
1 2 3 4immigrant group
Adjusted Predictions of immigrant groups with level(95)% CIs
Germany:
0.1
.2.3
.4.5
.6.7
Pr(
Occ==lo
w)
1 2 3 4immigrant group
Adjusted Predictions of immigrant groups with level(95)% CIs
.1.2
.3.4
.5.6
.7
Pr(
Occ==m
ediu
m)
1 2 3 4immigrant group
Adjusted Predictions of immigrant groups with level(95)% CIs
0.1
.2.3
.4.5
.6.7
Pr(
Occ==hig
h)
1 2 3 4immigrant group
Adjusted Predictions of immigrant groups with level(95)% CIs

39
Netherlands: 0
.1.2
.3.4
.5.6
Pr(
Occ=
=lo
w)
1 2 3 4immigrant group
Adjusted Predictions of immigrant groups with level(95)% CIs
0.1
.2.3
.4.5
.6P
r(O
cc=
=m
ediu
m)
1 2 3 4immigrant group
Adjusted Predictions of immigrant groups with level(95)% CIs
0.1
.2.3
.4.5
.6
Pr(
Occ==hig
h)
1 2 3 4immigrant group
Adjusted Predictions of immigrant groups with level(95)% CIs
UK:
0.1
.2.3
.4.5
.6.7
Pr(
Occ=
=lo
w)
1 2 3 4immigrant group
Adjusted Predictions of immigrant groups with level(95)% CIs
0.1
.2.3
.4.5
.6P
r(O
cc=
=m
ed
ium
)
1 2 3 4immigrant group
Adjusted Predictions of immigrant groups with level(95)% CIs
0.1
.2.3
.4.5
.6P
r(O
cc=
=h
igh
)
1 2 3 4immigrant group
Adjusted Predictions of immigrant groups with level(95)% CIs
Notes: Predicted probabilities calculated from the multinomial logit models holding other covariates at their mean.