Embed Size (px)
Citation preview
Public Works
Strategic Work Plan FY2017
Making lives better through the services we provide each day.
FY17 Public Works Strategic Work Plan 1 | Page
Public Works Department
Strategic Work Plan FY2017
City of Eugene, Oregon
Contents Strategic Work Plan: Organization and Elements ...................................................................................................................... 2
Department Overview
Vision ............................................................................................................................................................................................................ 3
Mission ......................................................................................................................................................................................................... 3
Values ........................................................................................................................................................................................................... 3
Strategic Goals and Objectives ........................................................................................................................................................... 4
Fiscal Year 2017 Action Items ............................................................................................................................................................ 5
Organizational View of Public Works .............................................................................................................................................. 5
Financial View of Public Works ......................................................................................................................................................... 6
Strategic Work Plan by Division
Administration and Executive Management .............................................................................................................................. 10
Airport ........................................................................................................................................................................................................ 15
Engineering .............................................................................................................................................................................................. 20
Maintenance ............................................................................................................................................................................................ 25
Parks and Open Space .......................................................................................................................................................................... 33
Wastewater .............................................................................................................................................................................................. 38
Appendices
Appendix A ............................................................................................................................................................................................... 43
Appendix B ............................................................................................................................................................................................... 44
Appendix C ............................................................................................................................................................................................... 44
2 | Page FY17 Public Works Strategic Work Plan
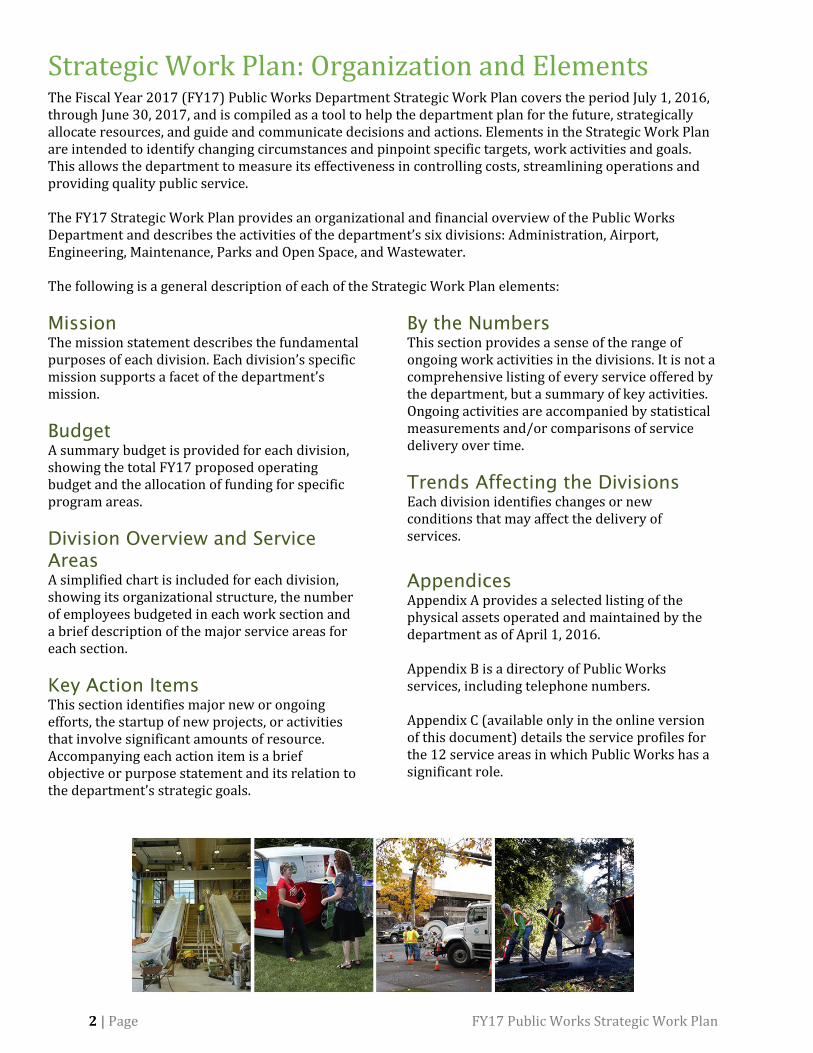
Strategic Work Plan: Organization and Elements The Fiscal Year 2017 (FY17) Public Works Department Strategic Work Plan covers the period July 1, 2016, through June 30, 2017, and is compiled as a tool to help the department plan for the future, strategically allocate resources, and guide and communicate decisions and actions. Elements in the Strategic Work Plan are intended to identify changing circumstances and pinpoint specific targets, work activities and goals. This allows the department to measure its effectiveness in controlling costs, streamlining operations and providing quality public service. The FY17 Strategic Work Plan provides an organizational and financial overview of the Public Works Department and describes the activities of the department’s six divisions: Administration, Airport, Engineering, Maintenance, Parks and Open Space, and Wastewater. The following is a general description of each of the Strategic Work Plan elements:
Mission
The mission statement describes the fundamental purposes of each division. Each division’s specific mission supports a facet of the department’s mission.
Budget
A summary budget is provided for each division, showing the total FY17 proposed operating budget and the allocation of funding for specific program areas.
Division Overview and Service
Areas
A simplified chart is included for each division, showing its organizational structure, the number of employees budgeted in each work section and a brief description of the major service areas for each section.
Key Action Items
This section identifies major new or ongoing efforts, the startup of new projects, or activities that involve significant amounts of resource. Accompanying each action item is a brief objective or purpose statement and its relation to the department’s strategic goals.
By the Numbers
This section provides a sense of the range of ongoing work activities in the divisions. It is not a comprehensive listing of every service offered by the department, but a summary of key activities. Ongoing activities are accompanied by statistical measurements and/or comparisons of service delivery over time.
Trends Affecting the Divisions
Each division identifies changes or new conditions that may affect the delivery of services.
Appendices
Appendix A provides a selected listing of the physical assets operated and maintained by the department as of April 1, 2016. Appendix B is a directory of Public Works services, including telephone numbers. Appendix C (available only in the online version of this document) details the service profiles for the 12 service areas in which Public Works has a significant role.
FY17 Public Works Strategic Work Plan 3 | Page
Department Overview
Vision Making lives better through the services we provide each day.
Mission Eugene Public Works is dedicated to excellence, integrity and stewardship. We enhance the safety, welfare and livability of the community by providing and managing infrastructure and services for parks and open spaces, airport, transportation, stormwater and wastewater systems.
Values
Excellence
• We demonstrate a high degree of competency • We provide services effectively and efficiently • We prepare for today and plan for tomorrow • We pursue innovation
Integrity
• We are dependable and responsible • We highly respect and value the public’s trust • We are available and responsive • We are dedicated to inclusiveness and accessibility • We are committed to respectful, open and transparent processes • We bring people together for common cause and purpose
Stewardship
• We preserve the health and safety of employees and the community • We protect public investments • We are fiscally accountable • We work toward social equity, environmental enhancement and economic prosperity
4 | Page FY17 Public Works Strategic Work Plan
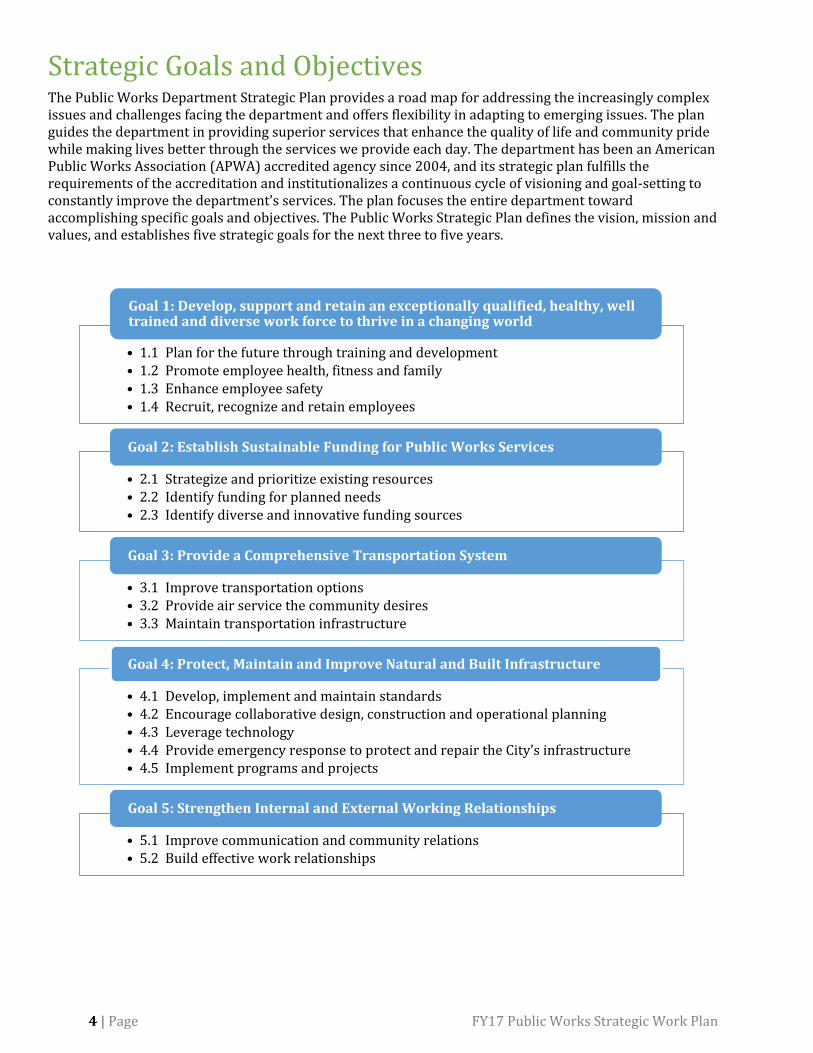
Strategic Goals and Objectives The Public Works Department Strategic Plan provides a road map for addressing the increasingly complex issues and challenges facing the department and offers flexibility in adapting to emerging issues. The plan guides the department in providing superior services that enhance the quality of life and community pride while making lives better through the services we provide each day. The department has been an American Public Works Association (APWA) accredited agency since 2004, and its strategic plan fulfills the requirements of the accreditation and institutionalizes a continuous cycle of visioning and goal-setting to constantly improve the department’s services. The plan focuses the entire department toward accomplishing specific goals and objectives. The Public Works Strategic Plan defines the vision, mission and values, and establishes five strategic goals for the next three to five years.
• 1.1 Plan for the future through training and development • 1.2 Promote employee health, fitness and family • 1.3 Enhance employee safety • 1.4 Recruit, recognize and retain employees
Goal 1: Develop, support and retain an exceptionally qualified, healthy, well trained and diverse work force to thrive in a changing world
• 2.1 Strategize and prioritize existing resources • 2.2 Identify funding for planned needs • 2.3 Identify diverse and innovative funding sources
Goal 2: Establish Sustainable Funding for Public Works Services
• 3.1 Improve transportation options • 3.2 Provide air service the community desires • 3.3 Maintain transportation infrastructure
Goal 3: Provide a Comprehensive Transportation System
• 4.1 Develop, implement and maintain standards • 4.2 Encourage collaborative design, construction and operational planning • 4.3 Leverage technology • 4.4 Provide emergency response to protect and repair the City’s infrastructure • 4.5 Implement programs and projects
Goal 4: Protect, Maintain and Improve Natural and Built Infrastructure
• 5.1 Improve communication and community relations • 5.2 Build effective work relationships
Goal 5: Strengthen Internal and External Working Relationships
FY17 Public Works Strategic Work Plan 5 | Page
Fiscal Year 2017 Action Items In preparation for FY17, the Public Works leadership team reviewed the department’s vision, mission and values and confirmed the statements remain relevant. The team also affirmed the near-term goals and objectives reflect the current work environment. In preparation for the 2021 IAAF Outdoor Track and Field World Championships in Eugene, Public Works is committed to establishing priorities that contribute to the event’s success. All staff are encouraged to develop opportunities that will provide a better experience during the games, both in-person and virtually. This will be an important topic moving ahead as Public Works looks to “inspire the world” during the championships and ensure a continuing legacy for our community. To achieve these goals, the leadership team established several departmental action items for FY17: • Participate in city-wide task team implementing the climate recovery ordinance • Implement recommendations of information technology services analysis, both internal and external • Implement the department’s equity and human rights plan • Enhance employee safety and wellness programs • Provide emergency management planning and response • Prepare Eugene for the future, 2021 and beyond, in four legacy categories: infrastructure; service quality
and capacity; community and organizational culture; and leadership and relationships When a division isn’t the lead on an action item, a policy or task team may take the lead. However, the division would have a direct role. The action items are included in the division’s “key action items” section.
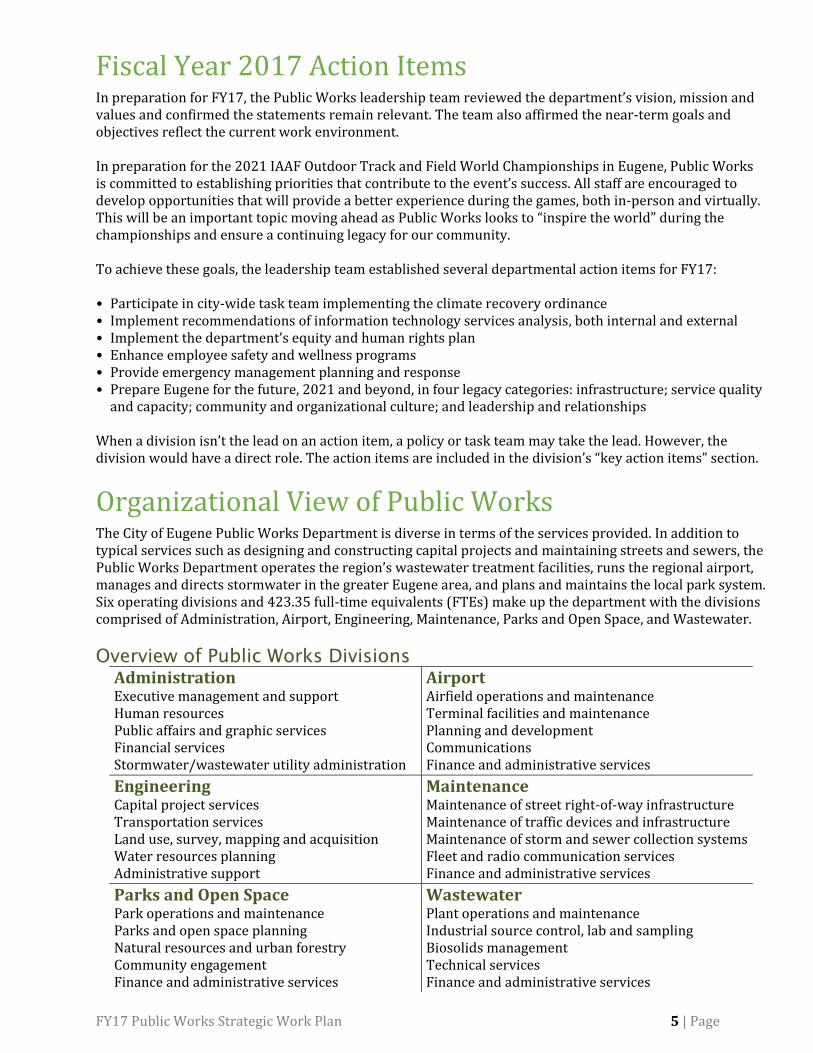
Organizational View of Public Works The City of Eugene Public Works Department is diverse in terms of the services provided. In addition to typical services such as designing and constructing capital projects and maintaining streets and sewers, the Public Works Department operates the region’s wastewater treatment facilities, runs the regional airport, manages and directs stormwater in the greater Eugene area, and plans and maintains the local park system. Six operating divisions and 423.35 full-time equivalents (FTEs) make up the department with the divisions comprised of Administration, Airport, Engineering, Maintenance, Parks and Open Space, and Wastewater.
Overview of Public Works Divisions
Administration Executive management and support Human resources Public affairs and graphic services Financial services Stormwater/wastewater utility administration
Airport Airfield operations and maintenance Terminal facilities and maintenance Planning and development Communications Finance and administrative services
Engineering Capital project services Transportation services Land use, survey, mapping and acquisition Water resources planning Administrative support
Maintenance Maintenance of street right-of-way infrastructure Maintenance of traffic devices and infrastructure Maintenance of storm and sewer collection systems Fleet and radio communication services Finance and administrative services
Parks and Open Space Park operations and maintenance Parks and open space planning Natural resources and urban forestry Community engagement Finance and administrative services
Wastewater Plant operations and maintenance Industrial source control, lab and sampling Biosolids management Technical services Finance and administrative services
6 | Page FY17 Public Works Strategic Work Plan
Financial View of Public Works The Public Works Department provides services and programs that protect the safety and welfare of the public, balances community goals for livability and economic vitality, and fulfills local, state and federal mandates. Department services are delivered in a manner that is professional, environmentally and fiscally responsible, and convenient and understandable to the public.
Public Works Operating Revenues
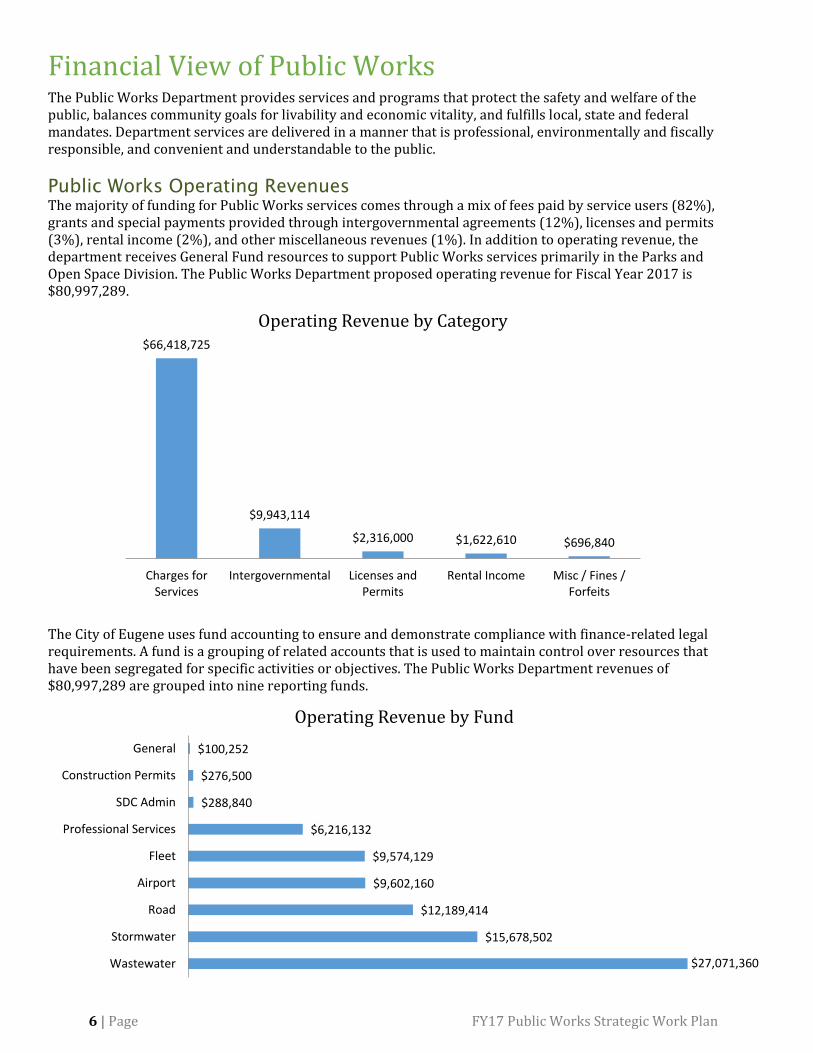
The majority of funding for Public Works services comes through a mix of fees paid by service users (82%), grants and special payments provided through intergovernmental agreements (12%), licenses and permits (3%), rental income (2%), and other miscellaneous revenues (1%). In addition to operating revenue, the department receives General Fund resources to support Public Works services primarily in the Parks and Open Space Division. The Public Works Department proposed operating revenue for Fiscal Year 2017 is $80,997,289.
The City of Eugene uses fund accounting to ensure and demonstrate compliance with finance-related legal requirements. A fund is a grouping of related accounts that is used to maintain control over resources that have been segregated for specific activities or objectives. The Public Works Department revenues of $80,997,289 are grouped into nine reporting funds.
$66,418,725
$9,943,114
$2,316,000 $1,622,610 $696,840
Charges forServices
Intergovernmental Licenses andPermits
Rental Income Misc / Fines /Forfeits
Operating Revenue by Category
$27,071,360
$15,678,502
$12,189,414
$9,602,160
$9,574,129
$6,216,132
$288,840
$276,500
$100,252
Wastewater
Stormwater
Road
Airport
Fleet
Professional Services
SDC Admin
Construction Permits
General
Operating Revenue by Fund
FY17 Public Works Strategic Work Plan 7 | Page
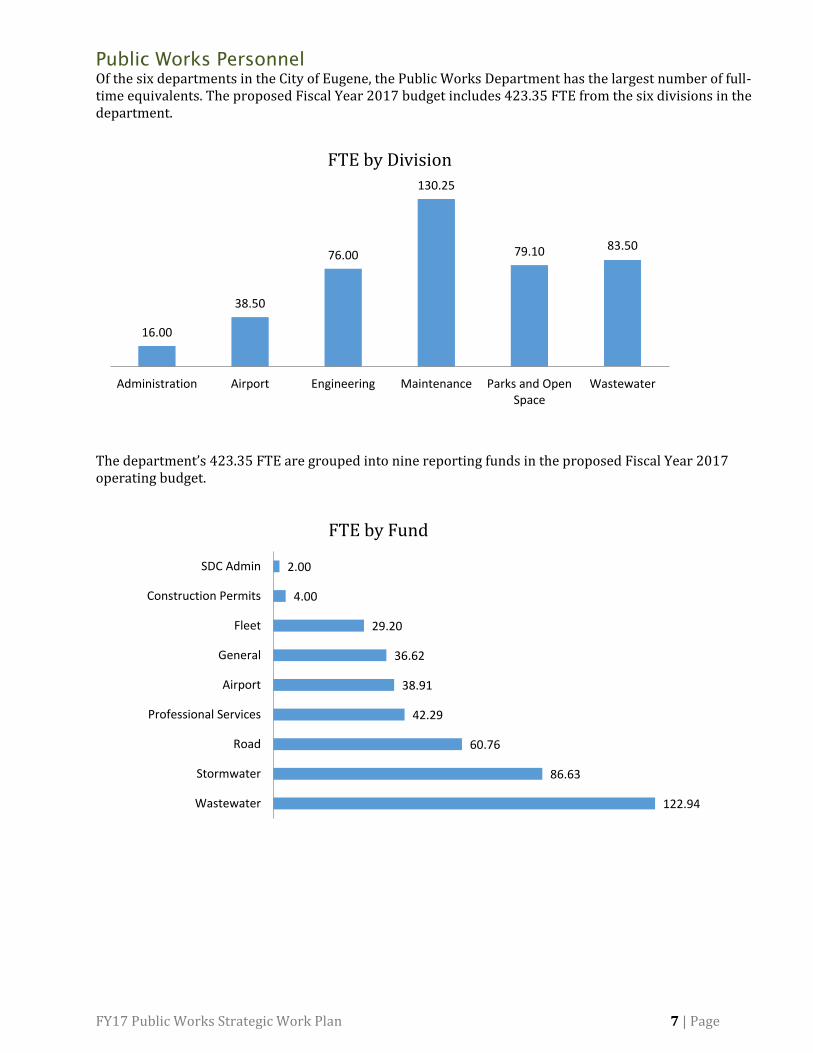
Public Works Personnel
Of the six departments in the City of Eugene, the Public Works Department has the largest number of full-time equivalents. The proposed Fiscal Year 2017 budget includes 423.35 FTE from the six divisions in the department.
The department’s 423.35 FTE are grouped into nine reporting funds in the proposed Fiscal Year 2017 operating budget.
16.00
38.50
76.00
130.25
79.10 83.50
Administration Airport Engineering Maintenance Parks and OpenSpace
Wastewater
FTE by Division
122.94
86.63
60.76
42.29
38.91
36.62
29.20
4.00
2.00
Wastewater
Stormwater
Road
Professional Services
Airport
General
Fleet
Construction Permits
SDC Admin
FTE by Fund
8 | Page FY17 Public Works Strategic Work Plan
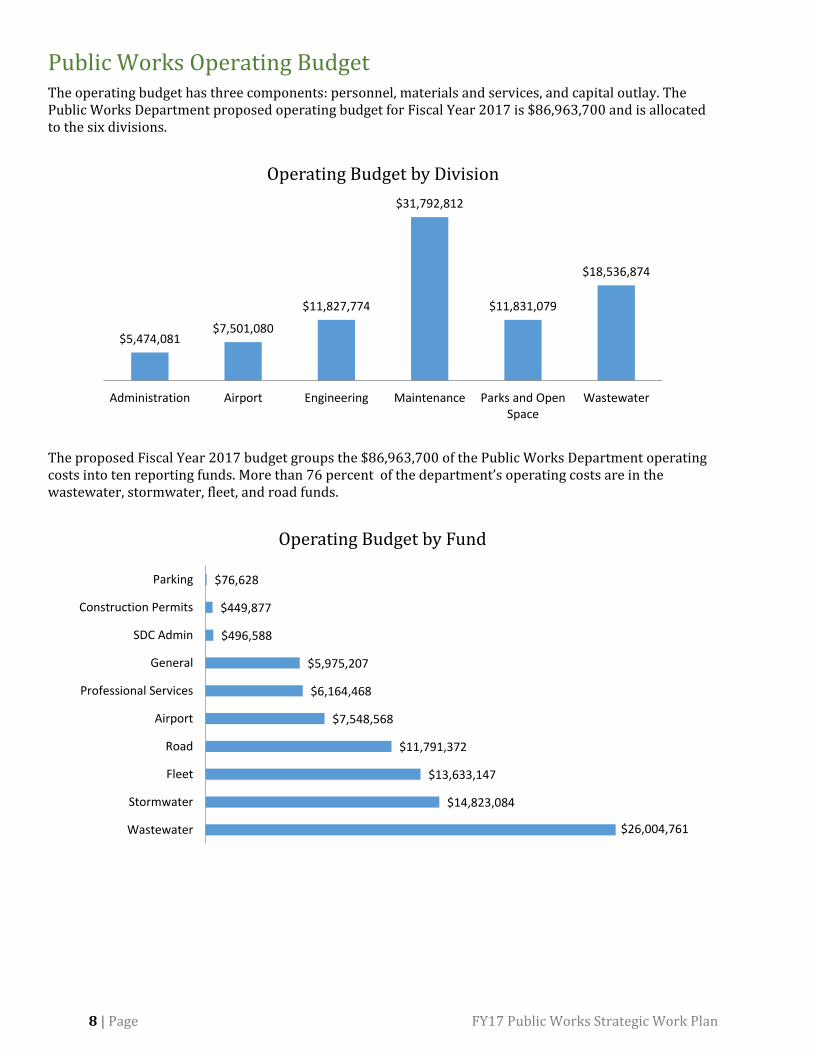
Public Works Operating Budget The operating budget has three components: personnel, materials and services, and capital outlay. The Public Works Department proposed operating budget for Fiscal Year 2017 is $86,963,700 and is allocated to the six divisions.
The proposed Fiscal Year 2017 budget groups the $86,963,700 of the Public Works Department operating costs into ten reporting funds. More than 76 percent of the department’s operating costs are in the wastewater, stormwater, fleet, and road funds.
$5,474,081$7,501,080
$11,827,774
$31,792,812
$11,831,079
$18,536,874
Administration Airport Engineering Maintenance Parks and OpenSpace
Wastewater
Operating Budget by Division
$26,004,761
$14,823,084
$13,633,147
$11,791,372
$7,548,568
$6,164,468
$5,975,207
$496,588
$449,877
$76,628
Wastewater
Stormwater
Fleet
Road
Airport
Professional Services
General
SDC Admin
Construction Permits
Parking
Operating Budget by Fund
FY17 Public Works Strategic Work Plan 9 | Page
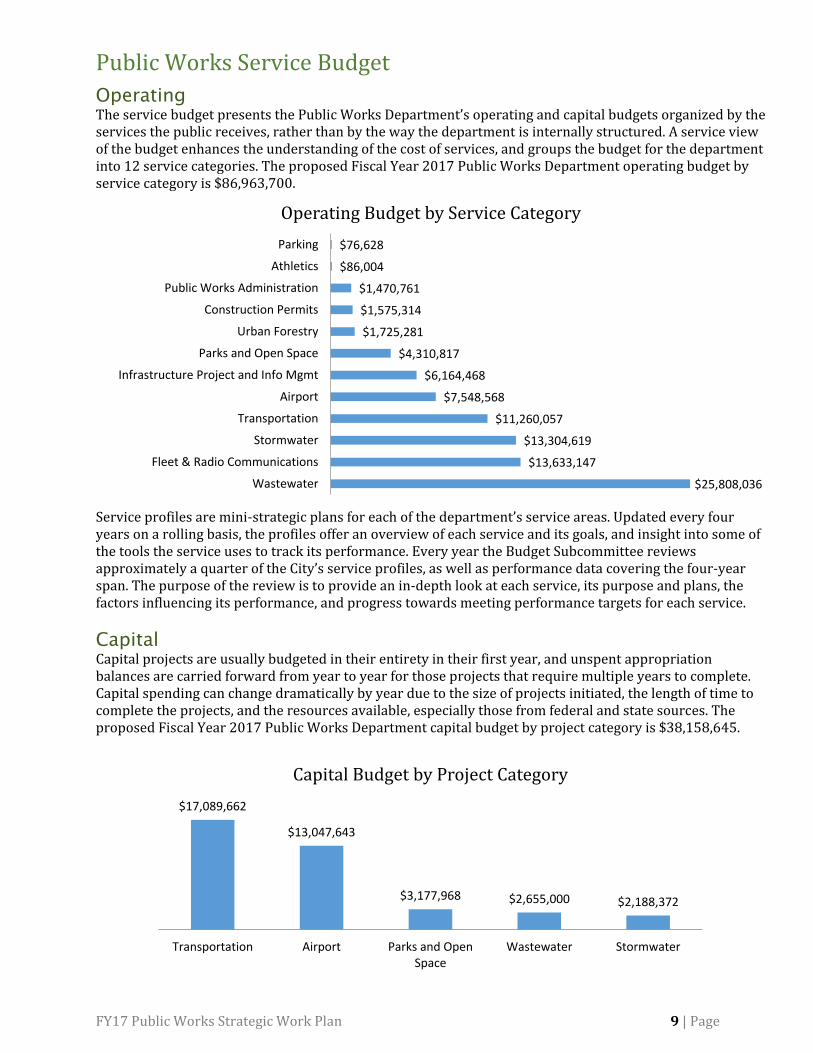
Public Works Service Budget
Operating
The service budget presents the Public Works Department’s operating and capital budgets organized by the services the public receives, rather than by the way the department is internally structured. A service view of the budget enhances the understanding of the cost of services, and groups the budget for the department into 12 service categories. The proposed Fiscal Year 2017 Public Works Department operating budget by service category is $86,963,700.
Service profiles are mini-strategic plans for each of the department’s service areas. Updated every four years on a rolling basis, the profiles offer an overview of each service and its goals, and insight into some of the tools the service uses to track its performance. Every year the Budget Subcommittee reviews approximately a quarter of the City’s service profiles, as well as performance data covering the four‐year span. The purpose of the review is to provide an in‐depth look at each service, its purpose and plans, the factors influencing its performance, and progress towards meeting performance targets for each service.
Capital
Capital projects are usually budgeted in their entirety in their first year, and unspent appropriation balances are carried forward from year to year for those projects that require multiple years to complete. Capital spending can change dramatically by year due to the size of projects initiated, the length of time to complete the projects, and the resources available, especially those from federal and state sources. The proposed Fiscal Year 2017 Public Works Department capital budget by project category is $38,158,645.
$25,808,036
$13,633,147
$13,304,619
$11,260,057
$7,548,568
$6,164,468
$4,310,817
$1,725,281
$1,575,314
$1,470,761
$86,004
$76,628
Wastewater
Fleet & Radio Communications
Stormwater
Transportation
Airport
Infrastructure Project and Info Mgmt
Parks and Open Space
Urban Forestry
Construction Permits
Public Works Administration
Athletics
Parking
Operating Budget by Service Category
$17,089,662
$13,047,643
$3,177,968 $2,655,000 $2,188,372
Transportation Airport Parks and OpenSpace
Wastewater Stormwater
Capital Budget by Project Category
10 | Page FY17 Public Works Strategic Work Plan
Strategic Work Plan by Division
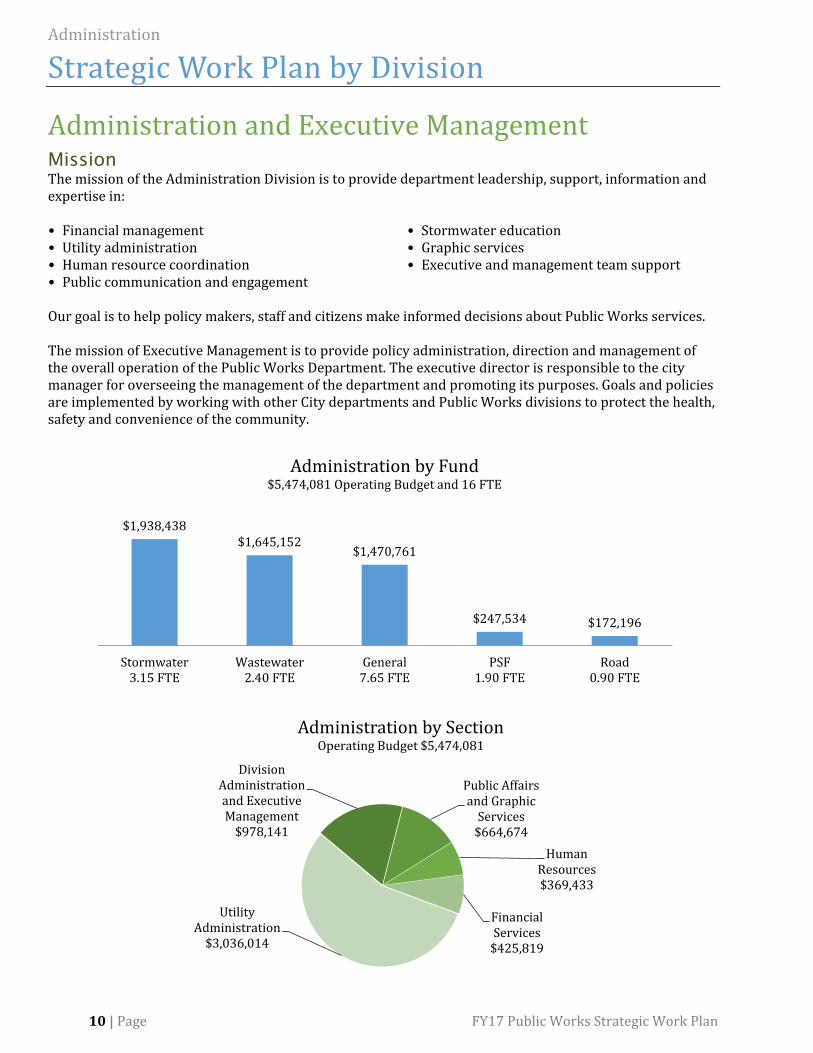
Administration and Executive Management Mission
The mission of the Administration Division is to provide department leadership, support, information and expertise in: • Financial management • Utility administration • Human resource coordination • Public communication and engagement
• Stormwater education • Graphic services • Executive and management team support
Our goal is to help policy makers, staff and citizens make informed decisions about Public Works services. The mission of Executive Management is to provide policy administration, direction and management of the overall operation of the Public Works Department. The executive director is responsible to the city manager for overseeing the management of the department and promoting its purposes. Goals and policies are implemented by working with other City departments and Public Works divisions to protect the health, safety and convenience of the community.
$1,938,438 $1,645,152
$1,470,761
$247,534 $172,196
Stormwater3.15 FTE
Wastewater2.40 FTE
General7.65 FTE
PSF1.90 FTE
Road0.90 FTE
Administration by Fund$5,474,081 Operating Budget and 16 FTE
Division Administration and Executive Management
$978,141
Public Affairs and Graphic
Services$664,674
Human Resources$369,433
Financial Services
$425,819
Utility Administration
$3,036,014
Administration by SectionOperating Budget $5,474,081
FY17 Public Works Strategic Work Plan 11 | Page
Administration Division Manager
1 FTE
Financial Services and Utility
Administration
6 FTE
Human Resources
3 FTE
Administrative Support
1 FTE
Public Affairs and Graphic Services
4 FTE
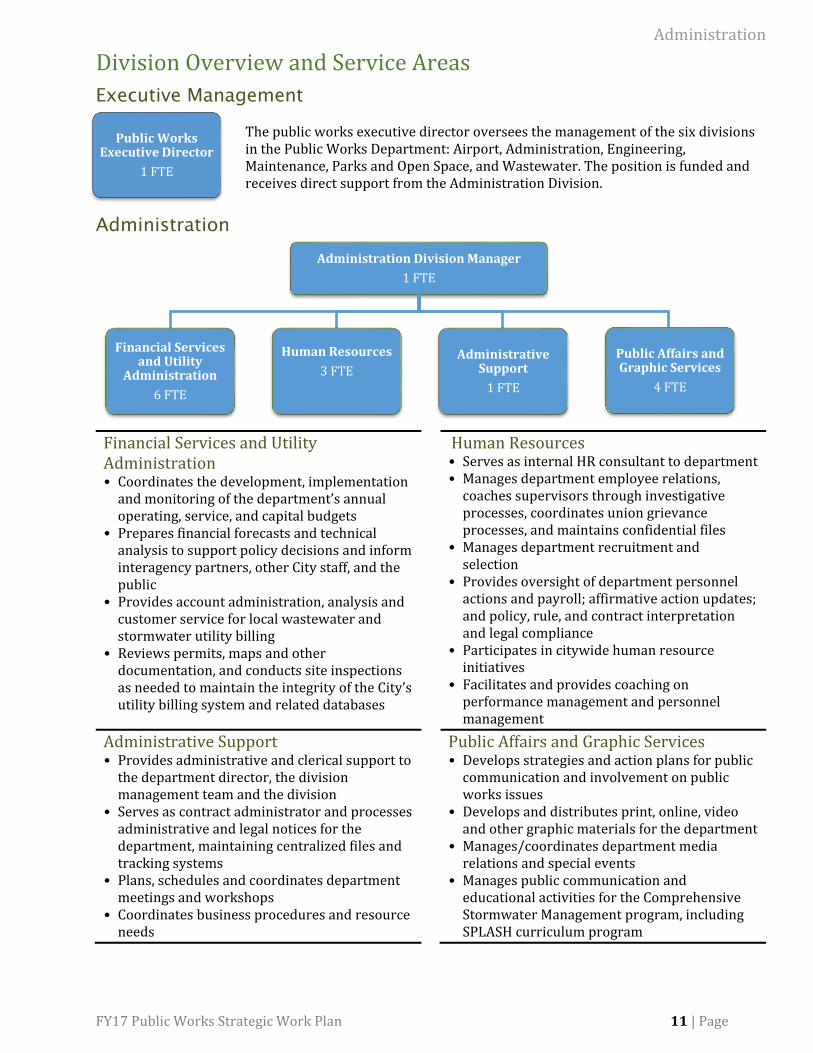
Division Overview and Service Areas
Executive Management
The public works executive director oversees the management of the six divisions in the Public Works Department: Airport, Administration, Engineering, Maintenance, Parks and Open Space, and Wastewater. The position is funded and receives direct support from the Administration Division.
Administration
Financial Services and Utility Administration • Coordinates the development, implementation
and monitoring of the department’s annual operating, service, and capital budgets
• Prepares financial forecasts and technical analysis to support policy decisions and inform interagency partners, other City staff, and the public
• Provides account administration, analysis and customer service for local wastewater and stormwater utility billing
• Reviews permits, maps and other documentation, and conducts site inspections as needed to maintain the integrity of the City’s utility billing system and related databases
Human Resources • Serves as internal HR consultant to department • Manages department employee relations,
coaches supervisors through investigative processes, coordinates union grievance processes, and maintains confidential files
• Manages department recruitment and selection
• Provides oversight of department personnel actions and payroll; affirmative action updates; and policy, rule, and contract interpretation and legal compliance
• Participates in citywide human resource initiatives
• Facilitates and provides coaching on performance management and personnel management
Administrative Support • Provides administrative and clerical support to
the department director, the division management team and the division
• Serves as contract administrator and processes administrative and legal notices for the department, maintaining centralized files and tracking systems
• Plans, schedules and coordinates department meetings and workshops
• Coordinates business procedures and resource needs
Public Affairs and Graphic Services • Develops strategies and action plans for public
communication and involvement on public works issues
• Develops and distributes print, online, video and other graphic materials for the department
• Manages/coordinates department media relations and special events
• Manages public communication and educational activities for the Comprehensive Stormwater Management program, including SPLASH curriculum program
Public Works Executive Director
1 FTE
12 | Page FY17 Public Works Strategic Work Plan
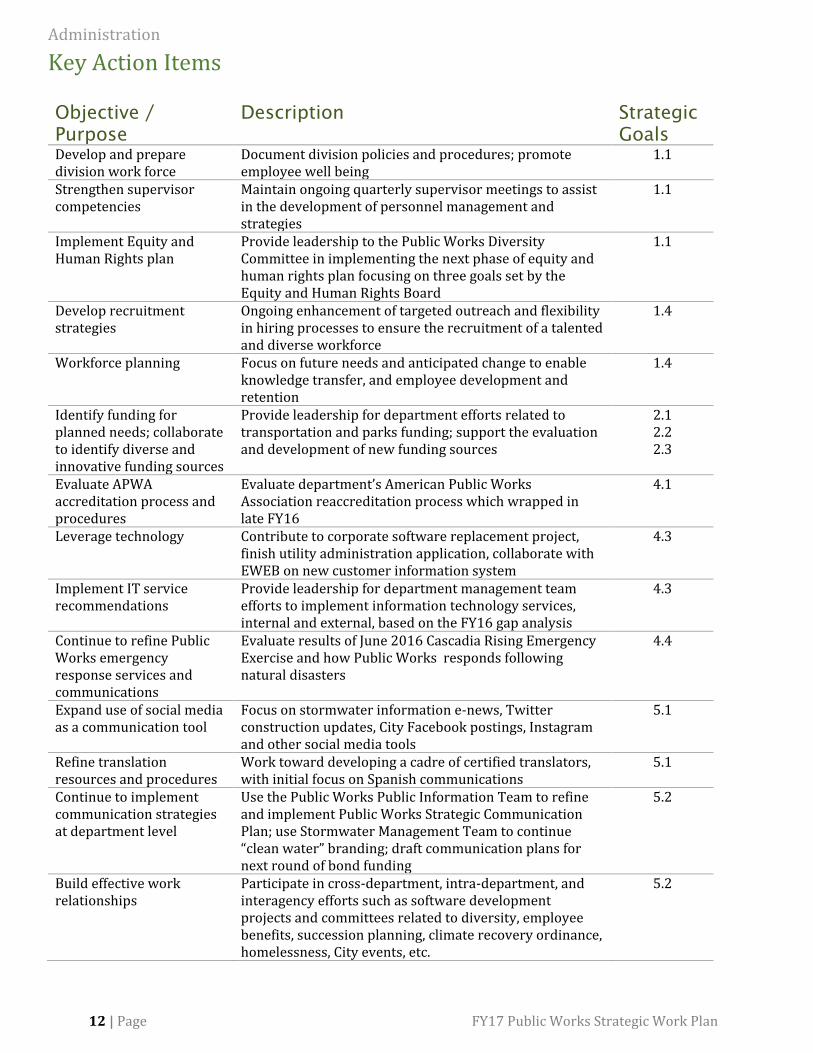
Key Action Items
Objective /
Purpose
Description Strategic
Goals
Develop and prepare division work force
Document division policies and procedures; promote employee well being
1.1
Strengthen supervisor competencies
Maintain ongoing quarterly supervisor meetings to assist in the development of personnel management and strategies
1.1
Implement Equity and Human Rights plan
Provide leadership to the Public Works Diversity Committee in implementing the next phase of equity and human rights plan focusing on three goals set by the Equity and Human Rights Board
1.1
Develop recruitment strategies
Ongoing enhancement of targeted outreach and flexibility in hiring processes to ensure the recruitment of a talented and diverse workforce
1.4
Workforce planning Focus on future needs and anticipated change to enable knowledge transfer, and employee development and retention
1.4
Identify funding for planned needs; collaborate to identify diverse and innovative funding sources
Provide leadership for department efforts related to transportation and parks funding; support the evaluation and development of new funding sources
2.1 2.2 2.3
Evaluate APWA accreditation process and procedures
Evaluate department’s American Public Works Association reaccreditation process which wrapped in late FY16
4.1
Leverage technology Contribute to corporate software replacement project, finish utility administration application, collaborate with EWEB on new customer information system
4.3
Implement IT service recommendations
Provide leadership for department management team efforts to implement information technology services, internal and external, based on the FY16 gap analysis
4.3
Continue to refine Public Works emergency response services and communications
Evaluate results of June 2016 Cascadia Rising Emergency Exercise and how Public Works responds following natural disasters
4.4
Expand use of social media as a communication tool
Focus on stormwater information e-news, Twitter construction updates, City Facebook postings, Instagram and other social media tools
5.1
Refine translation resources and procedures
Work toward developing a cadre of certified translators, with initial focus on Spanish communications
5.1
Continue to implement communication strategies at department level
Use the Public Works Public Information Team to refine and implement Public Works Strategic Communication Plan; use Stormwater Management Team to continue “clean water” branding; draft communication plans for next round of bond funding
5.2
Build effective work relationships
Participate in cross-department, intra-department, and interagency efforts such as software development projects and committees related to diversity, employee benefits, succession planning, climate recovery ordinance, homelessness, City events, etc.
5.2
FY17 Public Works Strategic Work Plan 13 | Page
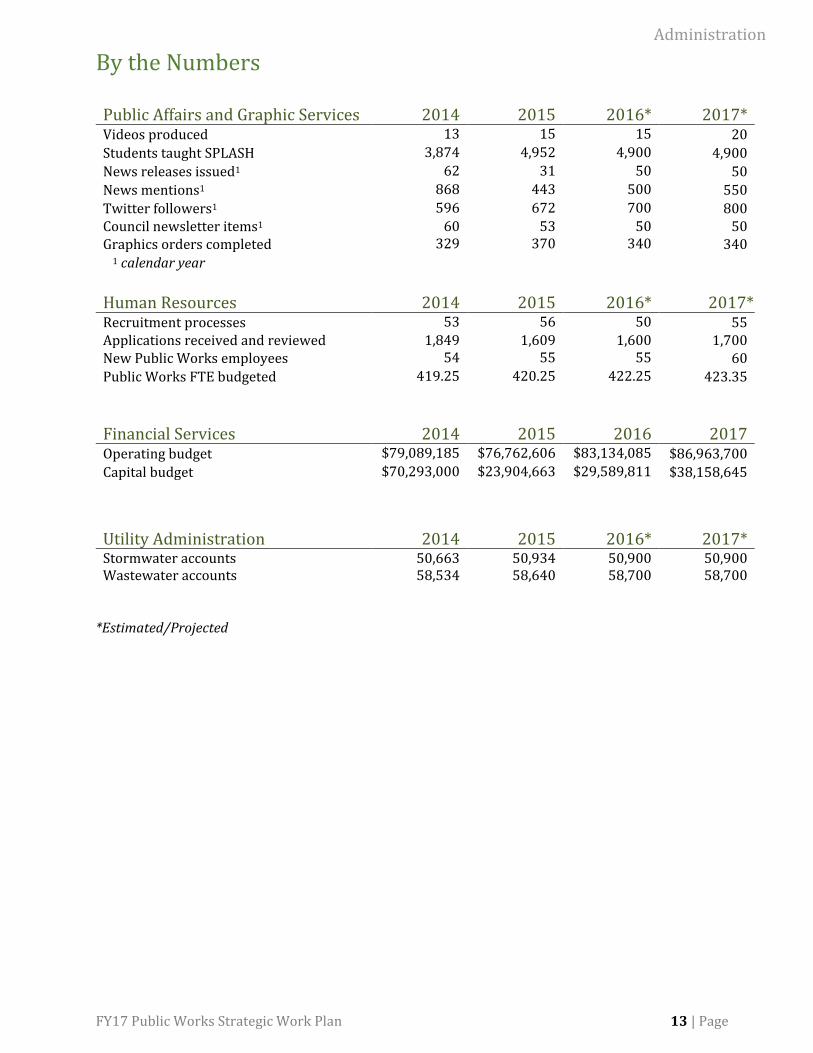
By the Numbers Public Affairs and Graphic Services 2014
2015
2016* 2017*
Videos produced 13 15 15 20
Students taught SPLASH 3,874 4,952 4,900 4,900
News releases issued1 62 31 50 50
News mentions1 868 443 500 550
Twitter followers1 596 672 700 800 Council newsletter items1 60 53 50 50 Graphics orders completed 329 370 340 340
1 calendar year
Human Resources
2014
2015
2016* 2017*
Recruitment processes 53 56 50 55 Applications received and reviewed 1,849 1,609 1,600 1,700 New Public Works employees 54 55 55 60
Public Works FTE budgeted 419.25 420.25 422.25 423.35
Financial Services
2014
2015
2016 2017
Operating budget $79,089,185 $76,762,606 $83,134,085 $86,963,700
Capital budget $70,293,000 $23,904,663 $29,589,811 $38,158,645
Utility Administration
2014
2015
2016* 2017*
Stormwater accounts 50,663 50,934 50,900 50,900 Wastewater accounts 58,534 58,640 58,700 58,700
*Estimated/Projected
14 | Page FY17 Public Works Strategic Work Plan
Trends Affecting the Division
Track Progress of Two
Citizen led Panels
The Street Repair Review Panel (SRRP) and the Railroad Quiet Zone Panel (RRQZ) have met several times over the past year, each face different tasks.
The SRRP is charged with reviewing the usage of street bond funds, which are set to expire in 2018. Over the course of FY17, panel members will weigh options for another bond and potentially offer recommendations to the Eugene City Council.
Under the guidance of City engineers, the RRQZ panel members crafted a safety-based proposal that may lead to the creation of a whistle-free zone for trains in downtown Eugene. Plans call for changes to current railroad crossings.
After an extended public outreach, the panel will ultimately pass its recommendations to the Eugene City Council, which could then decide whether to proceed forward and any possible funding source.
Finding and Keeping
Top Talent
Continuing improvement in the labor market has increased the competition for capable and skilled talent. Communicating our vision and values of excellence, integrity, and stewardship to prospective candidates is a crucial component to attracting and retaining the best employees.
Public Works human resource staff began a focus on creativity, flexibility and efficiency in our recruitment processes from the design and advertising of position announcements, to the offering of a variety of interview and
assessment options that can be aimed to suit the requirements of each position. This will enhance the selection process and bring in the best employees to serve our community.
Succession planning efforts will also be a high priority as boomers retire and others prepare for long term leadership. Continuing attention to the onboarding of new employees, mentoring, and knowledge transfer from seasoned employees will increase employee engagement, commitment, retention and professional growth of the Public Works organization.
Admin Has Role in
Project to Replace
Corporate Software
Public Works Administration routinely contributes to efforts to make the best use of technology to provide services to the public. Some projects focus on administrative operations, while others involve other Public Works divisions, other City departments, and other agencies. Examples of projects in FY17 include implementation of a capital project management system, and assisting EWEB in the development of a new customer information system, which includes billings for both stormwater and wastewater services.
Also in FY17, Public Works Administration will continue to participate in a large scale, multi-year effort to replace the City’s corporate software system. The City’s corporate software is at the end of its useful life, and a required upgrade will result in compatibility issues. The software replacement project is an opportunity to resolve compatibility issues, take advantage of current technology,
and improve the City’s business processes. Public Works Administration will participate in all phases of the project which will change the way the City conducts much of its business. Modules will include accounts payable, human resources, payroll, general ledger, budget, accounts receivable and purchasing.
Planning for Equity and
Human Rights
Public Works will build on the foundation of the previous award winning Diversity and Equity Strategic Plan. The next phase of equity and human rights planning will focus on three goals set by the Equity and Human Rights Board: workforce and work environment, service delivery, and communication and engagement. The plan will help set a clear vision as the next chapter in our work advances. Tangible actions with measurable outcomes will be implemented to create an organization of the future shaped by the principles of equity and inclusion where all feel valued and respected.
FY17 Public Works Strategic Work Plan 15 | Page
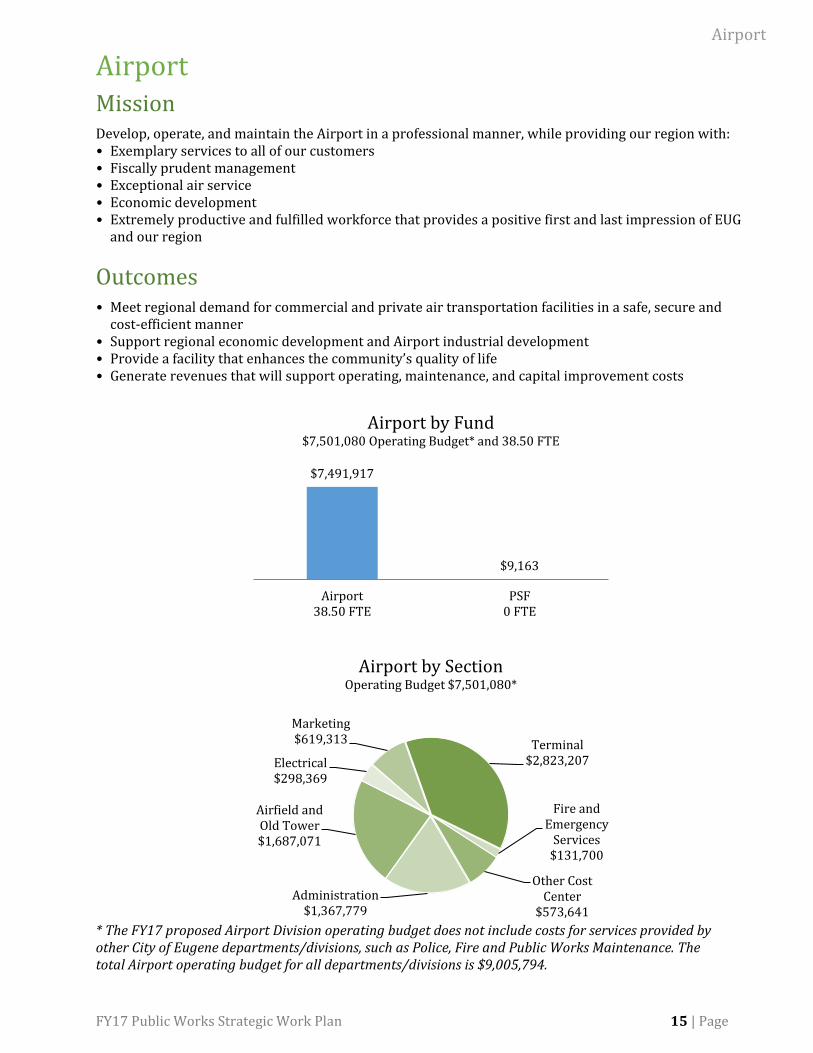
Airport Mission Develop, operate, and maintain the Airport in a professional manner, while providing our region with: • Exemplary services to all of our customers • Fiscally prudent management • Exceptional air service • Economic development • Extremely productive and fulfilled workforce that provides a positive first and last impression of EUG
and our region
Outcomes • Meet regional demand for commercial and private air transportation facilities in a safe, secure and
cost-efficient manner • Support regional economic development and Airport industrial development • Provide a facility that enhances the community’s quality of life • Generate revenues that will support operating, maintenance, and capital improvement costs
* The FY17 proposed Airport Division operating budget does not include costs for services provided by other City of Eugene departments/divisions, such as Police, Fire and Public Works Maintenance. The total Airport operating budget for all departments/divisions is $9,005,794.
$7,491,917
$9,163
Airport38.50 FTE
PSF0 FTE
Airport by Fund$7,501,080 Operating Budget* and 38.50 FTE
Administration$1,367,779
Airfield and Old Tower$1,687,071
Electrical$298,369
Marketing$619,313 Terminal
$2,823,207
Fire and Emergency
Services$131,700
Other Cost Center
$573,641
Airport by SectionOperating Budget $7,501,080*
16 | Page FY17 Public Works Strategic Work Plan
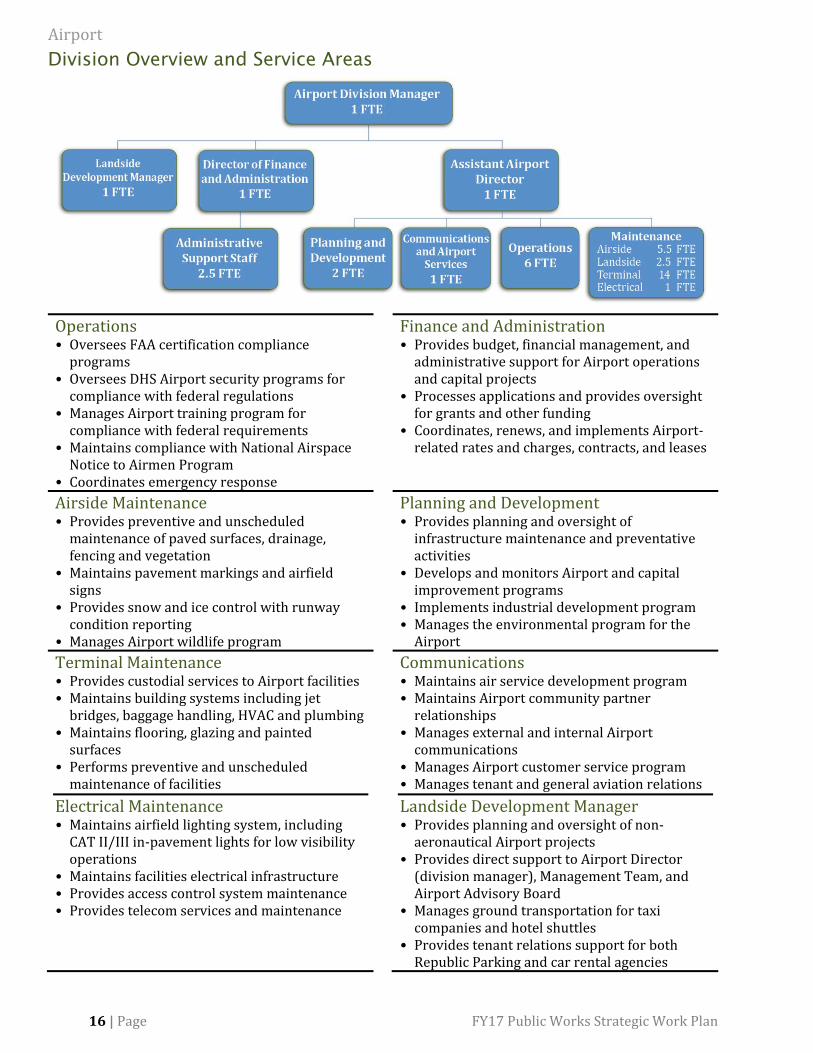
Division Overview and Service Areas
Operations • Oversees FAA certification compliance
programs • Oversees DHS Airport security programs for
compliance with federal regulations • Manages Airport training program for
compliance with federal requirements • Maintains compliance with National Airspace
Notice to Airmen Program • Coordinates emergency response
Finance and Administration • Provides budget, financial management, and
administrative support for Airport operations and capital projects
• Processes applications and provides oversight for grants and other funding
• Coordinates, renews, and implements Airport-related rates and charges, contracts, and leases
Airside Maintenance • Provides preventive and unscheduled
maintenance of paved surfaces, drainage, fencing and vegetation
• Maintains pavement markings and airfield signs
• Provides snow and ice control with runway condition reporting
• Manages Airport wildlife program
Planning and Development • Provides planning and oversight of
infrastructure maintenance and preventative activities
• Develops and monitors Airport and capital improvement programs
• Implements industrial development program • Manages the environmental program for the
Airport
Terminal Maintenance • Provides custodial services to Airport facilities • Maintains building systems including jet
bridges, baggage handling, HVAC and plumbing • Maintains flooring, glazing and painted
surfaces • Performs preventive and unscheduled
maintenance of facilities
Electrical Maintenance • Maintains airfield lighting system, including
CAT II/III in-pavement lights for low visibility operations
• Maintains facilities electrical infrastructure • Provides access control system maintenance • Provides telecom services and maintenance
Communications • Maintains air service development program • Maintains Airport community partner
relationships • Manages external and internal Airport
communications • Manages Airport customer service program • Manages tenant and general aviation relations
Landside Development Manager • Provides planning and oversight of non-
aeronautical Airport projects • Provides direct support to Airport Director
(division manager), Management Team, and Airport Advisory Board
• Manages ground transportation for taxi companies and hotel shuttles
• Provides tenant relations support for both Republic Parking and car rental agencies
FY17 Public Works Strategic Work Plan 17 | Page
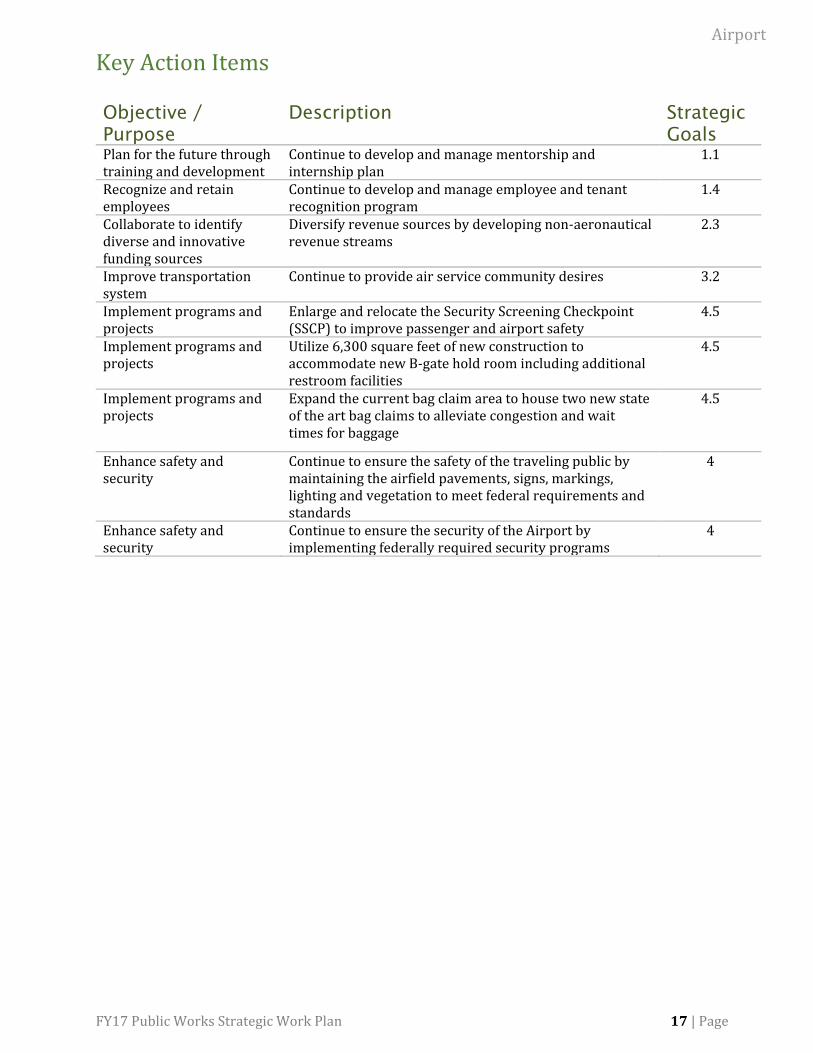
Key Action Items
Objective /
Purpose
Description Strategic
Goals
Plan for the future through training and development
Continue to develop and manage mentorship and internship plan
1.1
Recognize and retain employees
Continue to develop and manage employee and tenant recognition program
1.4
Collaborate to identify diverse and innovative funding sources
Diversify revenue sources by developing non-aeronautical revenue streams
2.3
Improve transportation system
Continue to provide air service community desires 3.2
Implement programs and projects
Enlarge and relocate the Security Screening Checkpoint (SSCP) to improve passenger and airport safety
4.5
Implement programs and projects
Utilize 6,300 square feet of new construction to accommodate new B-gate hold room including additional restroom facilities
4.5
Implement programs and projects
Expand the current bag claim area to house two new state of the art bag claims to alleviate congestion and wait times for baggage
4.5
Enhance safety and security
Continue to ensure the safety of the traveling public by maintaining the airfield pavements, signs, markings, lighting and vegetation to meet federal requirements and standards
4
Enhance safety and security
Continue to ensure the security of the Airport by implementing federally required security programs
4
18 | Page FY17 Public Works Strategic Work Plan
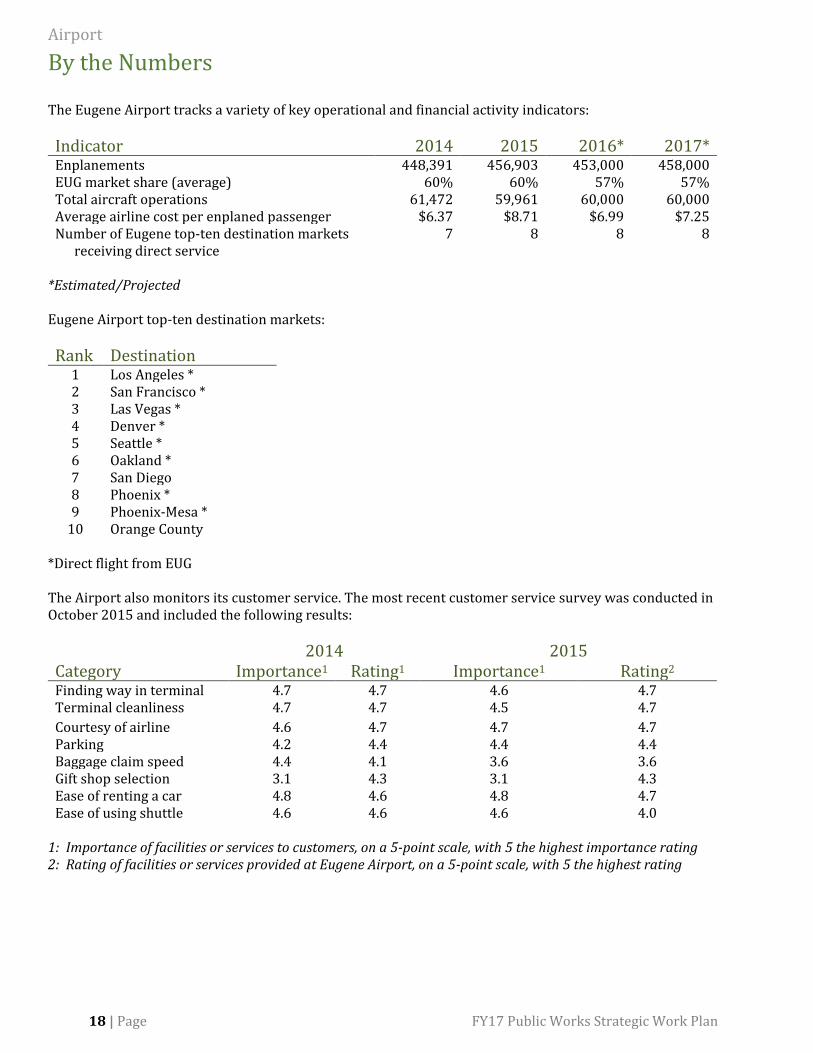
By the Numbers The Eugene Airport tracks a variety of key operational and financial activity indicators:
Indicator 2014 2015 2016* 2017* Enplanements 448,391 456,903 453,000 458,000 EUG market share (average) 60% 60% 57% 57% Total aircraft operations 61,472 59,961 60,000 60,000 Average airline cost per enplaned passenger $6.37 $8.71 $6.99 $7.25 Number of Eugene top-ten destination markets
receiving direct service
7 8 8 8
*Estimated/Projected Eugene Airport top-ten destination markets:
Rank Destination 1 Los Angeles * 2 San Francisco * 3 Las Vegas * 4 Denver * 5 Seattle * 6 Oakland * 7 San Diego 8 Phoenix * 9 Phoenix-Mesa *
10 Orange County *Direct flight from EUG The Airport also monitors its customer service. The most recent customer service survey was conducted in October 2015 and included the following results:
2014 2015 Category Importance1 Rating1 Importance1 Rating2 Finding way in terminal 4.7 4.7 4.6 4.7 Terminal cleanliness 4.7 4.7 4.5 4.7
Courtesy of airline 4.6 4.7 4.7 4.7 Parking 4.2 4.4 4.4 4.4 Baggage claim speed 4.4 4.1 3.6 3.6 Gift shop selection 3.1 4.3 3.1 4.3 Ease of renting a car 4.8 4.6 4.8 4.7 Ease of using shuttle 4.6 4.6 4.6 4.0
1: Importance of facilities or services to customers, on a 5-point scale, with 5 the highest importance rating 2: Rating of facilities or services provided at Eugene Airport, on a 5-point scale, with 5 the highest rating
FY17 Public Works Strategic Work Plan 19 | Page
Trends Affecting the Division
Passenger Facility
Charge Increase Vital
for Airport
Passenger Facility Charges (PFC) are local airport user fees that must be justified locally, imposed locally, and used locally to enhance local airport facilities. The PFC is subject to a federal cap of $4.50, an amount last updated during the Clinton Administration in 2000. Adjusting for inflation, that $4.50 is now worth about $2.50. There is a need to modernize the program by increasing the PFC to $8.50 with indexing for inflation to restore lost purchasing power and ensure that airports don’t lose ground in the future as costs increase.
Raising the cap on the PFC to $8.50, as proposed by the American Association of Airport Executives, would bring an additional $1.7 million dollars per year to EUG for capital projects. As hard as airports nationwide are lobbying for the increase, airlines are lobbying against the increase.
Increasing the PFC would benefit large capital improvement projects at EUG. The airport is in the process of completing a $17 million terminal expansion project that increases gate hold room space, security screening space and additional baggage claim devices. This project will be completed debt free. Raising the PFC cap will continue to allow the airport to remain debt free as improvement projects become necessary with continued passenger growth.
Who Will Pay for
Measures To Reinforce
Airport Security?
In light of the recent terror attack that targeted the Brussels Airport, the Senate recently passed several provisions to reinforce security.
These measures are aimed to strengthen airport employee vetting and to increase the use of teams that conduct covert operations to test security systems. They also enhance security around airport perimeters, fund law enforcement training for dealing with active shooters and require the Transportation Security Administration to review potential insider threats posed by employees. Some experts believe a recent attack on a Russian flight leaving Egypt had help from an aviation worker.
The airport industry places safety and security as a top priority, as does EUG, but funding new programs is projected to place a tremendous financial burden on airports. It will be important for the airport industry to continue to advocate for funding of new or enhanced security requirements.
United Airlines to
Increase Seat Capacity
on its EUG-SFO Route
Beginning June 9, 2016, United Airlines will bring back mainline service to Eugene Airport on three of the four EUG to SFO flights. They will operate using an Airbus A319 and A320 aircraft which will increase seat capacity on this route by an estimated 31 percent.
Currently United operates regional jets on this route, exclusively flying the RJ200 and RJ700 which seat 50 and 70
passengers respectively. The A319 and A320 seat 124 passengers and 150 passengers respectively. The larger narrow-body aircraft have higher priority under flow-control at SFO, which should mean fewer fog and other weather delays.
“We are grateful that United Airlines has recognized the strength of the Eugene market,” said Tim Doll, Airport Director.
United Airlines was the first airline to serve Eugene Airport beginning in May of 1943.
Airport Master Plan
Underway
In April of 2015, Eugene Airport accepted bids for airport planning services for development of an Airport Master Plan. This 20-year plan is a significant endeavor that will shape the future of the Eugene Airport for years to come. The Master Plan offers airport staff the opportunity to create and define the “Airport Vision” which ultimately determines the level of service offered to passengers, the ease and efficiency of airport operations, the quality of facilities, and the vigor of financial performance.
RS&H, a consulting firm out of Denver, won the bid for the Master Plan. It is one of the industry’s leading full-service aviation consulting firms. They visited with airport staff and other stakeholders beginning in February. The entire Master Plan process will take approximately 18-22 months.
20 | Page FY17 Public Works Strategic Work Plan
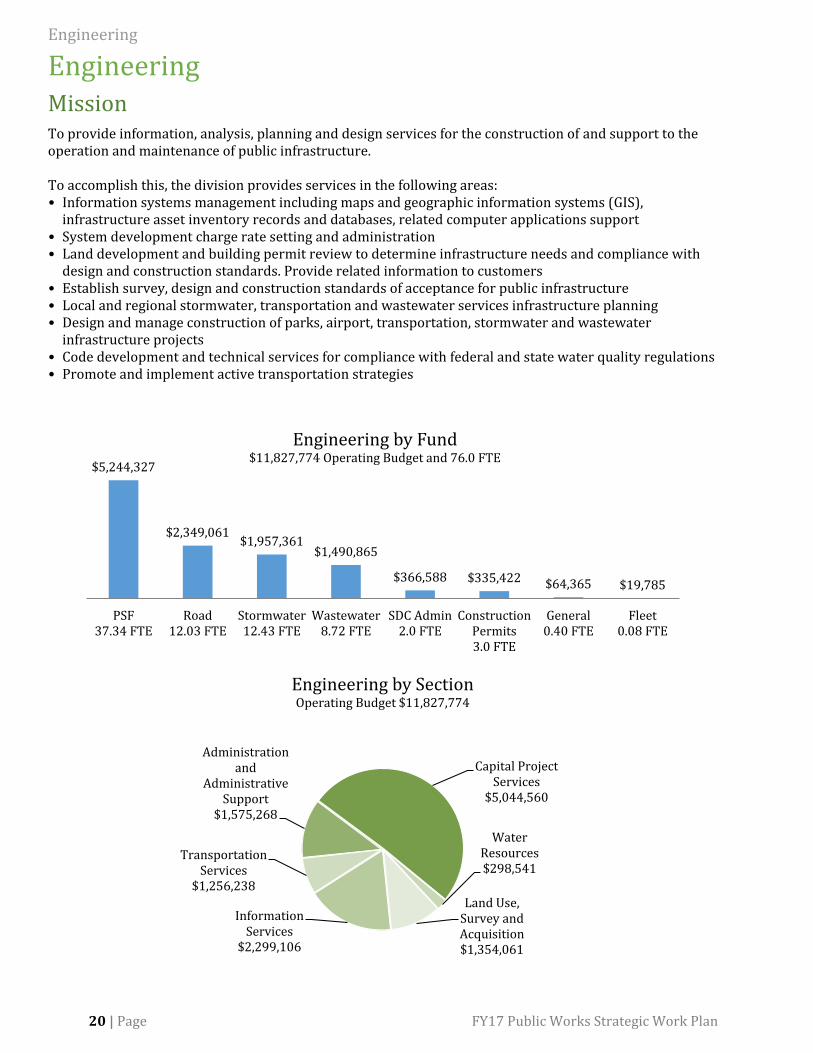
Engineering Mission To provide information, analysis, planning and design services for the construction of and support to the operation and maintenance of public infrastructure. To accomplish this, the division provides services in the following areas: • Information systems management including maps and geographic information systems (GIS),
infrastructure asset inventory records and databases, related computer applications support • System development charge rate setting and administration • Land development and building permit review to determine infrastructure needs and compliance with
design and construction standards. Provide related information to customers • Establish survey, design and construction standards of acceptance for public infrastructure • Local and regional stormwater, transportation and wastewater services infrastructure planning • Design and manage construction of parks, airport, transportation, stormwater and wastewater
infrastructure projects • Code development and technical services for compliance with federal and state water quality regulations • Promote and implement active transportation strategies
$5,244,327
$2,349,061$1,957,361
$1,490,865
$366,588 $335,422 $64,365 $19,785
PSF37.34 FTE
Road12.03 FTE
Stormwater12.43 FTE
Wastewater8.72 FTE
SDC Admin2.0 FTE
ConstructionPermits3.0 FTE
General0.40 FTE
Fleet0.08 FTE
Engineering by Fund$11,827,774 Operating Budget and 76.0 FTE
Administration and
Administrative Support
$1,575,268
Capital Project Services
$5,044,560
Water Resources$298,541
Land Use, Survey and Acquisition$1,354,061
Information Services
$2,299,106
Transportation Services
$1,256,238
Engineering by SectionOperating Budget $11,827,774
FY17 Public Works Strategic Work Plan 21 | Page
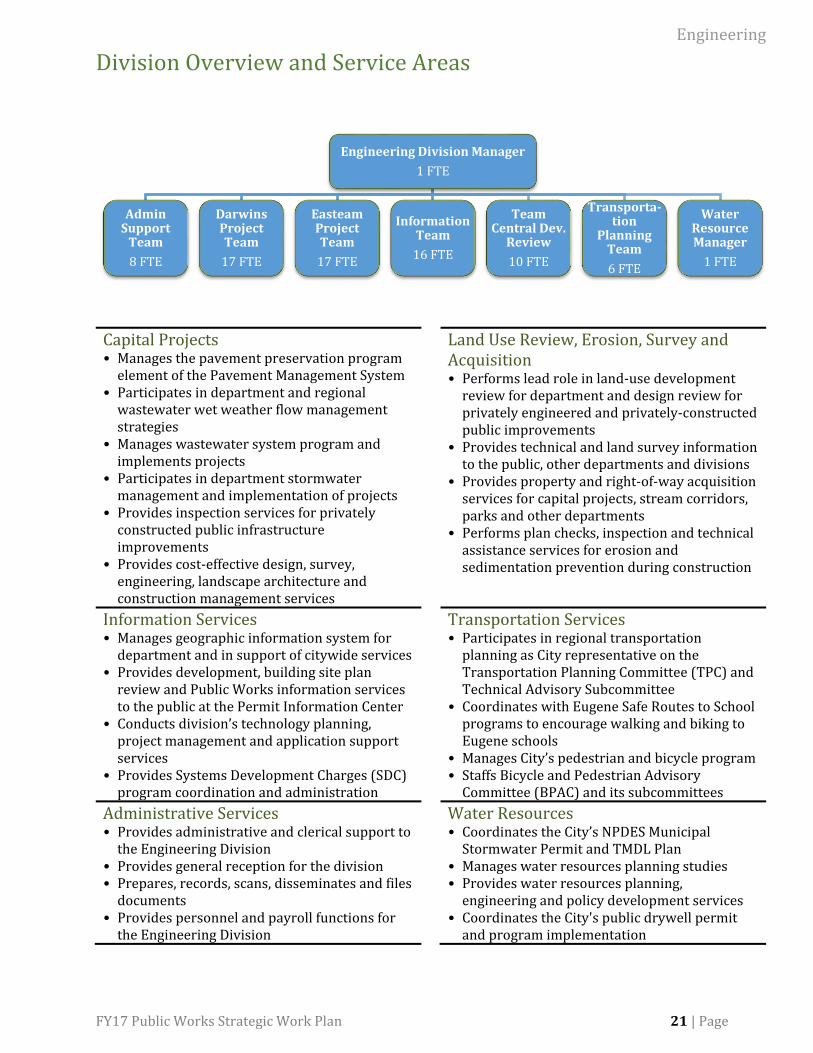
Division Overview and Service Areas
Capital Projects • Manages the pavement preservation program
element of the Pavement Management System • Participates in department and regional
wastewater wet weather flow management strategies
• Manages wastewater system program and implements projects
• Participates in department stormwater management and implementation of projects
• Provides inspection services for privately constructed public infrastructure improvements
• Provides cost-effective design, survey, engineering, landscape architecture and construction management services
Land Use Review, Erosion, Survey and Acquisition • Performs lead role in land-use development
review for department and design review for privately engineered and privately-constructed public improvements
• Provides technical and land survey information to the public, other departments and divisions
• Provides property and right-of-way acquisition services for capital projects, stream corridors, parks and other departments
• Performs plan checks, inspection and technical assistance services for erosion and sedimentation prevention during construction
Information Services • Manages geographic information system for
department and in support of citywide services • Provides development, building site plan
review and Public Works information services to the public at the Permit Information Center
• Conducts division’s technology planning, project management and application support services
• Provides Systems Development Charges (SDC) program coordination and administration
Transportation Services • Participates in regional transportation
planning as City representative on the Transportation Planning Committee (TPC) and Technical Advisory Subcommittee
• Coordinates with Eugene Safe Routes to School programs to encourage walking and biking to Eugene schools
• Manages City’s pedestrian and bicycle program • Staffs Bicycle and Pedestrian Advisory
Committee (BPAC) and its subcommittees
Administrative Services • Provides administrative and clerical support to
the Engineering Division • Provides general reception for the division • Prepares, records, scans, disseminates and files
documents • Provides personnel and payroll functions for
the Engineering Division
Water Resources • Coordinates the City’s NPDES Municipal
Stormwater Permit and TMDL Plan • Manages water resources planning studies • Provides water resources planning,
engineering and policy development services • Coordinates the City's public drywell permit
and program implementation
Engineering Division Manager
1 FTE
Admin Support
Team
8 FTE
Darwins Project Team
17 FTE
Easteam Project Team
17 FTE
Information Team
16 FTE
Team Central Dev.
Review
10 FTE
Transporta-tion
Planning Team
6 FTE
Water Resource Manager
1 FTE
22 | Page FY17 Public Works Strategic Work Plan
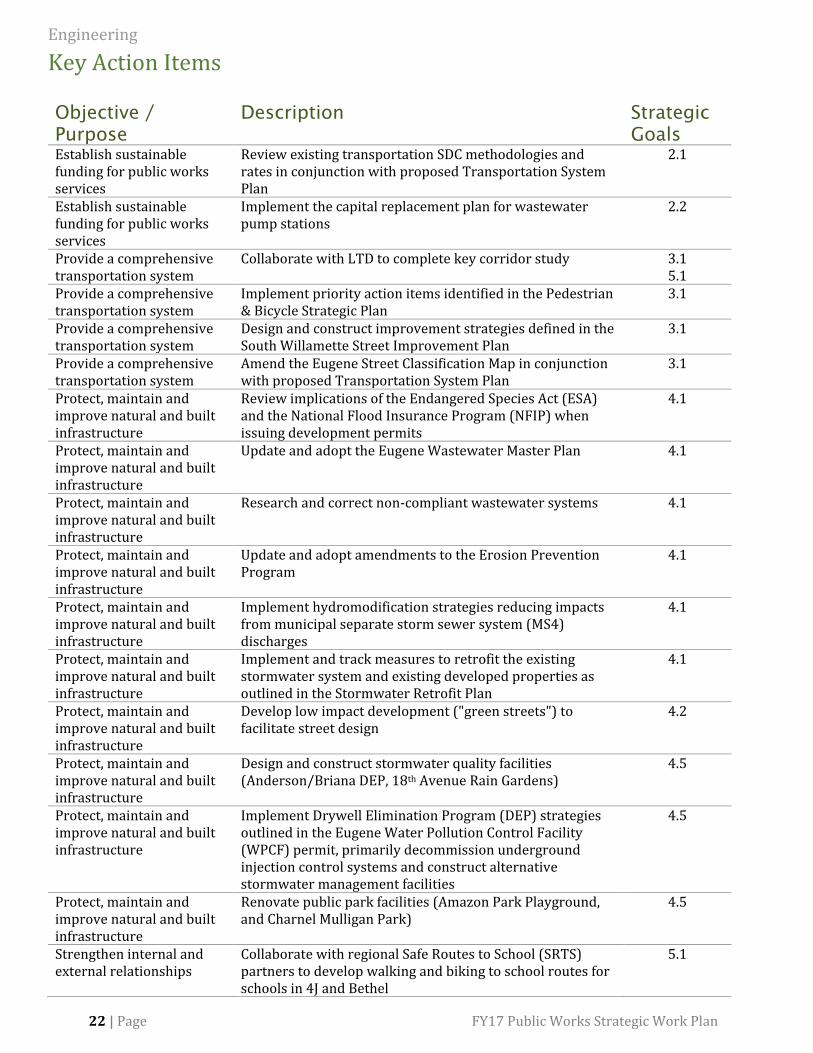
Key Action Items
Objective /
Purpose
Description Strategic
Goals
Establish sustainable funding for public works services
Review existing transportation SDC methodologies and rates in conjunction with proposed Transportation System Plan
2.1
Establish sustainable funding for public works services
Implement the capital replacement plan for wastewater pump stations
2.2
Provide a comprehensive transportation system
Collaborate with LTD to complete key corridor study 3.1 5.1
Provide a comprehensive transportation system
Implement priority action items identified in the Pedestrian & Bicycle Strategic Plan
3.1
Provide a comprehensive transportation system
Design and construct improvement strategies defined in the South Willamette Street Improvement Plan
3.1
Provide a comprehensive transportation system
Amend the Eugene Street Classification Map in conjunction with proposed Transportation System Plan
3.1
Protect, maintain and improve natural and built infrastructure
Review implications of the Endangered Species Act (ESA) and the National Flood Insurance Program (NFIP) when issuing development permits
4.1
Protect, maintain and improve natural and built infrastructure
Update and adopt the Eugene Wastewater Master Plan 4.1
Protect, maintain and improve natural and built infrastructure
Research and correct non-compliant wastewater systems 4.1
Protect, maintain and improve natural and built infrastructure
Update and adopt amendments to the Erosion Prevention Program
4.1
Protect, maintain and improve natural and built infrastructure
Implement hydromodification strategies reducing impacts from municipal separate storm sewer system (MS4) discharges
4.1
Protect, maintain and improve natural and built infrastructure
Implement and track measures to retrofit the existing stormwater system and existing developed properties as outlined in the Stormwater Retrofit Plan
4.1
Protect, maintain and improve natural and built infrastructure
Develop low impact development ("green streets") to facilitate street design
4.2
Protect, maintain and improve natural and built infrastructure
Design and construct stormwater quality facilities (Anderson/Briana DEP, 18th Avenue Rain Gardens)
4.5
Protect, maintain and improve natural and built infrastructure
Implement Drywell Elimination Program (DEP) strategies outlined in the Eugene Water Pollution Control Facility (WPCF) permit, primarily decommission underground injection control systems and construct alternative stormwater management facilities
4.5
Protect, maintain and improve natural and built infrastructure
Renovate public park facilities (Amazon Park Playground, and Charnel Mulligan Park)
4.5
Strengthen internal and external relationships
Collaborate with regional Safe Routes to School (SRTS) partners to develop walking and biking to school routes for schools in 4J and Bethel
5.1
FY17 Public Works Strategic Work Plan 23 | Page
Objective /
Purpose
Description Strategic
Goals
Strengthen internal and external relationships
Plan and implement open street events (Eugene Sunday Streets, Downtown, and South University Neighborhood)
5.1
Strengthen internal and external relationships
Participate with ODOT and regional partners in Beltline Facility Plan (Coburg Road to River Road)
5.2
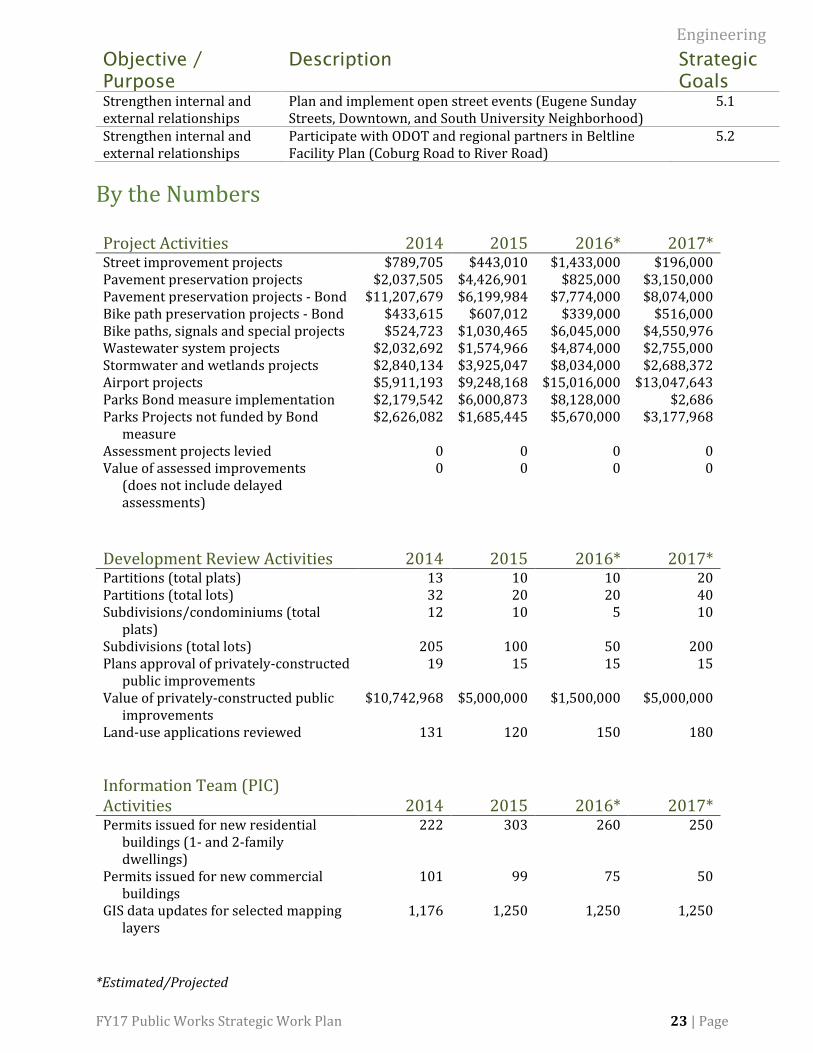
By the Numbers
Project Activities 2014 2015 2016* 2017* Street improvement projects $789,705 $443,010 $1,433,000 $196,000 Pavement preservation projects $2,037,505 $4,426,901 $825,000 $3,150,000 Pavement preservation projects - Bond $11,207,679 $6,199,984 $7,774,000 $8,074,000 Bike path preservation projects - Bond $433,615 $607,012 $339,000 $516,000 Bike paths, signals and special projects $524,723 $1,030,465 $6,045,000 $4,550,976 Wastewater system projects $2,032,692 $1,574,966 $4,874,000 $2,755,000 Stormwater and wetlands projects $2,840,134 $3,925,047 $8,034,000 $2,688,372 Airport projects $5,911,193 $9,248,168 $15,016,000 $13,047,643 Parks Bond measure implementation $2,179,542 $6,000,873 $8,128,000 $2,686 Parks Projects not funded by Bond
measure $2,626,082 $1,685,445 $5,670,000 $3,177,968
Assessment projects levied 0 0 0 0 Value of assessed improvements
(does not include delayed assessments)
0 0 0 0
Development Review Activities 2014 2015 2016* 2017* Partitions (total plats) 13 10 10 20 Partitions (total lots) 32 20 20 40 Subdivisions/condominiums (total
plats) 12 10 5 10
Subdivisions (total lots) 205 100 50 200 Plans approval of privately-constructed
public improvements 19 15 15 15
Value of privately-constructed public improvements
$10,742,968 $5,000,000 $1,500,000 $5,000,000
Land-use applications reviewed 131 120 150 180
Information Team (PIC) Activities 2014 2015 2016* 2017* Permits issued for new residential
buildings (1- and 2-family dwellings)
222 303 260 250
Permits issued for new commercial buildings
101 99 75 50
GIS data updates for selected mapping layers
1,176 1,250 1,250 1,250
*Estimated/Projected
24 | Page FY17 Public Works Strategic Work Plan
Trends Affecting the Division
Pavement Program
Drives Capital Projects
In November 2012, Eugene voters approved a five-year plan to continue repairing its backlog of streets in need of maintenance. The $43 million, five-year plan funded by general obligation bonds is being used to repave approximately 74 lane miles of streets and fund pedestrian and bicycle projects. The summer of 2016 marks the third year of construction under the bond measure.
The pavement preservation program represents the majority of the capital projects implemented by the Engineering Division. In advance of pavement work, stormwater and wastewater rehabilitation work is completed to assure that the City's underground utilities are in good repair prior to pavement work. Stormwater quality improvement opportunities are also implemented in conjunction with pavement improvements.
The proceeds of the 2008 and 2012 bond measures in addition to the local motor vehicle fuel tax of $0.05 per gallon and the reimbursement component of the transportation system development charge represent a significant investment in the preservation of the City’s transportation infrastructure. However, there is still a significant pavement preservation backlog, and the City has not fully met its goal of establishing a locally controlled and sustainable source of funding for pavement preservation.
Sustainability
Influences Engineering
Work
In February 2000, the Eugene City Council adopted a resolution committing city elected officials and staff to abide by sustainable practices in carrying out their duties. The resolution states: “The concept of sustainability guides city policy and actions. The City of Eugene is committed to meeting its current needs without compromising the ability of future generations to meet their own needs. The City will ensure that each of its policy decisions and programs are interconnected through the common bond of sustainability as expressed in these principles. The cumulative and long-term impacts of policy choices will be considered as we work to ensure a sustainable legacy.”
Sustainability and the triple bottom line framework will continue to be strong influences guiding work practices.
The pavement preservation program has provided numerous positive opportunities to affect the community's environment, economy and social equity. Examples include the use of warm mix asphalt, outreach to businesses to minimize construction impacts and replacement of access ramps to meet current ADA guidelines.
Policies Encourage
Active Transportation
The Eugene City Council's policy direction through the Community Climate and Energy Action Plan, the Pedestrian and Bicycle Master Plan, and the Public Works Department's Strategic Plan have placed an increased importance
on active modes of transportation. The division has established a Bicycle Pedestrian Advisory Committee to guide its efforts in making the City more walkable and bike friendly. This has led to the City being recognized at the gold level by national pedestrian and bicycle advocacy groups.
The 2012 pavement bond measure set aside more than $500,000 annually for pedestrian and bicycle improvements. The City continues to be successful in numerous state and federal grants for bicycle and pedestrian projects. It is anticipated that this success will continue and the pedestrian and bicycle network will continue to expand.
The Engineering Division has developed and implemented numerous successful events such as Breakfast at the Bridges, Smart Trips and Sunday Streets. These events and programs are intended to increase the interest in walking and biking while at the same time building community.
Pursuing “Vision Zero”
In late 2015, the City Council passed a resolution supporting Vision Zero, a national movement that calls for eliminating deaths and serious injuries on the transportation system. In 2016, a Vision Zero Task Force that includes community stakeholders and staff from the City and partner agencies will be created. The Task Force will be charged with developing a Vision Zero Action Plan. The plan will be multidisciplinary including education, engineering and enforcement.
FY17 Public Works Strategic Work Plan 25 | Page
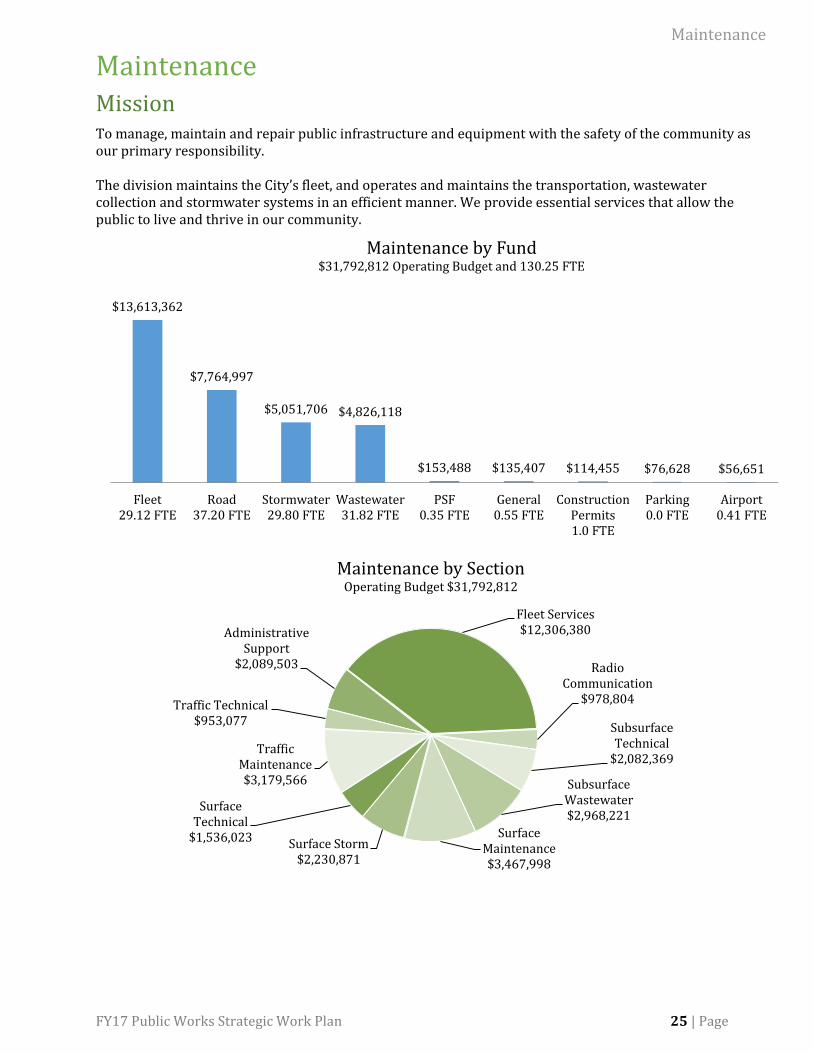
Maintenance Mission To manage, maintain and repair public infrastructure and equipment with the safety of the community as our primary responsibility. The division maintains the City’s fleet, and operates and maintains the transportation, wastewater collection and stormwater systems in an efficient manner. We provide essential services that allow the public to live and thrive in our community.
$13,613,362
$7,764,997
$5,051,706 $4,826,118
$153,488 $135,407 $114,455 $76,628 $56,651
Fleet29.12 FTE
Road37.20 FTE
Stormwater29.80 FTE
Wastewater31.82 FTE
PSF0.35 FTE
General0.55 FTE
ConstructionPermits1.0 FTE
Parking0.0 FTE
Airport0.41 FTE
Maintenance by Fund$31,792,812 Operating Budget and 130.25 FTE
Administrative Support
$2,089,503
Fleet Services$12,306,380
Radio Communication
$978,804
Subsurface Technical
$2,082,369
Subsurface Wastewater$2,968,221
Surface Maintenance$3,467,998
Surface Storm$2,230,871
Surface Technical
$1,536,023
Traffic Maintenance$3,179,566
Traffic Technical$953,077
Maintenance by SectionOperating Budget $31,792,812
26 | Page FY17 Public Works Strategic Work Plan
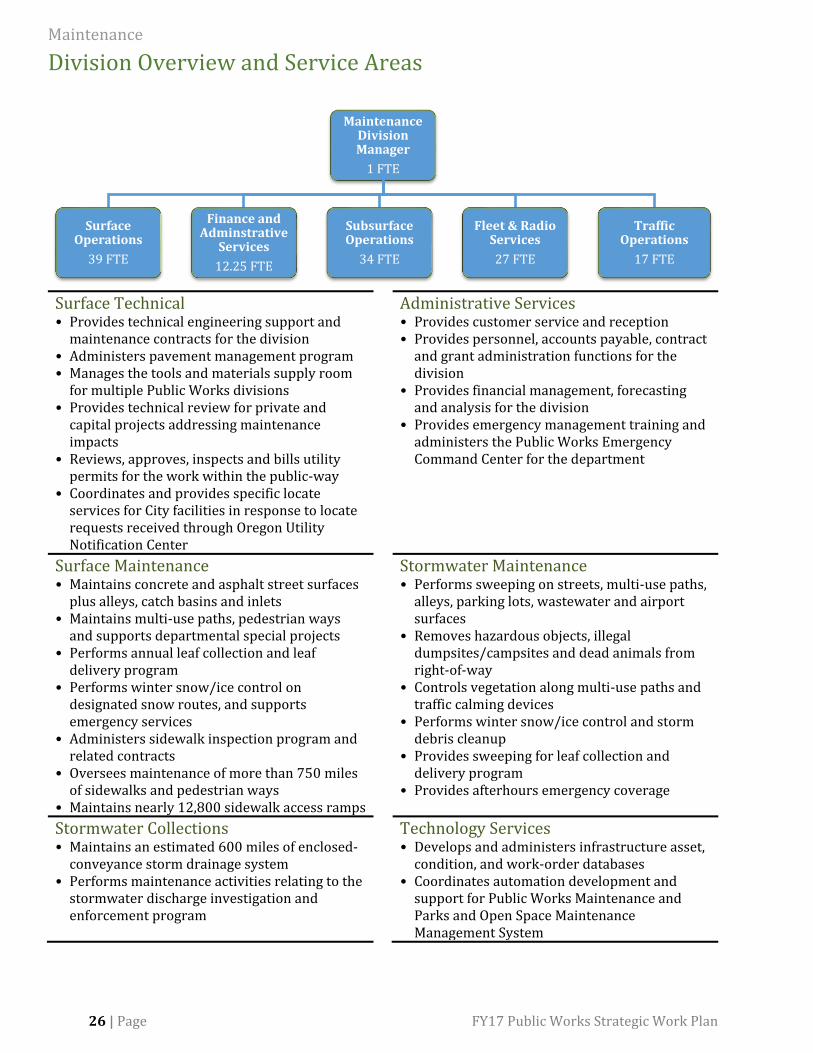
Division Overview and Service Areas
Surface Technical • Provides technical engineering support and
maintenance contracts for the division • Administers pavement management program • Manages the tools and materials supply room
for multiple Public Works divisions • Provides technical review for private and
capital projects addressing maintenance impacts
• Reviews, approves, inspects and bills utility permits for the work within the public-way
• Coordinates and provides specific locate services for City facilities in response to locate requests received through Oregon Utility Notification Center
Administrative Services • Provides customer service and reception • Provides personnel, accounts payable, contract
and grant administration functions for the division
• Provides financial management, forecasting and analysis for the division
• Provides emergency management training and administers the Public Works Emergency Command Center for the department
Surface Maintenance • Maintains concrete and asphalt street surfaces
plus alleys, catch basins and inlets • Maintains multi-use paths, pedestrian ways
and supports departmental special projects • Performs annual leaf collection and leaf
delivery program • Performs winter snow/ice control on
designated snow routes, and supports emergency services
• Administers sidewalk inspection program and related contracts
• Oversees maintenance of more than 750 miles of sidewalks and pedestrian ways
• Maintains nearly 12,800 sidewalk access ramps
Stormwater Maintenance • Performs sweeping on streets, multi-use paths,
alleys, parking lots, wastewater and airport surfaces
• Removes hazardous objects, illegal dumpsites/campsites and dead animals from right-of-way
• Controls vegetation along multi-use paths and traffic calming devices
• Performs winter snow/ice control and storm debris cleanup
• Provides sweeping for leaf collection and delivery program
• Provides afterhours emergency coverage
Stormwater Collections • Maintains an estimated 600 miles of enclosed-
conveyance storm drainage system • Performs maintenance activities relating to the
stormwater discharge investigation and enforcement program
Technology Services • Develops and administers infrastructure asset,
condition, and work-order databases • Coordinates automation development and
support for Public Works Maintenance and Parks and Open Space Maintenance Management System
Maintenance Division Manager
1 FTE
Surface Operations
39 FTE
Finance and Adminstrative
Services
12.25 FTE
Subsurface Operations
34 FTE
Fleet & Radio Services
27 FTE
Traffic Operations
17 FTE
FY17 Public Works Strategic Work Plan 27 | Page
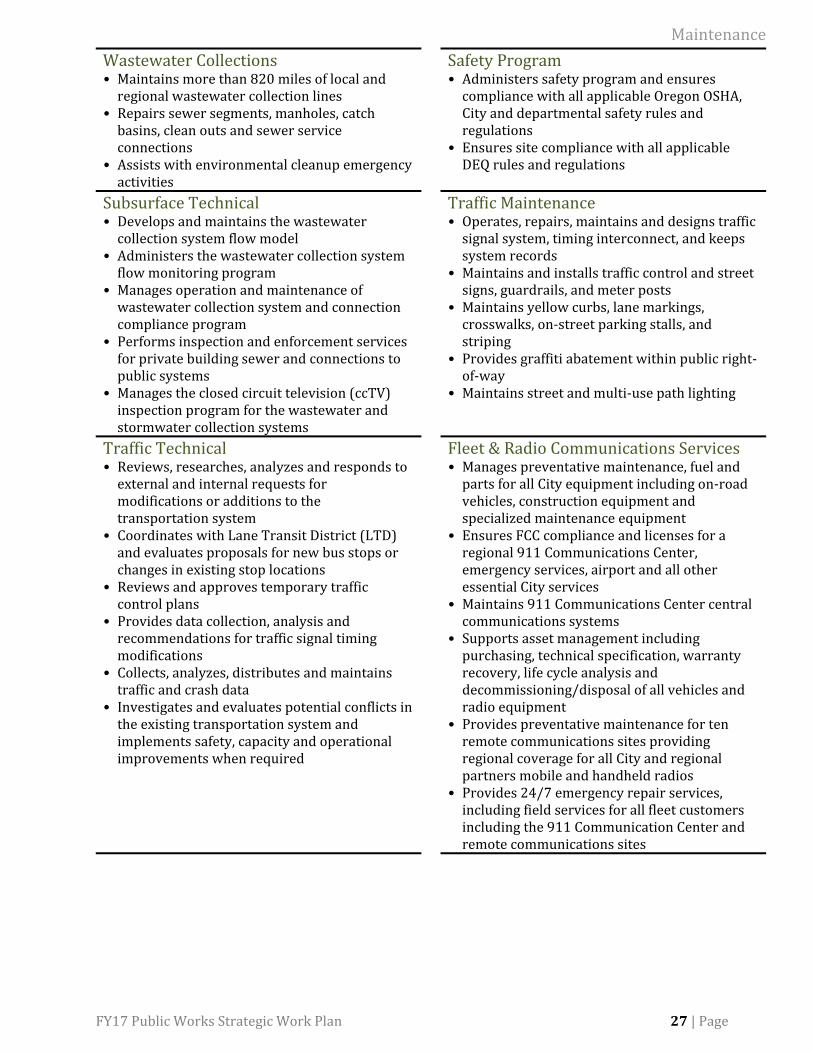
Wastewater Collections • Maintains more than 820 miles of local and
regional wastewater collection lines • Repairs sewer segments, manholes, catch
basins, clean outs and sewer service connections
• Assists with environmental cleanup emergency activities
Safety Program • Administers safety program and ensures
compliance with all applicable Oregon OSHA, City and departmental safety rules and regulations
• Ensures site compliance with all applicable DEQ rules and regulations
Subsurface Technical • Develops and maintains the wastewater
collection system flow model • Administers the wastewater collection system
flow monitoring program • Manages operation and maintenance of
wastewater collection system and connection compliance program
• Performs inspection and enforcement services for private building sewer and connections to public systems
• Manages the closed circuit television (ccTV) inspection program for the wastewater and stormwater collection systems
Traffic Maintenance • Operates, repairs, maintains and designs traffic
signal system, timing interconnect, and keeps system records
• Maintains and installs traffic control and street signs, guardrails, and meter posts
• Maintains yellow curbs, lane markings, crosswalks, on-street parking stalls, and striping
• Provides graffiti abatement within public right-of-way
• Maintains street and multi-use path lighting
Traffic Technical • Reviews, researches, analyzes and responds to
external and internal requests for modifications or additions to the transportation system
• Coordinates with Lane Transit District (LTD) and evaluates proposals for new bus stops or changes in existing stop locations
• Reviews and approves temporary traffic control plans
• Provides data collection, analysis and recommendations for traffic signal timing modifications
• Collects, analyzes, distributes and maintains traffic and crash data
• Investigates and evaluates potential conflicts in the existing transportation system and implements safety, capacity and operational improvements when required
Fleet & Radio Communications Services • Manages preventative maintenance, fuel and
parts for all City equipment including on-road vehicles, construction equipment and specialized maintenance equipment
• Ensures FCC compliance and licenses for a regional 911 Communications Center, emergency services, airport and all other essential City services
• Maintains 911 Communications Center central communications systems
• Supports asset management including purchasing, technical specification, warranty recovery, life cycle analysis and decommissioning/disposal of all vehicles and radio equipment
• Provides preventative maintenance for ten remote communications sites providing regional coverage for all City and regional partners mobile and handheld radios
• Provides 24/7 emergency repair services, including field services for all fleet customers including the 911 Communication Center and remote communications sites
28 | Page FY17 Public Works Strategic Work Plan
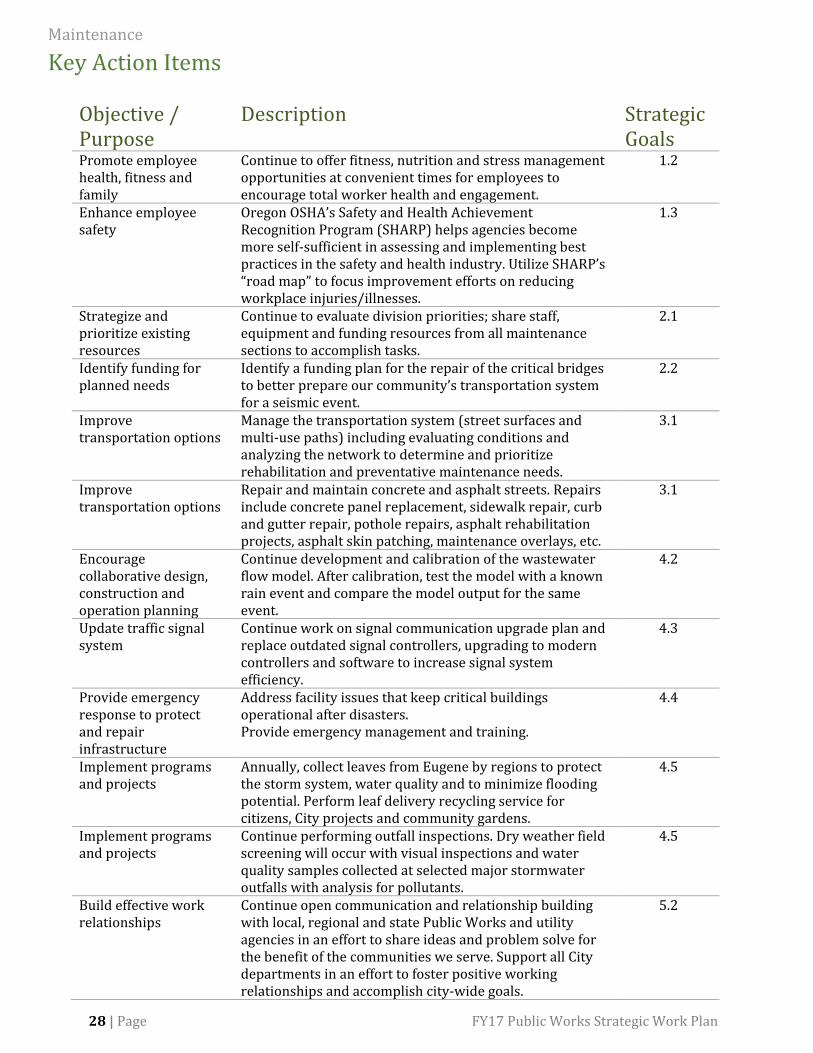
Key Action Items
Objective / Purpose
Description Strategic Goals
Promote employee health, fitness and family
Continue to offer fitness, nutrition and stress management opportunities at convenient times for employees to encourage total worker health and engagement.
1.2
Enhance employee safety
Oregon OSHA’s Safety and Health Achievement Recognition Program (SHARP) helps agencies become more self-sufficient in assessing and implementing best practices in the safety and health industry. Utilize SHARP’s “road map” to focus improvement efforts on reducing workplace injuries/illnesses.
1.3
Strategize and prioritize existing resources
Continue to evaluate division priorities; share staff, equipment and funding resources from all maintenance sections to accomplish tasks.
2.1
Identify funding for planned needs
Identify a funding plan for the repair of the critical bridges to better prepare our community’s transportation system for a seismic event.
2.2
Improve transportation options
Manage the transportation system (street surfaces and multi-use paths) including evaluating conditions and analyzing the network to determine and prioritize rehabilitation and preventative maintenance needs.
3.1
Improve transportation options
Repair and maintain concrete and asphalt streets. Repairs include concrete panel replacement, sidewalk repair, curb and gutter repair, pothole repairs, asphalt rehabilitation projects, asphalt skin patching, maintenance overlays, etc.
3.1
Encourage collaborative design, construction and operation planning
Continue development and calibration of the wastewater flow model. After calibration, test the model with a known rain event and compare the model output for the same event.
4.2
Update traffic signal system
Continue work on signal communication upgrade plan and replace outdated signal controllers, upgrading to modern controllers and software to increase signal system efficiency.
4.3
Provide emergency response to protect and repair infrastructure
Address facility issues that keep critical buildings operational after disasters. Provide emergency management and training.
4.4
Implement programs and projects
Annually, collect leaves from Eugene by regions to protect the storm system, water quality and to minimize flooding potential. Perform leaf delivery recycling service for citizens, City projects and community gardens.
4.5
Implement programs and projects
Continue performing outfall inspections. Dry weather field screening will occur with visual inspections and water quality samples collected at selected major stormwater outfalls with analysis for pollutants.
4.5
Build effective work relationships
Continue open communication and relationship building with local, regional and state Public Works and utility agencies in an effort to share ideas and problem solve for the benefit of the communities we serve. Support all City departments in an effort to foster positive working relationships and accomplish city-wide goals.
5.2
FY17 Public Works Strategic Work Plan 29 | Page
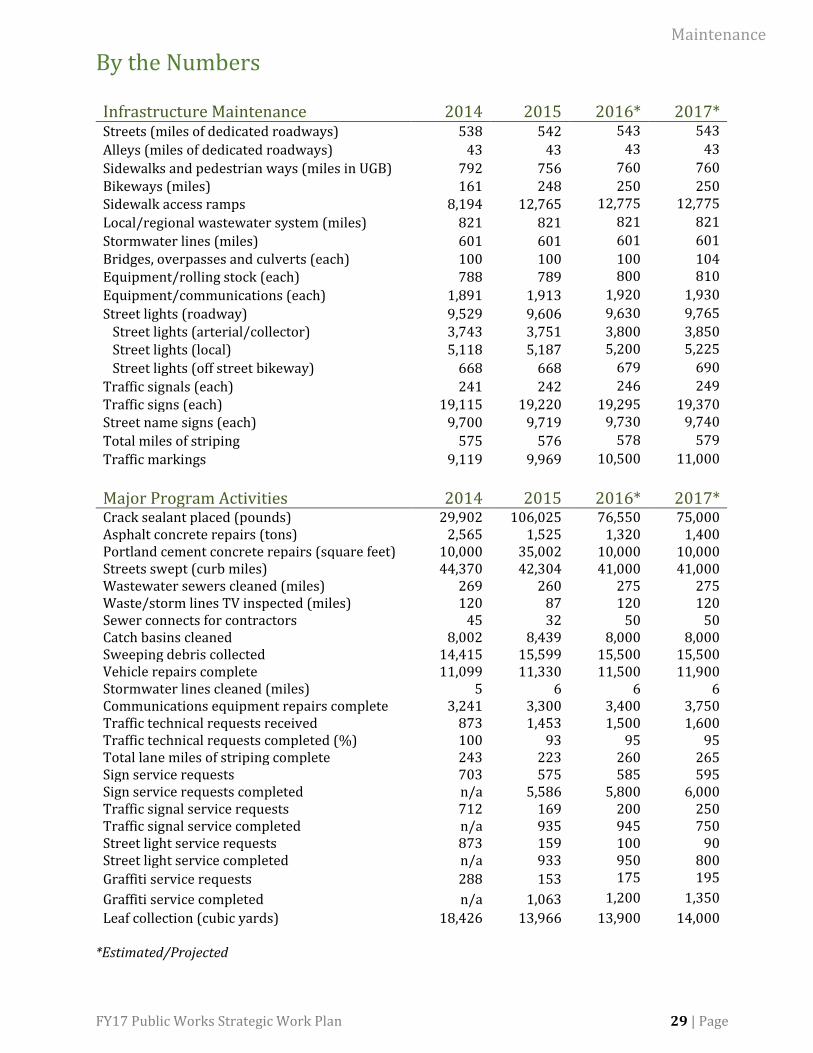
By the Numbers
Infrastructure Maintenance 2014 2015 2016* 2017* Streets (miles of dedicated roadways) 538 542 543 543
Alleys (miles of dedicated roadways) 43 43 43 43
Sidewalks and pedestrian ways (miles in UGB) 792 756 760 760
Bikeways (miles) 161 248 250 250 Sidewalk access ramps 8,194 12,765 12,775 12,775
Local/regional wastewater system (miles) 821 821 821 821
Stormwater lines (miles) 601 601 601 601
Bridges, overpasses and culverts (each) 100 100 100 104 Equipment/rolling stock (each) 788 789 800 810
Equipment/communications (each) 1,891 1,913 1,920 1,930
Street lights (roadway) 9,529 9,606 9,630 9,765
Street lights (arterial/collector) 3,743 3,751 3,800 3,850 Street lights (local) 5,118 5,187 5,200 5,225
Street lights (off street bikeway) 668 668 679 690
Traffic signals (each) 241 242 246 249
Traffic signs (each) 19,115 19,220 19,295 19,370 Street name signs (each) 9,700 9,719 9,730 9,740
Total miles of striping 575 576 578 579
Traffic markings 9,119 9,969 10,500 11,000
Major Program Activities 2014 2015 2016* 2017* Crack sealant placed (pounds) 29,902 106,025 76,550 75,000 Asphalt concrete repairs (tons) 2,565 1,525 1,320 1,400 Portland cement concrete repairs (square feet) 10,000 35,002 10,000 10,000 Streets swept (curb miles) 44,370 42,304 41,000 41,000 Wastewater sewers cleaned (miles) 269 260 275 275 Waste/storm lines TV inspected (miles) 120 87 120 120 Sewer connects for contractors 45 32 50 50 Catch basins cleaned 8,002 8,439 8,000 8,000 Sweeping debris collected 14,415 15,599 15,500 15,500 Vehicle repairs complete 11,099 11,330 11,500 11,900 Stormwater lines cleaned (miles) 5 6 6 6 Communications equipment repairs complete 3,241 3,300 3,400 3,750 Traffic technical requests received 873 1,453 1,500 1,600 Traffic technical requests completed (%) 100 93 95 95 Total lane miles of striping complete 243 223 260 265 Sign service requests 703 575 585 595 Sign service requests completed n/a 5,586 5,800 6,000 Traffic signal service requests 712 169 200 250 Traffic signal service completed n/a 935 945 750 Street light service requests 873 159 100 90 Street light service completed n/a 933 950 800
Graffiti service requests 288 153 175 195
Graffiti service completed n/a 1,063 1,200 1,350
Leaf collection (cubic yards) 18,426 13,966 13,900 14,000 *Estimated/Projected
30 | Page FY17 Public Works Strategic Work Plan
Trends Affecting the Division
Traffic Signal Retiming
Increases Safety and
Reduces Air Pollution
The Traffic Technical team is developing a traffic signal retiming program with a primary objective of increasing overall safety and reducing pollution from vehicle emissions. Strategies include minimization of stops, delay, fuel consumption and air pollution emissions. The retiming process would look at existing timing designs and collect updated field data to enter into signal timing software that would be used to analyze cycle lengths, offsets, phase sequence, and other timing parameters as part of the process for the evaluation and implementation of signal timing changes.
Today, there are about 240 traffic signals in the City. The purpose of these traffic control devices is to assign right of way to all street users, including motorists, cyclists and pedestrians. Traffic Operations staff often respond to a significant amount of citizen inquiries regarding traffic signal operations related to intersection congestion, user delays, and increasing the overall safety of the intersection. Many studies have shown that traffic signal retiming can help with these type of inquires plus provide other benefits to help operate traffic signals more efficiently and safely.
Signal retiming offers significant benefits to the traveling public in reducing delay and stops and enhancing safety. Improving signal timing can also reduce fuel consumption, reduce emissions and increase air quality. Improved traffic flow also reduces pavement wear and tear. Finally, signal retiming provides opportunities
to check on signal controller settings, balancing the needs for all users including pedestrians, cyclists, motorists and transit.
Continuity of
Operations Planning
(COOP) Continues
The City is more aware of natural disasters than ever. Such awareness has made all sections, including Fleet Services, realize there are opportunities for improvements in order to ensure the continuity in services are provided during and after a disaster. In response, Fleet and Public Works, along with the entire City, are taking steps to improve the situation.
For Fleet, the significant items of interest to prepare for include fuel supply, communications, and an adequate operation structure. There are concerns the current fuel supply for the City is almost entirely located at Fleet’s fuel facility. The facility may not be accessible during some types of emergencies. The emergency communication network could fail. The 70-year-old Fleet building is not expected to survive any type of seismic event. In response, Fleet is working on fuel contingency plans that include partnering with outside agencies, adding additional fuel sites within the City and establishing a priority list for different users. Fleet is also investigating portable and back-up communications systems to supplement the existing radio network if it fails. Fleet will determine if an alternative location for repairs could be made available through cooperating with area partners. Enhancing emergency preparedness will help safeguard the City’s Fleet and Radio Services and increase the
likelihood of continuous operations during an emergency as much as possible.
Fleet Services
Collaborates with
Partner Agencies
The City of Eugene fleet manager began a standing meeting over a year ago known as the “Fleet Managers’ Breakfast.” The group started with managers from EWEB, Lane County and Eugene intending to share information, network and strategize ways to improve customer service levels. The group has grown to include four other local government agencies who also benefit from the ideas shared at these meetings. The group has discussed how to provide mutual aid in the event of a disaster as well as how to leverage collective resources on a daily basis. Through this effort, the group is now working to create a regional fuel supply contract for the agencies who wish to participate. The goal is to reduce fuel costs through a larger volume contract and reduce costs associated with contract administration. Additionally, this effort will provide a framework for mutual aid and cooperation in the event of an emergency. The Fleet Managers’ Breakfast has proved to be a great forum for establishing relationships, sharing ideas and pooling resources.
Fleet Continues toward
Streamlined Data
The technology world is growing at a dizzying pace that can be challenging to keep up with. Fleet, with support from amazing Public Works staff, has embraced opportunities to improve its reporting options for customers.
FY17 Public Works Strategic Work Plan 31 | Page
Completed projects provide on-line reporting allowing users access to real time, pertinent information. The goal is to give users the right information, at the right time, in a simple and approachable manner.
In the coming year, Fleet will continue to focus on improving data collection and how it is shared. Fleet will again try to streamline internal processes such as automated fuel tracking and repair requests. A major task will be to issue a request for proposal for the fuel system that will collect fuel and telematics* data automatically. (*Telematics is the blending of computers and wireless telecommunications technologies, ostensibly with the goal of efficiently conveying information over vast networks to improve a host of business functions or government-related public services.) This would streamline the process at the pump for users and for Fleet staff that monitor this data, saving time for everyone. The data captured would also include mileage and vehicle information such as engine codes, utilization, idle time, fuel economy or preventative maintenance requirements. Fleet’s goal is to provide more robust data for decision makers.
Utility Locate Requests
Increase
The City of Eugene subscribes to the 811 Oregon Utility Notification Center (OUNC) as an operator of underground facilities. The City is required to respond to utility locate requests received from the 811 center from any person intending to excavate.
Maintenance’s Surface Operations Technical team is composed of two full-time utility locators, who are responsible for locating stormwater and wastewater collection systems, along with
street lights and traffic signals. Upon receipt of the locate request the locators have two business days to locate and mark these facilities. Locators also respond to “Emergency Locates” within a two-hour response time. Another service provided is locating for “Pre-Surveys” which are called in by the City’s Public Works Engineering Department, other franchise utilities and private engineering firms to locate facilities for designing larger scope projects. In addition to standard 48-hour requests, 456 emergency locates and 225 pre-surveys were responded to this past year.
Since 2012, the number of locates has been on a steady incline. PW Engineering has identified 41 Pavement Preservation and Bond Measure projects to be constructed in 2016 and 2017. LTD’s EmX project is starting construction of phase two on W. 11th Avenue from Garfield Street to Commerce Street with construction continuing through 2017. It also appears that the number of subdivisions is on the rise. In 2015 the locators responded to 9,740 locate requests, a 20 % increase. This increase in utility locate requests is expected to continue to rise in the future.
New Generators and
Continuity of
Operational Service
Public Work Maintenance and Park and Open Spaces divisions’ 1820 Roosevelt Blvd facility will undergo the installation of two additional backup generators and electrical service upgrades required to provide optional standby power to the entire facility. This installation will allow all essential buildings and services at the facility to have electrical service in the event of a power
failure for up to three days without the need to refuel. Approximately 200 Public Works employees work at this facility, and having a sustainable power supply will allow for continuity of operations so that staff can continue to support the community.
The Roosevelt facility is also the location of the Public Works’ Emergency Command Center (ECC). The ECC is essential to emergency response coordination during emergencies or weather related events to provide strategic deployment of the Public Works’ resources. Having continuous electrical service is vital to support the ECC, communication and staff. Additionally, the City’s fleet service benefits from this service upgrade by having the ability to service and maintain the fleet inventory during power failures.
Continuity of operational service is essential to the work performed at the Roosevelt facility. Providing uninterrupted services to both internal and external customers is our goal during unexpected events.
Seismic Assessment of
Local Bridges
As part of the City’s ongoing effort to build resilience and prepare for the Cascadia Subduction Zone earthquake, Public Works Maintenance retained a local firm to perform a high-level seismic vulnerability assessment and retrofit prioritization of 31 local bridges. The report identified approximately $34 million in potential repairs and retrofits to address the vulnerabilities found. Over the next year, Public Works Maintenance and Engineering will work together to develop a funding plan to complete the necessary work to keep our
32 | Page FY17 Public Works Strategic Work Plan
transportation system functional after a major earthquake.
Sidewalk Inspection
Program Focuses on
Downtown and
University Areas
In August 2021, the IAAF World Track and Field Championships will be held in Eugene. The primary mode of transportation will involve walking as participants and attendees move between accommodations, restaurants, practices, main event venues and sightseeing around town. In preparation for this size of event, sidewalks within the central downtown and university area require inspection as the first step to providing a safe transportation corridor. This process will involve inspection and documentation of approximately 70 miles of sidewalk.
Eugene Code assigns the responsibility for sidewalk maintenance and repair to the adjacent property owner. The Sidewalk Inspection Program works with property owners to identify corrective measures when the program becomes aware of hazards. These hazards are identified by citizens, property owners and during inspections by the City. Frequently, the sidewalk condition is directly influenced by public trees, which are a valuable asset to the property owners and community alike. Identifying solutions that meet the needs of pedestrians and protect trees takes a significant amount of coordination time.
Inspection and coordinating repairs will require at least five years, along with adequate resources to accomplish this task. Resource enhancements include the development of sidewalk tracking software and additional
support for the inspection and data collection.
Having safe, ADA compliant sidewalks during the World Track and Field Championships will help ensure safety amongst the thousands of people expected during this international event.
Subsurface to Focus on
Bottomless Catch
Basins
Public Works Maintenance Subsurface operations team has identified a two-year work plan to improve infrastructure in the University area. The plan includes restarting efforts to rehabilitate catch basins. These specific catch basins, which are within the City’s stormwater infrastructure system, don’t have concrete bottoms. As part of normal development, bottomless catch basins were created in Eugene and many other communities. Maintaining bottomless catch basins requires the use of a Vactor truck, which removes debris using high-powered vacuum force. In time, removing the subgrade material with the Vactor truck creates deeper, wider sumps that deteriorate the integrity of the catch basin as well as the road surface above. Other consequences include potential surface hazards and costly road repairs. Rehabilitation of these catch basins includes adding gravel to the desired depth and pouring concrete to create a bottom to the catch basin. The work plan includes rehabilitating sixty bottomless catch basins.
Traffic Operations
Prepares for Visitors
With the 2016 U.S. Track and Field trials and the 2021 IAAF World Championships coming to Eugene, Traffic operations are working closely with the City’s Parking Services and the
University of Oregon’s CommUniversity, the Student Neighborhood Ambassadors Volunteer Program. The goal of this collaboration is to help people navigate their way around a little better and to assist with on street parking regulations.
One strategy Traffic operations will utilize to help visitors navigate includes improving signage in the University-area. Specifically, wood posts that secure street signs and Zone B parking signs will be upgraded to steel posts, which have been proved to cut down on street sign theft.
Traffic staff will also paint yellow curbs in the University-area to assist visitors in understanding parking regulations. Additionally, the yellow curb at intersections in the West University Neighborhood will have the street names stenciled on them with the help of the CommUniversity volunteers.
Increasing street and parking signage, installing theft-proof sign posts, and adding stenciled street names on yellow curbs will benefit locals and visitors utilizing all modes of transportation during the upcoming sporting events and beyond.
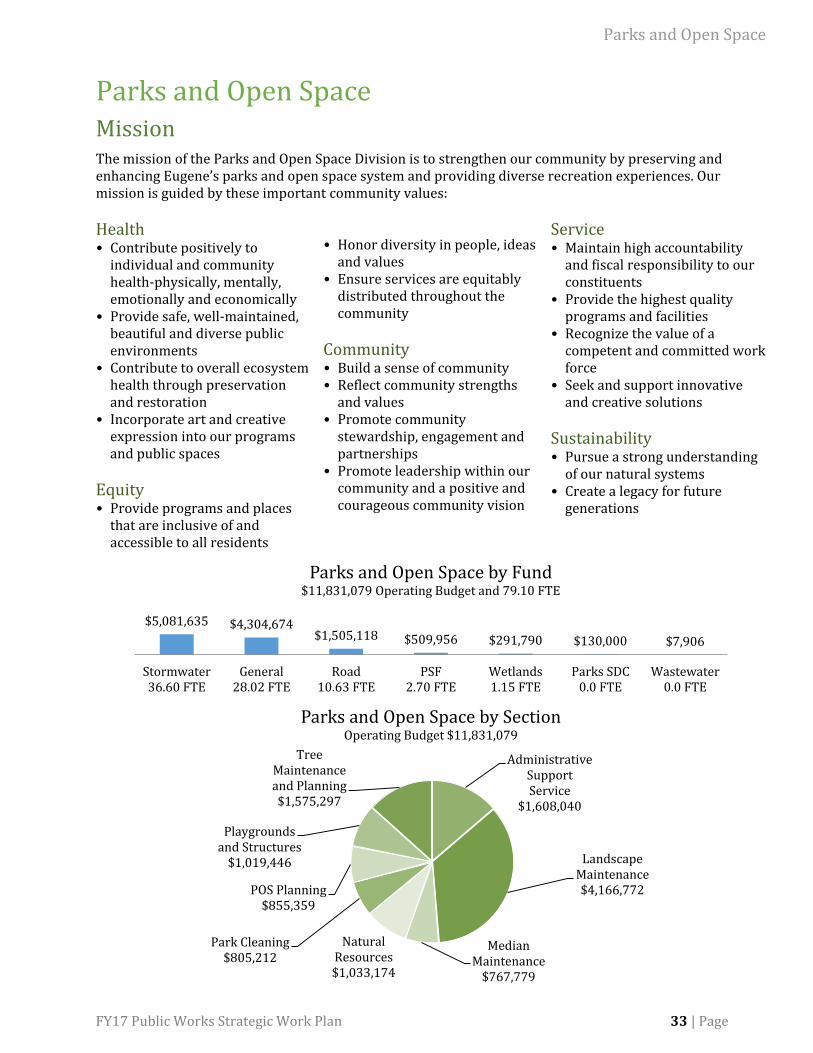
FY17 Public Works Strategic Work Plan 33 | Page
Parks and Open Space Mission The mission of the Parks and Open Space Division is to strengthen our community by preserving and enhancing Eugene’s parks and open space system and providing diverse recreation experiences. Our mission is guided by these important community values:
Health • Contribute positively to
individual and community health-physically, mentally, emotionally and economically
• Provide safe, well-maintained, beautiful and diverse public environments
• Contribute to overall ecosystem health through preservation and restoration
• Incorporate art and creative expression into our programs and public spaces
Equity • Provide programs and places
that are inclusive of and accessible to all residents
• Honor diversity in people, ideas
and values • Ensure services are equitably
distributed throughout the community
Community • Build a sense of community • Reflect community strengths
and values • Promote community
stewardship, engagement and partnerships
• Promote leadership within our community and a positive and courageous community vision
Service • Maintain high accountability
and fiscal responsibility to our constituents
• Provide the highest quality programs and facilities
• Recognize the value of a competent and committed work force
• Seek and support innovative and creative solutions
Sustainability • Pursue a strong understanding
of our natural systems • Create a legacy for future
generations
$5,081,635 $4,304,674$1,505,118 $509,956 $291,790 $130,000 $7,906
Stormwater36.60 FTE
General28.02 FTE
Road10.63 FTE
PSF2.70 FTE
Wetlands1.15 FTE
Parks SDC0.0 FTE
Wastewater0.0 FTE
Parks and Open Space by Fund$11,831,079 Operating Budget and 79.10 FTE
Administrative Support Service
$1,608,040
Landscape Maintenance$4,166,772
Median Maintenance
$767,779
Natural Resources$1,033,174
Park Cleaning$805,212
POS Planning$855,359
Playgrounds and Structures
$1,019,446
Tree Maintenance and Planning$1,575,297
Parks and Open Space by SectionOperating Budget $11,831,079
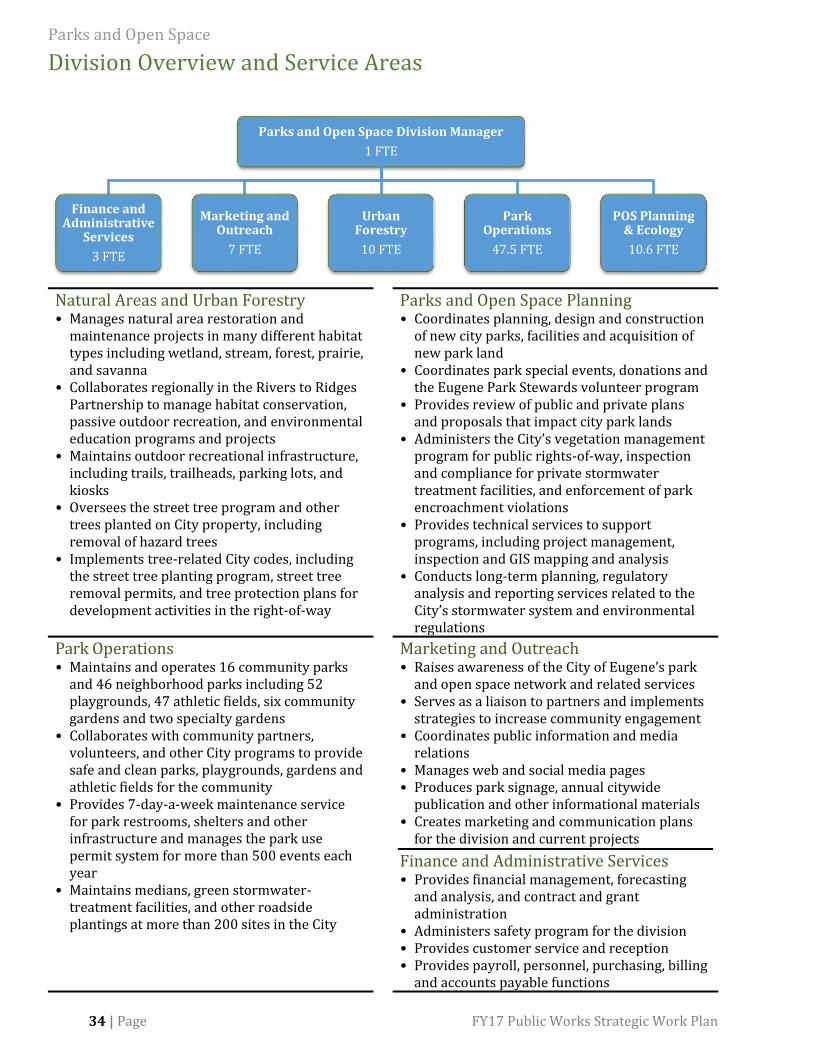
34 | Page FY17 Public Works Strategic Work Plan
Division Overview and Service Areas
Natural Areas and Urban Forestry • Manages natural area restoration and
maintenance projects in many different habitat types including wetland, stream, forest, prairie, and savanna
• Collaborates regionally in the Rivers to Ridges Partnership to manage habitat conservation, passive outdoor recreation, and environmental education programs and projects
• Maintains outdoor recreational infrastructure, including trails, trailheads, parking lots, and kiosks
• Oversees the street tree program and other trees planted on City property, including removal of hazard trees
• Implements tree-related City codes, including the street tree planting program, street tree removal permits, and tree protection plans for development activities in the right-of-way
Parks and Open Space Planning • Coordinates planning, design and construction
of new city parks, facilities and acquisition of new park land
• Coordinates park special events, donations and the Eugene Park Stewards volunteer program
• Provides review of public and private plans and proposals that impact city park lands
• Administers the City’s vegetation management program for public rights-of-way, inspection and compliance for private stormwater treatment facilities, and enforcement of park encroachment violations
• Provides technical services to support programs, including project management, inspection and GIS mapping and analysis
• Conducts long-term planning, regulatory analysis and reporting services related to the City’s stormwater system and environmental regulations
Park Operations • Maintains and operates 16 community parks
and 46 neighborhood parks including 52 playgrounds, 47 athletic fields, six community gardens and two specialty gardens
• Collaborates with community partners, volunteers, and other City programs to provide safe and clean parks, playgrounds, gardens and athletic fields for the community
• Provides 7-day-a-week maintenance service for park restrooms, shelters and other infrastructure and manages the park use permit system for more than 500 events each year
• Maintains medians, green stormwater-treatment facilities, and other roadside plantings at more than 200 sites in the City
Marketing and Outreach • Raises awareness of the City of Eugene’s park
and open space network and related services • Serves as a liaison to partners and implements
strategies to increase community engagement • Coordinates public information and media
relations • Manages web and social media pages • Produces park signage, annual citywide
publication and other informational materials • Creates marketing and communication plans
for the division and current projects
Finance and Administrative Services • Provides financial management, forecasting
and analysis, and contract and grant administration
• Administers safety program for the division • Provides customer service and reception • Provides payroll, personnel, purchasing, billing
and accounts payable functions
Parks and Open Space Division Manager
1 FTE
Finance and Administrative
Services
3 FTE
Marketing and Outreach
7 FTE
Urban Forestry
10 FTE
Park Operations
47.5 FTE
POS Planning & Ecology
10.6 FTE
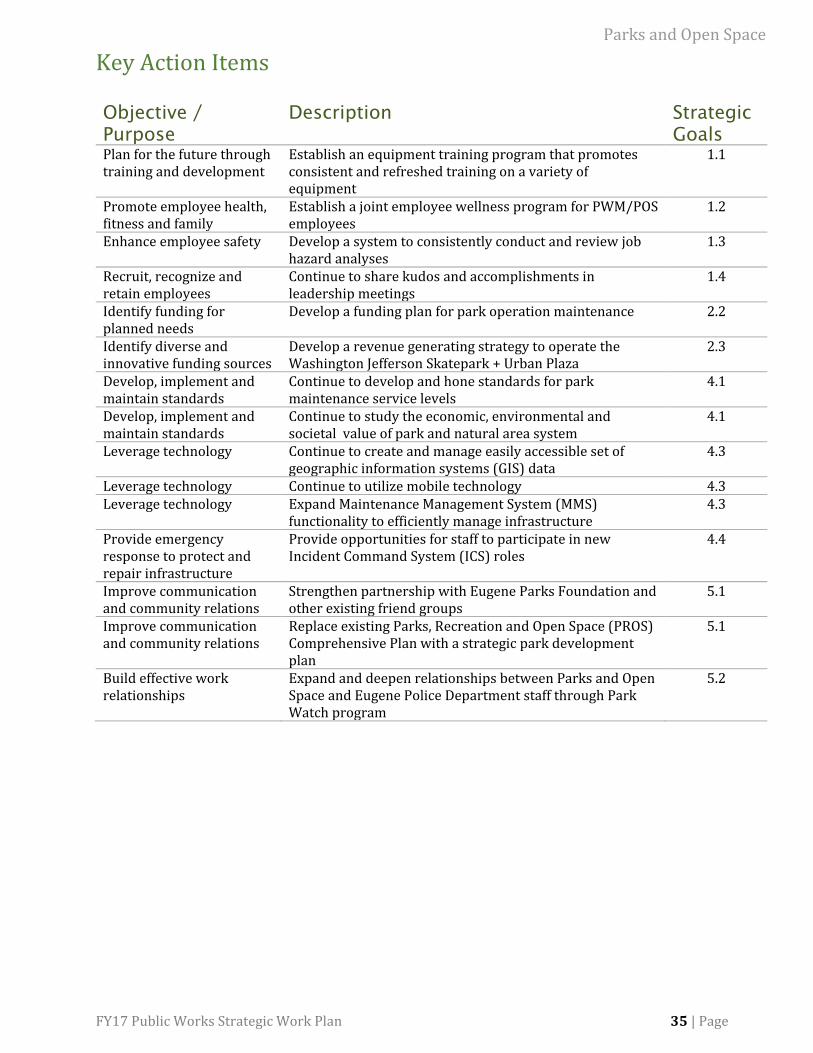
FY17 Public Works Strategic Work Plan 35 | Page
Key Action Items
Objective /
Purpose
Description Strategic
Goals
Plan for the future through training and development
Establish an equipment training program that promotes consistent and refreshed training on a variety of equipment
1.1
Promote employee health, fitness and family
Establish a joint employee wellness program for PWM/POS employees
1.2
Enhance employee safety Develop a system to consistently conduct and review job hazard analyses
1.3
Recruit, recognize and retain employees
Continue to share kudos and accomplishments in leadership meetings
1.4
Identify funding for planned needs
Develop a funding plan for park operation maintenance 2.2
Identify diverse and innovative funding sources
Develop a revenue generating strategy to operate the Washington Jefferson Skatepark + Urban Plaza
2.3
Develop, implement and maintain standards
Continue to develop and hone standards for park maintenance service levels
4.1
Develop, implement and maintain standards
Continue to study the economic, environmental and societal value of park and natural area system
4.1
Leverage technology Continue to create and manage easily accessible set of geographic information systems (GIS) data
4.3
Leverage technology Continue to utilize mobile technology 4.3 Leverage technology Expand Maintenance Management System (MMS)
functionality to efficiently manage infrastructure 4.3
Provide emergency response to protect and repair infrastructure
Provide opportunities for staff to participate in new Incident Command System (ICS) roles
4.4
Improve communication and community relations
Strengthen partnership with Eugene Parks Foundation and other existing friend groups
5.1
Improve communication and community relations
Replace existing Parks, Recreation and Open Space (PROS) Comprehensive Plan with a strategic park development plan
5.1
Build effective work relationships
Expand and deepen relationships between Parks and Open Space and Eugene Police Department staff through Park Watch program
5.2
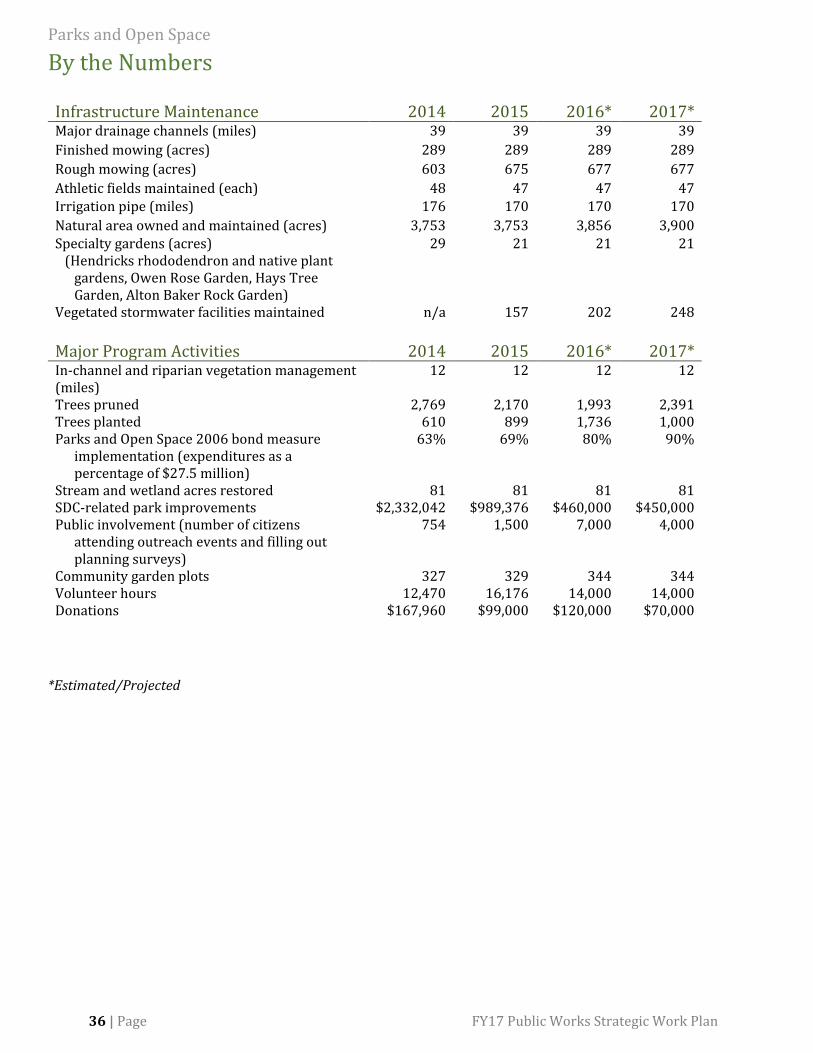
36 | Page FY17 Public Works Strategic Work Plan
By the Numbers
Infrastructure Maintenance 2014 2015 2016* 2017* Major drainage channels (miles) 39 39 39 39
Finished mowing (acres) 289 289 289 289
Rough mowing (acres) 603 675 677 677
Athletic fields maintained (each) 48 47 47 47 Irrigation pipe (miles) 176 170 170 170
Natural area owned and maintained (acres) 3,753 3,753 3,856 3,900 Specialty gardens (acres) (Hendricks rhododendron and native plant
gardens, Owen Rose Garden, Hays Tree Garden, Alton Baker Rock Garden)
29 21 21 21
Vegetated stormwater facilities maintained n/a 157 202 248
Major Program Activities 2014 2015 2016* 2017* In-channel and riparian vegetation management (miles)
12 12 12 12
Trees pruned 2,769 2,170 1,993 2,391 Trees planted 610 899 1,736 1,000 Parks and Open Space 2006 bond measure
implementation (expenditures as a percentage of $27.5 million)
63% 69% 80% 90%
Stream and wetland acres restored 81 81 81 81 SDC-related park improvements $2,332,042 $989,376 $460,000 $450,000 Public involvement (number of citizens
attending outreach events and filling out planning surveys)
754 1,500 7,000 4,000
Community garden plots 327 329 344 344 Volunteer hours 12,470 16,176 14,000 14,000 Donations $167,960 $99,000 $120,000 $70,000
*Estimated/Projected
FY17 Public Works Strategic Work Plan 37 | Page
Trends Affecting the Division
Parks and Recreation
System Plan Update
Work on the Parks and Recreation system plan update continues in FY17. An extensive public outreach effort that connected with 7,000 residents and technical analysis of the current system resulted in a system-wide Needs Assessment that was published in January of 2016.
The Needs Assessment identifies system strengths, challenges, trends and opportunities and is the basis for drafting a plan for the future. Five key themes that emerged from the Needs Assessment will guide decisions going forward:
Serve the entire community
Care for what we have
Grow responsibly
Invest in partnerships
Integrate with other systems
A draft plan will be shared with the community in the summer of 2016 and will include implementation strategies and potential funding options.
Community input will help identify supported implementation strategies and
a final plan that will be brought to the City Council for adoption in early 2017.
Increasing Vegetated
Stormwater Facilities
POS has created a new Stormwater Infrastructure Maintenance (SWiM) team to focus on helping residents and businesses understand how to properly care for the rapidly increasing numbers of vegetated stormwater facilities now located on public and private properties throughout Eugene. These facilities are landscape features that slow, filter, or absorb rainfall runoff. All serve a common purpose to control the quality and quantity of stormwater runoff from a property to waterways. Public education will be a key part of this new work due to many homeowners not being aware they have a stormwater facility let alone how to take care of it. In addition, the number of public facilities is expected to double in the next two years as Lane Transit District’s current EmX project comes on line, as well other planned construction.
Managing Illicit Park
Activities
Eugene’s parks and natural areas continue to see a steady increase in illicit camping,
unsanitary conditions along Eugene’s waterways, and vandalism such as destruction of vegetation and property and graffiti. POS staff will continue to reprioritize their work in order to try and keep up with the mounting health and safety concerns, as well as work to preserve the park experience for the public. To help the public feel safer and better address emerging issues, POS will build on the success of the summer 2016 Park Ambassador program by increasing staff and volunteer presence in the parks for summer 2017.
Public and Staff Safety
A recent survey of parks staff who work in the field showed growing concern for their safety. One key finding was that the majority of staff would like more training on how to better interact with people who are suffering from mental illness or the effects of substance abuse. POS will be offering a series of new trainings for staff in order to increase safety.
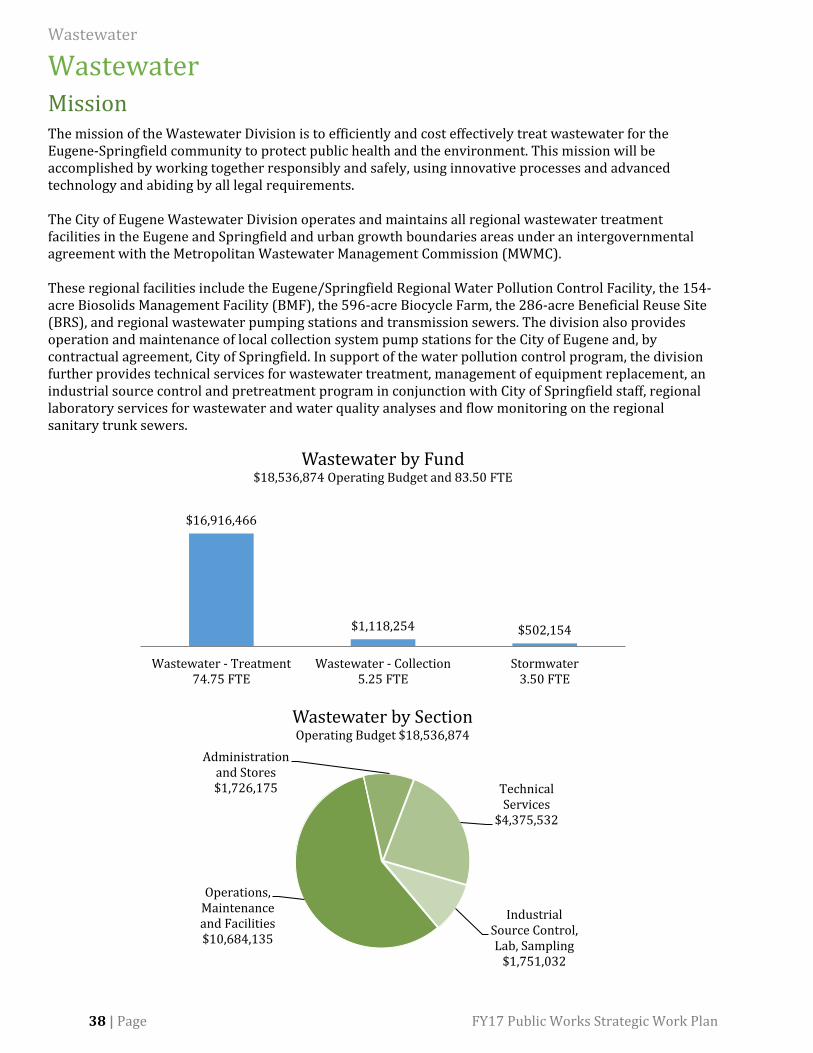
38 | Page FY17 Public Works Strategic Work Plan
Wastewater Mission The mission of the Wastewater Division is to efficiently and cost effectively treat wastewater for the Eugene-Springfield community to protect public health and the environment. This mission will be accomplished by working together responsibly and safely, using innovative processes and advanced technology and abiding by all legal requirements. The City of Eugene Wastewater Division operates and maintains all regional wastewater treatment facilities in the Eugene and Springfield and urban growth boundaries areas under an intergovernmental agreement with the Metropolitan Wastewater Management Commission (MWMC). These regional facilities include the Eugene/Springfield Regional Water Pollution Control Facility, the 154-acre Biosolids Management Facility (BMF), the 596-acre Biocycle Farm, the 286-acre Beneficial Reuse Site (BRS), and regional wastewater pumping stations and transmission sewers. The division also provides operation and maintenance of local collection system pump stations for the City of Eugene and, by contractual agreement, City of Springfield. In support of the water pollution control program, the division further provides technical services for wastewater treatment, management of equipment replacement, an industrial source control and pretreatment program in conjunction with City of Springfield staff, regional laboratory services for wastewater and water quality analyses and flow monitoring on the regional sanitary trunk sewers.
$16,916,466
$1,118,254 $502,154
Wastewater - Treatment74.75 FTE
Wastewater - Collection5.25 FTE
Stormwater3.50 FTE
Wastewater by Fund$18,536,874 Operating Budget and 83.50 FTE
Operations, Maintenance and Facilities$10,684,135
Administration and Stores$1,726,175 Technical
Services$4,375,532
Industrial Source Control, Lab, Sampling
$1,751,032
Wastewater by SectionOperating Budget $18,536,874
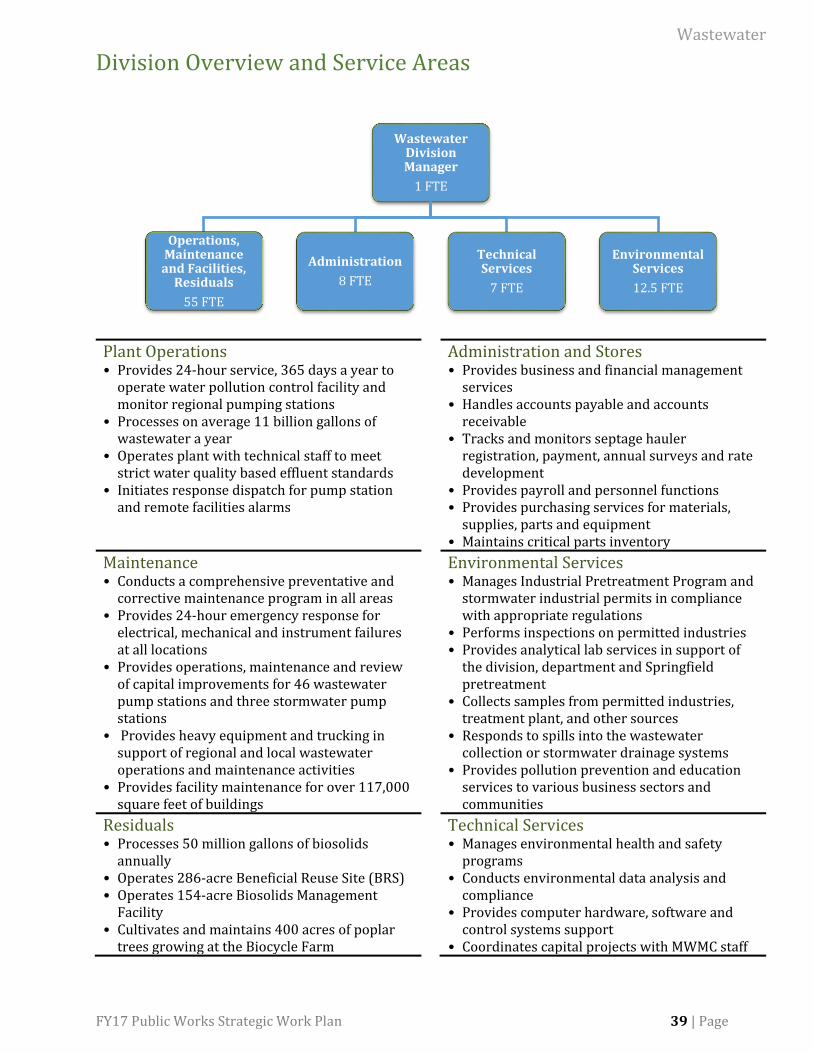
FY17 Public Works Strategic Work Plan 39 | Page
Division Overview and Service Areas
Plant Operations • Provides 24-hour service, 365 days a year to
operate water pollution control facility and monitor regional pumping stations
• Processes on average 11 billion gallons of wastewater a year
• Operates plant with technical staff to meet strict water quality based effluent standards
• Initiates response dispatch for pump station and remote facilities alarms
Administration and Stores • Provides business and financial management
services • Handles accounts payable and accounts
receivable • Tracks and monitors septage hauler
registration, payment, annual surveys and rate development
• Provides payroll and personnel functions • Provides purchasing services for materials,
supplies, parts and equipment • Maintains critical parts inventory
Maintenance • Conducts a comprehensive preventative and
corrective maintenance program in all areas • Provides 24-hour emergency response for
electrical, mechanical and instrument failures at all locations
• Provides operations, maintenance and review of capital improvements for 46 wastewater pump stations and three stormwater pump stations
• Provides heavy equipment and trucking in support of regional and local wastewater operations and maintenance activities
• Provides facility maintenance for over 117,000 square feet of buildings
Environmental Services • Manages Industrial Pretreatment Program and
stormwater industrial permits in compliance with appropriate regulations
• Performs inspections on permitted industries • Provides analytical lab services in support of
the division, department and Springfield pretreatment
• Collects samples from permitted industries, treatment plant, and other sources
• Responds to spills into the wastewater collection or stormwater drainage systems
• Provides pollution prevention and education services to various business sectors and communities
Residuals • Processes 50 million gallons of biosolids
annually • Operates 286-acre Beneficial Reuse Site (BRS) • Operates 154-acre Biosolids Management
Facility • Cultivates and maintains 400 acres of poplar
trees growing at the Biocycle Farm
Technical Services • Manages environmental health and safety
programs • Conducts environmental data analysis and
compliance • Provides computer hardware, software and
control systems support • Coordinates capital projects with MWMC staff
Wastewater Division Manager
1 FTE
Operations, Maintenance and Facilities,
Residuals
55 FTE
Administration
8 FTE
Technical Services
7 FTE
Environmental Services
12.5 FTE
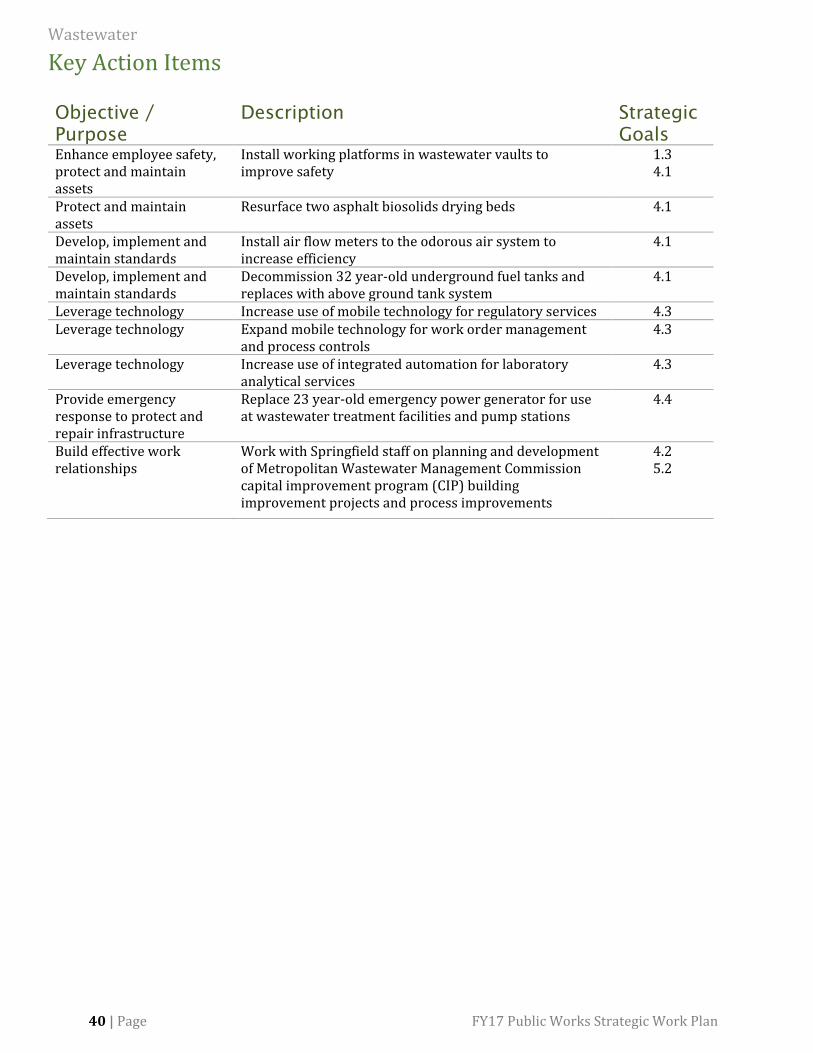
40 | Page FY17 Public Works Strategic Work Plan
Key Action Items
Objective /
Purpose
Description Strategic
Goals
Enhance employee safety, protect and maintain assets
Install working platforms in wastewater vaults to improve safety
1.3 4.1
Protect and maintain assets
Resurface two asphalt biosolids drying beds 4.1
Develop, implement and maintain standards
Install air flow meters to the odorous air system to increase efficiency
4.1
Develop, implement and maintain standards
Decommission 32 year-old underground fuel tanks and replaces with above ground tank system
4.1
Leverage technology Increase use of mobile technology for regulatory services 4.3 Leverage technology Expand mobile technology for work order management
and process controls 4.3
Leverage technology Increase use of integrated automation for laboratory analytical services
4.3
Provide emergency response to protect and repair infrastructure
Replace 23 year-old emergency power generator for use at wastewater treatment facilities and pump stations
4.4
Build effective work relationships
Work with Springfield staff on planning and development of Metropolitan Wastewater Management Commission capital improvement program (CIP) building improvement projects and process improvements
4.2 5.2
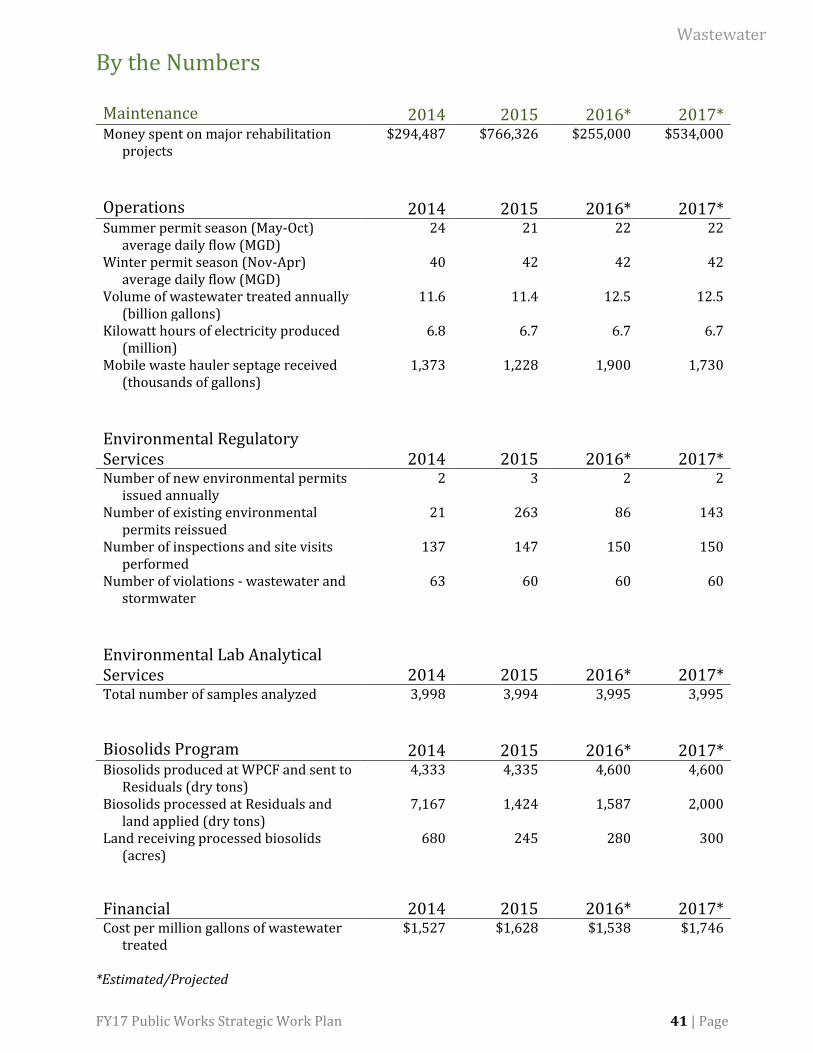
FY17 Public Works Strategic Work Plan 41 | Page
By the Numbers
Maintenance
2014
2015
2016*
2017* Money spent on major rehabilitation
projects $294,487 $766,326
$255,000 $534,000
Operations
2014
2015
2016*
2017* Summer permit season (May-Oct)
average daily flow (MGD) 24 21 22 22
Winter permit season (Nov-Apr) average daily flow (MGD)
40 42 42 42
Volume of wastewater treated annually (billion gallons)
11.6 11.4 12.5
12.5
Kilowatt hours of electricity produced (million)
6.8 6.7 6.7 6.7
Mobile waste hauler septage received (thousands of gallons)
1,373
1,228
1,900 1,730
Environmental Regulatory Services
2014
2015
2016*
2017*
Number of new environmental permits issued annually
2 3 2 2
Number of existing environmental permits reissued
21 263 86 143
Number of inspections and site visits performed
137 147 150 150
Number of violations - wastewater and stormwater
63 60 60 60
Environmental Lab Analytical Services
2014
2015
2016*
2017*
Total number of samples analyzed 3,998 3,994 3,995 3,995
Biosolids Program
2014
2015
2016*
2017* Biosolids produced at WPCF and sent to
Residuals (dry tons) 4,333 4,335 4,600 4,600
Biosolids processed at Residuals and land applied (dry tons)
7,167 1,424 1,587 2,000
Land receiving processed biosolids (acres)
680 245 280 300
Financial
2014
2015
2016*
2017* Cost per million gallons of wastewater
treated $1,527 $1,628 $1,538 $1,746
*Estimated/Projected
42 | Page FY17 Public Works Strategic Work Plan
Trends Affecting the Division
Water Quality
Division staff continue to work to ensure ongoing compliance with regulatory requirements of the Metropolitan Wastewater Management Commission’s (MWMC) wastewater permit and Eugene’s MS4 Stormwater permit. The division works closely with Oregon Association of Clean Water Agencies (ACWA) and DEQ to monitor the status of ever-increasing water quality requirements and to strategize work to be ready to meet future regulatory changes.
Resiliency
Wastewater staff continues to increase ability to respond to emergencies of many types. Continuity of operations planning, assessing structures, and updating and practicing emergency protocol is helping the division prepare for the future.
WIMS for Wastewater
Operations
Starting in mid-2016, Wastewater operations staff will begin using Water Information Management System (WIMS) software. The WIMS application will allow plant operators to integrate equipment control data, influent/effluent and residuals flow data, and laboratory data into customizable dashboards that can be accessed from a workstation or mobile device. The current data system at WPCF has been periodically
augmented and patched since the 1980s and staff sometimes wait up to 24 hours for data on plant operations. With the WIMS system, continuously streaming data will be accessible to plant staff as needed at any time, day or night, enabling operators, maintenance staff, and management to monitor the treatment plant, be able to set flow targets and parameters, analyze wastewater trends, and manage the overall treatment processes and equipment more efficiently.
Going Mobile and
Leveraging Technology
Wastewater Division staff have piloted the use of mobile tablets over the last two years. With an asset management application installed, maintenance staff can be working on a rooftop, at a pump station, or on a force main several miles away and still have location data, equipment information, scheduling, and work instructions. In addition, given the unique conditions and surprises that arise while working in the field, maintenance teams can send and receive images, documents, and other files from supervisors and technical specialists. Tablets also enable work teams to take images of equipment and structural assets, add GPS coordinate tags, and export and integrate that information into a networked asset management system. The next phase in FY17 is to utilize
mobile tablets to monitor and control plant operations.
MWMC Bonds
Redemption
The Wastewater Division works closely with the Metropolitan Wastewater Management Commission to operate and maintain the regional wastewater facilities. Part of MWMC’s role is to ensure the regional facilities will meet the DEQ permit requirements. This is done in part by investing in the regional facilities for required upgrades and expansion. The financing of these investments has resulted in two revenue bonds that were issued in 2006 and 2008 respectively. MWMC is reviewing paying off the 2006 revenue bond debt, plus refinancing the existing 2008 revenue bond debt at a lower interest rate. MWMC plans to use accumulated capital reserves to pay down the bond. These actions will result in an interest savings of $12.9 million.
Building Improvements
The Wastewater Division continues to partner with MWMC Springfield staff on the design of building improvements. This work will bring the 32-year-old MWMC work spaces for Maintenance, Lab, Operations and Administration staff to current standards. Construction is expected to start in FY17 and may last 18 months or more.
FY17 Public Works Strategic Work Plan 43 | Page
Appendix A City of Eugene Public Works Asset Inventory The Eugene Public Works Department constructs and maintains much of the public infrastructure in the City of Eugene. The following inventory is not intended to serve as a complete description of all City of Eugene assets but does include a broad listing of key assets maintained by the Public Works Department:
Asset Description Quantity*
Airport airfield pavement ................................................................................................ 8,564,000 square feet Airport terminal building ................................................................................................ 97,800 square feet Alleys owned, maintained by City .............................................................................. 43 miles of dedicated right-of-way Athletic fields maintained by the department .................................................... 47 Bike routes (identified) ..................................................................................................... 45 miles Bike lanes, on-street, ........................................................................................................... 158 miles Bike paths (off-street) ........................................................................................................ 45 miles Bridges, overpasses and culverts owned/maintained by the City ........ 104 Community garden plots ................................................................................................. 346 Equipment ................................................................................................................................. 789 pieces of rolling stock; 1,913 communication devices Hiking or mountain biking trails maintained by the department .......... 38.14 miles Jogging trails maintained by the department ..................................................... 8.88 miles Medians maintained by the department ................................................................ 213 median sites totaling 39 acres of landscaped/paved Park shelters ............................................................................................................................ 18 Parks (Riverfront system) ............................................................................................... 744 acres Parks irrigation facilities .................................................................................................. 170.36 miles of irrigation pipe; 25,466 irrigation heads Parks owned/maintained by City (includes developed and undeveloped parks and natural areas) .............................................................. 4,800 acres Partnership lands (Rivers to Ridges) ....................................................................... 23,326 acres Playgrounds ............................................................................................................................. 52 Public restrooms in parks ............................................................................................... 23 Sidewalks and pedestrian ways in UGB ................................................................ 756 miles (includes 12,765 sidewalk access ramps) Skateparks ................................................................................................................................. 6 Stormwater catch basins and curb inlets .............................................................. 15,193 Stormwater drainage channels (open) ................................................................... 39 miles of major channels Stormwater drainage lines (enclosed) .................................................................... 601 miles Street lights (arterials, local and off street bikeways) .................................... 9,765 Street name signs .................................................................................................................. 9,740 Streets owned/maintained by City ........................................................................... 543 centerline miles of dedicated right-of-way Improved asphalt .............................................................................................................. 448 miles Improved concrete ........................................................................................................... 30 miles Unimproved (Asphalt/oil mat, gravel, dirt) ...................................................... 65 miles Traffic signals .......................................................................................................................... 249 Traffic signs .............................................................................................................................. 19,370 Trees owned/maintained by City (including street trees) ......................... Approximately 100,000 Wastewater collection lines (local and regional in Eugene area) ........... 821 miles Wastewater pump stations (local and regional maintained by Eugene Public Works staff) ....................................................................................... 46 (26 local, 4 regional, plus 16 maintained under contract
with City of Springfield) Wastewater treatment facilities (regional) .......................................................... Plant designed to handle maximum capacity of 277 million
gallons per day West Eugene Wetland site acreage maintained (City only) ....................... 677 acres West Eugene Wetland site acreage maintained ................................................ 3,671 acres *as of 4/1/2016
44 | Page FY17 Public Works Strategic Work Plan
Appendix B Directory of Public Works Services
Administration
101 E. Broadway, Suite 400................................... 541-682-8421 Department financial management ................... 541-682-5388 Executive director...................................................... 541-682-5258 Human resource management ............................. 541-682-5076 Public affairs................................................................. 541-682-5523 Stormwater, wastewater user charges ............ 541-682-4900
Airport
28855 Lockheed Drive ............................................ 541-682-5430 Air service development ......................................... 541-682-5430 Parking information ................................................. 541-688-6571 Passenger paging ....................................................... 541-954-8364 Information desk ........................................................ 541-682-5544
Engineering
99 E. Broadway, Suite 400 ..................................... 541-682-5291 City easement/public utility-PIC, 99 W. 10th . 541-682-8400 Construction assessments/contracts ................ 541-682-5291 Development assistance-PIC, 99 W. 10th ........ 541-682-5086 Right-of-way use permits-PIC, 99 W. 10th ..... 541-682-5086 Flood zone information-PIC, 99 W. 10th ......... 541-682-5086 Paving .............................................................................. 541-682-5291 Stormwater ................................................................... 541-682-5291 Surveyor ......................................................................... 541-682-5291 Transportation planning and bicycle Information ................................................................... 541-682-5291
Maintenance
1820 Roosevelt Boulevard ..................................... 541-682-4800 Emergency after hours ............................................ 541-682-5111 Fleet/radio services .................................................. 541-682-4800 Graffiti removal ........................................................... 541-682-4800 Hazardous pothole repair ...................................... 541-682-4800 Street repair ................................................................. 541-682-4800 Stormwater system maintenance ....................... 541-682-4800 Traffic/signs/signals ................................................ 541-682-4800 Utility work right-of-way........................................ 541-682-4800 Wastewater collection system maintenance . 541-682-4800
Parks and Open Space
1820 Roosevelt Boulevard ...............................541-682-4800 Community gardens ............................................541-682-4800 Hazard trees ...........................................................541-682-4800 Natural resources maintenance ....................541-682-4800 Open waterway maintenance .........................541-682-4800 Park donations ......................................................541-682-4831 Park rentals .............................................................541-682-4800 Park operations .....................................................541-682-4800 Parks and open space planning .....................541-682-4800 Playground safety ................................................541-682-4800 Tree maintenance ................................................541-682-4800 Urban forestry .......................................................541-682-4800 Vegetation code enforcement .........................541-682-4821 Wetlands program ...............................................541-682-4800 Eugene Park Steward volunteer program ....................................................................541-682-4800
Wastewater
Wastewater Treatment Plant 410 River Avenue .................................................541-682-8600 Beneficial Reuse Site 91199 Prairie Rd ................................................ 541-682-8660 Biosolids Management Facility 29686 Awbrey Lane ............................................541-682-8660 Industrial pretreatment program .................541-682-8664 Industrial discharge permits ...........................541-682-8615 Mobile waste hauler permits ..........................541-682-8664 RV waste dumping ...............................................541-682-8600 Stormwater discharge permits ......................541-682-8616 Tours ..........................................................................541-682-8600 On the internet ................................. www.eugene-or.gov/pw
Appendix C Public Works Service Profiles (Fiscal year of next update)
Airport (FY18) Athletics*(FY18) Construction Permits (FY17) Fleet and Radio Communication Services (FY19) Infrastructure Project and Information Mgmt (FY17) Parking* (FY20)
Parks and Open Space (FY19) PW Administration** Stormwater (FY20) Transportation (FY18) Urban Forestry (FY17) Wastewater Collection and Treatment (FY20)
* Non-Public Works lead department ** Department Administration does not have a service profile Complete Appendix C available online at www.eugene-or.gov/pw.
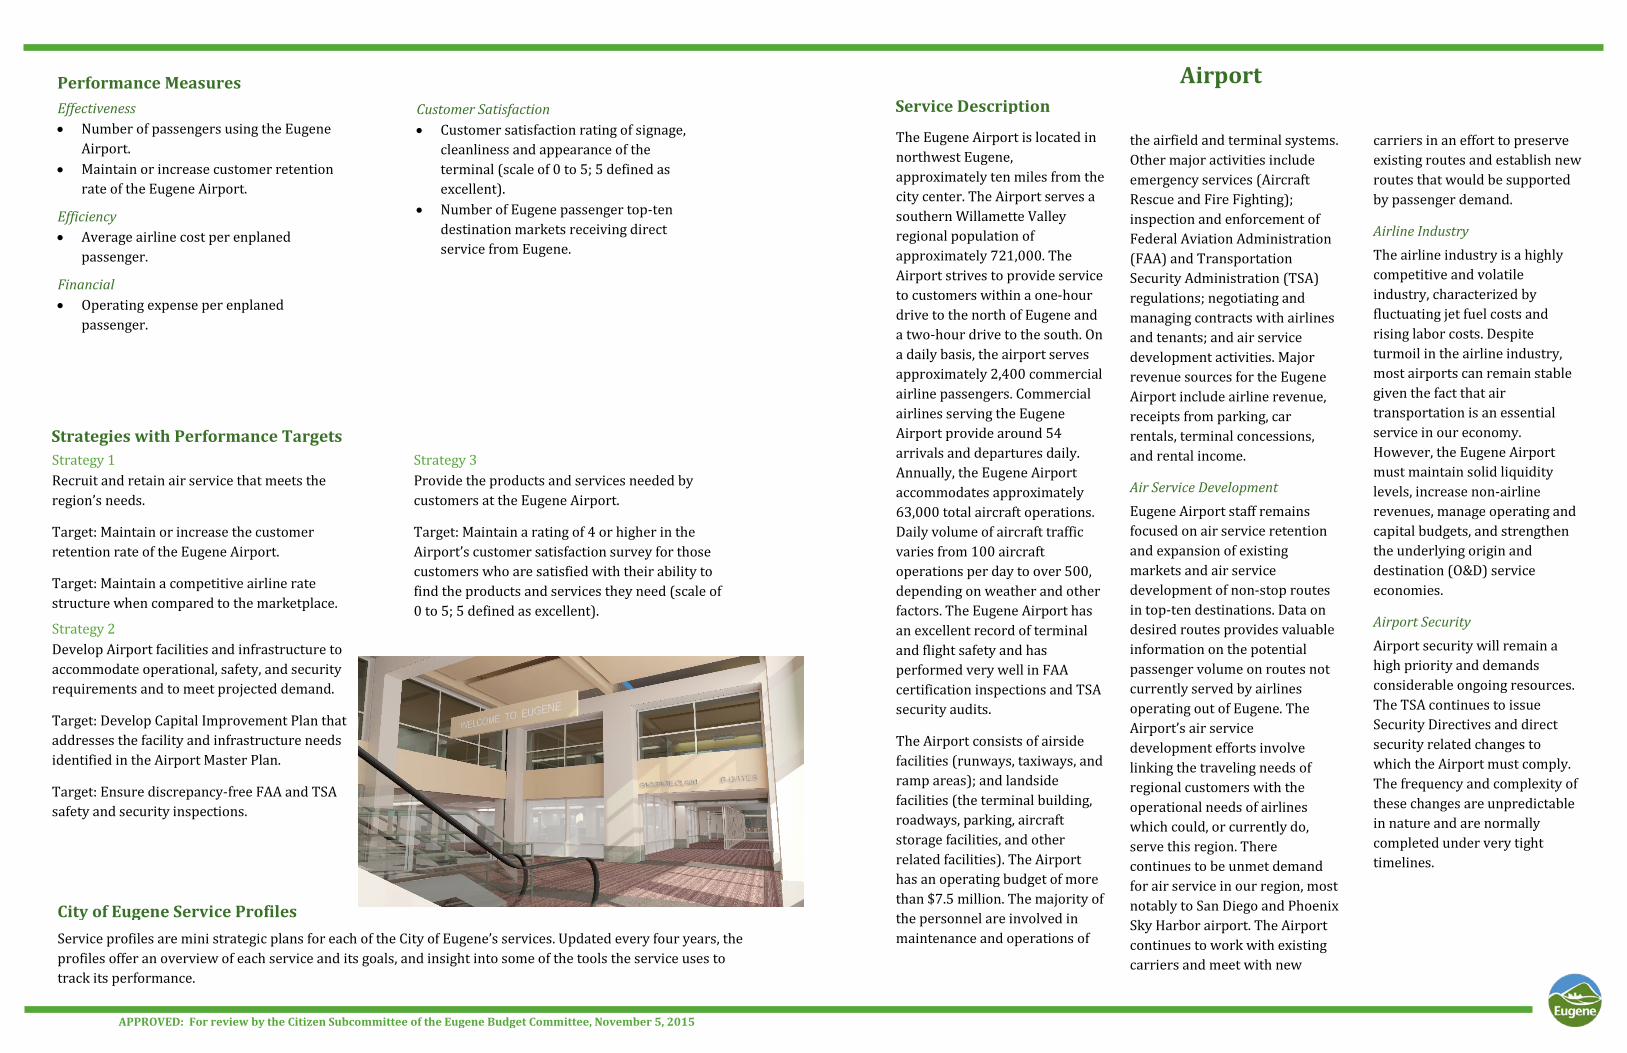
The Eugene Airport is located in northwest Eugene, approximately ten miles from the city center. The Airport serves a southern Willamette Valley regional population of approximately 721,000. The Airport strives to provide service to customers within a one-hour drive to the north of Eugene and a two-hour drive to the south. On a daily basis, the airport serves approximately 2,400 commercial airline passengers. Commercial airlines serving the Eugene Airport provide around 54 arrivals and departures daily. Annually, the Eugene Airport accommodates approximately 63,000 total aircraft operations. Daily volume of aircraft traffic varies from 100 aircraft operations per day to over 500, depending on weather and other factors. The Eugene Airport has an excellent record of terminal and flight safety and has performed very well in FAA certification inspections and TSA security audits.
The Airport consists of airside facilities (runways, taxiways, and ramp areas); and landside facilities (the terminal building, roadways, parking, aircraft storage facilities, and other related facilities). The Airport has an operating budget of more than $7.5 million. The majority of the personnel are involved in maintenance and operations of
Customer Satisfaction • Customer satisfaction rating of signage,
cleanliness and appearance of the terminal (scale of 0 to 5; 5 defined as excellent).
• Number of Eugene passenger top-ten destination markets receiving direct service from Eugene.
Effectiveness • Number of passengers using the Eugene
Airport. • Maintain or increase customer retention
rate of the Eugene Airport.
Efficiency • Average airline cost per enplaned
passenger.
Financial • Operating expense per enplaned
passenger.
Airport
Strategy 1 Recruit and retain air service that meets the region’s needs.
Target: Maintain or increase the customer retention rate of the Eugene Airport.
Target: Maintain a competitive airline rate structure when compared to the marketplace.
Strategy 2 Develop Airport facilities and infrastructure to accommodate operational, safety, and security requirements and to meet projected demand.
Target: Develop Capital Improvement Plan that addresses the facility and infrastructure needs identified in the Airport Master Plan.
Target: Ensure discrepancy-free FAA and TSA safety and security inspections.
Strategy 3 Provide the products and services needed by customers at the Eugene Airport.
Target: Maintain a rating of 4 or higher in the Airport’s customer satisfaction survey for those customers who are satisfied with their ability to find the products and services they need (scale of 0 to 5; 5 defined as excellent).
the airfield and terminal systems. Other major activities include emergency services (Aircraft Rescue and Fire Fighting); inspection and enforcement of Federal Aviation Administration (FAA) and Transportation Security Administration (TSA) regulations; negotiating and managing contracts with airlines and tenants; and air service development activities. Major revenue sources for the Eugene Airport include airline revenue, receipts from parking, car rentals, terminal concessions, and rental income.
Air Service Development Eugene Airport staff remains focused on air service retention and expansion of existing markets and air service development of non-stop routes in top-ten destinations. Data on desired routes provides valuable information on the potential passenger volume on routes not currently served by airlines operating out of Eugene. The Airport’s air service development efforts involve linking the traveling needs of regional customers with the operational needs of airlines which could, or currently do, serve this region. There continues to be unmet demand for air service in our region, most notably to San Diego and Phoenix Sky Harbor airport. The Airport continues to work with existing carriers and meet with new
APPROVED: For review by the Citizen Subcommittee of the Eugene Budget Committee, November 5, 2015
Service Description
Strategies with Performance Targets
Performance Measures
City of Eugene Service Profiles
Service profiles are mini strategic plans for each of the City of Eugene’s services. Updated every four years, the profiles offer an overview of each service and its goals, and insight into some of the tools the service uses to track its performance.
carriers in an effort to preserve existing routes and establish new routes that would be supported by passenger demand.
Airline Industry The airline industry is a highly competitive and volatile industry, characterized by fluctuating jet fuel costs and rising labor costs. Despite turmoil in the airline industry, most airports can remain stable given the fact that air transportation is an essential service in our economy. However, the Eugene Airport must maintain solid liquidity levels, increase non-airline revenues, manage operating and capital budgets, and strengthen the underlying origin and destination (O&D) service economies.
Airport Security Airport security will remain a high priority and demands considerable ongoing resources. The TSA continues to issue Security Directives and direct security related changes to which the Airport must comply. The frequency and complexity of these changes are unpredictable in nature and are normally completed under very tight timelines.
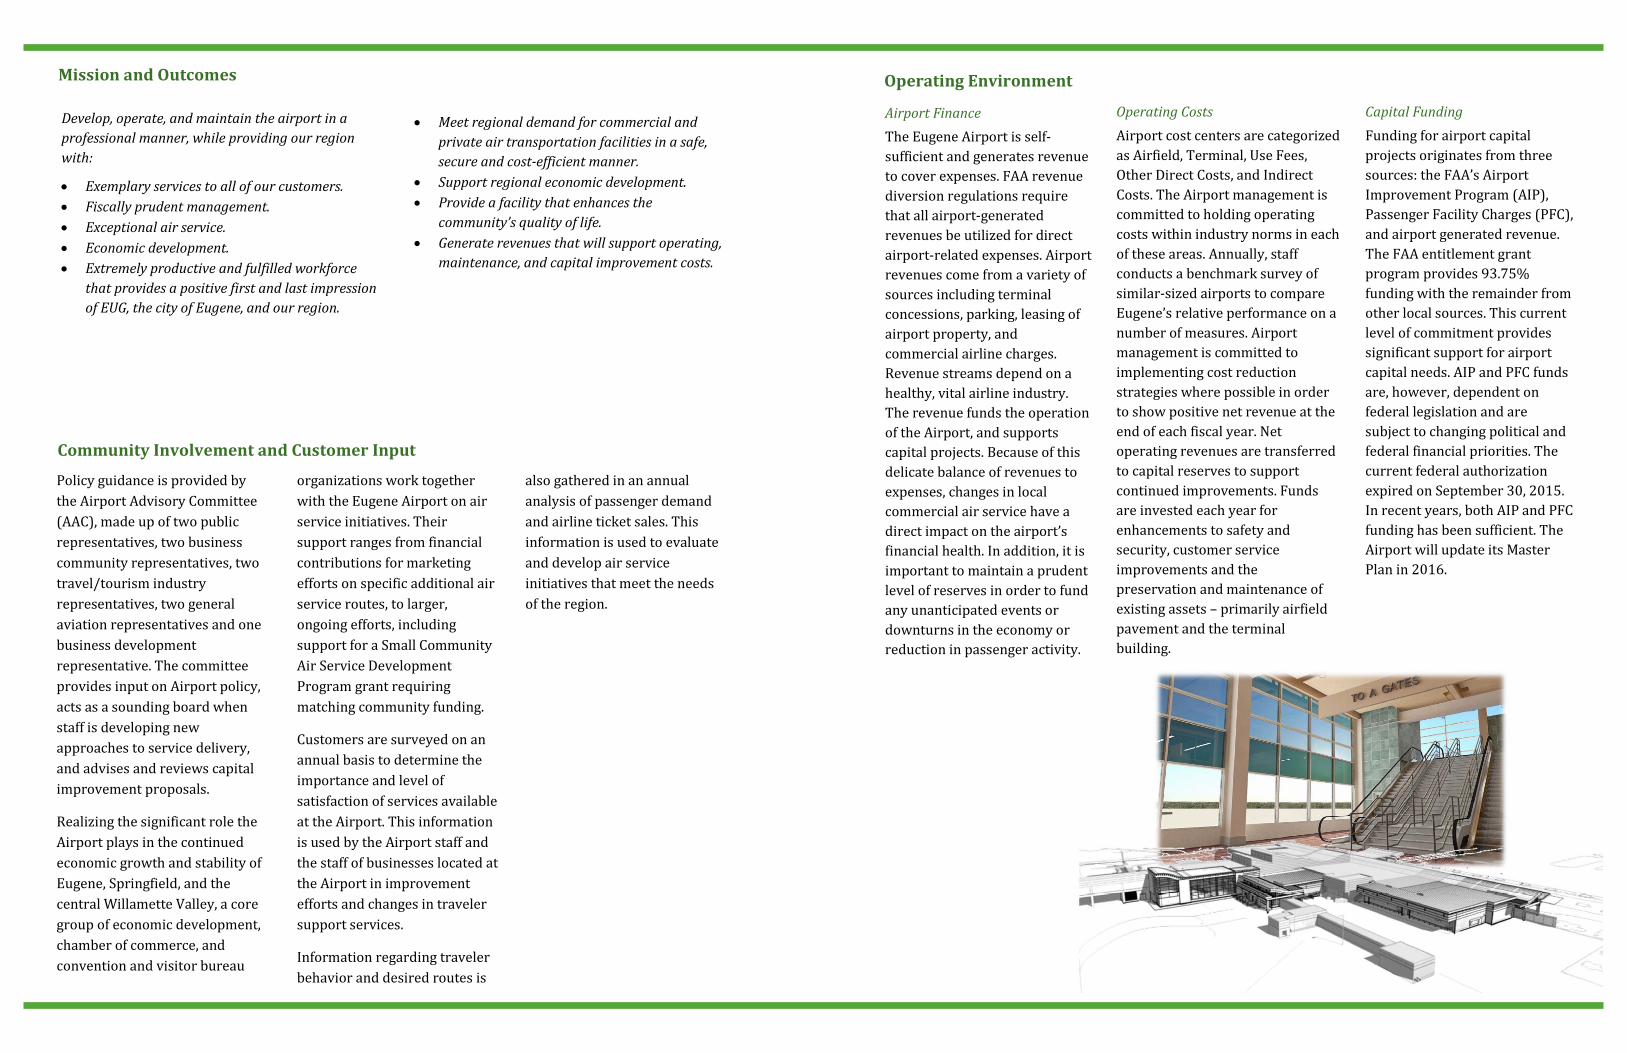
Airport Finance The Eugene Airport is self-sufficient and generates revenue to cover expenses. FAA revenue diversion regulations require that all airport-generated revenues be utilized for direct airport-related expenses. Airport revenues come from a variety of sources including terminal concessions, parking, leasing of airport property, and commercial airline charges. Revenue streams depend on a healthy, vital airline industry. The revenue funds the operation of the Airport, and supports capital projects. Because of this delicate balance of revenues to expenses, changes in local commercial air service have a direct impact on the airport’s financial health. In addition, it is important to maintain a prudent level of reserves in order to fund any unanticipated events or downturns in the economy or reduction in passenger activity.
Capital Funding Funding for airport capital projects originates from three sources: the FAA’s Airport Improvement Program (AIP), Passenger Facility Charges (PFC), and airport generated revenue. The FAA entitlement grant program provides 93.75% funding with the remainder from other local sources. This current level of commitment provides significant support for airport capital needs. AIP and PFC funds are, however, dependent on federal legislation and are subject to changing political and federal financial priorities. The current federal authorization expired on September 30, 2015. In recent years, both AIP and PFC funding has been sufficient. The Airport will update its Master Plan in 2016.
Policy guidance is provided by the Airport Advisory Committee (AAC), made up of two public representatives, two business community representatives, two travel/tourism industry representatives, two general aviation representatives and one business development representative. The committee provides input on Airport policy, acts as a sounding board when staff is developing new approaches to service delivery, and advises and reviews capital improvement proposals.
Realizing the significant role the Airport plays in the continued economic growth and stability of Eugene, Springfield, and the central Willamette Valley, a core group of economic development, chamber of commerce, and convention and visitor bureau
Community Involvement and Customer Input organizations work together
with the Eugene Airport on air service initiatives. Their support ranges from financial contributions for marketing efforts on specific additional air service routes, to larger, ongoing efforts, including support for a Small Community Air Service Development Program grant requiring matching community funding.
Customers are surveyed on an annual basis to determine the importance and level of satisfaction of services available at the Airport. This information is used by the Airport staff and the staff of businesses located at the Airport in improvement efforts and changes in traveler support services.
Information regarding traveler behavior and desired routes is
Develop, operate, and maintain the airport in a professional manner, while providing our region with:
• Exemplary services to all of our customers. • Fiscally prudent management. • Exceptional air service. • Economic development. • Extremely productive and fulfilled workforce
that provides a positive first and last impression of EUG, the city of Eugene, and our region.
• Meet regional demand for commercial and private air transportation facilities in a safe, secure and cost-efficient manner.
• Support regional economic development. • Provide a facility that enhances the
community’s quality of life. • Generate revenues that will support operating,
maintenance, and capital improvement costs.
also gathered in an annual analysis of passenger demand and airline ticket sales. This information is used to evaluate and develop air service initiatives that meet the needs of the region.
Operating Environment
Mission and Outcomes
Operating Costs Airport cost centers are categorized as Airfield, Terminal, Use Fees, Other Direct Costs, and Indirect Costs. The Airport management is committed to holding operating costs within industry norms in each of these areas. Annually, staff conducts a benchmark survey of similar-sized airports to compare Eugene’s relative performance on a number of measures. Airport management is committed to implementing cost reduction strategies where possible in order to show positive net revenue at the end of each fiscal year. Net operating revenues are transferred to capital reserves to support continued improvements. Funds are invested each year for enhancements to safety and security, customer service improvements and the preservation and maintenance of existing assets – primarily airfield pavement and the terminal building.
The Athletics program promotes and facilitates active lifestyles, physical fitness, and social interaction by serving adults and youth through league sports and other organized sports activities. The Athletics program also coordinates the use and maintenance of City wide athletic fields and facilities and serves as a central information source regarding community athletic activities. Athletics offers organized sports activities for adults, including men’s, women’s, and coed league competition for softball, volleyball, basketball, ultimate Frisbee, and outdoor soccer. These activities contribute 95% of the services revenue.
Athletics schedules 23 softball fields, 19 natural grass sports fields, 1 outdoor hockey rink, 4 sand volleyball courts, and the Westmoreland Disc Golf Course. It is also in the midst of an RFP process that will award a vendor contract to install and operate a pay-to-play Disc Golf Course at Alton Baker Park. The Athletics staff coordinates the use of these community facilities along with the City’s 23 tennis courts and 10 artificial surface playing fields. Facility coordination is a major focus of staff time. Approximately 75% of all facilities managed by Athletics are used by youth. Local youth sports organizations, the Eugene School District 4J, and the Bethel School
Athletics
District 52 are not charged for use of facilities. The Athletics staff also serves as a community liaison and provides professional support for various adult and youth sports agencies and nonprofit groups. The staff regularly responds to requests for information concerning athletic game rules, facility availability, equipment requirements, and community resources. Athletics staff contributed significantly to the Community Programs (The
Effectiveness Number of athletics patron visits.
Financial Total athletics service cost per patron
visit.
Percent of total athletics General Fund service budget offset by revenues.
DRAFT: For review by the Citizen Subcommittee of the Eugene Budget Committee, November 8, 2012
Service Description
Strategies with Performance Targets
Performance Measures
City of Eugene Service Profiles
Service profiles are mini strategic plans for each of the City of Eugene’s services. Updated every four years, the profiles offer an overview of each service and its goals, and insight into some of the tools the service uses to track its performance.
Strategy 1 Ensure that Athletics service revenues equal its direct expenses.
Target: 100% of direct program expenses covered by revenues in FY13-FY16.
Target: Promote rentals of City-owned athletic facilities.
Target: Keep team fees as market-competitive as possible.
Customer Satisfaction Percent of team managers surveyed who
are satisfied or very satisfied with athletics services.
Starting Block) associated with USA Track & Field Trials in 2008 and 2012.
Strategy 2 Maintain service quality.
Target: 90% or more of team managers are satisfied or very satisfied with service quality in FY13-16.
Target: Maintain quality and continuity of staff and contractual sports officials who support league activity.
Target: Perform ongoing evaluations of programs.
Target: Continue collaboration with public Works to ensure City facilities are well maintained.
The 2006 Parks, Recreation and Open Space (PROS) Comprehensive Plan provided significant public input that will shape services for two decades. Advisory committee meetings occur for each sport. The Athletics program uses team manages and officials groups to obtain customer input and to involve customers in program design. In addition, team managers are surveyed at the end of each sports season. Staff meets regularly with community partners and other service providers to identify gas, address funding issues, encourage
Athletic Facilities and Services Available to Adults Eugene’s population continues to grow, and in the 45+ age group there is an increasing interest in the pursuit of fitness activities and team-based competition. The community ethnic diversity is increasing, having an impact on types of team sports being requested. The construction of gyms and the development of athletic fields have lagged behind the growth in the size of the community, stressing the availability of facility use. Thirty-five percent of all City athletic programs are gym-based and rely on school district facilities. Youth athletic activities have the highest priority for many facilities. In order for the City to respond to population growth, additional recreational field and facility resources will need to be developed as outlined in the 2006 Comprehensive Parks, Recreation & Open Space (PROS) plan.
Regional Sports – Advisory Council Travel Lane County has recently established a regional Sports Advisory Council. The Eugene, Cascades & Coast Sports functions as a marketing entity and has dedicated staff who will work with corporate representatives, government officials, local media, venue owners and event providers to
seek out new sporting events throughout Lane County, increasing the economic opportunities that exist in this market. The City of Eugene is engaged in this partnership and is assisting in the analysis of existing sports facility resources.
Financial Sustainability and Cost Recovery The Athletics Program recovers nearly 100% of its direct costs. Meeting this financial goal has resulted in increased user fees for adult leagues and other users. Surveys of comparable municipal programs indicate fee increases place adult athletic leagues at or above comparable market rates.
Youth Obesity Over the past 20 years, the number of overweight children between the ages of 6 and 19 has tripled to nearly one out of every three adolescents. Adolescent obesity is largely caused by lack of physical activity. Communities need to create more lifelong opportunities for our population to be physically active. Athletic activities are a highly active form
Operating Environment
Community Involvement and Customer Input
of recreation which promotes healthy lifestyles.
Turf Sports The growing interest and participation in sports such as soccer, lacrosse, rugby and ultimate Frisbee is generating additional demand for turf sport fields. These sports, plus the new artificial surface playing fields, represent new service opportunities for the Athletics program.
Advances in Sports Equipment Higher performing softball equipment is necessitating larger playing facilities for adults. Fields with short outfields are becoming unsuitable for adult play and may present increasing liability risks. Larger softball fields will need to be developed to respond to the demand for adult softball. Softball leagues account for over 43% of the total Athletics revenue.
interagency collaboration, and eliminate barriers to service provision. Athletic services are included in City community surveys. Each year, the Budget Committee and City Council review the Athletics budget.
Mission and Outcomes
Athletics creates and facilitates recreational and competitive sports opportunities, promotes active lifestyles, and encourages physical fitness, and social interaction. Athletic services philosophy is that well-balanced, healthy people contribute to a productive and thriving community.
Preserve safe access to City parks and athletic fields. Contribute to the quality of life in the community. Promote lifelong fitness and health to all residents. Contribute to social integration and sense of community. Contribute to the economic health of the community.
This service area issues permits, and inspects construction to ensure that all permitted construction and development meet or exceed applicable Federal, State and City regulations. The areas of responsibility include all of the properties within the city of Eugene and Eugene’s Urban Growth Boundary. The total FY 12 budget for the Construction Permit Service area is approximately $5.4 million and includes staff from the Planning and Development, Public Works and Fire Departments. Staff providing this service is located at the City’s Permit and Information Center (PIC) in the Atrium Building.
Development activity in the community fluctuates greatly and requires specific strategies to provide a sustainable budget for this fully fee-supported service. Staff promotes a collaborative approach with permit applicants by partnering with them throughout their project, including pre-submittal assistance, during permit plan review and through the inspection phase of the project.
Plan review involves checking proposed projects against applicable State structural, mechanical, fire, plumbing and electrical codes. Local regulations addressed during review include zoning, public
Construction Permits
infrastructure, erosion, stormwater, wetlands and other environmental issues. Systems development charges also are assessed and are based on projected impacts to the city’s transportation, parks, wastewater and stormwater systems. Following approval of reviews, a permit is issued, authorizing construction activity to begin. Field inspectors inspect construction activity for adherence to plans and to ensure that all components meet or exceed standards.
This service area also includes programs that deal with non-permitted work and dangerous buildings and the City’s rental housing standards. The rental housing program, adopted by Council in 2005, ensures minimum habitability
Effectiveness Number of paid claims related to building code
violations missed in plan review or field inspection
Percent of permits receiving first plan review letter by commitment date
Percent of inspection requests completed within one day
Number of rental housing complaints per year
Efficiency Percent of permits processed via the web Average number of inspections per inspection
stop Percent of rental housing payments processed
via the web
Financial Percent of service costs recovered from fiscal
year revenues
Number of months of fund balance reserve
Customer Satisfaction Percent of customer survey respondents who
rate plan review services as “good” or better Percent of customer survey respondents who
rate inspection services as “good” or better
Strategy 1 Use technology to improve service delivery while reducing permit processing time and delivering services more economically.
Target: By 2013, customer-focused website implemented with additional functionality providing compliance information in real time.
Target: By 2015, 100 percent of all permits are submitted, reviewed and issued on-line.
Target: By 2015, time-based performance measures are reduced in time by 50 percent or more from 2010 time frames.
Strategy 2 Maintain and promote collaborative customer relationships.
Target: By 2012, stakeholders engaged and input provided on products and services: create and implement service improvement actions.
Target: By 2013, complete a communication audit and develop a communications plan; solicit input and feedback from program stakeholders; implement the plan.
Strategy 3
Optimize the workforce to improve service delivery through flexible, empowered and innovative employees.
Target: By 2015, all staff is trained in the use of new technologies and methods that improve service delivery to the customer.
Target: By 2015, 50 percent of all staff is cross-trained to serve in multiple areas of the operation.
DRAFT: For review by the Citizen Subcommittee of the Eugene Budget Committee, November 9, 2011
standards to safeguard the health, property and public well-being of owners, occupants and users of rental housing. Rental housing constitutes just under 50 percent of the housing units in Eugene. The program’s focus is on issues involving structural integrity, plumbing, heating, weatherproofing, mold, security and smoke detectors. The ordinance has an automatic sunset date of December 31, 2011 at which time the ordinance is repealed unless Council amends the code further. Consideration of options is underway this fall of 2011.
.
Service Description
Strategies with Performance Targets
Performance Measures
City of Eugene Service Profiles
Service profiles are mini strategic plans for each of the City of Eugene’s services. Updated every four years, the profiles offer an overview of each service and its goals, and insight into some of the tools the service uses to track its performance.
Our mission is to preserve and improve the public‘s safety, health, welfare and environment through the timely and consistent review and inspection of construction projects to ensure they meet federal, state and local standards.
Preserve public health and safety through properly constructed systems
Structural integrity of buildings to withstand natural disasters
Minimized loss of life due to fires Development is evaluated through a sustainability lens and
innovation is actively supported More orderly, attractive development compatible with the
public infrastructure and consistent with local land use policies
Primarily through education and mediation ensure minimum safety and livability standards for rental properties
Well informed and supported customers
Policy oversight is provided by the City Council and Budget Committee. In addition, advisory groups have been formed throughout the PIC’s history to provide feedback and guidance on services, policies and funding. The most recent group was focused on promoting green building.
Staff providing this service learns from customer feedback in a variety of ways. Each permit receipt includes the website of a customer internet survey. Hard copy customer survey forms are available at counters for visitors to submit. Supervisors receive feedback from customers on service delivery and process improvement on a daily basis. Limited consultation meetings with staff and the applicant allow customers to ask questions and provide feedback on policies and processes. The PIC publishes
information on the Building and Permit Services division website and periodically publishes a newsletter that provides information about regulations, procedures and services. A recent electronic survey and telephone interview of regular PIC customers obtained feedback on how to enhance information and services via the website. Staff hosts sack lunches, inviting designers and applicants to learn more about a development related topic and regularly engages with stakeholders by attending community and organizational meetings. Historically, the PIC has conducted a statistically valid telephone survey every two years by randomly contacting several hundred persons who have interacted with the permitting process during the previous year. The survey addresses their
Economy
Since the end of 2007, the recession has limited development, especially new single family dwellings. A large part of this service area is self-funded and knowing the variable nature of development, a funding reserve had been established. By 2010, reserves were only adequate to cover one month of operation and 17 out of 59 staff positions were eliminated. While residential construction is depressed, green building incentives have supported a modest increase in more sustainable construction. Institutional projects and multi-family housing near the University of Oregon have continued. The rental housing code has existed since 2005 without increasing fees and through prudent fund management anticipates no increases in the next several years as it draws down reserves it initially generated. Other permit fee increases have been minimized during this period and staff is investing in reduced process and new technology to provide a long range sustainable budget.
Staffing
With a smaller workforce due to lower permit activity and falling revenues, staff is exploring additional cross-training opportunities to help address the variable nature of this service area. Inspectors have been cross certified to allow a structural, mechanical, plumbing and
electrical inspection by one inspector at a home rather than four.
Complexity of Regulation
The long term trend of citizens demanding a legislative solution to emerging issues continues. Increasing development regulations require more skillful coordination, higher levels of knowledge and staff time. It takes a significant amount of time to explain these complex requirements, especially to those with limited experience with them.
Customer Service
Customer’s demands for shorter review times to obtain permits have increased during the down economy. Customers continue to want consistency yet flexibility for their project. The general public and neighborhood groups have increased scrutiny of proposed projects and have appealed issuance of some building permits to the State. Staff continues to invest in building partnerships with stakeholders, informing them about codes and processes while looking for creative solutions together.
Technology Opportunities
Many proven technology solutions, some designed specifically for building permit systems, are available to increase efficiency and reduce overall costs. Staff has provided inspectors with cell phones and integrated laptops for real time data entry in the field. A detailed
Operating Environment Mission and Outcomes
Community Involvement and Customer Input
analysis to enhance customer service via the BPS website, in coordination with the City’s new portal, is underway. New web functionality will include application submittals and ability to pay fees on-line. A new electronic permit tracking system combined with digital review and marking technology will bring additional efficiency as customers are supported through the transition from paper to on-line permitting. The rental housing program has charted some of the new course with the ability for property owners to make payments online.
Envision Eugene
The Planning Division leads the front end work to develop a long-range land use plan for Eugene. Strategies to accommodate growth, such as land use code changes, will be needed to transition the plan into action. Code language will strive to improve the quality and compatibility of new construction while keeping the code as simple and consistent as possible. PIC staff will help draft code language and monitor development activity as a way to measure progress toward community goals. In addition, staff will modify service delivery and help remove regulatory and procedural barriers to the desired growth patterns.
satisfaction with construction permit services and asks them to rate the importance of service attributes. The most recent survey was postponed to develop a clear five year vision and implementation plan. That work is nearing completion and the survey can then be modified to ask specific questions related to the vision. The next survey with the modified questions can act as a baseline and an objective assessment tool in the years to come. The rental housing program worked closely with a department advisory committee to develop standards to address mold in 2009. More recently, a community survey was undertaken that will inform Council as they consider the future of the rental housing program.
CityofEugenestaffuseover675vehicles,370piecesofconstructionequipment,and2,000piecesofcommunicationequipmenttodeliverawidearrayofservicestotheresidentsofEugene.Thisequipment–referredtoastheCity’sfleet–includesthefullrangeofmunicipalequipmentincludingpolicecars,emergencymedicalvehicles,fireengines,constructionandmaintenanceequipment,andcommunicationsequipment.
AcentralizedFleetandRadioCommunicationServicesstaffkeepstheCity’sfleetoperatingtoensureCitystaffhassafe,cost‐effective,environmentallyresponsibleandreliableequipmenttocarryouttheirresponsibilities.Fleet’sstaffimplementsayear‐roundpreventivemaintenancescheduleforallequipment.Fleetstaffperformsequipmentrepairsonamulti‐shiftbasisandareavailabletorespondtoemergencyrequestsona24/7basis.FleetServicesstaffalsoassistsCitypersonnelwithequipmentpurchasesbyprovidingtechnicaladvice,managingequipmentpurchases,andinspectingandmodifyingequipmentpriortodelivery.
WhileequipmentacquisitionandmaintenanceiscentralizedattheCity,equipmentmanagementandownershipresideswithindividualCitydepartments.DepartmentspayFleetServices
FleetandRadioCommunicationServices
fortheservicestheyprovideusingarateschedulepublishedatthestartofeachbudgetyear.Ratesareestablishedforeachclassofvehicleandequipmentbasedontheactualcostsofmaintenanceandrepairservices,aswellasannualinsuranceandoverhead.FundstoreplaceGeneralFundequipmentareallocatedannuallythroughtheCity’sbudgetprocess.Fundstoreplacenon‐GeneralFundvehiclesandequipmentaresetasideinequipmentreplacementaccountsmanagedbyFleetServices.Equipmentisreplacedbaseduponprojectedlife‐cycleandactualoperatingcosts.AFleetAdvisoryBoard,consistingofrepresentativesofeachCitydepartmentandstaffedbythemanagerofFleetServices,setsCity‐widefleetpolicy.TheCity’sfleetiscurrentlyvaluedat$50,000,000.Theservicehasastaffof30.20FTEanditsFY15operatingbudgetis$14,436,000.Ofthis,$7,353,000isdesignated
Effectiveness Percentageoftimevehiclesand
equipmentareavailableforcustomers’use.
Numberofvehicleandequipmentcomebacks.
Efficiency Fleetaveragefuelefficiencylaw
enforcementvehicles,lightvehicles,andon‐roadheavyvehicles.
Financial Operatingcostpermile(patrol,hybrid
sedan)
APPROVED:ForreviewbytheCitizenSubcommitteeoftheEugeneBudgetCommittee,January29,2015
ServiceDescription
StrategieswithPerformanceTargets
PerformanceMeasures
CityofEugeneServiceProfilesServiceprofilesareministrategicplansforeachoftheCityofEugene’sservices.Updatedeveryfouryears,theprofilesofferanoverviewofeachserviceanditsgoals,andinsightintosomeofthetoolstheserviceusestotrackitsperformance.
Strategy1
Continuetoimprovehowcustomersareinformedaboutthestatusoftheirequipmentandworkperformed.
Target:Increaseoverallcustomersatisfactionabove83%.
Strategy2
Continuallystrivetoimprovethesafety,effectiveness,andenvironmentalefficiencyofallequipment.
Target:IncreasethepercentageofhybridsedansandSUV’sinthefleet(fromFY13levelsof74%and69%respectively),to90%eachclassbyFY20.
CustomerSatisfaction Percentageofcustomersreportingthey
aresatisfiedorverysatisfiedwithFleetServices.
forequipmentacquisition.Theremainderfundsfleetandradiomaintenanceandrepairservices.
Strategy3
Providecostcompetitivefleetandradiocommunicationservices.
Target:Maintaincomebacksonequipmentrepairsat3%orless.
FleetServiceshastwoprimarydirectcustomers:
CitystaffwhodirectlyuseequipmentmaintainedandrepairedbyFleetServices.
CitysupervisorystaffwhoobtainFleetServices’adviceandassistanceregardingvehicle/equipmentmanagementandpurchase.
FleetServicesconductscustomersurveyseverytwoyearswiththelastbeingin2012.ThesurveyasksCitysupervisorystafftheiropinionofFleetServicesmaintenance,repair,acquisitionservicesandtheiropinionofFleet’scustomerservice.
CustomerExpectationsInformationfromCityStaffhasledFleetServicesto:
ImplementaprogramtoassignatechniciantoberesponsibleforfieldrepairsattheAirportandWastewaterDivisionstominimizeequipmentdowntimes.
FocusonensuringcommunicationbetweenFleetandDepartmentsishandledbydirectcontactinsteadofrelyingsolelyonelectronicinformationexchange.
Beginaprogramofmeetingwithprimarycustomerstoexplaintheratedevelopmentprocessandtooutlinewhatservicesareincludedintheratespaid.
Continuebuildingpositivecustomerworkingrelationshipsthroughthedevelopmentofamission,visionandvalueoperatingprincipleswhereongoingpartnershipdevelopmentisrecognizedasatoppriorityforFleetandRadioServices.
ManagedCompetition(100BestFleetPrograms)Todemonstratecompetence,FleetandRadioServiceshasparticipatedinthe100BestFleetscompetitionandbeen
rankedasoneoftheTop100PublicFleetsinthenationforthepast6years.
IntergovernmentalCooperationAsresourcesbecomemoreconstrained,othergovernmentaljurisdictionsmayrequestcooperativeagreementswiththeCityofEugene.Currently,multi‐jurisdictionalagreementshavebeendevelopedtoestablishtheCityofEugeneRadioShopastheprimarymaintenanceentityfortheinteroperablepublicsafetyradiosystemusedbythesystempartnersincluding:CityofEugene,LaneCounty,CityofSpringfieldandEWEB.
IncreasedRegulatoryRequirementsIncreasingregulationsareexpectedtocontinueinseveralareassuchasproductdisposal,alternativefuels,alternativeenergyequipment,radiocommunicationinnovationandFCCsystemrequirements.Ongoingregulatorychangesrequirestaffcertificationsandlicensingwhichcanbringadditionalcosts.
DesireforEnergyEfficientVehiclesandFuelsAcontinuedemphasistomaximizefuelefficiencywillleadtotheuseofmoreenergyefficientequipmentandalternativeenergyvehicles.Findingwaystoimprovevehicleutilizationthroughanalysis,theidlingreductionpolicy,andinvestmentsinalternativefuelswillbecomeimportanttoolstohelpaddressthevolatilityofcostsrelatedtotheuseoffossilfuels.
OperatingEnvironment
CommunityInvolvementandCustomerInput
AnIncreasinglyTechnicalEnvironmentVehiclesystems,radios,repairequipment,andFleetdatabasetrackingsystemscontinuetobecomeincreasinglycomplicatedandtechnical.OngoingtechnicaltrainingtorespondtothesechangeswillbecrucialforFleetandRadiostaff.Currently,FleetisrecognizedasaBlueSealShopunderthenationallyrecognizedASE(AutomotiveServiceExcellence)program.ContinuedrequirementsforprofessionalcertificationsofFleettechniciansareessentialformaintainingcompetenceinmaintenanceofthediversetypesofvehicles/equipmentintheCityfleet.AdvancessuchasalternativefuelsandelectricdrivesystemsinthevehiclemarketswillalsorequireFleetandRadioCommunicationsServicestoprovidecustomerDepartmentsongoingadviceandinformationonchoicesavailableinthevehicleandequipmentmarkets.
InefficientandUnsafeFleetFacilityFleetServicescurrentlyoccupiesanold,crampedstructurethatdoesnotmeetseismicstandards.Itisinefficientandcosttorepairandmaintain.AfeasibilitystudywasconductedinFY09toreplacethecurrentfacilityandaprojectisbeingdevelopedtoaddressfundingasaferandmoreefficientFleetFacility.
TheFleetManageralsomeetsmonthlywiththeFleetAdvisoryboardtoobtaininputregardingFleetoperationsandtoshareFleetandRadiorelatedissueswhichaffectcustomercostsandservicedelivery.TheFleetandRadioCommunicationsServicesPolicyandProceduresManualwasrevised,updatedandprocessedthroughtheFleetBoardandExecutiveManagersinFY09.ThismanualhelpstoincreasecommunicationandunderstandingoftheservicesprovidedtoallCityDepartmentsbyFleetServices.Inaddition,itprovidesatemplateofoperatingprinciplestoassistcustomerdepartmentsinunderstandingtheimportanceofefficientlymanagingtheiroperationalfleets.
MissionandOutcomesThroughteamwork,ourmissionistoprovidecustomerssafeandreliableequipmentthroughenvironmentallyresponsiblemaintenancerepairandinstallationinanefficientandcosteffectivemanner.
Safeandreliablevehicles,radios,andotherequipment.
EffectivemanagementoftheCity’sfleetassets. OperatingsavingstotheCitythrougheffective
andefficientoperationsofFleetServices. EffectiveandefficientdeliveryofCityservices. Westrivetomakeourcustomers’equipment
safeandreliable. Weareresponsivetocustomerneedsand
accountablefortheservicesweprovide.
Wedeliverqualityservicesinacost‐effective,equitable,environmentallyresponsibleandprofessionalmannerinawaythatminimizesequipmentdowntime.
Webelieveinopenanddirectcommunicationbetweenco‐workersandfleetcustomerstoensureweacquireandproperlymaintainequipmentinawaythatbestmeetstheirneeds.
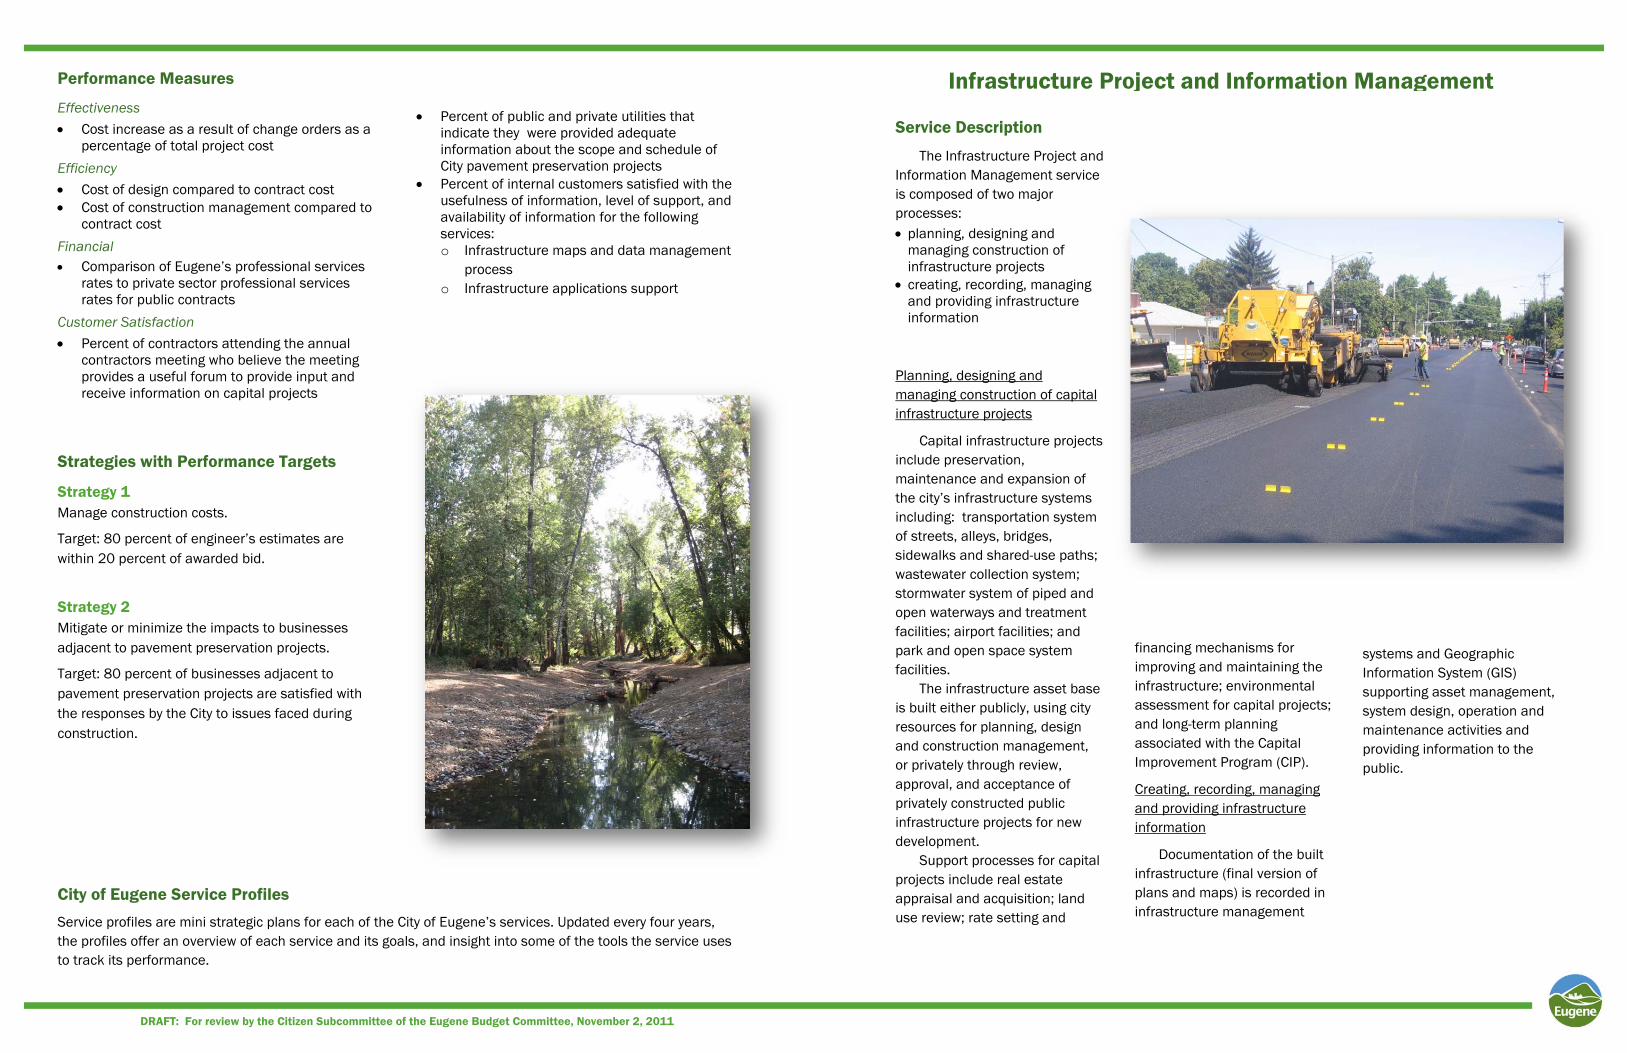
The Infrastructure Project and Information Management service is composed of two major processes: planning, designing and
managing construction of infrastructure projects
creating, recording, managing and providing infrastructure information
Planning, designing and managing construction of capital infrastructure projects
Capital infrastructure projects include preservation, maintenance and expansion of the city’s infrastructure systems including: transportation system of streets, alleys, bridges, sidewalks and shared-use paths; wastewater collection system; stormwater system of piped and open waterways and treatment facilities; airport facilities; and park and open space system facilities.
The infrastructure asset base is built either publicly, using city resources for planning, design and construction management, or privately through review, approval, and acceptance of privately constructed public infrastructure projects for new development.
Support processes for capital projects include real estate appraisal and acquisition; land use review; rate setting and
Infrastructure Project and Information Management
financing mechanisms for improving and maintaining the infrastructure; environmental assessment for capital projects; and long-term planning associated with the Capital Improvement Program (CIP).
Creating, recording, managing and providing infrastructure information
Documentation of the built infrastructure (final version of plans and maps) is recorded in infrastructure management
Effectiveness
Cost increase as a result of change orders as a percentage of total project cost
Efficiency Cost of design compared to contract cost Cost of construction management compared to
contract cost
Financial Comparison of Eugene’s professional services
rates to private sector professional services rates for public contracts
Customer Satisfaction
Percent of contractors attending the annual contractors meeting who believe the meeting provides a useful forum to provide input and receive information on capital projects
Percent of public and private utilities that indicate they were provided adequate information about the scope and schedule of City pavement preservation projects
Percent of internal customers satisfied with the usefulness of information, level of support, and availability of information for the following services: o Infrastructure maps and data management
process o Infrastructure applications support
Strategy 1 Manage construction costs.
Target: 80 percent of engineer’s estimates are within 20 percent of awarded bid.
Strategy 2 Mitigate or minimize the impacts to businesses adjacent to pavement preservation projects.
Target: 80 percent of businesses adjacent to pavement preservation projects are satisfied with the responses by the City to issues faced during construction.
DRAFT: For review by the Citizen Subcommittee of the Eugene Budget Committee, November 2, 2011
systems and Geographic Information System (GIS) supporting asset management, system design, operation and maintenance activities and providing information to the public.
Service Description
Strategies with Performance Targets
Performance Measures
City of Eugene Service Profiles
Service profiles are mini strategic plans for each of the City of Eugene’s services. Updated every four years, the profiles offer an overview of each service and its goals, and insight into some of the tools the service uses to track its performance.
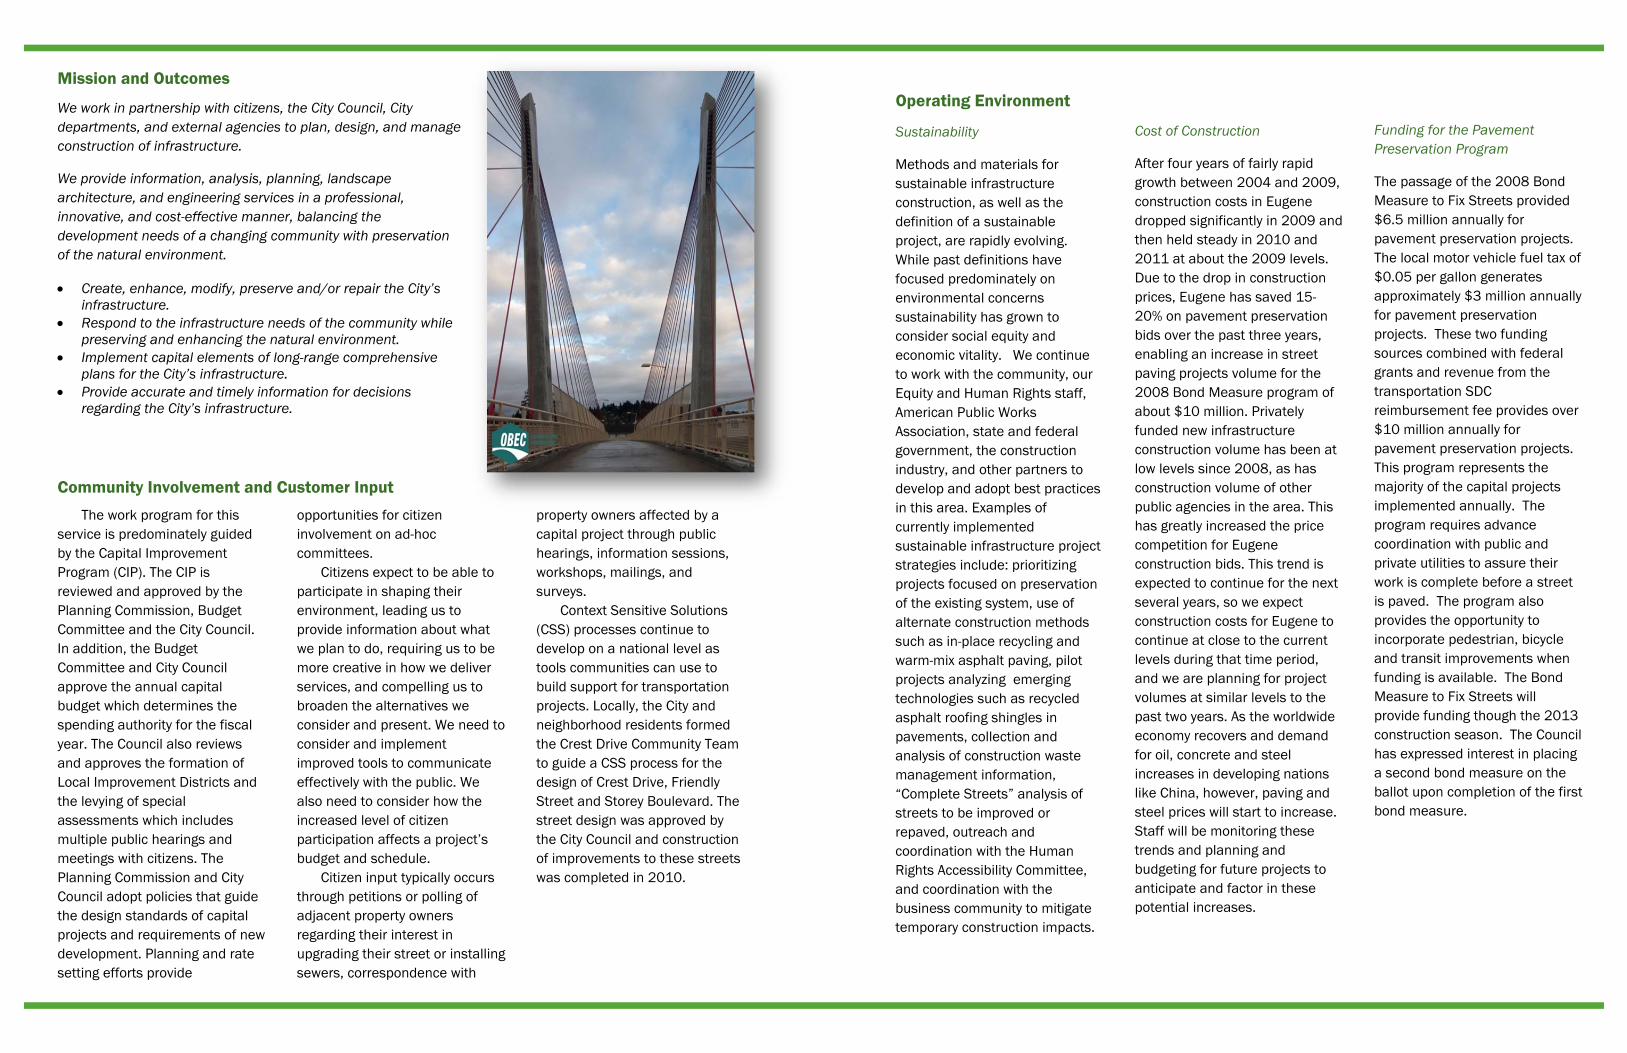
We work in partnership with citizens, the City Council, City departments, and external agencies to plan, design, and manage construction of infrastructure.
We provide information, analysis, planning, landscape architecture, and engineering services in a professional, innovative, and cost-effective manner, balancing the development needs of a changing community with preservation of the natural environment.
Create, enhance, modify, preserve and/or repair the City’s infrastructure.
Respond to the infrastructure needs of the community while preserving and enhancing the natural environment.
Implement capital elements of long-range comprehensive plans for the City’s infrastructure.
Provide accurate and timely information for decisions regarding the City’s infrastructure.
The work program for this service is predominately guided by the Capital Improvement Program (CIP). The CIP is reviewed and approved by the Planning Commission, Budget Committee and the City Council. In addition, the Budget Committee and City Council approve the annual capital budget which determines the spending authority for the fiscal year. The Council also reviews and approves the formation of Local Improvement Districts and the levying of special assessments which includes multiple public hearings and meetings with citizens. The Planning Commission and City Council adopt policies that guide the design standards of capital projects and requirements of new development. Planning and rate setting efforts provide
opportunities for citizen involvement on ad-hoc committees.
Citizens expect to be able to participate in shaping their environment, leading us to provide information about what we plan to do, requiring us to be more creative in how we deliver services, and compelling us to broaden the alternatives we consider and present. We need to consider and implement improved tools to communicate effectively with the public. We also need to consider how the increased level of citizen participation affects a project’s budget and schedule.
Citizen input typically occurs through petitions or polling of adjacent property owners regarding their interest in upgrading their street or installing
sewers, correspondence with
Sustainability
Methods and materials for sustainable infrastructure construction, as well as the definition of a sustainable project, are rapidly evolving. While past definitions have focused predominately on environmental concerns sustainability has grown to consider social equity and economic vitality. We continue to work with the community, our Equity and Human Rights staff, American Public Works Association, state and federal government, the construction industry, and other partners to develop and adopt best practices in this area. Examples of currently implemented sustainable infrastructure project strategies include: prioritizing projects focused on preservation of the existing system, use of alternate construction methods such as in-place recycling and warm-mix asphalt paving, pilot projects analyzing emerging technologies such as recycled asphalt roofing shingles in pavements, collection and analysis of construction waste management information, “Complete Streets” analysis of streets to be improved or repaved, outreach and coordination with the Human Rights Accessibility Committee, and coordination with the business community to mitigate temporary construction impacts.
Cost of Construction
After four years of fairly rapid growth between 2004 and 2009, construction costs in Eugene dropped significantly in 2009 and then held steady in 2010 and 2011 at about the 2009 levels. Due to the drop in construction prices, Eugene has saved 15-20% on pavement preservation bids over the past three years, enabling an increase in street paving projects volume for the 2008 Bond Measure program of about $10 million. Privately funded new infrastructure construction volume has been at low levels since 2008, as has construction volume of other public agencies in the area. This has greatly increased the price competition for Eugene construction bids. This trend is expected to continue for the next several years, so we expect construction costs for Eugene to continue at close to the current levels during that time period, and we are planning for project volumes at similar levels to the past two years. As the worldwide economy recovers and demand for oil, concrete and steel increases in developing nations like China, however, paving and steel prices will start to increase. Staff will be monitoring these trends and planning and budgeting for future projects to anticipate and factor in these potential increases.
Operating Environment Mission and Outcomes
Community Involvement and Customer Input
Funding for the Pavement Preservation Program
The passage of the 2008 Bond Measure to Fix Streets provided $6.5 million annually for pavement preservation projects. The local motor vehicle fuel tax of $0.05 per gallon generates approximately $3 million annually for pavement preservation projects. These two funding sources combined with federal grants and revenue from the transportation SDC reimbursement fee provides over $10 million annually for pavement preservation projects. This program represents the majority of the capital projects implemented annually. The program requires advance coordination with public and private utilities to assure their work is complete before a street is paved. The program also provides the opportunity to incorporate pedestrian, bicycle and transit improvements when funding is available. The Bond Measure to Fix Streets will provide funding though the 2013 construction season. The Council has expressed interest in placing a second bond measure on the ballot upon completion of the first bond measure.
property owners affected by a capital project through public hearings, information sessions, workshops, mailings, and surveys.
Context Sensitive Solutions (CSS) processes continue to develop on a national level as tools communities can use to build support for transportation projects. Locally, the City and neighborhood residents formed the Crest Drive Community Team to guide a CSS process for the design of Crest Drive, Friendly Street and Storey Boulevard. The street design was approved by the City Council and construction of improvements to these streets was completed in 2010.
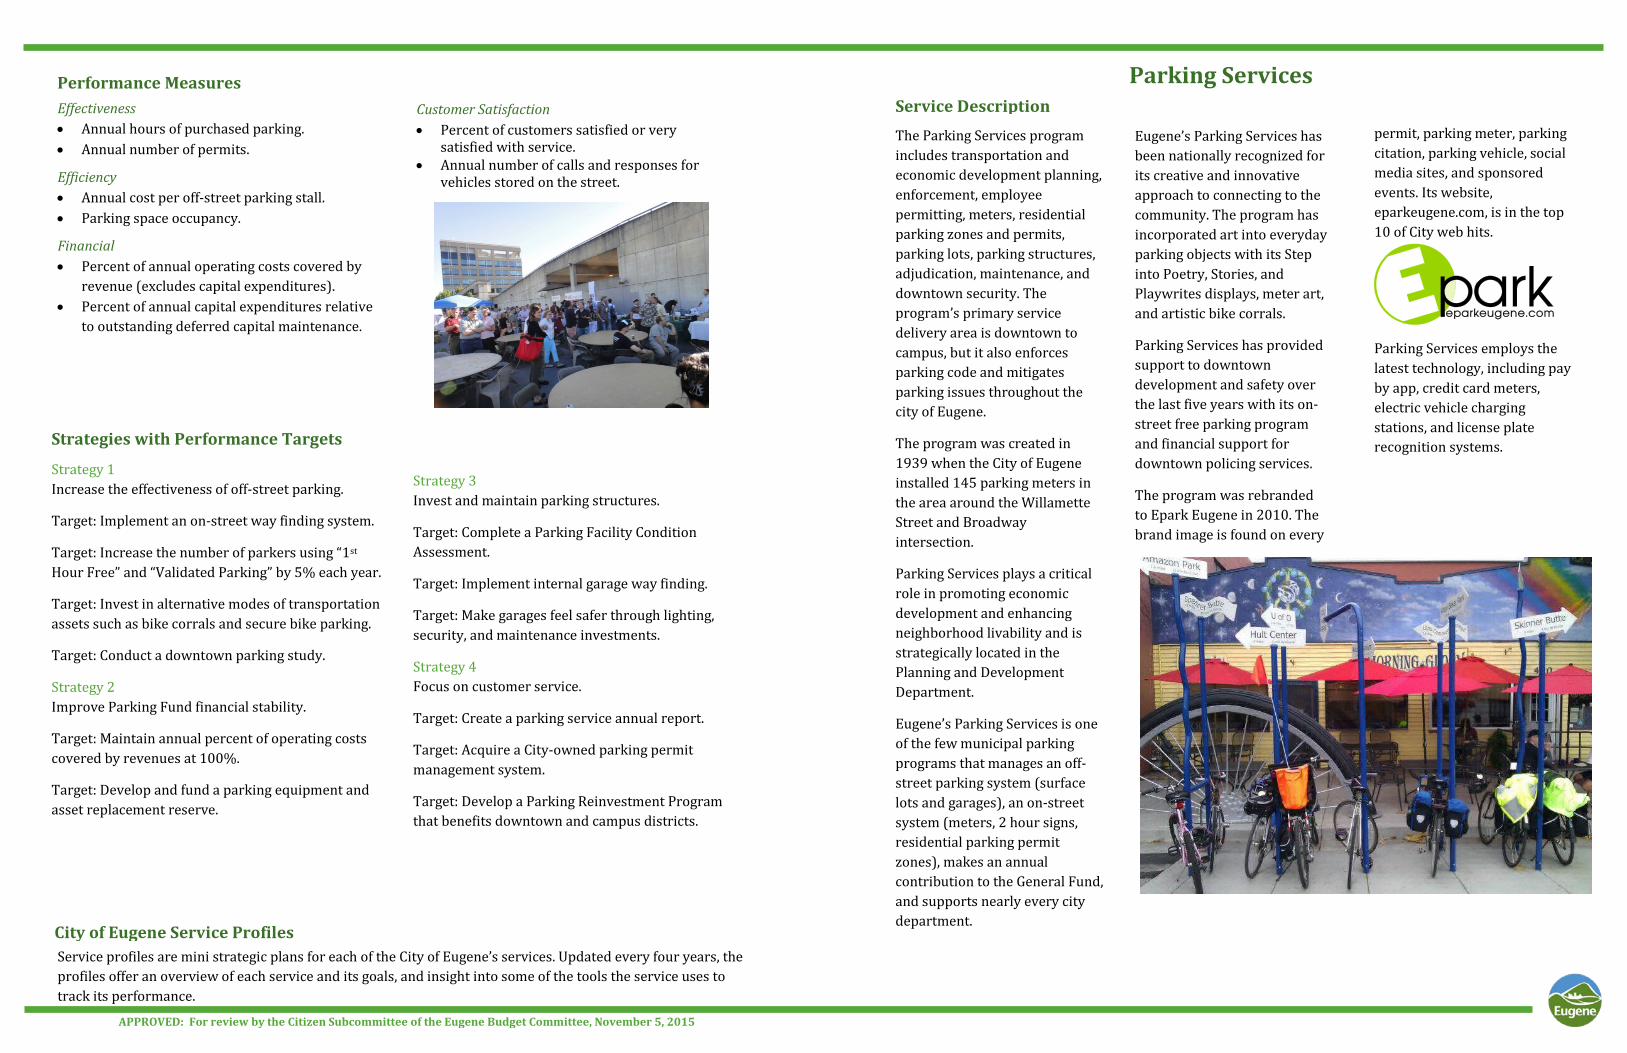
The Parking Services program includes transportation and economic development planning, enforcement, employee permitting, meters, residential parking zones and permits, parking lots, parking structures, adjudication, maintenance, and downtown security. The program’s primary service delivery area is downtown to campus, but it also enforces parking code and mitigates parking issues throughout the city of Eugene.
The program was created in 1939 when the City of Eugene installed 145 parking meters in the area around the Willamette Street and Broadway intersection.
Parking Services plays a critical role in promoting economic development and enhancing neighborhood livability and is strategically located in the Planning and Development Department.
Eugene’s Parking Services is one of the few municipal parking programs that manages an off-street parking system (surface lots and garages), an on-street system (meters, 2 hour signs, residential parking permit zones), makes an annual contribution to the General Fund, and supports nearly every city department.
Parking Services
Strategies with Performance Targets
Eugene’s Parking Services has been nationally recognized for its creative and innovative approach to connecting to the community. The program has incorporated art into everyday parking objects with its Step into Poetry, Stories, and Playwrites displays, meter art, and artistic bike corrals.
Parking Services has provided support to downtown development and safety over the last five years with its on-street free parking program and financial support for downtown policing services.
The program was rebranded to Epark Eugene in 2010. The brand image is found on every
Strategy 3 Invest and maintain parking structures.
Target: Complete a Parking Facility Condition Assessment.
Target: Implement internal garage way finding.
Target: Make garages feel safer through lighting, security, and maintenance investments.
Strategy 4 Focus on customer service.
Target: Create a parking service annual report.
Target: Acquire a City-owned parking permit management system.
Target: Develop a Parking Reinvestment Program that benefits downtown and campus districts.
Effectiveness • Annual hours of purchased parking. • Annual number of permits.
Efficiency • Annual cost per off-street parking stall. • Parking space occupancy.
Financial • Percent of annual operating costs covered by
revenue (excludes capital expenditures). • Percent of annual capital expenditures relative
to outstanding deferred capital maintenance.
Service Description
Performance Measures
City of Eugene Service Profiles
Service profiles are mini strategic plans for each of the City of Eugene’s services. Updated every four years, the profiles offer an overview of each service and its goals, and insight into some of the tools the service uses to track its performance.
Strategy 1 Increase the effectiveness of off-street parking.
Target: Implement an on-street way finding system.
Target: Increase the number of parkers using “1st Hour Free” and “Validated Parking” by 5% each year.
Target: Invest in alternative modes of transportation assets such as bike corrals and secure bike parking.
Target: Conduct a downtown parking study.
Strategy 2 Improve Parking Fund financial stability.
Target: Maintain annual percent of operating costs covered by revenues at 100%.
Target: Develop and fund a parking equipment and asset replacement reserve.
APPROVED: For review by the Citizen Subcommittee of the Eugene Budget Committee, November 5, 2015
Customer Satisfaction • Percent of customers satisfied or very
satisfied with service. • Annual number of calls and responses for
vehicles stored on the street.
permit, parking meter, parking citation, parking vehicle, social media sites, and sponsored events. Its website, eparkeugene.com, is in the top 10 of City web hits.
Parking Services employs the latest technology, including pay by app, credit card meters, electric vehicle charging stations, and license plate recognition systems.
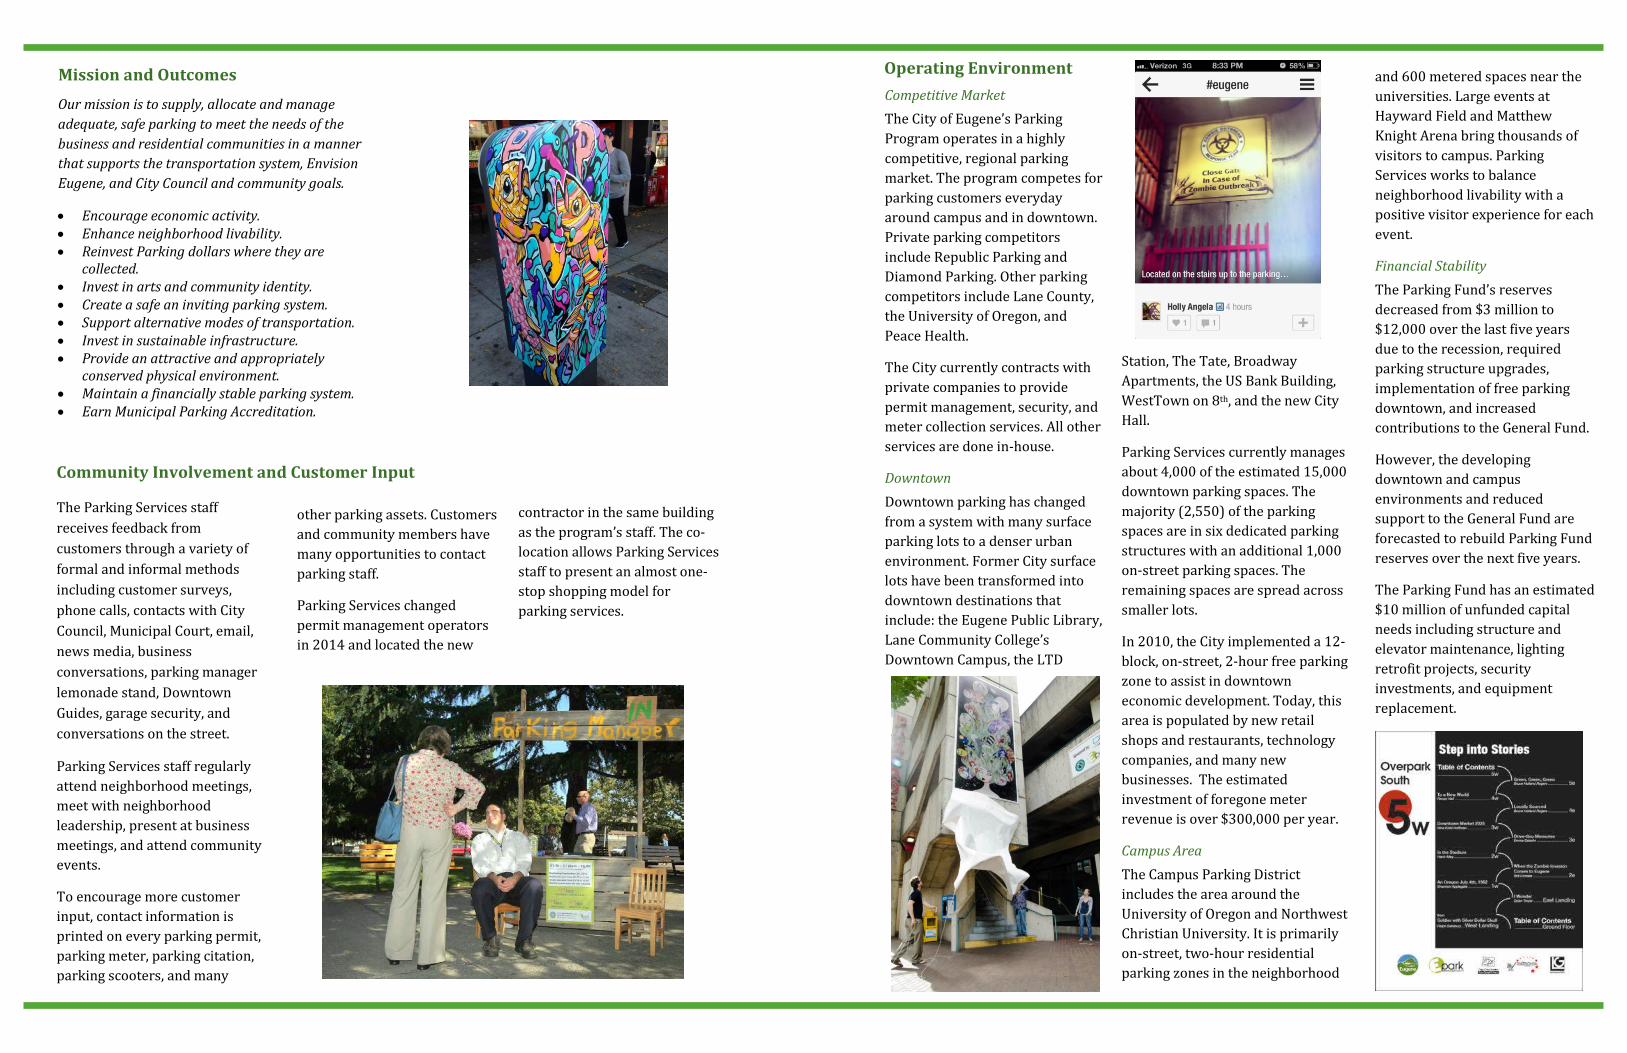
Competitive Market The City of Eugene’s Parking Program operates in a highly competitive, regional parking market. The program competes for parking customers everyday around campus and in downtown. Private parking competitors include Republic Parking and Diamond Parking. Other parking competitors include Lane County, the University of Oregon, and Peace Health.
The City currently contracts with private companies to provide permit management, security, and meter collection services. All other services are done in-house.
Downtown Downtown parking has changed from a system with many surface parking lots to a denser urban environment. Former City surface lots have been transformed into downtown destinations that include: the Eugene Public Library, Lane Community College’s Downtown Campus, the LTD
Station, The Tate, Broadway Apartments, the US Bank Building, WestTown on 8th, and the new City Hall.
Parking Services currently manages about 4,000 of the estimated 15,000 downtown parking spaces. The majority (2,550) of the parking spaces are in six dedicated parking structures with an additional 1,000 on-street parking spaces. The remaining spaces are spread across smaller lots.
In 2010, the City implemented a 12-block, on-street, 2-hour free parking zone to assist in downtown economic development. Today, this area is populated by new retail shops and restaurants, technology companies, and many new businesses. The estimated investment of foregone meter revenue is over $300,000 per year.
Campus Area The Campus Parking District includes the area around the University of Oregon and Northwest Christian University. It is primarily on-street, two-hour residential parking zones in the neighborhood
and 600 metered spaces near the universities. Large events at Hayward Field and Matthew Knight Arena bring thousands of visitors to campus. Parking Services works to balance neighborhood livability with a positive visitor experience for each event.
Financial Stability The Parking Fund’s reserves decreased from $3 million to $12,000 over the last five years due to the recession, required parking structure upgrades, implementation of free parking downtown, and increased contributions to the General Fund.
However, the developing downtown and campus environments and reduced support to the General Fund are forecasted to rebuild Parking Fund reserves over the next five years.
The Parking Fund has an estimated $10 million of unfunded capital needs including structure and elevator maintenance, lighting retrofit projects, security investments, and equipment replacement.
other parking assets. Customers and community members have many opportunities to contact parking staff.
Parking Services changed permit management operators in 2014 and located the new
contractor in the same building as the program’s staff. The co-location allows Parking Services staff to present an almost one-stop shopping model for parking services.
The Parking Services staff receives feedback from customers through a variety of formal and informal methods including customer surveys, phone calls, contacts with City Council, Municipal Court, email, news media, business conversations, parking manager lemonade stand, Downtown Guides, garage security, and conversations on the street.
Parking Services staff regularly attend neighborhood meetings, meet with neighborhood leadership, present at business meetings, and attend community events.
To encourage more customer input, contact information is printed on every parking permit, parking meter, parking citation, parking scooters, and many
Operating Environment
Community Involvement and Customer Input
Mission and Outcomes Our mission is to supply, allocate and manage adequate, safe parking to meet the needs of the business and residential communities in a manner that supports the transportation system, Envision Eugene, and City Council and community goals.
• Encourage economic activity. • Enhance neighborhood livability. • Reinvest Parking dollars where they are
collected. • Invest in arts and community identity. • Create a safe an inviting parking system. • Support alternative modes of transportation. • Invest in sustainable infrastructure. • Provide an attractive and appropriately
conserved physical environment. • Maintain a financially stable parking system. • Earn Municipal Parking Accreditation.
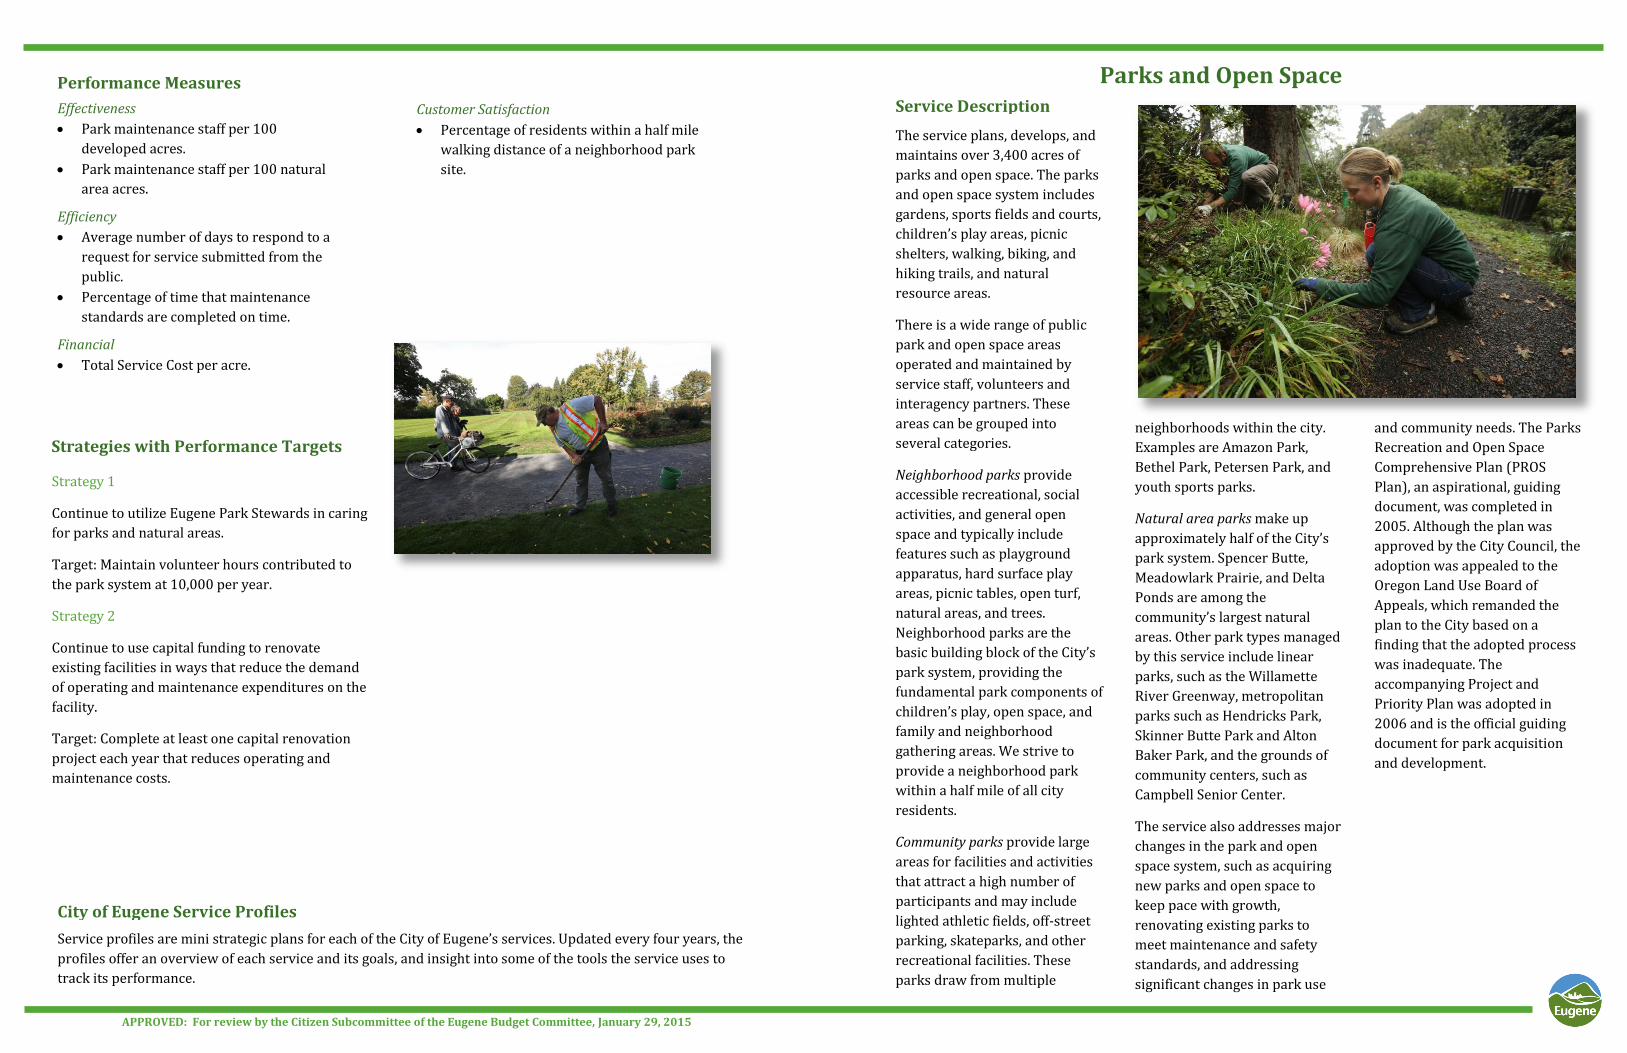
The service plans, develops, and
maintains over 3,400 acres of
parks and open space. The parks
and open space system includes
gardens, sports fields and courts,
children’s play areas, picnic
shelters, walking, biking, and
hiking trails, and natural
resource areas.
There is a wide range of public
park and open space areas
operated and maintained by
service staff, volunteers and
interagency partners. These
areas can be grouped into
several categories.
Neighborhood parks provide
accessible recreational, social
activities, and general open
space and typically include
features such as playground
apparatus, hard surface play
areas, picnic tables, open turf,
natural areas, and trees.
Neighborhood parks are the
basic building block of the City’s
park system, providing the
fundamental park components of
children’s play, open space, and
family and neighborhood
gathering areas. We strive to
provide a neighborhood park
within a half mile of all city
residents.
Community parks provide large
areas for facilities and activities
that attract a high number of
participants and may include
lighted athletic fields, off-street
parking, skateparks, and other
recreational facilities. These
parks draw from multiple
Parks and Open Space
neighborhoods within the city.
Examples are Amazon Park,
Bethel Park, Petersen Park, and
youth sports parks.
Natural area parks make up
approximately half of the City’s
park system. Spencer Butte,
Meadowlark Prairie, and Delta
Ponds are among the
community’s largest natural
areas. Other park types managed
by this service include linear
parks, such as the Willamette
River Greenway, metropolitan
parks such as Hendricks Park,
Skinner Butte Park and Alton
Baker Park, and the grounds of
community centers, such as
Campbell Senior Center.
The service also addresses major
changes in the park and open
space system, such as acquiring
new parks and open space to
keep pace with growth,
renovating existing parks to
meet maintenance and safety
standards, and addressing
significant changes in park use
Effectiveness
Park maintenance staff per 100
developed acres.
Park maintenance staff per 100 natural
area acres.
Efficiency
Average number of days to respond to a
request for service submitted from the
public.
Percentage of time that maintenance
standards are completed on time.
Financial
Total Service Cost per acre.
APPROVED: For review by the Citizen Subcommittee of the Eugene Budget Committee, January 29, 2015
Service Description
Strategies with Performance Targets
Performance Measures
City of Eugene Service Profiles
Service profiles are mini strategic plans for each of the City of Eugene’s services. Updated every four years, the
profiles offer an overview of each service and its goals, and insight into some of the tools the service uses to
track its performance.
Strategy 1
Continue to utilize Eugene Park Stewards in caring
for parks and natural areas.
Target: Maintain volunteer hours contributed to
the park system at 10,000 per year.
Strategy 2
Continue to use capital funding to renovate
existing facilities in ways that reduce the demand
of operating and maintenance expenditures on the
facility.
Target: Complete at least one capital renovation
project each year that reduces operating and
maintenance costs.
To help make spay/neuter
services more affordable the
Clinic distributes several hundred
spay/neuter discount vouchers to
low-income city residents each
year. Feral cats continue to be a
problem, and the City is
continuing to help fund Greenhill
Humane Society’s feral cat trap-
neuter-release program.
The City budgeted over $1 million
for animal services in FY12. This
includes $433,470 for the City
Spay/Neuter Clinic, $585,000 for
the Lane County contract and
$2,000 for Greenhill’s feral cat
program. In addition to contract
payments, LCAS also retains 95%
of dog licensing revenue and all
shelter fees paid by city
residents. This revenue,
estimated to be in the
neighborhood of $280,000, does
not appear in the City’s budget
because it is retained by Lane
County under the contract with
the City.
Customer Satisfaction
Percentage of residents within a half mile
walking distance of a neighborhood park
site.
and community needs. The Parks
Recreation and Open Space
Comprehensive Plan (PROS
Plan), an aspirational, guiding
document, was completed in
2005. Although the plan was
approved by the City Council, the
adoption was appealed to the
Oregon Land Use Board of
Appeals, which remanded the
plan to the City based on a
finding that the adopted process
was inadequate. The
accompanying Project and
Priority Plan was adopted in
2006 and is the official guiding
document for park acquisition
and development.
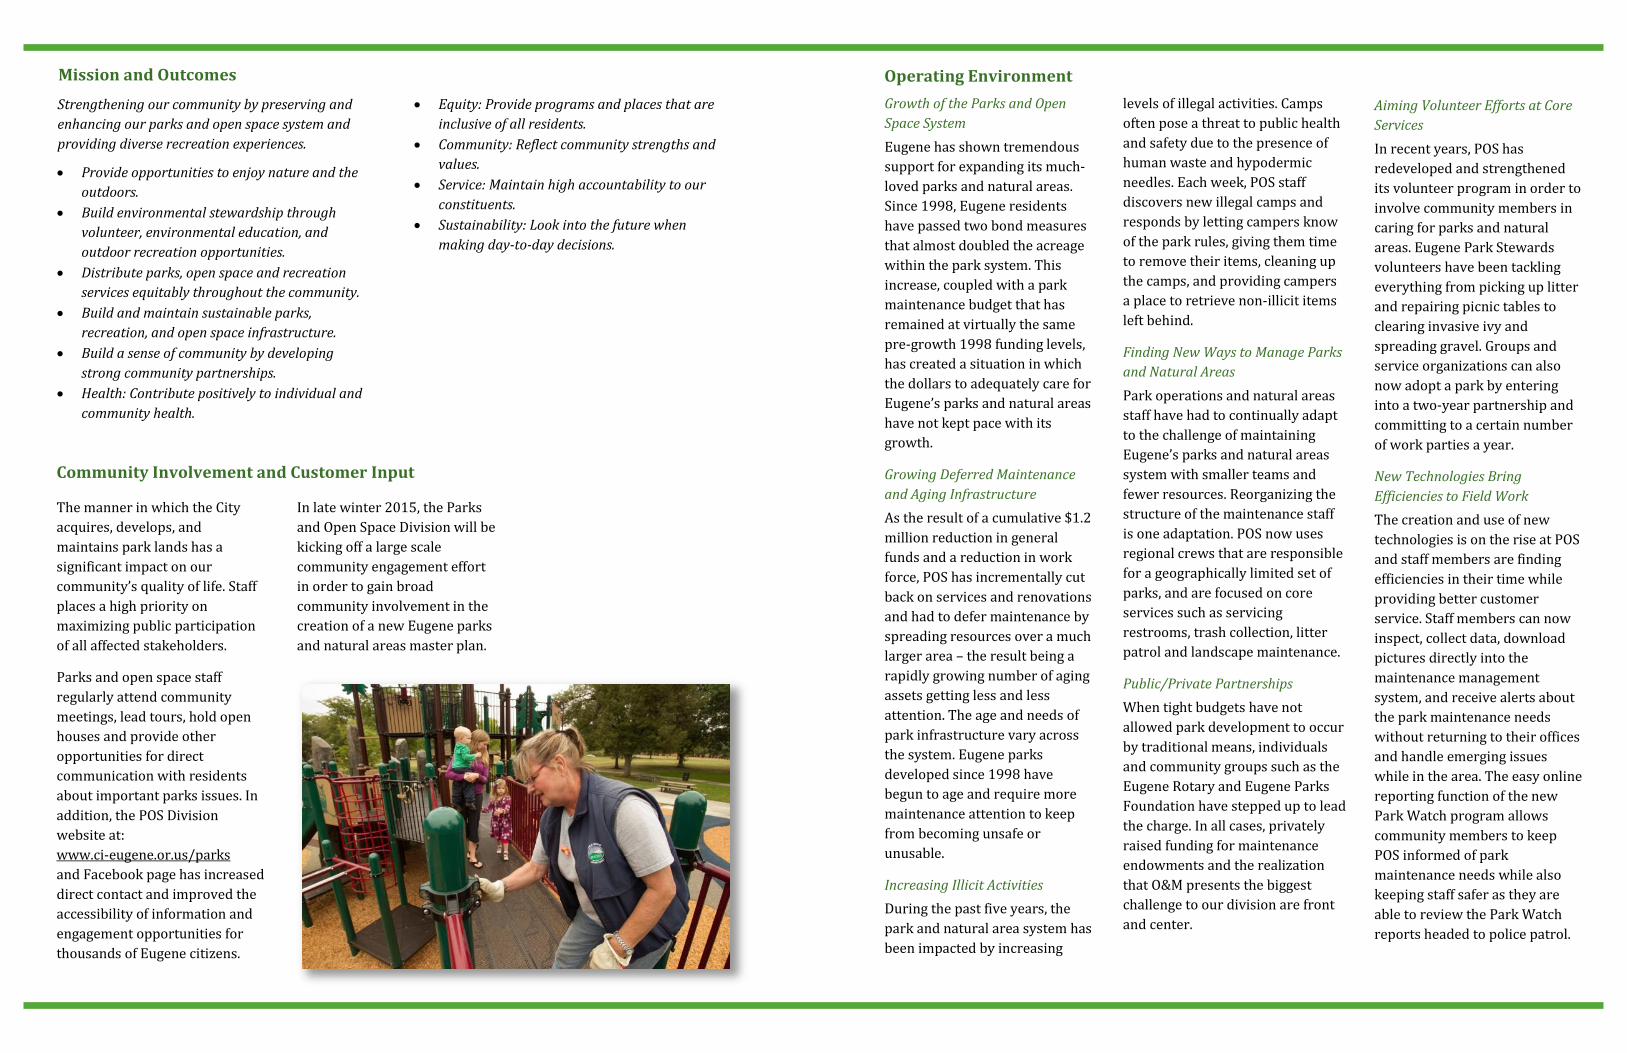
The manner in which the City
acquires, develops, and
maintains park lands has a
significant impact on our
community’s quality of life. Staff
places a high priority on
maximizing public participation
of all affected stakeholders.
Parks and open space staff
regularly attend community
meetings, lead tours, hold open
houses and provide other
opportunities for direct
communication with residents
about important parks issues. In
addition, the POS Division
website at:
www.ci-eugene.or.us/parks
and Facebook page has increased
direct contact and improved the
accessibility of information and
engagement opportunities for
thousands of Eugene citizens.
Growth of the Parks and Open
Space System
Eugene has shown tremendous
support for expanding its much-
loved parks and natural areas.
Since 1998, Eugene residents
have passed two bond measures
that almost doubled the acreage
within the park system. This
increase, coupled with a park
maintenance budget that has
remained at virtually the same
pre-growth 1998 funding levels,
has created a situation in which
the dollars to adequately care for
Eugene’s parks and natural areas
have not kept pace with its
growth.
Growing Deferred Maintenance
and Aging Infrastructure
As the result of a cumulative $1.2
million reduction in general
funds and a reduction in work
force, POS has incrementally cut
back on services and renovations
and had to defer maintenance by
spreading resources over a much
larger area – the result being a
rapidly growing number of aging
assets getting less and less
attention. The age and needs of
park infrastructure vary across
the system. Eugene parks
developed since 1998 have
begun to age and require more
maintenance attention to keep
from becoming unsafe or
unusable.
Increasing Illicit Activities
During the past five years, the
park and natural area system has
been impacted by increasing
levels of illegal activities. Camps
often pose a threat to public health
and safety due to the presence of
human waste and hypodermic
needles. Each week, POS staff
discovers new illegal camps and
responds by letting campers know
of the park rules, giving them time
to remove their items, cleaning up
the camps, and providing campers
a place to retrieve non-illicit items
left behind.
Finding New Ways to Manage Parks
and Natural Areas
Park operations and natural areas
staff have had to continually adapt
to the challenge of maintaining
Eugene’s parks and natural areas
system with smaller teams and
fewer resources. Reorganizing the
structure of the maintenance staff
is one adaptation. POS now uses
regional crews that are responsible
for a geographically limited set of
parks, and are focused on core
services such as servicing
restrooms, trash collection, litter
patrol and landscape maintenance.
Public/Private Partnerships
When tight budgets have not
allowed park development to occur
by traditional means, individuals
and community groups such as the
Eugene Rotary and Eugene Parks
Foundation have stepped up to lead
the charge. In all cases, privately
raised funding for maintenance
endowments and the realization
that O&M presents the biggest
challenge to our division are front
and center.
Operating Environment
Community Involvement and Customer Input
Aiming Volunteer Efforts at Core
Services
In recent years, POS has
redeveloped and strengthened
its volunteer program in order to
involve community members in
caring for parks and natural
areas. Eugene Park Stewards
volunteers have been tackling
everything from picking up litter
and repairing picnic tables to
clearing invasive ivy and
spreading gravel. Groups and
service organizations can also
now adopt a park by entering
into a two-year partnership and
committing to a certain number
of work parties a year.
New Technologies Bring
Efficiencies to Field Work
The creation and use of new
technologies is on the rise at POS
and staff members are finding
efficiencies in their time while
providing better customer
service. Staff members can now
inspect, collect data, download
pictures directly into the
maintenance management
system, and receive alerts about
the park maintenance needs
without returning to their offices
and handle emerging issues
while in the area. The easy online
reporting function of the new
Park Watch program allows
community members to keep
POS informed of park
maintenance needs while also
keeping staff safer as they are
able to review the Park Watch
reports headed to police patrol.
In late winter 2015, the Parks
and Open Space Division will be
kicking off a large scale
community engagement effort
in order to gain broad
community involvement in the
creation of a new Eugene parks
and natural areas master plan.
Mission and Outcomes
Strengthening our community by preserving and
enhancing our parks and open space system and
providing diverse recreation experiences.
Provide opportunities to enjoy nature and the
outdoors.
Build environmental stewardship through
volunteer, environmental education, and
outdoor recreation opportunities.
Distribute parks, open space and recreation
services equitably throughout the community.
Build and maintain sustainable parks,
recreation, and open space infrastructure.
Build a sense of community by developing
strong community partnerships.
Health: Contribute positively to individual and
community health.
Equity: Provide programs and places that are
inclusive of all residents.
Community: Reflect community strengths and
values.
Service: Maintain high accountability to our
constituents.
Sustainability: Look into the future when
making day-to-day decisions.
Clean water, enhanced fish and wildlife habitat, and flood control are key values for Eugeneans. These values drive the multiple objectives of Eugene’s Comprehensive Stormwater Management Plan and the services delivered to the community through Eugene’s stormwater programs.
With an annual average of 46 inches of rainfall, Eugene relies on a system of man-made and natural drainage infrastructure designed to protect water quality, control surface runoff and prevent flooding. Almost a third of Eugene residents are unaware that stormwater is not treated at the regional wastewater plant. Stormwater runoff flows to local streams, rivers, ponds and wetlands.
The primary receiving waters in Eugene are the Willamette River and Amazon Creek, both of which have shown some signs of water quality improvement but are still designated by the State of Oregon as having greater than permitted levels of certain pollutants. Through activities in the stormwater program, pollutants are prevented from entering our waterways as much as practicable and measures are taken to further improve water quality from what it is today. For several decades, the municipal stormwater system and the series of upstream dams on the Willamette and McKenzie rivers have effectively prevented major flooding in Eugene.
Service Description
Performance Measures
Stormwater Management
APPROVED: For review by the Citizen Subcommittee of the Eugene Budget Committee, November 5, 2015
Eugene’s publicly owned and managed stormwater system includes approximately 39 miles of streams and other waterways, more than 38 miles of roadside ditches and culverts, approximately 600 miles of enclosed stormwater pipe, approximately 15,300 catch basins, 3,800 pipe inlet/outlet structures, 9,400 manholes, 25 vegetated water quality facilities, 60 public structural water quality facilities, and 3,000 acres of wetlands in west Eugene that are owned and managed in partnership with other agencies.
Operations and maintenance of the public stormwater system includes cleaning, inspection, repair, and replacement of pipes, catch basins, manholes, and mechanical water quality facilities. Work on the major open waterways involves planting native trees and shrubs, controlling non-native and invasive vegetation, stabilizing and repairing stream banks,
Strategies with Performance Targets
City of Eugene Service Profiles
Effectiveness • Satisfactory compliance with NPDES permit
requirements administered by the Oregon Department of Environmental Quality.
• Maintain the City’s National Flood Insurance Program (NFIP) community rating at a 7; Compared ratings with Albany, Corvallis, and Salem.
Efficiency • Operating and capital cost per system mile.
Service profiles are mini strategic plans for each of the City of Eugene’s services. Updated every four years, the profiles offer an overview of each service and its goals, and insight into some of the tools the service uses to track its performance.
Financial • Cost per capita.
Customer Satisfaction • Percent of citizens responding to a
biennial public opinion survey who report satisfaction with how their stormwater fees are being used.
Strategy 1 Implement adaptive management to optimize services and maintain regulatory compliance within financial constraints.
Target: Track the amount of pollutants that are captured and removed from the stormwater system as a result of systematic maintenance operation (cubic yards of debris removed).
Target: No regulatory violations or notices of non-compliance to City.
Strategy 2 Maintain and improve flood protection and drainage services.
Target: Track the number of reported flooding incidents and actively maintain reported flooding locations.
Target: Maintain satisfactory compliance with U.S. Army Corps of Engineers inspections of the Amazon Waterway.
Strategy 3 Implement financial management goals and policies for stormwater services.
Target: Maintain a two-month operating reserve.
removing debris and sediment, and restoring habitat. Street sweeping, leaf pick-up and recycling, and care of water quality facilities are also part of stormwater maintenance.
In addition to stormwater system operation and maintenance, services include: the protection, enhancement, and restoration of wetlands and waterways; public outreach and education; volunteer coordination; erosion prevention; spill response and compliance enforcement of illegal discharges to the stormwater system; water quality monitoring; implementation of stormwater development standards; master planning; construction of capital improvements; administration of water quality compliance for 124 structural and 276 vegetated private facilities; and the administration of the City’s and Industry’s compliance with stormwater regulations.
Community engagement is a best management practice in Eugene’s stormwater management program. Formal and informal means are used to involve local residents, inform stormwater ratepayers, and receive feedback to ensure that public education efforts are meeting targeted objectives.
Examples of outreach include community events such as home shows, a robust website (happyrivers.org), an annual newsletter (Clean Water Connections), a monthly e-newsletter (Raindrop to River), and targeted engagement programs such as Canines for Clean Water. Educational programs include SPLASH (a school curriculum) and a variety of volunteer activities. Notices of annual permit reviews and reports are posted on the City’s website. Citizen input is solicited on new program initiatives, for example, the presentations made
Increasing Complexity and Expectations of Regulatory Requirements Federal and state agencies responsible for stormwater regulation continue to refine and expand requirements and expectations that the City must satisfy. Additionally, some requirements are influenced or driven by third party legal actions. The third renewal of the City’s National Pollutant Discharge Elimination System (NPDES) permit is expected in 2016 and it is likely to further emphasize low impact development practices including reducing stormwater runoff volumes, and implementing measures to address the sources of specific pollutants identified in the Willamette Basin Total Maximum Daily Load (TMDL). Regulatory complexities require higher levels of attention and involvement of City staff, as well as higher levels of analysis of local conditions related to regulations.
Changing environmental regulations and increasing demands on staff resources have led government agencies to developed cooperative efforts in stormwater management; including partnerships with Springfield and Lane County to provide clean water and healthy fish and wildlife habitat. Eugene actively participates in statewide organizations including the Oregon Association of Clean Water Agencies and the National Association of Clean Water Agencies to share knowledge, pool resources, and cooperatively
address water quality and stormwater issues.
Stormwater Management Balances Multiple Objectives The City’s stormwater capital improvement program reflects the broader goals of the Comprehensive Stormwater Management Plan as well as specific goals for compliance with federal clean water regulations through its NPDES stormwater permit; Willamette Basin TMDL implementation plan; and federal and state groundwater protection regulations pertaining to drywells.
Priority capital improvement projects include restoration projects that re-establish and enhance natural waterways; stormwater rehabilitation and improvements that preserve investments in existing infrastructure; public drywell elimination; upgrading and retrofitting existing systems to increase drainage capacity and provide water quality treatment; and building new facilities.
Stormwater development standards that apply to newly developing or re-developing private and public properties were implemented in 2006. In 2014, the standards were updated to incorporate a hierarchy of best management practices emphasizing low impact development techniques such as vegetated filters and swales to manage stormwater runoff. These practices are instrumental to reducing stormwater pollution, however, as the number of private stormwater facilities continue to grow, resources needed for periodic inspections to ensure they are being properly maintained have increased.
Operating Environment
Community Involvement and Customer Input
Amazon Creek Inspection Report Amazon Creek is a key part of the City’s “green infrastructure” providing: water quality, flood protection, and fish and wildlife natural resource value. It is also considered a federally-constructed flood control facility and is subject to maintenance requirements of the U.S. Army Corps of Engineers (Corps).
The Corps has been updating its methods for constructing, maintaining, and inspecting federally-constructed flood control reduction facilities (e.g., levees) nationwide since Hurricane Katrina. While Eugene is responsible for most of the long-term operation and maintenance of Amazon Creek, the Corps inspects the structural integrity of the system annually. The Corps has been impressed with the City’s maintenance program and the condition of the Amazon Creek flood damage reduction facility.
In 2010, the Corps did a thorough inspection over the course of several weeks using its updated inspection methodology and reported in detail the condition of the channel and specific maintenance actions that they expect the City to address. Many of the actions the Corps identified are consistent with actions the City plans to take for compliance with stormwater regulations and have influenced the City to modify its stormwater maintenance.
Mission and Outcomes
to stakeholders in the course of refining stormwater development standards. Collaboration is also highly valued; examples range from the Pollution Prevention Coalition (P2C) to ongoing relationships with the Long Tom Watershed Council and the McKenzie Watershed Council.
Staff conducts a biennial survey of Eugene residents to obtain feedback specifically about stormwater services. In addition, surveys are sent each year to Eugene households that have been impacted by public construction projects. The surveys assess the effectiveness of communication with property owners and residents about capital infrastructure projects, including stormwater projects, and their satisfaction with project objectives.
Stormwater customers annually receive in their EWEB billing a brochure that explains
The mission of the Stormwater Management Service is to manage stormwater systems in a way that meets the needs of the community and promotes wise stewardship of the urban and natural environment. We accomplish this by improving water quality, flood protection, and enhancements of our community’s natural resources in a cost-effective manner that complies with regulatory requirements.
• Reduce stormwater pollution and improve water quality in our streams and rivers.
• Reduce flooding and associated property damage.
• Preserve and enhance wetlands and waterways for fish and wildlife.
stormwater services and how stormwater rates are calculated. A public hearing is held if stormwater rates are proposed to be changed.
The City continues to expand its knowledge about the environmental impacts of development, and how to alleviate degradation of our community’s natural areas. Efforts will continue to identify, implement, and encourage system retrofits, waterway restoration projects, and related volunteer activities. Additionally, in response to community support for green infrastructure alternatives to traditional development, the City will continue seeking opportunities to increase implementation of low impact development practices such as impervious surface reduction incentives, and “green street” alternatives for local street improvements.
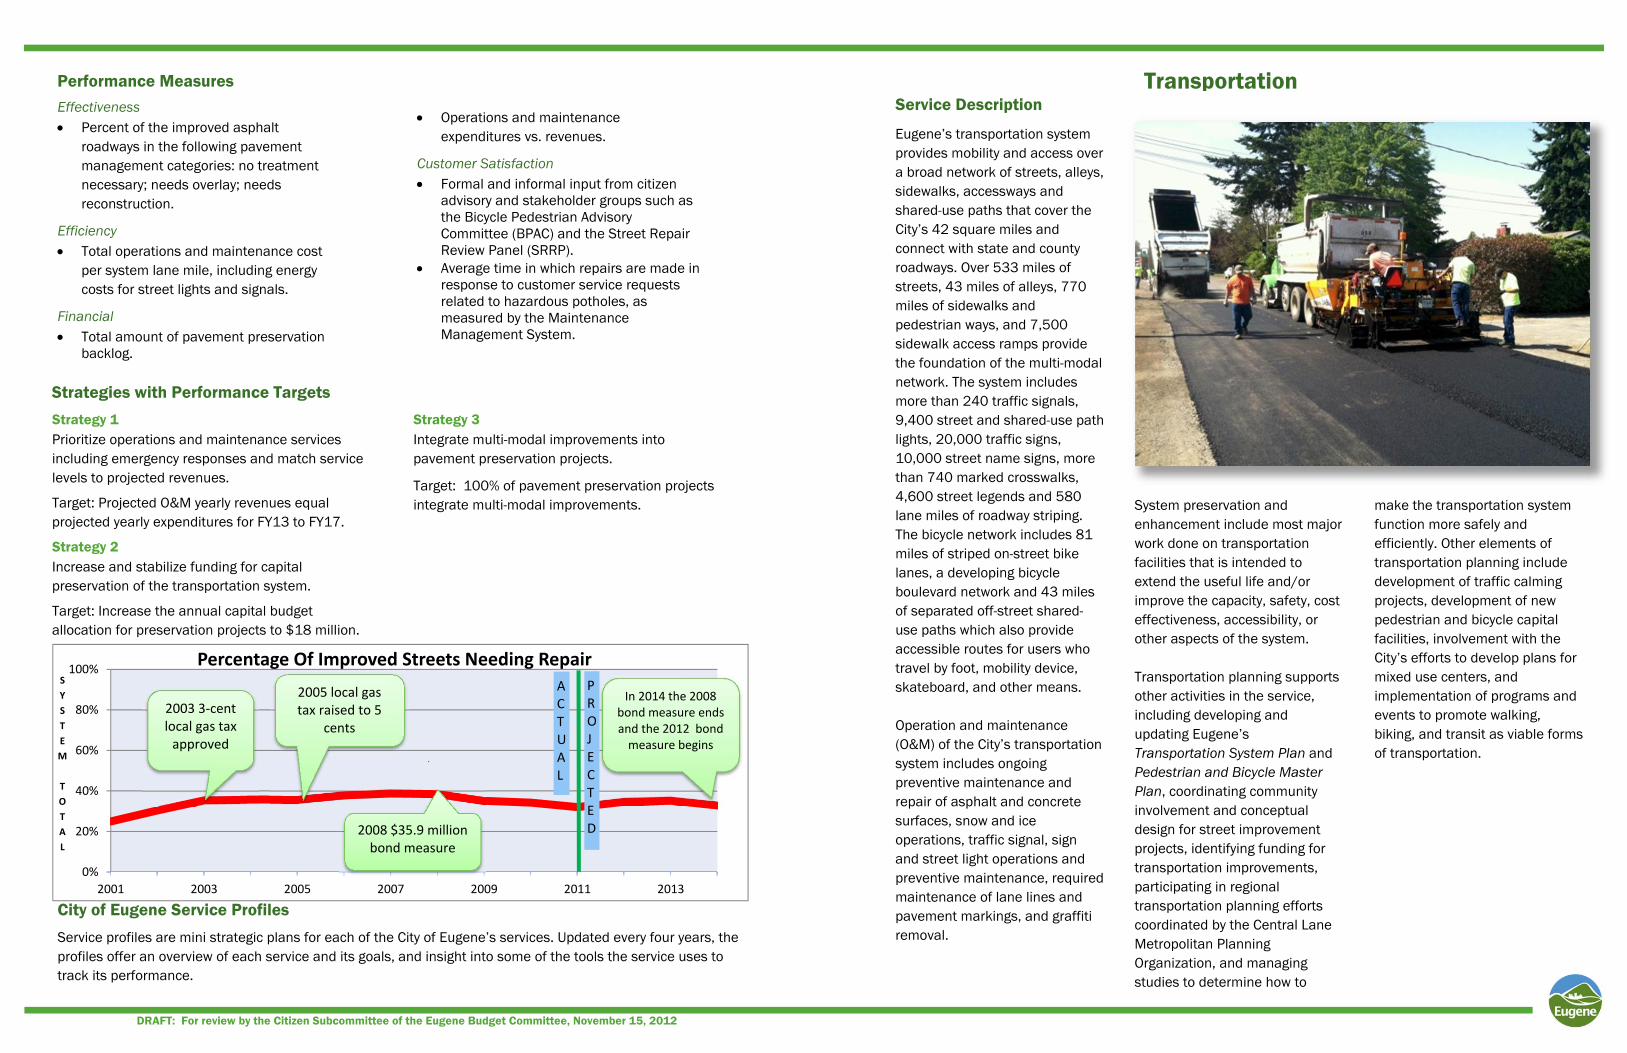
Eugene’s transportation system provides mobility and access over a broad network of streets, alleys, sidewalks, accessways and shared-use paths that cover the City’s 42 square miles and connect with state and county roadways. Over 533 miles of streets, 43 miles of alleys, 770 miles of sidewalks and pedestrian ways, and 7,500 sidewalk access ramps provide the foundation of the multi-modal network. The system includes more than 240 traffic signals, 9,400 street and shared-use path lights, 20,000 traffic signs, 10,000 street name signs, more than 740 marked crosswalks, 4,600 street legends and 580 lane miles of roadway striping. The bicycle network includes 81 miles of striped on-street bike lanes, a developing bicycle boulevard network and 43 miles of separated off-street shared-use paths which also provide accessible routes for users who travel by foot, mobility device, skateboard, and other means. Operation and maintenance (O&M) of the City’s transportation system includes ongoing preventive maintenance and repair of asphalt and concrete surfaces, snow and ice operations, traffic signal, sign and street light operations and preventive maintenance, required maintenance of lane lines and pavement markings, and graffiti removal.
Transportation
System preservation and enhancement include most major work done on transportation facilities that is intended to extend the useful life and/or improve the capacity, safety, cost effectiveness, accessibility, or other aspects of the system. Transportation planning supports other activities in the service, including developing and updating Eugene’s Transportation System Plan and Pedestrian and Bicycle Master Plan, coordinating community involvement and conceptual design for street improvement projects, identifying funding for transportation improvements, participating in regional transportation planning efforts coordinated by the Central Lane Metropolitan Planning Organization, and managing studies to determine how to
Effectiveness Percent of the improved asphalt
roadways in the following pavement management categories: no treatment necessary; needs overlay; needs reconstruction.
Efficiency Total operations and maintenance cost
per system lane mile, including energy costs for street lights and signals.
Financial Total amount of pavement preservation
backlog.
DRAFT: For review by the Citizen Subcommittee of the Eugene Budget Committee, November 15, 2012
Service Description
Strategies with Performance Targets
Performance Measures
City of Eugene Service Profiles
Service profiles are mini strategic plans for each of the City of Eugene’s services. Updated every four years, the profiles offer an overview of each service and its goals, and insight into some of the tools the service uses to track its performance.
Strategy 1 Prioritize operations and maintenance services including emergency responses and match service levels to projected revenues.
Target: Projected O&M yearly revenues equal projected yearly expenditures for FY13 to FY17.
Strategy 2 Increase and stabilize funding for capital preservation of the transportation system.
Target: Increase the annual capital budget allocation for preservation projects to $18 million.
Operations and maintenance expenditures vs. revenues.
Customer Satisfaction Formal and informal input from citizen
advisory and stakeholder groups such as the Bicycle Pedestrian Advisory Committee (BPAC) and the Street Repair Review Panel (SRRP).
Average time in which repairs are made in response to customer service requests related to hazardous potholes, as measured by the Maintenance Management System.
make the transportation system function more safely and efficiently. Other elements of transportation planning include development of traffic calming projects, development of new pedestrian and bicycle capital facilities, involvement with the City’s efforts to develop plans for mixed use centers, and implementation of programs and events to promote walking, biking, and transit as viable forms of transportation.
Strategy 3 Integrate multi-modal improvements into pavement preservation projects.
Target: 100% of pavement preservation projects integrate multi-modal improvements.
0%
20%
40%
60%
80%
100%
2001 2003 2005 2007 2009 2011 2013
SYSTEM
TOTAL
Percentage Of Improved Streets Needing Repair
2003 3‐cent local gas tax approved
2008 $35.9 million bond measure
In 2014 the 2008 bond measure ends and the 2012 bondmeasure begins
2005 local gas tax raised to 5
cents
PROJECTED
ACTUAL
A range of community involvement techniques are used to respond to needs of different constituencies and the varying scope of transportation projects. Most projects, whether citywide or location-specific, use more than one of the following community engagement tools: departmental advisory committees, stakeholder committees, community workshops, open houses, surveys, stakeholder interviews, meetings with neighborhood associations and other groups; and online interactive applications. Depending on the project, community involvement is also provided through the Planning Commission and City Council. The Council approves updates to policy documents that relate to transportation, including the Transportation System Plan
Infrastructure Capital Preservation The City has made progress toward funding transportation infrastructure preservation, but funding challenges remain. Between 2008 and 2012, construction prices have been volatile – increasing and decreasing sharply with demand and the global economic climate. Over the next four years construction costs are expected to increase overall while still remaining volatile. The combination of low construction costs from 2009 to 2011, cost-saving technological innovations such as in-place road recycling and the additional preservation funding provided by the voter-approved 2008 bond measure to fix streets have decreased the street maintenance backlog to approximately $118 million by 2012. In November 2012 a new 5-year, $43 million, bond measure to fix streets and fund bicycle and pedestrian projects was approved by the voters. While the 2012 bond measure provides significant funding in the short term, it does not address long term funding needs to stabilize or reduce the percentage of improved streets needing repair.
The 2008 bond will provide approximately $2.5 million in FY14 and the 2012 bond measure will provide $7.5 to $8.1 million of pavement preservation funding annually for FY15 to FY17. In addition, the current 5
cents-per-gallon local fuel tax provides approximately $3.1 million annually. Transportation SDC reimbursement fees are projected to contribute $200,000 to $300,000 annually through FY17. Totaling these preservation funding sources yields $5.9 million in FY14 and $10.9 million to $11.4 million annually for FY15 through FY17. It is estimated that increasing the funding level to $18 million annually would prevent any street from falling into the reconstruct category and eliminate the reconstruct backlog in 10 years.
Infrastructure Operations and Maintenance Increases in expenditures for transportation infrastructure O&M continue to exceed revenues over the fund forecast period. Increases in operating costs include power costs to keep street lights lit; employee costs; costs for materials and supplies; and fuel costs. Much of the system is aging at the same time the City’s infrastructure continues to expand (streets, signals, street lights, street signs, off-street shared-use paths, etc.).
Many downtown traffic signals are supported on painted steel strain poles that have exceeded their design life and have foundations which do not meet current design standards. The estimated cost to replace these aging traffic signal poles is approximately $2 million.
Since 2008, 23 lane miles of unimproved streets have been
Operating Environment
Community Involvement and Customer Input
treated through the Enhanced Street Repair Program. This program provides thin-lift asphalt overlays on streets that do not meet urban street standards to help extend street life and improve ride quality. Limited ongoing funding for this program is budgeted in the City’s Road Fund.
The Road Fund is used to operate and maintain Eugene’s streets. Most of Eugene’s Road Fund revenue comes from the City’s share of the State Highway Trust Fund. This revenue, which averages about $6 million a year, is allocated using a formula based in part on city population, and comes primarily from Oregon fuel taxes, truck weight-mile taxes, and state vehicle registration fees.
New Infrastructure Capital Projects New infrastructure capital projects are needed to meet the needs of Eugene’s growing population as well as to address gaps in existing infrastructure and implement adopted plans and policies. The combination of volatile construction costs and direction of available funds toward preservation and O&M leave fewer resources, with less buying power, to meet the needs identified in long-term transportation plans. In addition, an increased focus on integrating environmental stewardship and community involvement into projects generally has increased initial project costs.
update, the Pedestrian and Bicycle Master Plan and the Arterial and Collector Street Plan. The intergovernmental Metropolitan Policy Committee approves the Regional Transportation Plan (RTP) and Metropolitan Transportation Improvement Program (MTIP) and follows federal requirements for public involvement. The community engagement tools are designed to give stakeholders different opportunities to participate in projects depending on their interest and availability. For example, web surveys provide additional opportunities to provide input, particularly for those who are unable to attend traditional public meetings. In some cases residents want to have a strong role in the outcome of the projects, particularly in
Mission and Outcomes
Provide a safe and efficient multi-modal transportation system that is responsive to users and community goals.
Enhance neighborhood and community livability. Facilitate compact urban development. Provide a safe and efficient transportation system. Facilitate the movement of goods, services, and people. Provide access to public and private land. Provide opportunities for choosing alternatives to single
occupancy vehicle trips. Build and provide a full range of accessible transportation
options. Provide access to recreational opportunities. Educate the public about transportation issues to enable
better participation and decision-making. Provide a corridor for utilities.
terms of street design. In response to this desire, the City has used an approach called Context Sensitive Solutions (CSS), when appropriate, that allows for a greater amount of collaboration between staff and community stakeholders and more consideration of neighborhood context. Customer input is received in a variety of ways, including phone calls, e-mails and letters on particular topics and concerns, and from transportation-related questions including in the City’s community surveys. Additionally, open houses, neighborhood meetings and public hearings for plans, programs and specific projects provide significant
customer input.
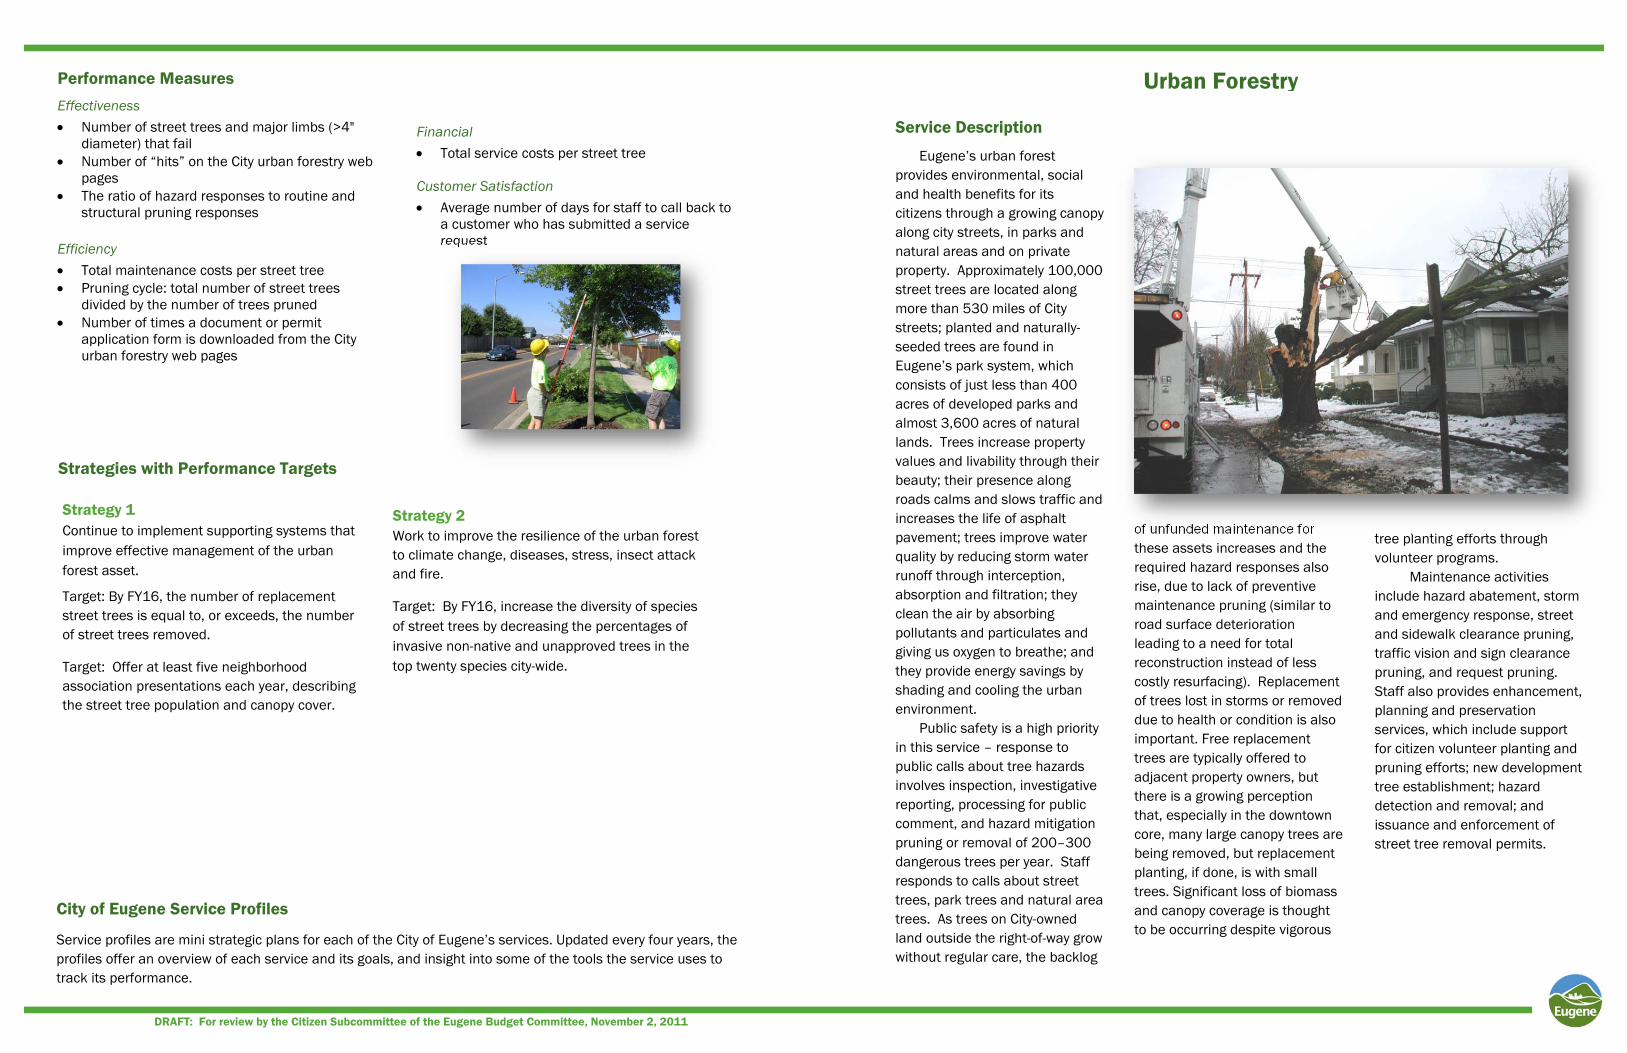
Eugene’s urban forest provides environmental, social and health benefits for its citizens through a growing canopy along city streets, in parks and natural areas and on private property. Approximately 100,000 street trees are located along more than 530 miles of City streets; planted and naturally-seeded trees are found in Eugene’s park system, which consists of just less than 400 acres of developed parks and almost 3,600 acres of natural lands. Trees increase property values and livability through their beauty; their presence along roads calms and slows traffic and increases the life of asphalt pavement; trees improve water quality by reducing storm water runoff through interception, absorption and filtration; they clean the air by absorbing pollutants and particulates and giving us oxygen to breathe; and they provide energy savings by shading and cooling the urban environment.
Public safety is a high priority in this service – response to public calls about tree hazards involves inspection, investigative reporting, processing for public comment, and hazard mitigation pruning or removal of 200–300 dangerous trees per year. Staff responds to calls about street trees, park trees and natural area trees. As trees on City-owned land outside the right-of-way grow without regular care, the backlog
Urban Forestry
of unfunded maintenance for these assets increases and the required hazard responses also rise, due to lack of preventive maintenance pruning (similar to road surface deterioration leading to a need for total reconstruction instead of less costly resurfacing). Replacement of trees lost in storms or removed due to health or condition is also important. Free replacement trees are typically offered to adjacent property owners, but there is a growing perception that, especially in the downtown core, many large canopy trees are being removed, but replacement planting, if done, is with small trees. Significant loss of biomass and canopy coverage is thought to be occurring despite vigorous
Effectiveness
Number of street trees and major limbs (>4" diameter) that fail
Number of “hits” on the City urban forestry web pages
The ratio of hazard responses to routine and structural pruning responses
Efficiency
Total maintenance costs per street tree Pruning cycle: total number of street trees
divided by the number of trees pruned Number of times a document or permit
application form is downloaded from the City urban forestry web pages
Financial Total service costs per street tree
Customer Satisfaction
Average number of days for staff to call back to a customer who has submitted a service request
Strategy 1 Continue to implement supporting systems that improve effective management of the urban forest asset.
Target: By FY16, the number of replacement street trees is equal to, or exceeds, the number of street trees removed.
Target: Offer at least five neighborhood association presentations each year, describing the street tree population and canopy cover.
Strategy 2 Work to improve the resilience of the urban forest to climate change, diseases, stress, insect attack and fire.
Target: By FY16, increase the diversity of species of street trees by decreasing the percentages of invasive non-native and unapproved trees in the top twenty species city-wide.
DRAFT: For review by the Citizen Subcommittee of the Eugene Budget Committee, November 2, 2011
tree planting efforts through volunteer programs.
Maintenance activities include hazard abatement, storm and emergency response, street and sidewalk clearance pruning, traffic vision and sign clearance pruning, and request pruning. Staff also provides enhancement, planning and preservation services, which include support for citizen volunteer planting and pruning efforts; new development tree establishment; hazard detection and removal; and issuance and enforcement of street tree removal permits.
Service Description
Strategies with Performance Targets
Performance Measures
City of Eugene Service Profiles
Service profiles are mini strategic plans for each of the City of Eugene’s services. Updated every four years, the profiles offer an overview of each service and its goals, and insight into some of the tools the service uses to track its performance.
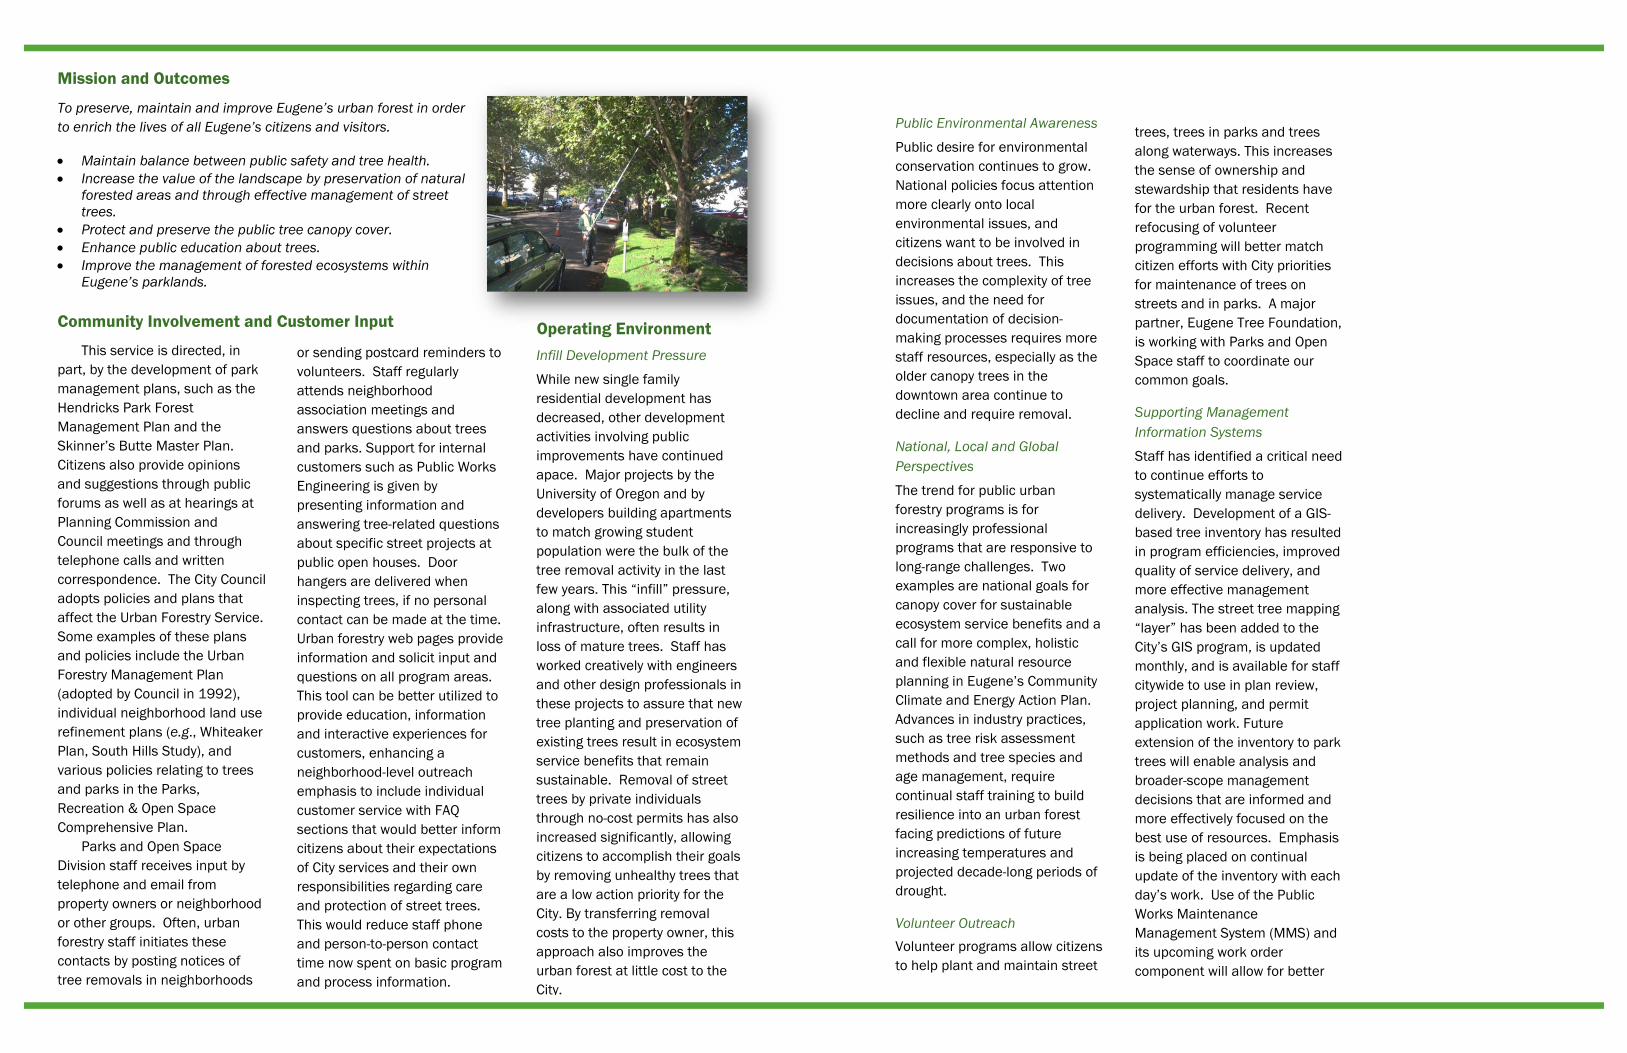
To preserve, maintain and improve Eugene’s urban forest in order to enrich the lives of all Eugene’s citizens and visitors.
Maintain balance between public safety and tree health. Increase the value of the landscape by preservation of natural
forested areas and through effective management of street trees.
Protect and preserve the public tree canopy cover. Enhance public education about trees. Improve the management of forested ecosystems within
Eugene’s parklands.
This service is directed, in part, by the development of park management plans, such as the Hendricks Park Forest Management Plan and the Skinner’s Butte Master Plan. Citizens also provide opinions and suggestions through public forums as well as at hearings at Planning Commission and Council meetings and through telephone calls and written correspondence. The City Council adopts policies and plans that affect the Urban Forestry Service. Some examples of these plans and policies include the Urban Forestry Management Plan (adopted by Council in 1992), individual neighborhood land use refinement plans (e.g., Whiteaker Plan, South Hills Study), and various policies relating to trees and parks in the Parks, Recreation & Open Space Comprehensive Plan.
Parks and Open Space Division staff receives input by telephone and email from property owners or neighborhood or other groups. Often, urban forestry staff initiates these contacts by posting notices of tree removals in neighborhoods
or sending postcard reminders to volunteers. Staff regularly attends neighborhood association meetings and answers questions about trees and parks. Support for internal customers such as Public Works Engineering is given by presenting information and answering tree-related questions about specific street projects at public open houses. Door hangers are delivered when inspecting trees, if no personal contact can be made at the time. Urban forestry web pages provide information and solicit input and questions on all program areas. This tool can be better utilized to provide education, information and interactive experiences for customers, enhancing a neighborhood-level outreach emphasis to include individual customer service with FAQ sections that would better inform citizens about their expectations of City services and their own responsibilities regarding care and protection of street trees. This would reduce staff phone and person-to-person contact time now spent on basic program and process information.
Public Environmental Awareness
Public desire for environmental conservation continues to grow. National policies focus attention more clearly onto local environmental issues, and citizens want to be involved in decisions about trees. This increases the complexity of tree issues, and the need for documentation of decision-making processes requires more staff resources, especially as the older canopy trees in the downtown area continue to decline and require removal.
National, Local and Global Perspectives
The trend for public urban forestry programs is for increasingly professional programs that are responsive to long-range challenges. Two examples are national goals for canopy cover for sustainable ecosystem service benefits and a call for more complex, holistic and flexible natural resource planning in Eugene’s Community Climate and Energy Action Plan. Advances in industry practices, such as tree risk assessment methods and tree species and age management, require continual staff training to build resilience into an urban forest facing predictions of future increasing temperatures and projected decade-long periods of drought.
Volunteer Outreach Volunteer programs allow citizens to help plant and maintain street
trees, trees in parks and trees along waterways. This increases the sense of ownership and stewardship that residents have for the urban forest. Recent refocusing of volunteer programming will better match citizen efforts with City priorities for maintenance of trees on streets and in parks. A major partner, Eugene Tree Foundation, is working with Parks and Open Space staff to coordinate our common goals.
Supporting Management Information Systems
Staff has identified a critical need to continue efforts to systematically manage service delivery. Development of a GIS-based tree inventory has resulted in program efficiencies, improved quality of service delivery, and more effective management analysis. The street tree mapping “layer” has been added to the City’s GIS program, is updated monthly, and is available for staff citywide to use in plan review, project planning, and permit application work. Future extension of the inventory to park trees will enable analysis and broader-scope management decisions that are informed and more effectively focused on the best use of resources. Emphasis is being placed on continual update of the inventory with each day’s work. Use of the Public Works Maintenance Management System (MMS) and its upcoming work order component will allow for better
Operating Environment
Mission and Outcomes
Community Involvement and Customer Input
Infill Development Pressure
While new single family residential development has decreased, other development activities involving public improvements have continued apace. Major projects by the University of Oregon and by developers building apartments to match growing student population were the bulk of the tree removal activity in the last few years. This “infill” pressure, along with associated utility infrastructure, often results in loss of mature trees. Staff has worked creatively with engineers and other design professionals in these projects to assure that new tree planting and preservation of existing trees result in ecosystem service benefits that remain sustainable. Removal of street trees by private individuals through no-cost permits has also increased significantly, allowing citizens to accomplish their goals by removing unhealthy trees that are a low action priority for the City. By transferring removal costs to the property owner, this approach also improves the urban forest at little cost to the City.
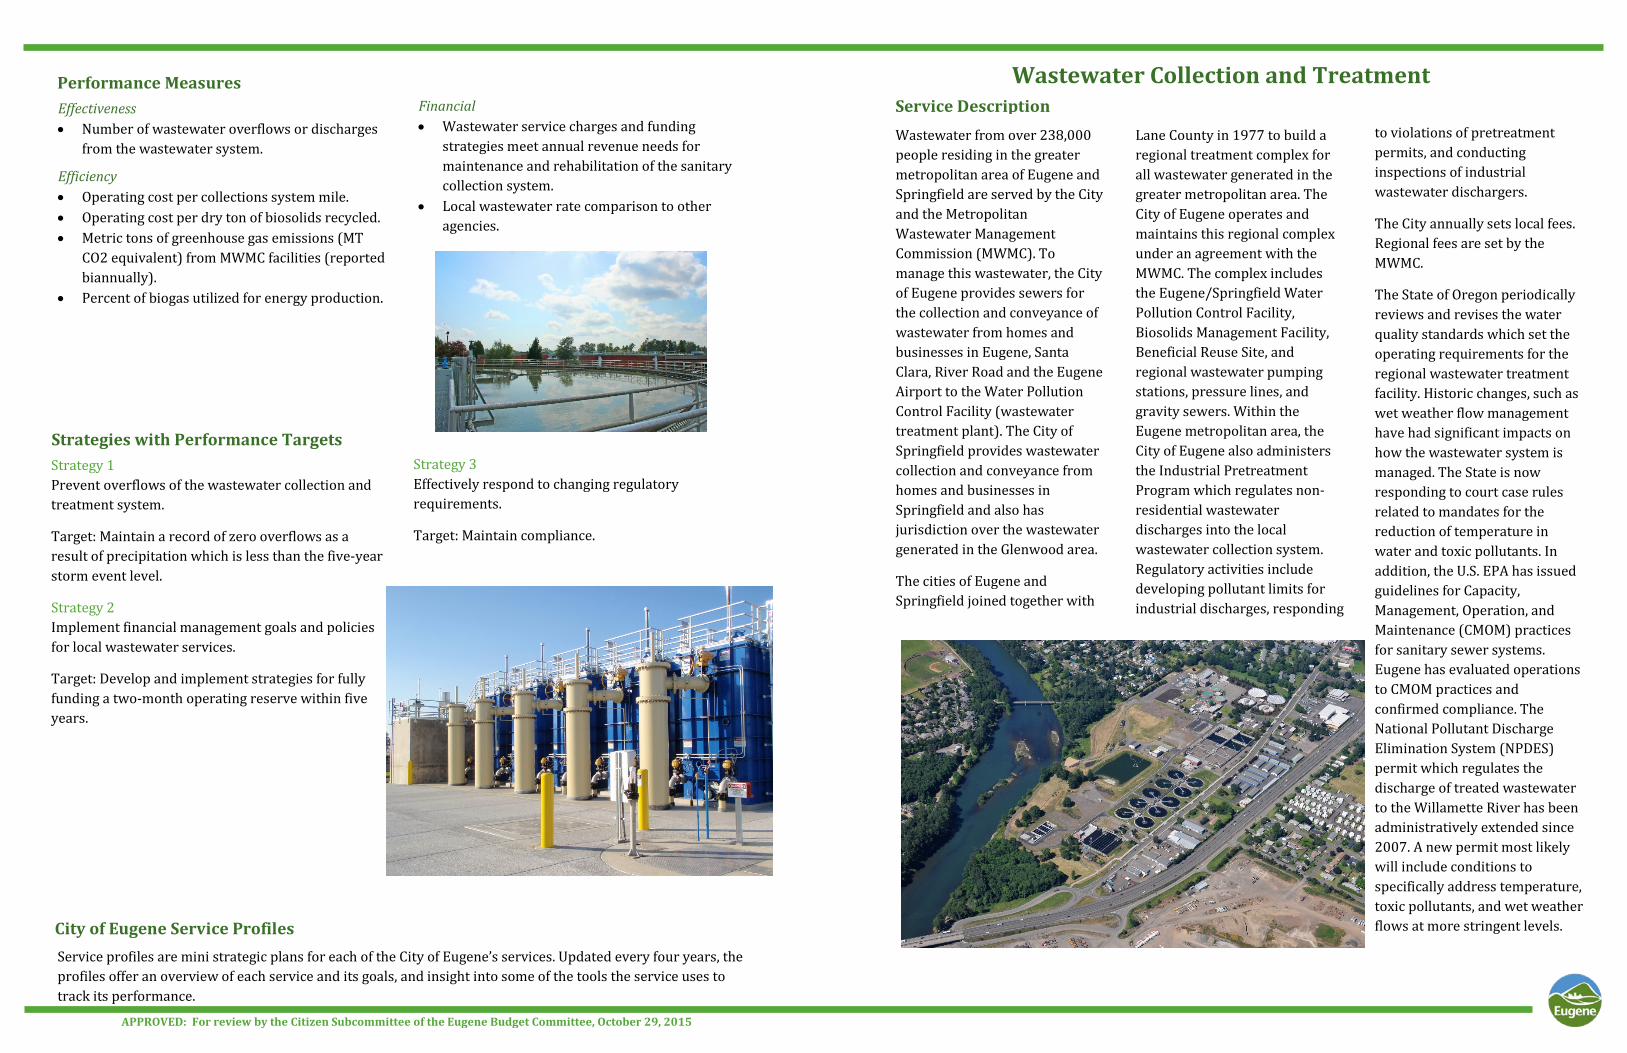
Wastewater from over 238,000 people residing in the greater metropolitan area of Eugene and Springfield are served by the City and the Metropolitan Wastewater Management Commission (MWMC). To manage this wastewater, the City of Eugene provides sewers for the collection and conveyance of wastewater from homes and businesses in Eugene, Santa Clara, River Road and the Eugene Airport to the Water Pollution Control Facility (wastewater treatment plant). The City of Springfield provides wastewater collection and conveyance from homes and businesses in Springfield and also has jurisdiction over the wastewater generated in the Glenwood area.
The cities of Eugene and Springfield joined together with
Wastewater Collection and Treatment Effectiveness
• Number of wastewater overflows or discharges from the wastewater system.
Efficiency • Operating cost per collections system mile. • Operating cost per dry ton of biosolids recycled. • Metric tons of greenhouse gas emissions (MT
CO2 equivalent) from MWMC facilities (reported biannually).
• Percent of biogas utilized for energy production.
City of Eugene Service Profiles
Service Description
APPROVED: For review by the Citizen Subcommittee of the Eugene Budget Committee, October 29, 2015
Strategies with Performance Targets
Lane County in 1977 to build a regional treatment complex for all wastewater generated in the greater metropolitan area. The City of Eugene operates and maintains this regional complex under an agreement with the MWMC. The complex includes the Eugene/Springfield Water Pollution Control Facility, Biosolids Management Facility, Beneficial Reuse Site, and regional wastewater pumping stations, pressure lines, and gravity sewers. Within the Eugene metropolitan area, the City of Eugene also administers the Industrial Pretreatment Program which regulates non-residential wastewater discharges into the local wastewater collection system. Regulatory activities include developing pollutant limits for industrial discharges, responding
Performance Measures
Service profiles are mini strategic plans for each of the City of Eugene’s services. Updated every four years, the profiles offer an overview of each service and its goals, and insight into some of the tools the service uses to track its performance.
to violations of pretreatment permits, and conducting inspections of industrial wastewater dischargers.
The City annually sets local fees. Regional fees are set by the MWMC.
The State of Oregon periodically reviews and revises the water quality standards which set the operating requirements for the regional wastewater treatment facility. Historic changes, such as wet weather flow management have had significant impacts on how the wastewater system is managed. The State is now responding to court case rules related to mandates for the reduction of temperature in water and toxic pollutants. In addition, the U.S. EPA has issued guidelines for Capacity, Management, Operation, and Maintenance (CMOM) practices for sanitary sewer systems. Eugene has evaluated operations to CMOM practices and confirmed compliance. The National Pollutant Discharge Elimination System (NPDES) permit which regulates the discharge of treated wastewater to the Willamette River has been administratively extended since 2007. A new permit most likely will include conditions to specifically address temperature, toxic pollutants, and wet weather flows at more stringent levels.
Strategy 1 Prevent overflows of the wastewater collection and treatment system.
Target: Maintain a record of zero overflows as a result of precipitation which is less than the five-year storm event level.
Strategy 2 Implement financial management goals and policies for local wastewater services.
Target: Develop and implement strategies for fully funding a two-month operating reserve within five years.
Strategy 3 Effectively respond to changing regulatory requirements.
Target: Maintain compliance.
Financial • Wastewater service charges and funding
strategies meet annual revenue needs for maintenance and rehabilitation of the sanitary collection system.
• Local wastewater rate comparison to other agencies.
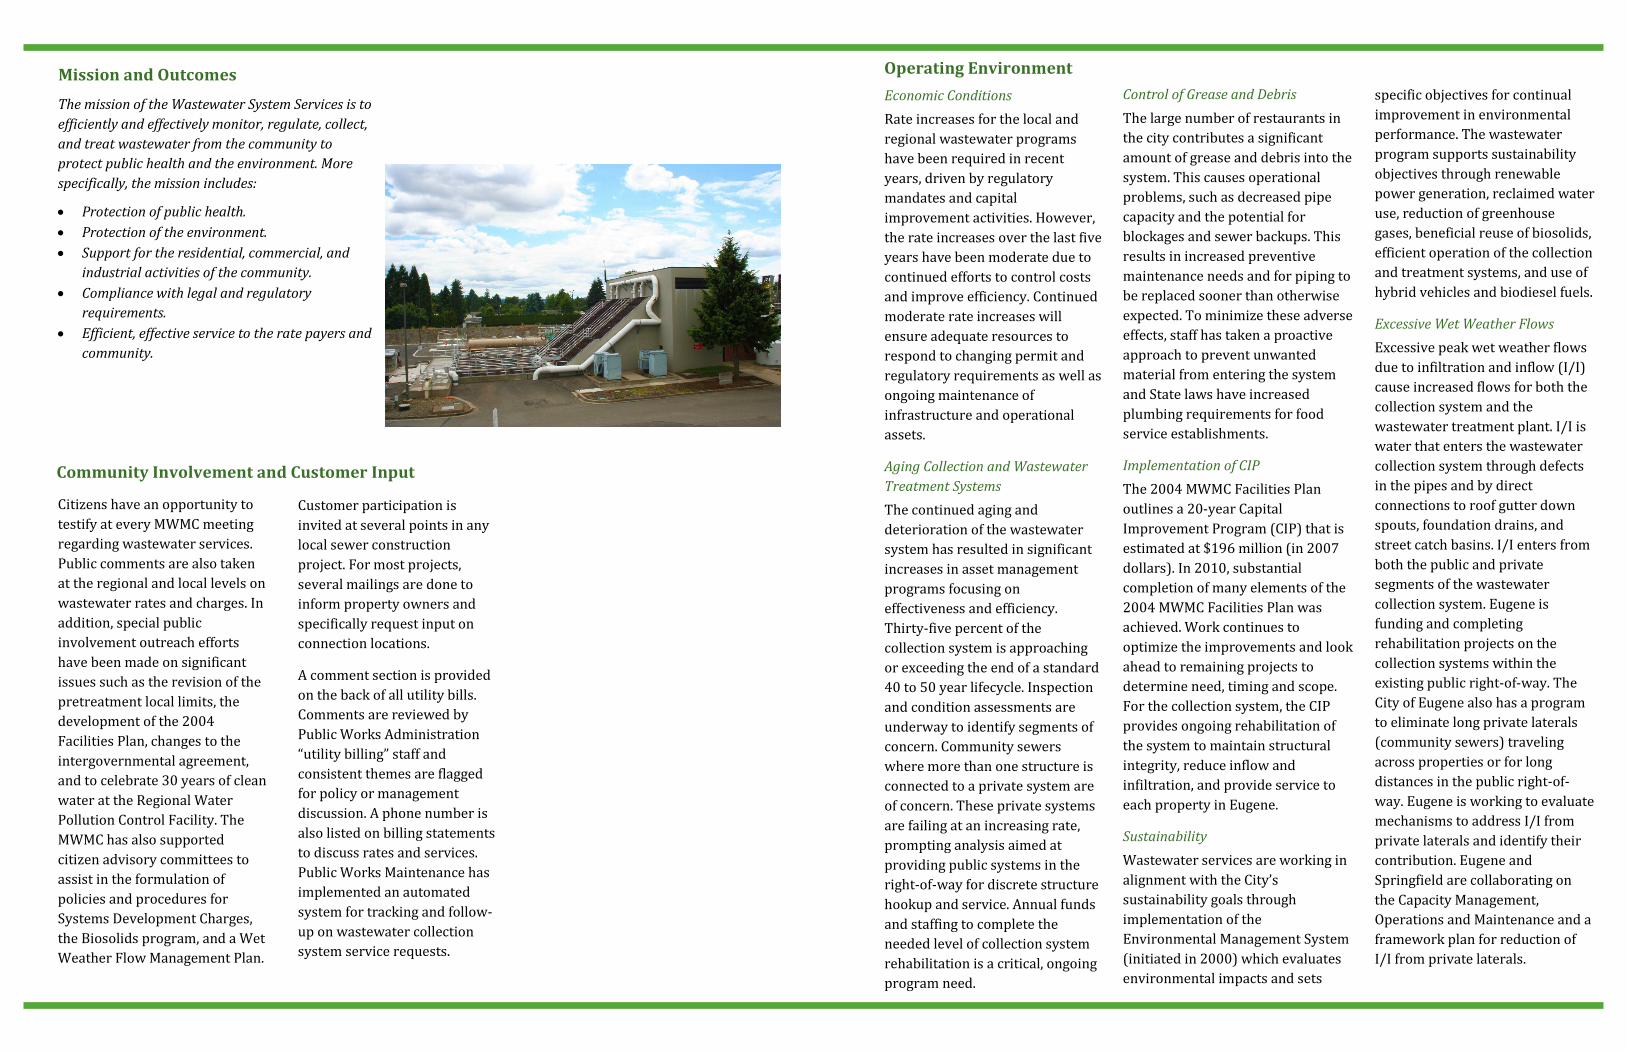
specific objectives for continual improvement in environmental performance. The wastewater program supports sustainability objectives through renewable power generation, reclaimed water use, reduction of greenhouse gases, beneficial reuse of biosolids, efficient operation of the collection and treatment systems, and use of hybrid vehicles and biodiesel fuels.
Excessive Wet Weather Flows Excessive peak wet weather flows due to infiltration and inflow (I/I) cause increased flows for both the collection system and the wastewater treatment plant. I/I is water that enters the wastewater collection system through defects in the pipes and by direct connections to roof gutter down spouts, foundation drains, and street catch basins. I/I enters from both the public and private segments of the wastewater collection system. Eugene is funding and completing rehabilitation projects on the collection systems within the existing public right-of-way. The City of Eugene also has a program to eliminate long private laterals (community sewers) traveling across properties or for long distances in the public right-of-way. Eugene is working to evaluate mechanisms to address I/I from private laterals and identify their contribution. Eugene and Springfield are collaborating on the Capacity Management, Operations and Maintenance and a framework plan for reduction of I/I from private laterals.
Citizens have an opportunity to testify at every MWMC meeting regarding wastewater services. Public comments are also taken at the regional and local levels on wastewater rates and charges. In addition, special public involvement outreach efforts have been made on significant issues such as the revision of the pretreatment local limits, the development of the 2004 Facilities Plan, changes to the intergovernmental agreement, and to celebrate 30 years of clean water at the Regional Water Pollution Control Facility. The MWMC has also supported citizen advisory committees to assist in the formulation of policies and procedures for Systems Development Charges, the Biosolids program, and a Wet Weather Flow Management Plan.
Economic Conditions Rate increases for the local and regional wastewater programs have been required in recent years, driven by regulatory mandates and capital improvement activities. However, the rate increases over the last five years have been moderate due to continued efforts to control costs and improve efficiency. Continued moderate rate increases will ensure adequate resources to respond to changing permit and regulatory requirements as well as ongoing maintenance of infrastructure and operational assets.
Aging Collection and Wastewater Treatment Systems The continued aging and deterioration of the wastewater system has resulted in significant increases in asset management programs focusing on effectiveness and efficiency. Thirty-five percent of the collection system is approaching or exceeding the end of a standard 40 to 50 year lifecycle. Inspection and condition assessments are underway to identify segments of concern. Community sewers where more than one structure is connected to a private system are of concern. These private systems are failing at an increasing rate, prompting analysis aimed at providing public systems in the right-of-way for discrete structure hookup and service. Annual funds and staffing to complete the needed level of collection system rehabilitation is a critical, ongoing program need.
Control of Grease and Debris The large number of restaurants in the city contributes a significant amount of grease and debris into the system. This causes operational problems, such as decreased pipe capacity and the potential for blockages and sewer backups. This results in increased preventive maintenance needs and for piping to be replaced sooner than otherwise expected. To minimize these adverse effects, staff has taken a proactive approach to prevent unwanted material from entering the system and State laws have increased plumbing requirements for food service establishments.
Implementation of CIP The 2004 MWMC Facilities Plan outlines a 20-year Capital Improvement Program (CIP) that is estimated at $196 million (in 2007 dollars). In 2010, substantial completion of many elements of the 2004 MWMC Facilities Plan was achieved. Work continues to optimize the improvements and look ahead to remaining projects to determine need, timing and scope. For the collection system, the CIP provides ongoing rehabilitation of the system to maintain structural integrity, reduce inflow and infiltration, and provide service to each property in Eugene.
Sustainability Wastewater services are working in alignment with the City’s sustainability goals through implementation of the Environmental Management System (initiated in 2000) which evaluates environmental impacts and sets
Operating Environment
Customer participation is invited at several points in any local sewer construction project. For most projects, several mailings are done to inform property owners and specifically request input on connection locations.
A comment section is provided on the back of all utility bills. Comments are reviewed by Public Works Administration “utility billing” staff and consistent themes are flagged for policy or management discussion. A phone number is also listed on billing statements to discuss rates and services. Public Works Maintenance has implemented an automated system for tracking and follow-up on wastewater collection system service requests.
Community Involvement and Customer Input
The mission of the Wastewater System Services is to efficiently and effectively monitor, regulate, collect, and treat wastewater from the community to protect public health and the environment. More specifically, the mission includes:
• Protection of public health. • Protection of the environment. • Support for the residential, commercial, and
industrial activities of the community. • Compliance with legal and regulatory
requirements. • Efficient, effective service to the rate payers and
community.
Mission and Outcomes

Public Works
101 E. Broadway, Suite 400Eugene, OR 97401eugene-or.gov/pw