Embed Size (px)
Citation preview
1
ECONOMIC IMPACTS OF
PROPOSED GAMING
FACILITIES
SOUTH EAST GAMING ZONE
June 10, 2015
Kansas Lottery Gaming Facility
Review Board
2
AGENDA IN BRIEF
1. About Civic
Economics
2. Our task in Kansas
3. Economic Impact
101
4. Economic impact
related to
construction
4. Economic impact
related to operations
5. Competitive impacts
on existing business
6. Discussion
3
ABOUT CIVIC ECONOMICS
• Established in 2002
• Matt Cunningham in
Chicago; Dan
Houston in Austin
• “Economic analysis
and strategic planning
for sustainable
prosperity.”
4
OUR TASK IN KANSAS
• Essentially the same
scope of work that we
conducted in 2008,
2009, and 2010
• Evaluate the
prospective economic
impacts of each
proposed casino
project
• Two distinct activities
studied:
– Construction
– Operations
• Our focus is on
facilitating
comparison of
competing proposals
5
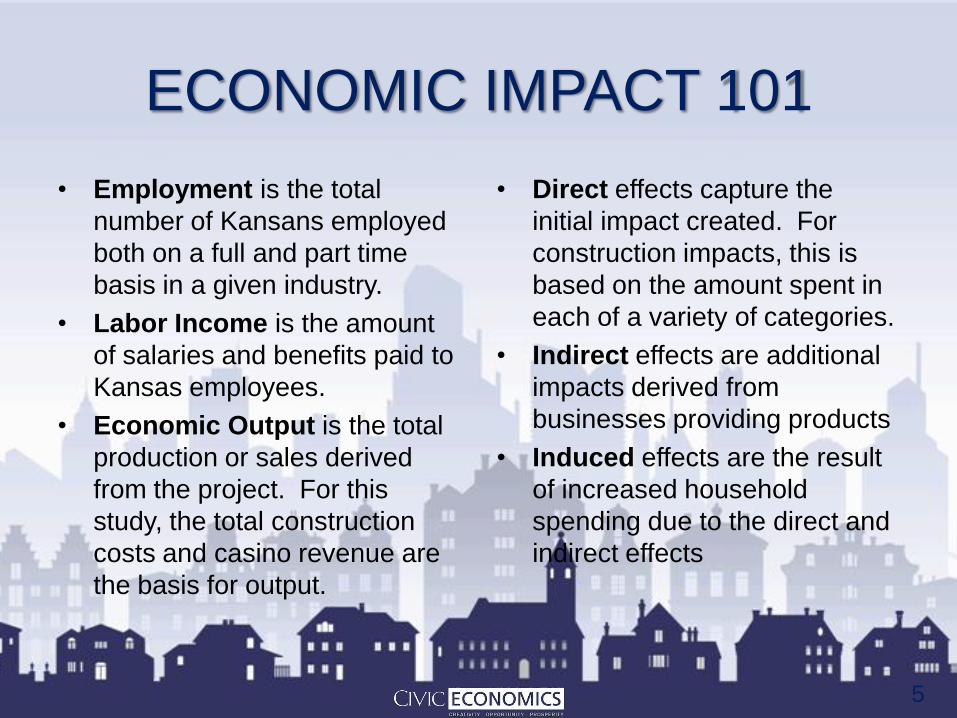
ECONOMIC IMPACT 101
• Employment is the total
number of Kansans employed
both on a full and part time
basis in a given industry.
• Labor Income is the amount
of salaries and benefits paid to
Kansas employees.
• Economic Output is the total
production or sales derived
from the project. For this
study, the total construction
costs and casino revenue are
the basis for output.
• Direct effects capture the
initial impact created. For
construction impacts, this is
based on the amount spent in
each of a variety of categories.
• Indirect effects are additional
impacts derived from
businesses providing products
• Induced effects are the result
of increased household
spending due to the direct and
indirect effects
6
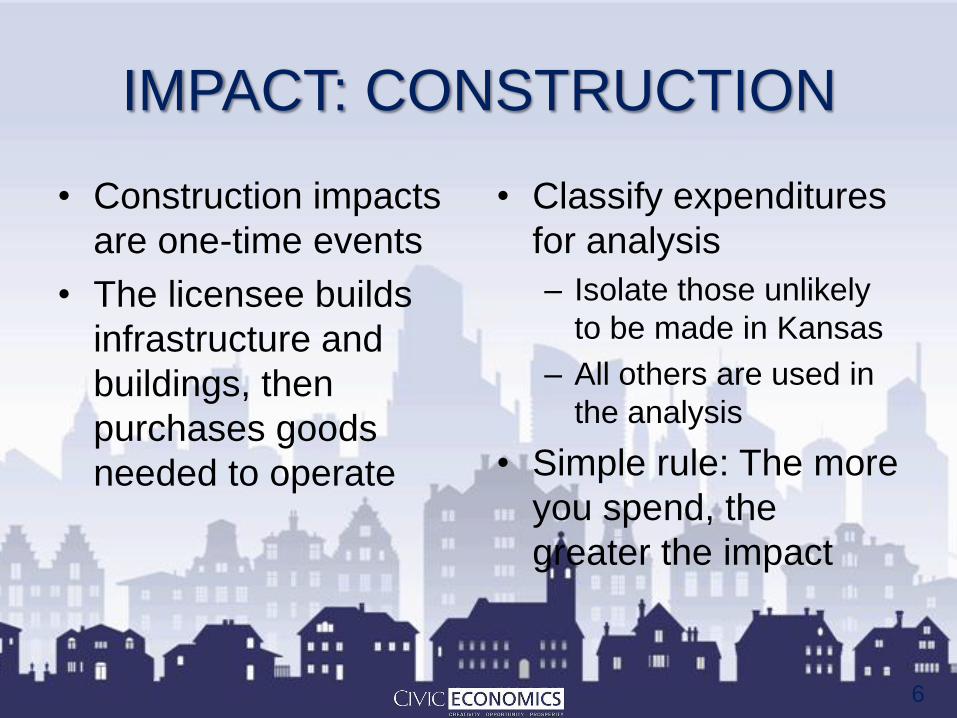
IMPACT: CONSTRUCTION
• Construction impacts
are one-time events
• The licensee builds
infrastructure and
buildings, then
purchases goods
needed to operate
• Classify expenditures
for analysis
– Isolate those unlikely
to be made in Kansas
– All others are used in
the analysis
• Simple rule: The more
you spend, the
greater the impact
7
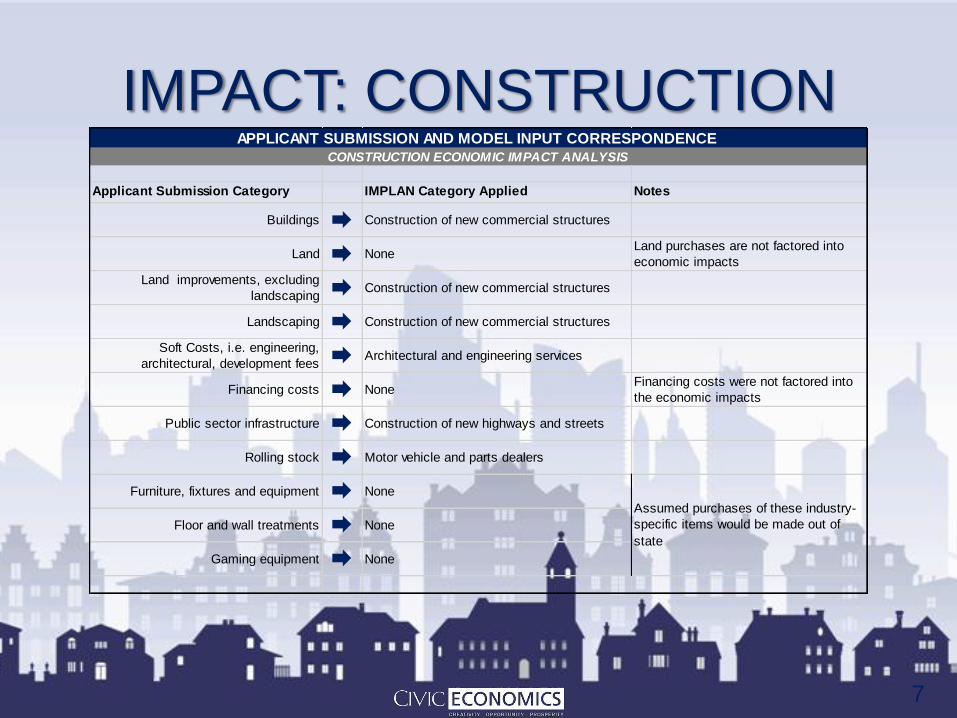
IMPACT: CONSTRUCTION
Applicant Submission Category IMPLAN Category Applied Notes
Buildings Construction of new commercial structures
Land NoneLand purchases are not factored into
economic impacts
Land improvements, excluding
landscapingConstruction of new commercial structures
Landscaping Construction of new commercial structures
Soft Costs, i.e. engineering,
architectural, development fees Architectural and engineering services
Financing costs NoneFinancing costs were not factored into
the economic impacts
Public sector infrastructure Construction of new highways and streets
Rolling stock Motor vehicle and parts dealers
Furniture, fixtures and equipment None
Floor and wall treatments None
Gaming equipment None
APPLICANT SUBMISSION AND MODEL INPUT CORRESPONDENCE
CONSTRUCTION ECONOMIC IMPACT ANALYSIS
Assumed purchases of these industry-
specific items would be made out of
state
8
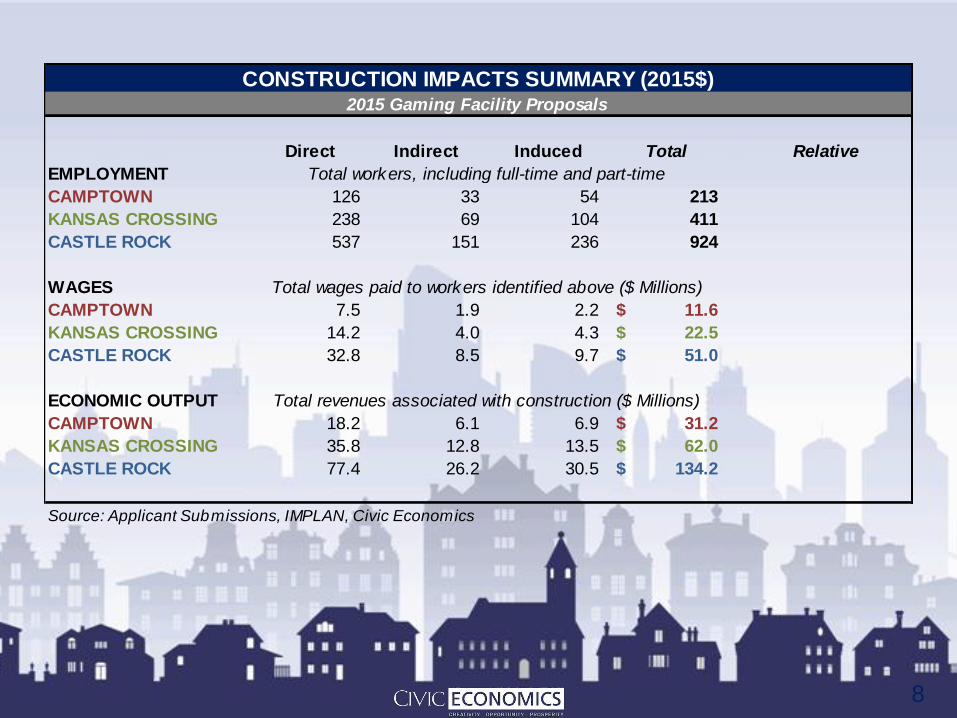
IMPACT: CONSTRUCTION Direct Indirect Induced Total Relative
EMPLOYMENT
CAMPTOWN 126 33 54 213
KANSAS CROSSING 238 69 104 411
CASTLE ROCK 537 151 236 924
WAGES
CAMPTOWN 7.5 1.9 2.2 11.6$
KANSAS CROSSING 14.2 4.0 4.3 22.5$
CASTLE ROCK 32.8 8.5 9.7 51.0$
ECONOMIC OUTPUT
CAMPTOWN 18.2 6.1 6.9 31.2$
KANSAS CROSSING 35.8 12.8 13.5 62.0$
CASTLE ROCK 77.4 26.2 30.5 134.2$
CONSTRUCTION IMPACTS SUMMARY (2015$)2015 Gaming Facility Proposals
Total workers, including full-time and part-time
Total wages paid to workers identified above ($ Millions)
Total revenues associated with construction ($ Millions)
Source: Applicant Submissions, IMPLAN, Civic Economics
9
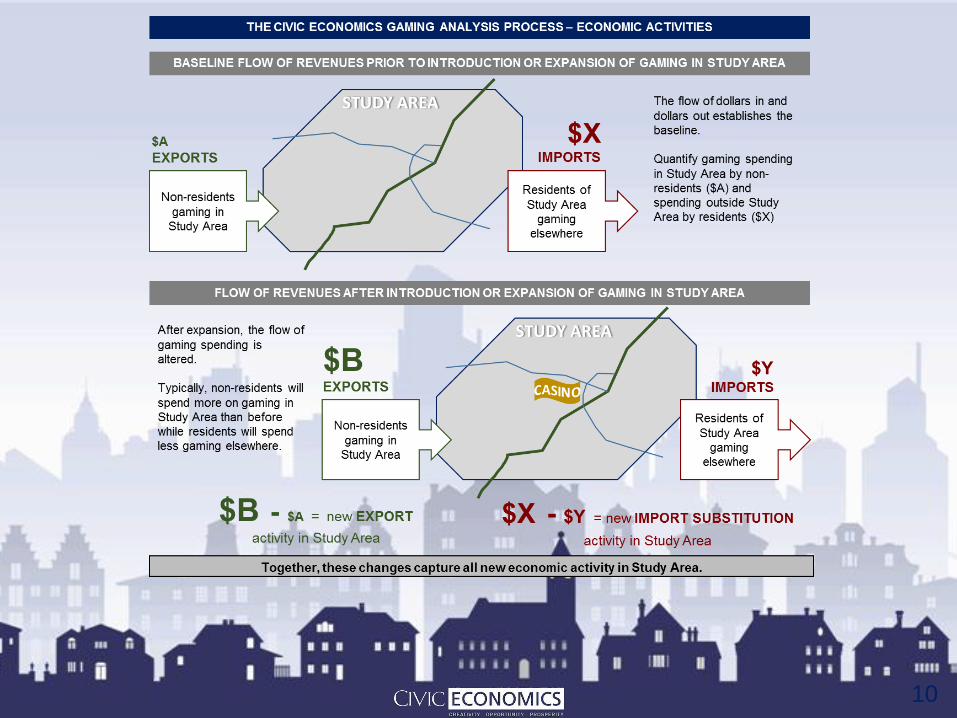
IMPACT: OPERATIONS
• A very different analysis, as you will see
• In many analyses, the applicant commits
to a phased development process,
requiring the analysis of multiple scenarios
• In this case, we have just one scenario:
– The third year of operations, roughly calendar
year 2019
10
11
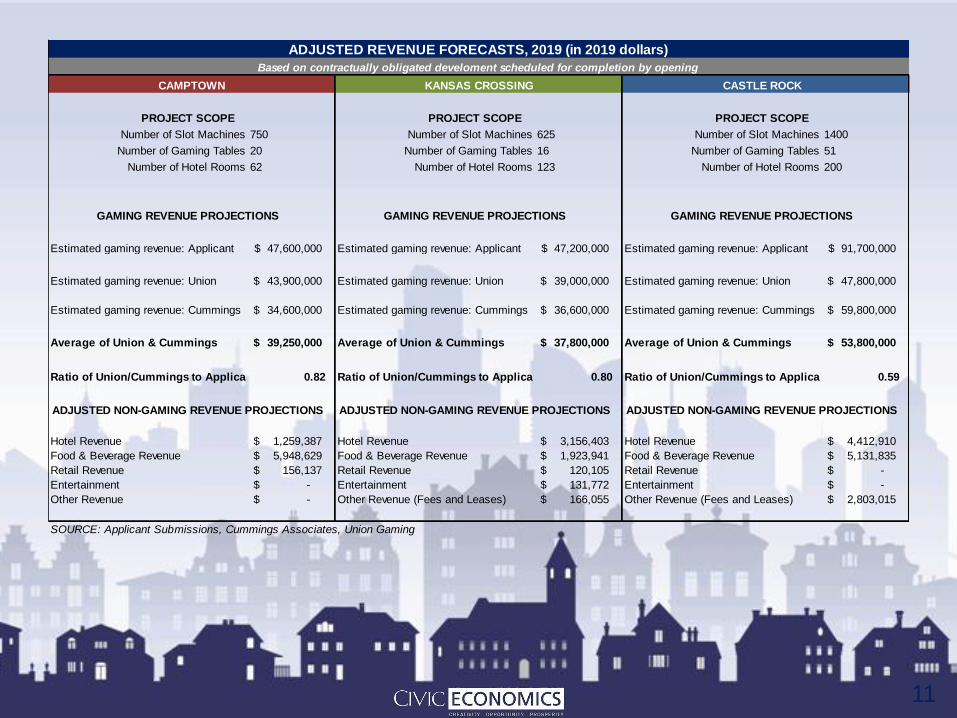
Number of Slot Machines 750 Number of Slot Machines 625 Number of Slot Machines 1400
Number of Gaming Tables 20 Number of Gaming Tables 16 Number of Gaming Tables 51
Number of Hotel Rooms 62 Number of Hotel Rooms 123 Number of Hotel Rooms 200
Estimated gaming revenue: Applicant 47,600,000$ Estimated gaming revenue: Applicant 47,200,000$ Estimated gaming revenue: Applicant 91,700,000$
Estimated gaming revenue: Union 43,900,000$ Estimated gaming revenue: Union 39,000,000$ Estimated gaming revenue: Union 47,800,000$
Estimated gaming revenue: Cummings 34,600,000$ Estimated gaming revenue: Cummings 36,600,000$ Estimated gaming revenue: Cummings 59,800,000$
Average of Union & Cummings 39,250,000$ Average of Union & Cummings 37,800,000$ Average of Union & Cummings 53,800,000$
Ratio of Union/Cummings to Applicant 0.82 Ratio of Union/Cummings to Applicant 0.80 Ratio of Union/Cummings to Applicant 0.59
Hotel Revenue 1,259,387$ Hotel Revenue 3,156,403$ Hotel Revenue 4,412,910$
Food & Beverage Revenue 5,948,629$ Food & Beverage Revenue 1,923,941$ Food & Beverage Revenue 5,131,835$
Retail Revenue 156,137$ Retail Revenue 120,105$ Retail Revenue -$
Entertainment -$ Entertainment 131,772$ Entertainment -$
Other Revenue -$ Other Revenue (Fees and Leases) 166,055$ Other Revenue (Fees and Leases) 2,803,015$
CASTLE ROCK
PROJECT SCOPE
GAMING REVENUE PROJECTIONS
ADJUSTED NON-GAMING REVENUE PROJECTIONS
CAMPTOWN KANSAS CROSSING
ADJUSTED REVENUE FORECASTS, 2019 (in 2019 dollars)
Based on contractually obligated develoment scheduled for completion by opening
GAMING REVENUE PROJECTIONS GAMING REVENUE PROJECTIONS
ADJUSTED NON-GAMING REVENUE PROJECTIONS ADJUSTED NON-GAMING REVENUE PROJECTIONS
SOURCE: Applicant Submissions, Cummings Associates, Union Gaming
PROJECT SCOPE PROJECT SCOPE
12
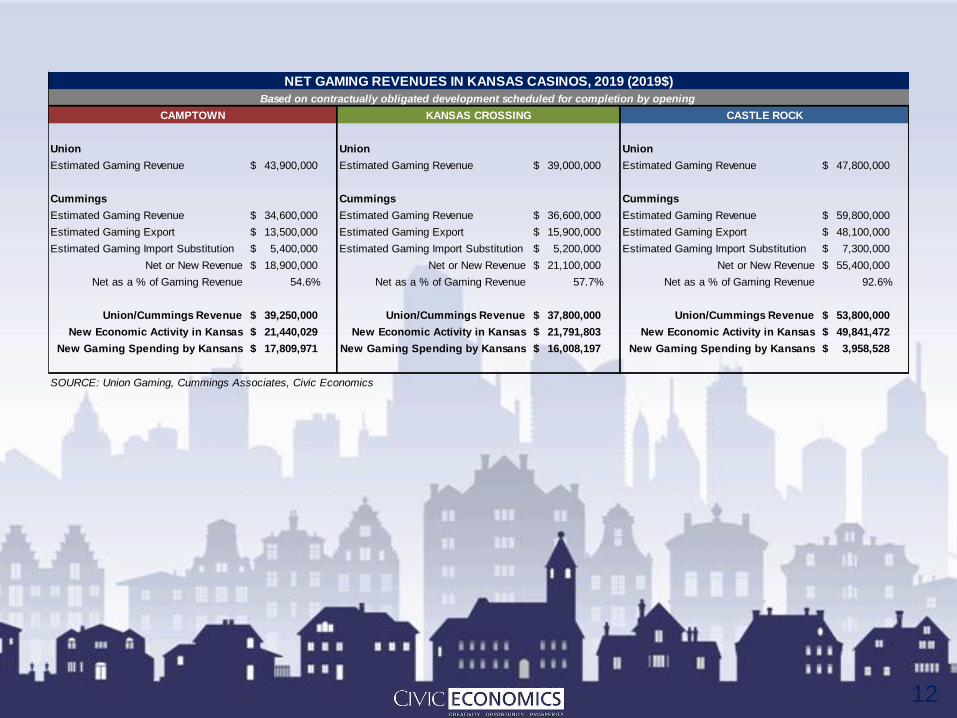
Union Union Union
Estimated Gaming Revenue 43,900,000$ Estimated Gaming Revenue 39,000,000$ Estimated Gaming Revenue 47,800,000$
Cummings Cummings Cummings
Estimated Gaming Revenue 34,600,000$ Estimated Gaming Revenue 36,600,000$ Estimated Gaming Revenue 59,800,000$
Estimated Gaming Export 13,500,000$ Estimated Gaming Export 15,900,000$ Estimated Gaming Export 48,100,000$
Estimated Gaming Import Substitution 5,400,000$ Estimated Gaming Import Substitution 5,200,000$ Estimated Gaming Import Substitution 7,300,000$
Net or New Revenue 18,900,000$ Net or New Revenue 21,100,000$ Net or New Revenue 55,400,000$
Net as a % of Gaming Revenue 54.6% Net as a % of Gaming Revenue 57.7% Net as a % of Gaming Revenue 92.6%
Union/Cummings Revenue 39,250,000$ Union/Cummings Revenue 37,800,000$ Union/Cummings Revenue 53,800,000$
New Economic Activity in Kansas 21,440,029$ New Economic Activity in Kansas 21,791,803$ New Economic Activity in Kansas 49,841,472$
New Gaming Spending by Kansans 17,809,971$ New Gaming Spending by Kansans 16,008,197$ New Gaming Spending by Kansans 3,958,528$
CASTLE ROCK
NET GAMING REVENUES IN KANSAS CASINOS, 2019 (2019$)
Based on contractually obligated development scheduled for completion by opening
KANSAS CROSSINGCAMPTOWN
SOURCE: Union Gaming, Cummings Associates, Civic Economics
13
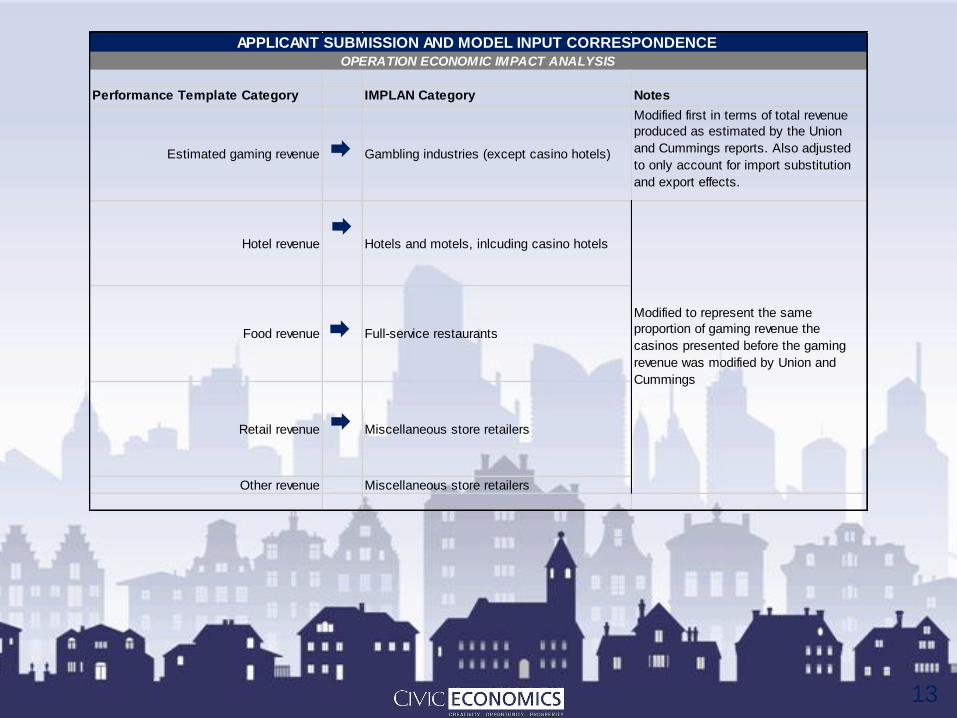
Performance Template Category IMPLAN Category Notes
Estimated gaming revenue Gambling industries (except casino hotels)
Modified first in terms of total revenue
produced as estimated by the Union
and Cummings reports. Also adjusted
to only account for import substitution
and export effects.
Hotel revenue Hotels and motels, inlcuding casino hotels
Food revenue Full-service restaurants
Retail revenue Miscellaneous store retailers
Other revenue Miscellaneous store retailers
APPLICANT SUBMISSION AND MODEL INPUT CORRESPONDENCE
OPERATION ECONOMIC IMPACT ANALYSIS
Modified to represent the same
proportion of gaming revenue the
casinos presented before the gaming
revenue was modified by Union and
Cummings
14
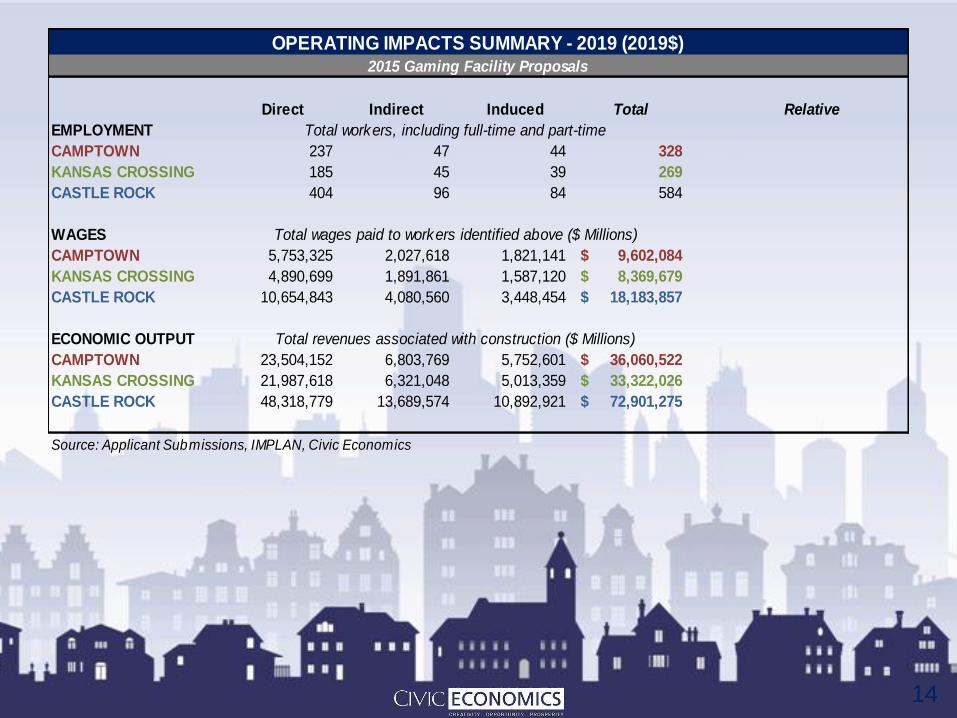
Direct Indirect Induced Total Relative
EMPLOYMENT
CAMPTOWN 237 47 44 328
KANSAS CROSSING 185 45 39 269
CASTLE ROCK 404 96 84 584
WAGES
CAMPTOWN 5,753,325 2,027,618 1,821,141 9,602,084$
KANSAS CROSSING 4,890,699 1,891,861 1,587,120 8,369,679$
CASTLE ROCK 10,654,843 4,080,560 3,448,454 18,183,857$
ECONOMIC OUTPUT
CAMPTOWN 23,504,152 6,803,769 5,752,601 36,060,522$
KANSAS CROSSING 21,987,618 6,321,048 5,013,359 33,322,026$
CASTLE ROCK 48,318,779 13,689,574 10,892,921 72,901,275$
Source: Applicant Submissions, IMPLAN, Civic Economics
OPERATING IMPACTS SUMMARY - 2019 (2019$)2015 Gaming Facility Proposals
Total workers, including full-time and part-time
Total wages paid to workers identified above ($ Millions)
Total revenues associated with construction ($ Millions)
15
LOCAL SPENDING PATTERNS
• What we excluded from NET Revenues is
simply:
– New gaming spending by Kansas residents as a
result of the new facility
• Where does that money come from?
– Nearly all of it from household discretionary budgets
– We cannot know how much would have been spent in
Kansas
16
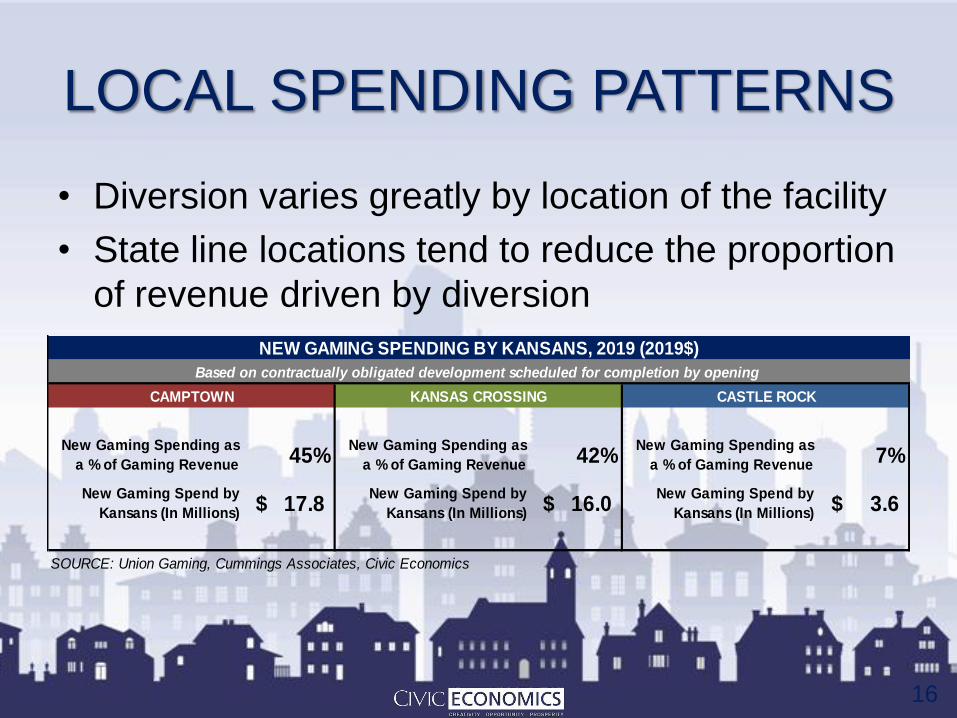
LOCAL SPENDING PATTERNS
• Diversion varies greatly by location of the facility
• State line locations tend to reduce the proportion
of revenue driven by diversion
New Gaming Spending as
a % of Gaming Revenue 45%New Gaming Spending as
a % of Gaming Revenue 42%New Gaming Spending as
a % of Gaming Revenue 7%
New Gaming Spend by
Kansans (In Millions) 17.8$ New Gaming Spend by
Kansans (In Millions) 16.0$ New Gaming Spend by
Kansans (In Millions) 3.6$
CASTLE ROCK
NEW GAMING SPENDING BY KANSANS, 2019 (2019$)
Based on contractually obligated development scheduled for completion by opening
CAMPTOWN KANSAS CROSSING
SOURCE: Union Gaming, Cummings Associates, Civic Economics
17
Thank You
• Learn more about
Civic Economics at
CivicEconomics.com
• For more information
about this project,
please contact:
Dan Houston
dhouston@
civiceconomics.com
512.587.7964
18
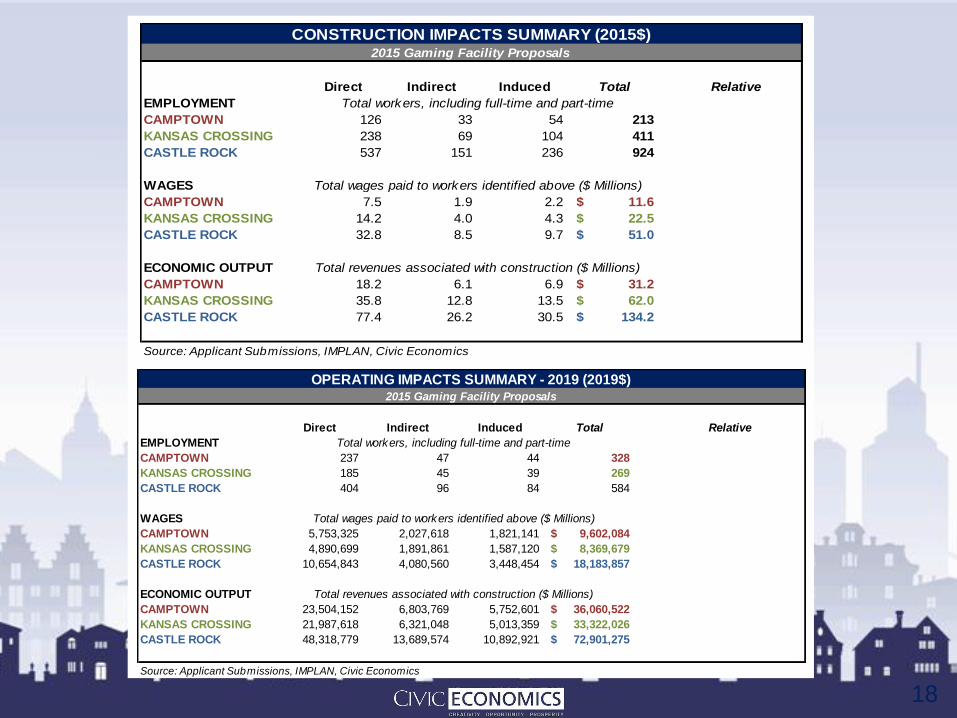
Direct Indirect Induced Total Relative
EMPLOYMENT
CAMPTOWN 126 33 54 213
KANSAS CROSSING 238 69 104 411
CASTLE ROCK 537 151 236 924
WAGES
CAMPTOWN 7.5 1.9 2.2 11.6$
KANSAS CROSSING 14.2 4.0 4.3 22.5$
CASTLE ROCK 32.8 8.5 9.7 51.0$
ECONOMIC OUTPUT
CAMPTOWN 18.2 6.1 6.9 31.2$
KANSAS CROSSING 35.8 12.8 13.5 62.0$
CASTLE ROCK 77.4 26.2 30.5 134.2$
CONSTRUCTION IMPACTS SUMMARY (2015$)2015 Gaming Facility Proposals
Total workers, including full-time and part-time
Total wages paid to workers identified above ($ Millions)
Total revenues associated with construction ($ Millions)
Source: Applicant Submissions, IMPLAN, Civic Economics
Direct Indirect Induced Total Relative
EMPLOYMENT
CAMPTOWN 237 47 44 328
KANSAS CROSSING 185 45 39 269
CASTLE ROCK 404 96 84 584
WAGES
CAMPTOWN 5,753,325 2,027,618 1,821,141 9,602,084$
KANSAS CROSSING 4,890,699 1,891,861 1,587,120 8,369,679$
CASTLE ROCK 10,654,843 4,080,560 3,448,454 18,183,857$
ECONOMIC OUTPUT
CAMPTOWN 23,504,152 6,803,769 5,752,601 36,060,522$
KANSAS CROSSING 21,987,618 6,321,048 5,013,359 33,322,026$
CASTLE ROCK 48,318,779 13,689,574 10,892,921 72,901,275$
Source: Applicant Submissions, IMPLAN, Civic Economics
OPERATING IMPACTS SUMMARY - 2019 (2019$)2015 Gaming Facility Proposals
Total workers, including full-time and part-time
Total wages paid to workers identified above ($ Millions)
Total revenues associated with construction ($ Millions)