Embed Size (px)
Citation preview
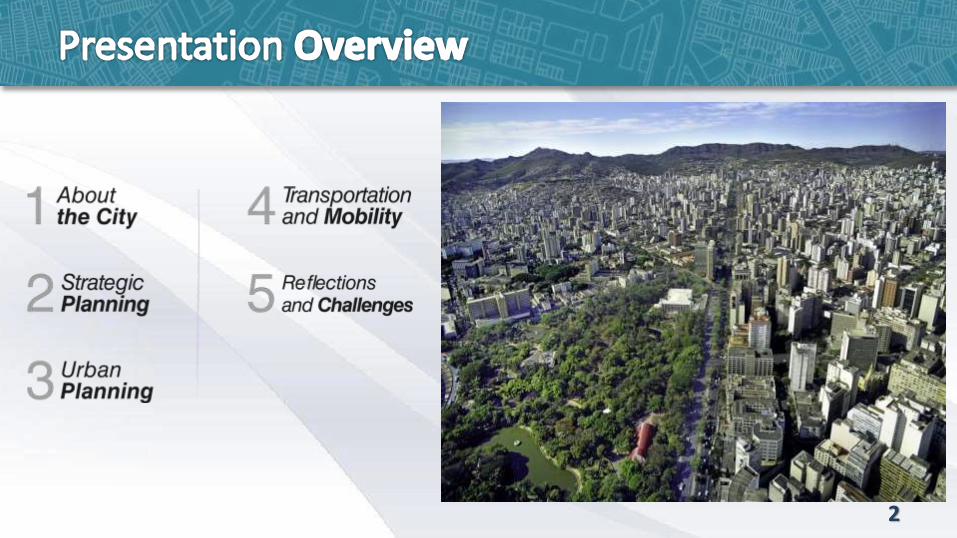
2
3
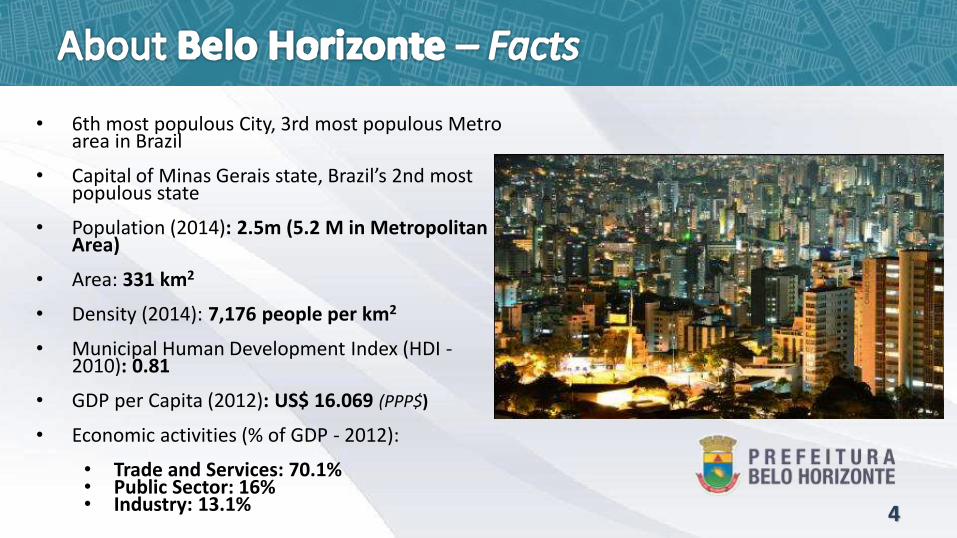
• 6th most populous City, 3rd most populous Metro area in Brazil
• Capital of Minas Gerais state, Brazil’s 2nd most populous state
• Population (2014): 2.5m (5.2 M in Metropolitan Area)
• Area: 331 km2
• Density (2014): 7,176 people per km2
• Municipal Human Development Index (HDI -2010): 0.81
• GDP per Capita (2012): US$ 16.069 (PPP$)
• Economic activities (% of GDP - 2012):
• Trade and Services: 70.1%• Public Sector: 16%• Industry: 13.1% 4
5
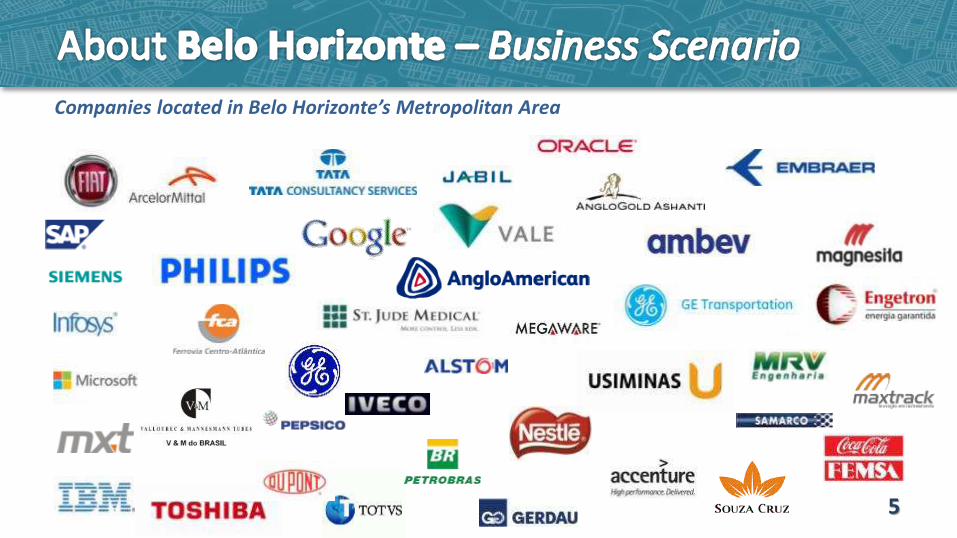
Companies located in Belo Horizonte’s Metropolitan Area
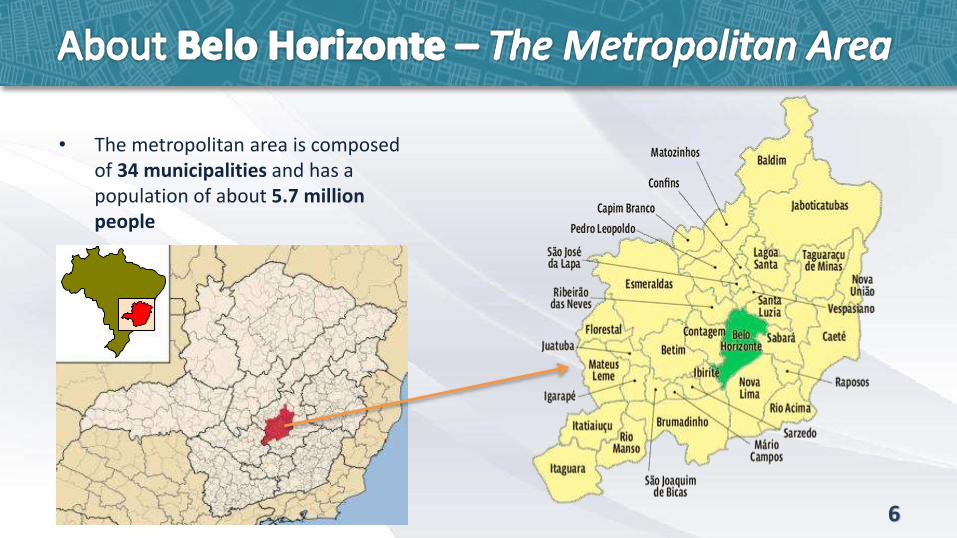
• The metropolitan area is composed of 34 municipalities and has a population of about 5.7 million people
6
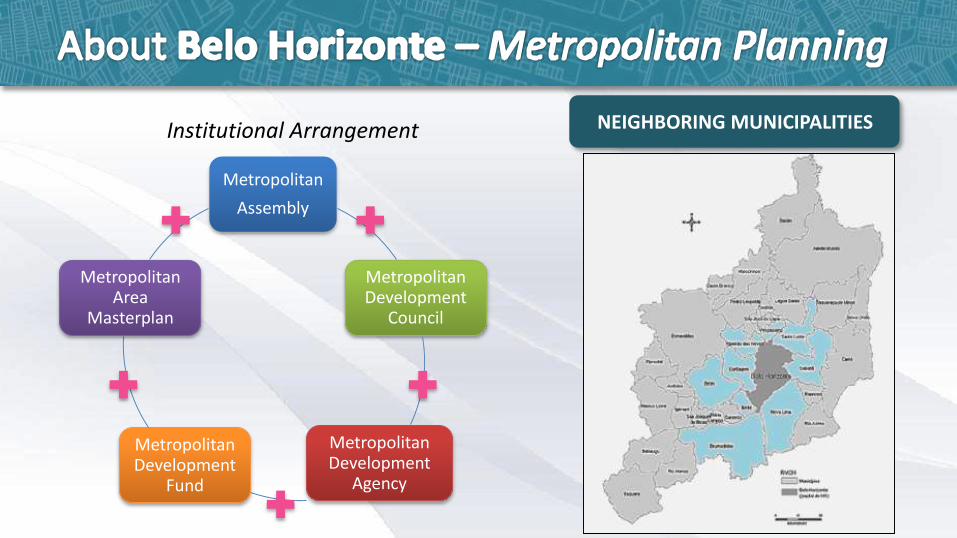
Institutional Arrangement
Metropolitan
Assembly
Metropolitan Development
Council
Metropolitan Development
Agency
Metropolitan Development
Fund
Metropolitan Area
Masterplan
NEIGHBORING MUNICIPALITIES
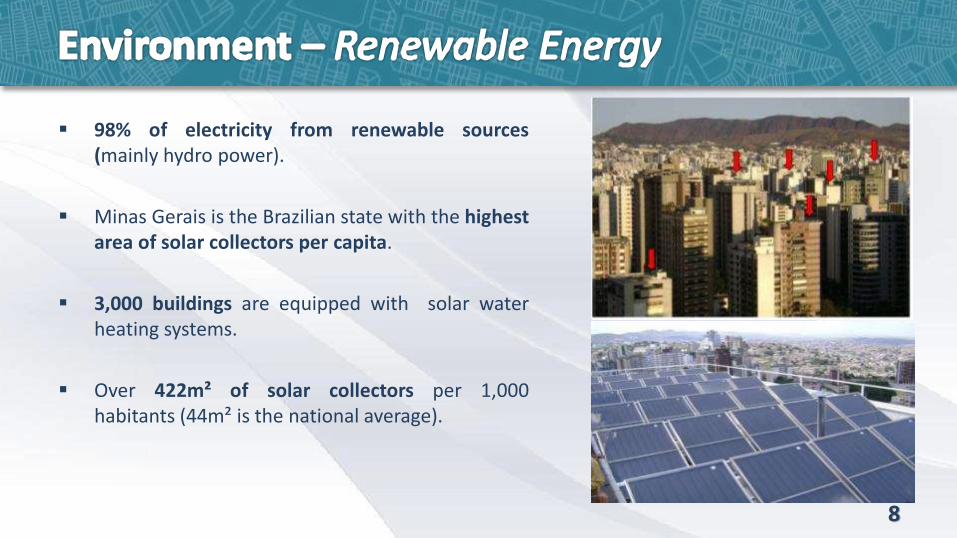
98% of electricity from renewable sources(mainly hydro power).
Minas Gerais is the Brazilian state with the highestarea of solar collectors per capita.
3,000 buildings are equipped with solar waterheating systems.
Over 422m² of solar collectors per 1,000habitants (44m² is the national average).
8
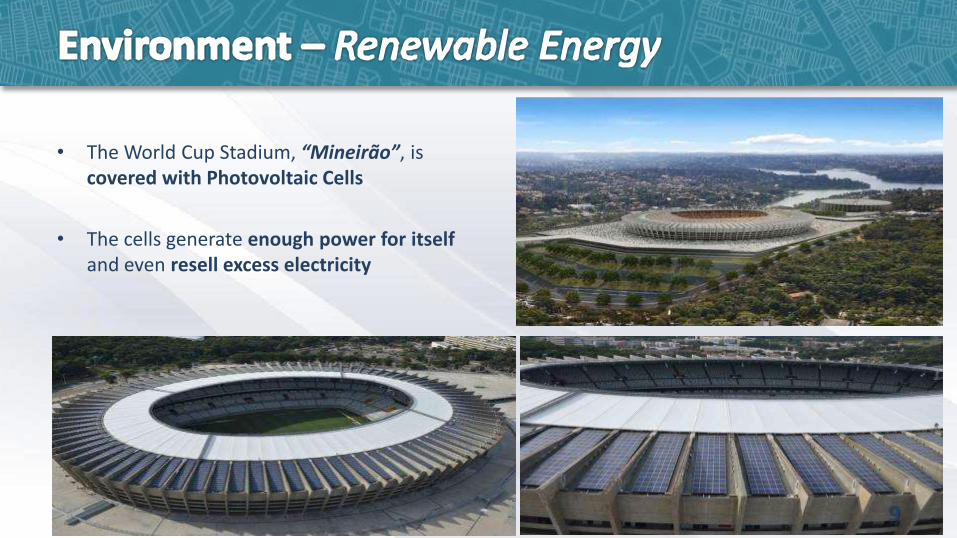
• The World Cup Stadium, “Mineirão”, is covered with Photovoltaic Cells
• The cells generate enough power for itself and even resell excess electricity
9
10
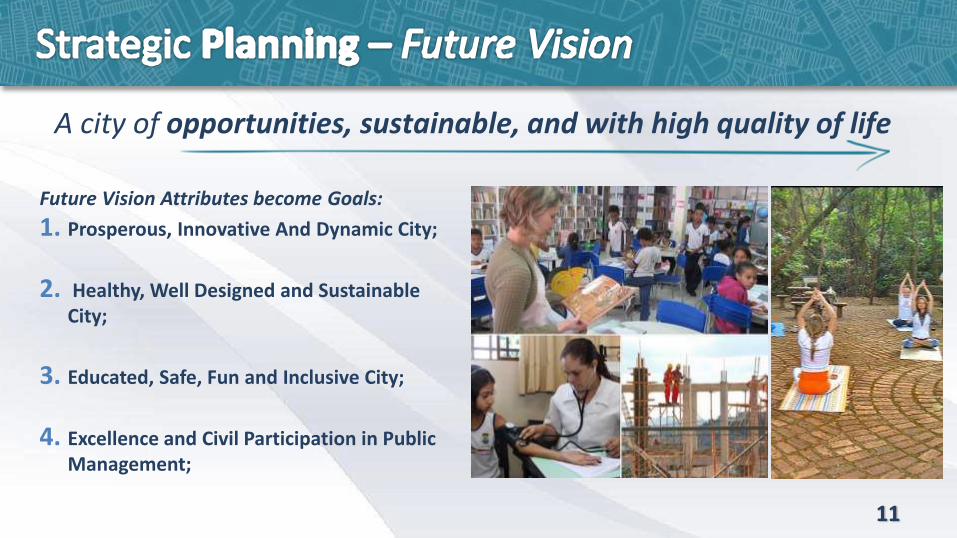
Future Vision Attributes become Goals:
1. Prosperous, Innovative And Dynamic City;
2. Healthy, Well Designed and Sustainable City;
3. Educated, Safe, Fun and Inclusive City;
4. Excellence and Civil Participation in Public Management;
11
A city of opportunities, sustainable, and with high quality of life
12
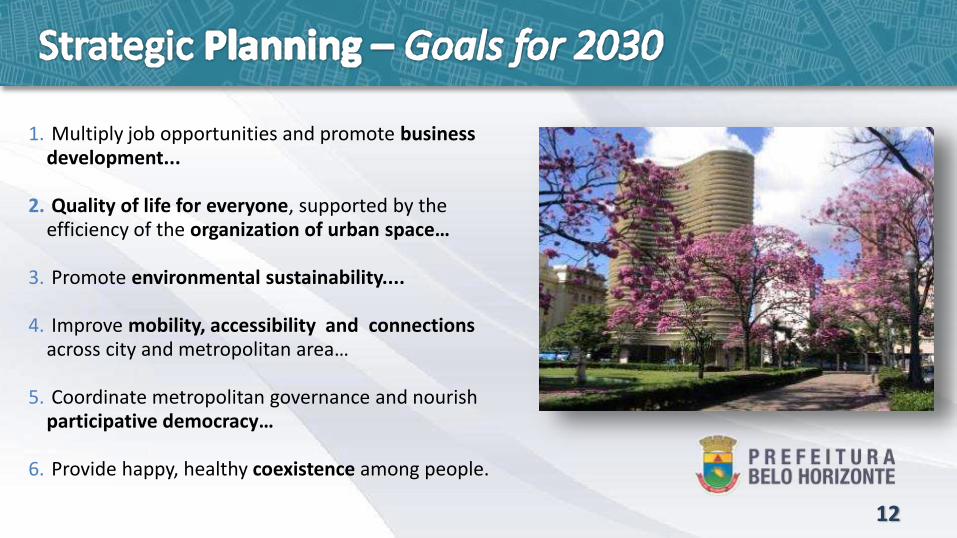
1. Multiply job opportunities and promote business development...
2. Quality of life for everyone, supported by the efficiency of the organization of urban space…
3. Promote environmental sustainability....
4. Improve mobility, accessibility and connections across city and metropolitan area…
5. Coordinate metropolitan governance and nourish participative democracy…
6. Provide happy, healthy coexistence among people.

13
• Long Term Plan: Strategic Plan for 20years, with defining goals and indicatorsfor the city that we aim to have in 2030.
• Short and Medium Term Plans: Goals andtargets for the 2009-2012 and 2013-2016periods.
15
2.0
4.0
6.0
8.0
10.0
12.0
14.0
16.0
18.0
2000 2005 2010 2015 2020 2025 2030 2035 2040
Valores Observados
Tendência (base 2000-2008)
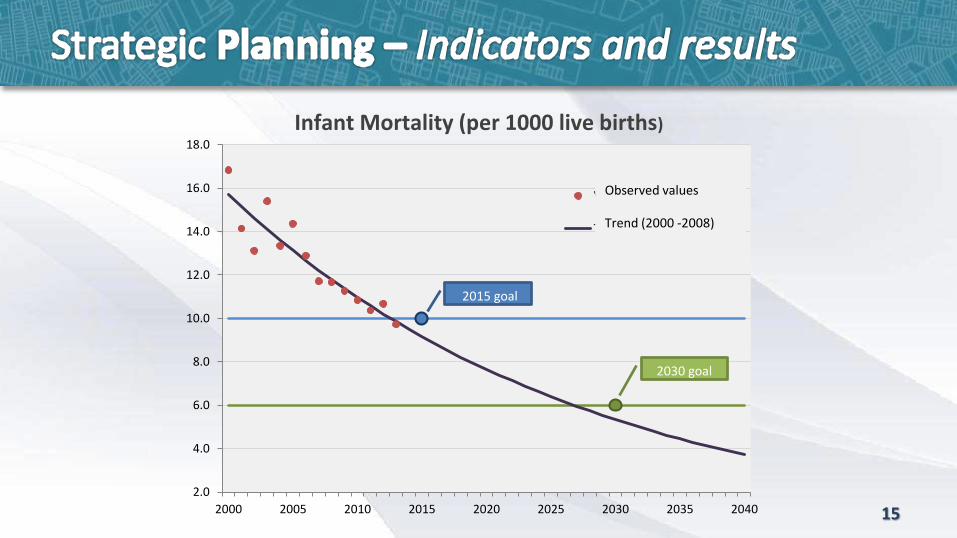
Infant Mortality (per 1000 live births)
2030 goal
2015 goal
Observed values
Trend (2000 -2008)
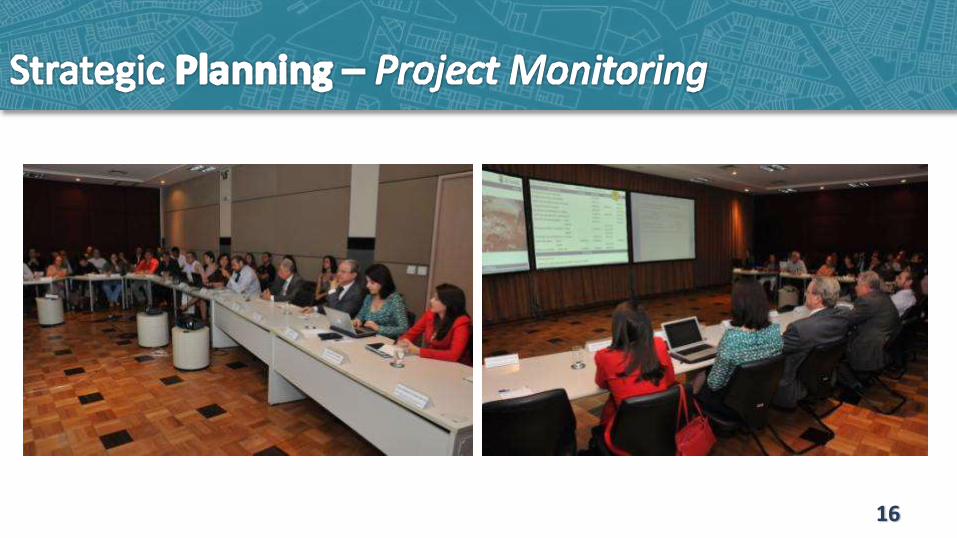
16.
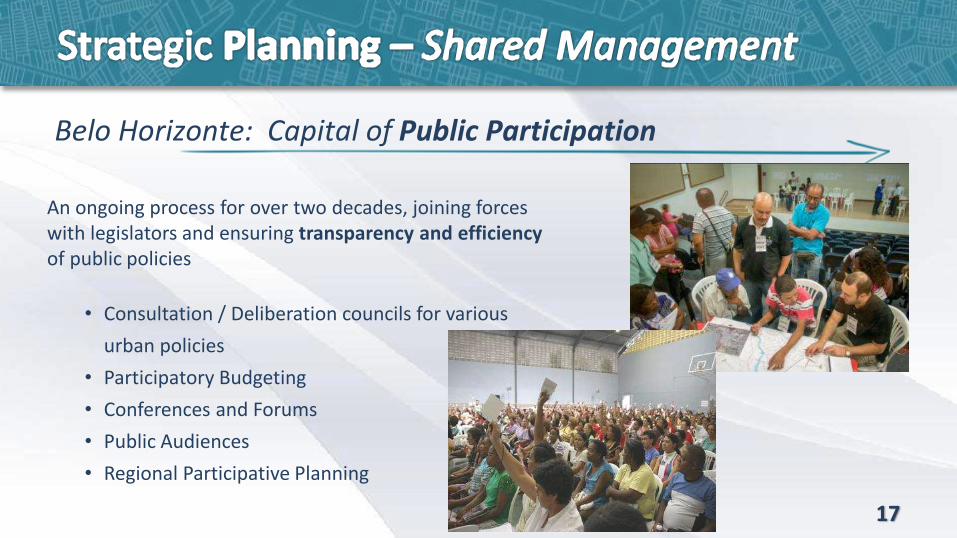
Belo Horizonte: Capital of Public Participation
An ongoing process for over two decades, joining forces with legislators and ensuring transparency and efficiencyof public policies
• Consultation / Deliberation councils for various
urban policies
• Participatory Budgeting
• Conferences and Forums
• Public Audiences
• Regional Participative Planning
17
18
19
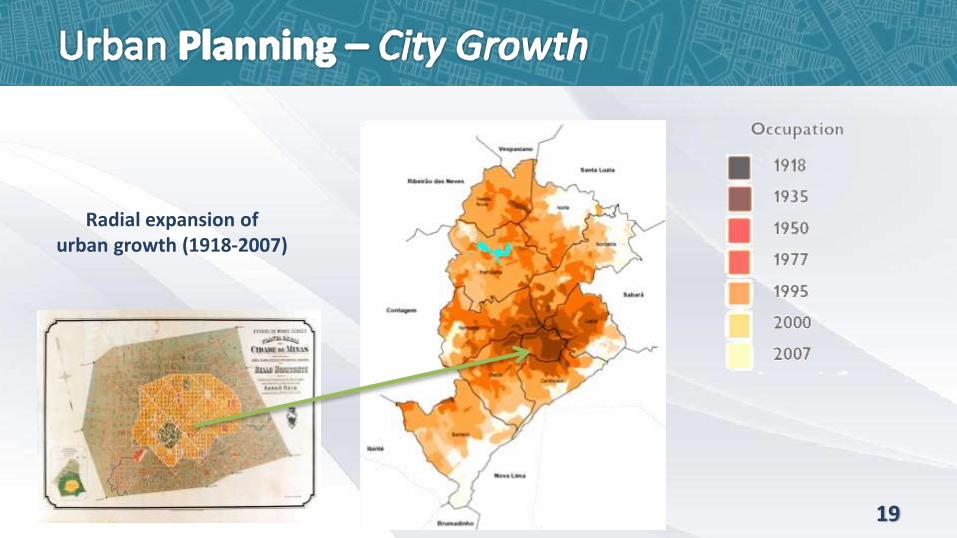
Radial expansion ofurban growth (1918-2007)
22
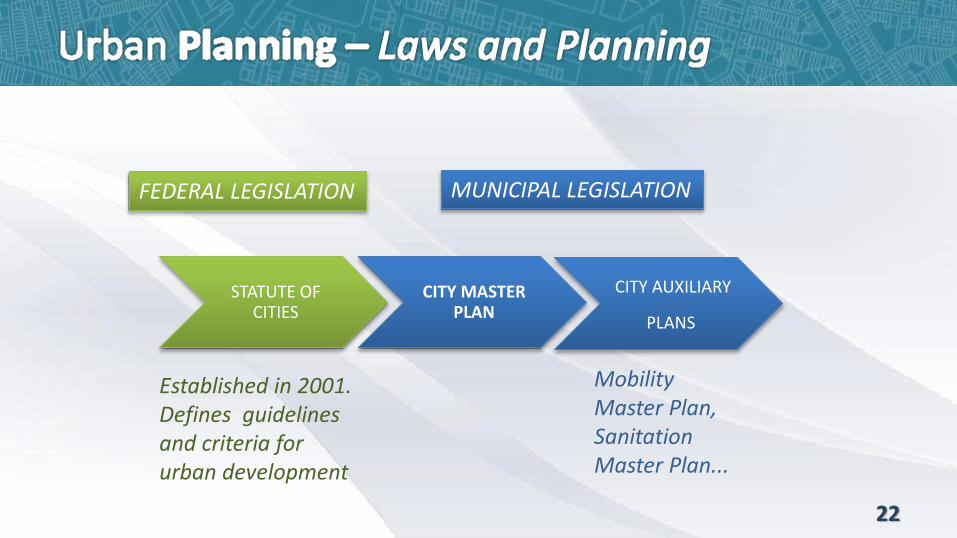
STATUTE OF CITIES
CITY AUXILIARY
PLANS
CITY MASTER PLAN
FEDERAL LEGISLATION MUNICIPAL LEGISLATION
MobilityMaster Plan, SanitationMaster Plan...
Established in 2001.Defines guidelinesand criteria forurban development
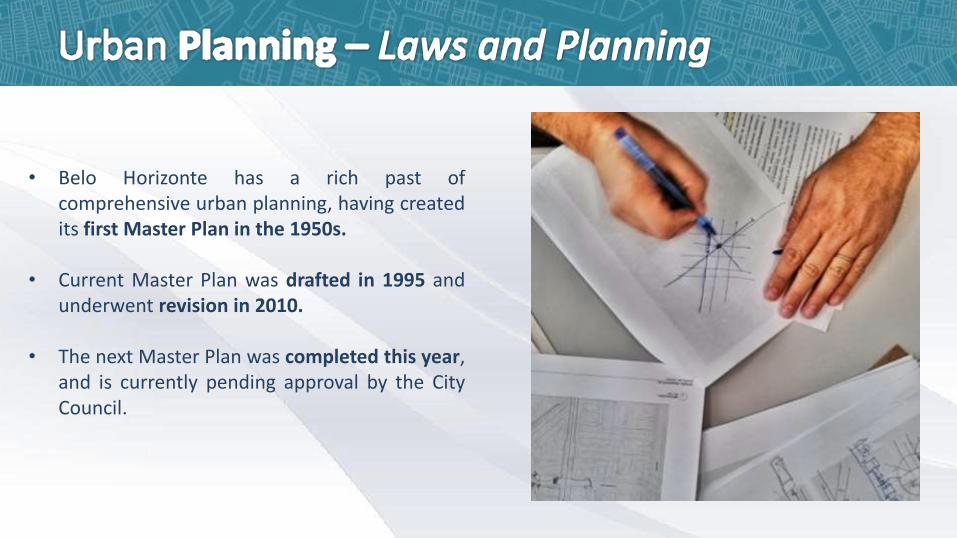
• Belo Horizonte has a rich past ofcomprehensive urban planning, having createdits first Master Plan in the 1950s.
• Current Master Plan was drafted in 1995 andunderwent revision in 2010.
• The next Master Plan was completed this year,and is currently pending approval by the CityCouncil.
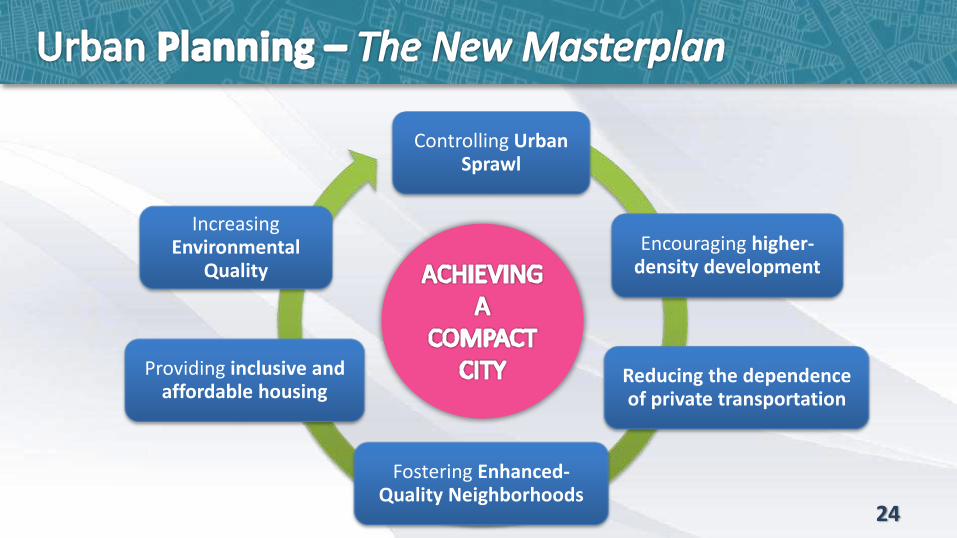
24
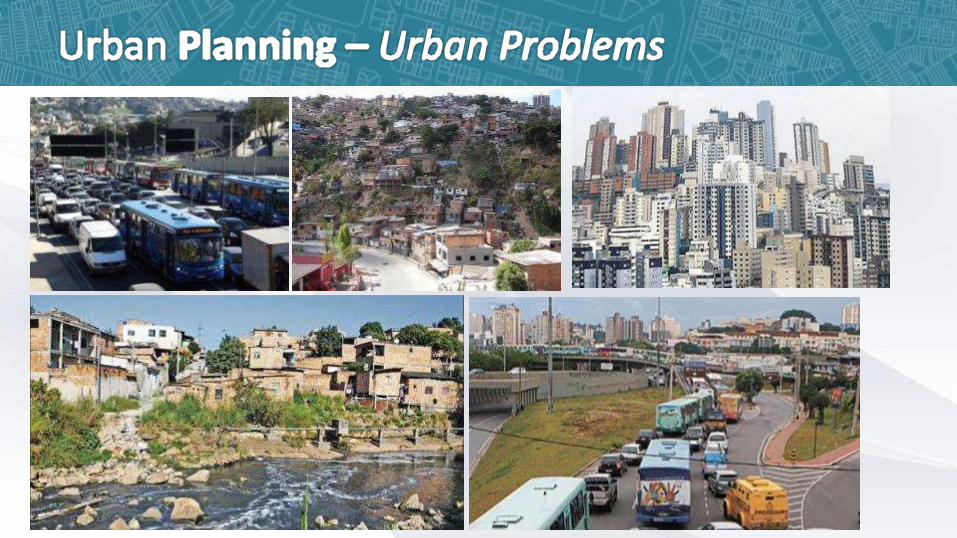
Controlling Urban Sprawl
Encouraging higher-density development
Reducing the dependence of private transportation
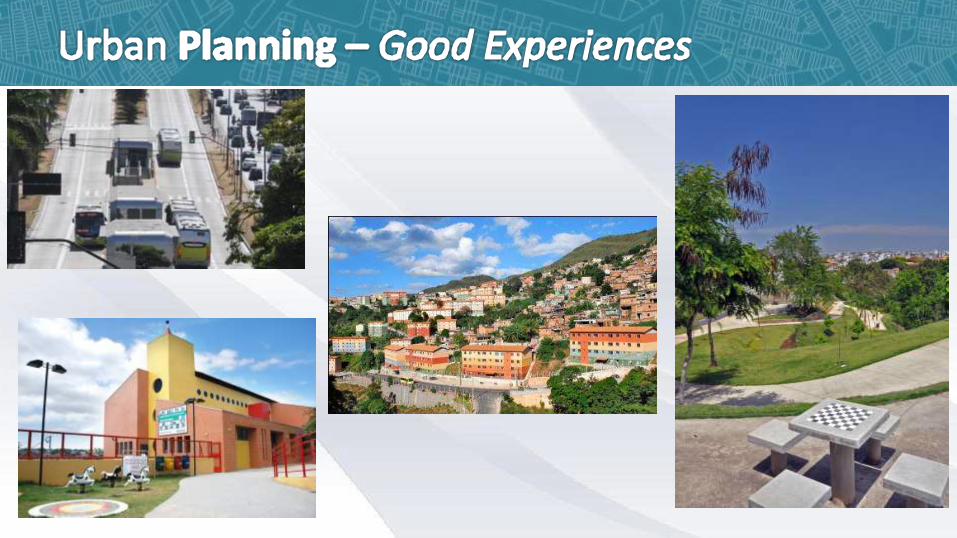
Fostering Enhanced-Quality Neighborhoods
Providing inclusive and affordable housing
Increasing Environmental
Quality
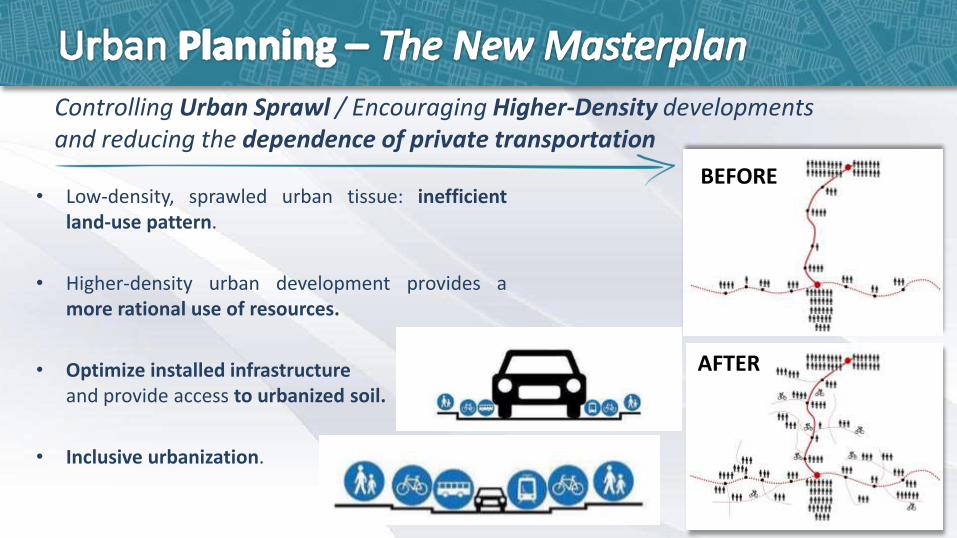
Controlling Urban Sprawl / Encouraging Higher-Density developmentsand reducing the dependence of private transportation
• Low-density, sprawled urban tissue: inefficientland-use pattern.
• Higher-density urban development provides amore rational use of resources.
• Optimize installed infrastructure and provide access to urbanized soil.
• Inclusive urbanization.
25
BEFORE
AFTER
26
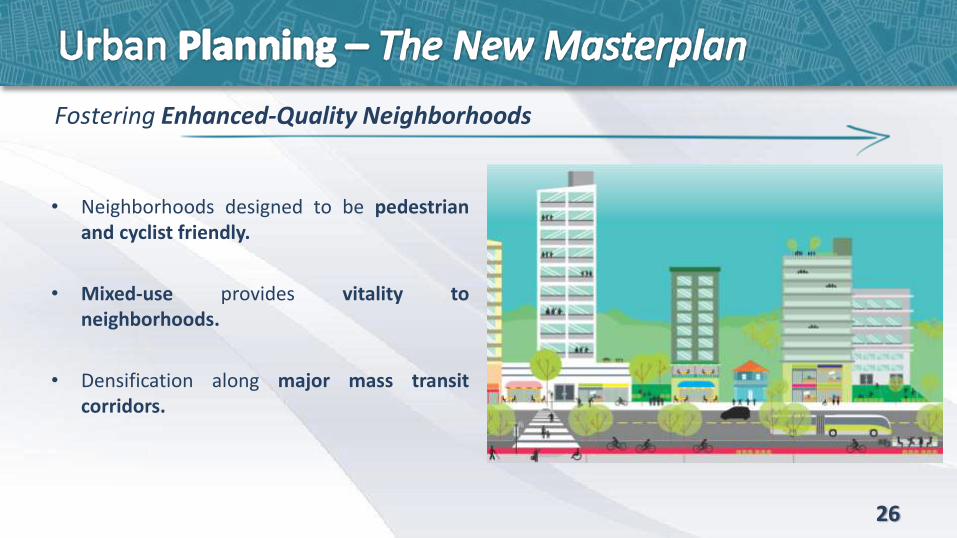
• Neighborhoods designed to be pedestrianand cyclist friendly.
• Mixed-use provides vitality toneighborhoods.
• Densification along major mass transitcorridors.
Fostering Enhanced-Quality Neighborhoods
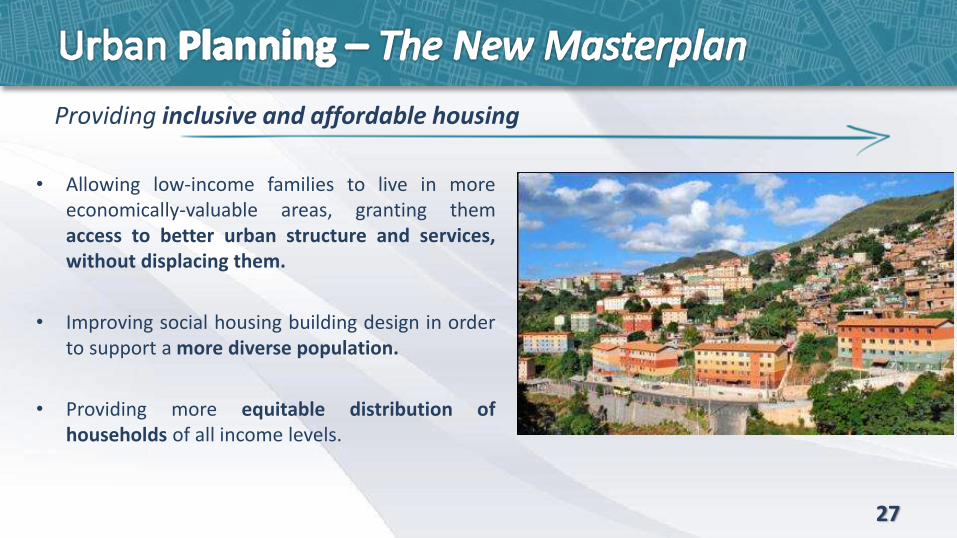
Providing inclusive and affordable housing
27
• Allowing low-income families to live in moreeconomically-valuable areas, granting themaccess to better urban structure and services,without displacing them.
• Improving social housing building design in orderto support a more diverse population.
• Providing more equitable distribution ofhouseholds of all income levels.
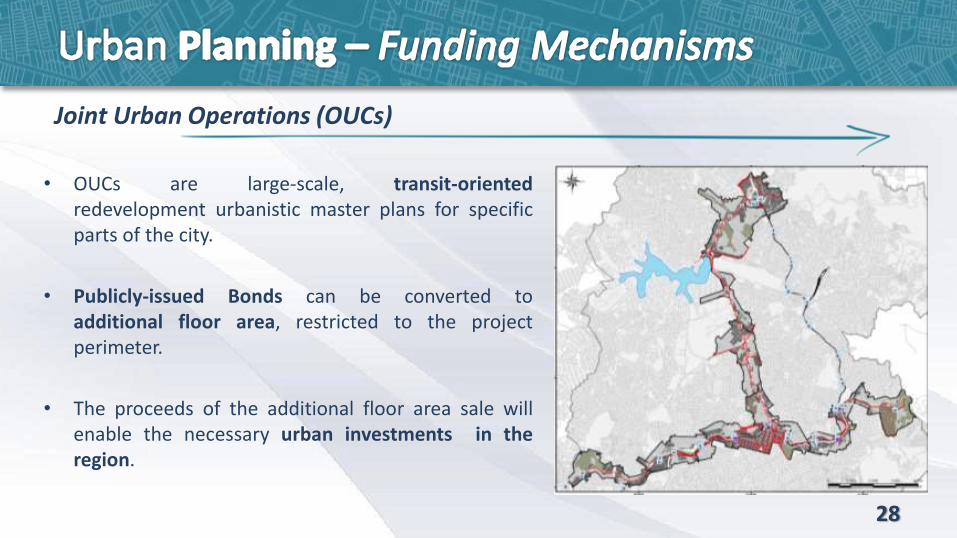
Joint Urban Operations (OUCs)
28
• OUCs are large-scale, transit-orientedredevelopment urbanistic master plans for specificparts of the city.
• Publicly-issued Bonds can be converted toadditional floor area, restricted to the projectperimeter.
• The proceeds of the additional floor area sale willenable the necessary urban investments in theregion.
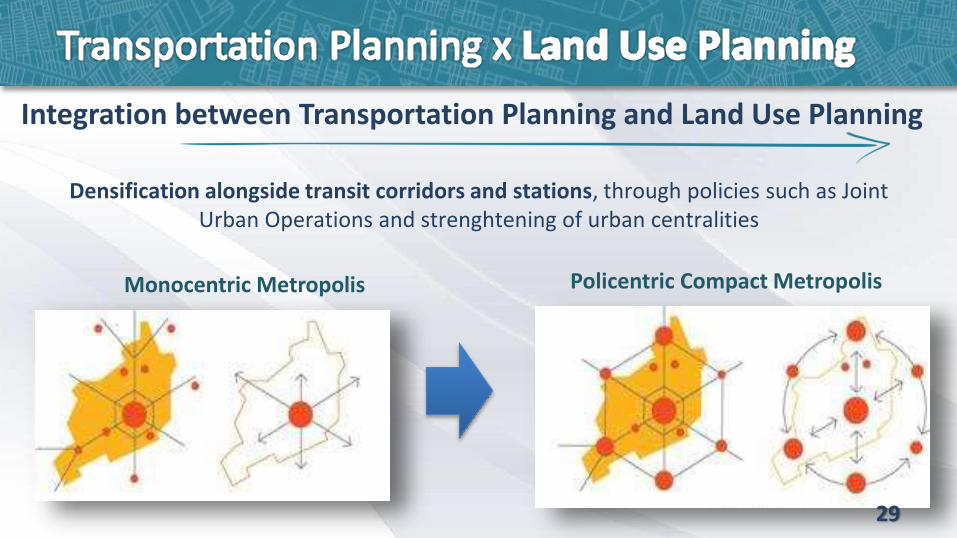
Monocentric Metropolis Policentric Compact Metropolis
Densification alongside transit corridors and stations, through policies such as Joint Urban Operations and strenghtening of urban centralities
Integration between Transportation Planning and Land Use Planning
29
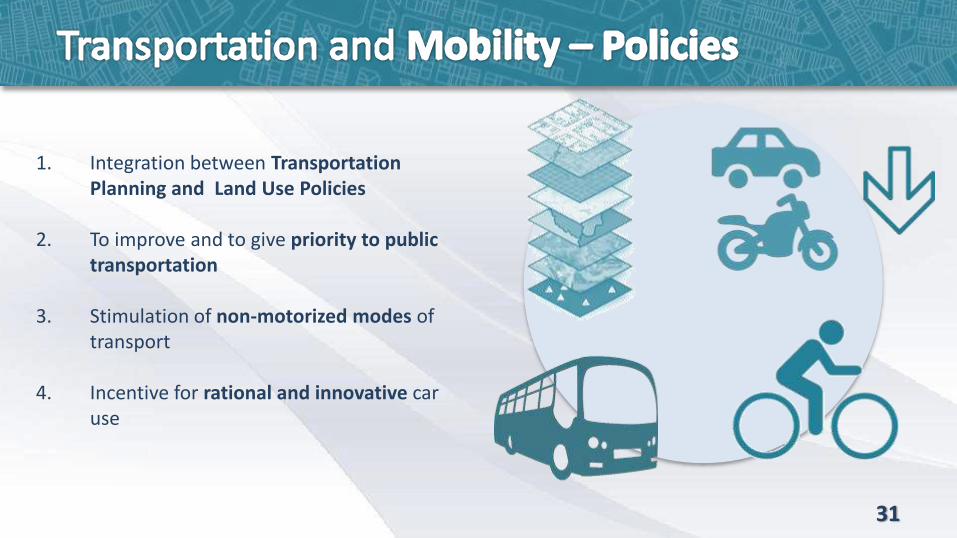
1. Integration between Transportation Planning and Land Use Policies
2. To improve and to give priority to public transportation
3. Stimulation of non-motorized modes of transport
4. Incentive for rational and innovative car use
31
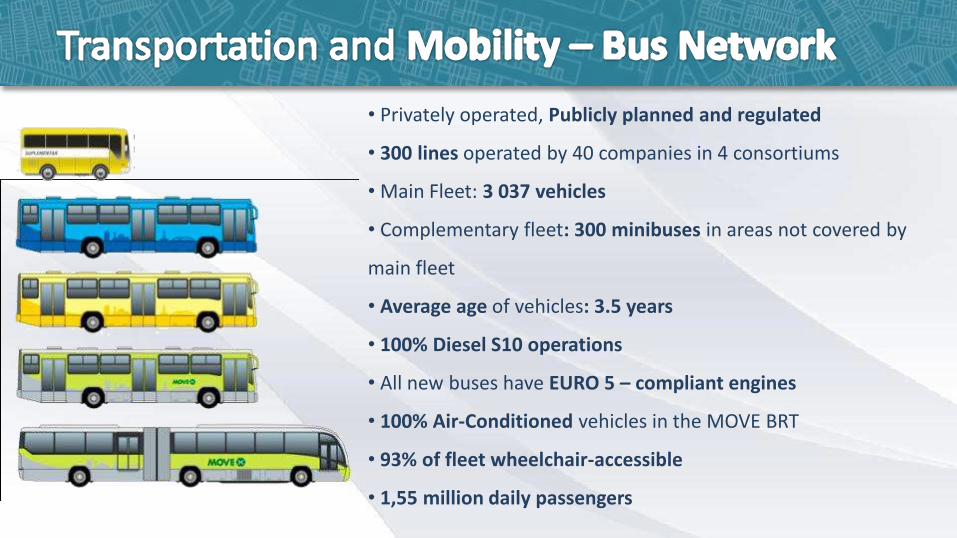
• Privately operated, Publicly planned and regulated
• 300 lines operated by 40 companies in 4 consortiums
• Main Fleet: 3 037 vehicles
• Complementary fleet: 300 minibuses in areas not covered by
main fleet
• Average age of vehicles: 3.5 years
• 100% Diesel S10 operations
• All new buses have EURO 5 – compliant engines
• 100% Air-Conditioned vehicles in the MOVE BRT
• 93% of fleet wheelchair-accessible
• 1,55 million daily passengers
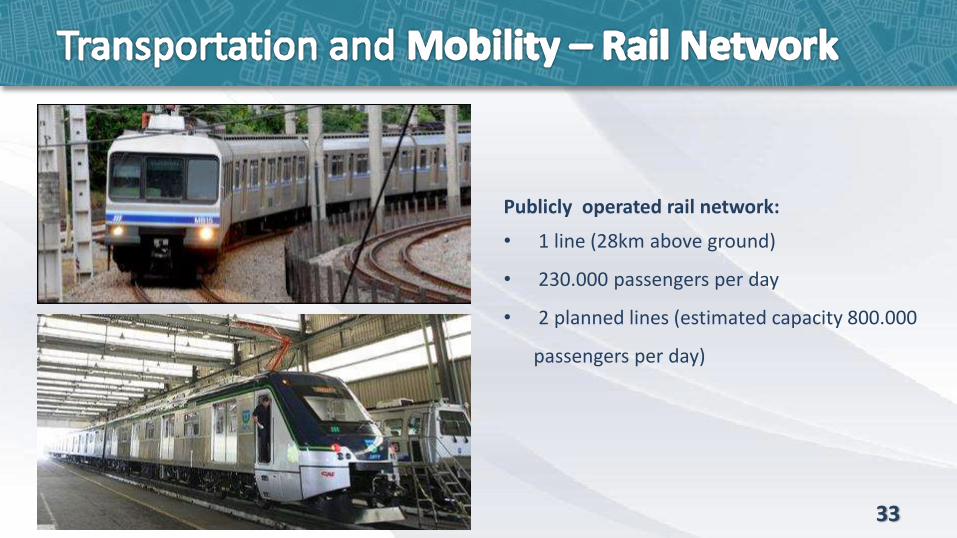
Publicly operated rail network:
• 1 line (28km above ground)
• 230.000 passengers per day
• 2 planned lines (estimated capacity 800.000
passengers per day)
33
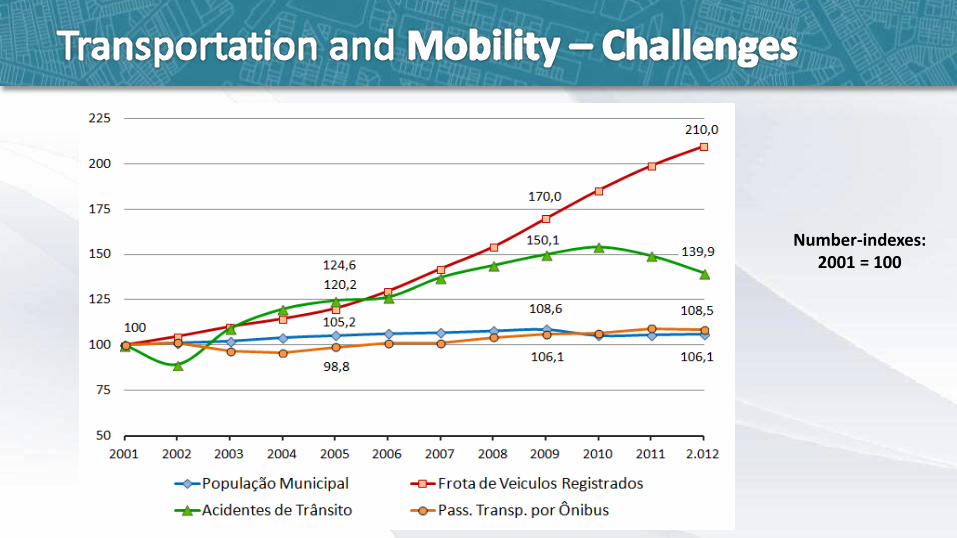
Number-indexes: 2001 = 100
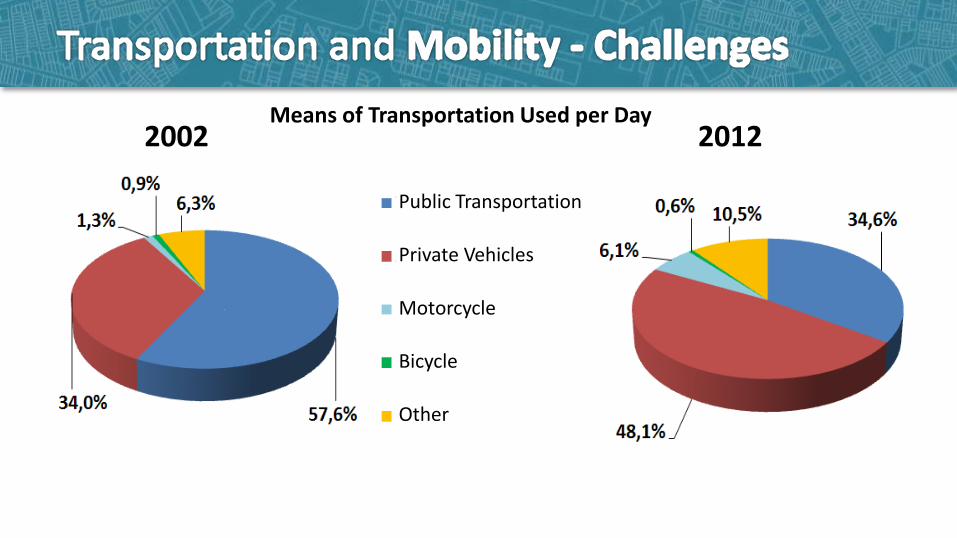
Public Transportation
Private Vehicles
Motorcycle
Bicycle
Other
2002 2012Means of Transportation Used per Day
Sustainable urban mobility initiatives
36
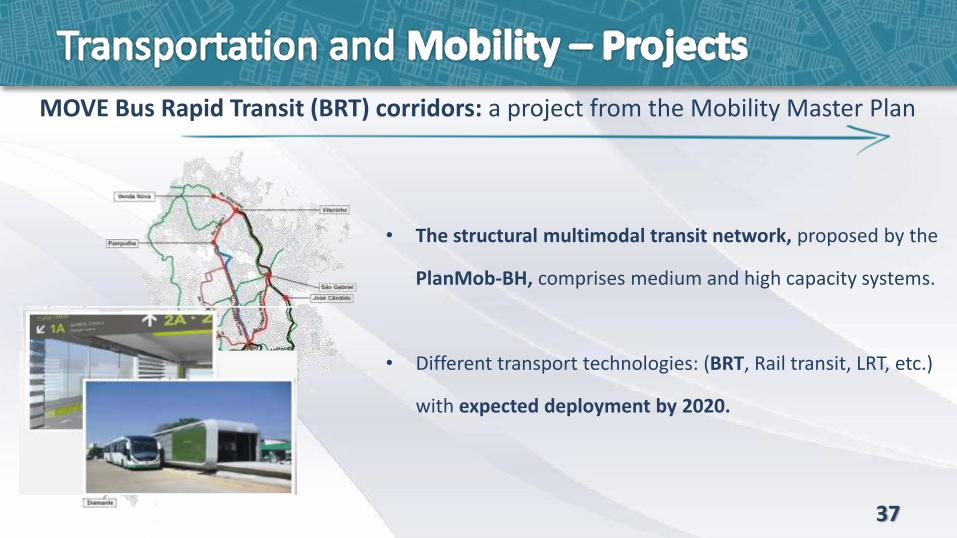
MOVE Bus Rapid Transit (BRT) corridors: a project from the Mobility Master Plan
• The structural multimodal transit network, proposed by the
PlanMob-BH, comprises medium and high capacity systems.
• Different transport technologies: (BRT, Rail transit, LRT, etc.)
with expected deployment by 2020.
37
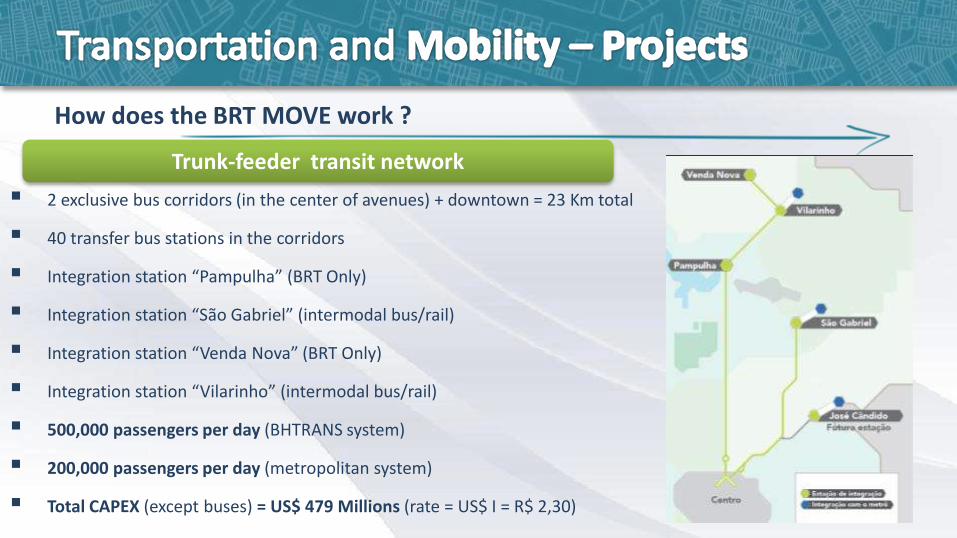
How does the BRT MOVE work ?
Trunk-feeder transit network
2 exclusive bus corridors (in the center of avenues) + downtown = 23 Km total
40 transfer bus stations in the corridors
Integration station “Pampulha” (BRT Only)
Integration station “São Gabriel” (intermodal bus/rail)
Integration station “Venda Nova” (BRT Only)
Integration station “Vilarinho” (intermodal bus/rail)
500,000 passengers per day (BHTRANS system)
200,000 passengers per day (metropolitan system)
Total CAPEX (except buses) = US$ 479 Millions (rate = US$ I = R$ 2,30)
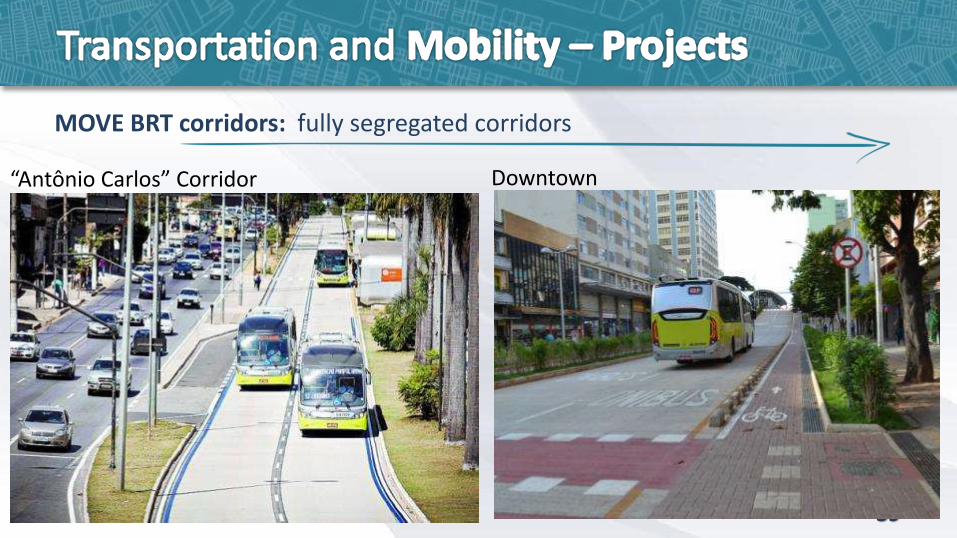
“Antônio Carlos” Corridor Downtown
MOVE BRT corridors: fully segregated corridors
39
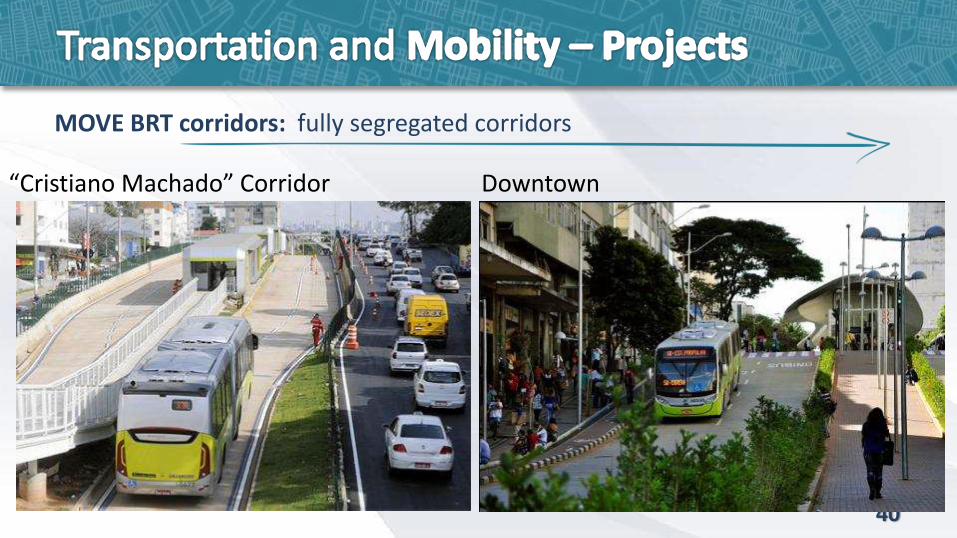
MOVE BRT corridors: fully segregated corridors
“Cristiano Machado” Corridor Downtown
40
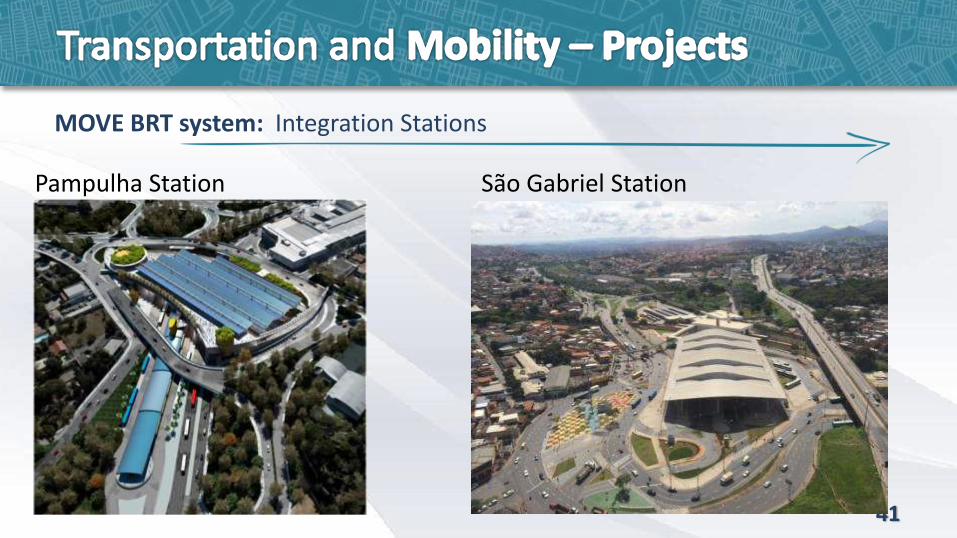
MOVE BRT system: Integration Stations
Pampulha Station São Gabriel Station
41
MOVE BRT System : Transfer Stations
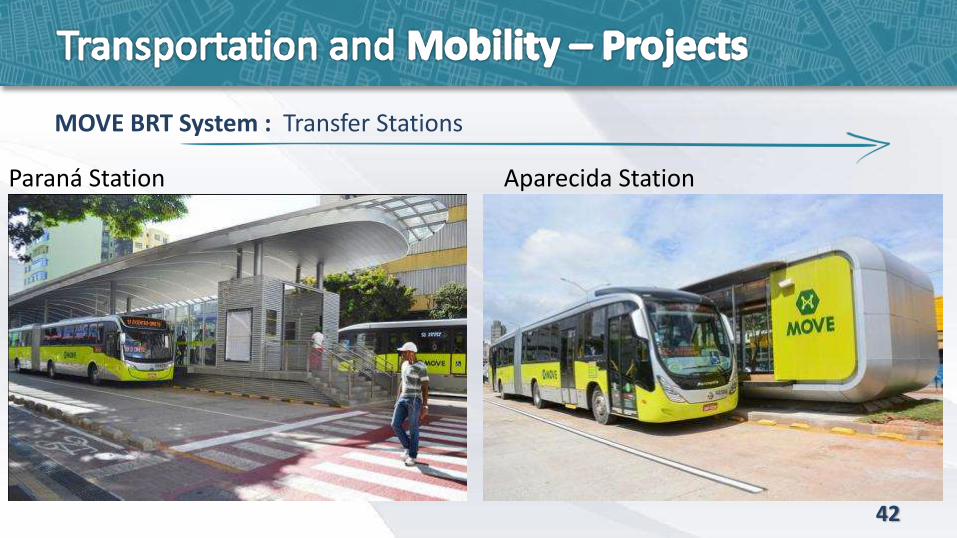
Paraná Station Aparecida Station
42
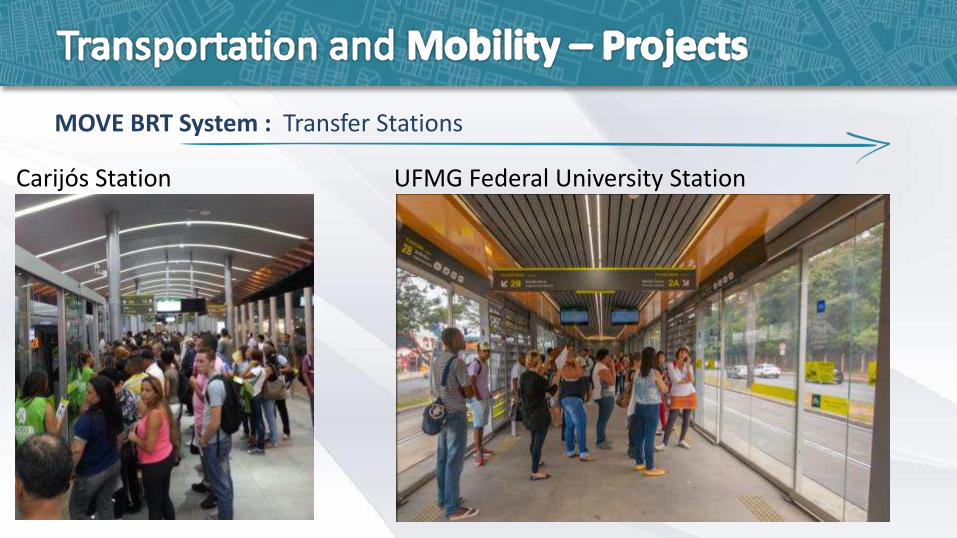
MOVE BRT System : Transfer Stations
Carijós Station UFMG Federal University Station
44
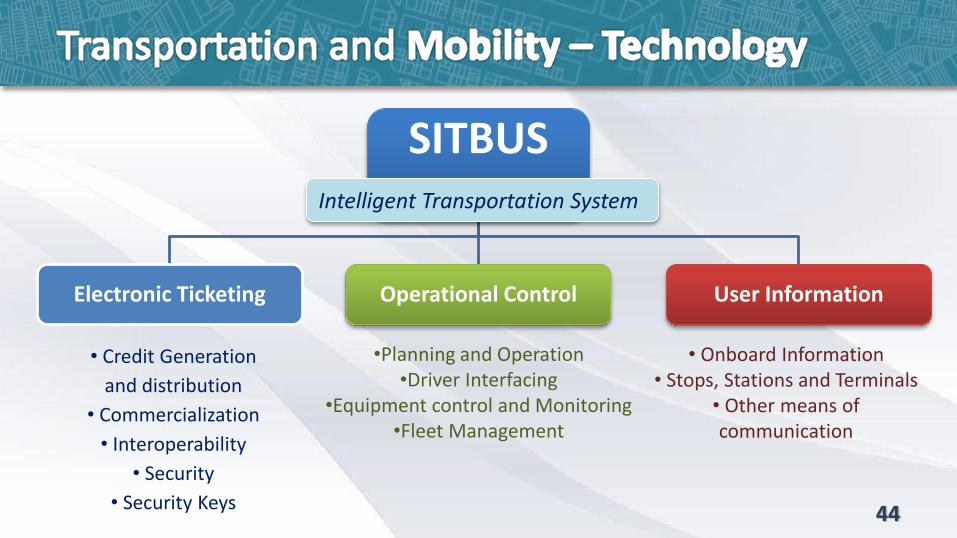
SITBUS
Electronic Ticketing Operational Control User Information
Intelligent Transportation System
• Credit Generation
and distribution
• Commercialization
• Interoperability
• Security
• Security Keys
•Planning and Operation•Driver Interfacing
•Equipment control and Monitoring•Fleet Management
• Onboard Information• Stops, Stations and Terminals
• Other means of communication
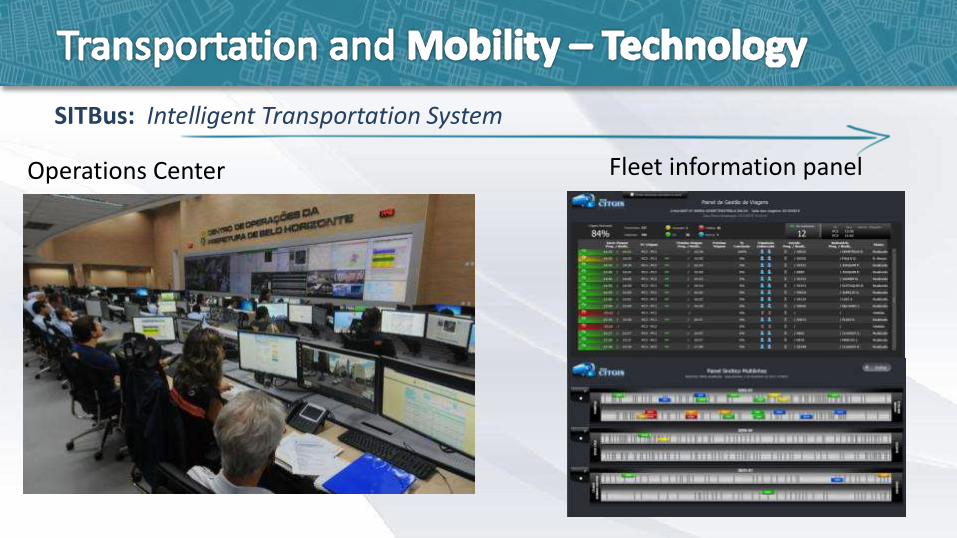
SITBus: Intelligent Transportation System
Fleet information panelOperations Center
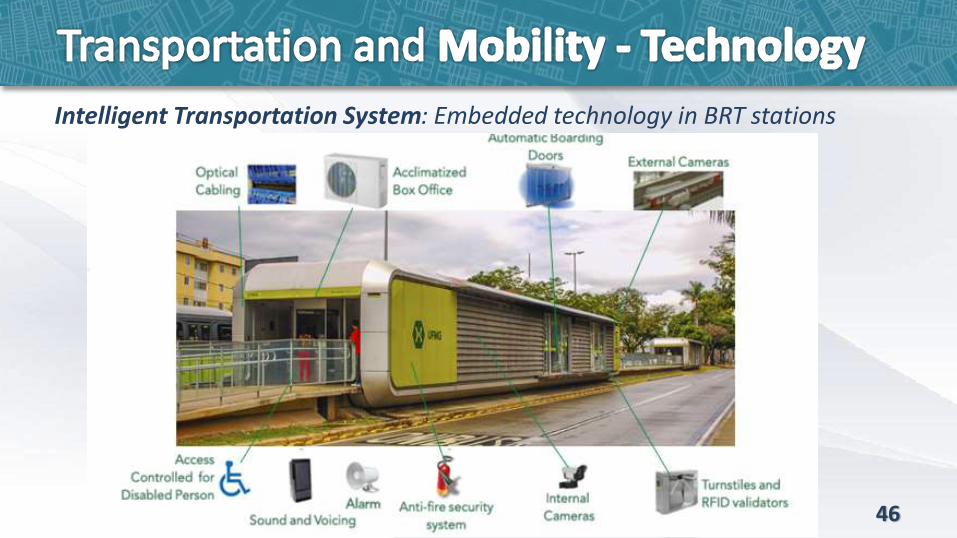
Intelligent Transportation System: Embedded technology in BRT stations
46
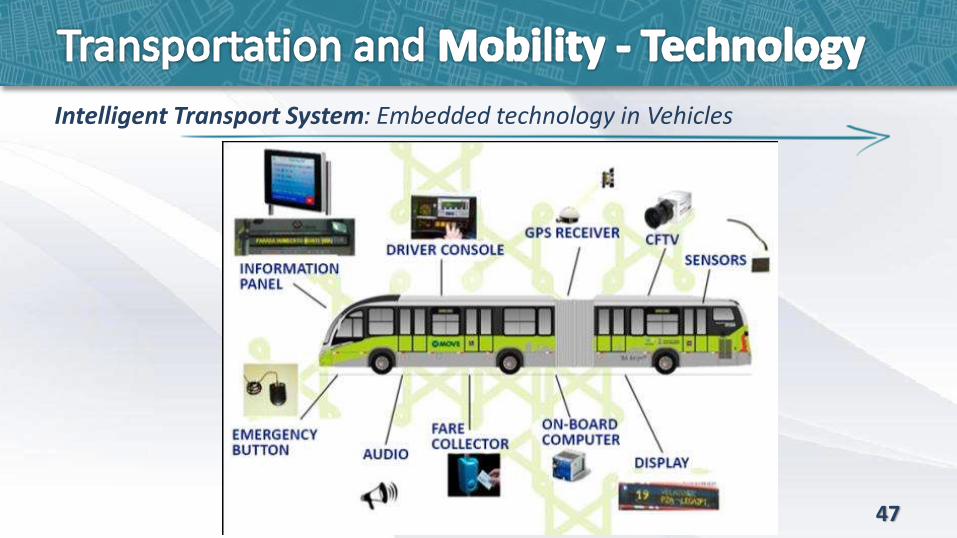
Intelligent Transport System: Embedded technology in Vehicles
47
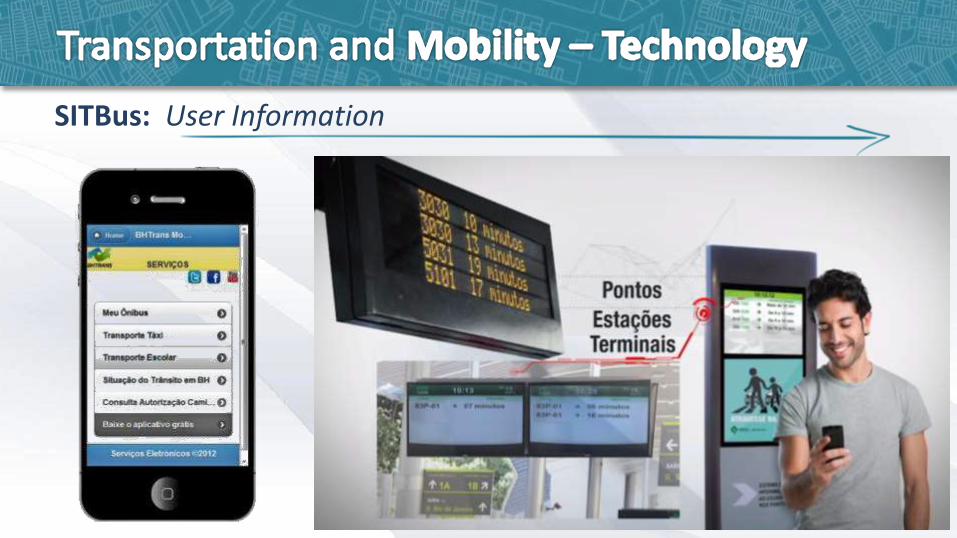
SITBus: User Information
48
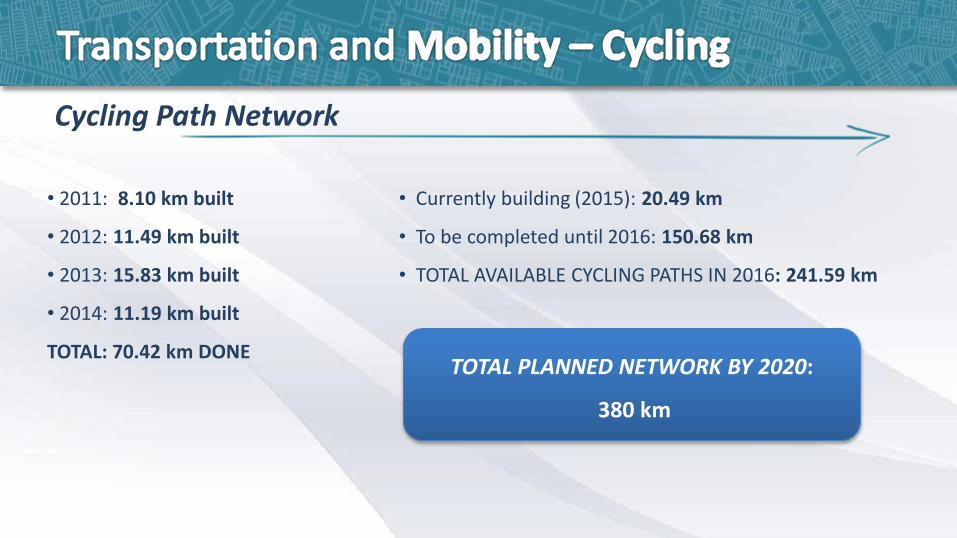
• Currently building (2015): 20.49 km
• To be completed until 2016: 150.68 km
• TOTAL AVAILABLE CYCLING PATHS IN 2016: 241.59 km
• 2011: 8.10 km built
• 2012: 11.49 km built
• 2013: 15.83 km built
• 2014: 11.19 km built
TOTAL: 70.42 km DONETOTAL PLANNED NETWORK BY 2020:
380 km
Cycling Path Network
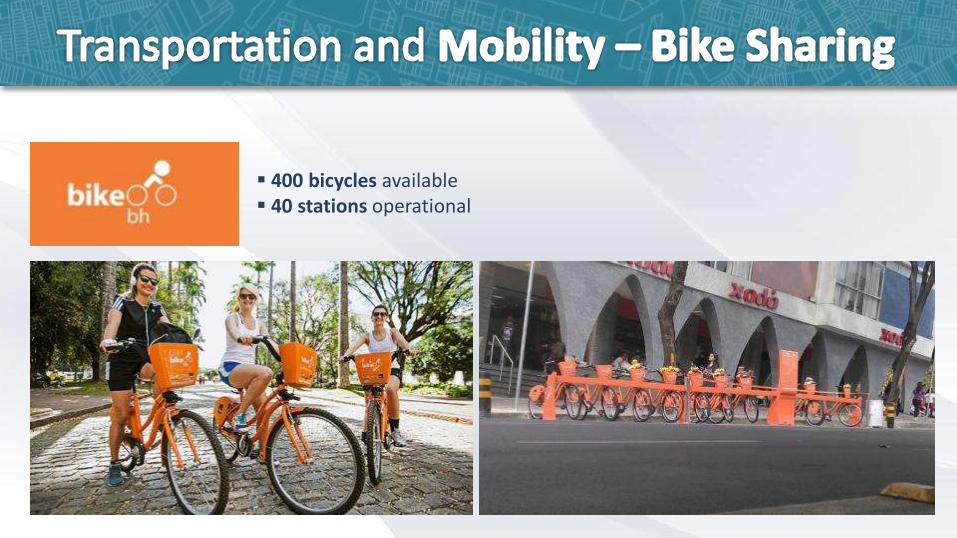
400 bicycles available 40 stations operational
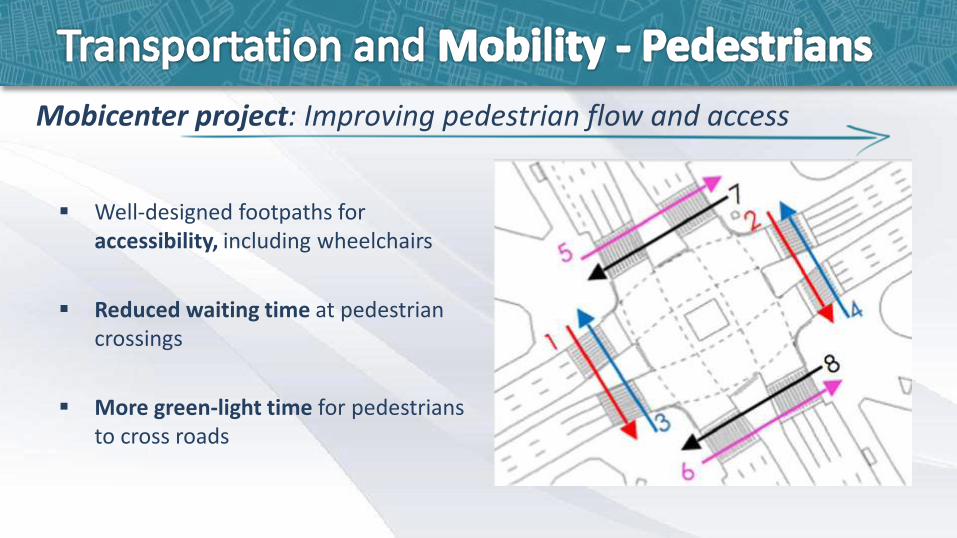
Mobicenter project: Improving pedestrian flow and access
Well-designed footpaths for accessibility, including wheelchairs
Reduced waiting time at pedestrian crossings
More green-light time for pedestrians to cross roads
www. pbh.gov.br