Embed Size (px)
Citation preview

© Family and Parenting Institute 2010 1
Families in an age of austerity
How tax and benefit reform will affect UK families
January 2011
Executive summary Context Families with children are particularly susceptible to the impact of recent changes in welfare, tax and benefit reform because of their high degree of reliance on state financial support:
• In 2008, 93 per cent of households with children were in receipt of at least one benefit.1 • The state makes an important contribution to family income even in middle income
ranges –households with children in the middle of the income distribution (5th income decile) rely on the state for a fifth (21%) of their income compared to 10% for similarly placed childless households.2
Family budgets are likely to take a double hit in the months ahead. At the same time as families start to feel the impact of reduced state benefits and tax credit changes, family finances will be affected by the widely predicted increases in mortgage payments, rising inflation and increases in food, clothing and energy bills. This paper explores how tax and benefit changes will affect UK families, and outlines how the many and complex changes announced in the Emergency Budget and Comprehensive Spending review will impact on family finances in the years to come. It looks at all the totality of the benefit and tax credit changes announced, the number of families affected and their likely loss of income. It outlines the impact on a number of illustrative family types and identifies areas of policy concern going forward.
The illustrative family examples consider changes to income tax, employees’ national insurance, tax credits and state benefits (except Council Tax Benefit). They omit other changes announced by the coalition Government. This means that the analysis does not include, for example, the changes to employer’s national insurance, VAT and excise duties, council tax and council tax benefit and spending on public services. Some of these changes could have a more substantial impact on families’ standard of living than the direct tax and benefit changes. The future standard of living of an individual family will also be affected by what happens in the labour market, and to other economic trends.
1 Haldenby A., Trewhitt K., Briefing Note: Welfare (Reform April 2010)
2Analysis derived from Table 21 The Effects of taxes and benefits on household income (Office for National Statistics, June 2010).
Tax and Benefits for families
© Family and Parenting Institute 2010 2
Which families are affected and by how much? Two recently announced measures will have a positive impact on family income, particularly the poorest families and those on low wages.
o The one off payment of £180 per child in Child Tax Credit in 2011-12 and £110 per child in 2012-13 will benefit £3.9 million claimants, creating a net additional spend on families of £711m in 2011-12.
o The £1,000 increase in the personal tax allowance will benefit families on low wages, and an estimated total 880,000 low paid individuals are likely to be exempt from income tax following this change.
However, these increases are, for many families, offset by losses from other elements of the benefits and tax credit system. The paper reveals three categories of UK family who will be most severely affected by the reforms to taxes and benefits.
1. New families
A number of reforms will impact on expectant parents and families with small babies in particular. A total of £150.1 million of grants to pregnant mothers has been taken out the system through the abolition of the Health in Pregnancy Grant (worth £190 per child) which was paid in respect of 790,000 children. Restrictions on payment of the Sure Start Maternity Grant (worth £500 per child), which is now only payable for the first child will affect 131,000 claimants.
A further £263.7 million of spending has been reduced through the abolition of the baby element of the child tax credit which was worth an annual £545 per child. This will affect 484,000 families. The abolition of the Child Trust Fund will also mean families losing out a contribution to their child’s savings of £250 or £500 if they were on low incomes, with a total loss to this group of £296m. This will affect all children born after 1st January 2011 – approximately 790,000 payments.
Along with all other families with children, these new families with new babies will experience the impact of the three year freeze in child benefit, which will take out a further £1.3bn of support by 2013/14. For a family with two children, this freeze is equivalent to £73 pa in 2011-12 rising to £192.32 pa in 2013-14. For higher earning families, the withdrawal of Child Benefit from families containing a higher rate tax payer will result in an additional loss of £1,752 pa in 2013 for a family with two children.
2. Struggling working families
For working families in particular, a number of changes to the tax credit system are likely to have a significant negative impact on family income. The full suite of reforms is laid out in the paper but three reforms are of particular significance:
• An increase in the number of hours needed to claim Working Tax Credits from 16 to 24 hours will affect 205,000 families with children who currently work fewer than 24 hours per week. If they are unable to increase their hours in response to this change, they stand to lose £3,810 pa of tax credit entitlement.
• The freeze in the rates of Working Tax Credit. This will affect 1.9 million families who will lose £210 pa by 2012/13 as a consequence.
• The reduction in the childcare element of the tax credit will take £381 million of support from the system, affecting 489,000 families.

Tax and Benefits for families
© Family and Parenting Institute 2010 3
3. Large families on low incomes
Several welfare changes (notably to housing benefit) could create financial hardship for larger families. In particular the cap on total household benefits seems likely to apply irrespective of number of children – raising questions about whether there will be a maximum number of children the state is willing to help support. The rationale underpinning this approach is also unclear: if the policymakers believe that certain families are receiving too much in benefits, it would be advisable to address the underlying structure of the benefit system. If it is thought that such families faced too little incentive to work, then it would make more sense to make changes to the conditionality which applies to benefit recipients.
The reforms may have a disproportionate impact on families of a particular religious or ethnic background. Bangladeshi and Pakistani families tend to be larger than those of all other ethnic groups. Of Bangladeshi and Pakistani families, 40 per cent had three or more dependent children in 2001; this was the case for only 17 per cent of white families. Certain ethnic minority families, already more economically disadvantaged, will therefore be disproportionately negatively affected by these welfare changes.
Policy questions arising from the reforms The impact on child poverty. The Treasury has asserted that the Emergency Budget and the Spending Review will have no measurable short-term impact on child poverty due to the increases in Child Tax Credit. But, given the severity of the cuts in areas such as maternity and housing benefits, there is a very real risk of child poverty rising over the longer term. For this reason, the Government’s response to the recommendations of the review on Poverty and Life Chances published on 3rd December 2010 ( http://povertyreview.independent.gov.uk) and the forthcoming review on ‘Early Intervention’ will be of even greater significance.
Welfare reform at a time of high unemployment. Greater conditionality (particularly for lone parents) and increased work incentives will only be effective at encouraging parents into work if there are a sufficient number of flexible jobs available. The government may also have inadvertently introduced new disincentives to work for parents – such as reducing the Childcare element of Tax Credits and freezing Working Tax Credit.
Tax breaks for married couples. The Conservatives have repeatedly indicated that they wish to recognise marriage in the tax system, and David Cameron recently suggested that this might be extended to higher earners.3 Supporting marriage was identified as a major part of the Conservative strategy in preventing social and family breakdown, but there is little if any evidence that policies that directly recognise marriage through the tax system increase the marriage rate or lower the risks of family breakdown. Marriage is an important institution. But given the cutbacks to so many benefits, there are important questions about whether this is the most effective way to channel support to families.
The future of universality. Several of these welfare reforms curtail support for ‘middle class’ families – particularly in relation to Child Benefit and Tax Credits. While these families may not be facing extreme financial hardship they may well fall into the category of the so-called ‘squeezed middle’. A purely means-tested system may be more efficient in that it concentrates
3 BBC News ‘Cameron hints at tax break amid child benefit row’ (5 October 2010) http://www.bbc.co.uk/news/uk-politics-11478320

Tax and Benefits for families
© Family and Parenting Institute 2010 4
resources on people in greatest need, but reducing the return that higher earners get from their contribution ultimately strains goodwill towards the benefits system. Eroding universal benefits raises challenging questions about the purpose of the welfare state and the relationship that families on all incomes have with it and doing it just for families with children raises questions about the rationale for reform.
The end of Child Benefit universality also reveals an apparent discrepancy in the Government’s cuts programme. The principle of universal benefit remains secure for the older generation – in terms of state pension, Winter Fuel Payment and free bus passes – but not for children. It will be a matter of interest to see if the principle of universality is withdrawn elsewhere in the welfare system and if not, what logic is given for withdrawing universal support just for families with children.
Social Exclusion and Housing Benefit cuts. Changes to Local Housing Allowance and to housing entitlement in the social housing sector could destabilise the living arrangements of many families – particularly those living in high rent areas such as London. Moving home has a particular impact on families – for those with children, it may mean changing schools, a greater possibility of overcrowding in the home and the potential disruption of long established social networks and care arrangements for children and for elderly people. Mitigating the damaging impact of these changes for families and communities should be a priority.
Women’s financial independence. There is growing concern that this programme of welfare reform could go some way to restoring the ‘male breadwinner, dependent female carer' model.4 It is arguable that the cumulative effect of cuts to Child Benefit (intended to be paid directly to the main carer), the abolition of the Health in Pregnancy Grant, restrictions to the Sure Start Maternity Grant, reductions in the childcare element of Working Tax Credit along with the design of Universal Credit could all serve to undermine the financial independence of women in families. When considered in tandem with the cuts to public services and reductions in the numbers of employees in the public sector (women are more likely than men to work in the public sector), the impact of the Emergency Budget and Spending Review could be regarded as biased against women. How can policy be recalibrated to ensure gender equality is also at the heart of welfare reform and family policy?
Conclusion Families are being asked to absorb much of the pain of the changes to UK tax and benefits. The government must demonstrate an understanding of how these changes affect families of different types. Beyond this, the Coalition needs to wed these changes to a future vision for families. The Prime Minister has stated his intention to make the UK the most family friendly society in Europe. Now his government must explain how this will be delivered in an age of austerity.
_____________
4 The Observer Spending cuts are restoring the old role of male breadwinner (Sunday 5 December 2010) http://www.guardian.co.uk/society/2010/dec/05/gender-equality-coalition-cuts

Tax and Benefits for families
© Family and Parenting Institute 2010 5
This paper outlines some of key changes to tax and benefits for families. In section one it maps the scale of the reforms in terms of the numbers of families affected and in section two it presents new analysis from the Institute for Fiscal Studies5 which models how the cuts might affect a hypothetical set of families. While the impact on families of the cuts to public services is not addressed in detail, it is important to note that, as heavy users of public services, families are also likely to be disproportionately affected.6
Section One: The Scale of Tax and Benefit Changes
1. Changes to Maternity Benefits 2. Changes to Tax Credits 3. Changes to Child Trust Fund 4. Changes to Child Benefit 5. Changes to Housing Benefit 6. Changes to Benefits for Older people 7. Additional Coalition Government changes affecting families 8. The Future of Welfare: Universal Credit
Section Two: The impact on different families
1. How will families be affected by these changes? 2. Modelling the impact for five hypothetical families
5 This material was prepared by Mike Brewer of the IFS 6 The distributional impact of the 2010 Spending Review (Landman Economics October 2010) http://www.tuc.org.uk/extras/cutsbriefinghowardreed.ppt
Tax and Benefits for families
© Family and Parenting Institute 2010 6
Section One:
The Scale of Tax and Benefit Changes
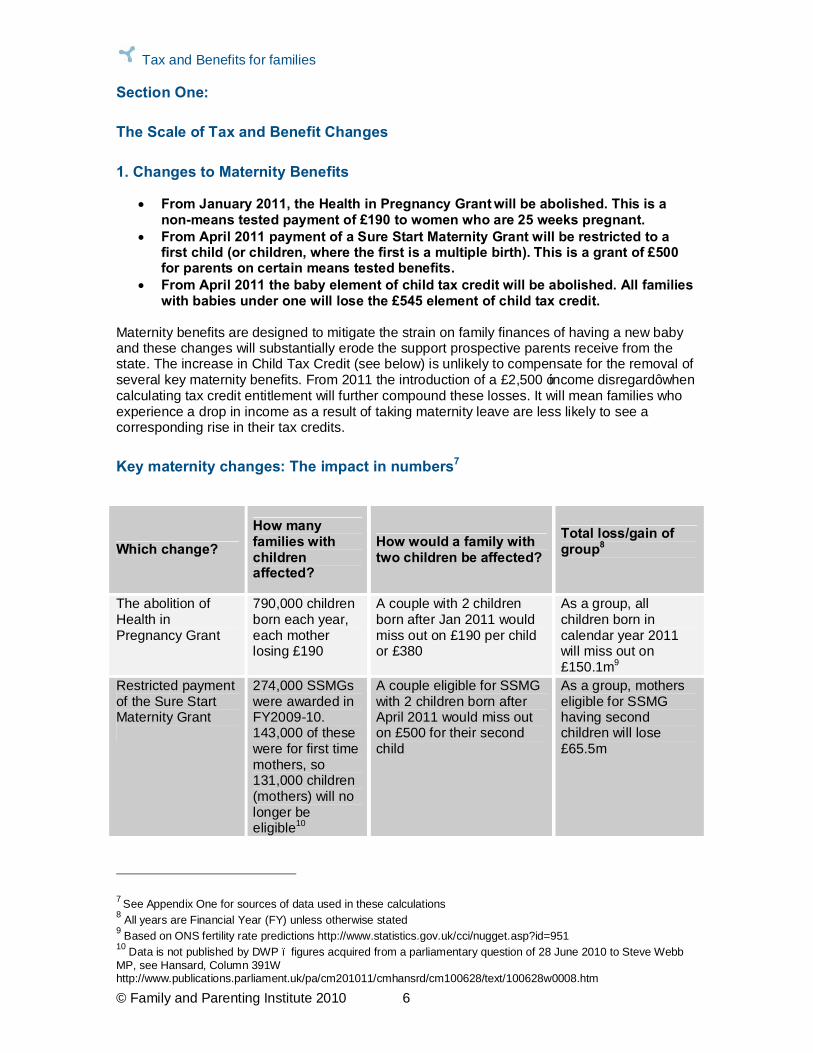
1. Changes to Maternity Benefits
• From January 2011, the Health in Pregnancy Grant will be abolished. This is a non-means tested payment of £190 to women who are 25 weeks pregnant.
• From April 2011 payment of a Sure Start Maternity Grant will be restricted to a first child (or children, where the first is a multiple birth). This is a grant of £500 for parents on certain means tested benefits.
• From April 2011 the baby element of child tax credit will be abolished. All families with babies under one will lose the £545 element of child tax credit.
Maternity benefits are designed to mitigate the strain on family finances of having a new baby and these changes will substantially erode the support prospective parents receive from the state. The increase in Child Tax Credit (see below) is unlikely to compensate for the removal of several key maternity benefits. From 2011 the introduction of a £2,500 ‘income disregard’ when calculating tax credit entitlement will further compound these losses. It will mean families who experience a drop in income as a result of taking maternity leave are less likely to see a corresponding rise in their tax credits.
Key maternity changes: The impact in numbers7
Which change? How many families with children affected?
How would a family with two children be affected?
Total loss/gain of group8
The abolition of Health in Pregnancy Grant
790,000 children born each year, each mother losing £190
A couple with 2 children born after Jan 2011 would miss out on £190 per child or £380
As a group, all children born in calendar year 2011 will miss out on £150.1m9
Restricted payment of the Sure Start Maternity Grant
274,000 SSMGs were awarded in FY2009-10. 143,000 of these were for first time mothers, so 131,000 children (mothers) will no longer be eligible10
A couple eligible for SSMG with 2 children born after April 2011 would miss out on £500 for their second child
As a group, mothers eligible for SSMG having second children will lose £65.5m
7 See Appendix One for sources of data used in these calculations 8 All years are Financial Year (FY) unless otherwise stated 9 Based on ONS fertility rate predictions http://www.statistics.gov.uk/cci/nugget.asp?id=951 10 Data is not published by DWP – figures acquired from a parliamentary question of 28 June 2010 to Steve Webb MP, see Hansard, Column 391W http://www.publications.parliament.uk/pa/cm201011/cmhansrd/cm100628/text/100628w0008.htm

Tax and Benefits for families
© Family and Parenting Institute 2010 7
Abolition of the baby element of child tax credit
484,000 families were claiming the baby element in 2009
A family with at least one child under 1 would lose £545 in FY 2011-12. This would be a one-off loss as is only paid up to the child turns two
As a group, claimants would lose £263.7million in FY 2011-12
2. Changes to Tax Credits
• Child Tax Credit: above-inflation increases in the child element of Child Tax Credit in April 2011 and April 2012. Increases in both the Emergency budget and the Spending Review will also mean a £180 payment above CPI in the 2011-12 financial year on top of which a further payment of £110 will be added in the 2012-13 financial year.
• From April 2011 both the basic and 30 hour elements of Working Tax Credit will be frozen for three years.
• From April 2011, the income threshold for the family element of the Child Tax Credit will reduce from £50,000 to £40,000 for half a million families and from April 2012 the family element of CTC will be withdrawn immediately after the child element.
• From April 2011 the rate at which tax credit entitlement is reduced as income rises is to be increased from 39 per cent to 41 per cent so that tax credits will be withdrawn from recipients more rapidly as their income increases.
• From April 2012 backdating of tax credits will be reduced from 93 days to one month.
• Tax credits were designed to be responsive to in-year changes in circumstances and supplement a sudden drop in income. But the introduction of a new ‘income disregard’ means that falls in income of up to £2,500 will not lead to an increase in a tax credit award. Simultaneously, tax credits will become more responsive to in-year rises in income; if there is an increase of more than £5,000 (rather than £25,000 previously) claimants will find their payments will be reduced. Claimants will have to inform HMRC about changes in their circumstances more quickly.
• From April 2011 the Childcare Element of the Working Tax Credit will be reduced from 80 per cent of childcare costs to 70 per cent.
• To receive Working Tax Credit, couples with children will have to work 24 hours (instead of the current 16) between them, and one must work at least 16 hours.
The increases announced for the child element of Child Tax Credit are significant, and for low-earning families this is likely to be most substantial gain amongst the newly announced changes to the welfare system. However, the overall package of changes to Tax Credits will have a more complex effect on income, which will be determined by the circumstances of individual families (specific examples are examined in more detail in Section Two). For example, restricting eligibility for Working Tax Credit to couples working 24 hours and increasing the Tax Credit withdrawal rate is likely to penalise low earning couples in employment who are struggling to balance work and family life. Another significant cut is the reduction in the Childcare Element of WTC, which will affect families struggling to meet high childcare costs. The charity 4Children has calculated that for parents with one child in full time childcare this amounts to paying an extra £15 per week and £780 per year (outside London) and an extra £17.50 per week and £910 per year (within London). Parents with two children in childcare would stand to lose £30 per week and £1,560 per year11.
11 4Children Comprehensive Spending Review 2010 Summary of changes affecting children and families http://www.4children.org.uk/information/show/ref/2215

Tax and Benefits for families
© Family and Parenting Institute 2010 8
Key Tax Credit Changes: Impact in Numbers12
The one-off increases in the child element of the Child Tax Credit were announced in two stages – in the June Budget then the October Spending Review. The wording of these increases remains somewhat ambiguous and there is no information regarding the future uprating of Child Tax Credit after the last increase in 2013. These calculations have been carried out on the more generous assumption that Child Tax Credit will remain at the higher amount (+£580) after 2013 and will then be uprated by the Consumer Price Index.
As already outlined, from 6 April 2011, the withdrawal (or ‘taper’) rate for tax credit entitlement will increase from 39% to 41%. Currently this means that if an individual claims working tax credit (WTC) or both WTC and Child Tax Credit (CTC), their entitlement is progressively reduced by 39p for each £1 that their income goes above £6,420 a year. If an individual claims CTC only, that income threshold rises to £16,190 a year. The change means that in future claimants will lose 41p instead of 39p for each £1 of income above those thresholds (or a further £20 for every £1,000 of income). Furthermore, families with household income above £40,000 will start to have their family element of £545 a year tapered away from 6 April 2011 at a rate of 41%. Under current rules, CTC claimants receive the full family element until their income reaches ‘the second income threshold’. For most people that is annual income of £50,000 (although for some it may be much higher). Above that amount the family element is withdrawn at 6.67%, or £1 in each £15 by which income exceeds that figure.
Changing the second income threshold to £40,000 and increasing the taper rate to 41% means that the withdrawal starts at lower income levels and at higher rates. However, the extent to which families are affected by this change is dependent on their earnings and individual circumstances.
Which change? How many families with children affected?
How would a family with two children be affected?
Total loss/gain of group13
Child Tax Credit: Spending Review: additional one off payment in the child element of £30 in FY 2011-12 and £50 in FY2012-13 June budget: additional one off payment of £150 in 2011-12 and £60 in 2012-13
3.955m CTC claimants, of which 1.49m families/2.8 m children are out of work and claim CTC only.
These are one-off payments, CTC will be uprated by CPI from this higher base in subsequent years. A family with 2 children claiming CTC will receive £360 in 2011-12 and a further £220 (so £580) in 2012-13 on top of their CTC payment, and remaining at this increased level thereafter.
£711m gain in FY 2011-12 £435m additional gain in FY 2012-13 Permanent gain of £1.146bn annual increase in CTC bill thereafter
12 See Appendix One for sources of data used in these calculations
13 All years are Financial Year (FY) unless otherwise stated

Tax and Benefits for families
© Family and Parenting Institute 2010 9
Working Tax Credit: basic and 30 hour element frozen for three years (FY2011-12 to 2013/14), basic element = £1920 pa (max), 30 hour element = £790 pa (max)
1.9m families and 3.3m children claim WTC and CTC, of which 1.795 million families with children claim 30 hour work element
A family with 2 children receiving basic WTC will lose £80.64 in 2011-12, £148.66 in 2012-12 and £210 in 2012-12. If they work more than 30 hours a week, their losses will be greater: £113.82 in 2011-12, £209.82 in 2012-13, and £297.42 in 2013-14
Losses of £212m in FY2011-12, £392m FY2012-13 £556m in FY2013-14
Working Tax Credit: Childcare element reduced from 80% to 70% of childcare costs
489,000 families claim childcare element of WTC, claiming an average of £70 p/w or £3640 p/a
The average childcare claim is £70 p/w, but this is an average of all claimants (over half only have 1 child). So using figures from the DayCare Trust, a nursery place in England is estimated to cost £82 p/w for children 2 and over (for 25 hours p/w).14 So, a couple with two children will spend £164 p/w on childcare, or £8736 p/a. The change in WTC childcare will mean the couple will have to pay £852.80 more in childcare in FY2011-12 and subsequent years (increasing in line with child care costs)
A loss in the range of £222 to £381million depending on childcare cost and losses increasing thereafter in line with changing childcare costs
Working Tax Credit: eligibility raised from 16 hours to 24 hours per week in work for couples with children, from April 201115
205,100 couples with children claiming WTC work less than 24 hours a week so will lose eligibility to WTC of £3810 per household
A couple with 2 children working less that 24 hours a week will therefore lose £3810, plus if they were claiming childcare for their 2 children,16 they would also lose that entirely (this would vary hugely, but could be 80% of £164 pw childcare costs, or £6822.40 in childcare p/a. (One might assume it would be lower if the couple were only working part time.)
£781 million in FY2011-12 (assuming implementation in April 2011) and thereafter i.e. this loss is permanent for this group
14http://www.daycaretrust.org.uk/data/files/Projects/London_project/london_childcare_facts_and_figures_2010__1.11.10.pdf 15 The Spending Review did not actually specify the start date of this reform, however we assume it will be in line with other major reforms and be implemented from April 2011 16 It is, however, worth noting that a couple where each adult worked between 16 and 24 hours would be unlikely to need a great deal of childcare – this calculation simply reflects their potential loss

Tax and Benefits for families
© Family and Parenting Institute 2010 10
3. Changes to Child Trust Fund
• From August 2010 Child Trust Fund payments were reduced from £250 to £50, with children from lower income households receiving £100, down from £500. Children no longer receive an additional payment when they are seven and from January 2011 the payments will be abandoned altogether.
• The Savings Gateway – a proposed Government supported savings scheme for those on low incomes – has been scrapped.
The CTF scheme has helped to create a generation with a head start in life, over the long term social mobility is likely to suffer if young people are unable to meet the costs of higher education or find the money required for a deposit on a first property. Parents having a new baby will now lose a key financial incentive to save for their child’s future, a problem which will be further exacerbated by the loss of several maternity benefits.
Key Child Trust Fund Changes: Impact in Numbers17
Which change?
How many families with children affected?
How would a family with two children be affected?
Total loss/gain of group18
Abolition of Child Trust Fund
395,00019 children born in calendar year 2011 will lose £250 + 395,000 children born in 2011 will lose £50020
Family with 2 children born after Jan 2011 will lose £500, low earning family with 2 children would lose £1000 (then an additional loss of the age 7 payment worth £500 or £1000)
£296m loss in calendar year 2011
4. Changes to Child Benefit
• From April 2011 Child Benefit will be frozen for 3 years. • From January 2013 Child Benefit will be cut for those on higher rate of tax, this is
based on individual earnings rather than household income Child Benefit is a popular and far-reaching benefit for families, with a high take-up rate. Freezing it will have a higher impact on poorer families as it makes up a larger proportion of their income, whereas cuts to Child Benefit for higher rate taxpayers will affect one-earner families most acutely. A family with one worker earning £45,000 and one parent staying at home to care for the children will lose their child benefit, whereas a couple with two people earning £40,000 each would lose nothing. These changes also undermine the advantages
17 See Appendix One for sources of data used in these calculations 18 All years are Financial Year (FY) unless otherwise stated 19 Based on ONS fertility rate predictions http://www.statistics.gov.uk/cci/nugget.asp?id=951 20 Based on the estimation that 50% of CTF take up is from low income families, eligible for the higher rate of CTF http://www.cypnow.co.uk/news/ByDiscipline/Childcare-and-Early-Years/1038702/Poorest-children-hit-hardest-abolition-child-trust-funds-says-Anne-Longfield/

Tax and Benefits for families
© Family and Parenting Institute 2010 11
associated with universality. Child Benefit lacked the social stigma attached to claiming other benefits and created a sense of social cohesion by tying middle class families into the welfare state.
Key Child Benefit Changes: Impact in Numbers21
Which change?
How many families with children affected?
How would a family with two children be affected?
Total loss/gain of group22
Child Benefit: Higher rate tax payers not eligible from 2013
1.5 million families23
A high earning family with 2 children would lose £1752 p/a in 2013. However, if CB was not frozen for 3 years, they would lose more - £1944 in 2013
This group will lose £2.35bn in FY2013-14, taking into account CB freeze. If CB was increased by RPI and not frozen, this group would lose £2.6bn in FY 2013-14
Child Benefit: Rates frozen for three years
7,769,880 families claiming CB for 13.6 million children
There are 2.9 million families with 2 children claiming CB. They will each lose £73 in 2011-12, £135.68 in 2012-13, £192.32 in 2013-14 (totalling £401 over these three years) due to the 3 year freeze in CB
£511m in FY2011-12, £943m in 2012-13 and £1.3bn in 2013-14
5. Changes to Housing Benefits
• From April 2013 Local Housing Allowance (LHA) rates will now be up-rated on the basis of the Consumer Price Index (CPI), rather than on the basis of local rents, eroding its value over time.
• From April 2011 LHA will be capped at £250 per week (one bedroom), £290 per week (two bedroom), £340 per week (three bedroom) up to a limit of £400 per week for four bedrooms or more. The £15 a week excess payment will also be abolished.
• From October 2011 LHA rents will also be calculated on the 30th percentile of private sector rents rather than the median.
• From April 2013 housing entitlements will be reduced for working age people in the social sector to reflect family size and address under-occupancy.
• From April 2011 non-dependant deductions (NDDs) are to increase.24
21 See Appendix One for sources of data used in these calculations 22 All years are Financial Year (FY) unless otherwise stated. 23 This is based on the HMT’s Spending Review Impact assessment. Originally this figure was 1.2 million families but was amended to 1.5 million. 24 This is a fixed amount deducted from the tenant’s housing benefit, because it is assumed that the non-dependant (often an adult son or daughter or elderly relative) makes a contribution towards the rent.

Tax and Benefits for families
© Family and Parenting Institute 2010 12
These changes to Housing Benefit will have a lasting impact on the finances and living arrangements of some of the lowest income families. Moving to calculating rents on the 30th percentile and introducing new caps on rent by property size, will mean that some families will not be able to afford to continue living in their current homes. The rise in non-dependant deductions could create problems within families where adult children are unable to contribute towards the rent - possibly also creating an incentive for them to move out to make an independent claim. Larger families (especially those living in London) will be disproportionately affected by capping all houses with four bedrooms and above at £400. Some may have to move to find cheaper (perhaps smaller) accommodation, leaving behind support networks and increasing the risk of overcrowding.
Key Housing Benefit Changes: Impact in numbers25
Housing Benefit is calculated by number of rooms, not children. A couple with two children under ten are most likely to be entitled to Local Housing Allowance two bedroom rate. Which change?
How many families with children affected?
How would a family with two children be affected?
Total loss/gain of group26
Local Housing Allowance rate caps by house size from April 2011** now reported to be postponed by Jan 2012
16,970 households with children
Only 3% of two bed houses will reach the rate cap of £340. Those who do will lose £52 pw or £2704 p/a
As a group, all households with children will lose £63.5m in FY2011-12 and thereafter (loss is a permanent reduction) ** if postponed, same reductions will be seen from Jan2012-13
Local Housing Allowance calculated on the basis of the 30th percentiles rather than 50th percentile
384,860 households with children
90% of two bed houses will be affected by the change in LHA, and they will lose on average £10pw or £520 p/a in HB in FY2011-12
As a group, households with children will lose £220m in FY2011-12
6. Changes to Benefits for Older people
• The rate of increase of the female state pension age will be faster than planned and the pension age for both men and women will rise to 66 by 2020.
• From April 2011 basic state pension will rise each year by the greatest of either prices, earnings or 2.5 per cent (the ‘triple guarantee’).
• In April 2011, the standard minimum income guarantee in Pension Credit will increase by the cash rise in a full basic State Pension.
25 See Appendix One for sources of data used in these calculations 26 All years are Financial Year (FY) unless otherwise stated

Tax and Benefits for families
© Family and Parenting Institute 2010 13
• From April 2011 the maximum Savings Credit award in Pension Credit will be frozen for four years.
• From April 2012 the 50 plus element will be removed from Working Tax Credit. • The full range of universal benefits for older people will be retained, including
free eye tests, free prescription charges, free bus passes, free TV licences for those over 75, and the Winter Fuel Payment.
Overall, benefits for people in later life have remained well insulated from the cuts to welfare. The protection of universal benefits and the rise in the basic state pension are particularly significant– especially for pensioners at risk of poverty. However, older women will clearly be affected by the decision to speed up the pace of State Pension Age equalisation. AgeUK has also argued that the rise in the State Pension Age will hit the poorest hardest, as it will shorten the length of retirements for those living in areas with lower life expectancy.27 Finally, it is important to highlight the fact that as older people are more reliant on public services they will be more affected by cuts in public spending, albeit indirectly.
Key Changes to Benefits for Older People: The impact in numbers28
The range of universal benefits for older people that will be maintained (including free eye tests, free prescription charges, free bus passes, free TV licences for those over 75, and the Winter Fuel Payment) cannot all be costed as they depend on usage. However, the £25 Cold Weather Payments to those on Pension Credit will cost around £32 million for the 2.7 Pension Credit claimants in FY2011-1229, and if all 5 million over 75s had a free colour TV license this would cost £727.5million. Which change?
How many affected?
Total loss/gain of group30
From April 2011 basic state pension will rise each year by the greatest of either prices, earnings or 2.5 per cent.
12.5 million pensioners in the UK. Pensioners will receive an increase in the basic state pension (single) £97.65 of £3.15 in April 2011 based on price inflation (which is higher than 2.5%) Based on CPI predictions, single pension will increase by £2.61 in 2012-13 and £1.96 in 2013-14
£39.3 million increase for pensioners as a group in April 2011
From April 2011, the means-tested Pension Credit Guarantee of £132.60 (single) and £202.40 (couple) will increase by the cash rise in
979,630 single people claim and 222,770 claim the Guarantee component, Pension Credit will increase by £4.50 a week
Single people will see a £4.4m increase in this credit from April 2011 and couples will see a £1.6m rise.
27 AgeUK ‘How the 2010 CSR will affect you’, http://www.ageuk.org.uk/money-matters/comprehensive-spending-review-2010/how-the-2010-comprehensive-spending-review-will-affect-you/ 28 See Appendix One for sources of data used in these calculations 29 HMT predict it will cost £50m per year from 2011-12 in payments to around 4.2m households, so approximately £32m for those 2.7 million on pension credit 30 All years are Financial Year (FY) unless otherwise stated

Tax and Benefits for families
© Family and Parenting Institute 2010 14
the full basic state pension rather than as a percentage linked to earnings or prices.
for a single pensioner and £7.20 for a couple based on pension increased in line with prices.
The maximum Savings Credit award will be frozen for four years from 2011-12. At the moment, those individuals with incomes of up to £183.90 a week, or couples with up to £270.12 a week are entitled to claim Savings Credit on the difference between their state pension and their total income.
The maximum award for the next 4 years will therefore be £20.52 for a single pensioner and £27.09 for a couple. HMT estimate 1.8m households will be affected over the 4 years.31 Currently 390,000 single people and 187,170 couples claim savings credit. 79,520 of these claim more than £20, of which 17,000 are single so most likely to lose out from this freeze.
The Treasury claims this cut will save £330m per year by 2014-15.32
The Winter Fuel Allowance is to be reduced in 2011 from £250 to £200 for households under 80, and from £400 to £300 for the over 80s.
13 million people are aged 60-80 will lose out on £50 each. 3 million people are 80+ and will lose £100 each.
£650 million loss from the 60-80 age group, £300 million loss from 80+ age group in FY2011-12 and thereafter.
7. Additional Coalition Government changes affecting families
• From April 2011 the income tax threshold will be increased by £1,000 (the personal allowance for people aged under 65 will rise from £6,475 to £7,475).
• From April 2013 there will be a further real reduction in the point at which the higher 40% rate of income tax is paid (in addition to those announced by the previous Government).
• From January 2011 the standard rate of VAT will rise from 17.5 to 20 per cent. • From October 2011 lone parents will have to look for work when their youngest
child is aged five instead of seven. • From April 2012 contributory Employment and Support Allowance will be time-
limited contributory for those in the work-related activity group. • From April 2013 Spending on Council Tax Benefit will be reduced by 10 per cent
and decisions about who gets support will be localised. • There will be a reduction of 68 per cent in the Warm Front budget (a scheme
aimed at vulnerable households suffering fuel poverty) • From 2013 there will be a cap on household benefit payments paid to workless
households of working age; established on the basis of median after-tax pay for working households. Disability Living Allowance claimants, War Widows, and families claiming Working Tax Credit will be exempt.
31 Based on HMT prediction, http://thepeoplescharter.org/index.php?option=com_content&view=article&id=95&Itemid=99&limitstart=1 32 Ibid

Tax and Benefits for families
© Family and Parenting Institute 2010 15
Low-income families will stand to gain from the rise in the income tax threshold (which could mean a total of 880,000 of the lowest-paid members of society are exempt from income tax altogether)33. However, it is likely that such families will be simultaneously hit by the hike in VAT and rising food and fuel costs with the risk that the gains made will be offset by losses elsewhere. Furthermore, the changes to Employment and Support Allowance could significantly reduce the household income of families where one of the parents has been claiming for over a year (the effects of this change are modelled in appendix two). Finally, in common with a number of the reforms outlined in this paper, the Coalition’s plans to cap household benefit payments is likely to hit larger families living in areas with high rent levels, as it appears likely to apply irrespective of family size or location.
8. The Future of Welfare: Universal Credit
• From October 2013 onwards a simplified ‘Universal Credit’ will merge the existing set of out of work benefits and in work support with the aim of reducing complexity and work disincentives in the system.
• It will help with the costs associated with bringing up children (including childcare), providing support based on the amounts currently provided through Child Tax Credit - but it will be paid in addition to Child Benefit.
• Claims will be made on the basis of households rather than individuals and both members of a couple will be required to claim.
• To improve work incentives, there are plans for Universal Credit to be withdrawn at a constant rate of around 65 pence for each pound of earnings. Higher earnings disregards could be used to strengthen work incentives for selected groups – such as parents.
• A new conditionality and sanctions regime will be introduced, the ‘claimant commitment’. The failure of unemployed people who are able to work to comply could lead to more severe financial sanctions such as the loss of Job Seekers Allowance for several weeks, three months or even three years. Hardship payments may be replaced by loans.
• Plans to introduce Mandatory Work Activity would mean some jobseekers will be required to take part in full-time work activity for up to four weeks.
‘Universal Credit’ will be an integrated working-age allowance which will ultimately replace Working Tax Credit, Child Tax Credit, Housing Benefit, Income Support, income-based Jobseeker’s Allowance and income-related Employment and Support Allowance. The system is likely to come into force for new claimants in 2013, with all recipients moving onto it in the first few years of the next Parliament after 2015.34 For many families, any move towards a simplified benefit system that allows them to keep more of their earnings will be welcomed. Although many of the details are still to be finalised, there are still possible drawbacks to the design of the benefit. Paying the credit on a household basis could mean child related benefits are paid to the main earner - which is commonly a man.35 Combined with the cuts to child benefit this could mean less money paid directly to women. Secondly, a more draconian sanctions regime could impact most on the most vulnerable claimants who are least able to cope. The
33 BBC News ‘Budget key points: At-a-glance’, 22 June 2010, http://www.bbc.co.uk/news/10374475 34 BBC News ‘Benefits system overhaul 'to make work pay'’ (11 November 2010), http://www.bbc.co.uk/news/uk-politics-11728546 35 The Guardian ‘Welfare reforms: women and large families are the losers’ (11 November 2010) http://www.guardian.co.uk/politics/2010/nov/11/welfare-women-large-families-losers
Tax and Benefits for families
© Family and Parenting Institute 2010 16
Government has indicated that sanctions are likely to apply to parents to some degree, which could create financial hardship for children.36
Section Two:
The impact on different families37
1. How will families be affected by these changes? When a government announces a complex set of welfare cuts and welfare increases, tax cuts and tax rises it can be difficult to establish a clear picture of how different groups of families will be affected. This section charts the overarching impact of some of the more significant reforms and explores how some hypothetical families might experience them in practical terms. Firstly, the tax reforms outlined by both the last and the current Government are an important part of the picture. The previous Government proposed an increase in the rate of national insurance and a rise in the point at which people start paying national insurance which together – if we abstract from the rise in employers’ NI payments – mean those earning less than £20,000 gain and those earning more will lose out. The Coalition Government announced a large rise in the income tax personal allowance, but that does not benefit higher-rate taxpayers. So couples where both earn less than £20,000 will find themselves gaining the most from these measures. Offsetting these changes, of course, and not captured in the analysis of the income of several families in the following section, is the increase in VAT, which IFS researchers estimate will effectively reduce the purchasing power of a given level of income by around 1 percent.38 The decision to link benefits and tax credits with the Consumer Prices Index (CPI) rather than the Retail Prices Index (RPI) or Rossi index represents the largest single saving from the welfare budget. The CPI usually gives a lower measure of inflation than either the RPI or the Rossi index, so this is effectively an across-the-board cut to all benefits received by working-age adults (the pension credit guarantee and the Basic State Pension have been spared, since these will be increased in line with earnings rather than prices). It will therefore have a long-term impact on the significant proportion of British families in receipt of state benefits. The Treasury estimates the change will save the Government £5.8 billion a year by 2014–15, a figure that will rise thereafter as the savings compound.39 As already discussed, the Coalition has announced plans to save £3.5 billion in child benefit by freezing it for three years, and then means-testing it by removing it from families containing a higher-rate income tax payer. This will mean that families just below the higher-rate threshold for income tax will be considerably worse off from a small rise in income – creating an all or nothing cliff-edge rather than a gradual withdrawal. The Government has argued that using the income tax system to means-test child benefit is less costly than devising a brand-new means-test (although Child Tax Credit effectively already serves as a system of means-testing support for families with children). This may be counter-productive as a cost saving exercise, the
36 BBC News ‘Parents not spared benefit sanctions - Duncan Smith’ (14 November 2010) http://www.bbc.co.uk/news/uk-politics-11752421 37 This section draws on material prepared by Mike Brewer of the Institute for Fiscal Studies.
38 This assumes that 75% of an increase in VAT is passed on to consumers, and that around 55% of all spending is liable to the standard rate of VAT. 39 See the June 2010 Budget documents for more details: http://www.hm-treasury.gov.uk/d/junebudget_costings.pdf.

Tax and Benefits for families
© Family and Parenting Institute 2010 17
Spending Review documents show that the Government expects to lose £280 million a year from parents manipulating their taxable income to avoid crossing the higher-rate threshold.40 The numerous changes to tax credits have already been outlined earlier in this document, but include faster withdrawal as earnings rise, withdrawing the family element of the child tax credit immediately after the child element is exhausted, and reducing the generosity of the childcare element of the working tax credit. Overall, from April 2012, a two child family will not receive any tax credits if their income exceeds £31,000. Significant sums will also be saved by altering the way in which tax credit awards are adjusted when income fluctuate within the year. This will mean families will find the Tax Credit system less responsive to a drop in their income, while their award will be reduced more quickly when they experience a rise in income. However, the Government has announced above-inflation increases in the child element of the child tax credit in 2011 and 2012, at a total cost of £2.4bn. The combined impact on families of all the changes to tax credit entitlement is complex. It is important to note that the rise in the child element of the child tax credit can dominate the other changes for some families, at least through to 2012/3. In particular, non-working families with children – likely to be amongst the poorest – are likely to benefit more from the above inflation rises in CTC than they are to lose from the freeze in Child Benefit and slowdown in the growth of other benefits, at least in 2012/3 (this can be seen in the analysis below). By 2014/5, though, the switch to the CPI and the extra year’s freeze in Child Benefit dominate. For working families, whether they gain or lose overall depends how many children are in the family, whether it qualifies for the working tax credit, how many hours are worked, family income and the split of earnings between the adults in a couple – detailed examples of this are highlighted below and in the appendix. The cuts to the childcare element of the working tax credit means the 400,000 or so families in receipt of this will now have to pay for an additional 10% of the total cost themselves. The move clearly makes using formal childcare a little more expensive; although the use of formal childcare may fall a little as a result, past research suggests that the impact on parental employment is somewhat limited.41 The precise details of the changes to Local Housing Allowance are still unclear at present, although the Department for Work and Pensions has published an assessment of how the changes due to take effect in the next financial year will hit the close to the 900,000 LHA recipients42. The average loss will be £12 a week, or 10% of the average LHA award, just under half of which comes from the previous Government’s decision to scrap the £15 rule, and half of which comes from this Government’s decision to set the LHA at the 30th centile of rents, impose nationwide caps which affect very large properties, and all properties in very high-rent areas - although at present this is almost entirely in central London. Clearly many LHA recipients (including families such as those profiled below) will find that these cuts outweigh any gains from a higher Child Tax Credit or the cuts to income tax and National Insurance for low to middle earners. From 2012-13 Employment and support allowance is being time-limited to a year for those recipients who are not receiving the means-tested variant, and who are not in the Support group. Some of the affected families will be able to claim the means-tested variant or even claim jobseekers allowance, but others will find themselves considerably worse off. In Appendix Two there is an example of this with a hypothetical family where a man is on ESA and has a partner earning £10,000 a year – they would find their income fall by some 14%. As already discussed, the decision to cap benefits for workless, non-disabled, non-widowed families at
40 See Spending Review policy costings document, http://cdn.hmtreasury.gov.uk/sr2010_policycostings.pdf. 41 See, for example, the review of studies available on Department for Work Pension’s website http://research.dwp.gov.uk/asd/asd5/WP14.pdf 42 Impacts of Housing Benefit proposals: Changes to the Local Housing Allowance to be introduced in 2011-12 (Department for Work and Pensions July 2010) http://www.dwp.gov.uk/docs/impacts-of-hb-proposals.pdf

Tax and Benefits for families
© Family and Parenting Institute 2010 18
£500 per week will primarily affect large families. For example, any workless family with seven or more children will be hard hit, along with those receiving large amounts of Housing Benefit. Overall the poorest will lose more as a percentage of income than the rich from such a large reduction in the welfare bill. And, as the IFS’s distributional analysis of all tax and benefit changes to be introduced between now and 2014–15 demonstrates, the net tax rises announced by the Government are not sufficient to offset this pattern for the bottom 90% of the population.43 2. Modelling the impact for five hypothetical families This section sets out how a number of hypothetical families will be affected by the changes to personal taxes, tax credits and state benefits announced by the coalition Government. The hypothetical families have been chosen by the Family and Parenting Institute, in consultation with researchers at the Institute for Fiscal Studies. In some cases, they have been consciously chosen to illustrate particular aspects of the announced changes to personal taxes, tax credits and state benefits. Focusing on individual cases can, of course, be misleading, and they should not be seen as a representative selection from all families. The impact of changes to personal taxes, tax credits and state benefits announced by the coalition Government on a representative sample of families in the UK is shown elsewhere in IFS analysis.44 Despite these caveats, the impact on individual families can sometimes be more revealing than looking at the average changes in income for a certain type of household or within a certain band of income. The examples below consider changes to income tax, employees’ national insurance, tax credits and state benefits (except Council Tax Benefit). They omit other changes announced by the coalition Government. This means that the analysis does not include, for example, the changes to employer’s national insurance, VAT and excise duties, council tax and council tax benefit and spending on public services. Some of these changes could have a more substantial impact on families’ standard of living than the direct tax and benefit changes. The future standard of living of an individual family will also be affected by what happens in the labour market, and to other economic trends. The analysis also does not include an assessment of the winners and losers under the Universal Credit proposals. Neither do the calculations include Local Housing Allowance, as LHA entitlements for the families would have had to be selected on a fairly arbitrary basis. But, in addition to those measures announced by the coalition in the June 2010 Budget and the Spending Review this analysis also includes reforms announced by the last Labour government and due to come in between June 2010 and April 2014. Those reforms announced by Labour which affect these families include.45
• An increase in employees’ National Insurance rates of 1% from April 2011; • An increase in the threshold at which employees start to pay National Insurance of £23
per week from April 2011; • Real reductions in the point at which the higher rate of income tax starts to be paid in
both April 2011 and April 2012; • A lower hours-of-work requirement for working tax credit for some of the over 50s
(which the coalition has cancelled).
43 Browne, J., IFS Spending Review briefing Distributional analysis of tax and benefit changes, (Institute for Fiscal Studies 21 October 2010) http://www.ifs.org.uk/publications/5313 44 James Browne’s presentation following the Spending Review (http://www.ifs.org.uk/publications/5313), which built on earlier work analysing the impact of changes in the June 2010 Budget (http://www.ifs.org.uk/publications/5246). 45 The Labour government had proposed a £4 per week toddler’s tax credit from April 2012, but the coalition Government is not going through with this. This is not reflected in the modelling, as we are comparing the situation now to the situation in April 2012 and April 2014.

Tax and Benefits for families
© Family and Parenting Institute 2010 19
The tables below compare the families’ net weekly income (income after adding benefits and tax credits and after deducting tax and national insurance liabilities) under the April 2010 tax and benefit system, and under two other tax and benefit systems which represent the situation in April 2012 and April 2014. However, these two tax and benefit systems have been expressed in today’s (2010-11) prices, so none of the changes reported here reflects the impact of inflation. A more extensive set of hypothetical families demonstrating the impact of the changes above and those announced by the Coalition, can be found in Appendix Two. Neutral impact - Family One The first hypothetical case shows a family where changes have a neutral impact on family income. This family consists of a lone parent not in work with two children. For this family, the impact of the increase in Child Tax Credit dominates the rest of the reforms with the consequence that they see little change in household income. Lone parent, children aged 2 and 4, not in work
Net weekly income April 2010 £198.09 April 2012 £201.78 April 2014 £197.86
The family will gain thanks to:
• Above-inflation increase in per child element of child tax credit The family will lose thanks to:
• The freeze in child benefit • The change of indexation rules for benefits and tax credits
Neutral impact – Family Two A significant number of pensioners also care for children. In this instance the couple stands to gain from the protection of some benefits for older people on low incomes but they will lose out over time as a result of the freezing of Child Benefit. Overall the impact on their income is neutral. Grandparents caring for children aged 12 and 14, man has private income of £30/wk, woman has no entitlement to state pension in own right
Net weekly income April 2010 £367.95 April 2012 £371.82 April 2014 £367.46
The family will gain thanks to:
• Above-inflation increase in per child element of child tax credit • Increases in pension credit
The family will lose thanks to:
• The freeze in child benefit • The change of indexation rules for the basic state pension46
46 The previous government uprated the state pension in line with RPI or 2.5%, whichever was higher. The coalition Government will uprate the state pension with the greatest of CPI, AEI and 2.5%. The OBR current expect inflation

Tax and Benefits for families
© Family and Parenting Institute 2010 20
• The fallback in the level of winter fuel payments Net losers - Family Three While it is an unusual set of circumstances, this particular family stands to lose out as a result of several of the recently announced reforms. They are amongst the few well-off couples who will find themselves losing both the family element of the child tax credit and child benefit. Such couples have to have a combined earnings below £58,000, and one earner who is a higher-rate taxpayer. In this case, the family will lose 9% of their disposable income from these cuts. Couple, 2 children aged 4 and 7, man working full-time and earning £45,000, woman not in paid work
Net weekly income April 2010 £648.81 April 2012 £625.02 April 2014 £592.50
The family will gain thanks to:
• Changes to employees national insurance
The family will lose thanks to: • Changes to the higher-rate threshold in income tax • The removal of the family element of the child tax credit once the per child elements
have been withdrawn • The removal of child benefit from higher-rate taxpaying families
Net losers - Family Four This working family’s loss in income illustrates the impact of, amongst other things, the changes to the Childcare element of Working Tax Credit. Overall this family stands to lose from the reforms. Couple, children aged 1 and 3, man works full-time and earns £30,000 a year, woman works 16 hours/wk and earns £9,000 a year, spend £150 a week on formal childcare
Net weekly income April 2010 £660.96 April 2012 £639.42 April 2014 £633.59
The family will gain thanks to:
• Above-inflation increase in per child element of child tax credit • Increase in income tax personal allowance • Changes to employees national insurance
The family will lose thanks to:
• The higher withdrawal rate in tax credits • The freeze in child benefit and some elements of the WTC • The change of indexation rules for benefits and tax credits • The cut in the generosity of the childcare element of the WTC
measured by the RPI to be higher than the CPI and the AEI in September 2011, and both the RPI and CPI will be greater than 2.5%.

Tax and Benefits for families
© Family and Parenting Institute 2010 21
Net losers - Family Five Couple, child aged 15, man had received Employment and Support Allowance for at least 12 months, woman works 25 hours/week and earns £10,000 a year While this family gains from the increases in child tax credit, the income tax allowance and changes to employees NI, these gains are offset by losses in tax credits and changes to Employment and Support Allowance. This means that the family loses overall from the package of reforms.
Net weekly income April 2010 £332.42 April 2012 £290.74 April 2014 £286.85
The family will gain thanks to:
• Above-inflation increase in per child element of child tax credit • Increase in income tax personal allowance • Changes to employees national insurance
The family will lose thanks to:
• The higher withdrawal rate in tax credits • The freeze in child benefit and some elements of the WTC • The change of indexation rules for benefits and tax credits • The time-limiting of contributory ESA

Tax and Benefits for families
© Family and Parenting Institute 2010 22
Appendix One:
Sources for ‘Impact in Numbers’ tables
Analysis in the sections looking at the impact in numbers of different benefit reforms was drawn primarily from the following data sources. Any additional sources specific to particular reforms have been individually footnoted within the tables.
• Tax Credit claimant numbers and break down of elements of tax credits were sourced from HMT’s Personal Tax Credit Quarterly Statistical Bulletin found here: http://www.hmrc.gov.uk/stats/personal-tax-credits/cwtc-quarterly-stats.htm
• Claimant numbers and average weekly claims for all benefits, including Child Benefit, as
well as basic state pension and pension credits were calculated using the DWP’s tabulation tool, which made it possible to break down different benefit claimant groups and analyse them accordingly. The Tabulation tool can be accesses here: http://83.244.183.180/100pc/tabtool.html
• Further Child Benefit statistics, including geographical and demographic breakdowns,
were sourced from HMRC’s statistical bulletin, here: http://www.hmrc.gov.uk/stats/child_benefit/chb-geog-aug09.pdf
• Data on housing benefit take up and demographic breakdown was sourced from DWP’s
statistical bulletin, here: http://research.dwp.gov.uk/asd/index.php?page=hbctb
• The losses associated with housing benefit reform were taken from DWP’s impact assessment modelling here: http://www.dwp.gov.uk/docs/impacts-of-hb-proposals.pdf
• All benefit rates were taken from www.directgov.uk, used by Government to publish
latest benefits and tax credits information.
• Forward estimations of RPI/CPI to calculate losses of upratings were drawn from Office for Budget Responsibility’s June 2010 forecast. These Q3 figures are used by the DWP as the basis for their uprating; the OBR forecasts state explicitly that they are the forecasts used in the ‘Emergency’ June Budget. http://budgetresponsibility.independent.gov.uk/d/pre_budget_forecast_140610.pdf

Tax and Benefits for families
© Family and Parenting Institute 2010 23
Appendix Two:
Additional hypothetical family examples
Family Six:
Lone parent, child aged 8, working 10 hours/wk at £6/hour, no spending on childcare (annual earnings £3,120)
Net weekly income April 2010 £165.84 April 2012 £166.53 April 2014 £164.06
The family will gain thanks to:
• Above-inflation increase in per child element of child tax credit The family will lose thanks to:
• The freeze in child benefit • The change of indexation rules for benefits and tax credits
Family Seven: Lone parent, children aged 6 and 8, working 15 hours/wk at £11.54/hour (annual earnings £9,000), no spending on childcare
Net weekly income April 2010 £293.35 April 2012 £305.31 April 2014 £301.34
The family will gain thanks to:
• Above-inflation increase in per child element of child tax credit • Increase in income tax personal allowance • Changes to employees national insurance
The family will lose thanks to: • The freeze in child benefit • The change of indexation rules for benefits and tax credits
Family Eight: Couple, children aged 2, 4, 6, neither in work
Net weekly income April 2010 £298.40 April 2012 £304.02 April 2014 £298.08
The family will gain thanks to:
• Above-inflation increase in per child element of child tax credit •
The family will lose thanks to: • The freeze in child benefit

Tax and Benefits for families
© Family and Parenting Institute 2010 24
• The change of indexation rules for benefits and tax credits Family Nine: Couple, three teenage children, man working full-time and earning £20,000 a year, woman working 25 hours a week and earning £9,000 a year
Net weekly income April 2010 £540.90 April 2012 £542.99 April 2014 £535.61
The family will gain thanks to:
• Above-inflation increase in per child element of child tax credit • Increase in income tax personal allowance • Changes to employees national insurance
The family will lose thanks to: • The higher withdrawal rate in tax credits • The freeze in child benefit and some elements of the WTC • The change of indexation rules for benefits and tax credits
Family Ten: Couple, 2 children aged 9 and 11, each working part-time and earning £13,000 (£16.60 an hour for 15 hours/wk), and both caring for their own parents47
Net weekly income April 2010 £450.18 April 2012 £452.08 April 2014 £446.73
The family will gain thanks to:
• Above-inflation increase in per child element of child tax credit • Increase in income tax personal allowance • Changes to employees national insurance
The family will lose thanks to: • The higher withdrawal rate in tax credits • The freeze in child benefit and some elements of the WTC48 • The change of indexation rules for benefits and tax credits
Family Eleven: Pensioner couple, woman has entitlement to state pension in own right, private pension income of £300/wk (£15,600 a year)
Net weekly income April 2010 £434.47 April 2012 £431.98 April 2014 £431.26
The family will lose thanks to: 47 Note that this is not relevant for the entitlement to benefits and tax credits: neither is assumed to claim Carers Allowance. 48 The family is not entitled to the WTC, but the freeze in elements of the WTC affects the point at which the CTC starts to be withdrawn, which does affect this family.

Tax and Benefits for families
© Family and Parenting Institute 2010 25
• The change of indexation rules for the basic state pension49 • The fallback in the level of winter fuel payments.
49 The previous government uprated the state pension in line with RPI or 2.5%, whichever was higher. The coalition Government will uprate the state pension with the greatest of CPI, AEI and 2.5%. The OBR current expect inflation measured by the RPI to be higher than the CPI and the AEI in September 2011, and both the RPI and CPI will be greater than 2.5%.