Embed Size (px)
Citation preview

MOVING THE SOUTH FORWARD IN THE NEW REALITY: A POST-ELECTION FUNDER BRIEFING
Welcome!
LaTosha BrownProject DirectorGrantmakers for Southern Progress Neighborhood Funders Group
Chantelle Fisher-BorneProject DirectorOut in the South Initiative Funders for LGBTQ Issues
The Southern Context: Perspectives from a long-time Southern social justice funder
Justin MaxsonExecutive DirectorMary Reynolds Babcock Foundation
Today’s Moderator

Page GleasonExecutive DirectorPro-Georgia
Chris Kromm Executive DirectorInstitute for Southern Studies
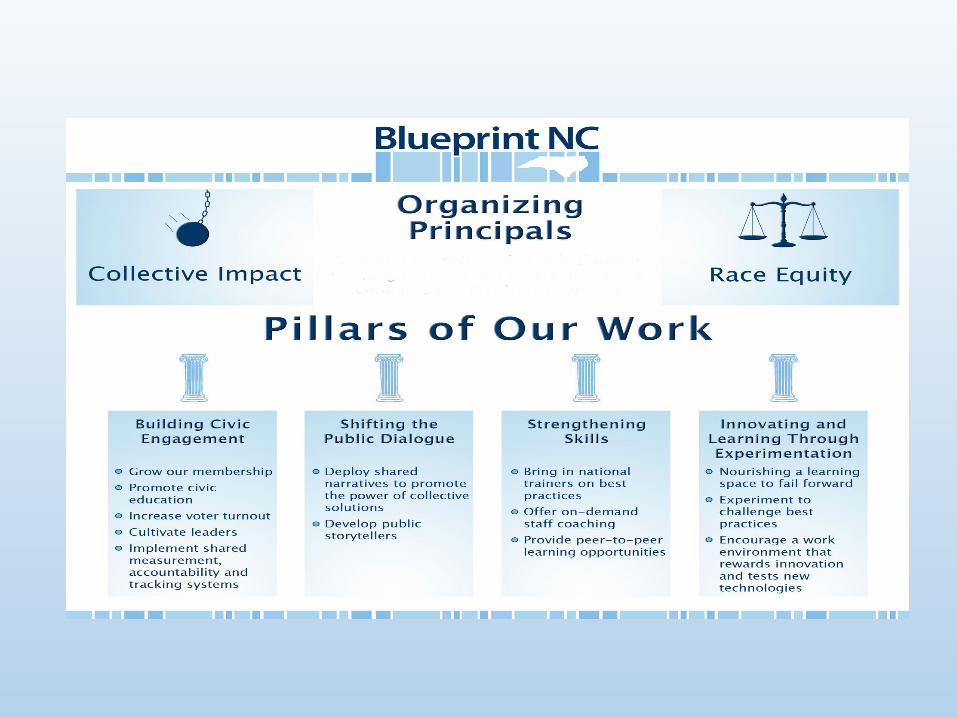
Erin ByrdExecutive Director Blueprint NC
Paulina Helm-HernandezCo-DirectorSoutherners on New Ground (SONG)
Monica HernandezExecutive DirectorSoutheast Immigrant Rights Network
Today’s Panelists
Multi-state analysis of election results in the South
Chris Kromm Executive DirectorInstitute for Southern Studies
THE SOUTH & 2016 ELECTIONS
Chris KrommDecember 2016

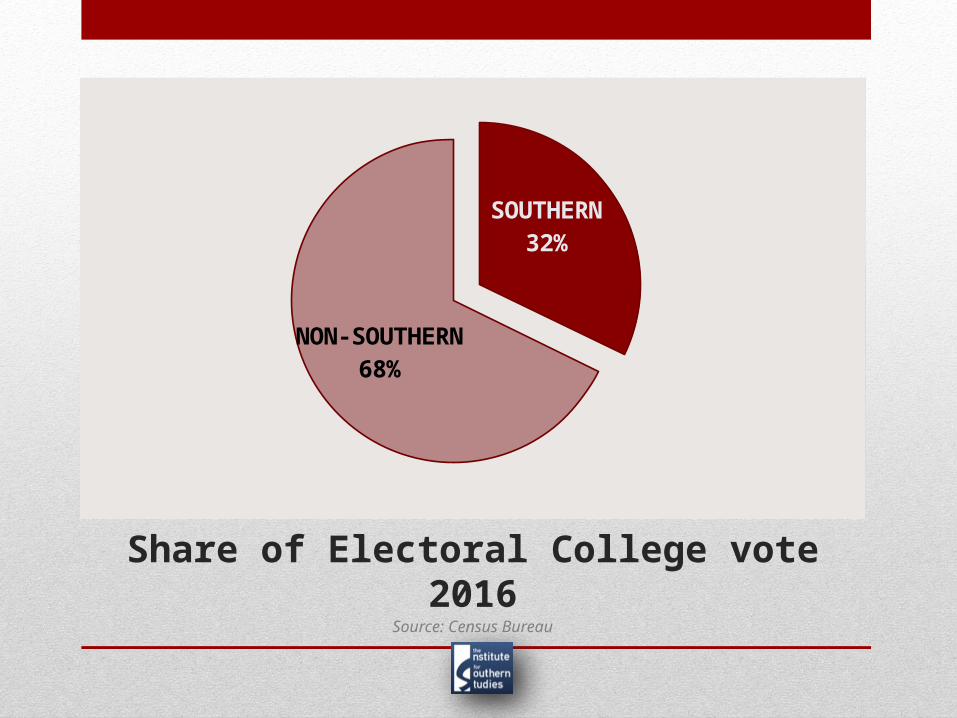
Share of Electoral College vote 2016
SOUTHERN32%
NON-SOUTHERN
68%
Source: Census Bureau
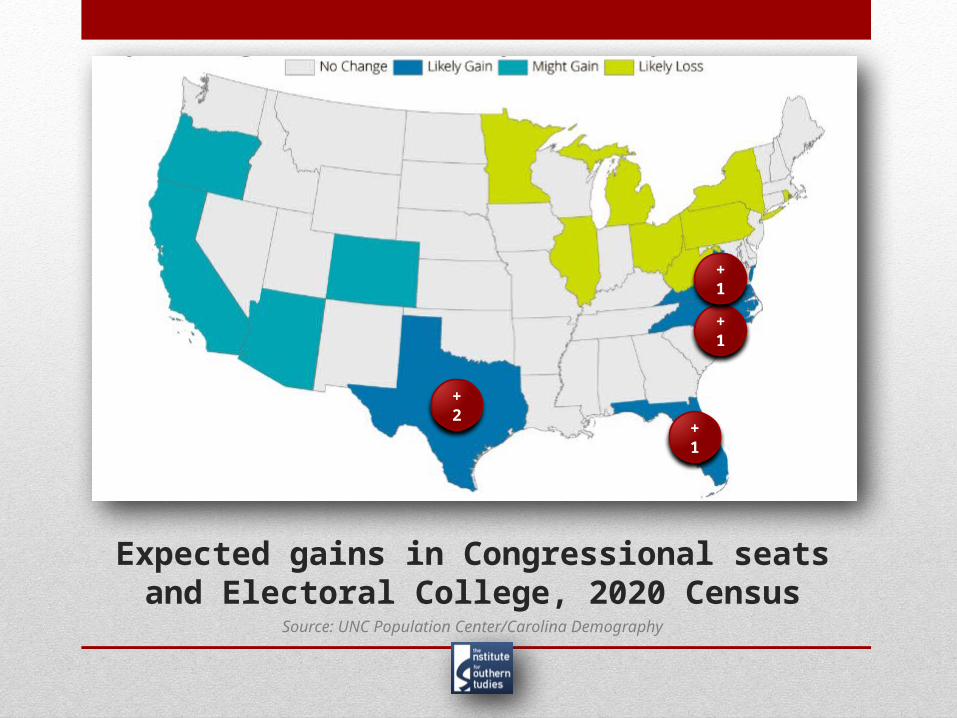
Expected gains in Congressional seats and Electoral College, 2020 Census
Source: UNC Population Center/Carolina Demography
+2
+1
+1
+1
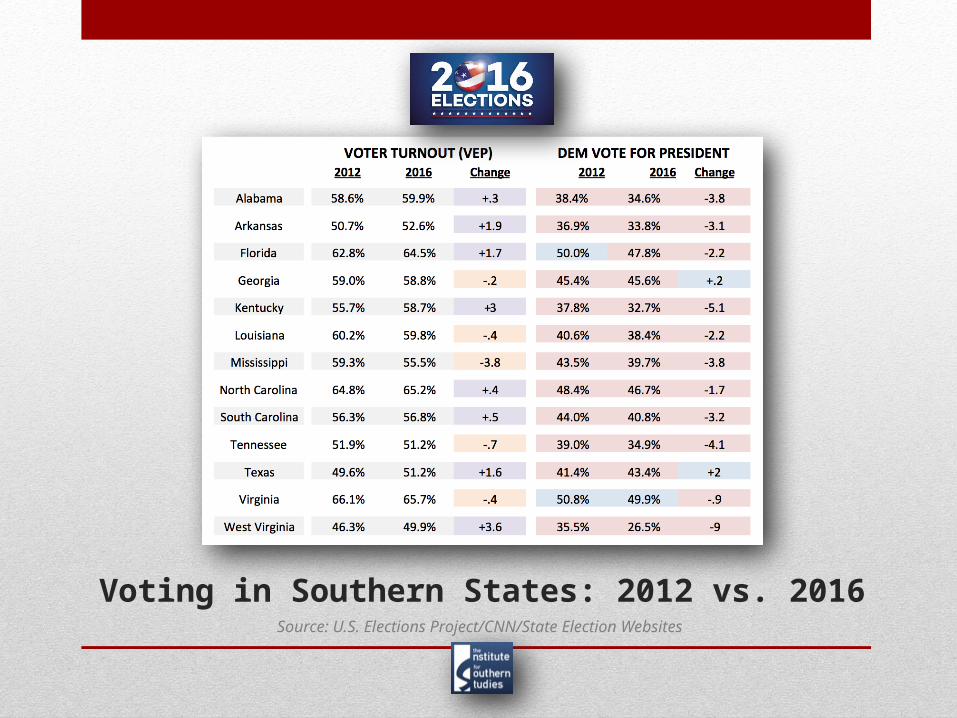
Voting in Southern States: 2012 vs. 2016Source: U.S. Elections Project/CNN/State Election Websites
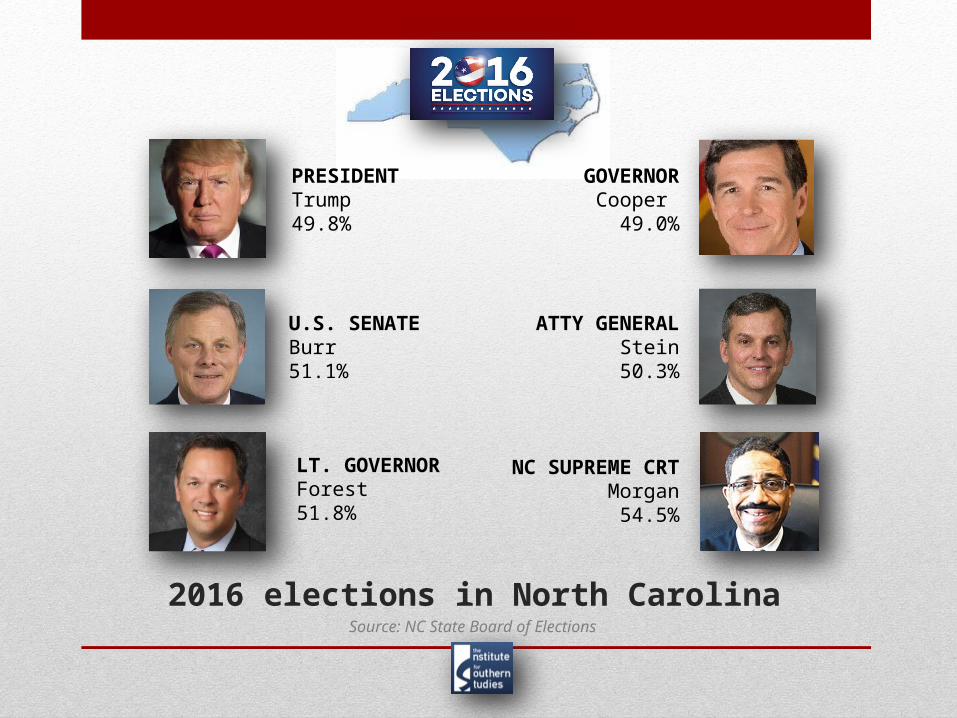
2016 elections in North CarolinaSource: NC State Board of Elections
PRESIDENTTrump 49.8%
U.S. SENATEBurr 51.1%
GOVERNORCooper
49.0%
ATTY GENERALStein
50.3%
NC SUPREME CRTMorgan54.5%
LT. GOVERNORForest51.8%
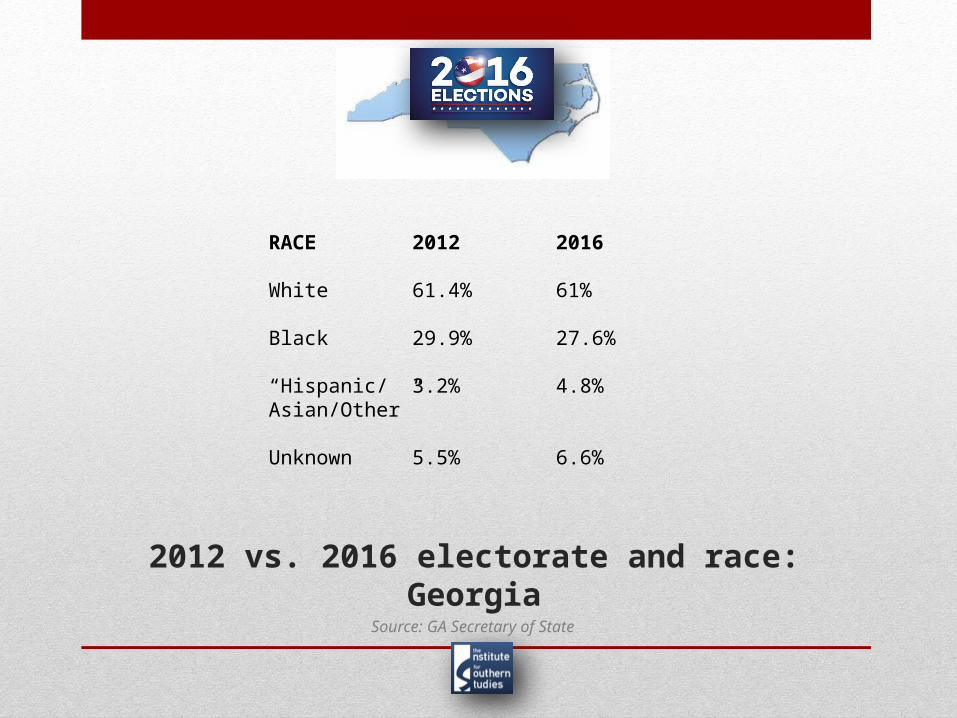
2012 vs. 2016 electorate and race: Georgia
Source: GA Secretary of State
RACE 2012 2016
White 61.4% 61%
Black 29.9% 27.6%
“Hispanic/ 3.2% 4.8%Asian/Other”
Unknown 5.5% 6.6%
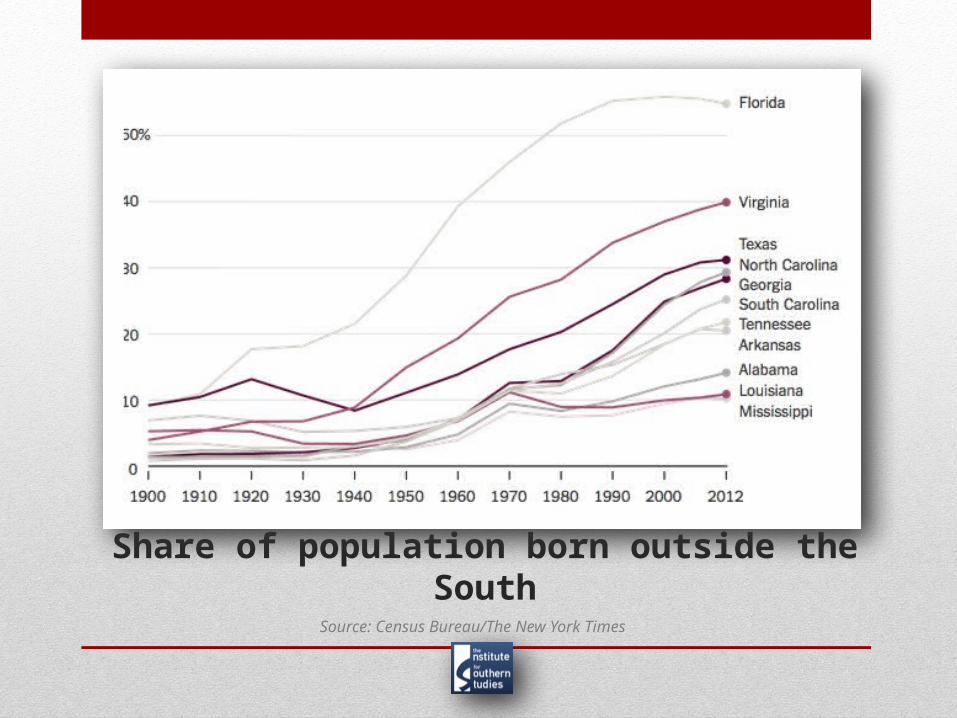
Share of population born outside the South
Source: Census Bureau/The New York Times
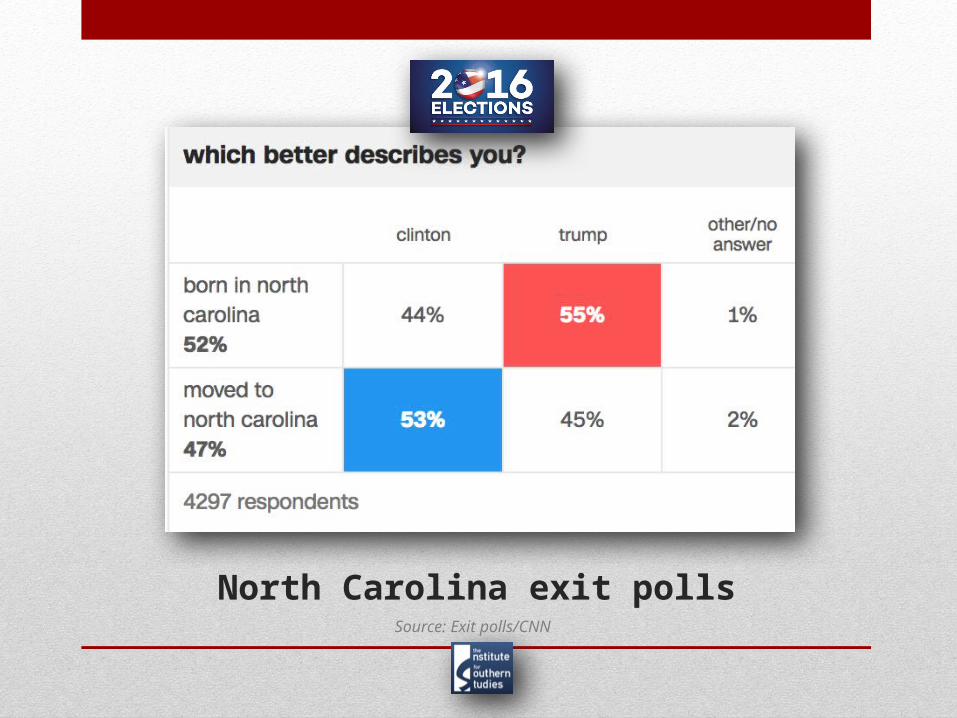
North Carolina exit pollsSource: Exit polls/CNN
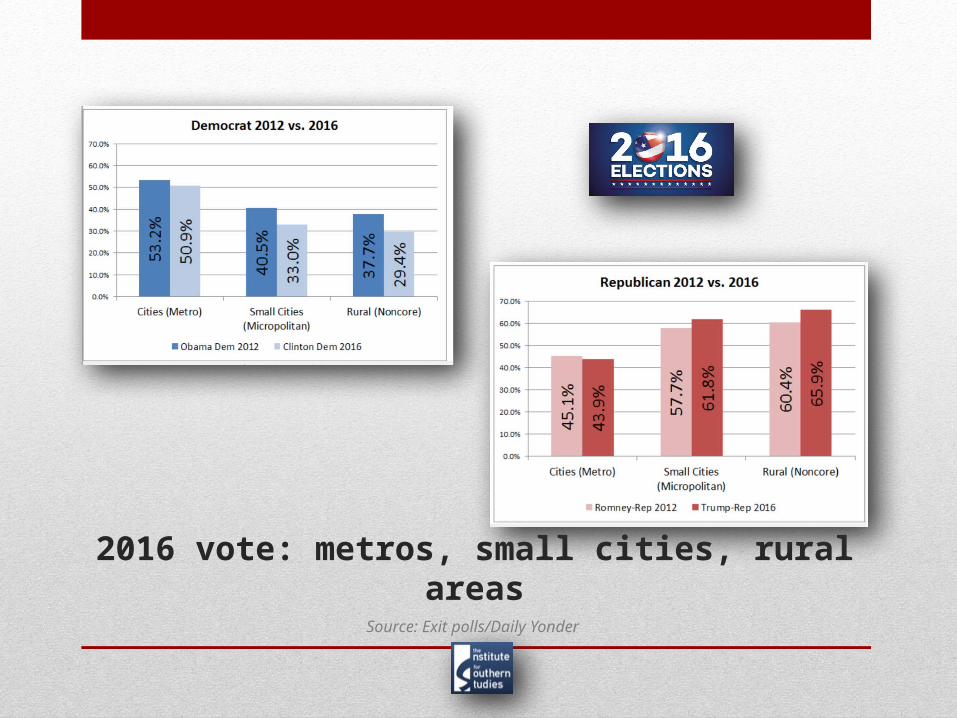
2016 vote: metros, small cities, rural areas
Source: Exit polls/Daily Yonder
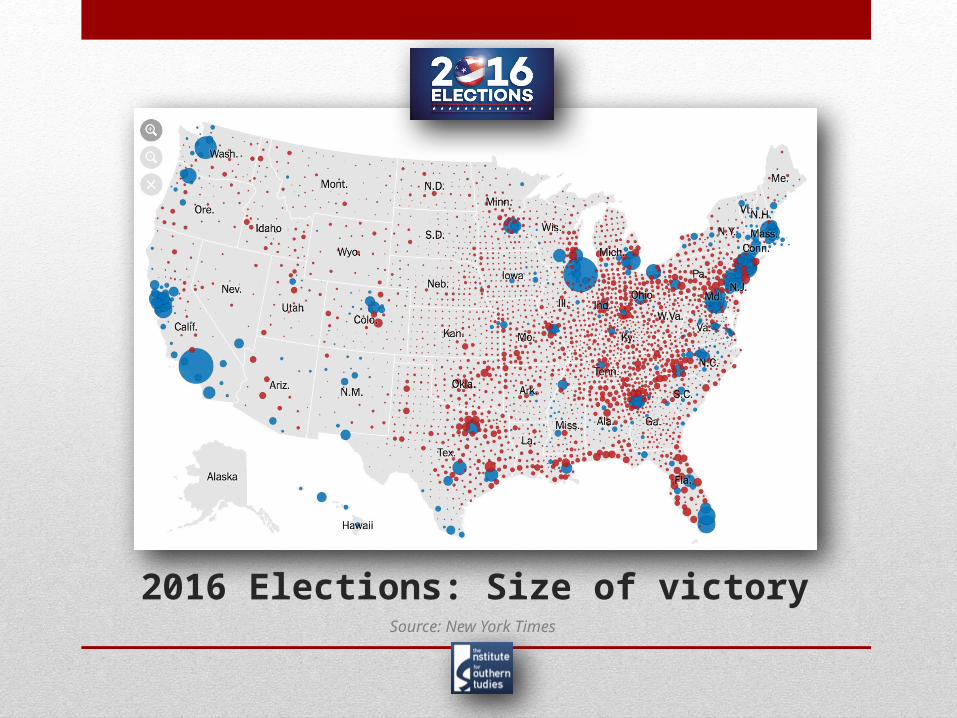
2016 Elections: Size of victorySource: New York Times
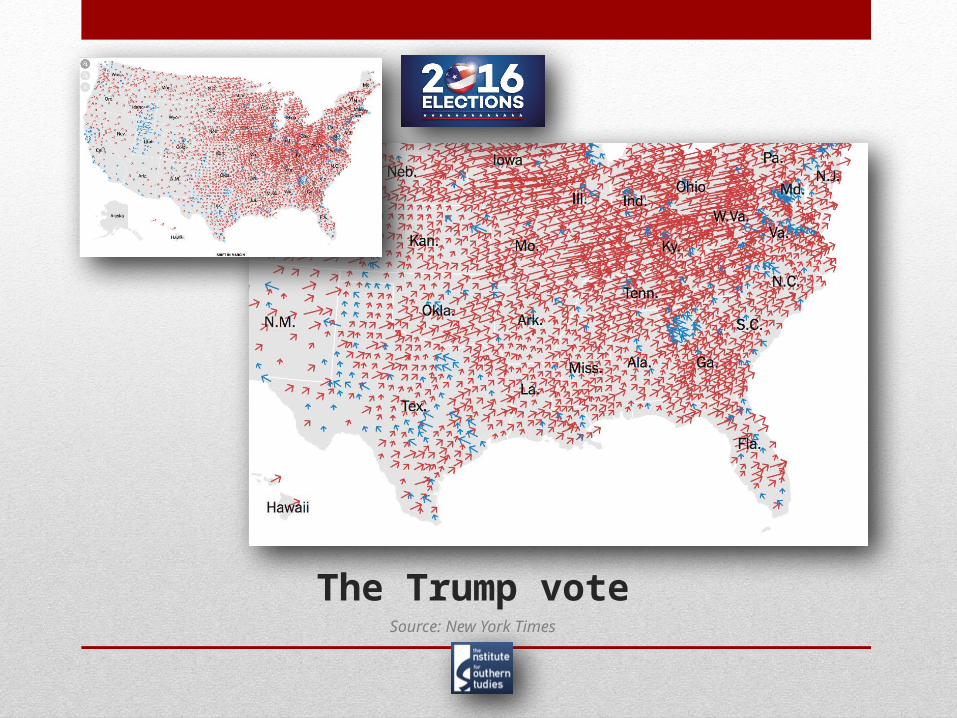
The Trump voteSource: New York Times
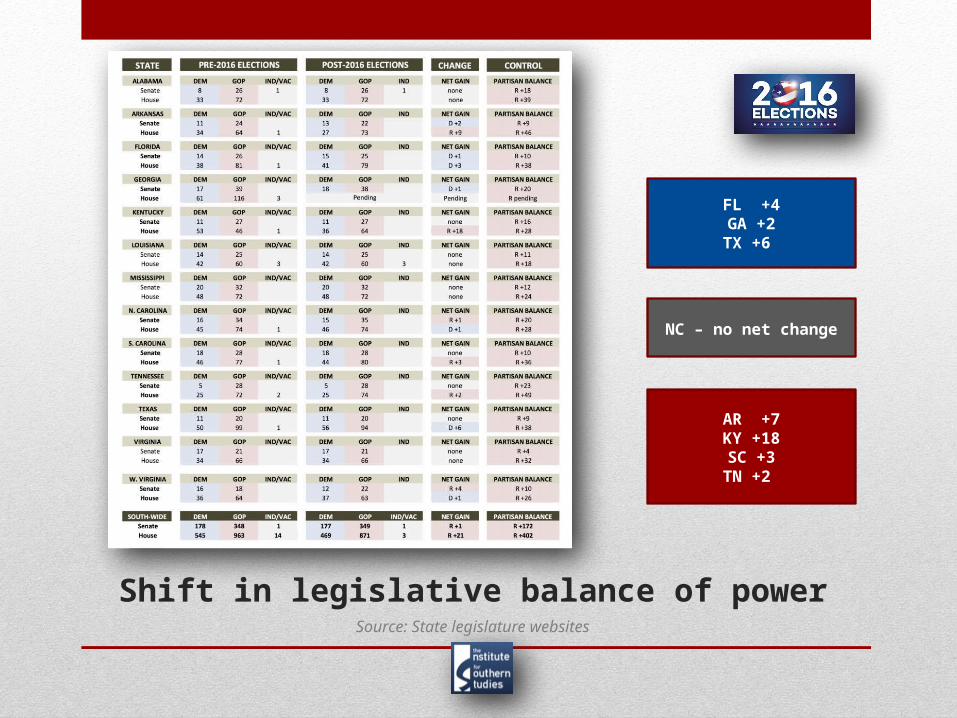
Shift in legislative balance of powerSource: State legislature websites
FL +4GA +2TX +6
NC – no net change
AR +7KY +18SC +3TN +2
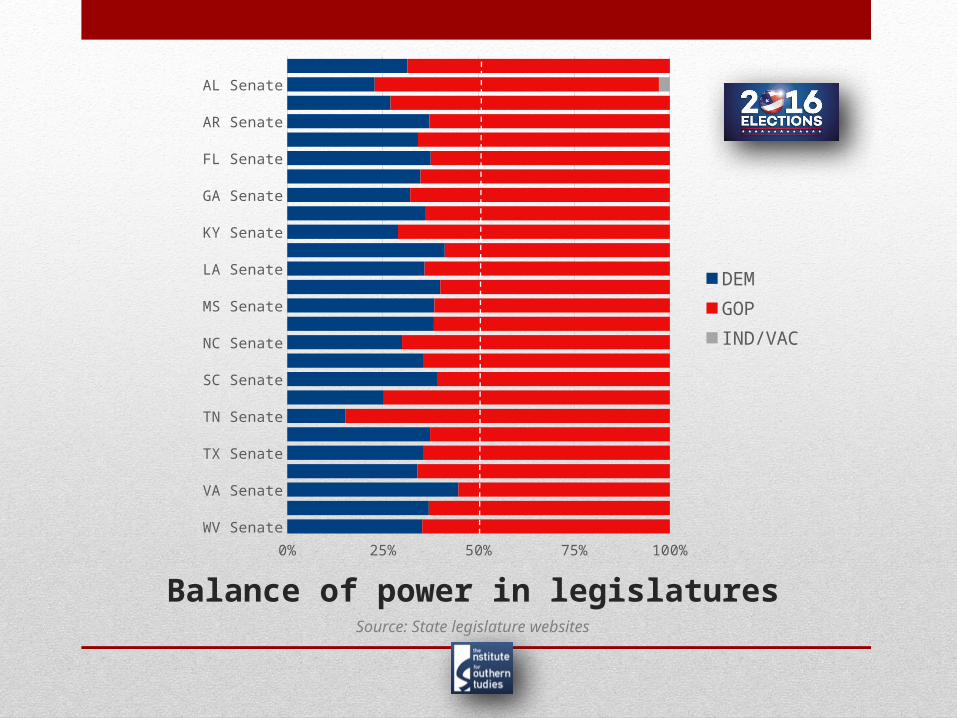
Balance of power in legislaturesSource: State legislature websites
WV Senate
VA Senate
TX Senate
TN Senate
SC Senate
NC Senate
MS Senate
LA Senate
KY Senate
GA Senate
FL Senate
AR Senate
AL Senate
0% 25% 50% 75% 100%
DEMGOPIND/VAC
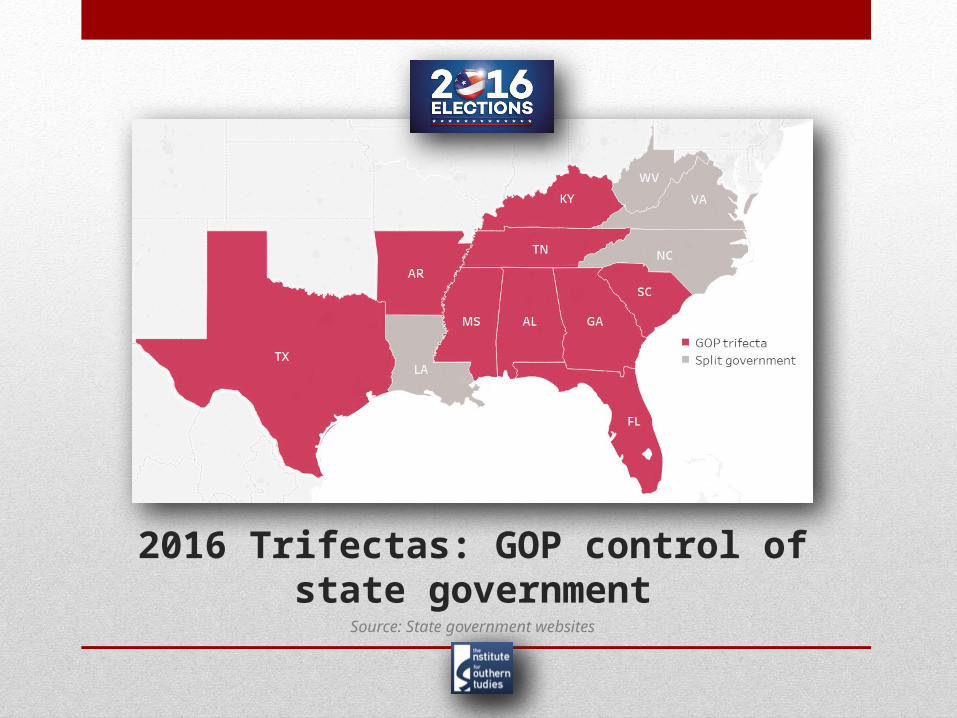
2016 Trifectas: GOP control of state government
Source: State government websites
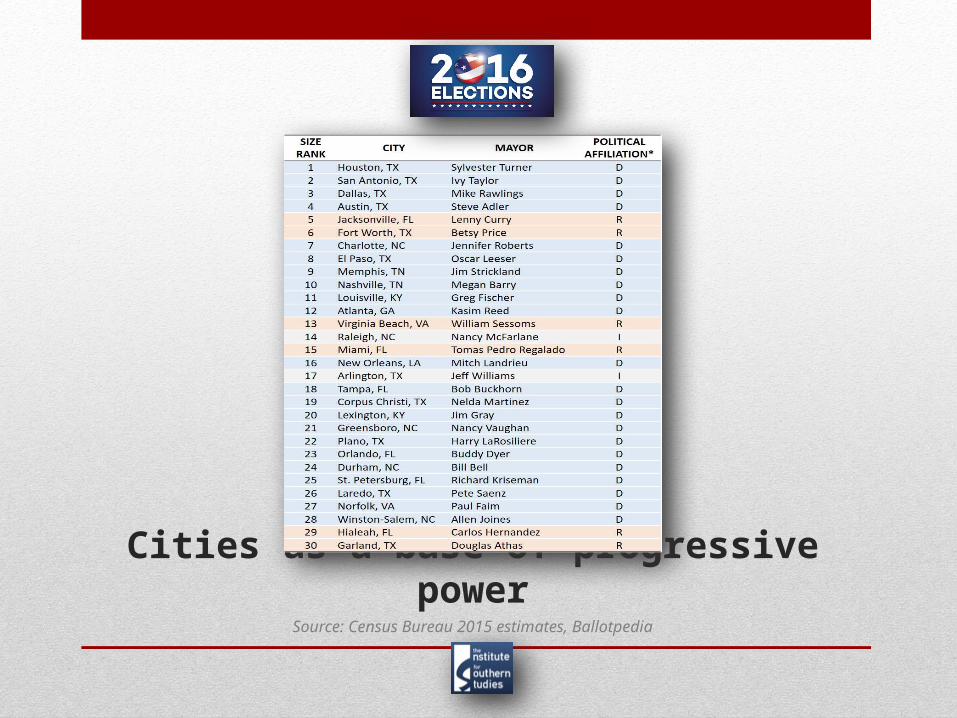
Cities as a base of progressive power
Source: Census Bureau 2015 estimates, Ballotpedia
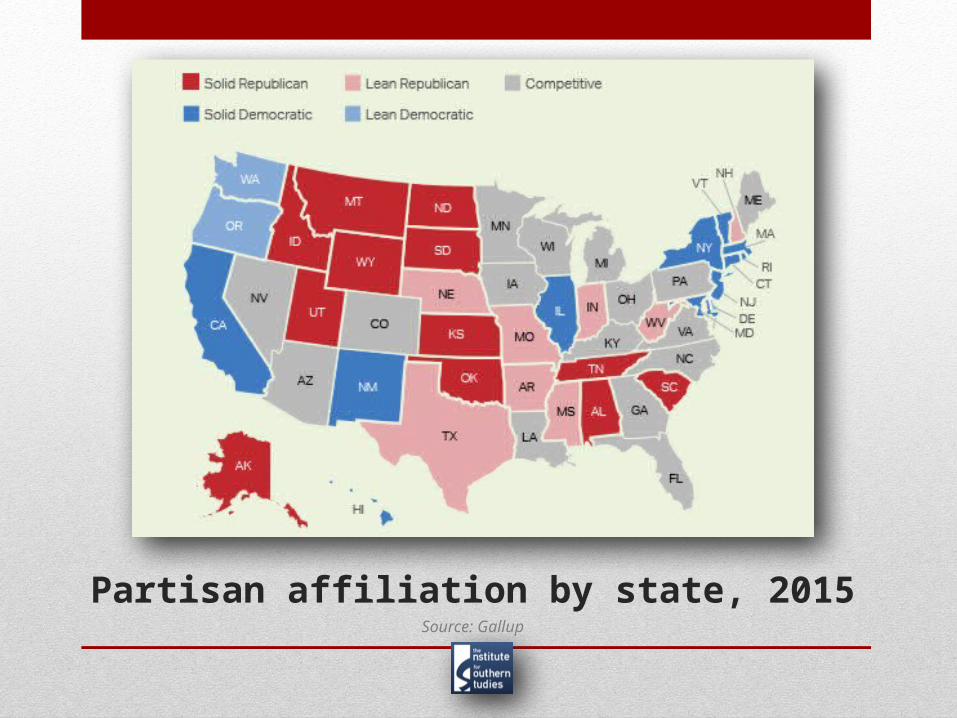
Partisan affiliation by state, 2015Source: Gallup
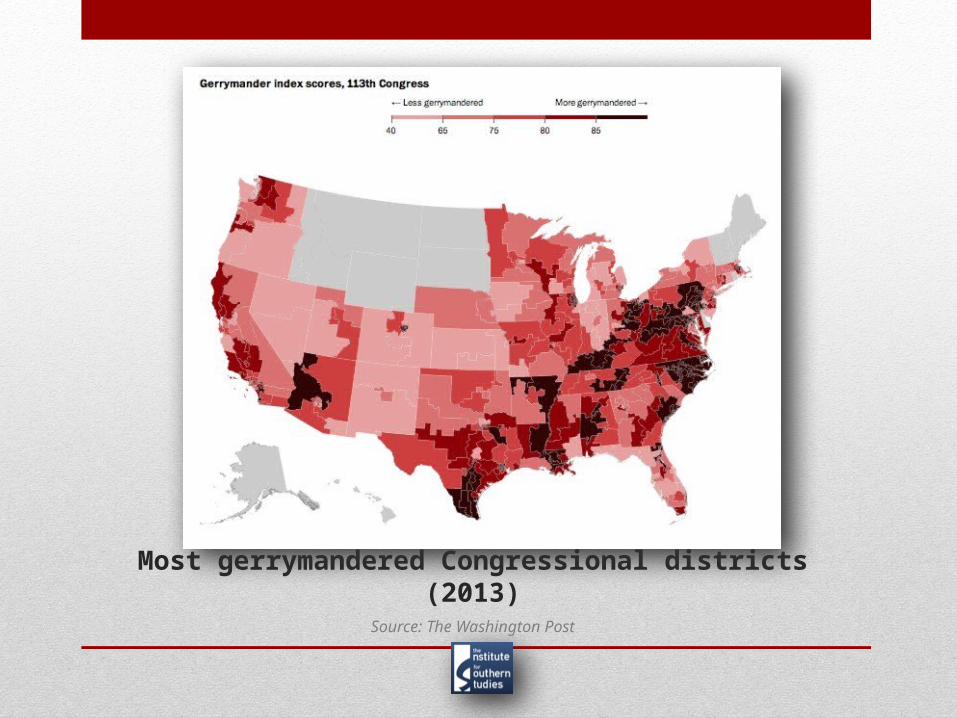
Most gerrymandered Congressional districts (2013)
Source: The Washington Post
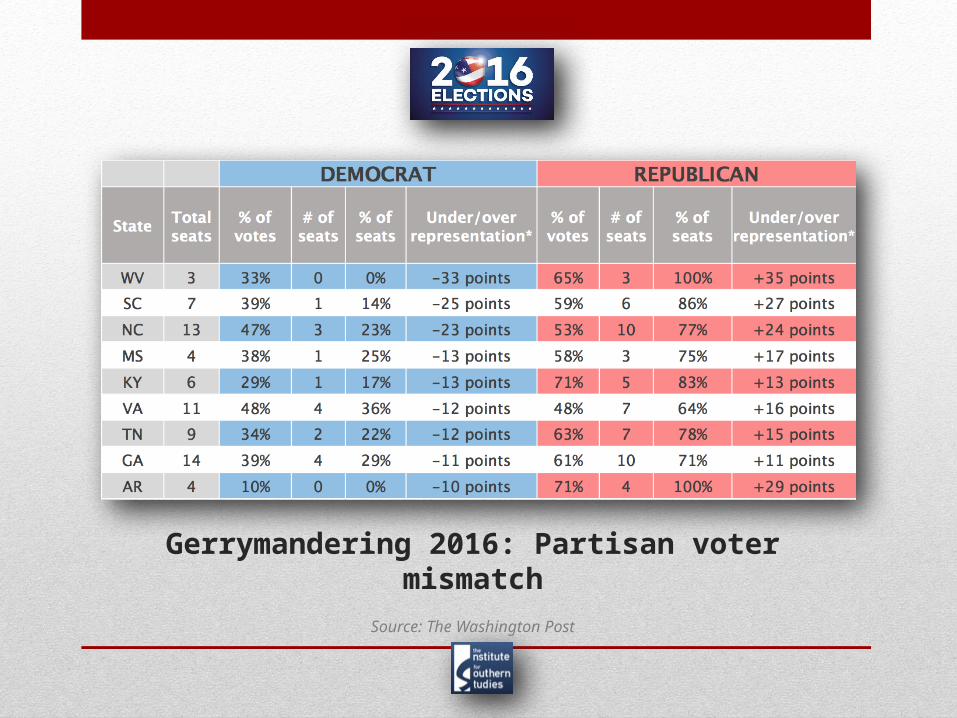
Gerrymandering 2016: Partisan voter mismatch
Source: The Washington Post
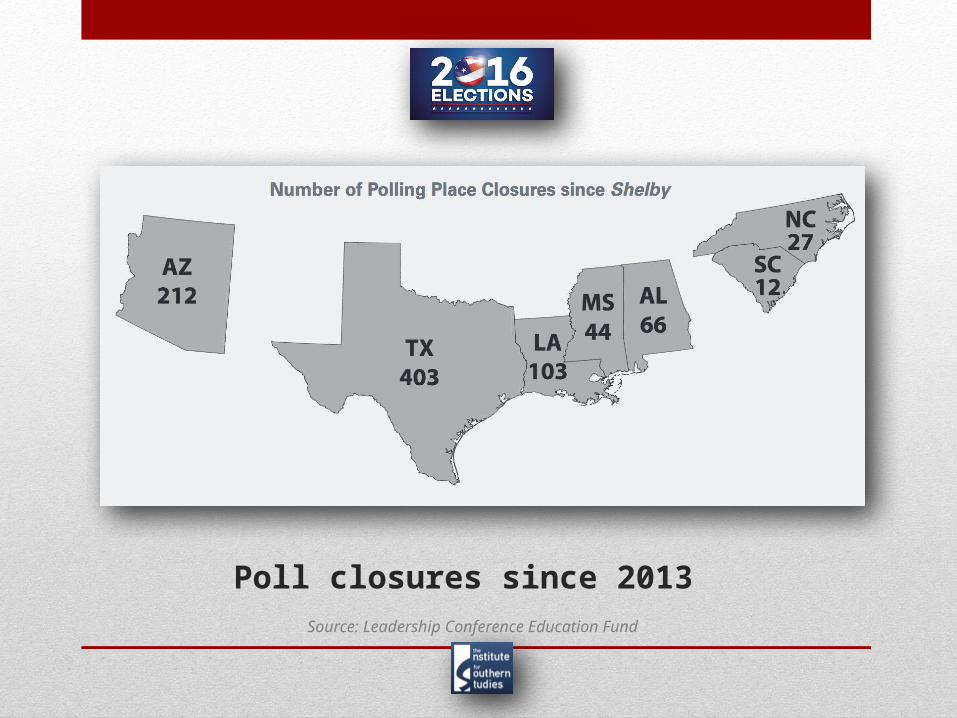
Poll closures since 2013 Source: Leadership Conference Education Fund
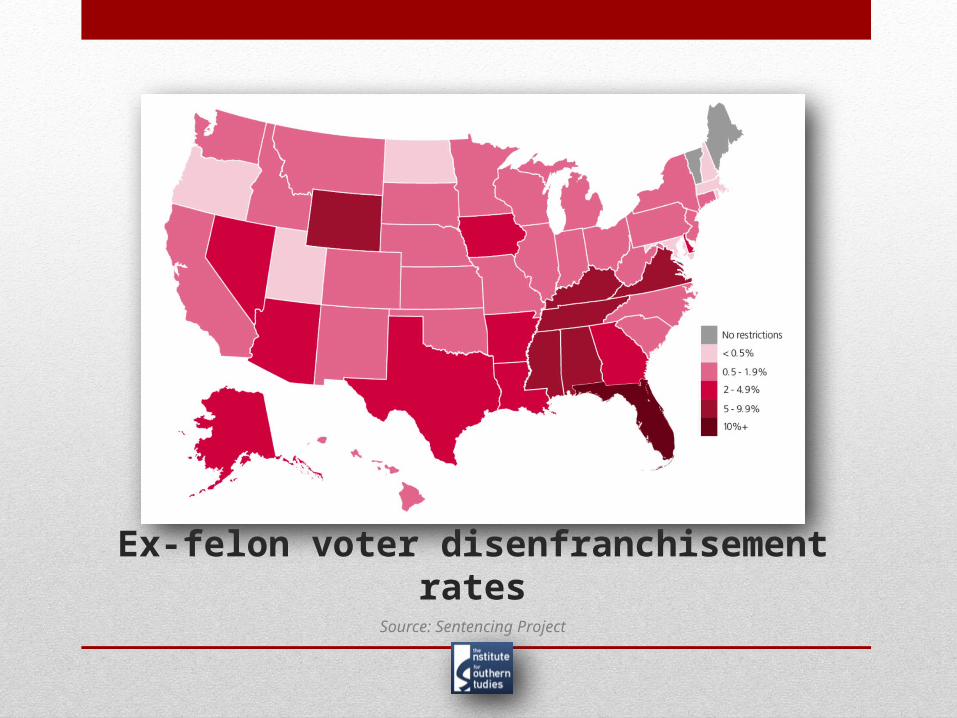
Ex-felon voter disenfranchisement rates
Source: Sentencing Project
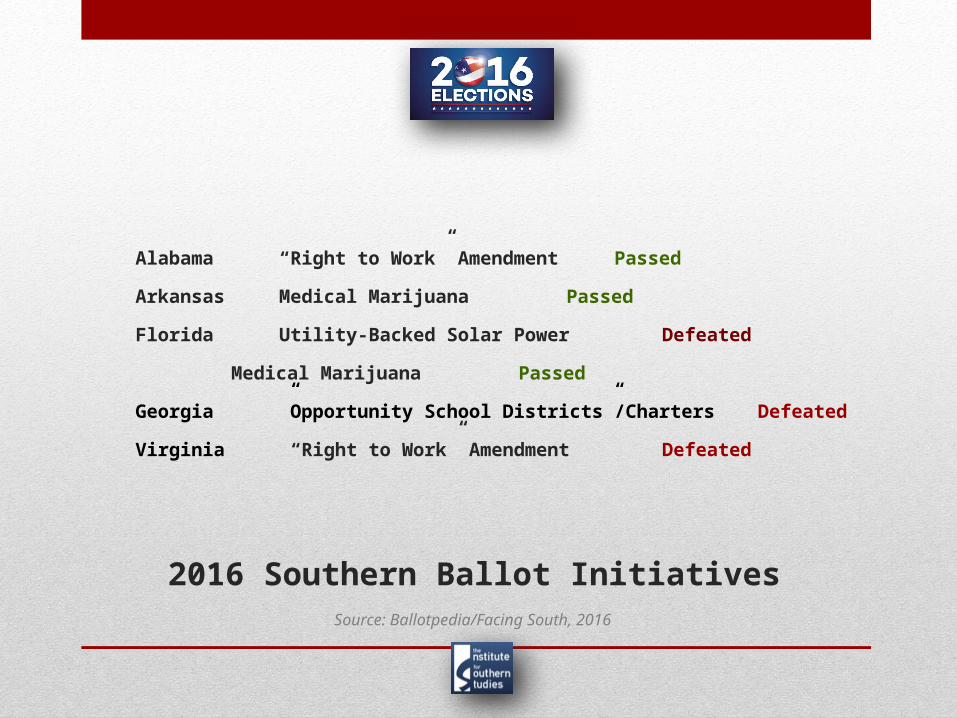
Source: Ballotpedia/Facing South, 2016
Alabama “Right to Work” Amendment Passed
Arkansas Medical Marijuana Passed
Florida Utility-Backed Solar Power Defeated
Medical Marijuana Passed
Georgia ”Opportunity School Districts”/Charters Defeated
Virginia “Right to Work” Amendment Defeated
2016 Southern Ballot Initiatives
Questions or more information
CHRIS KROMM ALLIE YEEExecutive Director/Publisher Associate [email protected] [email protected]@chriskromm @allieyee_nc
INSTITUTE FOR SOUTHERN STUDIESwww.southernstudies.org
FACING SOUTH WEEKLY [email protected] “subscribe” in subject line
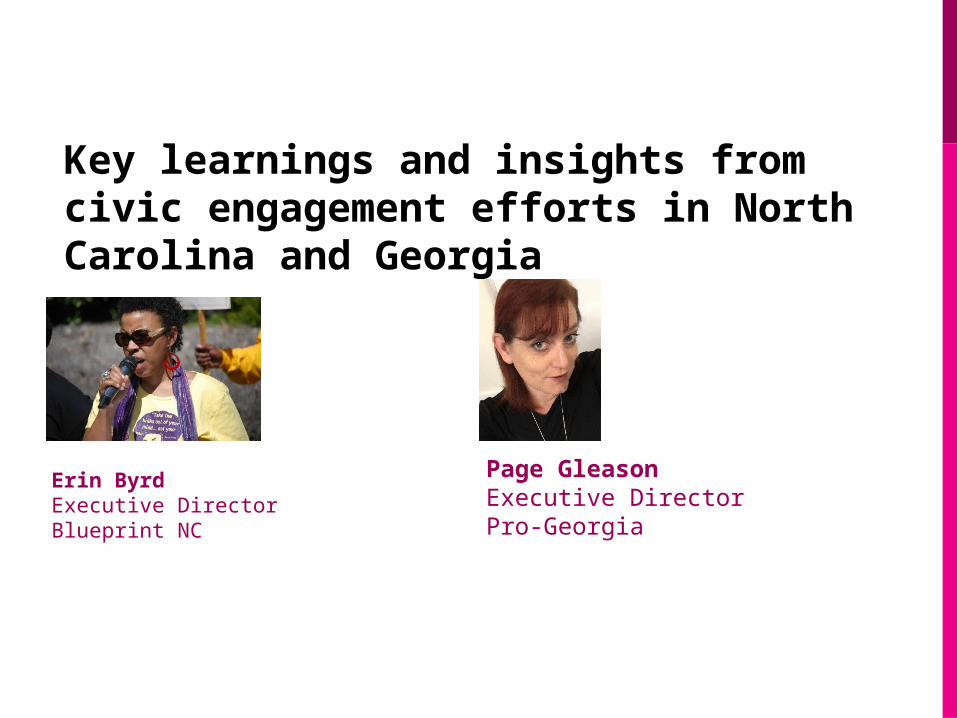
Key learnings and insights from civic engagement efforts in North Carolina and Georgia
Erin ByrdExecutive Director Blueprint NC
Page GleasonExecutive DirectorPro-Georgia

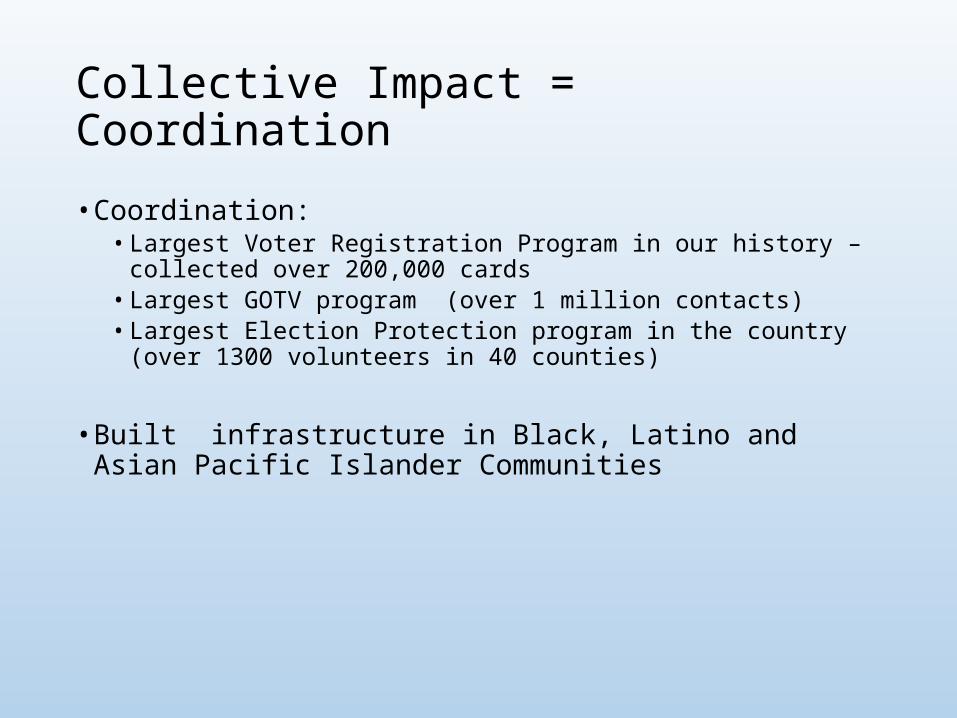
Collective Impact = Coordination
• Coordination: • Largest Voter Registration Program in our history – collected over 200,000
cards• Largest GOTV program (over 1 million contacts) • Largest Election Protection program in the country (over 1300 volunteers in
40 counties)
• Built infrastructure in Black, Latino and Asian Pacific Islander Communities
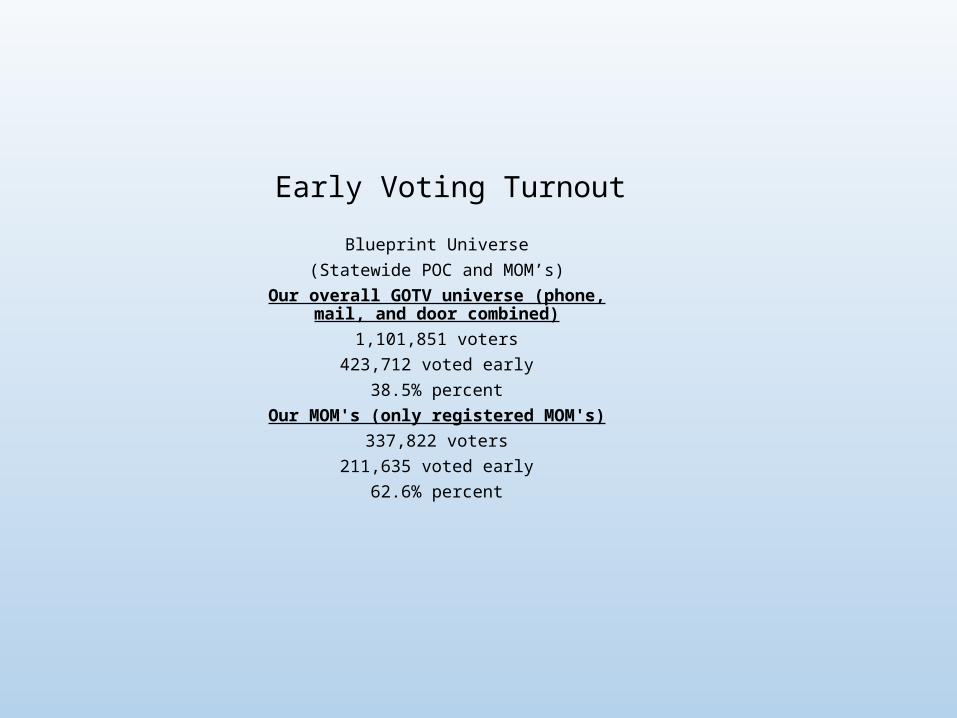
Early Voting TurnoutBlueprint Universe
(Statewide POC and MOM’s)Our overall GOTV universe (phone, mail, and door
combined)1,101,851 voters
423,712 voted early38.5% percent
Our MOM's (only registered MOM's)337,822 voters
211,635 voted early62.6% percent
c
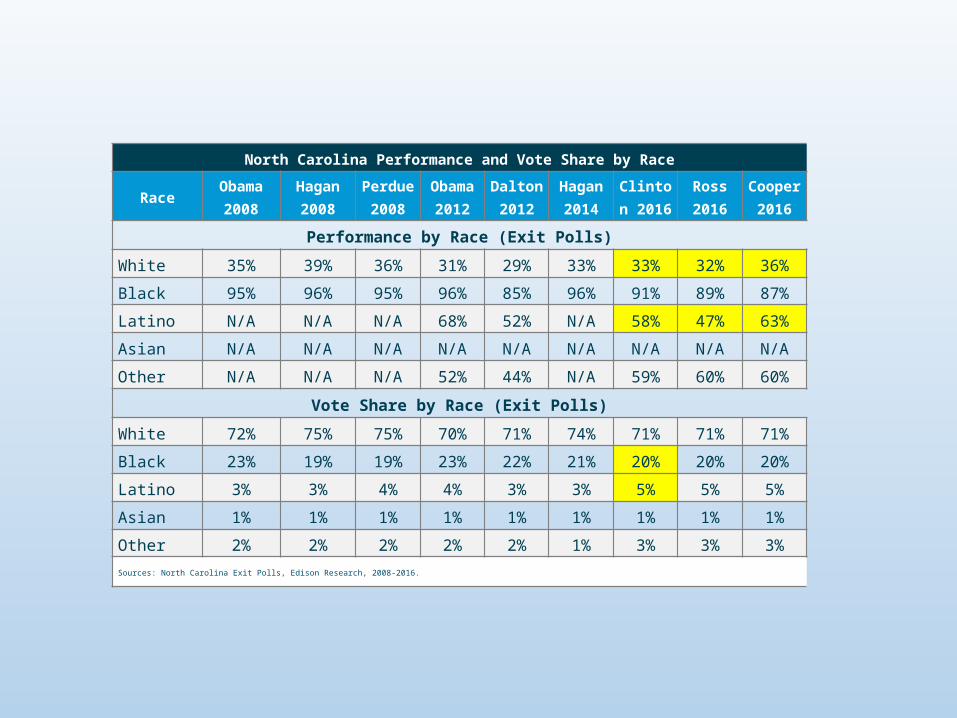
North Carolina Performance and Vote Share by Race
Race Obama 2008
Hagan 2008
Perdue 2008
Obama 2012
Dalton 2012
Hagan 2014
Clinton 2016
Ross 2016
Cooper 2016
Performance by Race (Exit Polls)
White 35% 39% 36% 31% 29% 33% 33% 32% 36%
Black 95% 96% 95% 96% 85% 96% 91% 89% 87%
Latino N/A N/A N/A 68% 52% N/A 58% 47% 63%
Asian N/A N/A N/A N/A N/A N/A N/A N/A N/A
Other N/A N/A N/A 52% 44% N/A 59% 60% 60%
Vote Share by Race (Exit Polls)
White 72% 75% 75% 70% 71% 74% 71% 71% 71%
Black 23% 19% 19% 23% 22% 21% 20% 20% 20%
Latino 3% 3% 4% 4% 3% 3% 5% 5% 5%
Asian 1% 1% 1% 1% 1% 1% 1% 1% 1%
Other 2% 2% 2% 2% 2% 1% 3% 3% 3%Sources: North Carolina Exit Polls, Edison Research, 2008-2016.
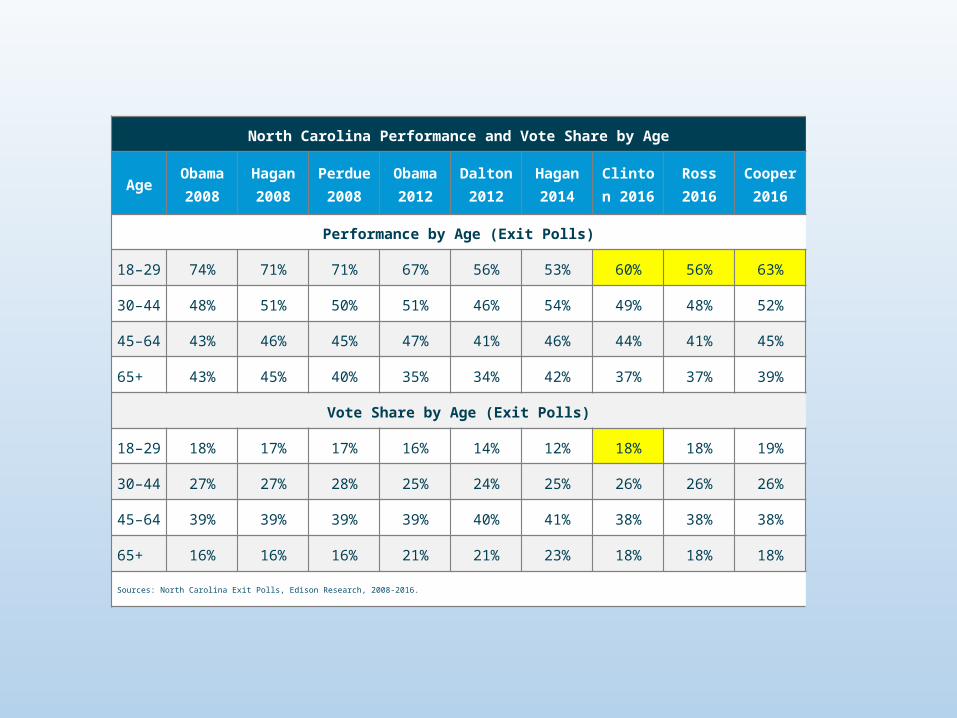
North Carolina Performance and Vote Share by Age
Age Obama 2008
Hagan 2008
Perdue 2008
Obama 2012
Dalton 2012
Hagan 2014
Clinton 2016
Ross 2016
Cooper 2016
Performance by Age (Exit Polls)
18–29 74% 71% 71% 67% 56% 53% 60% 56% 63%
30–44 48% 51% 50% 51% 46% 54% 49% 48% 52%
45–64 43% 46% 45% 47% 41% 46% 44% 41% 45%
65+ 43% 45% 40% 35% 34% 42% 37% 37% 39%
Vote Share by Age (Exit Polls)
18–29 18% 17% 17% 16% 14% 12% 18% 18% 19%
30–44 27% 27% 28% 25% 24% 25% 26% 26% 26%
45–64 39% 39% 39% 39% 40% 41% 38% 38% 38%
65+ 16% 16% 16% 21% 21% 23% 18% 18% 18%
Sources: North Carolina Exit Polls, Edison Research, 2008-2016.
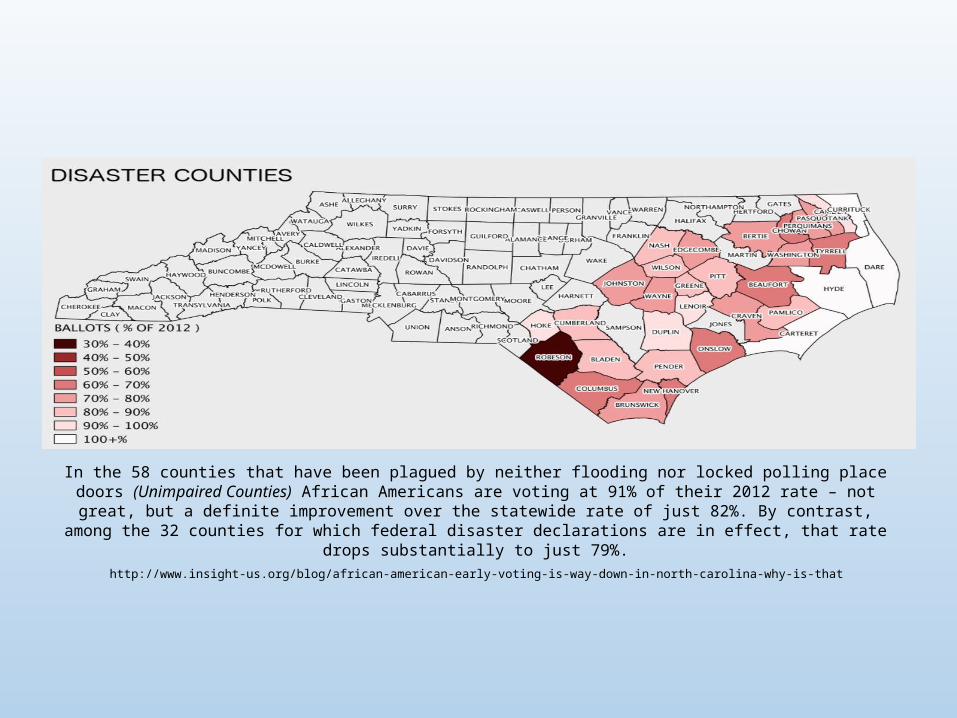
In the 58 counties that have been plagued by neither flooding nor locked polling place doors (Unimpaired Counties) African Americans are voting at 91% of their 2012 rate – not great,
but a definite improvement over the statewide rate of just 82%. By contrast, among the 32 counties for which federal disaster declarations are in effect, that rate drops substantially to just 79%.
http://www.insight-us.org/blog/african-american-early-voting-is-way-down-in-north-carolina-why-is-that
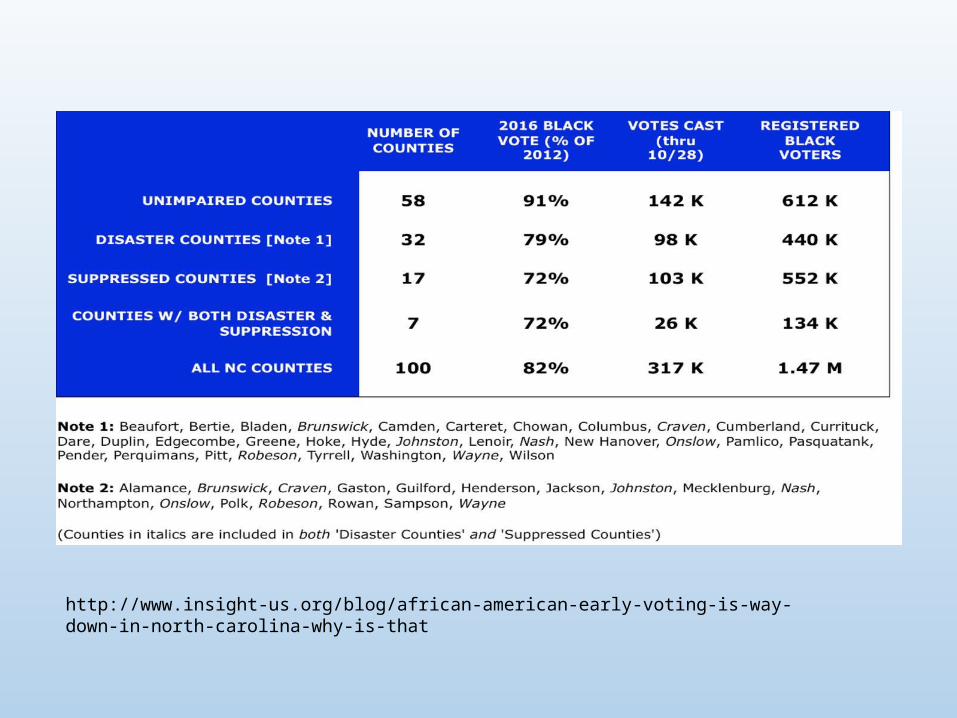
http://www.insight-us.org/blog/african-american-early-voting-is-way-down-in-north-carolina-why-is-that
ProGeorgia
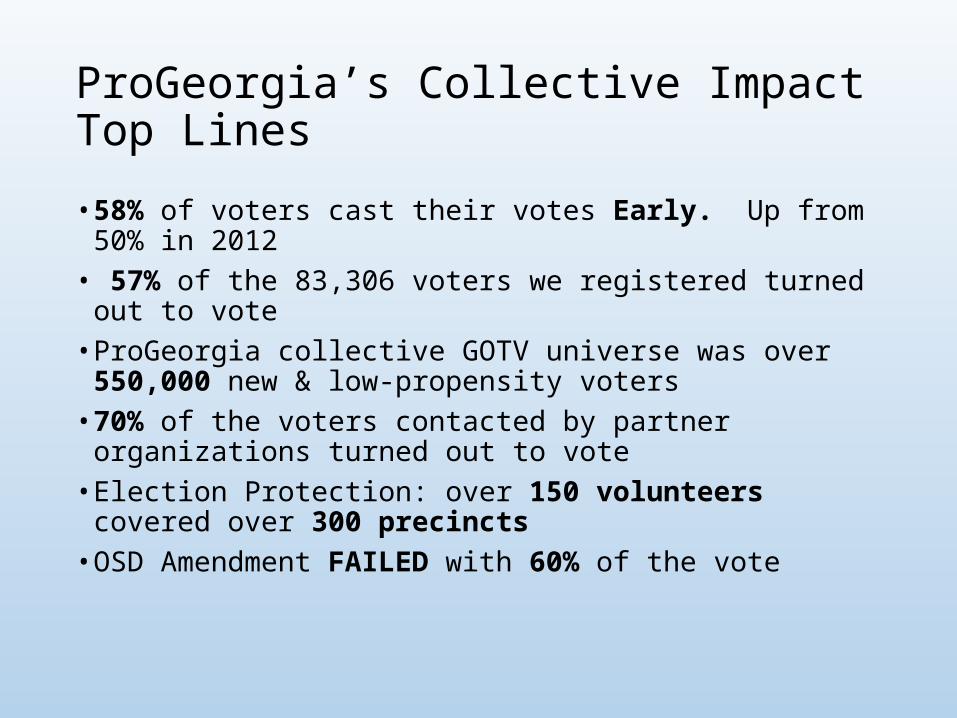
ProGeorgia’s Collective Impact Top Lines• 58% of voters cast their votes Early. Up from 50% in 2012• 57% of the 83,306 voters we registered turned out to vote• ProGeorgia collective GOTV universe was over 550,000 new & low-
propensity voters• 70% of the voters contacted by partner organizations turned out to
vote• Election Protection: over 150 volunteers covered over 300 precincts• OSD Amendment FAILED with 60% of the vote
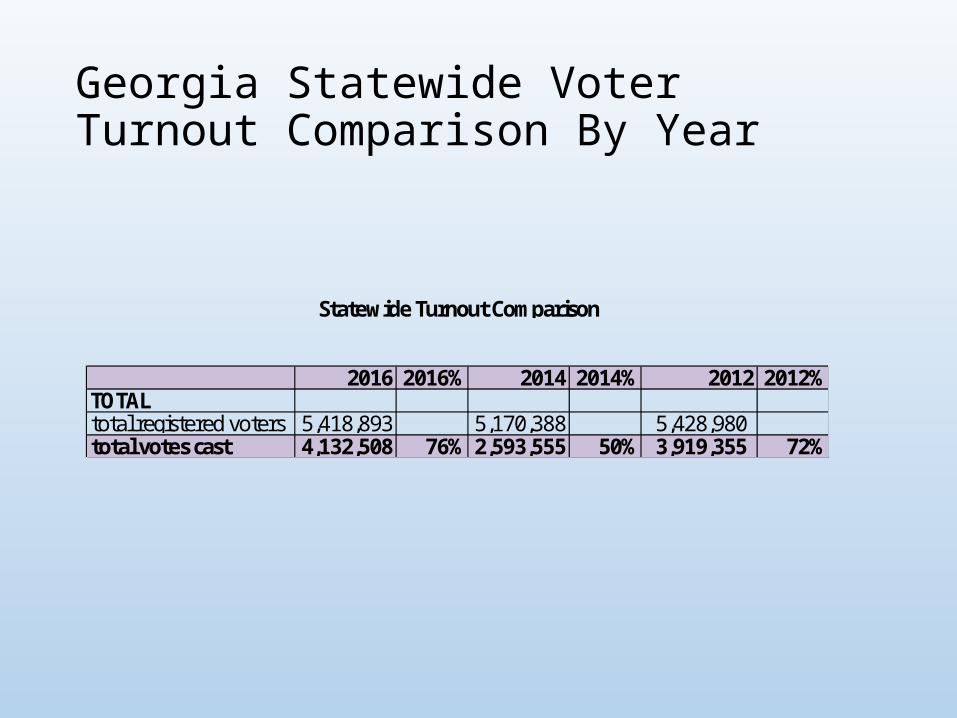
Georgia Statewide Voter Turnout Comparison By Year
2016 2016% 2014 2014% 2012 2012%TOTALtotal registered voters 5,418,893 5,170,388 5,428,980 total votes cast 4,132,508 76% 2,593,555 50% 3,919,355 72%
Statewide Turnout Comparison
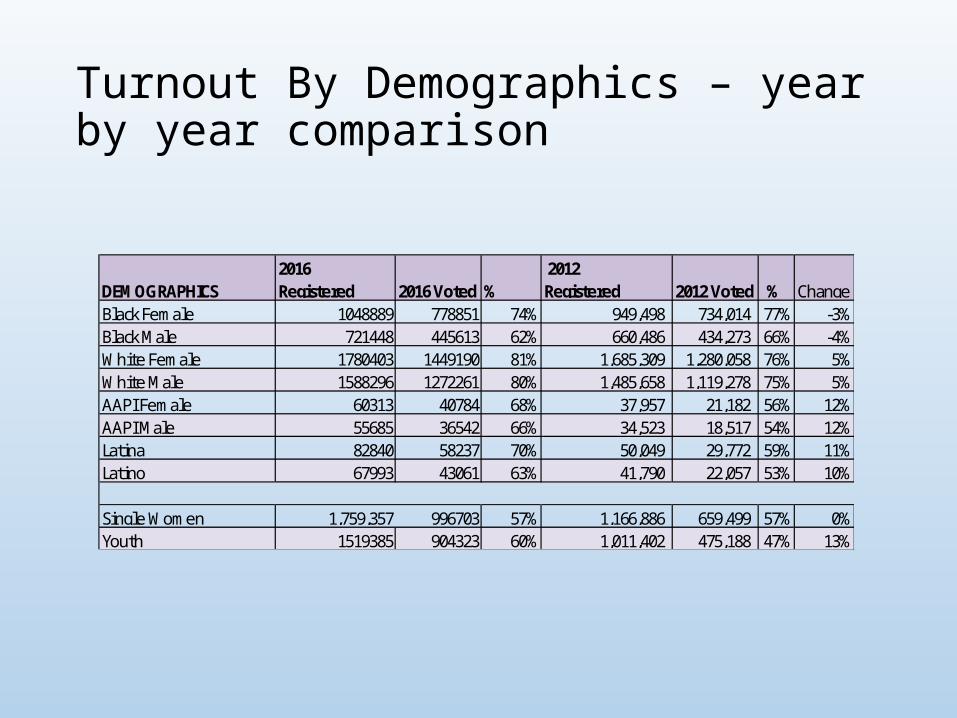
Turnout By Demographics – year by year comparison
DEMOGRAPHICS2016 Registered 2016 Voted %
2012 Registered 2012 Voted % Change
Black Female 1048889 778851 74% 949,498 734,014 77% -3%Black Male 721448 445613 62% 660,486 434,273 66% -4%White Female 1780403 1449190 81% 1,685,309 1,280,058 76% 5%White Male 1588296 1272261 80% 1,485,658 1,119,278 75% 5%AAPI Female 60313 40784 68% 37,957 21,182 56% 12%AAPI Male 55685 36542 66% 34,523 18,517 54% 12%Latina 82840 58237 70% 50,049 29,772 59% 11%Latino 67993 43061 63% 41,790 22,057 53% 10%
Single Women 1,759,357 996703 57% 1,166,886 659,499 57% 0%Youth 1519385 904323 60% 1,011,402 475,188 47% 13%
The impact of the election on social justice efforts that aim to support LGBTQ, people of color and immigrant communities in the South
Monica HernandezExecutive DirectorSoutheast Immigrant Rights Network
Paulina Helm-HernandezCo-DirectorSoutherners on New Ground (SONG)
Q AND ATwo ways to ask a question of the speakers:
1. Use the Q and A function on your task bar to type a question. 2. Click the “raise your hand” icon and the host will call on you
to ask your question live.

THANKS FOR JOINING AND NEXT STEPS!