Embed Size (px)
Citation preview
i
BACKGROUND PAPER 10 (PHASE I)
Information and Communications Technology in Sub-Saharan Africa:
A Sector Review
SUMMARY
Mavis Ampah, Daniel Camos, Cecilia Briceño-Garmendia, Michael Minges, Maria Shkaratan, and Mark Williams
JANUARY 2009
ii
© 2009 The International Bank for Reconstruction and Development / The World Bank
1818 H Street, NW
Washington, DC 20433 USA
Telephone: 202-473-1000
Internet: www.worldbank.org
E-mail: [email protected]
All rights reserved
A publication of the World Bank.
The World Bank
1818 H Street, NW
Washington, DC 20433 USA
The findings, interpretations, and conclusions expressed herein are those of the author(s) and do not necessarily reflect the views of the
Executive Directors of the International Bank for Reconstruction and Development / The World Bank or the governments they represent.
The World Bank does not guarantee the accuracy of the data included in this work. The boundaries, colors, denominations, and other
information shown on any map in this work do not imply any judgment on the part of The World Bank concerning the legal status of any territory or the endorsement or acceptance of such boundaries.
Rights and permissions
The material in this publication is copyrighted. Copying and/or transmitting portions or all of this work without permission may be a violation of applicable law. The International Bank for Reconstruction and Development / The World Bank encourages dissemination of its work and will normally grant permission to reproduce portions of the work promptly.
For permission to photocopy or reprint any part of this work, please send a request with complete information to the Copyright Clearance
Center Inc., 222 Rosewood Drive, Danvers, MA 01923 USA; telephone: 978-750-8400; fax: 978-750-4470; Internet: www.copyright.com.
All other queries on rights and licenses, including subsidiary rights, should be addressed to the Office of the Publisher, The World Bank, 1818 H Street, NW, Washington, DC 20433 USA; fax: 202-522-2422; e-mail: [email protected].
iii
About AICD
This study is a product of the Africa Infrastructure Country Diagnostic (AICD), a project designed to expand the
world’s knowledge of physical infrastructure in Africa.
AICD will provide a baseline against which future improvements in infrastructure services can be measured,
making it possible to monitor the results achieved from
donor support. It should also provide a better empirical foundation for prioritizing investments and designing
policy reforms in Africa’s infrastructure sectors.
AICD is based on an unprecedented effort to collect
detailed economic and technical data on African infrastructure. The project has produced a series of reports
(such as this one) on public expenditure, spending needs,
and sector performance in each of the main infrastructure sectors—energy, information and communication
technologies, irrigation, transport, and water and sanitation.
Africa’s Infrastructure—A Time for Transformation, published by the World Bank in November 2009,
synthesizes the most significant findings of those reports.
AICD was commissioned by the Infrastructure Consortium
for Africa after the 2005 G-8 summit at Gleneagles, which recognized the importance of scaling up donor finance for
infrastructure in support of Africa’s development.
The first phase of AICD focused on 24 countries that together account for 85 percent of the gross domestic
product, population, and infrastructure aid flows of Sub-
Saharan Africa. The countries are: Benin, Burkina Faso, Cape Verde, Cameroon, Chad, Côte d'Ivoire, the
Democratic Republic of Congo, Ethiopia, Ghana, Kenya,
Lesotho, Madagascar, Malawi, Mozambique, Namibia,
Niger, Nigeria, Rwanda, Senegal, South Africa, Sudan, Tanzania, Uganda, and Zambia. Under a second phase of
the project, coverage is expanding to include as many other
African countries as possible.
Consistent with the genesis of the project, the main focus is
on the 48 countries south of the Sahara that face the most
severe infrastructure challenges. Some components of the
study also cover North African countries so as to provide a broader point of reference. Unless otherwise stated,
iv
therefore, the term “Africa” will be used throughout this
report as a shorthand for “Sub-Saharan Africa.”
The World Bank is implementing AICD with the guidance
of a steering committee that represents the African Union,
the New Partnership for Africa’s Development (NEPAD),
Africa’s regional economic communities, the African Development Bank, the Development Bank of Southern
Africa, and major infrastructure donors.
Financing for AICD is provided by a multidonor trust fund to which the main contributors are the U.K.’s Department
for International Development, the Public Private
Infrastructure Advisory Facility, Agence Française de Développement, the European Commission, and Germany’s
KfW Entwicklungsbank. The Sub-Saharan Africa Transport
Policy Program and the Water and Sanitation Program
provided technical support on data collection and analysis pertaining to their respective sectors. A group of
distinguished peer reviewers from policy-making and
academic circles in Africa and beyond reviewed all of the major outputs of the study to ensure the technical quality of
the work.
The data underlying AICD’s reports, as well as the reports themselves, are available to the public through an
interactive Web site, www.infrastructureafrica.org, that
allows users to download customized data reports and
perform various simulations. Inquiries concerning the availability of data sets should be directed to the editors at
the World Bank in Washington, DC.
Summary
frica is undergoing a revolution in information and communications and technology (ICT) that is
bringing telecom services within the reach of hundreds of millions of people. The revolution is
based on wireless technologies, which are bypassing the fixed-line networks on which the
telecom markets of developed countries were built.
In the 53 countries surveyed, the rolls of fixed-line subscribers grew by 11 million, from 19.5 million
lines in 2000 to 30.6 million in 2007. That is an improvement, but it pales against the growth in mobile
networks, which added 252 million subscribers over the same time period. The number of mobile
subscribers in the 53 countries jumped more than 15 times—from 15 million in 2000 to 267 million in
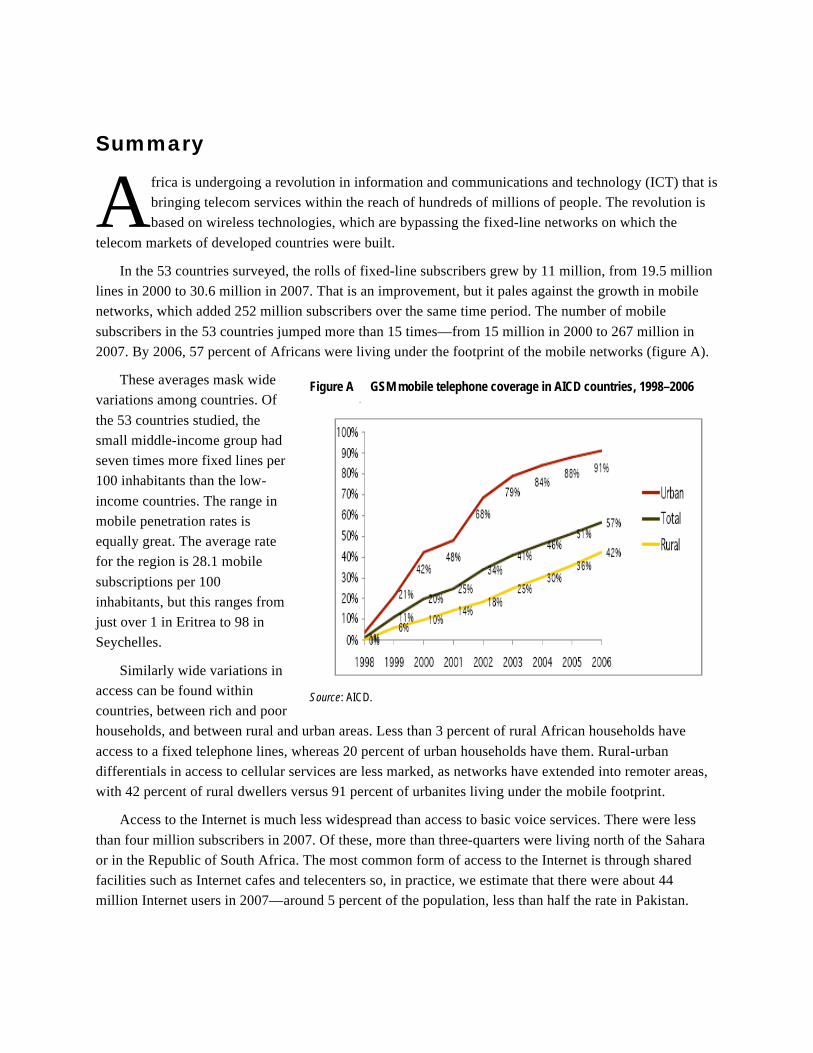
2007. By 2006, 57 percent of Africans were living under the footprint of the mobile networks (figure A).
These averages mask wide
variations among countries. Of
the 53 countries studied, the
small middle-income group had
seven times more fixed lines per
100 inhabitants than the low-
income countries. The range in
mobile penetration rates is
equally great. The average rate
for the region is 28.1 mobile
subscriptions per 100
inhabitants, but this ranges from
just over 1 in Eritrea to 98 in
Seychelles.
Similarly wide variations in
access can be found within
countries, between rich and poor
households, and between rural and urban areas. Less than 3 percent of rural African households have
access to a fixed telephone lines, whereas 20 percent of urban households have them. Rural-urban
differentials in access to cellular services are less marked, as networks have extended into remoter areas,
with 42 percent of rural dwellers versus 91 percent of urbanites living under the mobile footprint.
Access to the Internet is much less widespread than access to basic voice services. There were less
than four million subscribers in 2007. Of these, more than three-quarters were living north of the Sahara
or in the Republic of South Africa. The most common form of access to the Internet is through shared
facilities such as Internet cafes and telecenters so, in practice, we estimate that there were about 44
million Internet users in 2007—around 5 percent of the population, less than half the rate in Pakistan.
A
Figure A GSM mobile telephone coverage in AICD countries, 1998–2006
Source: AICD.
INFORMATION AND COMMUNICATIONS TECHNOLOGY IN SUB-SAHARAN AFRICA
2
What price access?
As mobile network coverage increases across the region, the primary determinant of popular access to
services is price, which is high by international standards and in relation to household incomes in the
region. In 2007 the average monthly prepaid package for mobile service in the countries studied was
priced at around $12, almost the same as the average package for fixed lines. There is great variation
across countries, with pre-paid mobile baskets ranging from a high of $19 to a low of $4. The price of a
fixed-line package covers a similar range, from $2 to $25 per month.
Broadband Internet is not always available, but where it is, services are usually charged on a flat-rate
basis. Here, too, prices tend to be very high. The average price of an entry level monthly DSL
subscription in Sub-Saharan Africa was over $100. In comparison, the average monthly price in OECD
countries for a broadband connection was $34.
But although mobile tariffs are still high given the low incomes in the region, they are falling steadily
and, as the networks expand, are reaching lower-income customers. One indication of the drop in prices is
the steady fall in the average revenue generated by network subscribers. The monthly average revenue per
mobile user (ARPU) stood at $16 in 2007, less than half the level of $40 in 2000. There is plenty of room,
however, for prices to come down even further. Over the same time period, ARPUs in Bangladesh, India,
and Pakistan fell by almost 90 percent—to $4 per month. In the fixed-line realm, some prices have
increased and others fallen as competition has forced the fixed operators to rebalance tariffs. The average
price of a call to the United States from the region, for example, was cut in half between 2000 and 2007.
Despite high service prices, the mobile networks have been able to provide access to low-income
users through flexible retail packages. Over 90 percent of the region’s consumers are on prepaid plans,
which allow them to purchase services in tiny increments and control their spending precisely. High
connection charges are rare, so the minimum cost of access to mobile services is generally lower than for
fixed networks, which traditionally operate on a post-paid subscription basis. For the operators,
prepayment dramatically reduces credit risk and the cost of revenue collection. Moreover, the absence of
credit checks, proof-of-address requirements, and other “know your customer” measures has reduced the
cost of customer acquisition in the region and increased the flexibility of markets.
Other factors—notably taxes and energy shortages—keep prices of ICT services in Africa higher than
they would be if market dynamics alone were at work. These taxes include import duties on mobile
handsets, taxes on services, and, in some countries, particularly in East Africa, excise charges on calls.
Value-added taxes range from 5 percent to 23 percent in the countries studied. The combined effect of
these taxes and duties is to add significantly to the cost of mobile ownership, putting ICTs outside the
reach of many consumers who otherwise might be able to afford them. Uganda ranks second in the world
in taxes as a percentage of total mobile revenues, while Kenya and Tanzania are above the world average.
Shortages of electricity contribute to higher costs, as service providers must rely on their own generators
to power mobile base stations and other telecommunications equipment. Scarce and unreliable electricity
also affects operators’ earnings because mobile subscribers, particularly in rural areas, have difficulty
recharging the batteries in their mobile phones.
INFORMATION AND COMMUNICATIONS TECHNOLOGY IN SUB-SAHARAN AFRICA
3
From monopoly to competition
Competition is the quickest route to lower prices and wider access to services. Perspectives on
telecom governance have changed radically over the past few decades. The most important implication
has been the shift from monopoly to competition. Greater competition has brought expanded networks,
lower prices, and new efforts to reach previously underserved groups of customers.
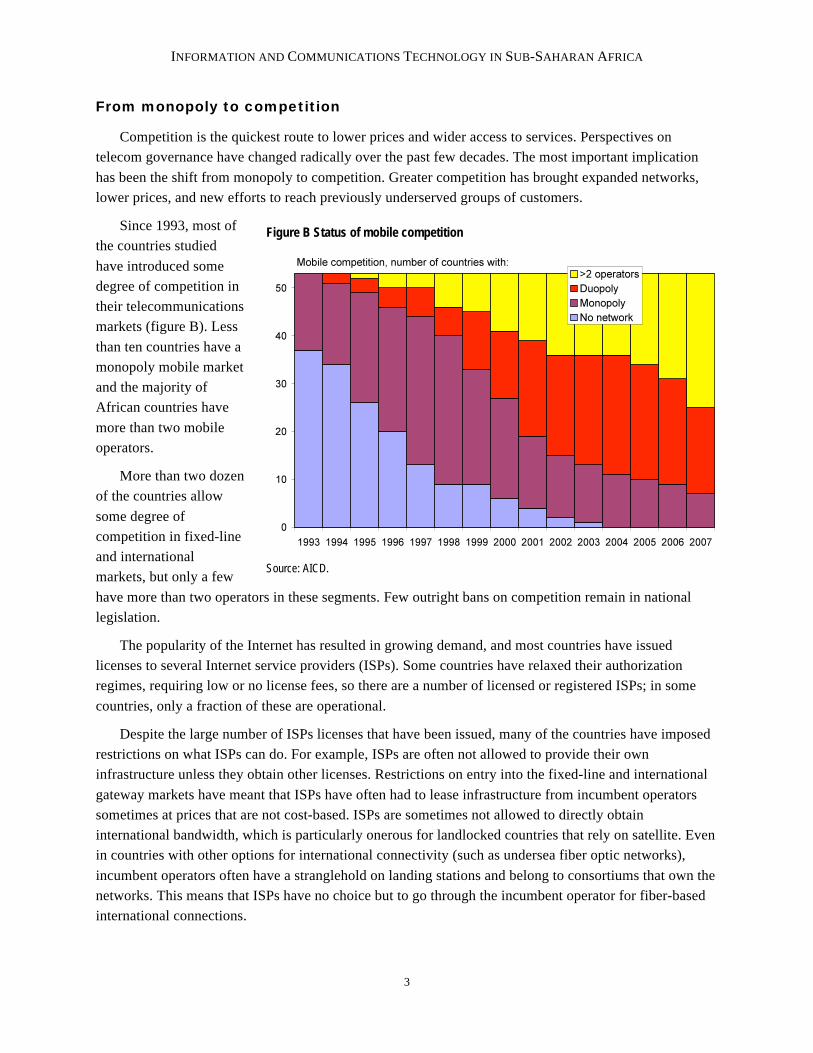
Since 1993, most of
the countries studied
have introduced some
degree of competition in
their telecommunications
markets (figure B). Less
than ten countries have a
monopoly mobile market
and the majority of
African countries have
more than two mobile
operators.
More than two dozen
of the countries allow
some degree of
competition in fixed-line
and international
markets, but only a few
have more than two operators in these segments. Few outright bans on competition remain in national
legislation.
The popularity of the Internet has resulted in growing demand, and most countries have issued
licenses to several Internet service providers (ISPs). Some countries have relaxed their authorization
regimes, requiring low or no license fees, so there are a number of licensed or registered ISPs; in some
countries, only a fraction of these are operational.
Despite the large number of ISPs licenses that have been issued, many of the countries have imposed
restrictions on what ISPs can do. For example, ISPs are often not allowed to provide their own
infrastructure unless they obtain other licenses. Restrictions on entry into the fixed-line and international
gateway markets have meant that ISPs have often had to lease infrastructure from incumbent operators
sometimes at prices that are not cost-based. ISPs are sometimes not allowed to directly obtain
international bandwidth, which is particularly onerous for landlocked countries that rely on satellite. Even
in countries with other options for international connectivity (such as undersea fiber optic networks),
incumbent operators often have a stranglehold on landing stations and belong to consortiums that own the
networks. This means that ISPs have no choice but to go through the incumbent operator for fiber-based
international connections.
Figure B Status of mobile competition
Source: AICD.
INFORMATION AND COMMUNICATIONS TECHNOLOGY IN SUB-SAHARAN AFRICA
4
Of the 14 AICD countries for which the International Telecommunications Union has data, most do
not allow full competition in international gateways. Six reported that international gateways were a
monopoly of the incumbent, four reported partial competition; only four responded that full competition
existed in this market segment.
Despite widespread de jure liberalization, the process of de facto liberalization has been moving more
slowly. Barely half of the countries studied have more than three active operators. Constraints on
competition often appear in the licensing process. In some countries there is no clear procedure for
obtaining a license, perpetuating the de facto monopoly. In other countries, the complexity of the
licensing process can discourage new entrants. For example, some countries divide the market into many
segments and require a license for each. Sometimes it is not clear which licenses are needed to provide
which service, or whether the scope of a license allows the licensee to offer the services it wants to offer.
Competition and performance
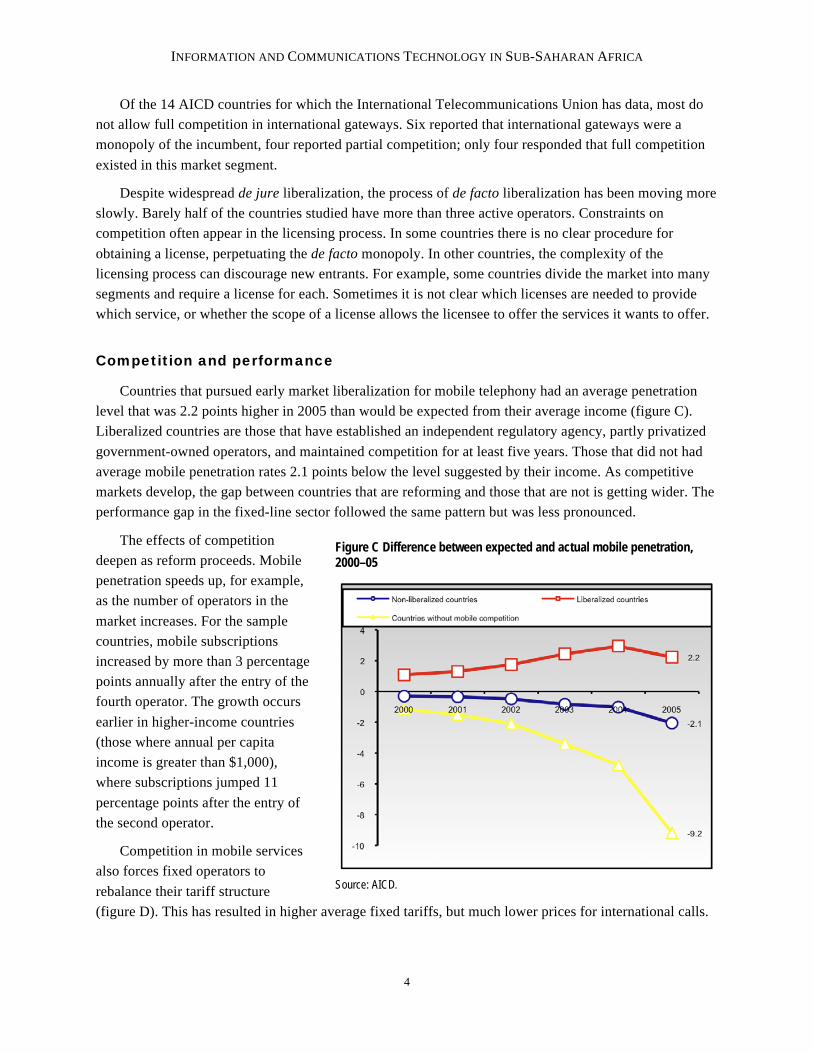
Countries that pursued early market liberalization for mobile telephony had an average penetration
level that was 2.2 points higher in 2005 than would be expected from their average income (figure C).
Liberalized countries are those that have established an independent regulatory agency, partly privatized
government-owned operators, and maintained competition for at least five years. Those that did not had
average mobile penetration rates 2.1 points below the level suggested by their income. As competitive
markets develop, the gap between countries that are reforming and those that are not is getting wider. The
performance gap in the fixed-line sector followed the same pattern but was less pronounced.
The effects of competition
deepen as reform proceeds. Mobile
penetration speeds up, for example,
as the number of operators in the
market increases. For the sample
countries, mobile subscriptions
increased by more than 3 percentage
points annually after the entry of the
fourth operator. The growth occurs
earlier in higher-income countries
(those where annual per capita
income is greater than $1,000),
where subscriptions jumped 11
percentage points after the entry of
the second operator.
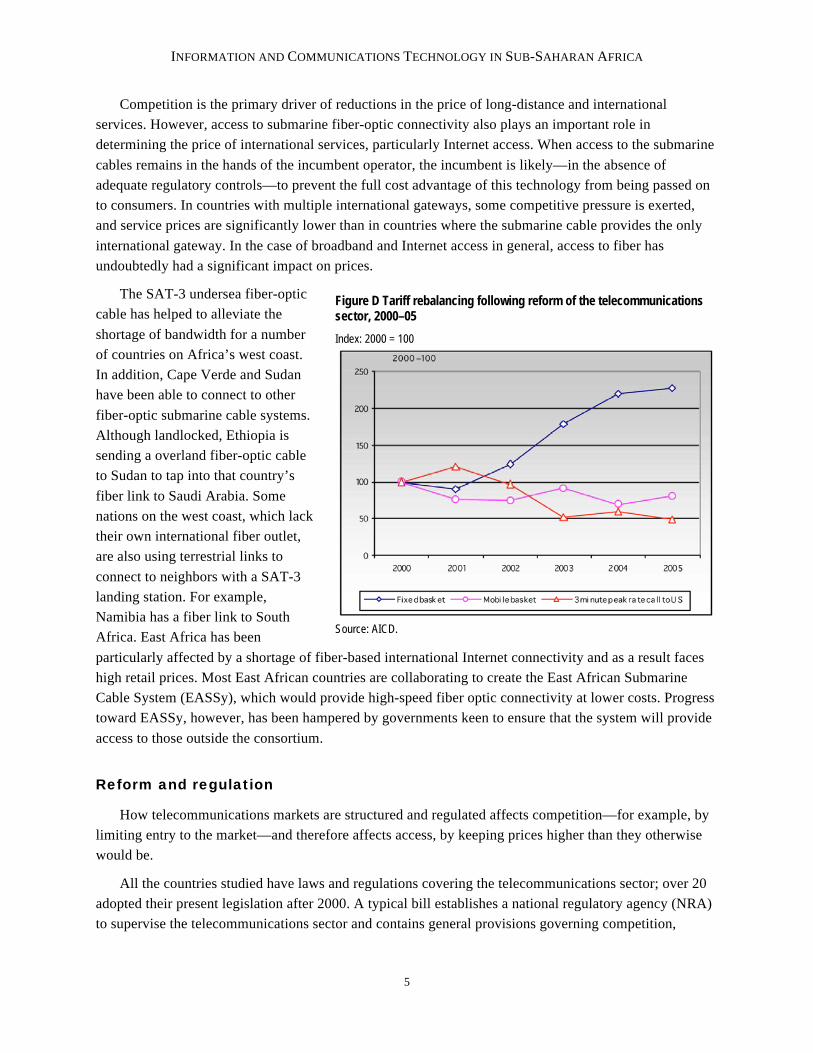
Competition in mobile services
also forces fixed operators to
rebalance their tariff structure
(figure D). This has resulted in higher average fixed tariffs, but much lower prices for international calls.
Figure C Difference between expected and actual mobile penetration, 2000–05
Source: AICD.
INFORMATION AND COMMUNICATIONS TECHNOLOGY IN SUB-SAHARAN AFRICA
5
Competition is the primary driver of reductions in the price of long-distance and international
services. However, access to submarine fiber-optic connectivity also plays an important role in
determining the price of international services, particularly Internet access. When access to the submarine
cables remains in the hands of the incumbent operator, the incumbent is likely—in the absence of
adequate regulatory controls—to prevent the full cost advantage of this technology from being passed on
to consumers. In countries with multiple international gateways, some competitive pressure is exerted,
and service prices are significantly lower than in countries where the submarine cable provides the only
international gateway. In the case of broadband and Internet access in general, access to fiber has
undoubtedly had a significant impact on prices.
The SAT-3 undersea fiber-optic
cable has helped to alleviate the
shortage of bandwidth for a number
of countries on Africa’s west coast.
In addition, Cape Verde and Sudan
have been able to connect to other
fiber-optic submarine cable systems.
Although landlocked, Ethiopia is
sending a overland fiber-optic cable
to Sudan to tap into that country’s
fiber link to Saudi Arabia. Some
nations on the west coast, which lack
their own international fiber outlet,
are also using terrestrial links to
connect to neighbors with a SAT-3
landing station. For example,
Namibia has a fiber link to South
Africa. East Africa has been
particularly affected by a shortage of fiber-based international Internet connectivity and as a result faces
high retail prices. Most East African countries are collaborating to create the East African Submarine
Cable System (EASSy), which would provide high-speed fiber optic connectivity at lower costs. Progress
toward EASSy, however, has been hampered by governments keen to ensure that the system will provide
access to those outside the consortium.
Reform and regulation
How telecommunications markets are structured and regulated affects competition—for example, by
limiting entry to the market—and therefore affects access, by keeping prices higher than they otherwise
would be.
All the countries studied have laws and regulations covering the telecommunications sector; over 20
adopted their present legislation after 2000. A typical bill establishes a national regulatory agency (NRA)
to supervise the telecommunications sector and contains general provisions governing competition,
Figure D Tariff rebalancing following reform of the telecommunications sector, 2000–05
Index: 2000 = 100
Source: AICD.
INFORMATION AND COMMUNICATIONS TECHNOLOGY IN SUB-SAHARAN AFRICA
6
licensing, interconnection, allocation of scarce resources (such as numbering and spectrum), pricing, and
market entry. Wide variations are found between countries in the extent of reform.
Compared with other infrastructure sectors, there has been intensive institutional reform. These
changes have been predominantly driven by market reforms that fostered competition and facilitated
various forms of private participation. Policy oversight evolved accordingly.
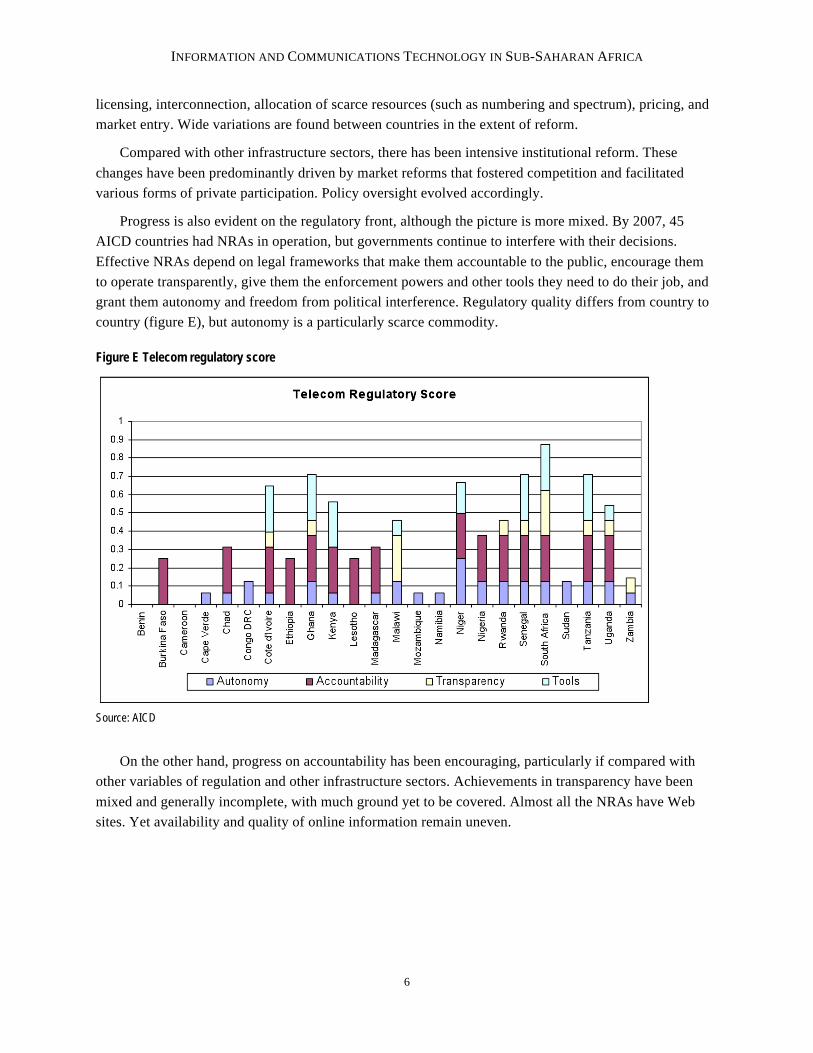
Progress is also evident on the regulatory front, although the picture is more mixed. By 2007, 45
AICD countries had NRAs in operation, but governments continue to interfere with their decisions.
Effective NRAs depend on legal frameworks that make them accountable to the public, encourage them
to operate transparently, give them the enforcement powers and other tools they need to do their job, and
grant them autonomy and freedom from political interference. Regulatory quality differs from country to
country (figure E), but autonomy is a particularly scarce commodity.
Figure E Telecom regulatory score
Source: AICD
On the other hand, progress on accountability has been encouraging, particularly if compared with
other variables of regulation and other infrastructure sectors. Achievements in transparency have been
mixed and generally incomplete, with much ground yet to be covered. Almost all the NRAs have Web
sites. Yet availability and quality of online information remain uneven.
INFORMATION AND COMMUNICATIONS TECHNOLOGY IN SUB-SAHARAN AFRICA
7
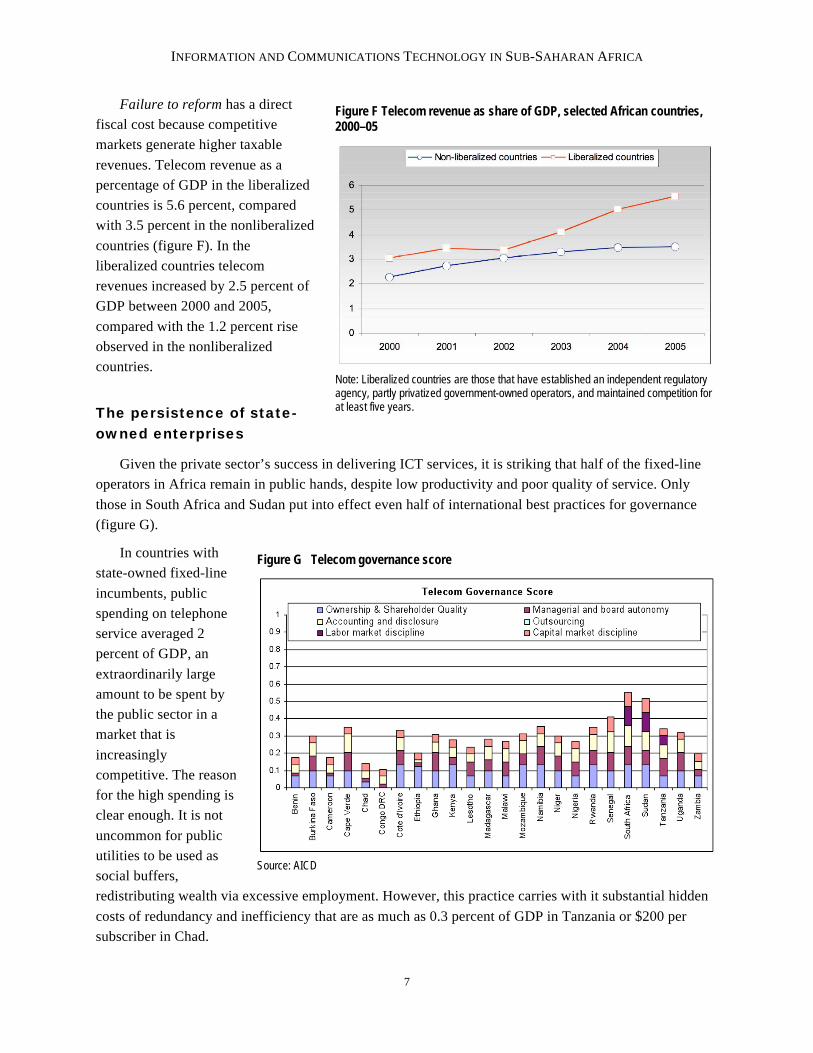
Failure to reform has a direct
fiscal cost because competitive
markets generate higher taxable
revenues. Telecom revenue as a
percentage of GDP in the liberalized
countries is 5.6 percent, compared
with 3.5 percent in the nonliberalized
countries (figure F). In the
liberalized countries telecom
revenues increased by 2.5 percent of
GDP between 2000 and 2005,
compared with the 1.2 percent rise
observed in the nonliberalized
countries.
The persistence of state-
owned enterprises
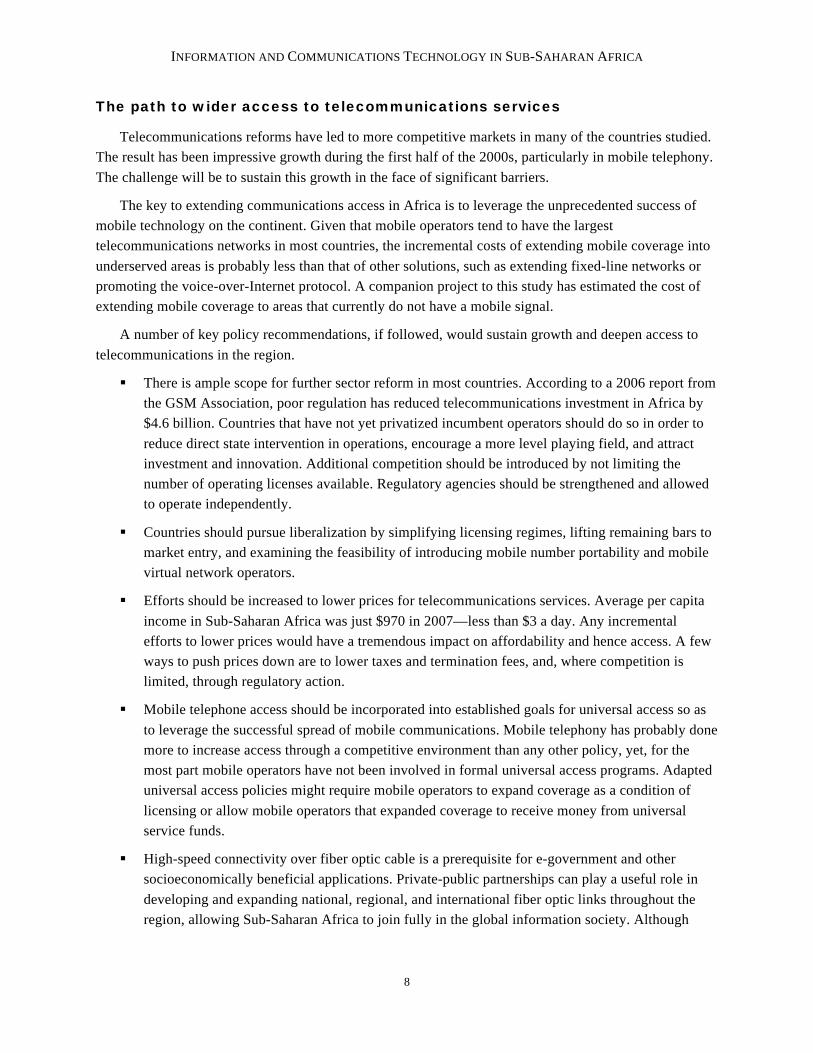
Given the private sector’s success in delivering ICT services, it is striking that half of the fixed-line
operators in Africa remain in public hands, despite low productivity and poor quality of service. Only
those in South Africa and Sudan put into effect even half of international best practices for governance
(figure G).
In countries with
state-owned fixed-line
incumbents, public
spending on telephone
service averaged 2
percent of GDP, an
extraordinarily large
amount to be spent by
the public sector in a
market that is
increasingly
competitive. The reason
for the high spending is
clear enough. It is not
uncommon for public
utilities to be used as
social buffers,
redistributing wealth via excessive employment. However, this practice carries with it substantial hidden
costs of redundancy and inefficiency that are as much as 0.3 percent of GDP in Tanzania or $200 per
subscriber in Chad.
Figure F Telecom revenue as share of GDP, selected African countries, 2000–05
Note: Liberalized countries are those that have established an independent regulatory agency, partly privatized government-owned operators, and maintained competition for at least five years.
Figure G Telecom governance score
Source: AICD
INFORMATION AND COMMUNICATIONS TECHNOLOGY IN SUB-SAHARAN AFRICA
8
The path to wider access to telecommunications services
Telecommunications reforms have led to more competitive markets in many of the countries studied.
The result has been impressive growth during the first half of the 2000s, particularly in mobile telephony.
The challenge will be to sustain this growth in the face of significant barriers.
The key to extending communications access in Africa is to leverage the unprecedented success of
mobile technology on the continent. Given that mobile operators tend to have the largest
telecommunications networks in most countries, the incremental costs of extending mobile coverage into
underserved areas is probably less than that of other solutions, such as extending fixed-line networks or
promoting the voice-over-Internet protocol. A companion project to this study has estimated the cost of
extending mobile coverage to areas that currently do not have a mobile signal.
A number of key policy recommendations, if followed, would sustain growth and deepen access to
telecommunications in the region.
There is ample scope for further sector reform in most countries. According to a 2006 report from
the GSM Association, poor regulation has reduced telecommunications investment in Africa by
$4.6 billion. Countries that have not yet privatized incumbent operators should do so in order to
reduce direct state intervention in operations, encourage a more level playing field, and attract
investment and innovation. Additional competition should be introduced by not limiting the
number of operating licenses available. Regulatory agencies should be strengthened and allowed
to operate independently.
Countries should pursue liberalization by simplifying licensing regimes, lifting remaining bars to
market entry, and examining the feasibility of introducing mobile number portability and mobile
virtual network operators.
Efforts should be increased to lower prices for telecommunications services. Average per capita
income in Sub-Saharan Africa was just $970 in 2007—less than $3 a day. Any incremental
efforts to lower prices would have a tremendous impact on affordability and hence access. A few
ways to push prices down are to lower taxes and termination fees, and, where competition is
limited, through regulatory action.
Mobile telephone access should be incorporated into established goals for universal access so as
to leverage the successful spread of mobile communications. Mobile telephony has probably done
more to increase access through a competitive environment than any other policy, yet, for the
most part mobile operators have not been involved in formal universal access programs. Adapted
universal access policies might require mobile operators to expand coverage as a condition of
licensing or allow mobile operators that expanded coverage to receive money from universal
service funds.
High-speed connectivity over fiber optic cable is a prerequisite for e-government and other
socioeconomically beneficial applications. Private-public partnerships can play a useful role in
developing and expanding national, regional, and international fiber optic links throughout the
region, allowing Sub-Saharan Africa to join fully in the global information society. Although
INFORMATION AND COMMUNICATIONS TECHNOLOGY IN SUB-SAHARAN AFRICA
9
governments should play an active role in encouraging the deployment of fiber networks, their
participation should not delay the badly needed implementation of fiber backbones.