Embed Size (px)
Citation preview
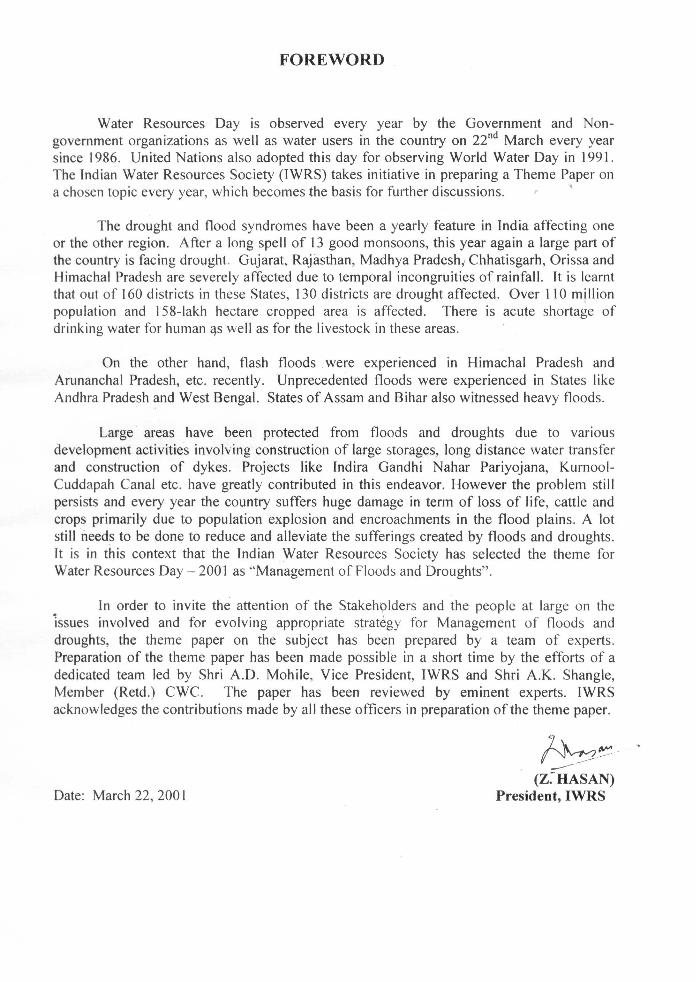


12.0 POINTS FOR DEBATE
India has a large track of otherwise drought prone area, which receives low rainfall and suffers from large temporal variability of rainfall. The population pressures are such that even such marginal areas have considerable population densities. Again, except for the deserts having no suitable soil cover & no water, these marginal areas are also under agriculture, which continues to be the main source of livelihood. In such areas, drought can lead to considerable human misery, reSUlting not only in health hazards, but also to annual or permanent migration and deaths of cattle and humans.
The larger scale human problem was very severe in the pre independence days. During these times, the droughts and famines resulted in the loss of thousands of lives, every few years. As Professor Amartya Sen said that thousands of lives - both human and cattle were lost in pre-independence drought days, whereas there have been no much loss of lives in India after independence.
Thus, although much remains to be done, on the whole, drought management in India is largely success story in containment and management. As seen, water resources development & irrigation have been the main strategies used in India for drought management.
Following issues need to be debated:
Flood Management
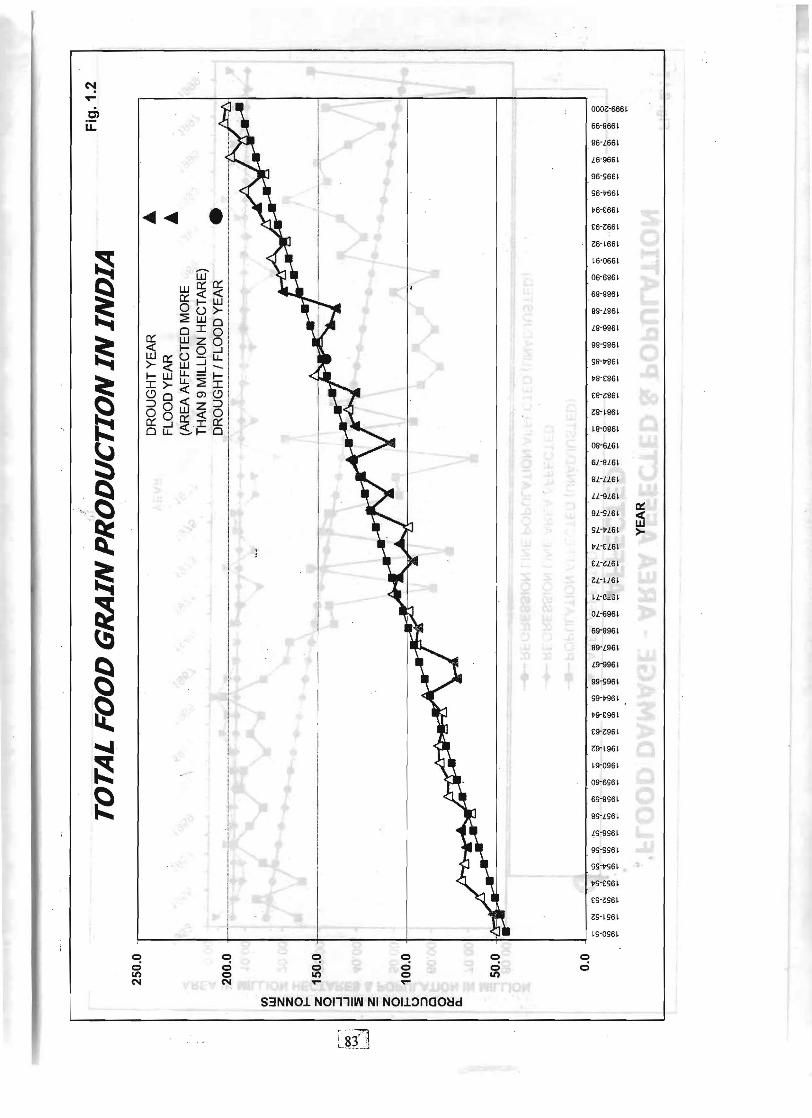
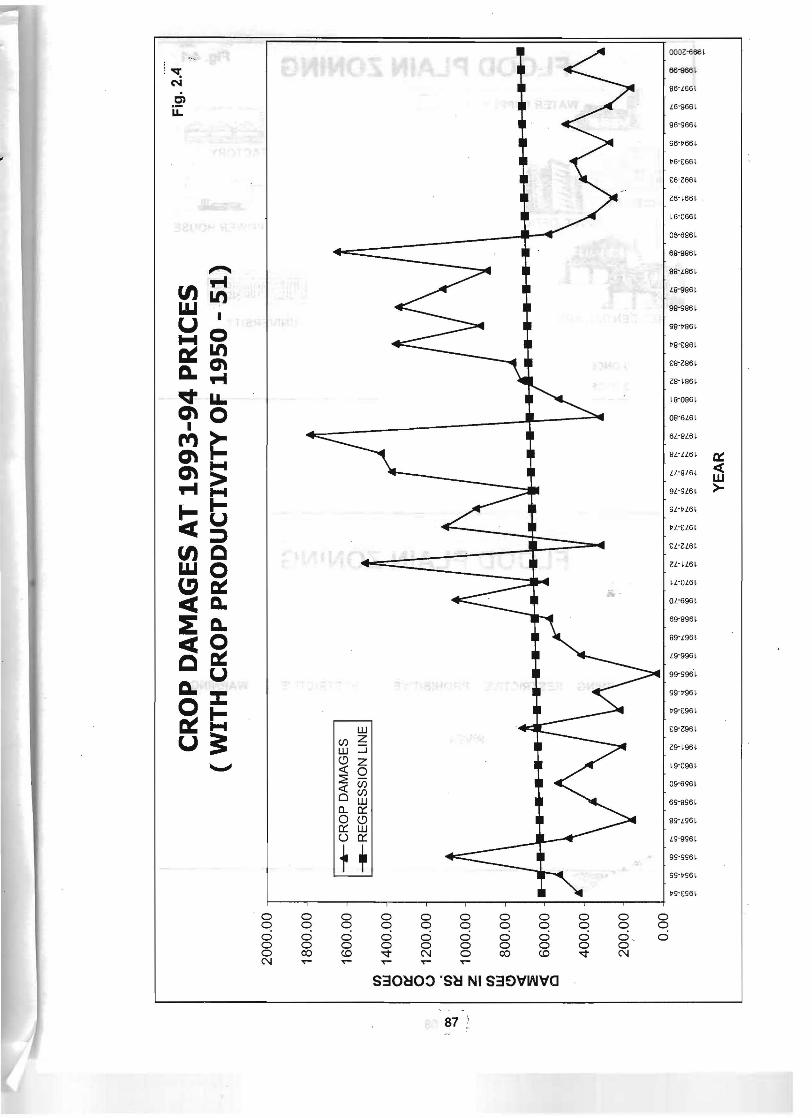
12.1 Is flood damage in the country increasing in spite of flood management works taken up systematically during the last 40/50 years? Analysis of available data shows that damage figures are not increasing in real terms. A good flood management system should indicate a trend of gradual reduction in damages. Why is not taking place?
12.2 Flood Plain Zoning has been accepted as an important strategy for flood management. But its implementation till now is not encouraging. Under the circumstances;
Does the situation warrant a change? Should the concept of flood plain zoning be sacrificed in the name of impracticability of implementation and pragmatism? Will not such a negation of the concept propagate the misery as a result of floods in many areas? Shall a new strategy, which can be executed after considering the vexed sociopolitical issue, is required to be drawn up? Will not flood plain zoning measures be required to be adopted for all new developments and the concept used for existing developments to a practicable limited extent?
12.3 There is a common perception that river beds and flood levels for some of the flood prone rivers are showing a rising trend, which is not substantiated by facts. How to
70
proceed to make an assessment in the matter vis-a-vis problem of floods in different areas?
12.4 There ' is a common perception that embankments are more harmful than beneficial in controlling floods. On the other hand, many case studies show that embankments have been effective in protecting both urban and agricultural areas. Is there any shortcoming in the methodology in planning/execution?
12.5 Shall the Union Government have to be given a larger role in adopting flood control measures in respect of inter-State rivers to address the problem of floods in the country in a more effective manner, somewhat in line with arrangement existing in countries like USA?
12.6 At present, a comparatively larger amount of funds is spent on flood mItIgation measures such as flood relief as immediate measures for relieving the human miseries. Whereas importance of flood relief cannot be overlooked, can it be the strategy to solve the menace of floods? Is it possible to limit the assistance of flood relief linking it with positive action for immediate and long-term action taken up by the concerned State for better flood management?
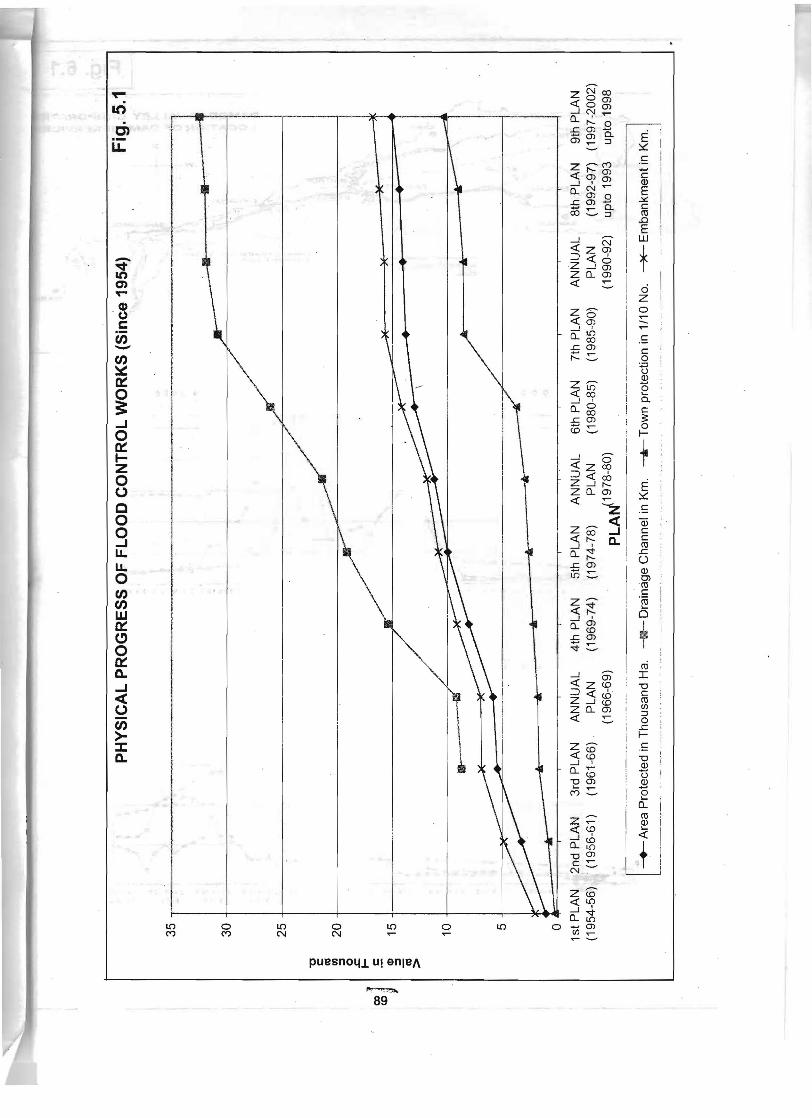
12.7 The principal measures for flood management for the last 40-50 years have been construction of embankments, drainage systems, anti-erosion works and such other protection works and non-structural measures like flood forecasting and warning. Is this strategy appropriate or should emphasis be laid on long-term measures like storage reservoirs also?
12.8 There is conflicting demand of drainage of flood waters in tal areas and concept of wet land ecology. Can a new strategy for overall development of tal areas consistent with their status as an important part of wet land ecology be devised in such a way as to ensure both adequate protection and income to inhabitants throl,lgh agriculture, pisciculture and such other economic activities?
12.9 Present methodology of deciding economic viability of flood control schemes is based on past flood damage data and the possible reduction of damage due to flood control works. Thus, this is based on the methodology of comparing "before" with "after" and not on the appropriate methodology of "without" and "with". Thus, the present methodology does not take into consideration the large scale agriculture, industrial and other developments which takes place in an area as a result of taking up the scheme. How to re-frame the methodology so that these beneficial aspects of development of the area as a result of the particular flood management scheme is considered effectively in working out the economic viability of the project?
Drought Management
12.10 Provision of irrigation water through Water Resources Development has been considered, in the past, as the main strategy for Drought Management in India. Does this strategy require any change?
71
J2.11 The definition of "Drought Proneness" is based on the meteorological factors. and the management factors in the form of irrigation intensity. Is a better definition possible?
J2.12 Have we succeeded in mitigating the effects of droughts in providing a more stable base of the economy through works development based drought management?
12.13 Where are the roles of rainwater harvesting, watershed management and water development through smaIl and large engineering projects, in drought management?
12.14 Do the cropping patterns in the drought prone areas reflect the water scarcity? If not, which policy measures are necessary to bring about the changes and emphasize production of crops requiring less water?
12.15 Is the present strategy of having a reliability of 75 percent, on annual basis, in regard to irrigation, justified?
12.16 Do we need to build larger "carryover" storages for better utilsation & better drought mitigation?
12.17 Is it practicable to plan large scale artificial recharge of surplus flood waters, for drought management?
12.18 The National Perspective Plan for water transfers is being advocated as the long term strategy for water development, both for increasing productivity and for drought management & drinking water supply. Is this practicable from the technical, financial, economic and socio-political perspectives?
12.19 Many countries advocate the concept of Virtual Water. For example, import of agricultural or industrial products requifing large volume of water in their production, obviates the need for developing and using that much water by the importer. Thus, virtuaIly, this water is being imported. How far this c0Dcept, based on the principle of a stable free market, applicable in the Indian context? Can this replace the need for sufficiency, at national or State level, of foodgrains, etc.?
72

. . ".
Annex-2.1
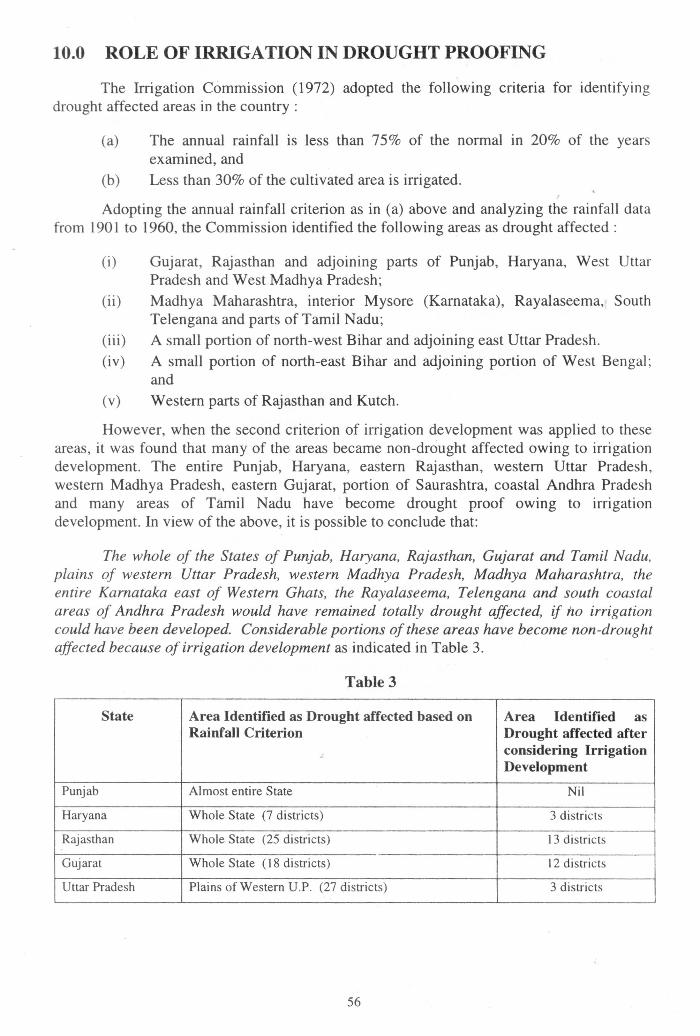
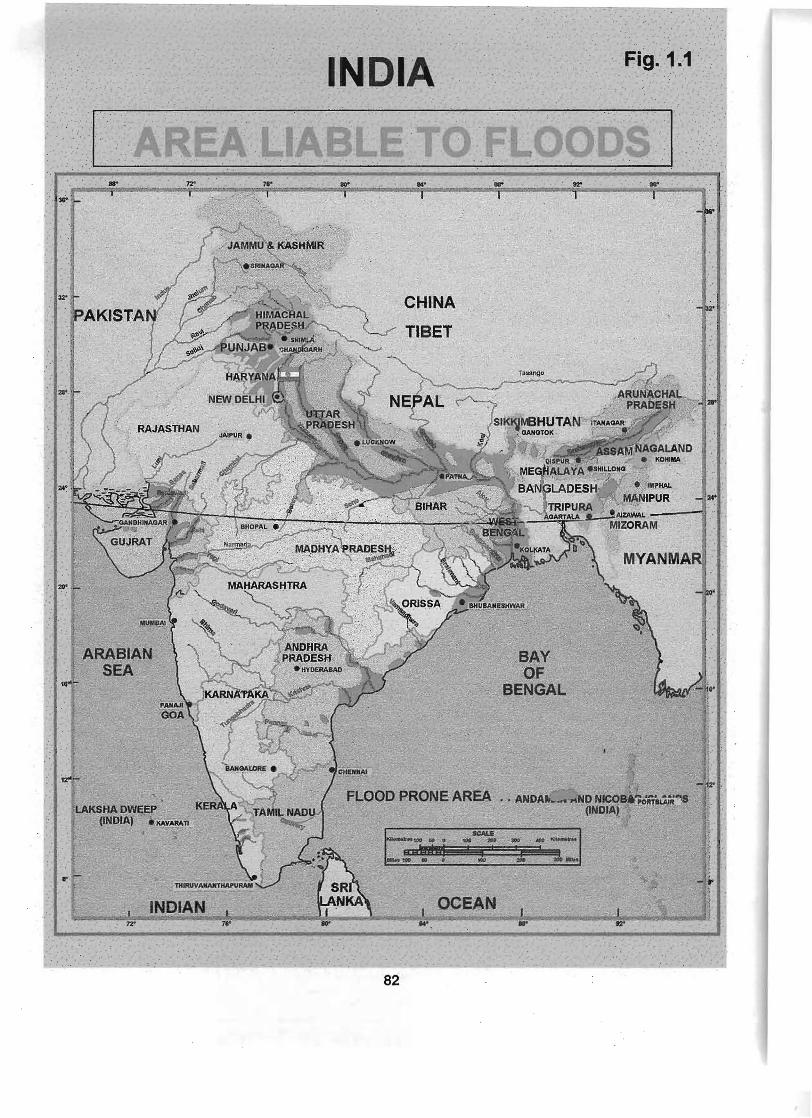
• AREA LIABLE TO FLOODS (AS PER REPORT OF RASHTRIY A BARR A YOG)
Sl. No State
Geographical area (m.ha.)
Area liable to flood (m.ha.)
% of area liable to flood
Area · protected (m.ha.) as considered
byRBA t. Andhra Pradesh 27.51 1.39 5.05 0.700 2. Assam 7.84 3.15 40.18 1.305 3. Bihar 17.39 4.26 24.50 1.566 4. Gujarat 19.60 1.39 7.09 0.362 5. Haryana 4.42 2.35 53.17 1.095 6. Himachal Pradesh 5.57 0.23 4.13 -7. Jammu & Kashmir 22.22 0.08 0.36 0.012 8. Karnataka 19.18 0.02 0.10 0.001 9. Kerala 3.89 0.87 22.37 0.011
10. Madhya Pradesh 44.34 0.26 0.59 -It. Maharashtra 30.77 0.23 0.75 0.001 12. Manipur 2.23 0.08 3.59 0.073 13. Meghalaya 2.24 0.02 0.89 0.075 14. Orissa 15.57 1.40 8.99 0.351 15. Punjab 5.04 3.70 73.41 2.407 16. Ra.jasthan 34.22 3.26 9.53 0.016 17. Tamil Nadu 13.01 0.45 3.46 0.029 18. . Tripura 1.05 0.33 31.43 0.009 19. Uttar Pradesh 29.44 7.34 24.93 0.739 20. West Bengal 8.88 2.65 29.84 1.001 2t. Delhi 0.15 0.05 33.33 0.023 22. Pondicherry 0.05 0.01 20.00 Neg.
Total 33.52 9.776 Say 34 m.ha. 10.00 m.ha.
From the above table, the total Flood Prone Area in the country is as below:a) Flood Prone Area in States 34.0 m.ha. b) Area protected in States till then 10.0 m.ha. Area flooded due to failure of protection works which might have been included in reported flooded areas(assumed) (-) 4.00 m.ha. Total flood prone area in the country . 40.0 million ha.
73
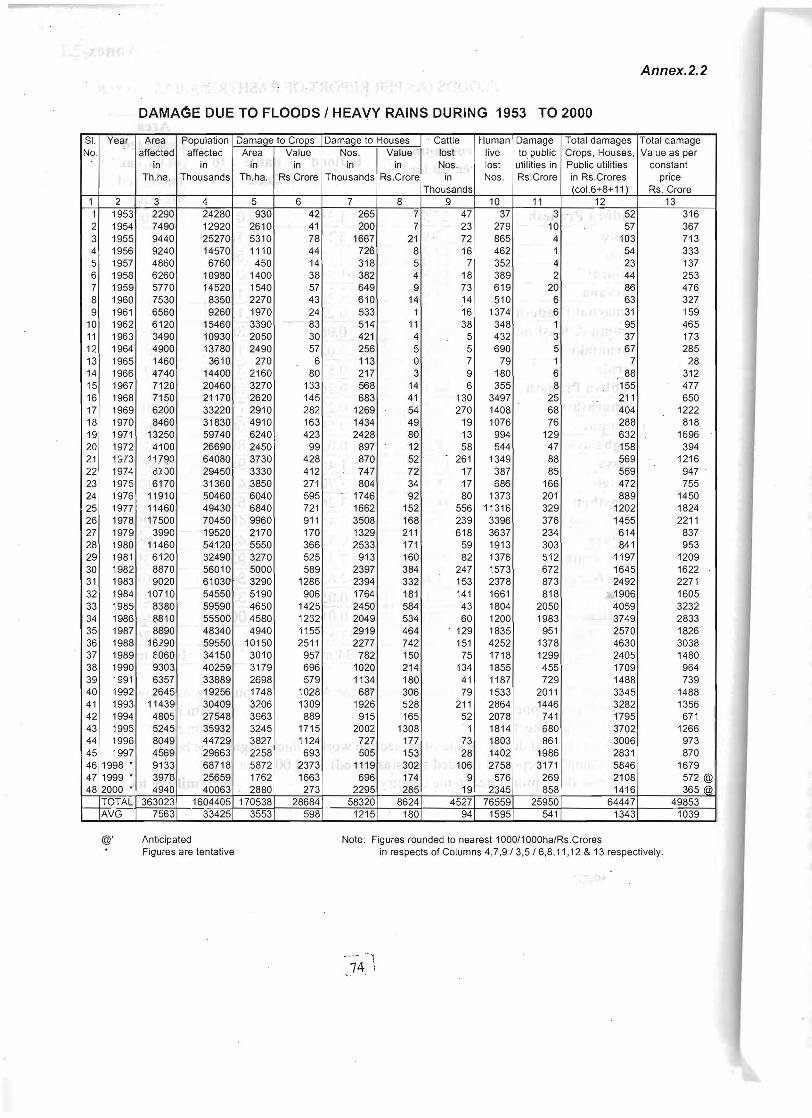
Annex.2.2
DAMAGE DUE TO FLOODS / HEAVY RAINS DURING .1953 TO 2000
SI. No.
Year Area affected
Population affected
Damage to Crops Damage to Houses . Cattle lost
Human live
Damage to public
Total damages Crops , Houses,
Total damage Value as perArea Value Nos . Value
in in in in in in Nos. lost utilities in Public utilities constant Th .ha. Thousands Th .ha . RS .Crore Thousands RS .Crore in
Thousands Nos. Rs .Crore in Rs .Crores
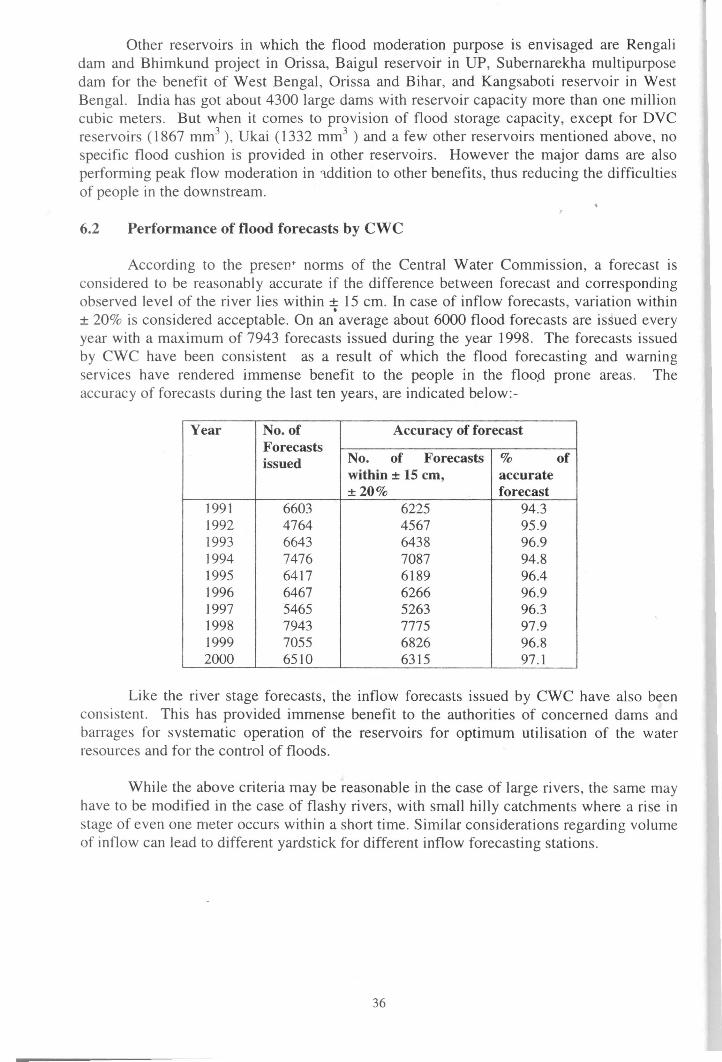
(coI.6+8+11) . price
Rs . Crore 1 2 I 3 4 5 6 7 8 9 10 11 12 13 1 1953 2290 24280 930 42 265 7 47 37 3 52 316 2 1954 7490· 12920 2610 41 200 7 23 279 10 57 367 3 1955 9440 25270, 5310 78 1667 21 72 865 4 103 713 4 1956 9240 14570 1110 44 7261 8 16 462 1 54 333 5 1957 4860 6760 450 14 318 5 7 352 4 23 137 6 1958 6260 10980 1400 38 382 4 18 389 2 44 253 7 1959 5770 14520 1540 57 649 9 73 619 20 86 476 8 1.960 7530 8350 2270 43 610 14 14 510 6 63 327 9 1961 6560 9260 1970 24 533 1 16 1374 6 31 159
10 1962 6120 15460 3390 83 514 111 38 348 1 95 465 11 1963 3490 10930 2050 30 421, 4 5 432 3 37 173 12 1964 4900 13780 2490 57 256 5 5 690 5 67 285 13 1965 1460 3610 270 6 113 0, 7 79 1 7 28 14 1966 4740 14400 2160 80 217 3 9 180 6 88 312 15 1967 7120 20460 3270 133 568 14 6 355 8 155 477 16 1968 7150 I 21170 2620 145 683 41 130 3497 25 211 650 17 1969 6200 33220 2910 282 1269 54 270 1408 68 404 1222 18 1970 8460 31830 4910 163 1434 49 19 1076 76 288 818 19 1971 13250 , 59740 6240 423 2428 80 13 994 129 632 1696 20 1972 4100 26690 2450 99 897 12 58 544 47 158 394 21 1373 117~ 64080 3730 428 870 52 261 1349 88 569 1216 22 1974 01 ·)0 29450 ' 3330 412 747 72 17 387 85 569 947 . 23 1975 6170 31360 3850 271 804 34 17 686 166 472 755 24 1976 11910 50460 6040 595 1746 92 80 1373 201 889 1450 25 1977 11460 49430 6840 721 1662 152 556 11316 329 1202 1824 26 1978 17500 70450 9960 911 3508 168 239 3396 376 1455 2211 27 1979 3990 19520 2170 170 1329 211 618 3637 234 614 837 28 1980 11460 54120 5550 366 2533 171 59 1913 303 841 953 29 1981 6120 32490 3270 525 913 160 82 1376 512 1197 1209 30 1982 8870 56010 5000 589 2397 384 247 1573 672 1645 1622 31 1983 9020 61030 3290 1286 ·2394 332 153 2378 873 2492 2271 32 1984 10710 54550 5190 906 1764 181 141 1661 818 . 1906 1605 33 1985 8380 59590 4650 1425 2450 584 i 43 1804 2050 4059 3232 34 1986 (1810 55500 4580 1232 2049 534 60 1200 1983 3749 2833 35 1987 8890 48340 4940 1155 2919 464 . 129 1835 951 2570 1826 36 1988 16290 59550 10150 2511 2277 742 151 4252 1378 4630 3038 37 1989 C060 34150 3010 957 782 150 75 1718 1299 2405 1480 38 1990 9303 40259 3179 696 1020 214 134 1855 455 1709 964 39 1991 6357 33889 2698 579 1134 180 41 1187 729 1488 739 40 1992 2645 19256 1748 1028 687 306 79 1533 2011 3345 1488 41 1993 11439 30409 3206 1309 1926 528 211 2864 1446 3282 1356 42 1994
1
4805 27548 3963 889 .915 165 52 2078 741 1795 671 43 1995 5245 35932 3245 1715 2002 1308 1 1814 680 3702 1266 44 1996 18049 44729 3827 1124 727 177 73 1803 861 3006 973 45 1997 4569 29663 2258 693 505 153 28 1402 1986 1 2831 870 46 1998 • 9133 68718 5872 2373 1119 302 106 2758 3171 5846 1679 47 1999 • 3978 25659 1762 1663 696 174 9 576 269 2108 572 @ 48 2000 • 4940 40063 2880 273 2295 285 19 2345 858 1416 365 @
TOTAL 363023 1604405 170538 28684 58320 8624 4527 76559 25950 64447 49853 AVG 7563 33425 3553 598 1215 180 94 1595 541 1343 1039 I @' Anticipated Note : Figuresrounded to nearest 1000/1000ha/Rs.Crores
Figures are tentative in respects of Columns 4,7,9 I 3,5/6,8,11,12 & 13 respectively.
Annex 6.1 Efficacy of Embankments for flood protection - case studies.
Kamla Balan embankments
Problem: The river Kamala Balan rises in the Himalayan ranges and emerges out of the gorge near Chisapani in NepaL It enters the Indian territory near Jainagar (Bihar). The river carries heavy sediment load resulting in constantly swinging, meandering and changing the courses. The basin usuaHy face heavy flood due to overflowing of the banks and consequent damages and sufferings to people. The frequency as well as severity of the flood problem registered a five fold increase by the fifties.
Scheme: To overcome the above difficulties the following works were proposed.
(a) Embankments on both banks of river Kamla Balan (Indo-Nepal border to Kotharam) from Mirchaiya in Nepal to Phuhia with spillways for release of excess water and keeping old channels active and sluices for proper drainage at suitable places. ~-
(b) Resectioning and regrading the JiwachhKamla course to carry 98.323 m3 / sec of
discharge. ' (c) A storage reservoir in the gorge in Nepal.
The first part of the above work was executed in phases. The embankment in Nepal portion i.e. from Mirchaiya to Jainagar was not executed at all. That from Jainagar to Jhanjharpur (50.5 km) on the right bank and Jainagar to Bhakua (12.8 km) and Parhi (22.5 km), Jhanjharpur (30 km) on the left bank were taken up in 1956 and completed in 1959. That below Jhanjharpur to Darjia in a length of 20 km was taken up in 1960, and completed in 1962. Further extension up to Kothram (20 km) was completed between 1980 and 1984 .
. Performance and evaluation: Pelformance Evaluation of embankment scheme<: on both banks of the river Kamala Balan from Indo-Nepal border to Kothram was got done by GFCC, Patna in 1991. The work consisted of (i) Evaluation of the effect of flood protection schemes on the agricultural and urban economy of the area / region protected. with the special purpose of recommending efficacy of such schemes for future adoption in other flood prone regions. (ii) To examine the impact of the embankment, two well known techniques viz. (i) Before and after approach and (ii) With and without approach have been adopted. The final report came with the following findings.
The objective of the embankments to prevent flooding from the spills of river in the protected area was achieved to a reasonable extent. On account of breaches, however, part of the area which was assured of reasonable protection, experienced flooding depending upon the location of such breaches. The figures of damages showed some increase basically on account of increased public and private developments in the area and inflationary rise in prices. In spite of these problems the embankments continued to be pop.~lar and provide immediate relief to the people.
75
Dibrugarh town prot~c~ion works, • t '
Problem: The Dibrugarh Town of Assam has been facing acute problem of erosion since its inception. The devastating earthquake of 1950 in the area further aggravated the problem, resulting in erosion of one-sixth of the townin 1954 flood only, .drawing attention of the Central and State Govt. agencies. The planned proteGtion works started thereafter with the help of technical expertise of the ~W & Pc. . . .
Scheme: Protection works comprised of 24 km dyke system, 22 ~mdrain through the town, stone / timber spurs; permeable / semi permeable piles and bank revetments from upstream of Maijon to Mohonaghat. Later, due to shifting of river erosion upstream, the protection works comprising Stone Bars, Bank-Heads, Revetments, Land Spurs, Permeable Spurs etc. were constructed in the reach upstream of the Maijon Stone Spur. The 24 km Dyke system was constructed in stages from time to time, between 1954-55 and 1979-80 to prevent the spilling of water into the town and adjoining areas. In order to give relief to the town area from water congestion as a result of construction of Dyke, .a 14 km drain was constructed through the town, out falling into the river, in the year 1956-57. The length of the drain was later extended to about 22 km.
Performance and evaluation: Central Water Commission, Govt. of India has got done the evaluation of performance of flood protection works of Dibrugarh town (Ass~!ll) in December 1991. The study has shown that the anti erosion works has helped to divert away the main current towards the north, thereby reducing the erosion' in the town and downstrc«m areas. Similarly the dykes (flood embankments) system is functioning well, checking the spillage of flood water into Dibrugarh town and its suburbs and providing a good sense of security to the people. However considering the floods of 1988, these embankments required regular monitoring, further raising and strengthening. There is urgent need for carrying out the flood plain zoning in the protected areas and regulating the developmental activities of the town and its adjoining areas, for gradually shifting of developmental activities from the present vulnerable areas of the town to comparatively higher level town areas to reduce the flood damage potential.
Lakhnallti bund on Yamuna river
Problem: The flood problem of Yamuna river is mainly confined to the reach below the barrage at Tajewala due to overflow of natural banks affecting the States of UP, Haryana and NCT of Delhi. Apart from overflow, the river also exhibits bank erosion in this reach which is usual in alluvial plains.
Scheme: Lakhnauti bund on the left bank of Yamuna near Saraipur village, about 72 km . '.
downstream of Tajewala weir was constructed by UP during 1962-63 for a length of 7.2 km to prevent development of spin channels of Yamuna river and prevent over bank flow .
. Afterwards it was extended by 4 km and number of bank protection works added. The bund protected 12 villages on countryside.
Performance and evaluation: GFCC, Patna had got done the work of performance evaluation of Lakhnauti Bund. The performance was evaluated with reference to pre and
76
post project status in the protected area. The effect on river regime and hydrology I drainage conditions, engineering features, damage before and after project, Socio-economic aspects of the protected as well as neighboring unprotected area etc. was evaluated and submitted its report in 1991. After evaluation GFCC came with some positive results and some suggestions. Some of the salient findings of the report are discussed below. Lakhnauti Bund has fulfilled it's primary objective of preventing development of spills through protected area and overflowing of both the river and the spills. Even in the Severe flood of 1978, which is the highest on record, the flood was within the embankments. No drainage congestion in the protected area is induced due to this bund because the country side of the bund is adequately drained by River Saindli. The direct benefits include reduction of damage to crops, animals and property while the indirect benefits relate to improvements in demographic, educational, public health and hygiene and housing facilities. There has been no damage due to floods in the protected area after the construction of the bund. There is now no dislocation of living conditions due to floods. The standard of houses has improved. There has been an overall improvement in health conditions. Most villages now have drinking water and electric power supply. The communications have improved. There is significant increase in area irrigated, a clear cut shift from flood grains to cash crops, and
) in use of inputs, labour and crop yields.
Gandak Project
Prior to 1954 Gandak River was provided with some marginal embankments on both the banks in the districts of Chapra, Siwan, Gopalganj, East and West Champaran and Muzaffarpur.
These embankments on river Gandak has served satisfactorily for over a century and will continue to provide substantial control over the floods from Gandak on its lower reaches lying in Bihar. But the discontinuity in the embankment was posing on and off problems to the people in its lower reaches. To overcome the problems, embankments in the discontinuous reaches were planned with a view to arrest large floods within the embankments providing security and relief to the people of the districts of Chapra, Siwan, Gopalganj, Champaran, Muzaffarpur, Vaishali etc. in Bihar and a few districts in Easteffj UP. W'ith this the entire length of Gandak River in the eastern bank up to Hazipur has been embanked. Comparative study of the average flood damage done by GFCC shows that there is. decline in the value of damages during the post project period.
Kosi embankment
The flood embankments on both the banks of Kosi river which were mostly completed as early as 1957 have on an average protected 5.28 lac acres of land in Darbhanga (1.17 lac) and Saharsa (4.11 lac) districts of Bihar fromthe ravages of flooding. Kharif crops on this land were formerly badly damaged and even Rabi sowing was sometimes affected by standing water and excessive moisture. Severe damage was also caused to properties like buildings, orchards etc. Prevenicion of flooding in this' area on account of the project has rendered following incidental benefits:
(i) Reduction of flood and water logging and consequential improvement in general health.
(ii) Reclamation for cultivation of large areas of land which were formerly infested with 'Kans and Pater'.
(iii) Construction of a network of metalled roads and other communication system in the area.
(iv) Opening of various industries / factories. . .
. . .
In addition to benefits to Bihar (India) from the project, Nepal is also drawing large benefits from it through protection from flood, stability of river in the upstream to some extent and better communication system at flood time apart from power and irrigation facility.
The Programme Evaluation Organization of the Planning Commission under-took evaluation of the embankment project with a view to ass@ss the economic benefits of the project. They also substantiated the above benefits from the project.
" Yamuna Embankments in Delhi
The Yamuna is provided with embankments on both sides in the reach near Delhi to provide flood protection to the population and agricultural land. However due to breaches in embankments during high floods, the protected area gets flooded occasionally. After the severe flood of 1978, the embankments were strengthened and raised giving reasonable protection to Delhi· against flood. There was an apprehension that such strengthening andraising of embankments will further accentuate flood problem needing further raising of embankments.
However, studies regarding impact on gauge and discharge at different river sections due to construction of embankments , bridges and barrage constricting the water-ways, showed no perceptible rise of flood level as compared to pre-embanked period as well as pre-constriction period. But studies have indicated that during high floods, the scouring of bed and banks takes place restricting the rise in -flood level and during falling flood, silting · of bed and sides takes place there by keeping the regime more or less in its' original State ..
78
ANNEX - 8.1
'
SI. j State / District No. i
I
lNo. of Talukas Area of the District (sq km)
As per ewe IS study No. of Talukas
affected by drought
Area affected by drought
(sq km) 1 2 3 4 5 6 I. ANDHRA PRADESH 79 125113.03 19 32839.51
l. Anantpur 11 19134.90 5 10455 ;8C 2. Chittoor 11 15143.10 -3. Cuddapah 9 15372.90 I 1473.70 4. Hyderabad 9 7762.49 3 3157.90 5. Kurnool II 17600.40 2 3825.97 6. Mahbubnagar 12 18472.00 3 4285 .00 7. Nalgonda 7 14223.24 I 1772.05 8. Prakasam 9 17404.00 ' 4 7869.0C
II. JHARKHAND 15 43384.50 . 9. Munger 4 7884.50 -
III. BIHAR
10. Nawadah 1 2494.00 -11. Palamau 3 12019.90 - -12. Rohtas 2 7199.70 -13. Bhojpur . 2 3971.10 -14. Aurangabad 1 3305.00 - -15. Gaya 2 6510.30 -
IV. GUJARAT 124 121238.90 103 106818.40 16. Ahmedabad 7 8565.90 5 7530.3C 17. Amreli 10 6711.40 10 6711.4C 18. Banaskantha 11 12404.30 9 11018.1C 19. Bhavnagar 12 9786.30 12 9786.3C 20. Bharuch 11 7805.70 11 7805.7C 21. Jamnagar 10 10143.00 10 10143.0C 22. Kheda 10 , 6888.10 3 2407.0C 23. Kachchh 9 19476.50 9 19476.5C 24 . Mahesana 11 9011.80 3 2803.5C 25. Panchmahals 11 8849.80 10 7975 . IC 26. Rajkot i3 11152.30 12 10667.7C 27. Surendranagar 9 10443 .80 9 10443.8C
V.HARYANA 15 16587.85 8 8338.50 28. Bhiwani 4 4657.38 4 4657.38 29. Gurgaon 5 4862.80 2 1462.44 30. Mahendragarh 3 3221.67 2 2218.68 .31. Rohtak 3 3846.00 -
VI. JAMMU & KASHMIR 8 15999.30 2 2407.60 32. Doda 4 11691.00 -33. Udhampur 4 4308.30 2 2407 .6C
-, ··C'.
VII. KARNATAKA I -139 152163.33 42 57645.54 34, Bangalore I! 11 7949,50 - -35, Belgaum ·1 10 13460.80 1 1996,00 36. Belial}' 8 9548.50 3 3994,3Q 37. Bijapur 11 17092.83 7 12477.44 .. 38. Chikmagalur 7 7222.00 1 804 .8(J 39 . Chitradurga 9 10754,50 5 7477 .50 40. Dharwad 17 13480.10 3 2772,32 41. Gulbarga 10 16167,80 5 8131.00 42. Hasan 8 6833,30 1 1277,80 43. Kolar 11 8215,20 4 3444,70 44. Mandya 7 I 4961.00 1 1034.28 45. Mysore 11 I: 11947,00 I 1235 ,90 46. Raichur 9 13972.40 4 6347.6C 47 , Tumkur 10 10557,70 6 6651,90
VIII.MADHY A PRADESH 47 87219.52 26 37307.93 48. Betul 3 7062,90 -49. Datia 2 2034.00 -50. Dewas 5 6723 ,50 3 4219.00 51. Dhar - 5 8195.41 4 6287,00 52. 1habua 5 6792.80 5 6792.8C 53 . Khandwa - 3 6379,60 1 1865,00 54. Khargone 8 13490.00 5 6955 .3'1 55. Shahdol 4 13860,06 - -56. Shajapur 4 6178 ,00 3 4533 ,0'1 57 . Sidhi 3 10390.75 I 3768.49 58. Ujjain 5 6112.50 4 4887.2C
IX. MAHARASHTRA 100 123767.05 45 57664.70 59. Ahmednagar 13 16762,20 7 9491 .8C 60, Aurangabad 12 16385 .00 2 3111.3~ 61. Bir 7 11169.00 3 4595 ,OC 62. Nasik 13 15631.50 7 8098.9,(: 63 , Oomandabad 11 14027.00 7 9515 ,OC 64. Pune 14 15688.20 4 4932.1C 65. Sangli 8 8610.25 5 5939.6E 66. Satara _ II _10436.90 4 3878.5C 67. Solapur II 15057.00 6 8102.5C
X. ORISSA 6 22862.41 1 2002.0" 68. Phulbani 3 11090.41 1 2002.01 69. Kalahandi 3 11771.00 -
XI. RAJASTHAN 76 218950.45 57 194203.27
70. Ajmer 5 8449.60 3 4317.8C 71. Banswara 5 5055.00 5 5055 .0C 72. Barmer 5 29521.40 5 29521.4C 73. Bikaner 4 27396.40 4 27396.4C 74. Churu 7 16861.35 7 16861 .35 75. Dungarpur 3 3770.00 3 3770.0C 76. 1aisaJmar 2 41674.30 2 41674 .3C 77 . 1alore 4 10554.40 3 8308.8C 78 . Jhunjhunun 4 5928.00 3 4460.2C 79. Jodhpur 5 22633 .80 5 22633. 8C 80. Nagaur 8 17628.00 8 17628.0C 81. Pali 7 12211.20 2 4763.8C 82. Udaipur 17 17267.00 7 7812.42
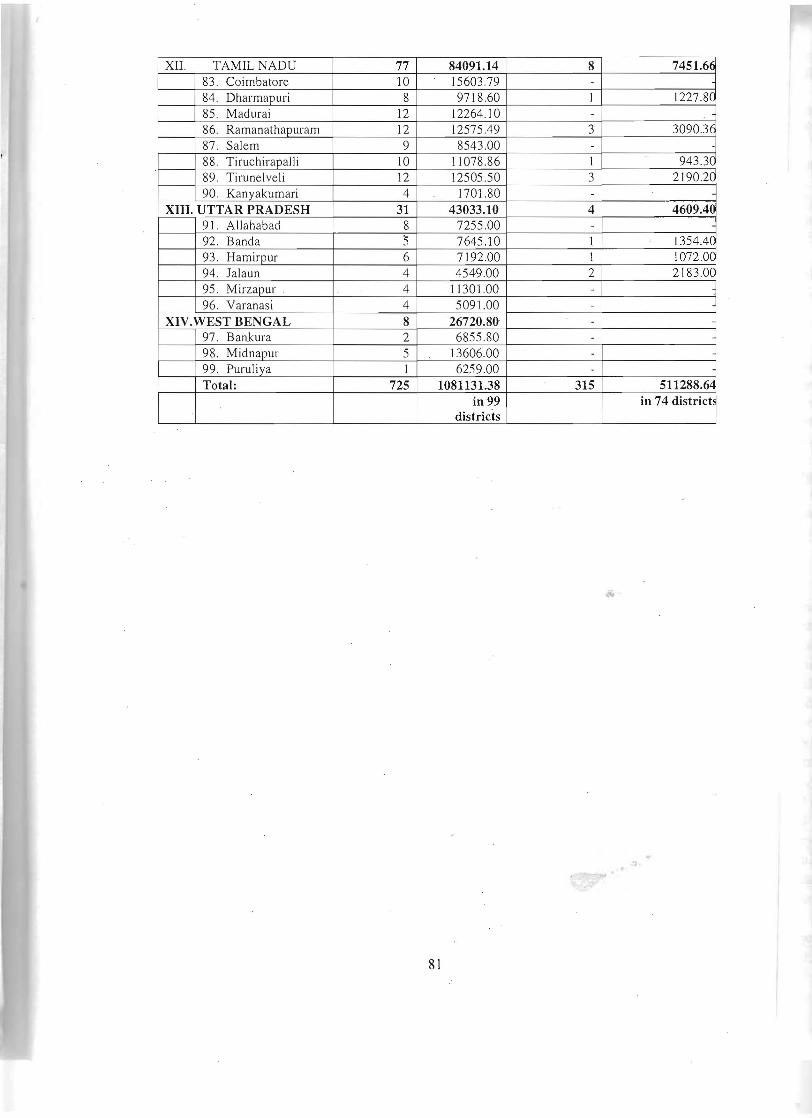
XII. TAMILNADU 77 84091.14 8 7451.66 83. Coimbatore 10 15603.79 -84. Dharmapuri 8 9718.60 1 1227.8C 85. Madurai 12 12264.10 -86. Ramanathapuram 12 12575.49 3 3090.3E 87. Salem 9 8543.00 -
88. Tiruchirapalli 10 11078.86 I 943 .3C 89. Tirunel veli 12 12505.50 3 2190.2C 90. Kanyakumari 4 1701.80 -
XIII. UTTAR PRADESH 31 43033.10 4 4609.40 91. Allahabad 8 7255.00 -
92. Banda :; 7645.10 1 1354.4C 93. Hamirpur 6 7192.00 1 1072.0C 94. Jal aun 4 4549.00 2 2183.0C 95. Mirzapur 4 11301.00 -
96. Varanasi 4 5091.00 -
XIV.WEST BENGAL 8 26720.80 -97. Bankura 2 6855.80 -98. Midnapur 5 13606.00 -
99. Puruliya I 6259.00 -Total : 725 1081131.38 315 511288.64
in 99 districts
in 74 district
81
INDIA
CHINA
'TIBET .
OCEAN
Fig.1A
82
J
5z~OIO Oms: -<°0 m-i;;o»»m ;;0;;0
r-t£,£tC.J
PRODUCTION IN MILLION TONNES
... ... N N
0 ~ o o
UI o
o o
UI o
0 o o o o o 1950·51
1951·52
1952·53
1953-54
1954-55
1955-56
1956·57
1957·58
1958-59
1959-60
1960-61
1961-62
1962-63
1963-64
1964-65
1965-66
1966-67
1967·68
1968-69
1969-70
1£"0·71
1971-72
1972-73
1973-74
-< 1974-75 m > 1975-76 ::tJ
1976-77
1977-78
1978-79
1979-80
1980-81 O-i);"O;;oJ;;;o5;;o 1981-82 ~ZmO~
1982-83 G)~~OG)Is:,,-<I 1983-84 -ir="m-i-,m»-< 1984-85 "C5 0;;0 m
1985-86 » ;;0 1986-87
1987-88
1988-89
1989-90 !:!
1990-91
1991-92
1992-93
~~ 1993-94
1994-95
1995-96
1996-97
1997-98
1996-99
1999-2000
,
, ,-
, -,
-
"TI cC"
- N

"
:00
,~
'
Fig
. 2.
1 t,
I,
FLO
OD
DA
MA
GE
-A
RE
A A
FFE
CT
ED
& P
OPU
LA
TIO
N
AFF
EC
TE
D
-.-
AR
EA
AF
FE
CT
ED
__
PO
PU
LAT
ION
AF
FE
CT
ED
(U
NA
DJU
ST
ED
)
-+-
RE
GR
ES
SIO
N L
INE
AR
EA
AF
FE
CT
ED
z
. ~REGRESSION L
INE
PO
PU
LAT
ION
AF
FE
CT
ED
J1.lN
AE
lj-tjS
-'fE
D
o ::::;
80.0
0 7
c >
'
..J :i
~
70.0
0 z o ~
60.0
0 ..
J ::J
Q. o
50.0
0 Q
.
~
~
40.0
0 0:
: < t; 30
.00
w
::I: ~
20.0
0 ::::;
..
J :i 1
0.00
z ~
0.00
+I--~i-,-.-'r-.-r-~.-.-'-.-~~-r-r~~-.-.-.-.~.-r-.-.-~'-.-.--.-r-r~~-.-.-.-.r-.-r-~.-.-.-.-.-~
0::
~
<
~~
~ ~
~Q)
ro"
ro~
ro~
· ~
Q)'o
Q)
~"
~~
~~
~"
~Q)
':0"
':O~
':O~
~
':OQ)
2>
" Q)Q
)~ 2>~
2>"
,,~ 2>
Q)
"Q)
. Q)
~ "Q
) "Q
) ,,
~ ,,~
,,~
,,~
"Q)
"Q)
"Q)
"Q)
"Q)
,,~
,,~
,,~
,,~
,,~
,,~
" ,,~
"Q)
" "
YE
AR
"'

r-i..
, C'! ( N
·~IIJ,. .
0 1 LLI t-U LLI U. U. <C Z 0 ..... t <C .... ~ CL 0 CL
I
LLI ~ <C :E <C C C 0 0 .... U.
I ~ :-: .
LS3 ~
966L
£66~
~66 ~
686~
L86~
--. 986J 0 UJ f
£86~C/)
:J-, 0
~86 ~$ 0 UJ f 6L6~() UJ u.. u.. LL6~ ~« «z wa >i= 9L6~
.« ...J :J
£L6~CL a CL
--. I f ~ a --. 0::: 0 ~ UJ
f-z C/)a :J -,i= 0« ...J « :J Z CL :J a
0CL UJ
0::: f ()o a
u..UJ UJ u..f- 0
C/) u..UJ:J -, f- «
C/) z0 :J a« -, z 0 i= :J «$ ...J
:J0 0 CLUJ UJ f- f- a () () CL UJ u.. u.. «
UJ u.. u.. «
UJ Z :J
UJ z :J
z a i= 5
z a i= :5
z Q C/) C/) UJ
z a U5 C/) UJ
:J :J 0::: 0::: CL CL ~ ~ a CL
a CL
UJ 0:::
UJ 0:::
+ + + +
0 0 0 0 0 0 co "
0 0 0 0 0 0 0 0 0 0
0 0 0 0 0 0 ~ ~
<0 L[) (") N"'". N0l111W NI NOI1YlndOd
~L6~
696~
L96~
996~
£96~
~96~
696~
L96~
996~
£96~
0 0 0
. 85
o o 6 o L{')
"""
o o 6 o o
"""
o o o o L{') C"')
o o 6 o o C"')
o o o o L{') N
o o o o o N
o o o o L{')
S3~O~~ ·S~ NI S3~'VW'Va
666~
966~
L66~
966~
S66~
P66~
£66~
l66~
~66~
066~
696~
996~
L96~
996~
S96~
P96~
£96~
196~
~96~
og6~
6LM
9L6~
LL6~ 0::
9L6~ <W
SL6~ > PL6~
£L6~
lL6~
~L6~
OL6~
696~
996~
L96~
996~
S96~
P96~
£96~
196~
~96~
096~
6C;6~
9S6~
LC;6~
9S6~
SS6~
VS6~
£S6~
0 0 0 0 0 0 6 6 6 0 0 0 L{')
86
LS
DAMAGES IN RS. COROES ..... ..... ..... ..... ..... I\)
I\) 0) co 0 I\) 0) co 0 +>-+> 0 0 0 0 0 0 0 0 0 0 0 '0 0 0 0 0 0 0 0 0 0 0 0 0 0 0 0 0 0 0 0 0 0 0 0 0 0 0 0 0 0 0 0
1953-54
1954·55
1955·56
1956·57
1957-58
1958·59
1959·60
1960-61
1961·62
1962-63
1963-64
1964·65
1965-66
1966·67
1967-68
1968-69
1969·70
1970·71
-<
1971·72
1972·73
1973·74
1974·75
1975·76
m 1976·77» :::0 1977·78
1978·79
1979-80
1980·81
1981·82
1982-83
1983-84
1984-85
1985-86
1986·87
1987·88
1988·89
1989·90
1990·91
1991-92
1992·93
1993·94
1994·95
1995·96
1996-97
1997·98
1996-99
1999-2000
I
++::0 (") m ::0G')O ::0 "'C m 0 C/) » ~ :;: o » z G') r mZ C/)
m
~
=en t-t~
""0 ::C-a no ~l> ~3: -al> ~~ Om ott)C:l>q-t t-t ....<\0 t-t\O
~wOu, .,,~
.... -a \0 UI ~ .... o n m UI tt).... ~
'11 cO' N ~:

Fig. 4.1 FLOOD PLAIN ZONING
o FREQUENT FLOOD( III)
o o o o
o . FLOOD ONCE IN 25 YEARS (II) NORMAL CHANNEL
o FLOOD ONCE IN 100 YEARS (I)
i
luublill;mUUMI \
UNIVERSITY
l
\
. POWER HOUS
FLOOD PLAIN ZONING
WARNING RESTRICTIVE PROHIBITIVE RESTRICTIVE WARNING
II III II
RIVER CHANNE
88
"'C
C
IU
III
:l
0 .s::.
I
0)] 1
'=
CDco
J
, :l
iii
>
PH
YS
ICA
L P
RO
GR
ES
S O
F F
LO
OD
CO
NT
RO
L W
OR
KS
(S
ince
195
4)
Fig
. 5.
1
35
TI-
------
-'-
-----
----
-------
---
30
+1
-------------------------------------------,
25
'
20
15
10
~
5
-------
-'
o~
r===
: :
1st
PLA
N
2nd
PLA
N
3rd
PLA
N
AN
NU
AL
4th
PLA
N
5th
PLA
N
AN
NU
AL
6th
PLA
N
7th
PLA
N
AN
NU
AL
8th
PLA
N
9th
PLA
N
(195
4-56
) (1
956-
61)
(196
1-66
) .
PLA
N
(196
9-74
) (1
974-
78)
PLA
N
(198
0-85
) (1
985-
90)
PLA
N
(199
2-97
) (1
997
-200
2)
(1966~69)
(199
0-92
) up
to 1
993
upto
199
8PLA~J1978-80)
--.-
----.,--...-
'-.-..-.--.....
--..-..-...
..----
..-----..
--..... --.-
-.----.-.
----
-..----
-.--.
J [~A
rea P
rote
cted
in T
hous
and
Ha.
_
__
Dra
inag
e C
hann
el in
Km
. -if
-T
own
prot
ectio
n in
1/1
0 N
o.
----
*-E
mb
an
kme
nt
in K
m.
---~---
.. --.-
. "
. --'
-'~--.
--.
. _..
. ' " ..
..._.
. -_.
...-._
---
---_
.__._.
. .__
.-.,-
--_.__
.....
,--
._--
-_
. -
-.....
-'"
' ..
__..
-.
_..
_
....
. ---
_.-
---_
._--
----
----
---
--_..
._
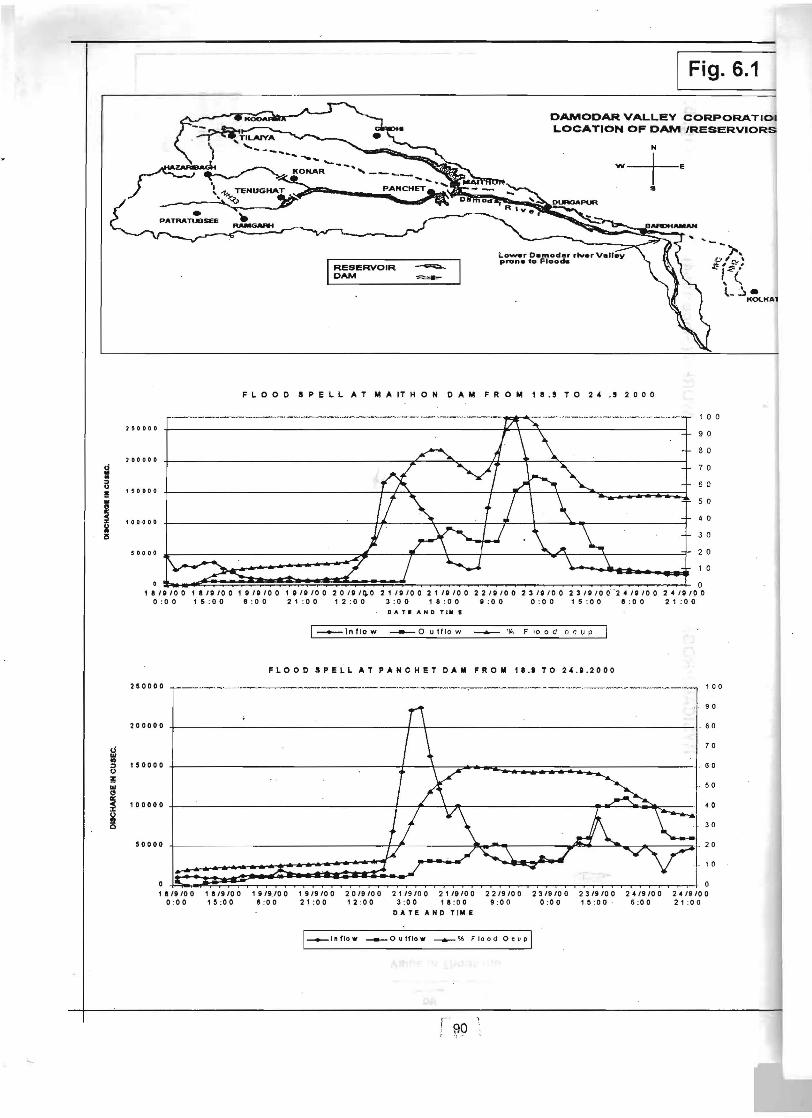
Fig. 6.1
I~~ERVOIR
DAMODAR VALLEY CORPORATIOI LOCATION OF DAM IRESERVIO
FLOOD S P E II AT M A IT H 0 N DAM FRO M 18 . ' TO 2 ~ ., 2000
~ .. :> u ~ • ~ II 15
,~oooo
200000
'50000
'00000
50000
1 0 0
90
8 0
'l 0
6 0
50
4 0
3 0
2 0
1 0
• 0 1 a 10 10 0 1 a 10 10 0 1 010100 1 010100 201011).0 21 10100 21 10100 2210100 2310100 231010 (i ' , 4 10 10 0 2410100
0 : 00 15:00 8 : 00 21 : 00 12 : 00 3 : 00 '8 : 00 0 : 00 0:00 '5 : 00 8 : 00 21:00 DATIANDTUt.
I_In 110 W - 0 utflo w --.....- % F 100 d 0. 0 I) P ]
FLOOD SPELL AT PANCHET DAM FROM 11.1 TO 2~.1 . 2000
U III.. :>
III '"\) U
II<:
~ ~ 0
250000 --.----------------------------. ------·---··---··-·- ·---·--·--1
200000
'50000
'00000
50000
,
9 0
80
70
60
50
40
30
2 0
'0
, a 1910 0 , a1910 0 , 919./00 , 919100 2019100 '"9100 2 , 19100 2219100 2319100 2319100 2419100 2419100 0 :00 '5 :00 8 : 00 2' :0012 :00 3:00 '8 : 00 9 :00 0 :00'5 :00 6 :00 2' :00
D ATE A H D TIM E
00
1-..-1 ft flo w ____ F 100 dOc u p I0 u trio w ----.- %
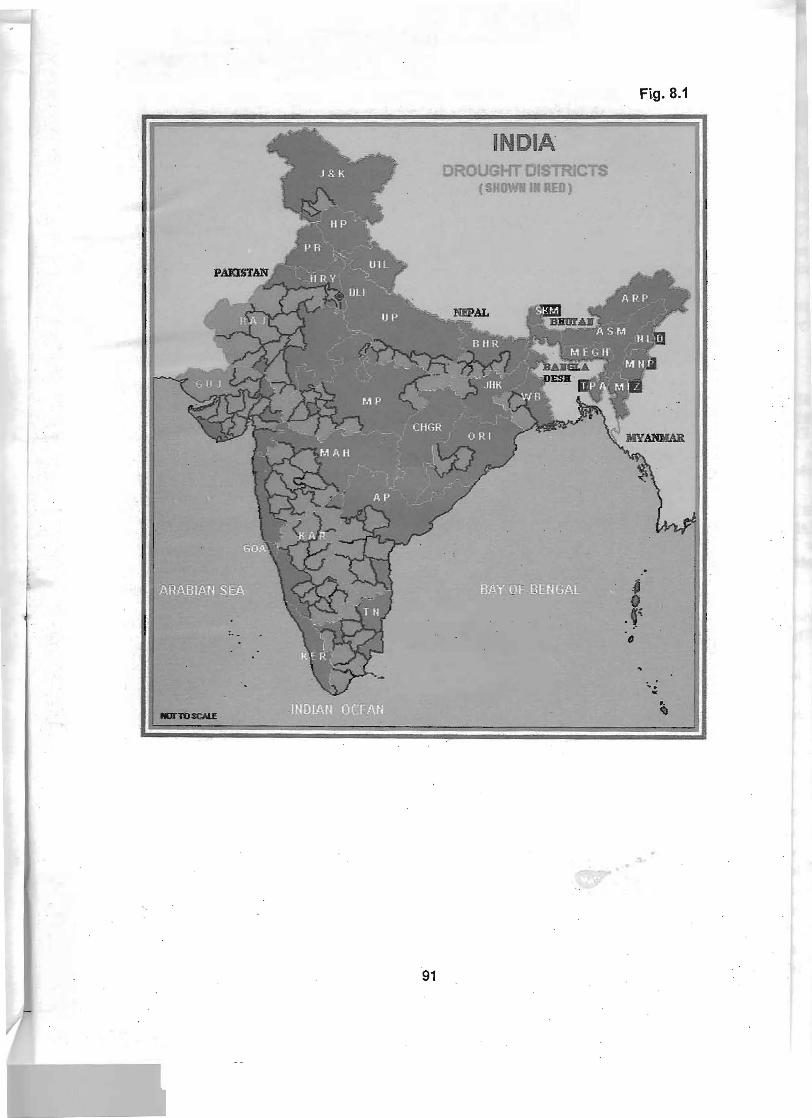
Fig. 8.1
INDIA
."
. . ~...
91
...
..-•
-

River Bank Erosion Protection
Printed at :Jolly Reprographics Ph. 5850443, 5744989