Embed Size (px)
Citation preview
Maja Bučar with andreja jaklič and Boštjan udovič
national systeM of innovation in slovenia
Cir
ana
lyse
s 4
NatioNal system of iNNovatioN iN sloveNiaEditor and main author:Maja Bučar
Co-authors:Andreja Jaklič (Chapter 2. and 8.3)Boštjan Udovič (Statistical annex) Electronic book series analize Cmo / CiR analysesEditor: Sabina KajnčEditorial board: Sabina Kajnč, Andreja Jaklič, Matija Rojec, Ana Bojinović Fenko
Reviewers: Slavo Radošević in Jana KolarBook design: Luka Kaše
Publisher: Faculty of Social Sciences, Založba FDV
Copyright © Faculty of Social Sciences, University of Ljubljana, 2010.All rights reserved. No part of this publication may be reproduced, stored in a retrieval system, or transmitted in any form or by any means, electronic, mechanical, photocopying, recording or otherwise without the prior permission of the copyright owner.
The publication has been prepared on the request of the Ministry of Higher Education, Science and Technology (MHEST). The views expressed in this publication are the sole responsibility of the authors and do not necessarily reflect the views of MHEST.
Accessible at: http://www.mednarodni-odnosi.si/cmo/cir-analyses.htm
CIP - Kataložni zapis o publikacijiNarodna in univerzitetna knjižnica, Ljubljana
001.895(497.4)
BUČAR, Maja, 1957- National system of innovation in Slovenia [Elektronski vir] / Maja Bučar with Andreja Jaklič and Boštjan Udovič. - El. knjiga. - Ljubljana : Fakulteta za družbene vede, 2010. - (Analize CMO = Electronic book series CIR analyses)
Način dostopa (URL): http://www.mednarodni-odnosi.si/cmo/cir-analyses.htm
ISBN 978-961-235-407-71. Jaklič, Andreja 2. Udovič, Boštjan, 1980
252790272
MAJA BUČAR WITH ANDREJA JAKLIČ AND BOŠTJAN UDOVIČ
NatioNal system of iNNovatioN iN sloveNia
Ljubljana, 2010

5
TABLE OF CONTENTS
ABBREVIATIONS .................................................................................................................. 11
1. INTRODUCTION ............................................................................................................. 13
2. MACROECONOMIC PERFORMANCE AND FRAMEWORK CONDITIONS FOR INNOVATION .................................................................................................................. 152.1 Drivers of macro-economic growth .............................................................. 152.2 Major structural features of the Slovenian economy ............................... 202.3 Innovation and economic growth .................................................................. 232.4 Framework conditions for innovation .......................................................... 25
2.4.1 Entrepreneurial culture ............................................................................ 252.4.2 Conditions for doing business ................................................................ 27
3. SLOVENIA’S R&D AND INNOVATION PERFORMANCE ....................................... 313.1 Volume and composition of GERD ................................................................. 333.2 Number and composition of research personnel ..................................... 363.3 Publications and citations .................................................................................. 383.4 Patenting, industrial design and trademarks .............................................. 403.5 Innovation performance of businesses......................................................... 43
4. ORGANISATIONAL PROFILE OF SLOVENIA’S NATIONAL INNOVATION SYSTEM (NIS) ...........................................................................................................474.1 Overview of major actors .................................................................................. 474.2 R&D and innovation activities in the business sector .............................. 474.3 Higher education ................................................................................................. 484.4 Public research organisations .......................................................................... 514.5 Non-profit research organisations ................................................................. 524.6 Intermediary organisations and professional associations .................. 53
5. LINKAGES OF THE NATIONAL SYSTEM OF INNOVATION IN SLOVENIA ....... 635.1 Linkages of enterprises through the innovation processes .................. 635.2 Other internal linkages in NIS ........................................................................... 655.3 External linkages- internationalisation of RTDI processes ..................... 67
6. GOVERNANCE – THE ROLE OF PUBLIC POLICY ................................................... 696.1 The structure of STI policy governance ......................................................... 69
6.1.1 National governance .................................................................................. 696.1.2 Regional governance of innovation .................................................... 72
6.2 Regulatory framework and STI policy ............................................................ 756.3 STI policy formulation and priority setting processes ............................ 786.4 The role of policy tools in STI policy formulation ...................................... 796.5 Characterisation of the overall policy mix ................................................... 82
6
6.6 Instruments ............................................................................................................. 836.6.1 Promotion of business R&D and technological innovation ............... 846.6.2 Promotion of human resource development in R&D and
innovation .......................................................................................................876.6.3 Promotion of public-private partnerships for innovation and
entrepreneurship .............................................................................................. 906.6.4 Steering and funding of public research organizations ...................... 916.6.5 Other measures .................................................................................................. 956.6.6 Evidence of the impact of STI policy measures ...................................... 95
7. SWOT ANALYSIS OF THE SLOVENIAN NIS .............................................................. 997.1 National innovation system ............................................................................. 997.2 governance ..........................................................................................................1007.3 Impact of globalization on Slovenian NIS ..................................................101
8. HIGHLIGHTS ON SPECIFIC ISSUES .........................................................................1038.1 Innovation capabilities in the business sector ........................................103
8.1.1 SME’s innovation capabilities ................................................................1058.1.2 Public policies to foster innovation capabilities of businesses ...107
8.2 Human resources for STI ..................................................................................1098.2.1 Current or prospective mismatches between supply and
demand of human resources in science and technology ........1098.2.2 International inward (including Slovenian expatriates) and
outward mobility of HRST ....................................................................1118.2.3 Policy measures .......................................................................................111
8.3 Access and use of international knowledge and the internationali-sation of R&D .........................................................................................................112
8.3.1 Flow of technological knowledge ............................................................1128.3.2 Collaboration in international R&D programmes and initiatives ...114
9. SUMMARY AND CONCLUDING THOUGHTS .......................................................115
STATISTICAL ANNEX.........................................................................................................121
References ..........................................................................................................................143
Index ....................................................................................................................................147
7
iNdex of tables
Table 2.2.1: Output growth by industries (% annual change) .........................21Table 2.2.2: The most important trade partners of Slovenia (millions of EUR,
2008) .............................................................................................................22Table 2.2.3: The structure of trade (2008) ...............................................................22Table 3.1.1: Gross R&D expenditures (GERD) in Slovenia, 2000–2008, current
prices ..............................................................................................................33Table 3.1.2: Funding and performing sector in R&D (2008), final data ........34Table 3.1.3: Composition of R&D by sector of activity (% of GDP) ..................35Table 3.3.1: Number of publications of Slovenian (co)authors in recent five
year cycles in the bibliographical base ISI Web of Knowledge, Essential Science Indicators ..................................................................40
Table 3.4.1: Patents and patent applications according to sector of applicant (2008 and 2009) .........................................................................................42
Table 3.5.1: Innovation activity of Slovenian manufacturing and service firms, as recorded in innovation surveys ..........................................43
Table 3.5.2: European Innovation Scoreboard: Slovenia ....................................45Table 4.2.1: Business R&D by sector of performance in 2007 (1000 EUR) ....48Table 6.6.1: List of measures as per Trendchart/ERAWATCH database ..........84Table 8.2.1.1: Number of S&T graduates of tertiary education, all levels, 2009 110Table SA1: GDP growth .............................................................................................. 121Table SA2: Output growth by industries (% annual change) ...................... 121Table SA3: Output by activity (million of EUR) ................................................... 122Table SA4: A list of summary indicators ............................................................... 123Table SA5: Labour productivity per person employed (EU27=100) .......... 124Table SA6: FDI to and from Slovenia (million of EUR) ..................................... 124Table SA7: High-tech manufacturing and services (year 2006) ................... 124Table SA8: Employment in high-tech as % of total employment ............... 125Table SA9: World Competitiveness Report Index ............................................. 125Table SA10: GERD as % of GDP (comparative view)........................................... 125Table SA11: GERD by type of costs (2007) ............................................................. 126Table SA12: GERD by socio-economic categories .............................................. 126Table SA13: R&D expenditures (GERD) per Researchers/Personnel (FTE) .. 126Table SA14: Share of government budget appropriations or outlays on
research and development (GBOARD) (% of total general government expenditure) .................................................................. 127
Table SA15: Gross domestic expenditure on R&D (GERD) by source of funds; Business enterprise sector (% of GERD) ......................................... 128
Table SA16: Researchers age cohort ....................................................................... 128
8
Table SA17: Researchers by sector of employment (heads), 2008 ............... 129Table SA18: Researchers by sector of employment (FTE), 2008 .................... 129Table SA19: Education in R&D.................................................................................... 129Table SA20: Employment in R&D .............................................................................. 130Table SA21: Share of women researchers (FTE): all sectors (% of total
researchers) .............................................................................................. 131Table SA22: R&D expenditures, citations, publications (EU27=100) ............ 131Table SA23: R&D expenditures, citations, publications (in 1000) .................. 132Table SA24: Population aged 25-64 having completed at least upper
secondary/tertiary education (2007) .............................................. 132Table SA25: Total expenditure on education as % of total public
expenditure for all levels of education (2006) ............................. 132Table SA26: Universities/faculties ............................................................................. 133Table SA27: Share of students in SSH and S&T + graduates (2007) ............. 133Table SA28: Share of students in SSH and S&T + graduates
(EU25/27=100) ........................................................................................ 133Table SA29: Doctorate students in science and technology fields (%
of the population aged 20–29) (year 2007) .................................. 134Table SA30: Graduates/PhD students (2007) ....................................................... 134Table SA31: Number of S&T graduates of tertiary education, all levels, 2009
135Table SA32: Patent granted by USPTO .................................................................... 135Table SA33: Patent application EPO/per mill. inhabitant ................................. 135Table SA34: Share of innovative enterprises cooperating by innovation
activity with other subject 2002–2004........................................... 136Table SA35: Share of innovative enterprises cooperating by innovation
activity with other subject 2004–2006........................................... 136Table SA36: Highly important sources of information for innovation, as
a percentage of innovative enterprises (2006) ........................... 136Table SA37: Share of Enterprises engaged in extramural 2006 (enterprises
engaged in extramural vs. enterprises with innovation activity) ...137Table SA38: Slovene Research Agency Budget for 2007 and 2009 .............. 138Table SA39: Research Programmes and Project Research Centres (outlays) –
share in total expenditure................................................................... 139
9
iNdex of figuRes
Figure 2.1.1: Domestic demand, investment and GDP growth .......................16Figure 2.1.2: Value added contributions to GDP growth by individual
sectors ...........................................................................................................17Figure 2.2.1: Enterprise survey on obstacles when engaging in business ...29Figure 3.1: Slovenian R&D expenditures in 2008 as per cent of GDP in
comparison with selected countries ..................................................31Figure 3.2: Average efficiency of R&D spending and share of expenditure
on R&D in GDP ...........................................................................................32Figure 3.1.1: Distribution of R&D expenditures by science field (2008) .......35Figure 3.1.2: Gross domestic expenditure on R&D (GERD) by sector of
performance and field of science, Slovenia (2008) .......................36Figure 3.2.1: Researchers by sector of employment, science field and gender,
in FTE (2008)................................................................................................37Figure 3.2.2: Number of Employed in R&D by education in FTE (2007) by
sector of performance .............................................................................37Figure 3.2.3: Spending per researcher (FTE) by sector of employment, in
1000 .............................................................................................................38Figure 3.3.1: Selected R&D output indicators ........................................................40Figure 3.4.1: Patent applications in selected countries (EPO/per million
inhabitants) .................................................................................................41Figure 3.4.2: Slovene IPR position in relation to EU27 (EU27=100) .................42Figure 3.5.1: Innovation activity by size of firms, in % .........................................44Figure 4.3.1: Students (ISCED 5-6) studying in another EU-27, EEA or
Candidate country – as % of all students .........................................50Figure 5.1.1: Share of innovative enterprises cooperating by innovation
activity with other subject 2002–2004 and 2004–2006 .............63Figure 5.1.2: Highly important sources of information for innovation, as a
percentage of innovative enterprises, 2004–2006 ......................64Figure 6.1.1: Organogram of the STI governance ..................................................70Figure 6.1.2.1: R&D activity per NUTS 3 regions .......................................................73Figure 6.1.2.2: Rate of increase of GERD according to the cohesion regions
(2005=100) ..................................................................................................75Figure 6.6.4.1: SRA allocations, according to annual financial statements
(years 2007, 2009) ................................................................................92Figure 8.1.1: Innovation expenditures by size of the firms, 2004-2006, in % .104Figure 8.1.2: Innovation expenditure of all firms, 2004-2006, in % .............. 104Figure 8.1.3: Innovation active enterprises as % of all firms ........................... 105Figure 8.1.1.1: Innovation expenditures of small firms, 2004–2006, in % ... 106
10
Figure 8.2.1.2: S&T doctoral graduates in Slovenia and EU 27 in 2006 .......... 110Figure SA1: Employment in high-tech as % of total employment ............. 139Figure SA2: Basic, Applied Research and Experimental Development
2004–2007 in 1000 EUR ...................................................................... 139Figure SA3: Graduates/PhD students (2007) ..................................................... 140Figure SA4: Human Resources stock in Science and Technology (between
25–34 years) as a % of total population (years 2000–2008) ... 140Figure SA5: Human Resources stock in Science and Technology (between
25-34 years) as a % of total population (year 2008) .................. 141Figure SA6: Highly important sources of information for innovation, as a
percentage of innovative enterprises (2006) ............................... 141
11
ABBREVIATIONS
beRd Business Expenditures for Research and DevelopmentCa Coordinated ActionCCis Chamber of Commerce and industry of SloveniaCe Centres of ExcellenceCee Central and Eastern EuropeCeeC Central and Eastern European CountriesCf Cohesion FundCiR Centre of International RelationsCis Community Innovation SurveyCobiss Cooperative Online Bibliographic System& ServiceseC European Commissioneea European Economic Areaeis European Innovation ScoreboardePo European Patent OfficeeRa European Research AreaeRa-Net European Research Area Network projectseRdf European Regional Development Fundesf European Social FundetP European Technology Platformeu European UnioneuR EURO – currency of the Euro zoneeuRostat European Union Statistical OfficeeuReKa Inter-governmental programme for R&D SMEseuRostaRs EU Article185 programme for R&D support to SMEsfdi Foreign Direct InvestmentsfP Framework Programmefte Full-time equivalentgdP Gross Domestic Productgem Global Entrepreneurship MonitorgeRd Gross Expenditures for Research and DevelopmentgoveRd Government Intramural Expenditures for Research and DevelopmentHei Higher Education Institute(s)HeRd Higher Education Expenditures for Research and DevelopmentHRst Human Resources for Science and TechnologyiCt Information and Communication TechnologiesiJs Institute Jozef Stefanimad Institute for Macroeconomic Analysis and DevelopmentiPR Intellectual Property RightsisCed International Standard Classification of Educationisi International Science Index
12
it Information TechnologyJti Joint Technology InitiativeKoRis The coordination of directors of research institutesme Ministry of Economymess Ministry of Education, Science and SportmHest Ministry of Higher Education, Science and TechnologymNe/C Multinational Companiesmst Ministry of Science and TechnologyNdP National Development ProgrammeNis National Innovation SystemNRdP National Research and Development ProgrammeNsRf National Strategic Reference FrameworkNuts The Nomenclature of the Territorial Units for StatisticsoeCd Organisation for Economic Cooperation and DevelopmentoP Operational programmePaefi Public Agency for Entrepreneurship and Foreign InvestmentsR&d Research and Developments&t Science and Technologysds Slovenian Development Strategysef Slovene Enterprise FundsiCRis Slovenian Current Research Innovation Systemsid (bank) Slovene Export Corporation (Bank)sme Small and Medium EnterprisessoRs Statistical Office of the Republic of SloveniasRa Slovenian Research Agencyssa Specific Support Actionssf Slovenian Science FoundationssH Social Sciences and Humanitiessti Science, Technology and InnovationsstReP Specific Targeted Research Projectstea Terms of early-stage entrepreneurial activitytia Slovenian Technology AgencytP Technology platformsusPto United States Patent and Trademark Officevem ‘All at one place’ business pointWef World Economic Forum
13
1. iNtRoduCtioN
In economic theory as well as in policy the importance of innovation as one of the key determinants of long-run economic growth is widely recognized. The con-cepts like national innovation system (NIS) (Edquist 1997) and national innova-tive capacity as the ability of a country to produce and commercialize a flow of innovative technology over the long term (Furman et al. 2002) receive significant attention. In its ambition to secure the country long-term sustainable economic and social development, Slovenia is looking also at the national innovation system in an attempt to develop R&D and innovation capacities as important sources and determinants of economic growth.
Slovenian innovation system has over the years evolved through complex re-lationship of relatively influential public R&D sector, increasing presence of busi-ness as the key investor in R&D and innovation and a search for optimal govern-ance of innovation policy, also by looking at best practices in other countries. A survey of the existing system, with particular attention to the policy options, is especially useful and timely, since Slovenia needs to prepare some of its critical policy documents in the area of NIS, like the National Programme for Research and Development, National Programme for Higher Education as well as the cor-responding legislation (Law on R&D as well as Law on Higher Education).
The analysis looks at the NIS through the concept of national innovative capac-ity (Furman et al. 2002) and tries to capture the current state of affairs in all main areas, which build such capacity. First, national innovative capacity depends on the presence of a strong common innovation infrastructure: country’s overall science and technology capabilities and policy environment and the mechanisms in place for supporting basic research and higher education. Thus, the analysis presents the basic data on R&D and innovation and provides for the overview of the main ac-tors in Slovenian NIS: from business sector R&D and innovation activity to public R&D at the higher education institutions (HEI) and public research institutes. Not only is the capacity of each actor important, the linkages within NIS are seen more and more as detrimental for the successful innovation policy. Since the closer co-operation between public science and industry is seen as one of the important ways to improve effectiveness of the NIS on one hand and since the insufficient linkages between business sector and public R&D has often been singled out as one of the main challenges for the Slovenian NIS (PRO INNO Trendchart Country report on Slovenia 2008 and 2009), a special section of the analysis focuses on this issue.
The role of public policy in building the innovation capabilities of the main ac-tors is also very important. The structure of STI policy governance as well as policy
NatioNal system of iNNovatioN iN sloveNia14
formulation and priority setting is described in detail. The policy manifests itself through the R&D and innovation support measures. Both, the relevant measures for the business R&D and innovation promotion as well as funding of the public research organisations are presented, with some assessment of their comprehen-siveness and effectiveness.
Three groups of issues are singled out for specific attention: the innovation capabilities of the business sector, especially SMEs, the issue of human resources for STI and the internationalisation of R&D. These are some of the issues Slov-enian innovation policy makers will have to take into account when designing new policy measures.
The analysis concludes with summing up of the main issues which are relevant for the future innovation policy if it is to contribute to effective national innova-tion system.
15
2. maCRoeCoNomiC PeRfoRmaNCe aNd fRameWoRK CoNditioNs foR iNNovatioN
2.1 DRIVERS OF MACRO-ECONOMIC GROWTH
With stable and dynamic economic growth from 1997 to 2007 Slovenia constantly decreased development gap compared to the EU. International trade (foreign de-mand in particular) has been the major driver of economic growth and interna-tional integration, while foreign direct investment that could potentially increase productivity and technological upgrading remained modest and less important than in other new EU member states (Table 2.2.1).1 Economic crises has reduced trade flows significantly and economic activity declined sharply in late 2008 and 20092 (Figure 2.1.1), which interrupted the implementation of the Slovenia’s De-velopment Strategy goals in the field of economic and social development (IMAD 2010). As for the non-achievement of the goals in R&D and innovation area, the reasons go beyond the economic crisis alone.
The crisis almost wiped out progress in the field of economic and social devel-opment resulting from strong GDP growth and rising employment in the period of favourable economic trends. Slovenia failed to take advantage of those times for radical changes to facilitate technological breakthroughs and sustainable develop-ment. The crisis has exposed numerous structural weaknesses, particularly the fact that Slovenia’s GDP growth is overly dependent on low-technology industries and traditional services, which limit the competitive edge of its economy. A quick return to the trajectory of economic recovery and improvement of the popula-tion’s welfare is therefore a great challenge for Slovenia, especially as the economic crisis severely affected the medium-term fiscal position and availability of sources of finance, and as the level of potential GDP also dropped. Relatively low growth of economic activity and employment in the coming years will be reflected in modest growth in general government revenue, which will make the consolida-tion of public finances even harder.
1 With 29 % share of inward FDI stock in GDP Slovenia lags behind EU average (35 %) and also other new EU member states (UNCTAD 2009).
2 Global trade declined in 2009, and Slovenia’s exports were down 15 %. The largest decline in domestic demand was recorded by investment, at 30 %. Private consumption also declined, but government spending increased.
NatioNal system of iNNovatioN iN sloveNia16
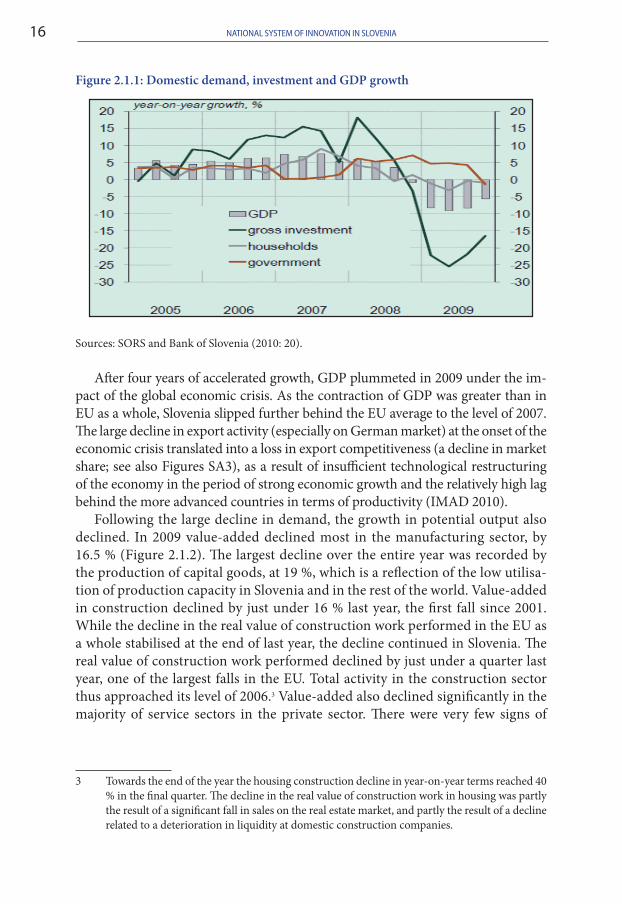
Figure 2.1.1: Domestic demand, investment and GDP growth
Sources: SORS and Bank of Slovenia (2010: 20).
After four years of accelerated growth, GDP plummeted in 2009 under the im-pact of the global economic crisis. As the contraction of GDP was greater than in EU as a whole, Slovenia slipped further behind the EU average to the level of 2007. The large decline in export activity (especially on German market) at the onset of the economic crisis translated into a loss in export competitiveness (a decline in market share; see also Figures SA3), as a result of insufficient technological restructuring of the economy in the period of strong economic growth and the relatively high lag behind the more advanced countries in terms of productivity (IMAD 2010).
Following the large decline in demand, the growth in potential output also declined. In 2009 value-added declined most in the manufacturing sector, by 16.5 % (Figure 2.1.2). The largest decline over the entire year was recorded by the production of capital goods, at 19 %, which is a reflection of the low utilisa-tion of production capacity in Slovenia and in the rest of the world. Value-added in construction declined by just under 16 % last year, the first fall since 2001. While the decline in the real value of construction work performed in the EU as a whole stabilised at the end of last year, the decline continued in Slovenia. The real value of construction work performed declined by just under a quarter last year, one of the largest falls in the EU. Total activity in the construction sector thus approached its level of 2006.3 Value-added also declined significantly in the majority of service sectors in the private sector. There were very few signs of
3 Towards the end of the year the housing construction decline in year-on-year terms reached 40 % in the final quarter. The decline in the real value of construction work in housing was partly the result of a significant fall in sales on the real estate market, and partly the result of a decline related to a deterioration in liquidity at domestic construction companies.
17macroeconomic performance and framework conditions for innovation
recovery even at the end of 2009. The contraction in activity in the service sec-tor is an indication of the gradual spread of the crisis from the export-oriented sectors of the economy to services.4
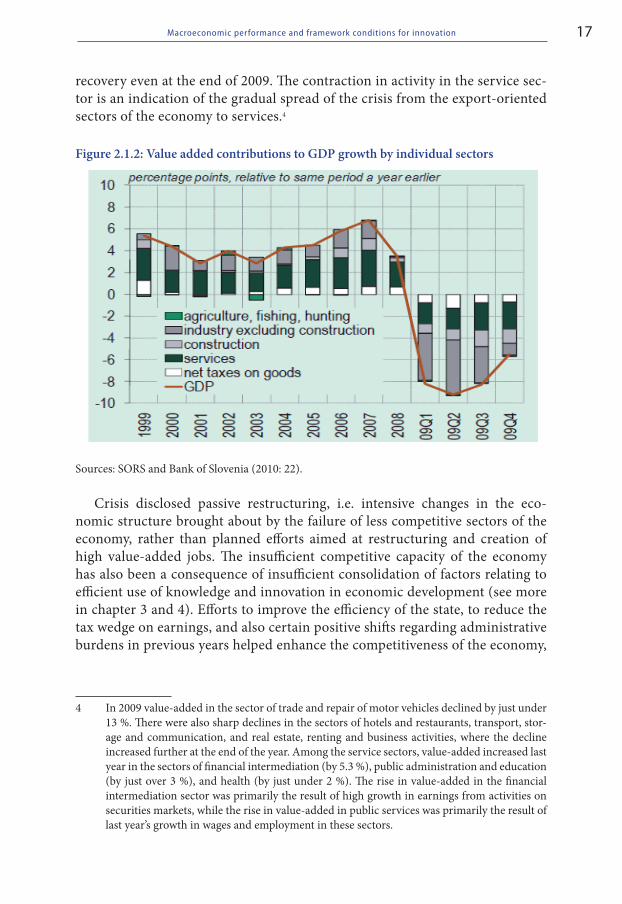
Figure 2.1.2: Value added contributions to GDP growth by individual sectors
Sources: SORS and Bank of Slovenia (2010: 22).
Crisis disclosed passive restructuring, i.e. intensive changes in the eco-nomic structure brought about by the failure of less competitive sectors of the economy, rather than planned efforts aimed at restructuring and creation of high value-added jobs. The insufficient competitive capacity of the economy has also been a consequence of insufficient consolidation of factors relating to efficient use of knowledge and innovation in economic development (see more in chapter 3 and 4). Efforts to improve the efficiency of the state, to reduce the tax wedge on earnings, and also certain positive shifts regarding administrative burdens in previous years helped enhance the competitiveness of the economy,
4 In 2009 value-added in the sector of trade and repair of motor vehicles declined by just under 13 %. There were also sharp declines in the sectors of hotels and restaurants, transport, stor-age and communication, and real estate, renting and business activities, where the decline increased further at the end of the year. Among the service sectors, value-added increased last year in the sectors of financial intermediation (by 5.3 %), public administration and education (by just over 3 %), and health (by just under 2 %). The rise in value-added in the financial intermediation sector was primarily the result of high growth in earnings from activities on securities markets, while the rise in value-added in public services was primarily the result of last year’s growth in wages and employment in these sectors.
NatioNal system of iNNovatioN iN sloveNia18
but still offer unexploited potential. The unfavourable ownership structure of the economy and large governmental influence within enterprises is still one of the main downsides.
The labour-market situation had already started to deteriorate towards the end of 2008 and proceed deteriorated significantly in 2009. Unemployment rose (current unemployment rate stands at 7.1 % by ILO definition) while employ-ment and employee compensation declined. Wage growth in 2009 was lower than in previous years and the number of recipients of various social benefits in-creased significantly as a result of higher unemployment. Intervention measures put in place by the government prevented a further deterioration of the situa-tion (subsidies to preserve jobs, a higher volume of active employment-policy programmes, special allowance for socially disadvantaged people). After declin-ing sharply since 2008 till the first quarter of 2009, labour productivity has been gradually rising as employment has continued to fall despite the stabilisation of economic activity (see Figure 2.1.2).
The main factors in inflation in 2009 were the deterioration in the macroeco-nomic environment, and the large fluctuations in energy prices. Headline infla-tion as measured by the harmonised index of consumer prices fell from an aver-age of 5.5 % in 2008 to an average of just 0.9 % in 2009. Core inflation indicators also fell sharply compared with the high levels of 2008. Year-on-year growth in certain core inflation indicators actually became negative in the first months of 2010. This was a reflection of the large decline in demand and economic activity, and the trend of decline in year-on-year growth in nominal labour costs. Because of the base effects, the high growth in the middle of 2008 and the rapid fall in energy prices towards the end of the year were major factors in the fluctuation in inflation in 2009. In the middle of 2009 there was a brief period of negative year-on-year growth in prices, as in the euro area. Inflation rose towards the end of the year as a result of the reversed base effects.
An expansive fiscal policy in the time of crisis changed the quality of public finances. Setting development priorities in public finances is a key priority, es-pecially at a time when Slovenia has to cope with a rapidly deteriorating public-finance position. The general government deficit had already widened in 2008 as a result of a lower tax burden and higher expenditure on wages and social transfers, while in 2009, the fiscal position deteriorated dramatically mainly as a consequence of the economic and financial crisis. General government debt also surged. The general government deficit in the first quarter of 2010 was up 131 million EUR in year-on-year terms, while the cumulative deficit over the last 12 months reached 6.0 % of GDP in March (Bank of Slovenia, Monthly Bul-letin, April 2010). Along with weaknesses related to the competitiveness of the economy, unfavourable public-finance movements thus pose the greatest risks to faster growth and development of Slovenia’s economy in the years to come. The economic rebound may also be negatively affected by a potential deteriora-tion of the stability of the banking sector in case of a pronounced increase in
19macroeconomic performance and framework conditions for innovation
banks’ exposure to non-performing loans due to the unfavourable economic situation. Additional fiscal stability threats arise from the potential rise of wages in public sector (the agreement that wages growth should not exceed productiv-ity growth was established in 2002) as well as rising liabilities related to rapidly aging population and unsustainable health and pension system (1999 reform was evaluated as insufficient and necessary changes are postponed). Increas-ing the activity of population aged above 60 years, reducing the average age of study, lowering labour taxes and social security burdens and limiting recently anticrises subsidies for shortened working week are some of the recommended areas for improvements.
In a time of economic crisis, catching up with more advanced countries is an even greater challenge for Slovenia than in the years of strong economic growth. With fewer possibilities available, it is necessary to make immediate strategic shifts to improve economic competitiveness amid a concurrent consolidation and restructuring of public finances. Enhancing competitiveness is vital for Slovenia to achieve sustainable economic recovery and further economic development. The failing non-competitive sectors of the economy should thus be more rap-idly replaced by high-technology and knowledge-based industries. Such changes could enable creation of new jobs with higher added value, which is essential to increase the population’s welfare. All this will crucially depend on policies pro-moting entrepreneurship and development of SMEs and attracting foreign direct investment. At the same time, it is necessary to improve the capabilities of the economy to create higher value added per employee in the existing enterprises by R&D policies and innovation. Even if Slovenia had already made several positive shifts regarding effective use of knowledge, changes were not as profound as in more developed countries in the EU and across the world.
At the beginning of 2010, the Slovenian government adopted strategic eco-nomic policy guidelines and proposals for structural changes, the successful implementation of which will play a significant role in how quickly Slovenia emerges from the crisis. The Stability Programme – 2009 Update and Slovenian Exit Strategy 2010–2013 envisage a gradual withdrawal of anti-crisis measures, consolidation of public finances, institutional adjustments and other structural changes to ensure the consistency of short-term anti-crisis measures with long-term strategic objectives, with immediate and effective operationalisation of measures playing a crucial role.5
5 According to this strategy, the general government deficit is to be cut to below 3 % of GDP by 2013. The government measures are aimed primarily at reducing public expenditure and making efficiency savings in the public sector. The withdrawal of fiscal stimulus and a decline in government spending will lead to a short-term reduction in economic growth, which is also envisaged by the baseline projection (Bank of Slovenia, Price Stability Report, April 2010).
NatioNal system of iNNovatioN iN sloveNia20
The basic economic projections for Slovenia for the period to 2012 indicate a gradual and moderate recovery in the period to 2012. No major changes in do-mestic demand or employment are expected. GDP growth is forecast at 1.3 % for this year, later approaching 3 %. Economic growth is dependent on growth in Slovenia’s most important trading partners, primarily euro area countries. GDP growth rates are expected to be smaller than they were before the crisis. As a result of excess production capacity and the standstill in construction, growth in invest-ment could stand at merely around 3 %. Private consumption is not expected to increase for another year. In the context of lower government spending, and the need to return public finances to within normal boundaries, low domestic de-mand means that export growth will outpace import growth, and net trade will contribute towards economic growth. Despite deterioration in the terms of trade as a result of the anticipated growth in commodity prices, the current account deficit in 2010 will be small. The employment could decline by a further 2 % due to carry-over effects. A more sustained rise in employment can be expected in 2011. Unemployment according to ILO methodology could reach 8 % (Bank of Slovenia, Price Stability Report, April 2010).
2.2 MAJOR STRUCTURAL FEATURES OF THE SLOVENIAN ECONOMY
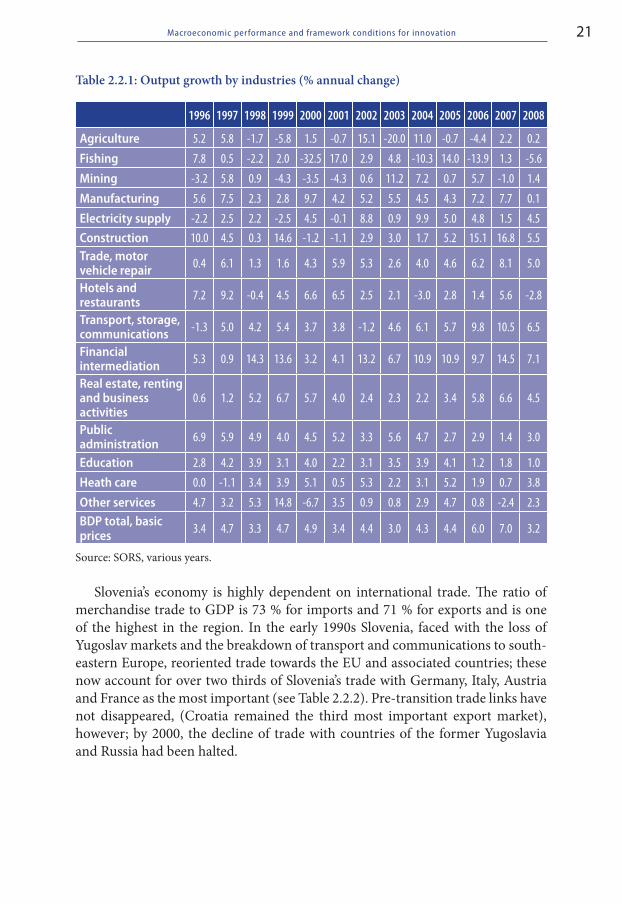
Agriculture accounted for 2.1 % of the Slovenian GDP in 2008, manufacturing for 19.4 %, construction for 7.3 %, while services for 65.96 %. As for services, the most important sectors are real estate and business activities [consulting] (15.6 %), wholesale and retail (11.1 %), transport, storage and communications (6.7 %), public services (5 %), while financial intermediation account for 3.9 % (Table 2.2.1). The structure of output is relatively stable in the last decade, manufactur-ing decreased for 3 percentage points, agriculture for 0.8 percentage points, while services increased for almost 5 percentage points.
Income structure of GDP reveals the following: 51 % share represents compen-sation for employees, 14 % taxes on production and imports, 14.3 consumption of fixed capital, and 22.2 % net operating surplus (mixed income). Looking at the expenditure of gross domestic product, the share of domestic use has been de-clining since 2000, but export constantly increased till 2008. In 2008 households represent 52 % of consumption, general government spending 18 %, and gross fixed capital formation 32 %. Until the economic crisis in 2008 the export, import and gross fixed capital formation experiences the most dynamic growth on the expenditure side. After 2008, the government spending grows the most dynami-cally (SORS).
21macroeconomic performance and framework conditions for innovation
Table 2.2.1: Output growth by industries (% annual change)
1996 1997 1998 1999 2000 2001 2002 2003 2004 2005 2006 2007 2008
Agriculture 5.2 5.8 -1.7 -5.8 1.5 -0.7 15.1 -20.0 11.0 -0.7 -4.4 2.2 0.2
Fishing 7.8 0.5 -2.2 2.0 -32.5 17.0 2.9 4.8 -10.3 14.0 -13.9 1.3 -5.6
Mining -3.2 5.8 0.9 -4.3 -3.5 -4.3 0.6 11.2 7.2 0.7 5.7 -1.0 1.4
Manufacturing 5.6 7.5 2.3 2.8 9.7 4.2 5.2 5.5 4.5 4.3 7.2 7.7 0.1
Electricity supply -2.2 2.5 2.2 -2.5 4.5 -0.1 8.8 0.9 9.9 5.0 4.8 1.5 4.5Construction 10.0 4.5 0.3 14.6 -1.2 -1.1 2.9 3.0 1.7 5.2 15.1 16.8 5.5Trade, motor vehicle repair 0.4 6.1 1.3 1.6 4.3 5.9 5.3 2.6 4.0 4.6 6.2 8.1 5.0
Hotels and restaurants 7.2 9.2 -0.4 4.5 6.6 6.5 2.5 2.1 -3.0 2.8 1.4 5.6 -2.8
Transport, storage, communications -1.3 5.0 4.2 5.4 3.7 3.8 -1.2 4.6 6.1 5.7 9.8 10.5 6.5
Financial intermediation 5.3 0.9 14.3 13.6 3.2 4.1 13.2 6.7 10.9 10.9 9.7 14.5 7.1
Real estate, renting and business activities
0.6 1.2 5.2 6.7 5.7 4.0 2.4 2.3 2.2 3.4 5.8 6.6 4.5
Public administration 6.9 5.9 4.9 4.0 4.5 5.2 3.3 5.6 4.7 2.7 2.9 1.4 3.0
Education 2.8 4.2 3.9 3.1 4.0 2.2 3.1 3.5 3.9 4.1 1.2 1.8 1.0
Heath care 0.0 -1.1 3.4 3.9 5.1 0.5 5.3 2.2 3.1 5.2 1.9 0.7 3.8
Other services 4.7 3.2 5.3 14.8 -6.7 3.5 0.9 0.8 2.9 4.7 0.8 -2.4 2.3BDP total, basic prices 3.4 4.7 3.3 4.7 4.9 3.4 4.4 3.0 4.3 4.4 6.0 7.0 3.2
Source: SORS, various years.
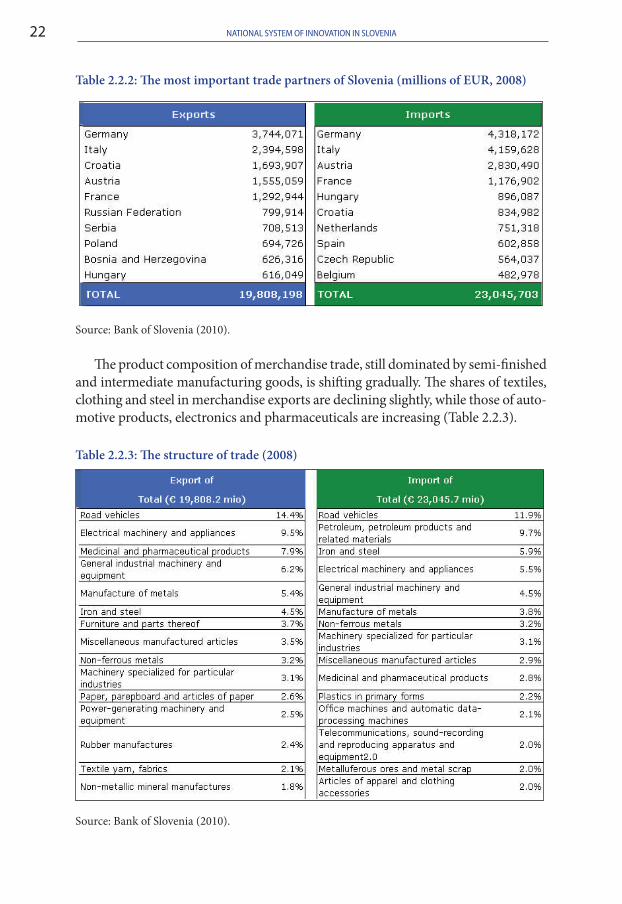
Slovenia’s economy is highly dependent on international trade. The ratio of merchandise trade to GDP is 73 % for imports and 71 % for exports and is one of the highest in the region. In the early 1990s Slovenia, faced with the loss of Yugoslav markets and the breakdown of transport and communications to south-eastern Europe, reoriented trade towards the EU and associated countries; these now account for over two thirds of Slovenia’s trade with Germany, Italy, Austria and France as the most important (see Table 2.2.2). Pre-transition trade links have not disappeared, (Croatia remained the third most important export market), however; by 2000, the decline of trade with countries of the former Yugoslavia and Russia had been halted.
NatioNal system of iNNovatioN iN sloveNia22
Table 2.2.2: The most important trade partners of Slovenia (millions of EUR, 2008)
Source: Bank of Slovenia (2010).
The product composition of merchandise trade, still dominated by semi-finished and intermediate manufacturing goods, is shifting gradually. The shares of textiles, clothing and steel in merchandise exports are declining slightly, while those of auto-motive products, electronics and pharmaceuticals are increasing (Table 2.2.3).
Table 2.2.3: The structure of trade (2008)
Source: Bank of Slovenia (2010).
23macroeconomic performance and framework conditions for innovation
2.3 INNOVATION AND ECONOMIC GROWTH
Looking at the European Innovation Scoreboard data (EIS 2010), Slovenia is mak-ing slow, but continuous progress in its innovation performance. It belongs to the group of moderate innovators, with several indicators close to the EU average. This is also the outcome of the Community Innovation Surveys, where the number of innovation active enterprises has increased significantly from 2002–2004 period to 2004–2006 (SURS 2008) and again in the period 2006–2008. Similar conclusion can be drawn also from the ranking of the world’s most innovative countries, carried out by the Economist Intelligence Unit (EIU 2009), where the value of the overall innovation performance indicator has increased from 2002–2006 to 2004–2008 period, even if the ranking hasn’t changed – Slovenia maintained its 24th position.
A more detailed examination of the figures however reveals certain structural problems, which in spite of the innovation policy measures undertaken by the government haven’t changed. For years now the analysts have observed the gap between relatively high innovation inputs/enablers and innovation outputs (See for example: Trend chart Country Reports on Slovenia 2007, 2008; IMAD’s Devel-opment Reports etc.). If, according to EIS, Slovenia achieved a 6 % rate of growth in enablers, the progress on the output side shows only 0.5 % growth during the observed period.6 Similarly, EIU ranks Slovenia 21st on the direct inputs in in-novation index (R&D by public and industry sector, educational attainment, IT development), but assesses the innovation environment (political environment, market opportunities, tax system, policy towards entrepreneurship and competi-tion, trade, policy towards FDI, finance, etc) as low as 45th among the 82 countries compared (EIU 2009: 12). A possible interpretation of these data is that while innovation policy measures can have relatively quick impact on the input side (increased R&D investment by business sector, for example), the translation of the inputs into significant change on the output side, especially in altering the economic structure (employment in high tech manufacturing & services; export share of high tech), requires a significantly longer time frame.
In spite of rising volume and quality of available data there are still few at-tempts to estimate the contribution of innovation activity. Most of existing studies explored the impact of innovation activity to productivity. Kotnik (2005: 157–68) used the first two CIS surveys in Slovenia and her study confirmed innovative activities of Slovenian manufacturing firms as a determinant of productivity at the firm level. The effect differed between industries with different technological intensity. The knowledge capital of the firm that has augmented the standard pro-duction function turned out to have a statistically significant and positive effect on value added for medium- and high-tech industries.
6 One also needs to take into consideration the fact that several output indicators have no (re-One also needs to take into consideration the fact that several output indicators have no (re-cent) data available.
NatioNal system of iNNovatioN iN sloveNia24
Recent firm level study by Damijan, Kostevc and Rojec (2009) examined im-plications of endogenous growth theory on the relationship between firm pro-ductivity, innovation as well as productivity growth by combining information on firm-level innovation (CIS) with balance-sheet and income statements data for a large sample of Slovenian firms in the period 1996–2002. They found a significant and robust link between productivity levels and firm propensity to innovate, while the results on the link between innovation activity and productivity growth are not robust to different econometric approaches.7
As stated above the essential determinant of economic growth in Slovenia is export and internationalization: therefore innovation through trade and FDI is especially important incentive for growth and development. Internationalization enhances several inter-related mechanisms involved in economic growth: efficient division of labour, capital accumulation (including human capital), and technolog-ical advance through the creation of new technologies (technological innovation) and the adoption of technologies that have been developed abroad (technology transfer). It is argued that economic growth is achieved in different ways in core economies (countries that are technological innovators) and non-core economies. In core economy countries growth is powered by their capacity to innovate and to win new global markets with their technologically advanced products (techno-logical innovation). High growth rates in non-core economies (as can be assumed for Slovenia) are often achieved by rapidly absorbing the advanced technologies and capital of the core economies, for example through high levels of foreign di-rect investment from high-tech multinationals of the core economies (technology transfer). This type of growth process is frequently also called ‘catch-up growth’ (Stel, Carree and Thurik 2005: 314–5).
According to the Economist Intelligence Unit (EIU) study on Innovation in Central Eastern Europe (2008) the impact of innovation is shown to be particu-larly positive on growth for medium-income countries. Slovenia is ranked as the first among CEE, yet the EIU’s innovation model suggests that over the last five years CEE innovation has been modest compared with developed EU economies, and that this underperformance will continue over the next five years. Improv-ing innovation performance requires an increase in direct inputs – such as R&D spending, better science education and IT infrastructure – as well as improvement to the broader innovation- entrepreneurship environment such as less incoherent bureaucracy, fairer taxation and more flexible labour markets.
A set of recent empirical studies confirmed strong relationship between inter-nationalization and innovation on the case of Slovenia. Firm level evidence shows that the share of innovative firms increases with the degree of internationalization.
7 More detailed empirical tests, however, reveal that these results are mainly driven by the ex-More detailed empirical tests, however, reveal that these results are mainly driven by the ex-ceptional performance of a specific group of services firms located in the fourth quintile with respect to size, productivity and R&D propensity measure.
25macroeconomic performance and framework conditions for innovation
According to the CIS 2004 the share of innovative firms that operate in domestic market only is 10 %, the share of innovative firms among exporters is 25 %, among foreign affiliates 35 %, while the highest – 42 % – share is found among domestic outward investors (headquarters of MNEs) (Jaklič 2006). Damijan et al. (2010) found evidence that exports increase the probability of becoming an innovator (a process or a product one), and that exporting leads to productivity improve-ments (the effect is especially strong for medium and large first time exporters). Burger et al. (2008) revealed that exporting firms are more innovative and pro-ductive already before exporting and also confirmed the effect of »learning by exporting« in the first two years after the beginning of export. While the impact of inward of FDI on innovation capacity on the case of Slovenian firms has not been significant, the innovation capacity was found as one of the most important determinant of outward FDI and creation of Slovenian multinational enterprises (Jaklič 2006). Direct presence on foreign market and international production has also vice versa serve as incentive for innovation activity (Jaklič 2006). Outward internationalization has thus been identified as one of the most important drivers of innovation and consequently an incentive for firms’ growth and development.
2.4 FRAMEWORK CONDITIONS FOR INNOVATION
2.4.1 entrepreneurial culture
Entrepreneurial activity is generally assumed to be an important aspect of the industries that are most conducive to innovative activity and unrestrained com-petition. Innovation is also often associated with firm creation, whereby new en-terprises are set up to provide the market with new offerings, thus creating new jobs. Stel, Carree and Thurik (2005) found that entrepreneurial activity by nascent entrepreneurs and owner/managers of young businesses affects economic growth, but that this effect depends upon the level of per capita income. Entrepreneurship thus plays a different role in countries in different stages of economic develop-ment. Moreover, over time, as well as the creation of new firms, innovation can lead to the expansion of existing firms, through increased demand for their prod-ucts or through increased competitiveness. At the same time, innovation can see firm closures, if products or services become obsolete or if they are displaced by more competitive offerings.
The Global Entrepreneurship Monitor (GEM) research shows that in 2009 3.2 % of adult population in Slovenia owned a company for less than 3 months (nascent entrepreneurs), 2.14 % had a company for more than 3 months but for less than 42 months (new business owners), while 5.6 % of the adult population in Slovenia owned a company for more than 42 months (established business owners). In terms of the early-stage entrepreneurial activity (TEA index), these results rank
NatioNal system of iNNovatioN iN sloveNia26
Slovenia 38th among 53 countries worldwide and 10th among the 20 European countries, participating in the research (Rebernik et al. 2010). The analysis has shown that Slovenia is more entrepreneurially ‘sleepy’ than is the average of any other comparable group of countries. That is, less new businesses are created and there are less active firms. In addition, less people decide to discontinue the opera-tions of their new ventures.8 The comparison of Slovenia with the European coun-tries and, in particular, the countries in its close proximity reveals that in Slov-enia opportunity-driven entrepreneurship is the prevalent driver for becoming involved in entrepreneurial processes. As regards necessity TEA, Slovenia ranks at the very bottom, i.e. 50th (0.51 %) among the 53 countries, and 33rd (4.73 %) as regards opportunity TEA. This can be even more clearly seen from the motivation index, i.e. the ratio of TEA opportunity to TEA necessity indices. In 2009, the motivation index for Slovenia was 9.20, which presents a significant increase from 2008 when it was 7.28. This result ranks Slovenia 5th among the 53 GEM nations, with Switzerland ranking 1st and Denmark 2nd. As many as 87 per cent of Slov-enian opportunity-driven entrepreneurs were pulled into entrepreneurship due to the desire for greater independence or to increase their income. Apparently, the desire to gain personal freedom and independence is a strong driver in Slovenian entrepreneurship, which ranks Slovenia 6th among all 53 countries.
Individuals mostly become engaged in entrepreneurship at the age 25–34. In this respect, Slovenia is quite comparable with other participating countries. The majority of early-stage entrepreneurs belongs to this age group, while the majority of established business owners belongs to the 45–54 age group. When compar-ing Slovenia with other groups of countries, we can see that the 25–34 age group exhibits the above average number of early-stage entrepreneurs (41.1 %) whereas their number is much lower in the 35–44 age group. In the European GEM coun-tries, the prevalent rate of early-stage entrepreneurs aged 35–44 is 29.2 % while in Slovenia it is only 17.0 %. It should be analysed why the 35–44 age group in Slovenia is so ‘undernourished’ in terms of entrepreneurial initiative. Moreover, effective motivation mechanisms should be established and as many obstacles as possible preventing entrepreneurial individuals from deciding for entrepreneur-ship should be eliminated.
The percentage of female entrepreneurs decreased in 2009 and it amounted to only 24.2 % of all early-stage entrepreneurs. The overall average of all GEM countries was 35.4 %, while the average of the European GEM countries was 33.3 %. The percentage of women in the group of established business owners was a bit higher (28.7 %). The education structure of Slovenian entrepreneurs did not improve in 2009, since as many as 59.1 % of all early-stage entrepreneurs had only secondary education or less. The percentage of established business
8 Among European countries which participated in (10.5 %) and Hungary (9.1 %) while the countries with the lowest rates were Belgium (3.5 %), Denmark (3.6 %) and Italy (3.7 %).
27macroeconomic performance and framework conditions for innovation
owners with this educational attainment was lower (53 %). These results show that early-stage entrepreneurs are even less educated than those who have been involved in entrepreneurship for more than 3.5 years. The majority of early-stage entrepreneurs came from the highest household income group. This structure did not change compared with 2008 and is similar to the structure of established busi-ness owners, which points to a more sustainable structure in a long term. These findings also correlate with the fact that most entrepreneurs in Slovenia become involved in entrepreneurship in order to exploit a business opportunity and not out of necessity.
Large majority of population in Slovenia (77.6 %) believes that successful en-trepreneurs in Slovenia are both respected and respectable, but the proportion of those who would choose to become entrepreneurs is much lower (55.8 %). The comparison of the last four years (2006–2009) showed relatively stable results. The only exception is the perception of good business opportunities, which exhibits a strong fall (from 45 % of adult population in 2008 to 30 % in 2009).
Next to economic crises that significantly worsened financing possibilities for entrepreneurship, the extensive employment protection makes it more risky for the entrepreneurs to create new jobs (the OECD employee protection data rank Slovenia among the countries where workforce is extremely protected). However, the percentage of individuals who discontinued a business in 2009 was only 1.3 %. The main reasons for business discontinuation among entrepreneurs in Slovenia in 2009 were financial problems (30.4 %), personal reasons (19.6 %), other job or business opportunity (19.4 %), business not being profitable (12.5 %) and the fact that exit was planned in advance (8.6 %).
National experts saw entrepreneurial capacities, financial support and govern-ment programmes as the key advantages of Slovenia for the development of entre-preneurship while unsupportive cultural and social norms and the co-dependency of political, institutional and social frameworks, which do not acknowledge the proper role of entrepreneurship, were seen as the main disadvantages. Diligence, creativity and ingenuity of individuals in Slovenia are the principal advantages for the promotion of entrepreneurship, especially among young generation, which is better educated and more entrepreneurship oriented. According to the national experts’ opinions, the entrepreneurial activity in Slovenia could be greatly en-hanced by adequate education and training systems.
2.4.2 Conditions for doing business
Slovenia’s economic freedom score is 64.7, making its economy the 61st freest in the 2010 Index. Its score has increased by 1.8 points since last year, reflecting im-provements in six of the 10 economic freedoms. Slovenia is ranked 27th out of 43 countries in the Europe region, and its overall score is well above the world average. The transition of the Slovenian economy to greater economic freedom continues,
NatioNal system of iNNovatioN iN sloveNia28
facilitated by structural reforms and an increasingly vibrant private sector.9 The economy enjoys relatively high levels of business freedom, trade freedom, invest-ment freedom, property rights, and freedom from corruption. Business regula-tions have become more straightforward and transparent, and recent reductions in the corporate tax rate have increased competitiveness. Foreign investment is encouraged, and the streamlining of investment rules has eliminated burdensome restrictions. Weak scores in government spending and labour freedom hold down Slovenia’s overall economic freedom. Government spending is more than 40 per-cent of GDP, and the privatization of state-controlled enterprises has been slug-gish. Labour market reforms have also been delayed, hampering employment and productivity growth (http://www.heritage.org/index/country/slovenia).
Slovenia is ranked as 53 out of 183 economies in 2010 in the World Bank’s Ease of Doing Business data base (see the list of summary indicators in Table SA4). Larger improvements have been realised in starting a business, dealing with per-mits (VEM one stop shop, as explained later contributed here). Compared to the region, the worst (and relatively worsening) conditions are found at employing workers, where all of the indicators (Difficulty of hiring index; Rigidity of hours index; Difficulty of redundancy index; Rigidity of employment index and Redun-dancy costs) exceed the regional (Eastern Europe and Asia) average. Ranking has decreased also at paying taxes (Profit tax exceeds the regional average).
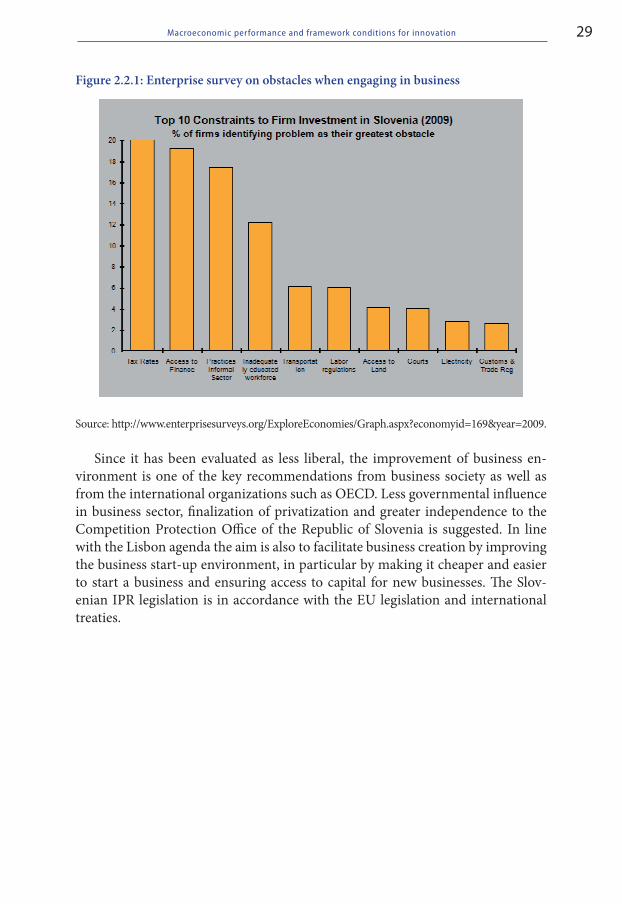
The highest barriers that could be summed up from various different surveys of business environment (World bank doing business, CIR surveys, Enterprise survey etc.) in Slovenia are (i) high taxes, (ii) rigid labour market and (iii) admin-istrative procedures (especially enforcing contracts).
9 Improved ranking is also found at WEF – The Global Competitiveness Report 2009–2010, where Slovenia (ranked 37th) follows closely behind Czech Republic, having improved by five places. Slovenia benefits from world-class health and educational systems, good infrastruc-ture, and impressive innovative capacity. In addition, the country’s macroeconomic stabil-ity has improved (up from 33rd to 26th rank this year), advancing its overall competitiveness outlook.
29macroeconomic performance and framework conditions for innovation
Figure 2.2.1: Enterprise survey on obstacles when engaging in business
Source: http://www.enterprisesurveys.org/ExploreEconomies/Graph.aspx?economyid=169&year=2009.
Since it has been evaluated as less liberal, the improvement of business en-vironment is one of the key recommendations from business society as well as from the international organizations such as OECD. Less governmental influence in business sector, finalization of privatization and greater independence to the Competition Protection Office of the Republic of Slovenia is suggested. In line with the Lisbon agenda the aim is also to facilitate business creation by improving the business start-up environment, in particular by making it cheaper and easier to start a business and ensuring access to capital for new businesses. The Slov-enian IPR legislation is in accordance with the EU legislation and international treaties.

31
3. sloveNia’s R&d aNd iNNovatioN PeRfoRmaNCe
This chapter presents Slovenia’s performance in science, technology and innova-tion, combining quantitative indicators with qualitative assessment. International benchmarking is provided, where possible, especially with the EU and the EU/OECD member states, which have experienced similar transition process as Slov-enia. Specifics of Slovenia’s R&D system, explaining some of the differences in data, are highlighted.
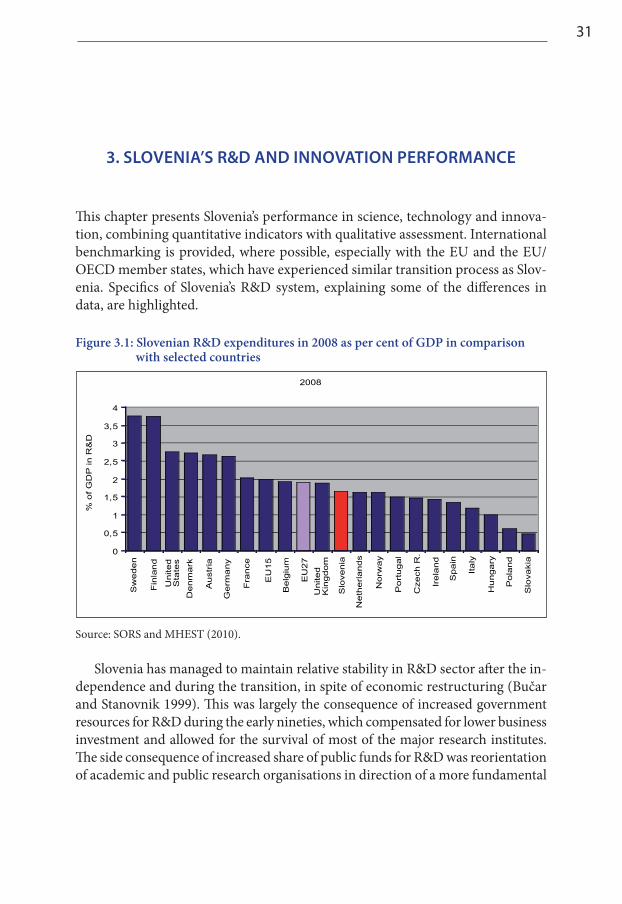
Figure 3.1: Slovenian R&D expenditures in 2008 as per cent of GDP in comparison with selected countries
Source: SORS and MHEST (2010).
Slovenia has managed to maintain relative stability in R&D sector after the in-dependence and during the transition, in spite of economic restructuring (Bučar and Stanovnik 1999). This was largely the consequence of increased government resources for R&D during the early nineties, which compensated for lower business investment and allowed for the survival of most of the major research institutes. The side consequence of increased share of public funds for R&D was reorientation of academic and public research organisations in direction of a more fundamental
2008
0
0,5
1
1,5
2
2,5
3
3,5
4
Sw
ed
en
Fin
lan
d
Un
ite
d
De
nm
ark
Au
str
ia
Ge
rma
ny
Fra
nce
EU
15
Be
lgiu
m
EU
27
Un
ite
d
Slo
ve
nia
Ne
the
rla
nd
s
No
rwa
y
Po
rtu
ga
l
Cze
ch
R.
Ire
lan
d
Sp
ain
Ita
ly
Hu
ng
ary
Po
lan
d
Slo
va
kia
% o
f G
DP
in
R&
D
Kin
gd
om
Sta
tes
NatioNal system of iNNovatioN iN sloveNia32
research and looser ties with business sector. Yet since 199610 the business sector has picked up the R&D investment to the current level where today it provides for major source of funding for R&D.
In terms of R&D input indicators (the number of researchers, the amount of public R&D investment, and the high level of business R&D investment), Slovenia scores relatively well in comparison to the EU average and is grouped in the category of ‘moderate innovator.’ More problematic is the output side, particularly if measured by number of innovative firms or the number of pat-ents (EIS 2009). The EIS 2009 Report (EIS 2010) shows that Slovenia’s scores are higher comparing to the EU average in the field of Human resources and Innovators, while there is a problem especially in the field of Throughputs and firm investments.
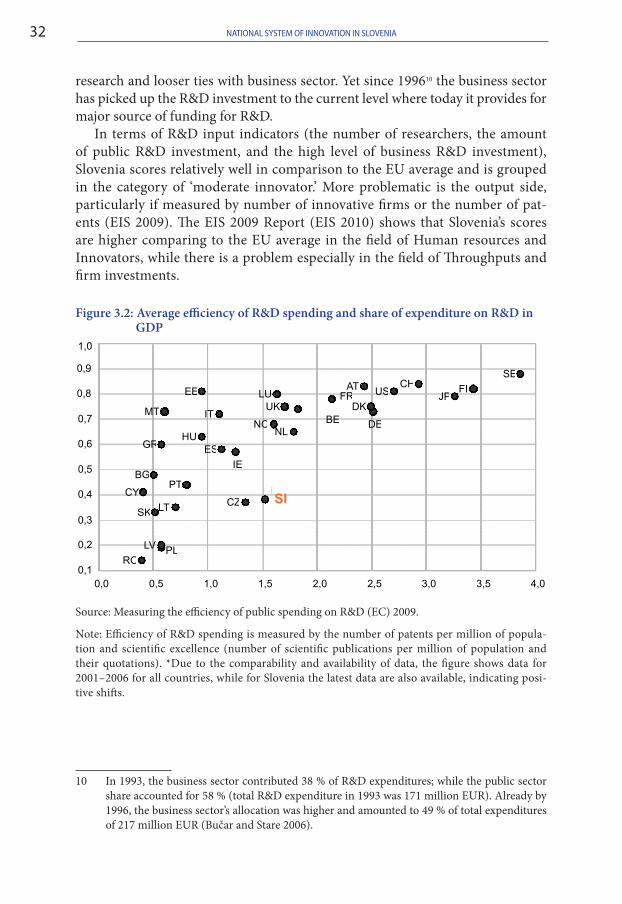
Figure 3.2: Average efficiency of R&D spending and share of expenditure on R&D in GDP
Source: Measuring the efficiency of public spending on R&D (EC) 2009.
Note: Efficiency of R&D spending is measured by the number of patents per million of popula-tion and scientific excellence (number of scientific publications per million of population and their quotations). *Due to the comparability and availability of data, the figure shows data for 2001–2006 for all countries, while for Slovenia the latest data are also available, indicating posi-tive shifts.
10 In 1993, the business sector contributed 38 % of R&D expenditures; while the public sector share accounted for 58 % (total R&D expenditure in 1993 was 171 million EUR). Already by 1996, the business sector’s allocation was higher and amounted to 49 % of total expenditures of 217 million EUR (Bučar and Stare 2006).
SE
FI JP
CH US
DE
DK
AT FR
BE NL
UK LU
NO
SI CZ
IE
ES
IT
EE
HU
PT
LT
MT
GR
PL LV
SK
BG
CY
RO 0,1
0,2
0,3
0,4
0,5
0,6
0,7
0,8
0,9
1,0
0,0 0,5 1,0 1,5 2,0 2,5 3,0 3,5 4,0
33slovenia’s r&d and innovation performance
3.1 VOLUME AND COMPOSITION OF GERD
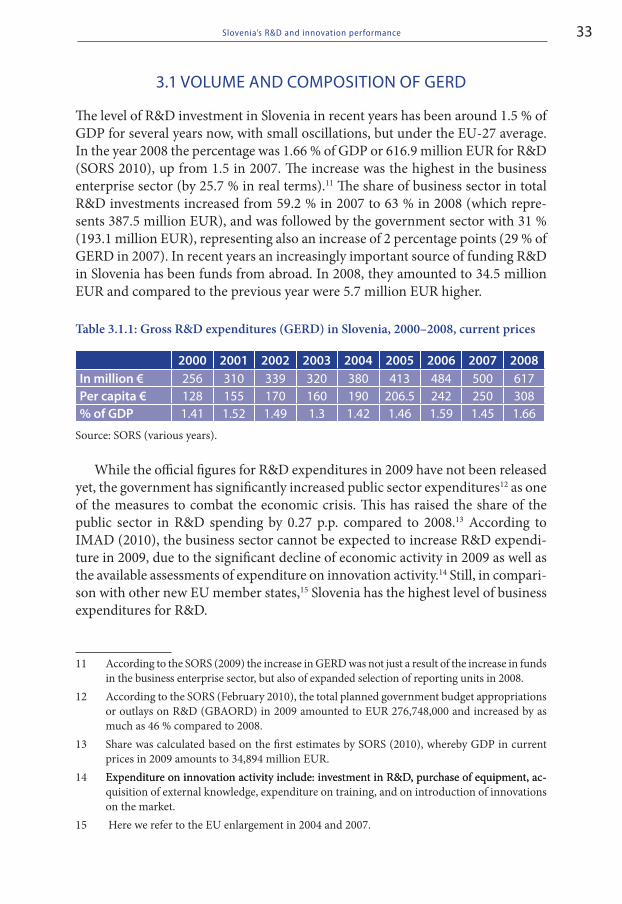
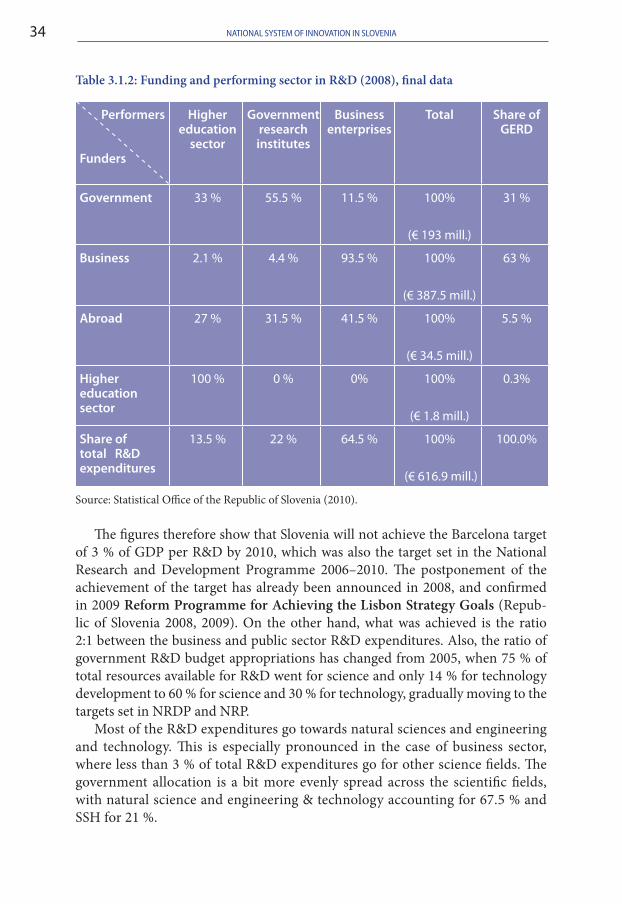
The level of R&D investment in Slovenia in recent years has been around 1.5 % of GDP for several years now, with small oscillations, but under the EU-27 average. In the year 2008 the percentage was 1.66 % of GDP or 616.9 million EUR for R&D (SORS 2010), up from 1.5 in 2007. The increase was the highest in the business enterprise sector (by 25.7 % in real terms).11 The share of business sector in total R&D investments increased from 59.2 % in 2007 to 63 % in 2008 (which repre-sents 387.5 million EUR), and was followed by the government sector with 31 % (193.1 million EUR), representing also an increase of 2 percentage points (29 % of GERD in 2007). In recent years an increasingly important source of funding R&D in Slovenia has been funds from abroad. In 2008, they amounted to 34.5 million EUR and compared to the previous year were 5.7 million EUR higher.
Table 3.1.1: Gross R&D expenditures (GERD) in Slovenia, 2000–2008, current prices
2000 2001 2002 2003 2004 2005 2006 2007 2008in million € 256 310 339 320 380 413 484 500 617Per capita € 128 155 170 160 190 206.5 242 250 308% of gdP 1.41 1.52 1.49 1.3 1.42 1.46 1.59 1.45 1.66
Source: SORS (various years).
While the official figures for R&D expenditures in 2009 have not been released yet, the government has significantly increased public sector expenditures12 as one of the measures to combat the economic crisis. This has raised the share of the public sector in R&D spending by 0.27 p.p. compared to 2008.13 According to IMAD (2010), the business sector cannot be expected to increase R&D expendi-ture in 2009, due to the significant decline of economic activity in 2009 as well as the available assessments of expenditure on innovation activity.14 Still, in compari-son with other new EU member states,15 Slovenia has the highest level of business expenditures for R&D.
11 According to the SORS (2009) the increase in GERD was not just a result of the increase in funds in the business enterprise sector, but also of expanded selection of reporting units in 2008.
12 According to the SORS (February 2010), the total planned government budget appropriations or outlays on R&D (GBAORD) in 2009 amounted to EUR 276,748,000 and increased by as much as 46 % compared to 2008.
13 Share was calculated based on the first estimates by SORS (2010), whereby GDP in current prices in 2009 amounts to 34,894 million EUR.
14 Expenditure on innovation activity include: investment in R&D, purchase of equipment, ac-Expenditure on innovation activity include: investment in R&D, purchase of equipment, ac-quisition of external knowledge, expenditure on training, and on introduction of innovations on the market.
15 Here we refer to the EU enlargement in 2004 and 2007.
NatioNal system of iNNovatioN iN sloveNia34
Table 3.1.2: Funding and performing sector in R&D (2008), final data
Performers
funders
Higher education
sector
government research institutes
business enterprises
total share ofgeRd
government 33 % 55.5 % 11.5 % 100%
(€ 193 mill.)
31 %
business 2.1 % 4.4 % 93.5 % 100%
(€ 387.5 mill.)
63 %
abroad 27 % 31.5 % 41.5 % 100%
(€ 34.5 mill.)
5.5 %
Higher education sector
100 % 0 % 0% 100%
(€ 1.8 mill.)
0.3%
share of total R&d expenditures
13.5 % 22 % 64.5 % 100%
(€ 616.9 mill.)
100.0%
Source: Statistical Office of the Republic of Slovenia (2010).
The figures therefore show that Slovenia will not achieve the Barcelona target of 3 % of GDP per R&D by 2010, which was also the target set in the National Research and Development Programme 2006–2010. The postponement of the achievement of the target has already been announced in 2008, and confirmed in 2009 Reform Programme for Achieving the Lisbon Strategy Goals (Repub-lic of Slovenia 2008, 2009). On the other hand, what was achieved is the ratio 2:1 between the business and public sector R&D expenditures. Also, the ratio of government R&D budget appropriations has changed from 2005, when 75 % of total resources available for R&D went for science and only 14 % for technology development to 60 % for science and 30 % for technology, gradually moving to the targets set in NRDP and NRP.
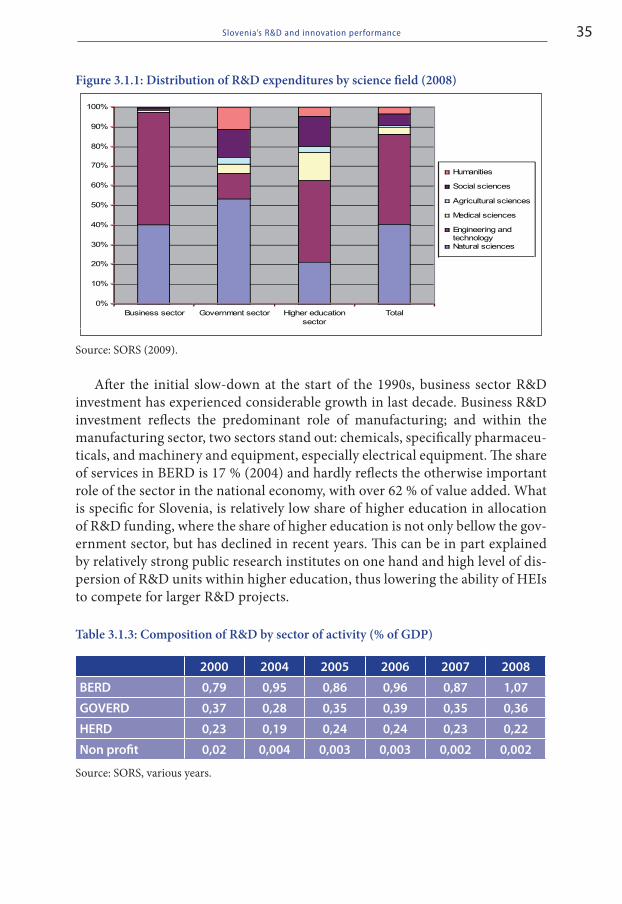
Most of the R&D expenditures go towards natural sciences and engineering and technology. This is especially pronounced in the case of business sector, where less than 3 % of total R&D expenditures go for other science fields. The government allocation is a bit more evenly spread across the scientific fields, with natural science and engineering & technology accounting for 67.5 % and SSH for 21 %.
35slovenia’s r&d and innovation performance
Figure 3.1.1: Distribution of R&D expenditures by science field (2008)
Source: SORS (2009).
After the initial slow-down at the start of the 1990s, business sector R&D investment has experienced considerable growth in last decade. Business R&D investment reflects the predominant role of manufacturing; and within the manufacturing sector, two sectors stand out: chemicals, specifically pharmaceu-ticals, and machinery and equipment, especially electrical equipment. The share of services in BERD is 17 % (2004) and hardly reflects the otherwise important role of the sector in the national economy, with over 62 % of value added. What is specific for Slovenia, is relatively low share of higher education in allocation of R&D funding, where the share of higher education is not only bellow the gov-ernment sector, but has declined in recent years. This can be in part explained by relatively strong public research institutes on one hand and high level of dis-persion of R&D units within higher education, thus lowering the ability of HEIs to compete for larger R&D projects.
Table 3.1.3: Composition of R&D by sector of activity (% of GDP)
2000 2004 2005 2006 2007 2008
beRd 0,79 0,95 0,86 0,96 0,87 1,07
goveRd 0,37 0,28 0,35 0,39 0,35 0,36
HeRd 0,23 0,19 0,24 0,24 0,23 0,22
Non profit 0,02 0,004 0,003 0,003 0,002 0,002
Source: SORS, various years.
0%
10%
20%
30%
40%
50%
60%
70%
80%
90%
100%
Business sector Government sector Higher educationsector
Total
Humanities
Social sciences
Agricultural sciences
Medical sciences
Engineering andtechnologyNatural sciences
NatioNal system of iNNovatioN iN sloveNia36
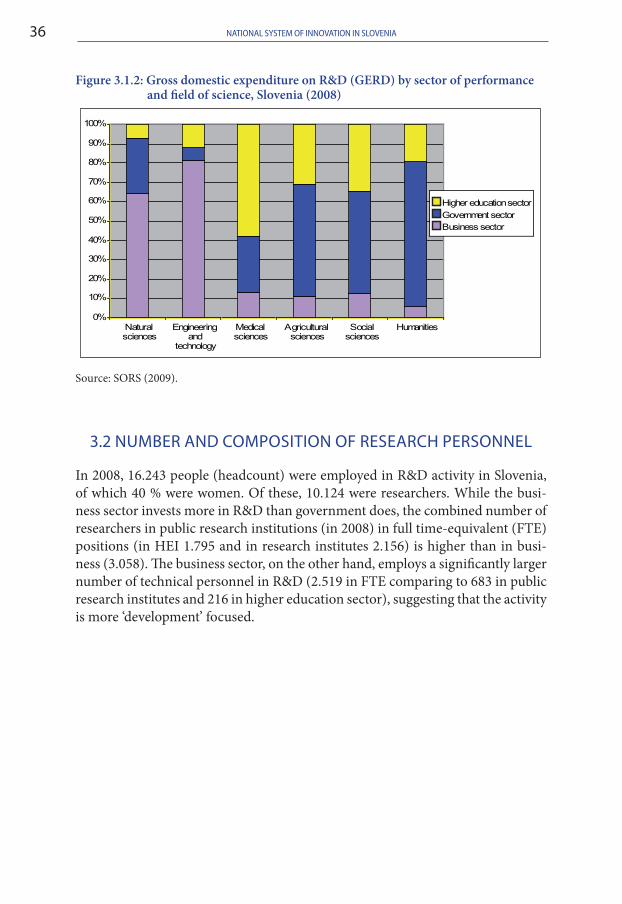
Figure 3.1.2: Gross domestic expenditure on R&D (GERD) by sector of performance and field of science, Slovenia (2008)
Source: SORS (2009).
3.2 NUMBER AND COMPOSITION OF RESEARCH PERSONNEL
In 2008, 16.243 people (headcount) were employed in R&D activity in Slovenia, of which 40 % were women. Of these, 10.124 were researchers. While the busi-ness sector invests more in R&D than government does, the combined number of researchers in public research institutions (in 2008) in full time-equivalent (FTE) positions (in HEI 1.795 and in research institutes 2.156) is higher than in busi-ness (3.058). The business sector, on the other hand, employs a significantly larger number of technical personnel in R&D (2.519 in FTE comparing to 683 in public research institutes and 216 in higher education sector), suggesting that the activity is more ‘development’ focused.
0%
10%
20%
30%
40%
50%
60%
70%
80%
90%
100%
Naturalsciences
Engineeringand
technology
Medicalsciences
Agriculturalsciences
Socialsciences
Humanities
Higher education sectorGovernment sectorBusiness sector
37slovenia’s r&d and innovation performance
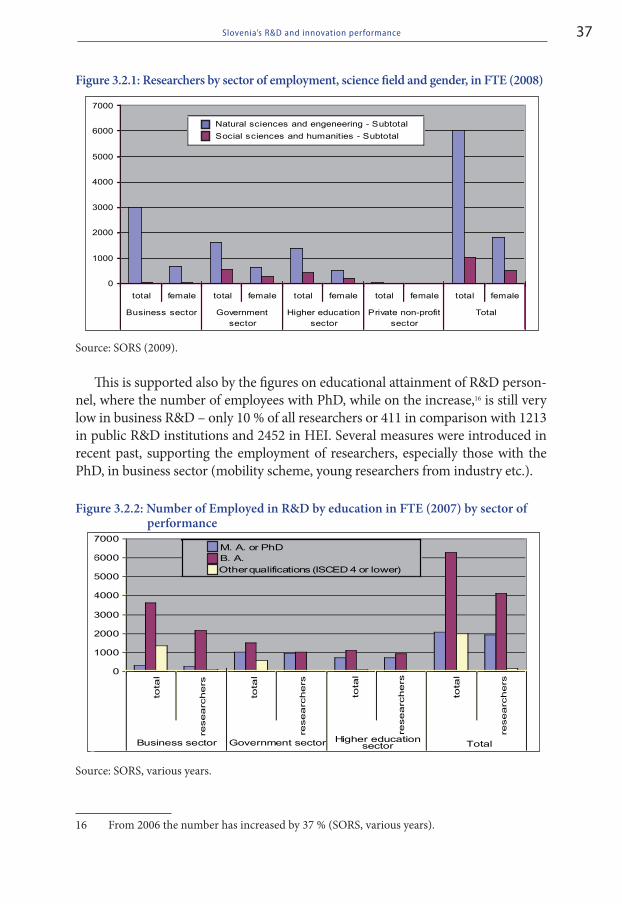
Figure 3.2.1: Researchers by sector of employment, science field and gender, in FTE (2008)
Source: SORS (2009).
This is supported also by the figures on educational attainment of R&D person-nel, where the number of employees with PhD, while on the increase,16 is still very low in business R&D – only 10 % of all researchers or 411 in comparison with 1213 in public R&D institutions and 2452 in HEI. Several measures were introduced in recent past, supporting the employment of researchers, especially those with the PhD, in business sector (mobility scheme, young researchers from industry etc.).
Figure 3.2.2: Number of Employed in R&D by education in FTE (2007) by sector of performance
16 From 2006 the number has increased by 37 % (SORS, various years).
Source: SORS, various years.
0
1000
2000
3000
4000
5000
6000
7000
total female total female total female total female total female
Business sector Governmentsector
Higher educationsector
Private non-profitsector
Total
Natural sciences and engeneering - Subtotal
Social sciences and
humanities
- Subtotal
0
1000
2000
3000
4000
5000
6000
7000
tota
l
rese
arc
he
rs
tota
l
rese
arc
he
rs
tota
l
rese
arc
he
rs
tota
l
rese
arc
he
rs
Business
sector Government
sector Higher education
sector
Total
M. A. or PhDB. A.Other qualifications (ISCED 4 or lower)
NatioNal system of iNNovatioN iN sloveNia38
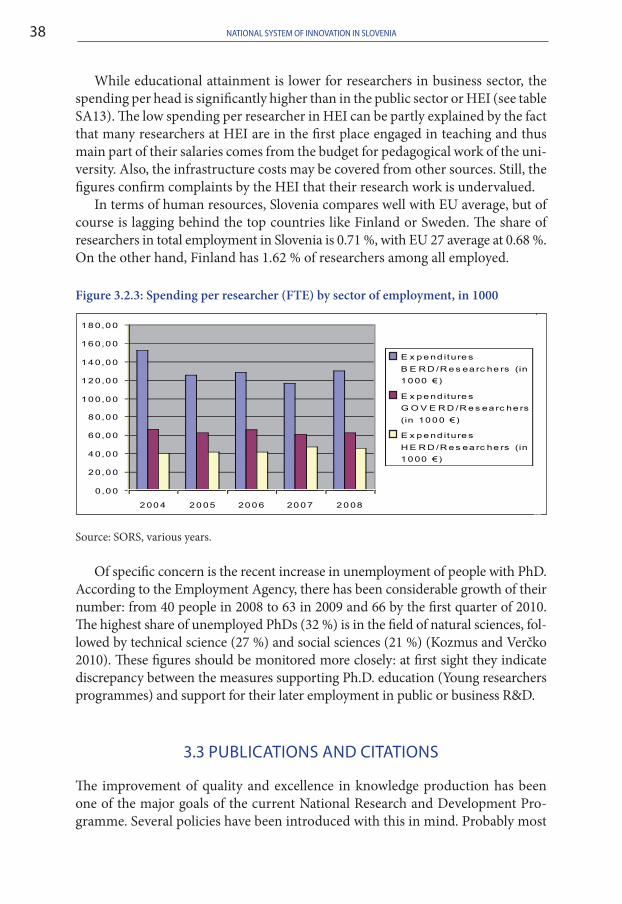
While educational attainment is lower for researchers in business sector, the spending per head is significantly higher than in the public sector or HEI (see table SA13). The low spending per researcher in HEI can be partly explained by the fact that many researchers at HEI are in the first place engaged in teaching and thus main part of their salaries comes from the budget for pedagogical work of the uni-versity. Also, the infrastructure costs may be covered from other sources. Still, the figures confirm complaints by the HEI that their research work is undervalued.
In terms of human resources, Slovenia compares well with EU average, but of course is lagging behind the top countries like Finland or Sweden. The share of researchers in total employment in Slovenia is 0.71 %, with EU 27 average at 0.68 %. On the other hand, Finland has 1.62 % of researchers among all employed.
Figure 3.2.3: Spending per researcher (FTE) by sector of employment, in 1000
Source: SORS, various years.
Of specific concern is the recent increase in unemployment of people with PhD. According to the Employment Agency, there has been considerable growth of their number: from 40 people in 2008 to 63 in 2009 and 66 by the first quarter of 2010. The highest share of unemployed PhDs (32 %) is in the field of natural sciences, fol-lowed by technical science (27 %) and social sciences (21 %) (Kozmus and Verčko 2010). These figures should be monitored more closely: at first sight they indicate discrepancy between the measures supporting Ph.D. education (Young researchers programmes) and support for their later employment in public or business R&D.
3.3 PUBLICATIONS AND CITATIONS
The improvement of quality and excellence in knowledge production has been one of the major goals of the current National Research and Development Pro-gramme. Several policies have been introduced with this in mind. Probably most
0,0 0
2 0,0 0
4 0,0 0
6 0,0 0
8 0,0 0
1 0 0,0 0
1 2 0,0 0
1 4 0,0 0
1 6 0,0 0
1 8 0,0 0
2 00 4 2 0 05 20 0 6 20 0 7 2 0 08
E x p e nd iture s
B E R D /R e s ea rc he rs (in
1 0 00 € )
E x p e nd iture s
G O V E R D /R e s ea rc he rs
(in 10 0 0 € )
E x p e nd iture s
H E R D /R e s ea rc he rs (in
1 0 00 € )
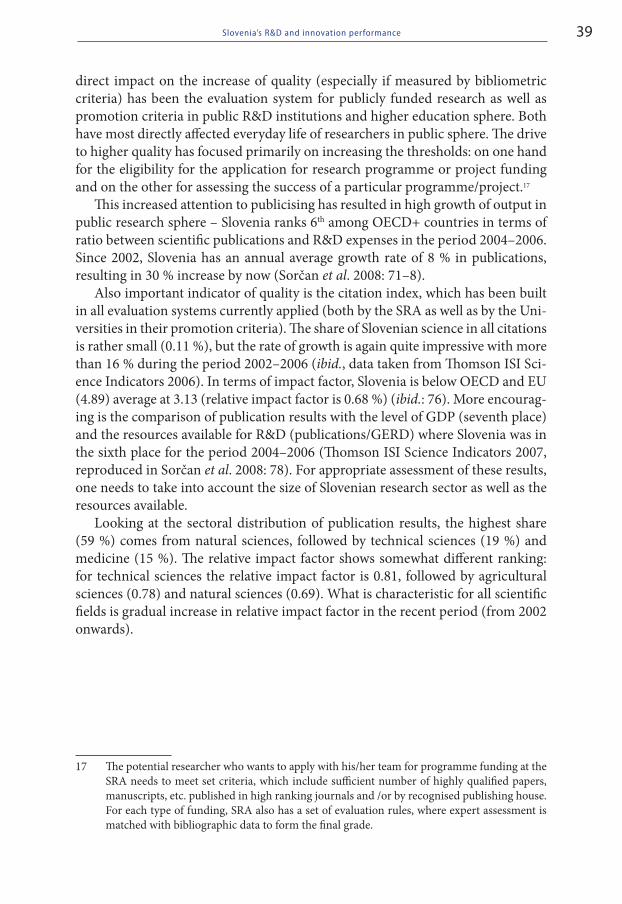
39slovenia’s r&d and innovation performance
direct impact on the increase of quality (especially if measured by bibliometric criteria) has been the evaluation system for publicly funded research as well as promotion criteria in public R&D institutions and higher education sphere. Both have most directly affected everyday life of researchers in public sphere. The drive to higher quality has focused primarily on increasing the thresholds: on one hand for the eligibility for the application for research programme or project funding and on the other for assessing the success of a particular programme/project.17
This increased attention to publicising has resulted in high growth of output in public research sphere – Slovenia ranks 6th among OECD+ countries in terms of ratio between scientific publications and R&D expenses in the period 2004–2006. Since 2002, Slovenia has an annual average growth rate of 8 % in publications, resulting in 30 % increase by now (Sorčan et al. 2008: 71–8).
Also important indicator of quality is the citation index, which has been built in all evaluation systems currently applied (both by the SRA as well as by the Uni-versities in their promotion criteria). The share of Slovenian science in all citations is rather small (0.11 %), but the rate of growth is again quite impressive with more than 16 % during the period 2002–2006 (ibid., data taken from Thomson ISI Sci-ence Indicators 2006). In terms of impact factor, Slovenia is below OECD and EU (4.89) average at 3.13 (relative impact factor is 0.68 %) (ibid.: 76). More encourag-ing is the comparison of publication results with the level of GDP (seventh place) and the resources available for R&D (publications/GERD) where Slovenia was in the sixth place for the period 2004–2006 (Thomson ISI Science Indicators 2007, reproduced in Sorčan et al. 2008: 78). For appropriate assessment of these results, one needs to take into account the size of Slovenian research sector as well as the resources available.
Looking at the sectoral distribution of publication results, the highest share (59 %) comes from natural sciences, followed by technical sciences (19 %) and medicine (15 %). The relative impact factor shows somewhat different ranking: for technical sciences the relative impact factor is 0.81, followed by agricultural sciences (0.78) and natural sciences (0.69). What is characteristic for all scientific fields is gradual increase in relative impact factor in the recent period (from 2002 onwards).
17 The potential researcher who wants to apply with his/her team for programme funding at the SRA needs to meet set criteria, which include sufficient number of highly qualified papers, manuscripts, etc. published in high ranking journals and /or by recognised publishing house. For each type of funding, SRA also has a set of evaluation rules, where expert assessment is matched with bibliographic data to form the final grade.
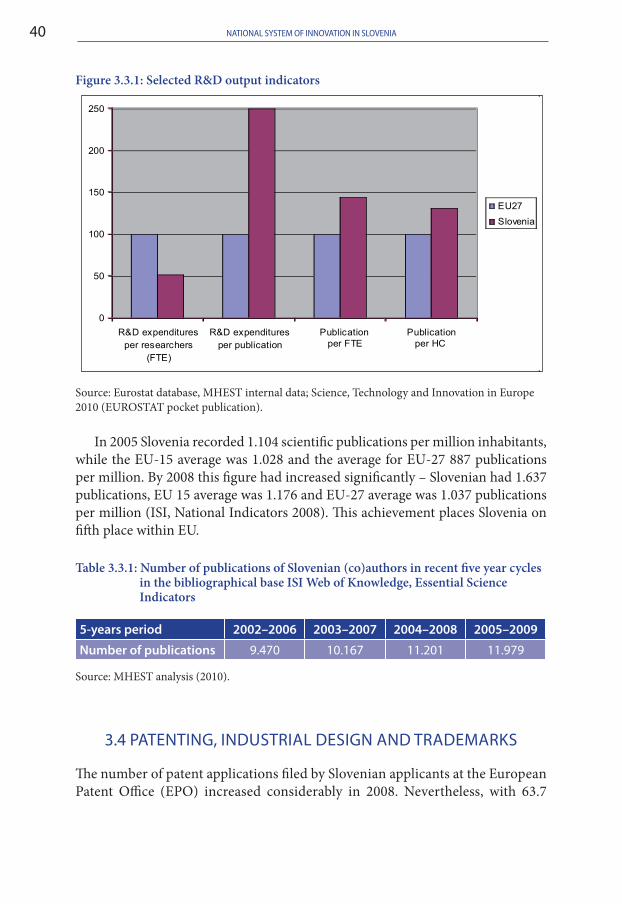
NatioNal system of iNNovatioN iN sloveNia40
Figure 3.3.1: Selected R&D output indicators
Source: Eurostat database, MHEST internal data; Science, Technology and Innovation in Europe 2010 (EUROSTAT pocket publication).
In 2005 Slovenia recorded 1.104 scientific publications per million inhabitants, while the EU-15 average was 1.028 and the average for EU-27 887 publications per million. By 2008 this figure had increased significantly – Slovenian had 1.637 publications, EU 15 average was 1.176 and EU-27 average was 1.037 publications per million (ISI, National Indicators 2008). This achievement places Slovenia on fifth place within EU.
Table 3.3.1: Number of publications of Slovenian (co)authors in recent five year cycles in the bibliographical base ISI Web of Knowledge, Essential Science Indicators
5-years period 2002–2006 2003–2007 2004–2008 2005–2009
Number of publications 9.470 10.167 11.201 11.979
Source: MHEST analysis (2010).
3.4 PATENTING, INDUSTRIAL DESIGN AND TRADEMARKS
The number of patent applications filed by Slovenian applicants at the European Patent Office (EPO) increased considerably in 2008. Nevertheless, with 63.7
0
50
100
150
200
250
R&D expendituresper researchers
(FTE)
R&D expendituresper publication
Publication per
FTE
Publication per
HC
EU27
Slovenia
41slovenia’s r&d and innovation performance
patent applications per million of population,18 Slovenia still lags behind the EU average (131.1) although it ranks in the middle of all EU Member States (14th) and is ahead of almost all other new members (IMAD 2010). The number of patents in a certain country depends on several factors related to human capital, production structure19 and a supportive institutional environment. It is particularly evident that the countries with a higher number of researchers20 in the business sector also present higher numbers of patents per million population. It is therefore impor-tant to note that over the last two years and throughout 2000–2008, the number of researchers in Slovenia has increased mainly in the business sector.
Figure 3.4.1: Patent applications in selected countries (EPO/per million inhabitants)
Source: EUROSTAT (2010).
What can be observed from the 2008 and 2009 data collected by the Institute for Information Science through SICRIS (Slovenian Current Research Informa-tion System) in terms of reported patents and patent applications by the registered R&D units, the numbers are relatively equally spread among the three sectors: business R&D units, HEI and public research institutes. In view of the current relatively poor promotion of patenting at HEI and insufficient legal arrangements (the regulating on the patenting procedure and distribution of potential income from patents is left to the individual university/research institute), the results are encouraging. Also, several patents and patent applications have been reported by the Centres of excellence, which are the product of a new measure to stimulate
18 In 2008, Slovenian applicants filed 129 patent applications at EPO, which is 12.2 % more than the year before when they filed 115 applications (EPO Annual Report 2008, 2009).
19 A low share of final products in the production structure has a negative effect on patenting since the suppliers of intermediate products are less motivated to apply for patents.
20 Expressed as full-time equivalent (FTE).
0
50
100
150
200
250
300
2000 2001 2002 2003 2004 2005 2006 2007
EU27SloveniaCzech R.HungaryFinlandIreland
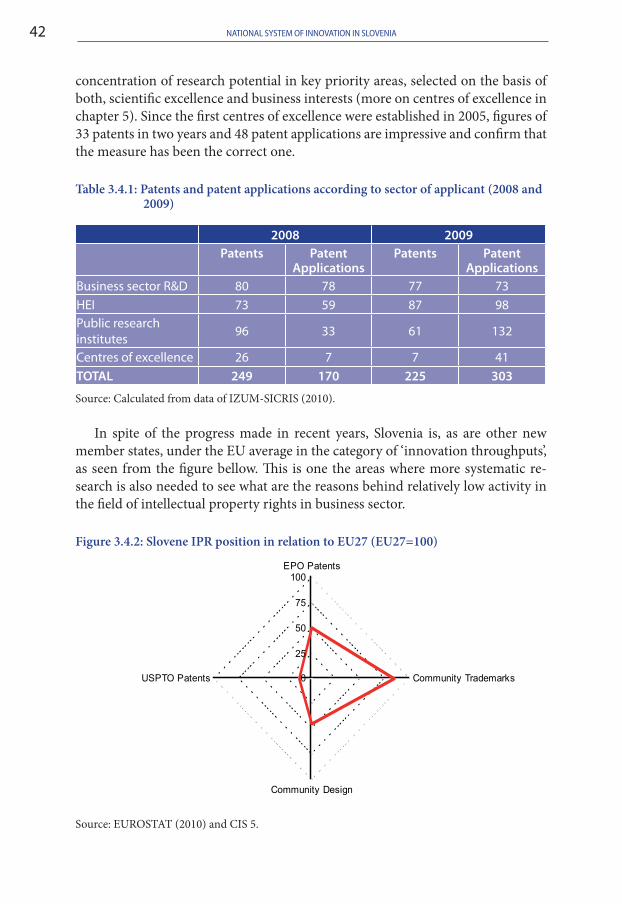
NatioNal system of iNNovatioN iN sloveNia42
concentration of research potential in key priority areas, selected on the basis of both, scientific excellence and business interests (more on centres of excellence in chapter 5). Since the first centres of excellence were established in 2005, figures of 33 patents in two years and 48 patent applications are impressive and confirm that the measure has been the correct one.
Table 3.4.1: Patents and patent applications according to sector of applicant (2008 and 2009)
2008 2009Patents Patent
applicationsPatents Patent
applicationsBusiness sector R&D 80 78 77 73HEI 73 59 87 98Public research institutes 96 33 61 132
Centres of excellence 26 7 7 41total 249 170 225 303
Source: Calculated from data of IZUM-SICRIS (2010).
In spite of the progress made in recent years, Slovenia is, as are other new member states, under the EU average in the category of ‘innovation throughputs’, as seen from the figure bellow. This is one the areas where more systematic re-search is also needed to see what are the reasons behind relatively low activity in the field of intellectual property rights in business sector.
Figure 3.4.2: Slovene IPR position in relation to EU27 (EU27=100)
Source: EUROSTAT (2010) and CIS 5.
0
25
50
75
100EPO Patents
Community Trademarks
Community Design
USPTO Patents
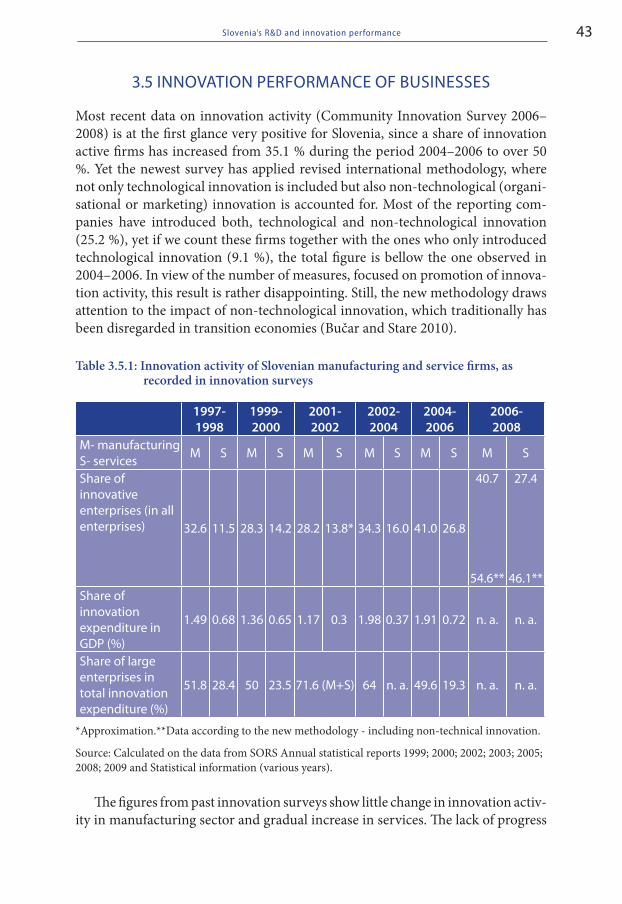
43slovenia’s r&d and innovation performance
3.5 INNOVATION PERFORMANCE OF BUSINESSES
Most recent data on innovation activity (Community Innovation Survey 2006–2008) is at the first glance very positive for Slovenia, since a share of innovation active firms has increased from 35.1 % during the period 2004–2006 to over 50 %. Yet the newest survey has applied revised international methodology, where not only technological innovation is included but also non-technological (organi-sational or marketing) innovation is accounted for. Most of the reporting com-panies have introduced both, technological and non-technological innovation (25.2 %), yet if we count these firms together with the ones who only introduced technological innovation (9.1 %), the total figure is bellow the one observed in 2004–2006. In view of the number of measures, focused on promotion of innova-tion activity, this result is rather disappointing. Still, the new methodology draws attention to the impact of non-technological innovation, which traditionally has been disregarded in transition economies (Bučar and Stare 2010).
Table 3.5.1: Innovation activity of Slovenian manufacturing and service firms, as recorded in innovation surveys
1997-1998
1999-2000
2001-2002
2002-2004
2004-2006
2006- 2008
M- manufacturing S- services M S M S M S M S M S M S
Share of innovative enterprises (in all enterprises) 32.6 11.5 28.3 14.2 28.2 13.8* 34.3 16.0 41.0 26.8
40.7
54.6**
27.4
46.1**Share of innovation expenditure in GDP (%)
1.49 0.68 1.36 0.65 1.17 0.3 1.98 0.37 1.91 0.72 n. a. n. a.
Share of large enterprises in total innovation expenditure (%)
51.8 28.4 50 23.5 71.6 (M+S) 64 n. a. 49.6 19.3 n. a. n. a.
*Approximation.**Data according to the new methodology - including non-technical innovation.
Source: Calculated on the data from SORS Annual statistical reports 1999; 2000; 2002; 2003; 2005; 2008; 2009 and Statistical information (various years).
The figures from past innovation surveys show little change in innovation activ-ity in manufacturing sector and gradual increase in services. The lack of progress
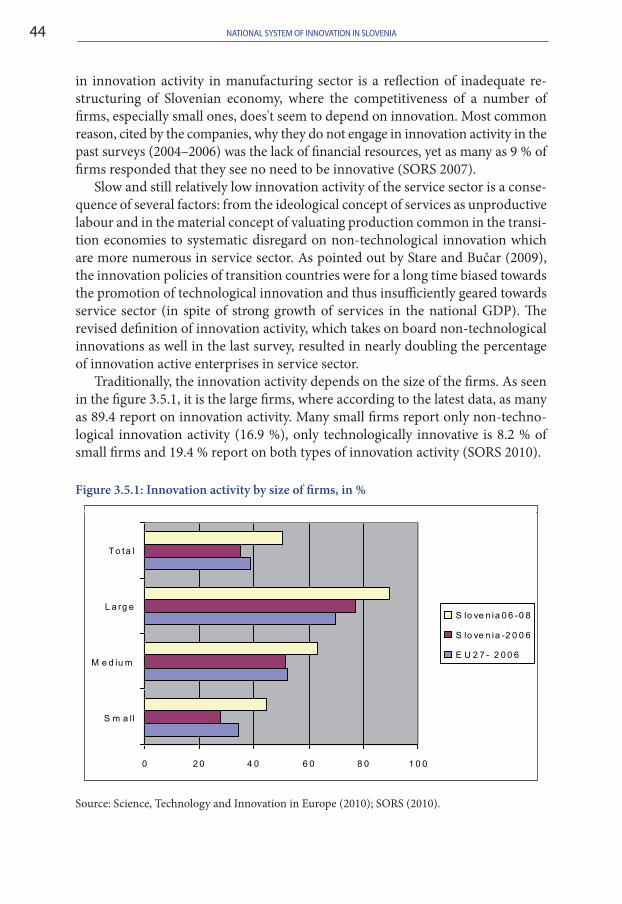
NatioNal system of iNNovatioN iN sloveNia44
in innovation activity in manufacturing sector is a reflection of inadequate re-structuring of Slovenian economy, where the competitiveness of a number of firms, especially small ones, does't seem to depend on innovation. Most common reason, cited by the companies, why they do not engage in innovation activity in the past surveys (2004–2006) was the lack of financial resources, yet as many as 9 % of firms responded that they see no need to be innovative (SORS 2007).
Slow and still relatively low innovation activity of the service sector is a conse-quence of several factors: from the ideological concept of services as unproductive labour and in the material concept of valuating production common in the transi-tion economies to systematic disregard on non-technological innovation which are more numerous in service sector. As pointed out by Stare and Bučar (2009), the innovation policies of transition countries were for a long time biased towards the promotion of technological innovation and thus insufficiently geared towards service sector (in spite of strong growth of services in the national GDP). The revised definition of innovation activity, which takes on board non-technological innovations as well in the last survey, resulted in nearly doubling the percentage of innovation active enterprises in service sector.
Traditionally, the innovation activity depends on the size of the firms. As seen in the figure 3.5.1, it is the large firms, where according to the latest data, as many as 89.4 report on innovation activity. Many small firms report only non-techno-logical innovation activity (16.9 %), only technologically innovative is 8.2 % of small firms and 19.4 % report on both types of innovation activity (SORS 2010).
Figure 3.5.1: Innovation activity by size of firms, in %
Source: Science, Technology and Innovation in Europe (2010); SORS (2010).
0 2 0 4 0 6 0 8 0 1 0 0
S m a ll
M e d iu m
L a rg e
To ta l
S lo ve n ia 0 6 -0 8
S lo ve n ia -2 0 0 6
E U 2 7 - 2 0 0 6
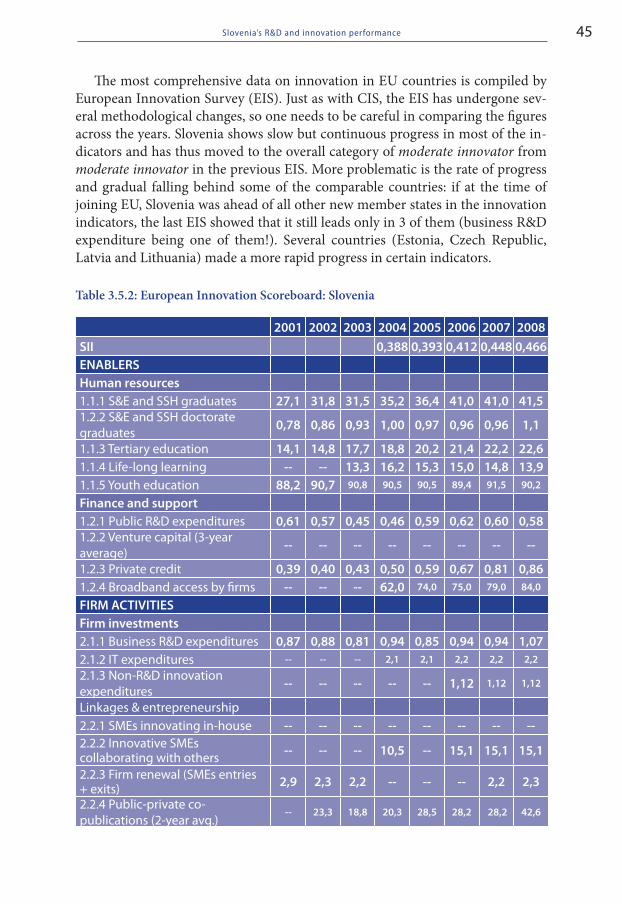
45slovenia’s r&d and innovation performance
The most comprehensive data on innovation in EU countries is compiled by European Innovation Survey (EIS). Just as with CIS, the EIS has undergone sev-eral methodological changes, so one needs to be careful in comparing the figures across the years. Slovenia shows slow but continuous progress in most of the in-dicators and has thus moved to the overall category of moderate innovator from moderate innovator in the previous EIS. More problematic is the rate of progress and gradual falling behind some of the comparable countries: if at the time of joining EU, Slovenia was ahead of all other new member states in the innovation indicators, the last EIS showed that it still leads only in 3 of them (business R&D expenditure being one of them!). Several countries (Estonia, Czech Republic, Latvia and Lithuania) made a more rapid progress in certain indicators.
Table 3.5.2: European Innovation Scoreboard: Slovenia
2001 2002 2003 2004 2005 2006 2007 2008sii 0,388 0,393 0,412 0,448 0,466eNableRs
Human resources1.1.1 S&E and SSH graduates 27,1 31,8 31,5 35,2 36,4 41,0 41,0 41,51.2.2 S&E and SSH doctorate graduates 0,78 0,86 0,93 1,00 0,97 0,96 0,96 1,1
1.1.3 Tertiary education 14,1 14,8 17,7 18,8 20,2 21,4 22,2 22,61.1.4 Life-long learning -- -- 13,3 16,2 15,3 15,0 14,8 13,91.1.5 Youth education 88,2 90,7 90,8 90,5 90,5 89,4 91,5 90,2
finance and support1.2.1 Public R&D expenditures 0,61 0,57 0,45 0,46 0,59 0,62 0,60 0,581.2.2 Venture capital (3-year average) -- -- -- -- -- -- -- --
1.2.3 Private credit 0,39 0,40 0,43 0,50 0,59 0,67 0,81 0,861.2.4 Broadband access by firms -- -- -- 62,0 74,0 75,0 79,0 84,0
fiRm aCtivities
firm investments2.1.1 Business R&D expenditures 0,87 0,88 0,81 0,94 0,85 0,94 0,94 1,072.1.2 IT expenditures -- -- -- 2,1 2,1 2,2 2,2 2,2
2.1.3 Non-R&D innovation expenditures -- -- -- -- -- 1,12 1,12 1,12
Linkages & entrepreneurship2.2.1 SMEs innovating in-house -- -- -- -- -- -- -- --2.2.2 Innovative SMEs collaborating with others -- -- -- 10,5 -- 15,1 15,1 15,1
2.2.3 Firm renewal (SMEs entries + exits) 2,9 2,3 2,2 -- -- -- 2,2 2,3
2.2.4 Public-private co-publications (2-year avg.)
-- 23,3 18,8 20,3 28,5 28,2 28,2 42,6
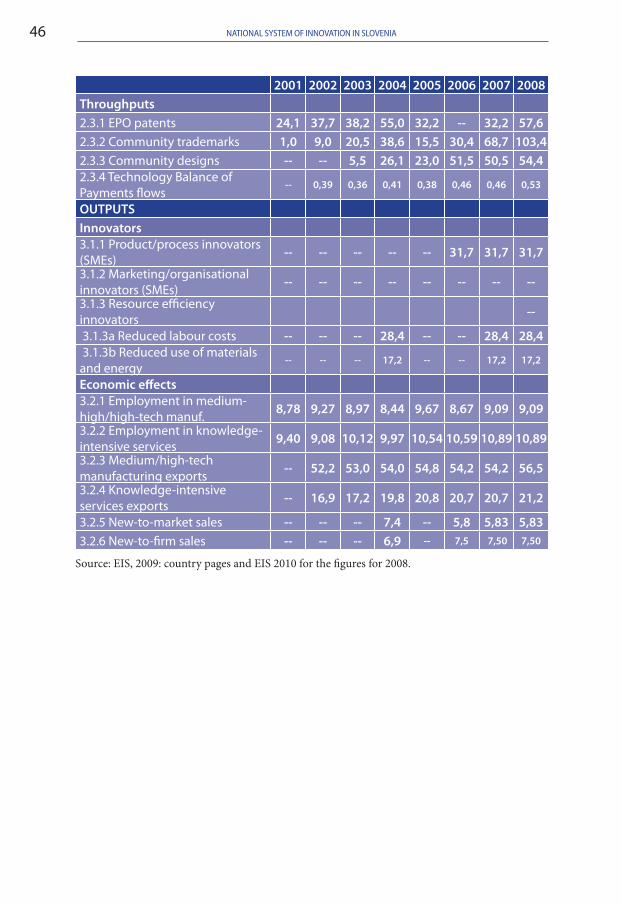
NatioNal system of iNNovatioN iN sloveNia46
2001 2002 2003 2004 2005 2006 2007 2008throughputs2.3.1 EPO patents 24,1 37,7 38,2 55,0 32,2 -- 32,2 57,62.3.2 Community trademarks 1,0 9,0 20,5 38,6 15,5 30,4 68,7 103,42.3.3 Community designs -- -- 5,5 26,1 23,0 51,5 50,5 54,42.3.4 Technology Balance of Payments flows
-- 0,39 0,36 0,41 0,38 0,46 0,46 0,53
outPuts innovators3.1.1 Product/process innovators (SMEs) -- -- -- -- -- 31,7 31,7 31,7
3.1.2 Marketing/organisational innovators (SMEs) -- -- -- -- -- -- -- --
3.1.3 Resource efficiency innovators --
3.1.3a Reduced labour costs -- -- -- 28,4 -- -- 28,4 28,4 3.1.3b Reduced use of materials and energy
-- -- -- 17,2 -- -- 17,2 17,2
economic effects3.2.1 Employment in medium-high/high-tech manuf. 8,78 9,27 8,97 8,44 9,67 8,67 9,09 9,09
3.2.2 Employment in knowledge-intensive services 9,40 9,08 10,12 9,97 10,54 10,59 10,89 10,89
3.2.3 Medium/high-tech manufacturing exports -- 52,2 53,0 54,0 54,8 54,2 54,2 56,5
3.2.4 Knowledge-intensive services exports -- 16,9 17,2 19,8 20,8 20,7 20,7 21,2
3.2.5 New-to-market sales -- -- -- 7,4 -- 5,8 5,83 5,833.2.6 New-to-firm sales -- -- -- 6,9 -- 7,5 7,50 7,50
Source: EIS, 2009: country pages and EIS 2010 for the figures for 2008.
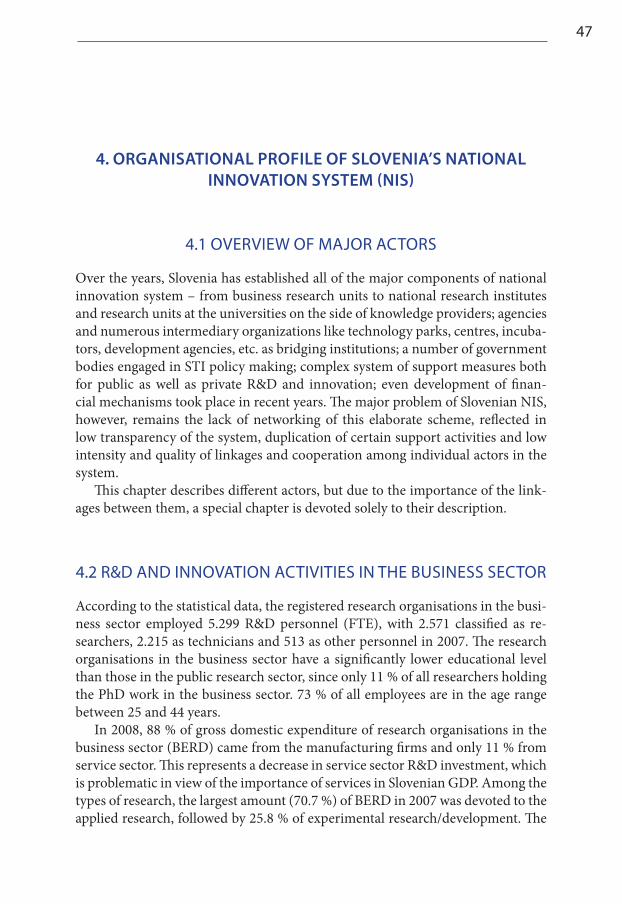
47
4. oRgaNisatioNal PRofile of sloveNia’s NatioNal iNNovatioN system (Nis)
4.1 OVERVIEW OF MAJOR ACTORS
Over the years, Slovenia has established all of the major components of national innovation system – from business research units to national research institutes and research units at the universities on the side of knowledge providers; agencies and numerous intermediary organizations like technology parks, centres, incuba-tors, development agencies, etc. as bridging institutions; a number of government bodies engaged in STI policy making; complex system of support measures both for public as well as private R&D and innovation; even development of finan-cial mechanisms took place in recent years. The major problem of Slovenian NIS, however, remains the lack of networking of this elaborate scheme, reflected in low transparency of the system, duplication of certain support activities and low intensity and quality of linkages and cooperation among individual actors in the system.
This chapter describes different actors, but due to the importance of the link-ages between them, a special chapter is devoted solely to their description.
4.2 R&D AND INNOVATION ACTIVITIES IN THE BUSINESS SECTOR
According to the statistical data, the registered research organisations in the busi-ness sector employed 5.299 R&D personnel (FTE), with 2.571 classified as re-searchers, 2.215 as technicians and 513 as other personnel in 2007. The research organisations in the business sector have a significantly lower educational level than those in the public research sector, since only 11 % of all researchers holding the PhD work in the business sector. 73 % of all employees are in the age range between 25 and 44 years.
In 2008, 88 % of gross domestic expenditure of research organisations in the business sector (BERD) came from the manufacturing firms and only 11 % from service sector. This represents a decrease in service sector R&D investment, which is problematic in view of the importance of services in Slovenian GDP. Among the types of research, the largest amount (70.7 %) of BERD in 2007 was devoted to the applied research, followed by 25.8 % of experimental research/development. The
NatioNal system of iNNovatioN iN sloveNia48
basic research receives only 3.5 % of total BERD. As for the scientific fields, busi-ness R&D is heavily concentrated in engineering and technology (57.6 %) and natural sciences (40 %). The main R&D intensive branches are pharmaceuticals, followed by radio, TV and communications equipment, machinery and equip-ment, electrical machinery and apparatus and other fabricated metal products. The fear that the importance of R&D investment by pharmaceutical industry will decline with the entry of FDI (one of the two major pharmaceutical companies was taken over by Novartis) has not proved justified: 42 % of total intramural business enterprise R&D expenditure falls on pharmaceuticals (SORS 2009).
Business sector has become the most important financier (63 %) as well as performer (64.5 %) of R&D activity. Most of the resources are spent internally: as much as 91 % of total business investment in R&D was spent in 2007 in business R&D units.
Table 4.2.1: Business R&D by sector of performance in 2007 (1000 EUR)
2007 in 1000 euR
manufacturing 2007 (in %)
in total business R&d (%)
Pharmaceuticals 111314 42,1 37,2 %
Fabricated metal products, equipment etc. 118358 44,8 39,5 %
Radio, TV and communication equipment 30149 11,4 10,1 %
Electrical Machinery and apparatus 23745 9,0 8 %
Medical, precision and optical instruments 13672 5,2 4,6 %
Motor vehicles, trailers and semi-trailers 7070 2,7 2,4 %
Other 13,1 11,6 %
Total manufacturing 264163 88,3 %
Source: SORS (2009).
4.3 HIGHER EDUCATION
Currently, Slovenia has five universities: the University of Ljubljana; the University of Maribor; the University of Primorska, University of Nova Gorica and EMUNI university. Also, 28 independent higher education institutions operate. The first three are public universities, funded for their academic tasks mostly by the govern-ment. In the spring of 2006, a new university was established (Nova Gorica), the first example of private public partnership in this area. The Euro-Mediterranean University (EMUNI University) based and registered in Slovenia was established
49organisational profile of slovenia’s national innovation system
by the Union for the Mediterranean. It was established as international network of universities (142 members from 37 countries). Within the four universities, there are 60 different HEIs in all academic fields.
The participation of youth in tertiary education is on the increase. The number of students enrolled in tertiary education relative to the number of the population aged 20–26 increased from 29.9 % in 2000 to 41 % in 2008/2009. As noted by IMAD (2010), in the academic year 2008/2009, participation of the generation at enrolment age in tertiary education (53.1 %) was close to the Slovenian Develop-ment Strategy target (55 %).
The increase in the enrolment was not followed by the adequate increase in the number of teaching staff. Slovenia still lags considerably behind most European countries (data available for OECD members). The ratio in Slovenia is also wors-ened by the fact that young people not only enroll in tertiary education to acquire education but also to take advantage of the benefits of being a student.21 This is further reflected in low efficiency of studies. In the academic year 2008/2009, the share of repeat students enrolled in full-time undergraduate study programmes and long non-structured master’s study programmes stayed at about 10 %.22 The average duration of studies of full-time university graduates is among the highest in Europe. In 2008, the average duration was 6.7 years (2007: 6.8 years).23 The low efficiency of studies is also seen by comparing data on the number of students in tertiary education per 1.000 population aged 20–29, where Slovenia is well above the EU average,24 with data on the number of graduates of tertiary education per 1.000 population aged 20–29, where Slovenia lags behind the EU average.25
Another indicator of quality in tertiary education is the international mo-bility of students. In the academic year 2008/2009, as in the period 2000/2001–2008/2009, the share of foreign students studying in Slovenia slightly increased (to 1.7 %; in 2007/2008: 1.5 %). Nevertheless, the share of foreign students in Slovenia and Slovenian students studying abroad in 2007 was among the lowest in the EU.
21 Additional explanation for low efficiency (i.e. long time required to graduate) is the benefits enjoyed by legal status of students. During their studies, students can work with no income tax. This form of employment is also favourable for the employers, since they do not need to pay social and health security compulsory contributions – meaning that net price of student labour is significantly lower than for the regular employees. In addition, such employment provides for high level of flexibility in hiring, since this is typically a temporary engagement. The government proposed a new law on regulating this type of employment in spring 2010, which resulted in laud opposition by the student organisations.
22 The share of repeat students enrolled in the first year is slightly higher.23 Data from EUROSTUDENT III (2005–2008), available for 2006 or 2007. 24 In 2007, the ratio in Slovenia was 40.1, the EU average was 28.6 (IMAD 2010).25 In Slovenia, the number of graduates in tertiary education per 1.000 population aged 20–29
was 57.7 (EU-27: 59.9).
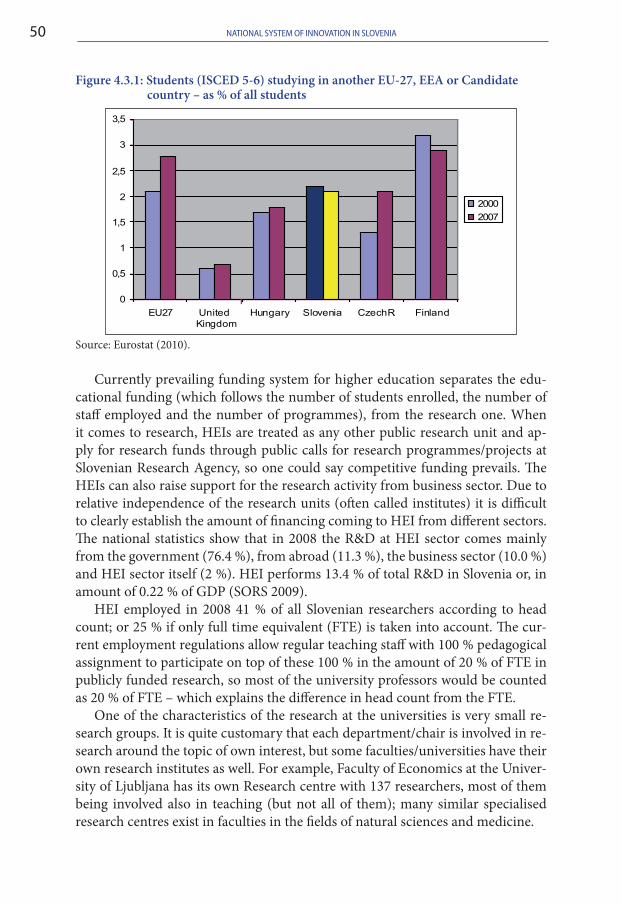
NatioNal system of iNNovatioN iN sloveNia50
Figure 4.3.1: Students (ISCED 5-6) studying in another EU-27, EEA or Candidate country – as % of all students
Source: Eurostat (2010).
Currently prevailing funding system for higher education separates the edu-cational funding (which follows the number of students enrolled, the number of staff employed and the number of programmes), from the research one. When it comes to research, HEIs are treated as any other public research unit and ap-ply for research funds through public calls for research programmes/projects at Slovenian Research Agency, so one could say competitive funding prevails. The HEIs can also raise support for the research activity from business sector. Due to relative independence of the research units (often called institutes) it is difficult to clearly establish the amount of financing coming to HEI from different sectors. The national statistics show that in 2008 the R&D at HEI sector comes mainly from the government (76.4 %), from abroad (11.3 %), the business sector (10.0 %) and HEI sector itself (2 %). HEI performs 13.4 % of total R&D in Slovenia or, in amount of 0.22 % of GDP (SORS 2009).
HEI employed in 2008 41 % of all Slovenian researchers according to head count; or 25 % if only full time equivalent (FTE) is taken into account. The cur-rent employment regulations allow regular teaching staff with 100 % pedagogical assignment to participate on top of these 100 % in the amount of 20 % of FTE in publicly funded research, so most of the university professors would be counted as 20 % of FTE – which explains the difference in head count from the FTE.
One of the characteristics of the research at the universities is very small re-search groups. It is quite customary that each department/chair is involved in re-search around the topic of own interest, but some faculties/universities have their own research institutes as well. For example, Faculty of Economics at the Univer-sity of Ljubljana has its own Research centre with 137 researchers, most of them being involved also in teaching (but not all of them); many similar specialised research centres exist in faculties in the fields of natural sciences and medicine.
0
0,5
1
1,5
2
2,5
3
3,5
EU27 UnitedKingdom
Hungary Slovenia Czech R. Finland
2000
2007
51organisational profile of slovenia’s national innovation system
An important way of assuring the quality of research at HEI is through the promotion criteria, which is becoming more and more rigorous at all four uni-versities and attaches increasing importance to the quality of the research work of the candidates. In particular, the overall publication record is considered as well as number of papers in top ranking journals and number of citations. Still, this is the assessment at the individual level and not at the institutional one.
Slovenian higher education system is currently engaged in the implementation of the Bologna reform. The regulator allowed different dynamics in introduction of the Bologna system, depending on the individual programme of each faculty. In practice this means that even within each university, some faculties may al-ready be fully adjusted to the new system, while some have only started with Bo-logna process in the school year 2009/10. The reform, as well as 2008 Resolution on Higher education26 has the increase of quality of research work as well as of teaching high on their agendas.
The Law on Higher education27 passed in 2004, envisaged the establishment of the Public Agency for Higher education with the task of accreditation, monitoring and evaluation of the programmes of HEI. Due to various political objections the establishment of the independent agency had been postponed and it only started its work on 1 May 2010.
The four universities have formed the rectors’ conference where common problems and strategies are discussed. The members are all four rectors and vice-rectors. The Chair rotates bi-annually. Also, all four rectors are by their position members of the National Council for Science and Technology.
4.4 PUBLIC RESEARCH ORGANISATIONS
There are 47 research institutes in the government sector, employing 2157 re-searchers (FTE count) in 2008. The public research institutes (15), which are hav-ing the Republic of Slovenia as their founder, are entitled to institutional funding. The percentage that institutional funding represents, varies from institute to insti-tute, but, on average, institutes report that 10–30 % of their budget is covered in this way. Institutes can apply to Slovenian Research Agency for the research pro-gramme funding with their research groups, for the applied projects if they have co-financing from business sector and for the so-called targeted research projects. The funding is obtained also through direct contracts with the business sector and through international cooperation.
26 More at: http://www.uradni-list.si/1/content?id=82672. 27 See more: http://zakonodaja.gov.si/rpsi/r02/predpis_ZAKO4172.html.
NatioNal system of iNNovatioN iN sloveNia52
The research institutes receive most of the resources from the public funding: according to 2008 data, as much as 79 % of total funding was received from the government with only 13 % coming from business sector and 6 % from abroad. With each strategic document in the area of STI, a need to align better the re-search implemented by the institutes with the needs of the Slovenian business sector is stressed, but no shift has occurred yet. The government sector accounts for 21.9 % of total R&D activity.
The most important national and public research institutes are:Agricultural Institute of Slovenia;•Educational Research Institute;•GeoZS, Geological Survey of Slovenia;•IER, Institute for Economic Research;•Institute for Hydraulic Research;•IJS, Jozef Stefan Institute;•IMT, Institute of Metals and Technology;•INV, Institute for Ethnic Studies;•INZ, Institute of Contemporary History;•National Institute of Chemistry;•NIB, National Institute of Biology;•Slovenian Forestry Institute;•UI, Urban Planning Institute;•ZAG, National Building and Civil Engineering Institute; and•ZRC SAZU, Scientific Research Centre of SASA.•
The national research institutes are highly different in terms of number of em-ployees, in terms of level of cooperation with the business sector or participation in the higher education programmes. The largest and most influential national research institute is the Institute Jozef Stefan (IJS) with more than 800 employees. IJS stands out in several R&D indicators, from the share of the funds received from the Slovenian Research Agency to the number of patents filed (more than 200 by 2008). The size gives IJS also significant political clout and thus impact on Slovenian R&D policy.
4.5 NON-PROFIT RESEARCH ORGANISATIONS
This sector is very small in Slovenia. One of more recognizable private non-profit research institutes is Peace institute,28 established by several individuals to promote research in social sciences. The Peace institute functions also as a non-governmental
28 More at: http://www.mirovni-institut.si/Main/Index/en/.
53organisational profile of slovenia’s national innovation system
organisation. The individual (independent) researchers can register themselves with the Slovenian research agency and would be accounted for in this group as well.
A relatively active non-profit organisation in the area of R&D in Slovenia is the Slovenian Science Foundation (SSF). The SSF is involved in the promotion of science and is providing scholarships for young researchers but does not provide direct research funding.
4.6 INTERMEDIARY ORGANISATIONS AND PROFESSIONAL ASSOCIATIONS
Over the years, Slovenia has developed a rather complex scheme of institutions for R&D and innovation policy implementation, from technology parks and centres (1994), incubators (2003), clusters (2001), technology networks (2003), technol-ogy platforms (2004), centres of excellence (2005), different business information units like the Small Business Development Centre,29 Innovation Relay Centres, Euro-Info-Centres, regional development agencies, Slovene Enterprise Fund, etc. All of these were set up with the ambition to provide for as complete an innovation system as possible. Yet sometimes it seemed as if the main emphasis was more on the number of different instruments and institutions than on the quality of their work. National funding for their basic activities has often been insufficient and ir-regular and several institutions spend much of their energy on survival instead of on carrying out the tasks they were established for (Bučar and Stare 2006). These can be grouped according to their main tasks in the following categories:
Government executing/ funding agencies:a) 30 Slovenian Research Agency, Slov-enian Technology Agency, Public Agency for Entrepreneurship and Foreign Investment, Slovenian Enterprise Fund;‘Bridging’ institutionsb) like technology centres, technology platforms, centres of excellence, clusters;Technology/innovation/entrepreneurship support institutionsc) like technol-ogy parks, business and university incubators, technology transfer offices, VEM-points, regional development agencies;Financial intermediariesd) : venture funds, business angels association, etc;Interest organizationse) : Chamber of Commerce and Industry, Chamber of Craft and Small Business of Slovenia, etc.
29 Integrated in 2005 into JAPTI, Public Agency for Entrepreneurship and Foreign Investment (see details in section 2.2).
30 Chapter 6.6. includes the presentation of various measures, implemented by these agencies.
NatioNal system of iNNovatioN iN sloveNia54
Ad a)In compliance with 2002 Law on Research and Development, Slovenia established two Agencies in the field of R&D and innovation: the Agency for Scientific Re-search (SRA)31 and the Agency for Technology Development (TIA).32 The idea behind such institutional setting was that the agencies (each in its sphere) would be responsible for permanent, professional and independent selection process of projects and programmes, which are to be financed from public resources. Each agency has its management board, a director and a scientific (expert) council. The Law on R&D specifies also the main tasks for each agency. While SRA is focused on financing public R&D resources primarily to public research institutes and higher education institutions, TIA is the central agency in support of business sector R&D and technology development.
Formally the Slovenian Research Agency (http://www.arrs.si) was established and begun functioning in 2004. Since the task of the SRA is the distribution of pub-lic research funding according to the policies decided by the Ministry of Higher Education, Science and Technology and the government, the basic mechanism of funding is distribution of grants to selected projects/ programmes and other activities. Each of the regular programmes has its selection and evaluation system pre-specified. The SRA’s programme consists of:33
long-term financing of research programmes, known as ‘Research programme •groups’ (three to seven years contracts, awarded to a group of researchers for their programme of basic research);34
basic and applied research projects’ funding;•Young researchers programme;•support to research infrastructure;•financing of the participation of Slovenian researchers in international re-•search networks and organisations;co-financing of international research conferences and other events;•monitoring the implementation of the National research and development •programme;international and bilateral R&D cooperation, etc.•
31 For details, see ERAWATCH Research Inventory Slovenia: http://cordis.europa.eu/erawatch/index.cfm?fuseaction=ri.content&topicID=4&countryCode=SI. 32 For details see: http://cordis.europa.eu/erawatch/index.cfm?fuseaction=org.
document&UUID=9E507280-9779-CCF5-A96457625F3A7247&hwd=. 33 A detailed description of the main programmes is given in 6.6.4.34 For details about the programme, see: http://cordis.europa.eu/erawatch/index.cfm?fuseaction=prog.
document&UUID=7D87B479-BAD1-C57F-1B12AB4FE1C719C5&hwd.
55organisational profile of slovenia’s national innovation system
The SRA’s planned annual programme budget in 2010 is 184.8 million EUR, while the administrative costs of the Agency are planned at 3.7 million. SRA em-ploys 52 staff members (http://www.arrs.gov.si/sl/finan/letpor/10/inc/ARRS_Pro-gram_dela_10_11.pdf ).
The establishment of the Slovenian Technology Agency (http://www.tia.si) took longer due to a more complex manner in which its operation was to run. Initially, technology promotion was under the Ministry of Economy, but with the government’s reorganisation at the end of 2004, technology sector was moved to the Ministry of Higher Education, Science and Technology as a new directorate. The operational responsibility and the budget line for TIA was to be moved as well, but this process was delayed for two years. By 2008, TIA has finally been recognised as the implementing agency in the area of innovation and technology development programmes of the MHEST, Ministry of Economy and Ministry of Defence. TIA’s programme includes:
Promoting and supporting technological platforms;•Promotion the further involvement of Slovenian enterprises in defence R&D;•Development and investment projects;•Support to strategic R&D projects in business sector;•Supporting the strengthening of the national innovation system;•Funding of the Programme for the Young Researchers from the business •sector;Participation in various international projects like VALOR, NATO, DEFINE, •STARNETREGIO, TARGET, GLOVAL, etc;Internal organisation of the TIA, including quality monitoring and building a •user-friendly monitoring system for the public calls the TIA is carrying out.
TIA has expanded its activity significantly in 2008 and 2009. Most of the newly allocated resources by the government for the business R&D were chan-nelled through TIA. This has led to a serious human resources problem, since the number of its staff has not grown at the same pace as its activity. The overall operational budget of the TIA for the year 2009 is 1.66 million EUR. Several of the programmes are co-financed by the European Regional Development Fund (ERDF), so the total amount of financial resources available for 2010 is planned initially at 88.9 million EUR, with the largest share of money going to develop-ment & investment projects and for the support of strategic R&D projects. The latter was supposed to be single largest TIA’s programme with more than 109 million EUR for the period 2009–2012, yet the second budget revision severely scaled the amount available for 2009 downwards: in part also as a consequence of serious delays in processing of the call and claiming the reimbursements. According to TIA’a data, the actual amount of resources disbursed on 2009 was 51.46 million EUR with the plan for 2010 at the level of 103.9 and 96.5 mil-lion for 2011 (TIA, 2010 – http://www.tia.si/shared_files/Dokumenti/Program_TIA2010_2011.pdf ).
NatioNal system of iNNovatioN iN sloveNia56
Several of innovation and entrepreneurship support measures of the Ministry of Economy (ME) are carried out by the Public Agency for Entrepreneurship and Foreign Investment (PAEFI – http://www.japti.si), which is under the ME’s ‘um-brella.’ PAEFI is thus involved in supportting technology parks, university incuba-tors, small business voucher scheme, mobility schemes, etc. Among relatively new measures are: the support to the mobility of researchers to and within business sector as well as support to the interdisciplinary development groups in business sector. Also, provision of the special training for the entrepreneurs and special tar-get groups (from elementary school to the university level students) is supported, allthough at a rather modest level.35
Some of the activities of PAEFI seem to collide with the activities of TIA and MHEST (support to R&D projects of SMEs, support to innovative environment & promotion of innovation activity/education). Total PAEFI’s budget for 2010 is planned at 42.58 million EUR (nearly double of the budget for 2009), while its running costs are planned at nearly 2.5 million. This does not compare well with TIA, and neither does the number of staff: while PAEFI manages its programmes for entrepreneurship and foreign investments with 54 people, TIA has to do with 21 staff members.
Increasingly important in business R&D and innovation activity is the Slovene Enterprise Fund (SEF – http://www.podjetniskisklad.si). SEF played a minor role in supporting innovation related measures till 2005 due to serious limitations in terms of financial resources. With the ERDF’s contribution and the European In-vestment Fund, SEF has successfully expanded its operation and now SEF is grow-ing as a national financial organisation for support to SMEs with different forms of favourable financing. The support measures executed via SEF are subsidised loans to SMEs for expansion/modernisation of production capacities, subsidies for the establishment and start up of innovative firms in innovative environment such as technology parks, business or university incubators and technology equipment subsidies for SMEs to enhance firms’ productivity and growth, and consequently improve their position on a global market. Under the new financial perspective 2007–2013, SEF continues to provide financial support to SMEs for the same as well as several new programmes.
Another relatively new actor in the area of providing financial support is the SID Bank –Slovenian Export and Development Bank.36 With its financial services SID Bank supports investments in research and development of technological
35 The public call for the support to the organisation and implementation of entrepreneurial education for the young for 2009, ranging from support to the education programmes in elementary schools, vocational high schools, high schools (gymnasium) to the university, was issued in June 2009 for the total value of (only) 150.000 EUR. (http://www.japti.si/index.php?t=razpisi&id=51).
36 More on http://www.sid.si/about-sid-bank.
57organisational profile of slovenia’s national innovation system
environment and technology. SID Bank refinances credits of banks and other financial institutions, co-finances transactions and investments or SID Bank fi-nances projects directly. SID bank carries out financing of these projects through commercial banks. For small and medium enterprises SID Bank had recently de-veloped two special products: financing of SMEs’ investments in research, de-velopment and innovation and sharing of risks arising from financing of SMEs’ investments in R&D&I. According to some of the government’s proposals (Slov-enia’s exit strategy), SID bank is to play a major role in the future co-financing of development of business sector. The government plans to move from subsidies to credits and here SID is to provide the appropriate financial assistance. Exact mode of operation is currently (summer 2010) under discussion.
Ad b) Bridging institutions One of the early ideas of the bridging institutions was the formation of technology centres (from 1994 onwards). Technology centres are independent legal entities es-tablished by several companies for the purposes of R&D in a specific field or branch, as well as for the provision of R&D equipment subsequently made available to com-panies for their development projects. There are currently 28 active technology cen-tres operating in the fields ranging from textile processing, footwear, tool-making, and electrical engineering, information and safety technologies. The innovation in-frastructure support programme provides for the continuation of existing support to technology centres. The mode of co-financing has changed over the years, from the co-financing of the costs of operation to financing of the programmes.
Technology platforms were first introduced by the Ministry of Higher Educa-tion, Science and Technology in 2005 in cooperation with the Chamber of Com-merce and Industry. MHEST offered a financial subsidy for the establishment of the platforms and their participation at the EU level. 12 technology platforms were formed in 2005. In 2008 and 2009 technology platforms were supported through two measures: one directed specifically to their functioning and the other, signifi-cantly larger, to joint research projects, initiated by the technology platforms. The platforms are supported by the Chamber of Industry and Commerce as well, since they are seen as an efficient way of voicing the R&D and innovation priorities of a particular branch of industry as well as mobilizing attention of the public R&D sphere to the R&D problems of business sector.
The cluster initiative in Slovenia, beginning in 2000, was one of the top prior-ity measures when introduced. The background of the cluster policy is interesting from the point of view of policy implementation and was set out as an example of good innovation governance. Prior to introducing the measure, several consulta-tions and meetings with foreign experts took place. The extensive assessment of the potential clusters, involving 1700 companies, was carried out in 1999. On this basis, a pilot programme was planned for the period 2000–2003.
The cluster promotion started carefully: during the first year of the programme only three pilot clusters were established. In the subsequent year, their number
NatioNal system of iNNovatioN iN sloveNia58
increased to five, but a real breakthrough in clustering was achieved in 2003. Clus-ters were primarily sector based and linked together companies within the same industrial sector and research institutions in the particular field. The total 2003 budget for cluster policy was approximately 1.5 million EUR. The ME accepted 14 projects and was able to grant on average 21 % of the requested funds. The inter-est of the business sector far surpassed the ability of government to support this initiative, in spite of high priority assigned to clustering. Several more developed clusters also approached EU funds for financial support.
In 2004, 18 cluster offices were operational. All together 29 projects related to clustering were being supported: 3 pilot cluster projects, 13 early stage clusters and additional 13 cluster initiatives, bringing together 350 companies and 40 edu-cation/research institutes.
The ME was not only supporting the clusters themselves, it was actively pro-moting the cluster concept as such. It co-funded several seminars, workshops and conferences and even study tours by the representatives of clusters abroad (in 2003, Great Britain and Sweden). Representatives of ME took part at international conferences, presenting Slovenian experience in cluster support. With the assist-ance of business journal Podjetnik (Entrepreneur) ME hosted an international cluster conference in 2004 in Slovenia.
The success of the cluster initiative was not convincing enough and after the change of government in the end of 2004, the cluster support programme was discontinued. The clusters which have developed sufficiently by the time the pro-gramme stopped (like the automobile cluster) were able to apply for R&D project support, but not for their own operational costs. The promotion of clusters in Slov-enia was a reflection of a transfer of an example good policy practice, observed abroad, but modified to be more in line with the needs of Slovenian businesses.
Ad c) Support institutionsTechnology parks – another early introduced measure (1994) are supported by Ministry of Economy through PAEFI. Here, too, the modes of financing have changed several times since their establishment – until 2005 the services the parks offered to SMEs located within the parks were subsidised, but in 2005 and in 2006 a special public call, supported also by the funds from European Regional Devel-opment Fund provided substantially increased resources for construction of new premises and new research infrastructure investments. Currently, the support to technology parks is provided through PAEFI via the programme on innovation infrastructure. Four parks are functional, the biggest being Ljubljana Technology park, where more than 250 enterprises are located.
University incubators were introduced in 2004 at the three main (public) uni-versities, following the PHARE study recommendation. They are in part supported by the Ministry of Economy/PAEFI through innovation infrastructure measure. Yet sporadic funding in the past has led to relatively unimpressive activity, at least in the area of incubation. They have moved into provision of different consultancy
59organisational profile of slovenia’s national innovation system
and training services, also to meet the criteria of the call to which they apply for co-financing. Especially successful in this regard has been the incubator at the University of Maribor, called the Factory of Ideas (Tovarna podjemov).
New businesses can also turn for support to so called ‘business incubators’ which were set up either by local governments or private companies. In the long-term programme, included in the Operational Programme, the Ministry of Econ-omy planed the establishment of a network of economic-developmental-logistical centres (the document talks about 9 of them) in all geographical areas of Slovenia, where sufficient critical mass of knowledge, economic development and business concentration and population is present. In 2008, PAEFI published the first public call for the co-financing of the construction of technology parks and business incubators within so called ‘regional economic-logistic-technology centres’, with approximately 50 million EUR dedicated for the period 2009–2012 and selected two locations. At the end of 2009, the change of OP was negotiated: some of the planned funds were transferred to the MHEST for the support to Competence centres37 and most of the remaining resources the Ministry of Economy is allocat-ing for ‘development centres’ –similar to the previous idea of economic-business-logistical centres, just less ambitious.38
Technology transfer offices have been established by some universities as an attempt to stimulate cooperation of HEI with business sector, but little systematic record on their impact exists. They are to be supported by the universities them-selves and the business they generate. Yet current level of decentralised manage-ment, present especially at the larger universities (Ljubljana for example), where much of the decision-making in relation to research is left at the level of individual faculty, makes the position of these offices rather fluid.
There are currently several regional development agencies, but not policy-setting ones. They have very differentiated legal status (from public agencies at the level of local community, to public – private partnership or full private ownership) and are primarily involved in providing consultancy services to local entities (SMEs) when applying for Structural Funds or other government subsidies. Some of the regional development agencies have registered with PAEFI as business/innovation support providers and/or VEM points and thus receive some co-funding for their activities.
Ad d) Financial intermediariesThe lack of venture capital has been cited often as one of the drawbacks for pro-motion of entrepreneurship, especially in high-tech area. Only a small number of venture capital firms are operational in Slovenia, in spite of lengthily discussions on the need to promote this form of assistance. Already in 2004, with the Law
37 A call for the formation of Competence centres was issued in August 2010, for which the MHEST allocated 45 million EUR (http://www.uradni-list.si/_pdf/2010/Ra/r2010064.pdf ).
38 The call is under preparation and should be issued in the fall of 2010.
NatioNal system of iNNovatioN iN sloveNia60
on development of small and medium enterprises, the basis for establishment of venture capital fund within the Slovene Enterprise Fund was given. The Law also allowed for private sector co-financing of this activity. It took two more years for the Government to adopt a law on venture capital companies,39 while the Corpo-rate Income Tax Act introduced tax relief for venture capital investments in fast-growing and innovative SMEs through venture capital companies.
At first, the the Ministry of Economy planned to establish a public venture capital company which would operate according to the principle of public-pri-vate partnership and encourage private venture capital companies to enter young, growing, and innovative enterprises. In 2009, it was decided to form a holding fund at the Slovene Enterprise Fund which is to offer equity financing to pri-vate venture capital companies of up to 49 %. The government hopes that this measure will stimulate higher activity of existing venture capital firms40 as well as attract new (foreign) venture capital firms to Slovenia. The ambition is that with the available 33.99 million EUR, of which 85 % come from EU – ERDF and 15 % from Slovenian budget around 40 new enterprises could be supported (under as-sumption that at least 8 venture companies will apply to the first call and that each will finance minimum 5 enterprises). How realistic these expectations are will be reflected in the report on the first public call, opened by SEF in June 2010.
Since 2007, a Business angels club is also operating (http://www.poslovni-angeli.si/) in Slovenia. According to their web page, it currently has around 200 members, who are well known entrepreneurs in the country and are prepared to invest between 100.000 to 400.000 EUR as equity in viable business propositions.
The Chamber of Commerce and Industry has established RSG Capital as its spin-off and initially supported it by funds from CCIS. It was set up as non profit-making entity and therefore reinvested all excess income into further development of its continuing operations. In 2008, RSG was transformed into venture capital management company. The ownership of the company is now diversified, and the company operates like a standard venture capital firm.41
Ad e) Interest associationsIn addition to the government, several other institutions are also involved in pro-moting entrepreneurship and innovation. The Chamber of Commerce and In-dustry provides info desk to new entrepreneurs and offers consultancy, so does the Chamber of Crafts and Small Business.42 Both associations are involved in the
39 Zakon o družbah tveganega kapitala http://www.uradni-list.si/1/content?id=82515 ; Official Gazette UL92/2007 from 10 October 2007.
40 According to ME, four such firms were operating in 2010.41 http://www.rsg-capital.si/en/.42 While the first one has a voluntary membership, the Chamber of Crafts and Small Business
maintained legally compulsory membership.

61organisational profile of slovenia’s national innovation system
policy process as active participants in discussion on new strategic orientation, voicing the views of their constituencies.
Local communities, especially larger ones, like the City of Ljubljana, have their own entrepreneurship promotion centres, where SMEs can find necessary information and support for their ideas. Also, some private consultancy firms are engaged in providing assistance to SMEs, either through voucher scheme, fi-nanced by PAEFI or their service is being subsidised by the local community.


63
5. liNKages of tHe NatioNal system of iNNovatioN iN sloveNia
5.1 LINKAGES OF ENTERPRISES THROUGH THE INNOVATION PROCESSES
According to CIS 2002–2004 and 2004–2006, the cooperation of innovation ac-tive enterprises is on the increase in all categories. The most dynamic and closest is the cooperation with the suppliers on one hand and the customers on the other. This could be expected in the production value-chain. The degree of innovation cooperation places Slovenian enterprises on the fourth place in EU.
Figure 5.1.1: Share of innovative enterprises cooperating by innovation activity with other subject 2002–2004 and 2004–2006
Source: SORS (2006, 2007).
An increase in cooperation is recorded also in cooperation of innovative enter-prises with HEI and public research institutes, even though this is the least active area of cooperation. The key objective of setting up a wide variety of support in-stitutions has been the promotion of the cooperation between public R&D sphere and business sector. This, however, seems to remain one of the deficiencies of the Slovenian R&D and innovation system.
0 1 0 20 3 0 40 5 0
Enterprise
Suppliers
Clients/customers
Competitors
Consultants/commerciallabs
HEIs
Govt/PRI
20 02 -20 0 4 064-2 006
20 0 6
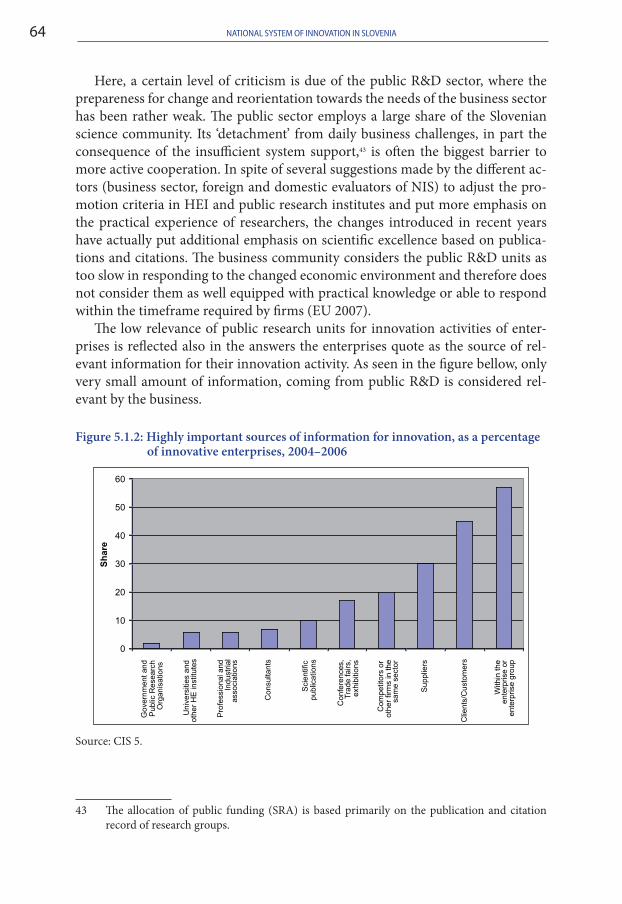
NatioNal system of iNNovatioN iN sloveNia64
Here, a certain level of criticism is due of the public R&D sector, where the prepareness for change and reorientation towards the needs of the business sector has been rather weak. The public sector employs a large share of the Slovenian science community. Its ‘detachment’ from daily business challenges, in part the consequence of the insufficient system support,43 is often the biggest barrier to more active cooperation. In spite of several suggestions made by the different ac-tors (business sector, foreign and domestic evaluators of NIS) to adjust the pro-motion criteria in HEI and public research institutes and put more emphasis on the practical experience of researchers, the changes introduced in recent years have actually put additional emphasis on scientific excellence based on publica-tions and citations. The business community considers the public R&D units as too slow in responding to the changed economic environment and therefore does not consider them as well equipped with practical knowledge or able to respond within the timeframe required by firms (EU 2007).
The low relevance of public research units for innovation activities of enter-prises is reflected also in the answers the enterprises quote as the source of rel-evant information for their innovation activity. As seen in the figure bellow, only very small amount of information, coming from public R&D is considered rel-evant by the business.
Figure 5.1.2: Highly important sources of information for innovation, as a percentage of innovative enterprises, 2004–2006
Source: CIS 5.
43 The allocation of public funding (SRA) is based primarily on the publication and citation record of research groups.
0
10
20
30
40
50
60
Gov
ernm
ent a
ndP
ublic
Res
earc
hO
rgan
isat
ions
Uni
vers
ities
and
othe
r H
E in
stitu
tes
Pro
fess
iona
l and
Indu
stria
las
soci
atio
ns
Con
sulta
nts
Sci
entif
icpu
blic
atio
ns
Con
fere
nces
,T
rade
fairs
,ex
hibi
tions
Com
petit
ors
orot
her
firm
s in
the
sam
e se
ctor
Sup
plie
rs
Clie
nts/
Cus
tom
ers
With
in th
een
terp
rise
oren
terp
rise
grou
p
Sh
are
65linkages of the national system of innovation in slovenia
Yet, our research, based on case studies, has shown, that several successful companies have established links with public research either at universities or re-search institutes and formed permanent teams of researchers from both sides. According to their statements, it took some time to find a common language and to develop fruitful cooperation, but in the end, the result is beneficial to both sides (Bučar and Rojec 2009). The measure, which proved to be very effective in stimulating the cooperation between the public R&D and the business sector, is the financing of young researchers from business sector (see details in 6.6.2). Even though this was not the prime objective of the measure,44 the young researchers provided a communication linkage between their employer – the business firm and their educator – HEI. This often resulted in more intensive cooperation in R&D field. On the other hand, several measures aimed specifically at supporting the cooperation between public and private R&D units, were often not known to the enterprises (like the mobility scheme, for example).
One of the reasons for low effectiveness of the support network is insufficient coordination and specialisation, where no clear demarcation of the tasks is done.45 Since facilitation of the knowledge flows is an important R&D and development policy orientation, the challenge of coordinated approach to designing the most efficient network, combining the roles of university incubators, technology parks, technology centres, platforms, centres of excellence, regional development agen-cies, clusters, business promotion centres, etc. in a coherent and transparent sup-port system should be given more policy attention.
5.2 OTHER INTERNAL LINKAGES IN NIS
The issue of cooperation between the business and public R&D as well as within public R&D, where fragmentation of research teams has also been noted, has been addressed by the R&D and innovation policy by introduction of several measures (see chapter 6.6 for detailed description).
One of such more recent measures in Slovenian R&D and innovation policy was the formation of the Centres of Excellence. In 2003, even prior to the ac-ceptance of the Slovenian National Research and Development Programme, the government decided to support the establishment of Centres of Excellence by the Ministry of Higher Education, Science and Technology (MHEST). Most important
44 The measure aimed at increasing the educational structure of the researchers employed in business R&D units.
45 A study by Mali and Bučar (2008) found that many of the support institutions offer rather similar services to businesses and apply for government subsidies at the same calls (innova-tion infrastructure). Similar were the findings of SLORITTS project in 2005 (http://cordis.europa.eu/itt/itt-en/05-1/ire04.htm ).
NatioNal system of iNNovatioN iN sloveNia66
was the decision to engage for this the resources available from the European Re-gional Development Fund first for the period 2004–2006 and for the continuation of the measure during the period of current financial perspective 2007–2013.
The first period led to the establishment of ten Centres of Excellence, which combined research facilities at different public research units (both institutes and universities are involved) with research units in the business sector – members of the centres of excellence. The formation of the Centres of Excellence (CE) provided an opportunity to join together key researchers and their institutions in a particu-lar science area regardless of their origin. The experience of the first round of CE was carefully evaluated (Mešl and Bučar 2008) and the findings were incorporated in the new call for CE for the period 2009–2013, which was issued and processed by MHEST in 2009. In the second call, eight centres of excellence were selected, each receiving approximately 10 million EUR for five years of their activity.
Among the positive characteristics, which are maintained in the current for-mation of the CE are the following:
Inter-disciplinarity, since the CE joins together different scientific fields, rel-•evant for a particular area. This by itself has been a novelty for Slovenia where public financing of basic and applied research is usually divided according to the scientific fields and little cross- or interdisciplinary research finds sufficient financial support.Joining of the research teams at research institutes, at universities and in busi-•ness firms on equal footing. Joint sharing of the research equipment not only between the public research •units, but in particular with the business community. Most of the high tech equipment for research in the areas where centres of excellence have been established is for Slovenian circumstances extremely expensive and only the formation of a CE and the co-operation at such scale makes it possible for the researchers to get access to this type of equipment. Benefit for the postgraduate students and young researchers who could use •the sophisticated equipment for their research and participate in the on-going research activities of the Centre.
During the first round of CE, there had been several implementation obstacles, especially since this was a novel type of organisational scheme. Hopefully, most have been resolved with the changes introduced in the second round of financing on CE from 2009 on. A very complex administrative procedure, referred to by the first CE, has been partly modified, but also special allocation of funds for the administrative tasks of CE are now provided under the on-going contracts. Over-all, the creation of the centres of excellence has been a positive development in Slovenian R&D system, which due to the restricted national resources would not have occurred without ERDF. The policy-maker’s expectation is that the period of co-financing of CE is long enough to enable CE to develop successfully in the scientific field to be able to generate by themselves sufficient financial resources
67linkages of the national system of innovation in slovenia
for its sustained growth after the funding through ERDF ceases. This will depend as well on the quality of linkages established with the business sector.
5.3 EXTERNAL LINKAGES- INTERNATIONALISATION OF RTDI PROCESSES46
Increased participation of Slovenian researchers in international R&D coopera-tion is one of the objectives of the NRDP and is actively promoted through vari-ous measures. Co-financing is provided for participation of Slovenian researchers at international conferences and their membership fees in international research associations, preparations of project proposals for EU Framework Programmes is encouraged not only via providing technical and information assistance, but also financially stimulated. More and more research programmes are open to foreign participation. Slovenia has signed numerous bilateral agreements on cooperation in S&T field and is actively engaged in several multilateral programmes with the ambition to secure itself access to international knowledge.
From the viewpoint of the business sector, one of the most successful pro-grammes has been participation in EUREKA programme. As a member of EU-REKA since 1994, Slovenia has been involved in 158 EUREKA projects with a total budget of 65 million EUR. Slovenian companies, research institutes and uni-versities are working on projects in a variety of areas from medicine, biotechnol-ogy and the environment to information technology and transport. During 2009, 32 new EUREKA projects were running with Slovenian participation and in 2010 already 38 new projects have been approved.47 For 2010, 1 million EUR public funds are planned for Slovenian participation in the programme, a significant de-crease from 3.5 million in 2009 (MHEST 2010 internal data). Slovenia has chaired EUREKA for the period 2007–2008, and successfully participated in the launch of the new EUROSTARS programme, the first one to be jointly financed and im-plemented by EUREKA and the European Commission. By mid-2010, Slovenia cooperates in 7 EUROSTAR projects.
Slovenia’s economy has not been among important recipients of FDI and R&D sector even less so. According to the Bank of Slovenia data on FDI, the stock of FDI in R&D sector was only 1 million EUR at the end of 2006.
At the same time, several of the existing programmes have in principle been opened to the EU participants: for example Young Researchers Programme.48 Still,
46 See also 8.3.47 This usually covers up to 25 % of total project costs of Slovenian participation.48 See more at: http://cordis.europa.eu/erawatch/index.cfm?fuseaction=prog.
document&UUID=60F03F40-9287-2F04-D84A300B8F3D44A5&hwd=.
NatioNal system of iNNovatioN iN sloveNia68
the practicalities, such as low awareness of this possibility, payment scheme, lan-guage barrier, often limit the extent to which foreign (EU) researchers apply.
Slovenia is actively involved in different ERA-NETs, JTIs as well as several EU level technology platforms (TPs).49 MHEST had a special measure through which it supports the creation of Slovenian TPs50 as a platform for further cooperation at the EU level i.e. in the European Technology Platforms (ETPs). Part of the fi-nancial support to Slovenian TPs was directed specifically for their active par-ticipation in the respective ETPs. Also, Slovenia is a member of several EU and intergovernmental research institutions.
The MHEST in fact assessed that the interest of individual researchers for the participation in international cooperation exceeds the resources available; hence a more thorough long term strategy considering the areas, modalities and criteria for participation of Slovenia in these initiatives will be needed. This relates as well to joint programming. While Slovenia in principle highly supports the idea and sees it as an opportunity for a small country to engage in highly expensive and complex research in some areas, one of the identified obstacles may be the re-source limitation. This requires a need to restructure existing allocation of public R&D funding and preparation of comprehensive criteria for selection of priorities at international and national level (Erawatch Country Policy Mix Report 2009).
The NRDP51 based the priorities in close alliance with the priorities of the FP6, but at the very broad level. With growing interest and involvement of research organisations in EU financed research, next NRDP needs to take a step further in aligning research priorities at the national level with those at the international and integrate ERA concept and policies more closely in the national R&D policy. This would help to avoid current situation where there was little if any subsidi-arity achieved through national and FP projects, rather it was found that the two are seen also in the research community as two separate tracks of raising finance (Sorčan et al. 2008).
49 See more at: http://www.sycp.si/sycp/Technology_Platforms_RTD.wlgt.50 See more at: http://cordis.europa.eu/erawatch/index.cfm?fuseaction=prog.
document&UUID=FDC89821-F688-43EF-79AF72D50A885CB3&hwd=. 51 See more at: http://cordis.europa.eu/erawatch/index.cfm?fuseaction=policy.
document&UUID=7D87A9BB-B3F1-0959-F567E3A894EDC30B&hwd=.
69
6. goveRNaNCe – tHe Role of PubliC PoliCy
6.1 THE STRUCTURE OF STI POLICY GOVERNANCE
6.1.1 National governance
The institutional framework of innovation policy has gone through several changes since Slovenia’s independence, reflecting in part the search for the most efficient division of tasks between different ministries and in part the influ-ence of the science lobby and, to a lesser extent, business communities. Each of the past elections had brought forward new ideas on how to best organise the government to be more supportive to science, technology and innovation (for details, see Trend Chart Report: Slovenia, September 2003–October 2004; 2004–2005 and earlier).
Initially, Slovenia had a Ministry of Science and Technology (MST), which was in charge of research and innovation policies. Several analysis, both national and international, called for strengthening of the technology and innovation dimension of the Ministry’s focus and eventually two separate departments were formed, both at the level of State Secretaries: one for science and the other for technology. The co-financing of industrial R&D projects, technology parks and technology centers, as well as the mobility scheme (co-financing the employment of research personnel in industry) were run via Office for Innovation and Office for Technology. Yet the department for technology at the MST was both, understaffed and underfinanced, especially in relation to its counterpart, the department for research.
Following the elections in October 2000, the new government initiated a re-organization of the ministries. The MST was split into two segments, with the science segment going to the Ministry of Education, and the technology one to the Ministry of the Economy (ME). All of the staff and activities of the Office for Innovation and those for technology were moved to the Ministry of the Economy. This Ministry was to be the key carrier of technology development and innovation policy and support mechanisms.
The science policy fell within the purview of a Special Office in the Ministry of Education, Science and Sport (MESS). The programmes remained the same as un-der the previous Ministry of Science and Technology: funding of the public research via research group scheme, project funding for basic and applied research, the young researchers programme and other infrastructure funding (scientific meetings, pub-lications, equipment) as well as support for the international co-operation.
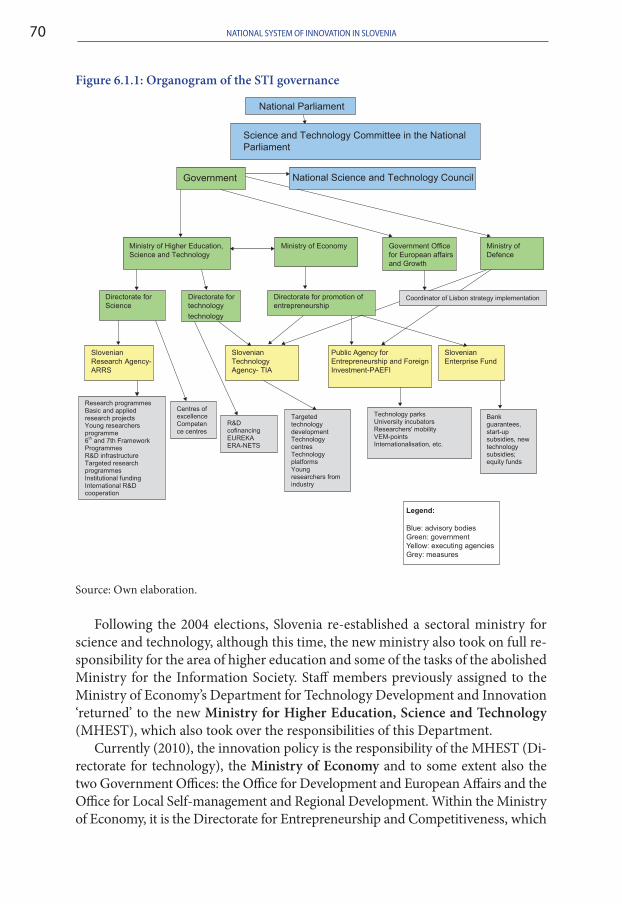
NatioNal system of iNNovatioN iN sloveNia70
Figure 6.1.1: Organogram of the STI governance
Source: Own elaboration.
Following the 2004 elections, Slovenia re-established a sectoral ministry for science and technology, although this time, the new ministry also took on full re-sponsibility for the area of higher education and some of the tasks of the abolished Ministry for the Information Society. Staff members previously assigned to the Ministry of Economy’s Department for Technology Development and Innovation ‘returned’ to the new Ministry for Higher Education, Science and Technology (MHEST), which also took over the responsibilities of this Department.
Currently (2010), the innovation policy is the responsibility of the MHEST (Di-rectorate for technology), the Ministry of Economy and to some extent also the two Government Offices: the Office for Development and European Affairs and the Office for Local Self-management and Regional Development. Within the Ministry of Economy, it is the Directorate for Entrepreneurship and Competitiveness, which
Science and Technology Committee in the National
Parliament
Government
Ministry of Higher Education,
Science and Technology
Ministry of Economy
Directorate for promotion of
entrepreneurship
Directorate for
technology
technology
Slovenian
Technology
Agency- TIA
Slovenian
Research Agency-
ARRS
Technology parks University incubators Researchers' mobility VEM-points Internationalisation, etc.
R&D cofinancing EUREKA ERA-NETS
Research programmes Basic and applied research projects Young researchers programme 6
th and 7th Framework
Programmes R&D infrastructure Targeted research programmes Institutional funding International R&D cooperation
Government Office
for European affairs
and Growth
Ministry of
Defence
Targeted technology development Technology centres Technology platforms Young researchers from industry
Coordinator of Lisbon strategy implementation Directorate for
Science
Public Agency for
Entrepreneurship and Foreign
Investment-PAEFI
Slovenian
Enterprise Fund
Centres of excellence Competence centres
Bank guarantees, start-up subsidies, new technology subsidies; equity funds
National Parliament
National Science and Technology Council
Legend:
Blue: advisory bodies
Green: government
Yellow: executing agencies
Grey: measures
71Governance – the role of public policy
among others looks after the promotion of entrepreneurship and innovation ac-tivity of businesses with special focus on SMEs. Within the Ministry of Higher Education, Science and Technology, the Directorate of Technology is in charge of promoting R&D and technology development activity of business units, especially SMEs. The Directorate for Science is responsible for overall policy and funding of R&D. Each of the Ministries has its executive agencies through which most of the policy measures are executed. Ministry of Economy directs the implementation of its programme through the Public Agency for Entrepreneurship and Foreign Investment (PAEFI), through Technology Agency (TIA) and Slovene Enterprise Fund (SEF). MHEST has transferred the implementation of most of its measures to Technology Agency (TIA) and Slovene Research Agency (SRA).
The coordination of R&D and innovation policies as well as other policies af-fecting economic development, especially the implementation of the Lisbon strat-egy was to be the task of Government Office for Growth, established in 2006. Due to various problems (limited budget allocation, change of minister only 6 months into its existence, etc.) the Office had not played its coordinating role well. It had hosted the Competitiveness Council, established by the government in the begin-ning of 2008, to help identify the priorities for Slovenian science and technology development by bringing together the actors in public research organisations and the business community. The Competitiveness Council’s contribution to innova-tion system as well as its role in current organisational framework of the Office remains vague. Partly this can be explained by many other more pressing issues on the government’s agenda due to the financial/economic crisis. With the new gov-ernment which took office in November 2008, the Office has been reorganised to cover also the European affairs. The main preoccupation of the Office has been the preparation of various measures in response to the financial and economic crisis, focusing thus only very modestly on the coordination of R&D and innovation.
Especially in the implementation process of the innovation policy, the role of Gov. Office of Local Self-governance and Regional Development needs to be stressed. This Office coordinates the Operational Programmes and as such monitors all the public calls issues either by the Ministries or the Agencies, where co-financing by European Regional Development Fund (ERDF) or European Social Fund (ESF) is envisaged. In practice it means that no public call can be issued until it is cleared with this Office, which makes sure that the requirements set forth in the call are in compliance with the regulations set up by Slovenian government and approved by the European Commission for the withdrawal of EU Structural Funds.
The National Science and Technology Council52 is the premier policy body for science and technology policy, although its composition has changed after the entry into force of the Law on R&D (2002), which increased the representation
52 See more at: http://cordis.europa.eu/erawatch/index.cfm?fuseaction=org.document&UUID=1686F32D-0661-2236-95DF8D150AB32B38&hwd=.
NatioNal system of iNNovatioN iN sloveNia72
of the business community. It was believed that this shift would make it easier to bring science policy closer to economic needs. The current composition of the Council according to the law foresees six members to come from research sector, six from business sector, one representative of the public and one representative of the union representing the researchers. As a general rule, the Minister of Finance and the Minister of Higher Education, Science and Technology are automati-cally members of the Council, as are the president of the Chamber of Commerce and Industry, all four rectors of the universities and the President of the National Academy of Science and Arts. The current NRDP (2006–2010) gives specific re-sponsibilities to the council in terms of final approval of evaluation criteria and several other policies in the R&D field. In spite of the high level membership, the visibility or the impact of the Council is limited, both in the science and in the business community.
During the preparation of the Law on Research and Development (2002) ex-tensive policy learning took place and models of other, especially Nordic coun-tries were examined. As a result, two agencies were established: the Agency for Science and the Agency for Technology (Trend Chart Report: Slovenia, Septem-ber 2003–October 2004). They were presented in greater detail in chapter 4.
6.1.2 Regional governance of innovation
Due to the size of its population (2 million), Slovenia is considered a single region at the NUTS 2 level. Still, for the purposes of the EU cohesion policy, it was agreed that two cohesion regions were formed. The two cohesion regions, Eastern Slov-enia and Western Slovenia, were introduced based on the Promotion of Balanced Regional Development Act and determined with the resolution of the Govern-ment of RS (83rd regular session of the Government of RS, 54910-3/2005/12, 7 November 2005). The Government filed a motion to the Commission on their notification as statistical territorial units NUTS-2. Eastern Slovenia includes de-velopment regions (NUTS-3 territorial units): Pomurska, Podravska, Koroška, Savinjska, Spodnjeposavska, Zasavska, Southeastern Slovenia and Notranjsko-kraška. Western Slovenia includes development regions: Central Slovenia, Goren-jska, Goriška and Costal-Karst (National Strategic Reference Framework – NSRF 2007: 15).
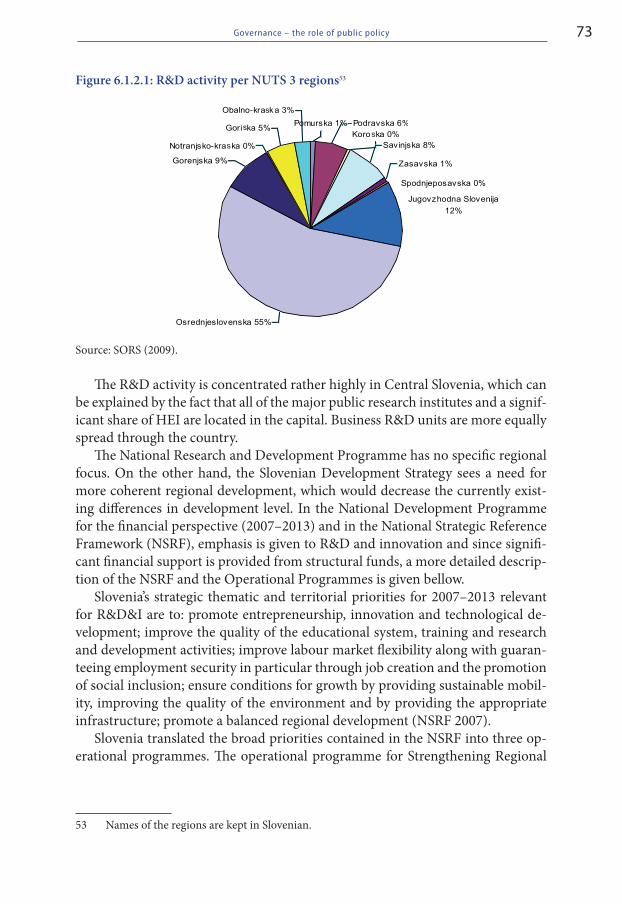
73Governance – the role of public policy
Figure 6.1.2.1: R&D activity per NUTS 3 regions53
Source: SORS (2009).
The R&D activity is concentrated rather highly in Central Slovenia, which can be explained by the fact that all of the major public research institutes and a signif-icant share of HEI are located in the capital. Business R&D units are more equally spread through the country.
The National Research and Development Programme has no specific regional focus. On the other hand, the Slovenian Development Strategy sees a need for more coherent regional development, which would decrease the currently exist-ing differences in development level. In the National Development Programme for the financial perspective (2007–2013) and in the National Strategic Reference Framework (NSRF), emphasis is given to R&D and innovation and since signifi-cant financial support is provided from structural funds, a more detailed descrip-tion of the NSRF and the Operational Programmes is given bellow.
Slovenia’s strategic thematic and territorial priorities for 2007–2013 relevant for R&D&I are to: promote entrepreneurship, innovation and technological de-velopment; improve the quality of the educational system, training and research and development activities; improve labour market flexibility along with guaran-teeing employment security in particular through job creation and the promotion of social inclusion; ensure conditions for growth by providing sustainable mobil-ity, improving the quality of the environment and by providing the appropriate infrastructure; promote a balanced regional development (NSRF 2007).
Slovenia translated the broad priorities contained in the NSRF into three op-erational programmes. The operational programme for Strengthening Regional
53 Names of the regions are kept in Slovenian.
Notranjsko-kra ka 0%
Gori ka 5%
Obalno-kraska 3%
Podravska 6%
Spodnjeposavska 0%
Zasavska 1%
Savinjska 8%Koro ka 0%
Pomurska 1%
Gorenjska 9%
Jugovzhodna Slovenija
12%
Osrednjeslovenska 55%
s
ss
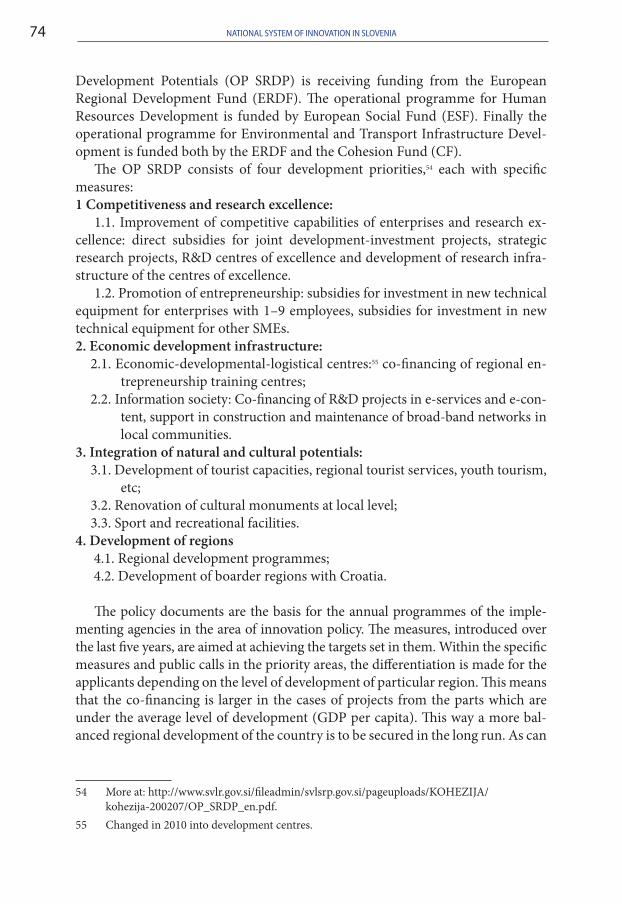
NatioNal system of iNNovatioN iN sloveNia74
Development Potentials (OP SRDP) is receiving funding from the European Regional Development Fund (ERDF). The operational programme for Human Resources Development is funded by European Social Fund (ESF). Finally the operational programme for Environmental and Transport Infrastructure Devel-opment is funded both by the ERDF and the Cohesion Fund (CF).
The OP SRDP consists of four development priorities,54 each with specific measures:1 Competitiveness and research excellence:
1.1. Improvement of competitive capabilities of enterprises and research ex-cellence: direct subsidies for joint development-investment projects, strategic research projects, R&D centres of excellence and development of research infra-structure of the centres of excellence.
1.2. Promotion of entrepreneurship: subsidies for investment in new technical equipment for enterprises with 1–9 employees, subsidies for investment in new technical equipment for other SMEs.2. Economic development infrastructure:
2.1. Economic-developmental-logistical centres:55 co-financing of regional en-trepreneurship training centres;
2.2. Information society: Co-financing of R&D projects in e-services and e-con-tent, support in construction and maintenance of broad-band networks in local communities.
3. Integration of natural and cultural potentials:3.1. Development of tourist capacities, regional tourist services, youth tourism,
etc;3.2. Renovation of cultural monuments at local level;3.3. Sport and recreational facilities.
4. Development of regions 4.1. Regional development programmes; 4.2. Development of boarder regions with Croatia.
The policy documents are the basis for the annual programmes of the imple-menting agencies in the area of innovation policy. The measures, introduced over the last five years, are aimed at achieving the targets set in them. Within the specific measures and public calls in the priority areas, the differentiation is made for the applicants depending on the level of development of particular region. This means that the co-financing is larger in the cases of projects from the parts which are under the average level of development (GDP per capita). This way a more bal-anced regional development of the country is to be secured in the long run. As can
54 More at: http://www.svlr.gov.si/fileadmin/svlsrp.gov.si/pageuploads/KOHEZIJA/kohezija-200207/OP_SRDP_en.pdf.
55 Changed in 2010 into development centres.
75Governance – the role of public policy
be observed in the figure bellow, the higher co-financing of less developed East Slovenia is already reflected in the rate of increase of GERD.
Figure 6.1.2.2: Rate of increase of GERD according to the cohesion regions (2005=100)
Source: SORS (2009).
6.2 REGULATORY FRAMEWORK AND STI POLICY
The most important legal and policy documents which form the R&D and inno-vation policy are:
Law on Research and Development• (2002); (http://zakonodaja.gov.si/rpsi/r07/predpis_ZAKO3387.html);Slovenian Development Strategy• 2006–2013 (SDS); (http://www.gov.si/umar/aprojekt/asrs/ssd.php);Resolution on the National Research and Development Pro-•gramme 2006–2010 (NRDP); (http://www.uradni-list.si/1/ulonline.jsp?urlid=20063&dhid=80293);National Reform Programme for Achieving the Lisbon Strategy Goals• 2005–2010 with 2008 revision (NRP); (http://www.svr.gov.si/fileadmin/srs.gov.si/pageuploads/Dokumenti/SI-NRP2008-en.pdf);Programme of Measures for Entrepreneurship and Competitiveness• 2007–2013 (http://www.mg.gov.si/fileadmin/mg.gov.si/pageuploads/DPK/Program_ukrepov_angl_071009.pdf );
1 1 4
1 2 8
1 4 1
1 1 5
0 20 40 60 80 100 120 140 160
East Slovenia
West Slovenia
2007
2006
2005
NatioNal system of iNNovatioN iN sloveNia76
National Development Programme (NDP, 2007–2013)• and National Strategic Reference Framework (NSRF) with the three Operational Programmes;56 (http://www.svlr.gov.si/fileadmin/svlsrp.gov.si/pageuploads/KOHEZIJA/Programski_dokumenti/NSRO_Slovenija_POTRJENO.pdf ).
Law on Research and Development (Law on R&D, 2002) was passed in No-vember 2002, providing the basis for a fully-fledged restructuring of the R&D organisational set-up, the conditions for participating in R&D, setting the ground for transition to knowledge based society, where R&D is seen as an important development priority. The law envisaged the formation of two separate agencies; one to deal with research and the other to focus on technology and innovation development. In addition, the re-organisation of the National Council on Science and Technology was introduced, where more nominations were to come from the business sector. This was meant to ensure a more equitable approach in setting the priorities, with science lobby having a valid counterpart in representatives coming from the business sector. Some of the solutions in the Law on R&D remain the same as under the previous one, like the importance of NRDP as the key policy document in R&D and innovation area.
With the more recent documents, one can observe significant level of coher-ence, in part because the SDS and NRDP were prepared simultaneously and with reference to one another. The NRP and Framework built on the objectives and pri-orities of SDS and NRDP and expanded into the level of specific measures. These documents are novel in a sense that the R&D and increased innovation efforts by the business sector are seen as the key inputs into increased competitiveness and therefore more dynamic economic growth. This clear linkage of R&D and economic policy has not been so explicitly pronounced in the past. Also important is the stress on socio-economic relevance of research and expectations that the increased public investment is to be aimed at the innovation activity of the business sector.
Slovenian Development Strategy (IMAD 2005) defines five development priorities:
A competitive economy and faster economic growth;•Effective generation, two-way flow and application of the knowledge needed •for economic development and quality jobs;An efficient and less costly state;•A modern social state and higher employment;•Integration of measures to achieve sustainable development.•
For each development priority, measures to achieve the set objectives are spec-ified. In relation to R&D policy, the SDS stresses the need for research to be more
56 The two documents are the basis for the allocation of structural funds and several measures focusing on R&D and innovation have been financed through ERDF and ESS.
77Governance – the role of public policy
integrated with the needs and capabilities of the business sector. The Strategy calls for increase of R&D expenditures to 3 % of GDP following the Lisbon target and to achieve this, special measures to promote business R&D investment should be designed. Attention should be paid to raising the absorption capacity for R&D results in the business sector, particularly of SMEs. Organisational structure of public R&D system should be restructured as well and more effective placement of public R&D resources assured. The mobility of researchers from public to pri-vate sector should be stimulated. With all the planned measures, the SDS aimed at making R&D and innovation one of the key drivers of growth.
Key objectives of the National Research and Development Programme 2006–2010 included:
Increasing of public R&D investment to 1 % of GDP by 2010;•Shifting balance of public research funds from basic non-targeted research in •favour of targeted (and applied) research;Introduction of support measures to stimulate growth of investment of busi-•ness sector in R&D to help achieve a 2 % of GDP target;Growth of number of researchers with PhDs in the business sector;•Higher rate of establishment of new high-tech firms, including promotion of •spin-offs from universities;Continuous participation in the international research, especially in ERA;•Support to the growth of patents, as an indicator of business relevance of •research;Growth of high-tech exports and growth of value-added in Slovenian economy.•
The National Reform Programme for Achieving the Lisbon Strategy Goals 2005–2010 (Republic of Slovenia 2005) follows closely the structure of the SDS and elaborates further on the priorities. The sections of NRP, relevant for the in-novation policy, are in the First development priority:
III.A.3.2. Promoting entrepreneurial development and innovation;•III.A.3.3. Education for entrepreneurship;•III.A.3.4. Small and medium- sized enterprises’ access to financial resources.•
Entire Second Development Priority: Effective generation, two-way flow and application of the knowledge needed for economic development and quality jobs, is in fact devoted to R&D and innovation issues, since it includes the priority themes such as promoting R&D activities and innovation and promotion of the develop-ment of human resources and lifelong learning.
The Programme of Measures to Stimulate Entrepreneurship and Competitive-ness 2007–2013 (ME 2007), which was approved by the Slovenian Government in July 2006, serves to Ministry of Economy as a guideline for a comprehensive and transparent design and implementation of measures to improve entrepreneurship and competitiveness and for a targeted use of budgetary and structural funds. In 2007, the document was supplemented in order to allow a more transparent and
NatioNal system of iNNovatioN iN sloveNia78
simple implementation of the measures by taking into account all regulations on state aid for the allocation of finance.
The National Development Programme 2007–201357 was prepared in 2006. The topic of science- industry cooperation is included in the second develop-ment- investment priority “Effective creation, two-way flow and use of knowledge for economic development and quality employment.”
As already mentioned, these activities are to be funded through the projects within first priority of the Operational programme of European Regional Devel-opment Fund “Competitiveness of enterprises and research excellence.” The sup-port goes to joint research and development projects as well as to the investment in modernisation, construction and equipment of intermediary organisations and other institutions in R&D and business support environment as well in business enterprises.
As observed in the beginning, the existing policy documents, relevant for the innovation policy, have a significant level of coherence due either to their simulta-neous preparation (NRDP, SDS) or hierarchical structure (NSRF and OPs). They address the challenges of Slovenian R&D and innovation system well and set forth clear objectives. From the bird’s eye perspective R&D and innovation policy looks well formulated even if maybe a bit too optimistic in setting the goals. But policy documents are only the broad framework; it is the implementation which reflects the efficacy of innovation policy. Here Slovenia has experienced several problems: from insufficient coordination of the measures to slow and complex administra-tive system in delivery of support to business R&D and innovation.
6.3 STI POLICY FORMULATION AND PRIORITY SETTING PROCESSES
The best way to present policy formulation and priority setting in R&D and in-novation is to describe the process of the preparation of the five-year National Research and Development Programme. This is the most elaborate scheme for identification of knowledge demand and decisions on future orientation of Slov-enian R&D and innovation policy. The Programme is important both for pub-lic R&D and business sector, since it includes key policy focus in the five year period, including the sector priorities, mechanisms (programme vs. project fi-nancing, co-financing), ratios between different scientific fields as well as between different types of research (basic, applied, development) and the organisational framework.
57 See more at: http://www.svlr.gov.si/si/delovna_podrocja/drzavni_razvojni_program/.
79Governance – the role of public policy
According to the Law on Research and Development (200258) the ministry re-sponsible for science needs to prepare the draft text of this basic policy document in the area of R&D on the basis of the guidelines prepared by the National Council for Science and Technology. Various stakeholders may be involved in the prepara-tion of the text and the Ministry can commission different expertise.59 Once the draft of the National Research and Development Programme is prepared, the law requests the draft be open for public discussion among different stakeholders. The Slovenian Chamber of Commerce and Industry is usually asked to organise the debate on behalf of the business sector, being the forum for business to express its opinions on various government policies. This is the opportunity for business sector to specify its expectations from R&D policy as well as assess if the priorities proposed are in accordance with their knowledge demand.
The coordination of directors of research institutes (KORIS) has to present its comments and proposes changes and amendments to various policy documents. The Rectors’ Conference acts on behalf of universities. All of these bodies have a consultative function, but no formal powers in the process of accepting the policy documents.
During the discussion at the government level, all ministries are invited to comment, especially the Ministry of Finance and Ministry of Economy. The Min-istry of Finance needs to check the resources available and the dynamics of R&D financing. The Ministry of Economy must check the compatibility of R&D policy with the innovation policy and the policy to support entrepreneurship.
The process ends with the approval of the NRDP by the Parliament. All other documents, like annual programmes of the MHEST, of the Agencies and interme-diary institutions need to follow the stipulations of the NRDP. The implementa-tion of the NRDP is regularly evaluated.
6.4 THE ROLE OF POLICY TOOLS IN STI POLICY FORMULATION
STI policy formulation has been based on inputs from international sources (transnational learning) as well as on different national analysis and policy de-bates. Slovenian policy makers have studied the R&D and innovation policies of several European countries in search of the policy concept that best responds to Slovenian needs. Several senior Slovenian policy makers are involved in various bodies at the EU level, dealing with benchmarking R&D and innovation policies. The results of Trend Chart and the EIS are assessed annually and have so far had an impact on innovation policy in the course of time.
58 See more at: http://zakonodaja.gov.si/rpsi/r07/predpis_ZAKO3387.html.59 The 2005–2010 NRDP was prepared with the assistance of a group of national experts, the
new one under the preparation will be relying also on international input.
NatioNal system of iNNovatioN iN sloveNia80
During the accession period under the PHARE programme, projects were car-ried out with experts from Germany, Ireland, the Netherlands, Denmark, Sweden (TWINNING) and Finland (see details in Trend Chart Report Slovenia 2004–2005). More recently, especially Scandinavian innovation policy was studied ex-tensively and several exchanges at different levels took place with Finland, Sweden and Denmark.
Foreign advice was followed most consistently in the case of clusters,60 univer-sity incubators (PHARE project, 2002) and the reorganisation of the R&D and innovation system with the establishment of the two agencies mentioned above. The concept underlying the Technology Agency is based on the Swedish example. Close contacts with the Swedish agency VINNOVA and TEKES from Finland continue with regular exchange of visits.
The key deficiency of policy benchmarking and trans-national learning so far has been in the implementation of the recommendations obtained from in-ternational learning experiences. Some of the measures were incorporated in the Slovenian innovation policy without securing sufficient and sustainable resources (technology parks, for example), some were agreed upon, but never implemented (like Slovenian Innovation agency, proposed in 1999 by a PHARE study and accepted by the government at the time as a valuable advice, but never implemented).
European innovation policy, the EU Action plan and various monitoring and benchmarking exercises had a positive impact on innovation policy in Slovenia – not only because of an abundant information inflow, but also because the level of awareness of innovation policy increased substantially in government circles. The Lisbon and Barcelona strategies had similar effect, initiating a more lively debate on innovation and R&D policy which is not restricted to a narrow circle of those directly involved in R&D, but reached a broader audience.
In fact, the current National Research and Development Programme follows rather closely the priorities set in the EU 6th Framework Programme (concerning information and communication technologies, advanced (new) synthetic metal and non-metal materials and nanotechnologies, complex systems and innova-tive technologies, technologies for sustainable development and health and life-sciences) and adds to the list of priorities research of specific importance for the Slovenian culture and history.
The basis for the selection of these priorities was a pilot project on technology foresight exercises. These priorities were to be used as a guide where the public resources for R&D should be channelled. Due to their very broad level, the second more detailed technology foresight project was carried out with results submit-ted to the government in the spring 2008. The methodology was partly based on Delphi, but due to the low available resources, the consultations were limited to
60 Trend Chart Report: Slovenia, September 2002–October 2003.
81Governance – the role of public policy
the smaller number of experts. Still, the working groups organised according to thematic areas provided a good forum for discussion among the business rep-resentatives and the research sphere as to what the long-term potential of each actor is. The results of the second foresight exercise were not publicly debated or integrated in any of the strategic documents so far.
Another possible tool for knowledge demand identification is the use of the technology platforms, which have been supported by the MHEST and initially also by the Chamber of Commerce and Industry. One of the ambitions of the technology platforms is to provide a forum where both the public R&D institu-tions and especially firms using/developing particular technology can meet and exchange knowledge and ideas on how to develop further in the future. What the technology platforms’ system still lacks is a clear mechanism of transmitting identified knowledge demand to R&D policy-makers and also to knowledge suppliers: in other words, they still don’t have systematic influence on shaping of funding priorities in Slovenia. We do however find reference to the work of technology platforms in some of the measures, introduced by the MHEST.
An attempt to identify knowledge demand (and set R&D priorities) was the establishment of development groups within the Competitiveness Coun-cil by the Government’s Office for Growth in spring 2008. The Council had 10 so called development groups, each with 16 members, representatives of the re-search – higher education and business sector. Seven groups followed the sec-tors (life and health, ICT, materials and nanotechnologies, environment and construction, energy and renewable energy sources, communications, transport and vehicles, process technologies), while three were meant to be horizontal (creative industries, business-finance and public research and higher education governance). The groups provided in the fall of 2008 inputs in terms of prior-ity research areas/themes both for basic and applied research, identified busi-ness interest and research capabilities and tried to assess absorption capacity of Slovenian business in a particular field. What failed was a systematic uptake of the identified priorities into the funding programmes for public R&D as well as in the business R&D support measures or at least an open discussion of the proposed priorities.
The pressing issue in the STI policy formulation is the integration of existing structures in the process of research priority identification. Each of the ‘tools’ so far provided some input, but no mechanism exists which would put all these different initiatives, foresights, policy debates together and provide for non-biased assessment and proposal for priorities in R&D and innovation policy. This partly explains why priority setting has remained a very sensitive issue in Slovenian R&D and innovation system and if /when agreed, the priorities have usually remained at a very broad level. MHEST has used some of the results of different priority seeking exercises as a base for the call for the competence centres in summer 2010.
NatioNal system of iNNovatioN iN sloveNia82
6.5 CHARACTERISATION OF THE OVERALL POLICY MIX
The policy framework and targets for R&D area are provided with the NRDP61 as well as in NRP. On the basis of these, each of the responsible ministries/agen-cies designs its own instruments/measures towards the implementation. While officially there exist a coordination body at the government level, in practice each Ministry has a significant level of independence in policy design and implementa-tion. This sometimes results in conflicting measures or duplication of measures, instead of coherent policy mix. The gap is particularly vivid between the financial support mechanisms for public R&D, designed and administered by SRA and the support measures for business R&D, executed via TIA or directly by the MHEST, as well as among the support measures introduced by MHEST and those by ME (and administered through PAEFI). This lack of coordination and rather non-transparent support schemes resulted in less effective system criticised in particu-larly by business community.
With the application of Structural funds to most of the measures, the finan-cial resources available during the financial perspective 2007–2013 have become significantly greater than in the past. This raised the issue of efficiency and effec-tiveness of the resources and investment in R&D. This in turn raised the problem of absorption capacity at the business sector level and the need to address this through special support measures in the area of awareness-raising and capacity- building, beyond those currently existing (mobility schemes, joint interdiscipli-nary teams, etc.). The absorption or governance capacity is a problem also within government and para-government agencies, since with increased funds, new measures and complex monitoring system, required by the demanding regulation of Structural funds, need more dynamic and well-trained public officials.
There is a wide range of different support measures available at different insti-tutions: TIA, PAEFI, SEF as well as in some cases directly at the Ministries. The policy mix does cover most of the identified challenges: from the promotion of R&D activity in the business sector to increased cooperation between the public R&D institutions and business to support for human resources (mobility/training) and financial support to start-ups. A wide range of options open to SMEs suggests a need for joint effort of the supporting institutions to make their programmes as visible as possible. In this regard the initiative of the three main institutions to or-ganise so call Entrepreneurial days62 was welcomed by enterprises, since they were able to see what is being offered to them through various channels.
61 See more at: http://cordis.europa.eu/erawatch/index.cfm?fuseaction=policy.document&UUID=7D87A9BB-B3F1-0959-F567E3A894EDC30B&hwd=.
62 A one-day presentation of the programmes and expected calls was organised by all three main agencies in Ljubljana, Maribor and Nova Gorica for the representatives from business in 2008 and 2009.
83Governance – the role of public policy
Still, a more stable policy mix with clear positioning of the main executing agencies SRA, TIA, PAEFI and SEF (and newly announced role of SID) would contribute not only to more efficient NIS at the overall level, but also towards bet-ter specialisation of other intermediary institutions. Should there be a continua-tion of support policies in specific areas, the intermediary institutions can develop towards better division of labour63 and increase their competencies. The support measures to technology parks and business/university incubators, technology cen-tres and platforms, VEM focal points, etc. should pay special attention to this issue and already at the design stage see that the duplication or overlaps are avoided.
Two policy areas seem however to be missing from the current policy mix. Neither Ministry (MHEST or ME) continued the support to the organisational changes or the modernisation of management techniques. This means that there is at the moment no promotion of this type of ‘soft’ innovation. The Programme on promotion of entrepreneurship (ME 2007) only very briefly talks about the introduction of models of business excellence and promises measures in this area. While during the survey on policies for innovation in services (Stare and Bucar 2007), several government officials have mentioned that they are planning to intro-duce specific measures addressing the innovation in service sector, so far no direct instrument has been designed. What should be noticed however is that the dic-tions of all public calls now regularly quote “…for new product/service/process...” and try not to discriminate against innovation in services.
6.6 INSTRUMENTS
Slovenia has several measures to support R&D and innovation. Detailed informa-tion on the existing measures is provided in the EU’s Trendchart/ERAWATCH database, which provides access and full coverage of all the member states in-novation policy measures.64 The number of measures in a particular priority area does not necessarily reflect their importance, it is the budget allocation where the strength of the measure is reflected. There is no doubt that in the innovation system so far, the support to R&D, especially public R&D, has been seen as most important, with gradual development of other measures. With the additional re-sources coming from the Cohesion funds, the business related R&D measures have gained in their importance.
63 Due to relatively unstable policy environment and chronic insufficient level of resources, these institutions adjusted their programmes in accordance with what they could get financial assistance for, instead of looking for a narrower specialisation in the particular support area.
64 See: http://proinno.intrasoft.be/index.cfm?fuseaction=wiw.measures&page=list&CO=19. Due to the discontinuation of the Trendchart project in 2010, the updates for the measures are not available.
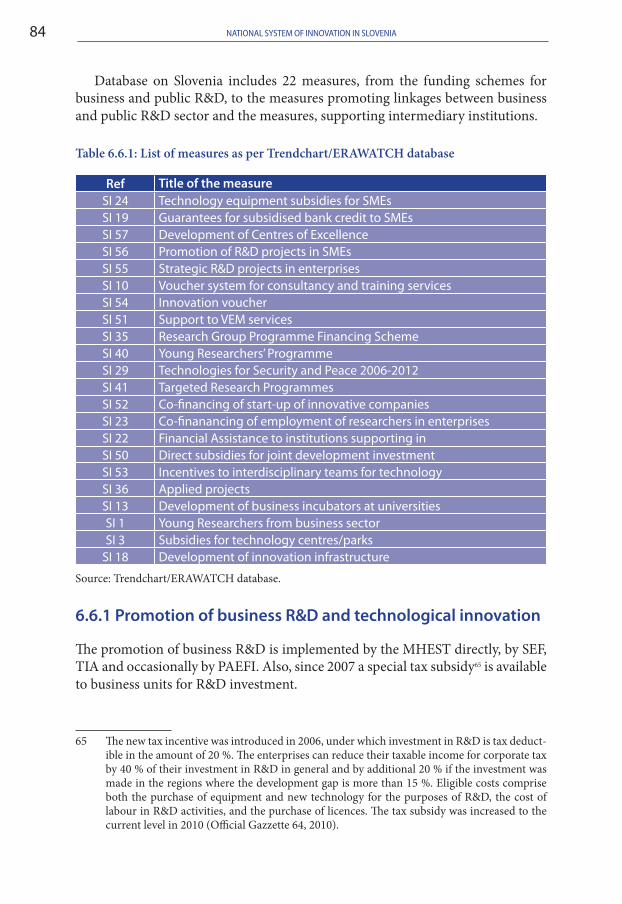
NatioNal system of iNNovatioN iN sloveNia84
Database on Slovenia includes 22 measures, from the funding schemes for business and public R&D, to the measures promoting linkages between business and public R&D sector and the measures, supporting intermediary institutions.
Table 6.6.1: List of measures as per Trendchart/ERAWATCH database
Ref title of the measureSI 24 Technology equipment subsidies for SMEsSI 19 Guarantees for subsidised bank credit to SMEsSI 57 Development of Centres of ExcellenceSI 56 Promotion of R&D projects in SMEsSI 55 Strategic R&D projects in enterprisesSI 10 Voucher system for consultancy and training servicesSI 54 Innovation voucherSI 51 Support to VEM servicesSI 35 Research Group Programme Financing SchemeSI 40 Young Researchers’ ProgrammeSI 29 Technologies for Security and Peace 2006-2012SI 41 Targeted Research ProgrammesSI 52 Co-financing of start-up of innovative companiesSI 23 Co-finanancing of employment of researchers in enterprisesSI 22 Financial Assistance to institutions supporting inSI 50 Direct subsidies for joint development investmentSI 53 Incentives to interdisciplinary teams for technologySI 36 Applied projectsSI 13 Development of business incubators at universitiesSI 1 Young Researchers from business sectorSI 3 Subsidies for technology centres/parks
SI 18 Development of innovation infrastructure
Source: Trendchart/ERAWATCH database.
6.6.1 Promotion of business R&d and technological innovation
The promotion of business R&D is implemented by the MHEST directly, by SEF, TIA and occasionally by PAEFI. Also, since 2007 a special tax subsidy65 is available to business units for R&D investment.
65 The new tax incentive was introduced in 2006, under which investment in R&D is tax deduct-ible in the amount of 20 %. The enterprises can reduce their taxable income for corporate tax by 40 % of their investment in R&D in general and by additional 20 % if the investment was made in the regions where the development gap is more than 15 %. Eligible costs comprise both the purchase of equipment and new technology for the purposes of R&D, the cost of labour in R&D activities, and the purchase of licences. The tax subsidy was increased to the current level in 2010 (Official Gazzette 64, 2010).
85Governance – the role of public policy
Slovenian Enterprise Fund’s programme (http://www.podjetniskisklad.si)66 in-cludes among other measures also the following ones, focused more on technol-ogy and R&D projects:
D• irect investment grants of the Fund to start-up enterprises in technology parks and incubators (SI_52), the Fund offers grants for enterprise start-ups, where grants aim at encouraging establishment and launching of innovative and technology-oriented enterprises. The Fund’s grant can be acquired by en-terprises registered up to 18 months and located in technological parks and university incubators. The grant covers the reimbursement of eligible starting expenses.67
S• everal types of guarantees, including the guarantee for loans for technologi-cal projects (SI_19). Guarantees for technological projects are intended as col-lateral for bank loans taken by enterprises cooperating closely with knowl-edge-based institutions and transferring knowledge, new technologies and development processes into growing, market-oriented undertakings.68 Equity finance line for SMEs • is a new measure from 2010 on.69 Equity financ-ing instruments will be implemented through a public tender, inviting private venture capital companies, which comply with terms and criteria of the tender, under which such companies will acquire the stake of the Republic of Slovenia equalling up to 49 % of their total capital or a minimum of EUR 1 million, respectively. These selected venture capital companies will be able to invest the acquired funds, together with funds provided by private investors, as venture and mezzanine capital in promising, innovative and fast-growing SMEs. C• o-financing (subsidies) of new technical equipment in SMEs (SI_ 24) was a very popular measure, providing subsidies for purchase of new technical equipment for micro and small businesses, but has been discontinued.
Technology Agency’s programme differs somewhat every year, depending on which calls are implemented by various Ministries through TIA. In support of business R&D and innovation, the following measures are most important:
Direct subsidies for joint development-investment projects• (SI_50). Here the financing is available for projects, where the development of new product and/or service or development of significantly improved product and/or service with higher value added is planned. The result of the project must be an innovation for all cooperating enterprises which may, if in line with the
66 SEF had approved 779 different projects in total amount of 120.3 million EUR in 2009. 67 The 2010 call amounts to 4.1 million EUR. http://www.podjetniskisklad.si/files/razpisi%20
sklada,%206_7_2010.doc. 68 Amount available for 2010: 10 million EUR.69 More at: http://www.podjetniskisklad.si/index.php?option=com_content&view=article&id=
134&Itemid=106.
NatioNal system of iNNovatioN iN sloveNia86
business policy, be protected as intellectual property. Major share of the co-financing is provided by ERDF.Support to strategic R&D projects in business sector• (SI_55)The programme on co-financing strategic R&D projects in enterprises had been developed on the basis of the previous one in the same area,70 but focuses more precisely on the priorities identified by the Slovenian and EU technology platforms. The programme provides for co-financing of applied research and development projects to the pre-industrialised phase of the research. Its main objective is to provide support to strategically important research, relevant for Slovenian enterprises. Part of co-financing is provided by the European Re-gional Development Fund.Technologies for Security and Peace • (SI_29)The programme aims at development of R&D in the Slovenian defence indus-try sector and the promotion of R&D cooperation between public institutions and private business enterprises in the area of defence & security technologies. The goals are linked to the Slovenian membership in the EU and NATO and are focused on improvement of the Slovenian defence capabilities. Through annual call technology development projects in areas specified by the Ministry of Defence are financed.
For the Ministry of Economy, TIA is also coordinating the Slovenian participa-tion in the EU VALOR project. The project is trying to assist in commercialisation of the research results, be it at the research institutes or the R&D units of enter-prises. The assistance is to be provided by the development of common assess-ment methodology, which should have the potential to indicate the marketability of research results.
The new programme by MHEST was introduced and implemented in 2009, called SMER SI_55. The programme focuses on co-financing of R&D efforts of micro, small and medium enterprises. It was a part of stimulus package of the government to offset the effects of economic crisis on industrial sector R&D in-vestment. Its goal was to stimulate investment of SMEs in research & develop-ment of new technologies, products and processes with the aim to increase the technological level of products/processes. The programme was well received by the SMEs, but there is a serious concern that due to the public finance limitation it will not be continued.
PAEFI has been running a voucher system for consultancy and training serv-ices for SMEs for several years now. The measure was designed to overcome the reluctance on the side of small businesses to approach consultancy services due to high costs. The aim of the measure is to increase the demand for external expert help through assurance of qualitative and financial accessible consulting services
70 Support to business R&D projects, a measure run by MHEST.
87Governance – the role of public policy
for different target groups. Besides, the measure objectives are also to improve the operation of entrepreneurs and initiate self-employment. With subsidised costs of consultancy, a larger number of potential entrepreneurs decide to start business and establish an enterprise. It was believed that the provided consul-tancy could help new founded SMEs to survive initial critical years as well as timely reorganisation and modernisation of the older SMEs. PAEFI maintains a database of qualified consultants (both independent experts as well as consul-tancy firms). SME applies for a voucher at VEM entry point and if approved, the consultancy fee requested in co-financed in the amount of 1.500–4.000 EUR. PAEFI controls the provision of consultancy services in terms of quality and price range.
As an extension of the voucher scheme an innovation voucher measure was introduced in 2009. The objective of the programme is to provide co-financing for costs of the industrial research, where the aim is registration of a patent or other ways of protecting intellectual property rights. Especially the micro and small en-terprises have limited capacity for cooperation with public R&D institutions and for transferring of the technology/knowledge in the production process. This pro-gramme should assist them in this. In 2009, this was a pilot call with a very low budget of only 100.000 EUR, with the resources available to cover up to 60 % of the actual costs incurred by the applicant and limited to 900 to 4.200 EUR. But the good response led to enlargement of the funds available in 2010 to 800.000 EUR and a decision that the voucher system as such will be reformed in direction of more specified consultancy.
In addition, different regions and local communities are introducing their own entrepreneurship support measures, often co-financed indirectly through Struc-tural Funds. One of the popular measures is the establishment of a local business zone, where physical infrastructure is provided for new enterprises. Some of the larger communities also have different entrepreneurship support centres, which help the SMEs with information and often also with advice on different national/EU support schemes.
6.6.2 Promotion of human resource development in R&d and innovation
The area of human resources has attracted policy makers for years. One of the very first programmes in Slovenia, inherited from previous state, was the programme for young researchers, aimed at improving the age structure of the employees in the public R&D sector and guarantee sufficient inflow of new R&D personnel. The programme has been labelled as a good practice example in several studies of the Slovenian NIS. In recent years, several other measures have been introduced by the Slovenian Research Agency, TIA and PAEFI in the area of human resource generation and mobility.
NatioNal system of iNNovatioN iN sloveNia88
Young researchers programme The Young Researchers Programme71 is one of the most successful activities in the area of education and training for R&D and innovation. The Programme was al-ready set up in 1985 and has over the years worked successfully in bringing young people into research. The impact was so significant that it actually lowered the average age of researchers in the public research sector in Slovenia.
The programme finances young people, selected by higher education insti-tutions and public research institutes to be potential candidates for research-ers, during their M.A. or PhD studies. During their studies they have a mentor in this institution and take part in the research as junior assistants. The Minis-try, responsible for science (MHEST) pays for their salary, tuition fees as well as mentorship costs. Since the establishment of Slovenian Research Agency, the programme is coordinated and executed by the Agency. The Slovenian Research Agency provides financing for around 1200 young researchers every year, repre-senting around 850 to 900 FTEs (full-time equivalents for young researchers on full salary). Between 200 and 250 new young researchers complete the training programme every year, with the same number of new young researchers being included in the programme. Since 2009, the call for young researchers is opened to the candidates from EU countries as well, under the condition of meeting the prescribed criteria for a young researcher (http://www.arrs.gov.si/en/mr/akti/prav-MR-RO-januar08.asp).
The criticism that Young Researchers’ programme does not provide sufficient options for employment after the contracts are ended led to a small, but impor-tant addition to the contract. A new condition was added to Young Researchers’ contracts since 2006/2007, requesting that each of the participants in the pro-gramme takes a compulsory 20 hours course on Entrepreneurship and Innova-tion. This was introduced with the ambition to give the future researchers some of the very basics of entrepreneurship and thus stimulate in the long-run coopera-tion between R&D sector and business sector.
Young researchers from business sector The measure is based on the above Young Researchers measure, which was modi-fied in 2001 to provide a special window exclusively to junior researchers from business sector.72 The annual call for Young Researchers from business is imple-mented by the Technology Agency (TIA) and supplemented with the resources from ESF.
71 Detailed description available on: http://proinno.intrasoft.be/index.cfm?fuseaction=wiw.measures&page=detail&id=-420&CO=19.
72 More at: http://proinno.intrasoft.be/index.cfm?fuseaction=wiw.measures&page=detail&id=-1186&CO=19.
89Governance – the role of public policy
Young researchers participate in research work during their postgraduate studies on basic research or R&D applied research projects, related to the needs of their company. What is also specific in the case of young researchers from business sector is the fact that the candidates for PhD work with two mentors: one from the company and one from the HEI where the studies take place. This should assure the relevance of the research for the company and thus contribute to further employability of the young researcher. TIA covers the salary, social contributions, as well as material and non-material costs for research and doc-toral studies. The funds for the training of young researchers are allocated for a fixed-term, up to a maximum of four years and six months for a PhD pro-gramme (doctorate). In 2009, 166 firms applied for financing and as many as 140 new young researchers from business were approved for financing. The ex-pansion of the programme has been significant since the additional funds from ESF have been channelled towards this measure, in spite of cited administrative difficulties with the implementation.
The measure has so far received rather positive reviews (IER 2010), not only as a direct contribution of new highly skilled human resources to the business R&D, but also indirectly as a very good channel for developing the contacts be-tween the business R&D and the public sector R&D units (HEI primarily). Dur-ing their studies the young researchers get familiar with the research potential of the HEI and can initiate the joint projects with their employer.
Co-financing of employment of researchers in industry (SI _23)The human resource issue is addressed also by the measure, introduced by the Ministry of Economy in 2006, under which a transfer of researchers from public research institutions to business R&D units is supported. The measure is now to be implemented via PAEFI and it provides for co-financing of the salaries of the researchers who have been working in public R&D units and are to move to business sector. Also, the measure has been modified to encourage transfer of highly- skilled personnel from large enterprises to the small ones. The Ministry decided for co-financing of the mobility of the researchers from public research institutions to the business enterprises for three major reasons: to motivate en-terprises for employment of highly educated researchers, to reduce costs and improve cooperation between public and private R&D and thus stimulate tech-nology transfer, to promote intra-firm capabilities to intensify technological development. The specific criteria is that the researchers eligible are those with engineering or natural science background and that they should continue work-ing in the same area of research. The success rate of the uptake of such mobility scheme in 2006 was modest, so several modifications were introduced to make it more attractive. The goal is to achieve at least 30 transfers from public R&D to business sector and another 30 from large corporations to small and micro firms.
NatioNal system of iNNovatioN iN sloveNia90
6.6.3 Promotion of public-private partnerships for innovation and entrepreneurship
Several measures aim at the promotion of entrepreneurship, assistance to start-ups, especially high-tech start-ups and support to intermediary institutions. Most of them are not only aiming at entrepreneurship, but also include elements of R&D and innovation policy. Therefore it is difficult to separate innovation meas-ures from overall support to entrepreneurship: one of such examples is a relatively well established measure of voucher support for the consultancy services, offered to SMEs: the consultancy services can be in several areas, from legal to financial matters, but also in the field of technology and innovation development, patent or trade mark protection, etc.
The voucher scheme is operating through VEM focal points, another activity PAEFI is responsible for. VEM focal points73 are to provide support to new entre-preneurs in all areas relevant for starting a business. In the process of improving the entrepreneurial environment for SMEs, the government introduced a system VEM (I know) as a single entry point for SMEs. To assure client-friendliness and yet not go into establishment of offices throughout the country, PAEFI decided to select certain number of qualified existing business consultancy firms, regional development agencies and similar and entrust them the implementation of VEM programmes: standard business consultancy on setting up a firm, assistance in registering as well as running of the voucher programme. This spread-out sys-tem should provide for easier access to relevant information for the start-ups. The selection criteria is the completeness of the service offered, human resources available for consultations, experience and geographical coverage of the area with minimum 25.000 inhabitants or 750 micro, small and medium enterprises.
The support to technology parks, business incubators and university incuba-tors, financed by Ministry of Economy, is implemented in two stages under PAEFI. The first call issued by PAEFI invited various suitable organisations to register themselves in the database of innovative support institutions, forming ‘innova-tive environment.’ Those who qualify for registration may then apply for the finan-cial support for the services they will be providing their members and broader, to other small and micro firms. The call is quite complex and prescribes to the poten-tial recipients the minimum number of expected tasks (consultancies, workshops, seminars, meetings, information gathering) to qualify for funding. It distinguishes between innovative support institutions in category A (the technology parks, uni-versity incubators and several business incubators, which meet the required crite-ria) and support institutions B, with less demanding infrastructure. The 2010–2011 call offered support in the amount of 2 million EUR, one million per year.
73 VEM in Slovenian language means – I know.
91Governance – the role of public policy
The cooperation between public research institutions and business sector is to be promoted also with a new measure, providing incentives to interdisciplinary teams. The measure, executed by PAEFI on behalf of the Ministry of Economy, was announced as financial assistance for the formation of interdisciplinary devel-opment teams for work on technology development projects in enterprises. The eligible costs are the costs of consultancy of highly qualified experts hired to help with specific technology development project. In the case of industrial research, the consultancy costs can be co-financed up to 50 %, while for the pre-feasibility research the co-financing is limited to 25 %. PAEFI planned several openings of applications to the call, but already by the second opening in 2009 the resources available (10 million EUR) were distributed in full. In view of the quick response from the SMEs, the measure was welcomed.
The innovation environment is supported also by the MHEST through TIA. The Ministry supports institutions/networks providing advice and support to in-novations/innovators and is therefore helping the formation of a stable and stimu-lating framework for innovators, both individuals as well as SMEs. Organisations to be funded are those that support more than 300 members (researchers, small and micro entrepreneurs, self-employed persons, etc.). The measure co-finances their activities, which consist of assistance in organisation of conferences’ and fairs’ participation for their members, workshops, public round tables on innova-tion, etc. These organisations are mainly Chamber of Commerce and Industry, different Associations of inventors, innovators’ centres, etc. The organisation, eli-gible for founding, has to be operational for at least one year.
6.6.4 steering and funding of public research organizations
The funding of public research organisations is entrusted to Slovenian Research Agency. The agency runs several programmes, from funding of the research pro-grammes, basic and applied research projects, infrastructure funding for the na-tional research institutes, targeted research projects, the programme for young researchers, international cooperation programmes, funding of science informa-tion services, research infrastructure, etc. A description of the main programmes is given bellow, with the exception of Young Researchers programme, which was already presented in section 6.6.2.
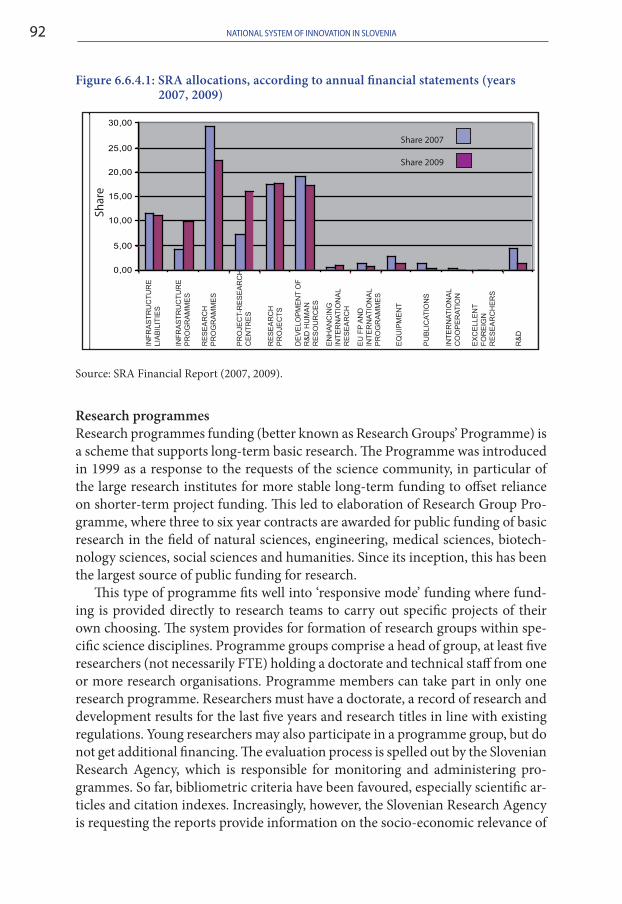
NatioNal system of iNNovatioN iN sloveNia92
Figure 6.6.4.1: SRA allocations, according to annual financial statements (years 2007, 2009)
Source: SRA Financial Report (2007, 2009).
Research programmesResearch programmes funding (better known as Research Groups’ Programme) is a scheme that supports long-term basic research. The Programme was introduced in 1999 as a response to the requests of the science community, in particular of the large research institutes for more stable long-term funding to offset reliance on shorter-term project funding. This led to elaboration of Research Group Pro-gramme, where three to six year contracts are awarded for public funding of basic research in the field of natural sciences, engineering, medical sciences, biotech-nology sciences, social sciences and humanities. Since its inception, this has been the largest source of public funding for research.
This type of programme fits well into ‘responsive mode’ funding where fund-ing is provided directly to research teams to carry out specific projects of their own choosing. The system provides for formation of research groups within spe-cific science disciplines. Programme groups comprise a head of group, at least five researchers (not necessarily FTE) holding a doctorate and technical staff from one or more research organisations. Programme members can take part in only one research programme. Researchers must have a doctorate, a record of research and development results for the last five years and research titles in line with existing regulations. Young researchers may also participate in a programme group, but do not get additional financing. The evaluation process is spelled out by the Slovenian Research Agency, which is responsible for monitoring and administering pro-grammes. So far, bibliometric criteria have been favoured, especially scientific ar-ticles and citation indexes. Increasingly, however, the Slovenian Research Agency is requesting the reports provide information on the socio-economic relevance of
0,00
5,00
10,00
15,00
20,00
25,00
30,00
INF
RA
ST
RU
CT
UR
E
LIA
BIL
ITIE
S
INF
RA
ST
RU
CT
UR
EP
RO
GR
AM
ME
S
RE
SE
AR
CH
P
RO
GR
AM
ME
S
PR
OJE
CT-
RE
SE
AR
CH
CE
NT
RE
S
RE
SE
AR
CH
P
RO
JEC
TS
DE
VE
LOP
ME
NT
OF
R&
D H
UM
AN
R
ES
OU
RC
ES
EN
HA
NC
ING
IN
TE
RN
AT
ION
AL
RE
SE
AR
CH
EU
FP
AN
D
INT
ER
NA
TIO
NA
L P
RO
GR
AM
ME
S
EQ
UIP
ME
NT
PU
BLI
CA
TIO
NS
INT
ER
NA
TIO
NA
L C
OO
PE
RA
TIO
N
EX
CE
LLE
NT
F
OR
EIG
N
RE
SE
AR
CH
ER
S
R&
D
Shar
e
Share 2007
Share 2009
93Governance – the role of public policy
the research. This indicator is based on the amount of funding that a particular research group was able to secure on top of the direct government funds.
The programme consists of 3–6 year-cycles, which start with the public call for research programmes/research groups’ proposals. Selected programmes are awarded by 3–6 year contracts, which are verified annually. Final evaluation takes place at the end of project.
The third call for financing of research groups in 2008 for the period 2009–2014 was more focused on top priorities in National Research and Development Programme. The structure of approved Programme groups is composed of 72 % of Programme groups from S&T, and 28 % of Programme groups from the field of SSH. In terms of Full Time Equivalent (FTE), S&T represents 75 % of the total FTE (665 FTE), Social sciences 11 % of total FTE (97 FTE), and Humanities 14 % (123 FTE). Still, the content of the research programmes is science-driven (bot-tom-up), since the themes are proposed independently by each research group.
In 2009, the share of natural sciences was 27 %, engineering & technical sciences at 30 %. Humanities accounted for 12 %, followed by biotechnology at 11 % and medical sciences and social sciences at 9 % of total SRA programme resources and 2 % were allocated to interdisciplinary research. In terms of research performers, most of the financial resources went to public research institutes (55 %), higher education institutions were the recipients of 41 %, the business sector received 3 % of the public funds and 1 % went to private non-profit institutions, according to the SRA’s financial report.
Basic and applied research projectsSRA publishes regularly a call for financing basic and applied research projects as well as post-doctoral research projects. The selection and funding of a research project is based on a public call, where annually the priorities and selection cri-teria are also announced. Successful project proposals that meet all prescribed conditions and offer the best research performance indicators are financed for up to three years.
Applied projects are directed towards a specific practical aim or objective and serve concrete users. Interested users have to provide co-financing of applied project of up to 25 % of the project. An applied project applicant must obtain at least 25 % of the eligible project costs from other interested users and submit evi-dence of co-financing. If an applied research project is an industrial project, the applicant must provide co-financing for up to 50 % of eligible project costs from interested users.
Targeted research programmesA more targeted funding mode is used for commissioning specific research to as-sist in public policy. These schemes are known as Targeted Research Programmes. The thematic priorities are specified by each of the interested ministries, with the aim of the scheme being the provision of scientific support to policy-makers in
NatioNal system of iNNovatioN iN sloveNia94
the preparation of their programmes and policies or in the evaluation of the exist-ing programmes.
An annual call coordinated by the Slovenian Research Agency is announced, divided into the thematic priorities according to the Slovenian Development Strat-egy and attributed to a specific ministry. In each priority, the responsible ministry defines the topics of research connected to its policies (some more broadly, some relatively narrowly and specifically) and invites the research community to pro-pose projects. Projects can run from one to four years, with semi-annual report-ing and annual evaluation. The largest recipients of the funds are usually research units in the social sciences, since the majority of the targeted fields relates to soci-etal issues (human resources and social cohesion, balanced regional development, economic competitiveness, information society, etc.). One of the weaknesses of the current programme is its heterogeneity: some ministries have a very clear idea where they need research input in their policies and strategies, others use this as a channel to provide additional support for certain research institutes and some participate at a very low level. Several evaluations of the targeted research programme have pointed out these weaknesses, with little impact on the system however (Stanovnik et al. 2006).
Institutional fundingAccording to the provisions of the Law on Research and Development (Official Gazette of the Republic of Slovenia 96/02 and 115/02), institutional funding is the obligation of the founder (the government) towards public research and in-frastructural institutes (the infrastructure institutes are the Institute of Informa-tion Science, which operates the Information System on Slovenian Science [SIC-RIS] and the Co-operative Online Bibliographic System and Services [COBISS]). Through these funds, the Slovenian Research Agency covers the fixed operating costs of the research or infrastructural activities of these institutions. Universities receive this type of institutional funding from another channel specifically dedi-cated to higher-education institutions’ research institutional funding (not to be confused with the institutional funding the universities receive for their teaching activities), but majority of R&D activity at the HEI is financed through regular participation at public calls at Slovenian Research Agency (Research programmes, applied and basic projects, targeted research projects) and MHEST.
The institutional funding provided under the founder’s obligations comprises part of the administrative costs, fixed operating costs and the fixed costs of main-taining and repairing property and equipment. Depending on the individual in-stitute, this covers between 10–30 % of their basic running costs.
SRA provides funds for the promotion of Slovenian researchers in interna-tional R&D, especially within EU, supports the purchase of research equipment in public R&D units, co-finances science publication activity, etc. With the number of different schemes, a rather complex selection/evaluation practice and very de-tailed system of monitoring the allocation of approved funding, there is a fear that
95Governance – the role of public policy
the Agency is becoming overly bureaucratic. Also, some critics point out to the fragmentation of Slovenian public science, since awarded financing only allows for relatively small projects and programmes. In 2009, the research programmes and projects, involving approximately 5000 researchers at 200 research institu-tions, were financed in amount of 1.400 FTE or 95 million EUR (data by MHEST). This financing was arranged on the basis of nearly 2000 different contractual ar-rangements (contracts and annexes) which the SRA concluded and had to moni-tor and evaluate!
6.6.5 other measures
The number of measures in a particular priority area does not reflect their impor-tance, it is the budget allocation where the strength of the measure is reflected. There is no doubt that in the innovation system so far, the support to R&D, espe-cially public R&D, has been seen as most important, with gradual development of other measures. With the additional resources coming from the Cohesion funds, the business related R&D measures have gained in their importance. Still, some of the financially less prominent measures may have an important long term conse-quences in the area of awareness building. Two can be singled out as particularly interesting: first relates to the entrepreneurial education at all levels (from elemen-tary school to university level) and the second one to the new clause in the Young researchers’ contracts on compulsory course on entrepreneurship.
Within the first measure, PAEFI provides financial support to the educational institutions who want to develop special programme for entrepreneurial educa-tion. There is some money74 available for the preparation and the pilot execution of the programme as well as training of the mentors. More important than the finan-cial input is the general notion of introducing the content of entrepreneurship and innovation in educational programmes. Hopefully this measure will be picked up by the Ministry of Education and translate into more systematic support.
6.6.6 evidence of the impact of sti policy measures
The evaluation practice has gradually improved in Slovenia during last decade. Still, monitoring of the R&D system has so far focused more on the overall per-formance than explicitly on the issue of demand fulfilment. The most compre-hensive system evaluations are usually carried out during the preparation of the National Research and Developement Programme.
The evaluation practice for research programmes and measures to promote R&D has been developing gradually by SRA and is becoming more systematic
74 The call in 2009 provided 150.000 EUR.
NatioNal system of iNNovatioN iN sloveNia96
in the recent years. Research programme evaluations depend on the type of the programme. In general, the basic criteria employed by the ministry responsible for science and by SRA have been quantitative appraisals of bibliographic ref-erences of the members and especially the heads of the research programmes/projects. Basic regulation on the evaluation of the researchers and research organ-isations/teams, introducing a complex point system for bibliographic references, was passed in April 2006, but has been amended continuously, with last changes at the beginning of 2010. This system is applied in the evaluation of the annual reports submitted by the research programme groups and also used to prescribe the eligibility criteria for the selection of basic, applied or developmental research projects.
The evaluations are usually performed by a combination of internal staff and outside experts. SRA uses external foreign evaluators more and more frequently (pending the availability of resources). The agency now performs both ex-ante and ex-post evaluations: the first are practised in the selection process of research programmes/projects to be funded and the second at the end of the funding. Sys-tematic use of the ex-post evaluation results of a particular research group/indi-vidual in the next round of financing is becoming a more regular practice.
The current innovation policy support system is relatively comprehensive, especially if the narrow approach to innovation is taken. It provides support to business R&D, helps with development of human resources, promotes start-ups and new entrepreneurs and tries to build a supportive innovation environment through intermediary institutions. Several new programmes were met enthusi-astically by the recipient community (see high application rate both for SMEs R&D projects as well as applications for centres of excellence), suggesting that the policy makers have responded well to the needs of both public and business research community.
Still, the programmes are not well known to the SMEs, many are administra-tively very demanding and often suffer from long processing times. The complex functioning of public administration, additionally complicated with the drawing on resources from the Structural funds seriously endangers the efficiency of the programmes. If the public calls are issued in late spring and the applications are not processed till early summer, the recipients of the support are faced with rela-tively short period for the implementation of their projects (in case of a single year programmes), since they have to file their reports and financial claims by October to meet the budget year. The revolving projects are somewhat less restrictive in this sense, yet there the reporting and claiming of the reimbursement is again not only highly time-consuming activity, but additionally complicated by the fact that the recipients have very limited information on dynamics of the reimbursement. This affects seriously the scheduling of their financial flow and ability to execute the activities in timely fashion. The latter has caused problems, particularly in long-awaited large projects, where the value of the approved project may surpass 3 million EUR. Often, it isn’t the comprehensiveness of the measures which is a
97Governance – the role of public policy
weakness, but the coordination and the implementation of the current ones limits the effectiveness of the innovation policy support system.
An unresolved problem of the support measures is their fragmentation and frequent changes in the conditions applied for the target audience. These relate especially to the support measures focused on the innovation environment, like technology parks/incubators, technology centres, platforms and the new idea of the logistics/research/development centres. Some of the changes were necessary due to the different financing scheme (decision not to finance their existence, but rather their activity), some happened due to the changed implementing agency, but seldom were they welcomed by the recipients.
While the financial impact of additional resources for innovation policy meas-ures from the structural funds has been substantial, the implementation proc-ess is now much more complex. Among the first public calls, where the support measures were expanded with the use of structural funds according to the current financial perspective, were the calls issued in 2008 by TIA and SEF. Especially the measures, planned to be implemented by TIA, have experienced serious adminis-trative problems. Due to the fact that financing is coming both from the national as well as EU sources, the procedure is now rather complex even at the stage of preparing the call which needs to be coordinated by the Ministry responsible for the specific measure, the Gov. Office of Local Self-Governance and Regional De-velopment75 and the implementing agency. This alone had in some cases taken more than 10 months. Once the contracts are awarded, Slovenian system for re-porting and claiming the EU funding proved to be extremely complicated, requir-ing not only a very detailed cost reporting but also several phases of controls: end result being that the actual disbursement of funds has been seriously delayed in the beginning.
Several changes have been introduced to simplify the process, which is re-flected in improved withdrawal of funds. As reported on the EU structural funds web site (http://www.euskladi.si), within the OP Strengthening Development Po-tential, where the funding from ERDF is concentrated, public calls were issued by end of 2009 for 103.6 % of planned resources, 108.8 % of these have already been approved and for 89.0 % of the funds the contracts have been signed. Up to the end of 2009 49.4 % of funds have been paid to the recipients and 44.1 % have been reimbursed from EU. The situation is worse with the OP Development of Human Resources (co-financed by European Social Fund), where public calls were issued for 54.6 % of planned amount, approved 97 % and contracts signed for 96 %. The end users received 21.2 % of approved resources and Slovenia reimbursed from EU budget only 13.5 % of the funds so far (December 2009).76
75 The Office is in charge of coordination of the overall programme for the allocation of Struc-tural Funds.
76 More at: http://www.euskladi.si/aktualno/.
NatioNal system of iNNovatioN iN sloveNia98
Therefore the overall assessment of the current range of the support measures has to acknowledge their wide range and rather extensive coverage of different challenges. A closer look reveals overlapping and poor coordination, a relatively high level of user unfriendliness, especially towards the small businesses as well as other ‘delivery’ problems. So, instead of only designing new measures, Slovenian innovation policy should focus on streamlining the existing ones.
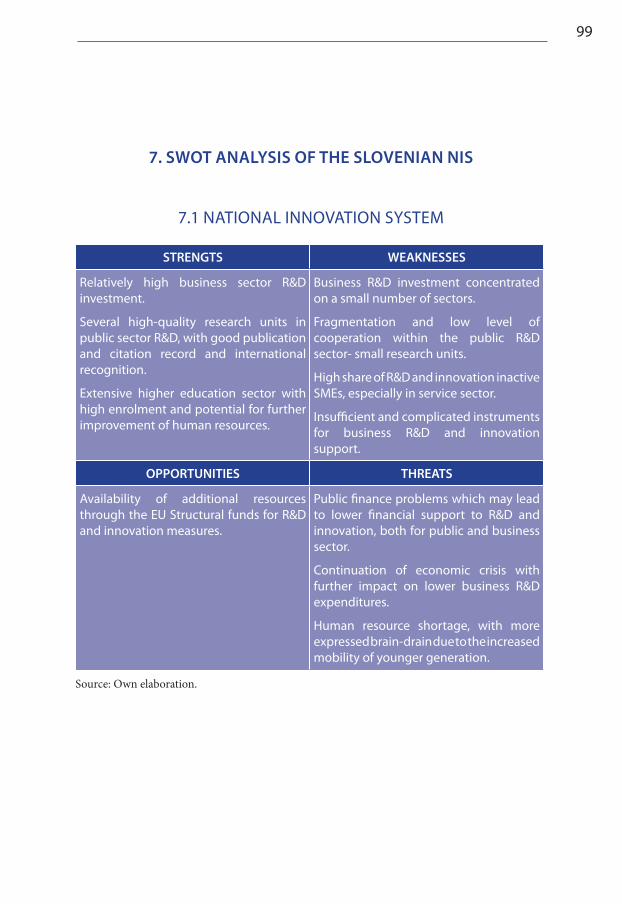
99
7. sWot aNalysis of tHe sloveNiaN Nis
7.1 NATIONAL INNOVATION SYSTEM
stReNgts WeaKNesses
Relatively high business sector R&D investment.
Several high-quality research units in public sector R&D, with good publication and citation record and international recognition.
Extensive higher education sector with high enrolment and potential for further improvement of human resources.
Business R&D investment concentrated on a small number of sectors.
Fragmentation and low level of cooperation within the public R&D sector- small research units.
High share of R&D and innovation inactive SMEs, especially in service sector.
Insufficient and complicated instruments for business R&D and innovation support.
oPPoRtuNities tHReats
Availability of additional resources through the EU Structural funds for R&D and innovation measures.
Public finance problems which may lead to lower financial support to R&D and innovation, both for public and business sector.
Continuation of economic crisis with further impact on lower business R&D expenditures.
Human resource shortage, with more expressed brain-drain due to the increased mobility of younger generation.
Source: Own elaboration.
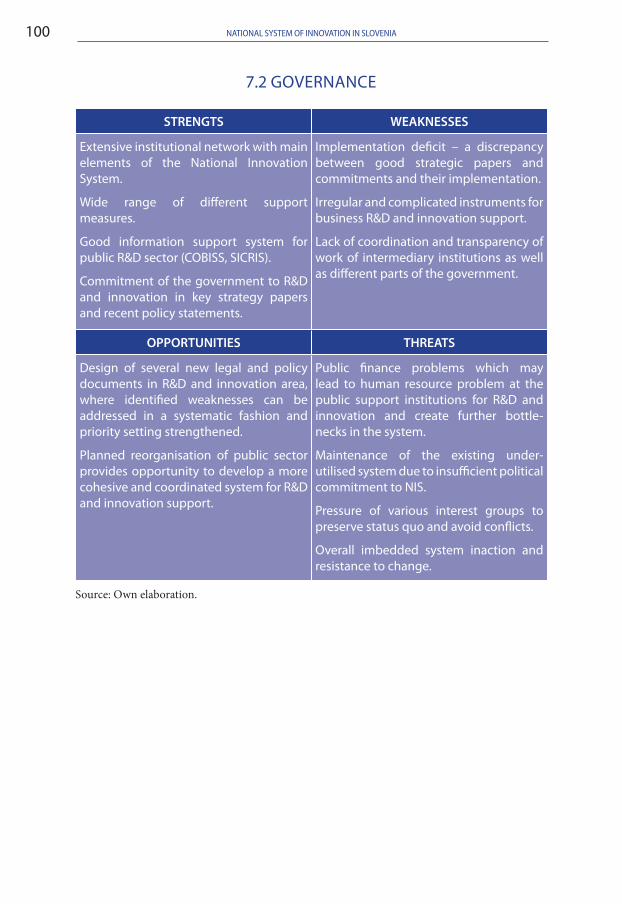
NatioNal system of iNNovatioN iN sloveNia100
7.2 GOVERNANCE
stReNgts WeaKNesses
Extensive institutional network with main elements of the National Innovation System.
Wide range of different support measures.
Good information support system for public R&D sector (COBISS, SICRIS).
Commitment of the government to R&D and innovation in key strategy papers and recent policy statements.
Implementation deficit – a discrepancy between good strategic papers and commitments and their implementation.
Irregular and complicated instruments for business R&D and innovation support.
Lack of coordination and transparency of work of intermediary institutions as well as different parts of the government.
oPPoRtuNities tHReats
Design of several new legal and policy documents in R&D and innovation area, where identified weaknesses can be addressed in a systematic fashion and priority setting strengthened.
Planned reorganisation of public sector provides opportunity to develop a more cohesive and coordinated system for R&D and innovation support.
Public finance problems which may lead to human resource problem at the public support institutions for R&D and innovation and create further bottle-necks in the system.
Maintenance of the existing under-utilised system due to insufficient political commitment to NIS.
Pressure of various interest groups to preserve status quo and avoid conflicts.
Overall imbedded system inaction and resistance to change.
Source: Own elaboration.
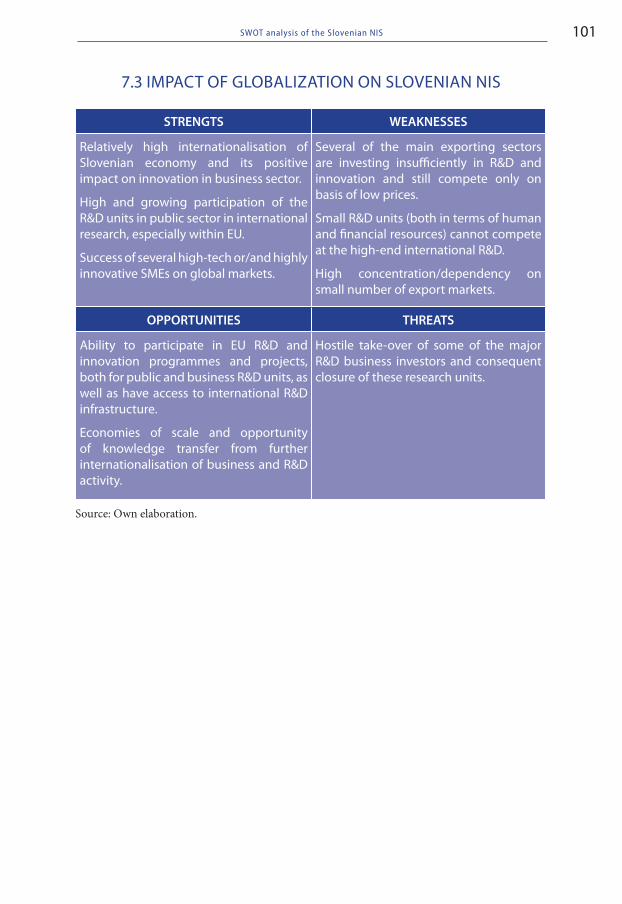
101sWot analysis of the slovenian Nis
7.3 IMPACT OF GLOBALIZATION ON SLOVENIAN NIS
stReNgts WeaKNesses
Relatively high internationalisation of Slovenian economy and its positive impact on innovation in business sector.
High and growing participation of the R&D units in public sector in international research, especially within EU.
Success of several high-tech or/and highly innovative SMEs on global markets.
Several of the main exporting sectors are investing insufficiently in R&D and innovation and still compete only on basis of low prices.
Small R&D units (both in terms of human and financial resources) cannot compete at the high-end international R&D.
High concentration/dependency on small number of export markets.
oPPoRtuNities tHReats
Ability to participate in EU R&D and innovation programmes and projects, both for public and business R&D units, as well as have access to international R&D infrastructure.
Economies of scale and opportunity of knowledge transfer from further internationalisation of business and R&D activity.
Hostile take-over of some of the major R&D business investors and consequent closure of these research units.
Source: Own elaboration.

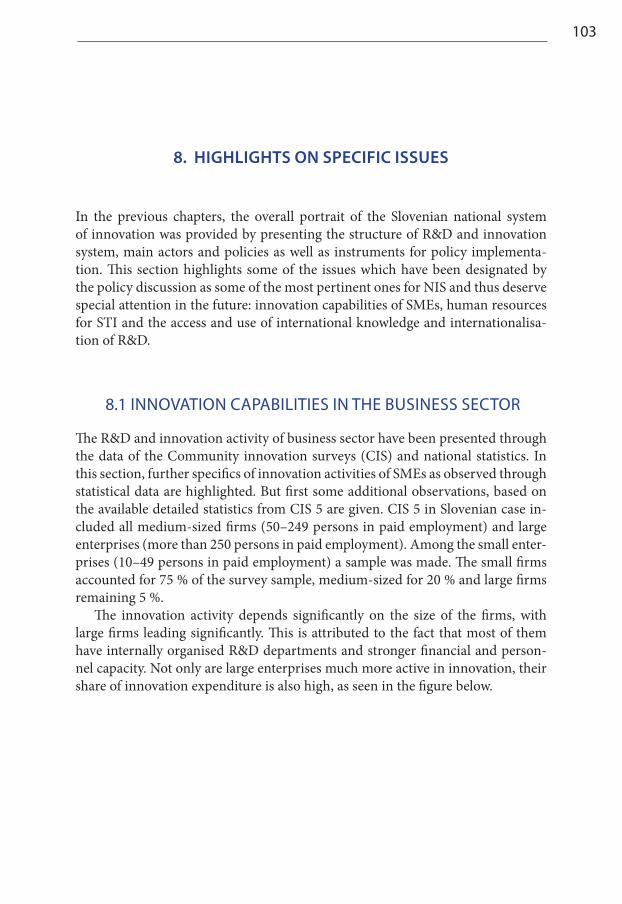
103
8. HigHligHts oN sPeCifiC issues
In the previous chapters, the overall portrait of the Slovenian national system of innovation was provided by presenting the structure of R&D and innovation system, main actors and policies as well as instruments for policy implementa-tion. This section highlights some of the issues which have been designated by the policy discussion as some of the most pertinent ones for NIS and thus deserve special attention in the future: innovation capabilities of SMEs, human resources for STI and the access and use of international knowledge and internationalisa-tion of R&D.
8.1 INNOVATION CAPABILITIES IN THE BUSINESS SECTOR
The R&D and innovation activity of business sector have been presented through the data of the Community innovation surveys (CIS) and national statistics. In this section, further specifics of innovation activities of SMEs as observed through statistical data are highlighted. But first some additional observations, based on the available detailed statistics from CIS 5 are given. CIS 5 in Slovenian case in-cluded all medium-sized firms (50–249 persons in paid employment) and large enterprises (more than 250 persons in paid employment). Among the small enter-prises (10–49 persons in paid employment) a sample was made. The small firms accounted for 75 % of the survey sample, medium-sized for 20 % and large firms remaining 5 %.
The innovation activity depends significantly on the size of the firms, with large firms leading significantly. This is attributed to the fact that most of them have internally organised R&D departments and stronger financial and person-nel capacity. Not only are large enterprises much more active in innovation, their share of innovation expenditure is also high, as seen in the figure below.
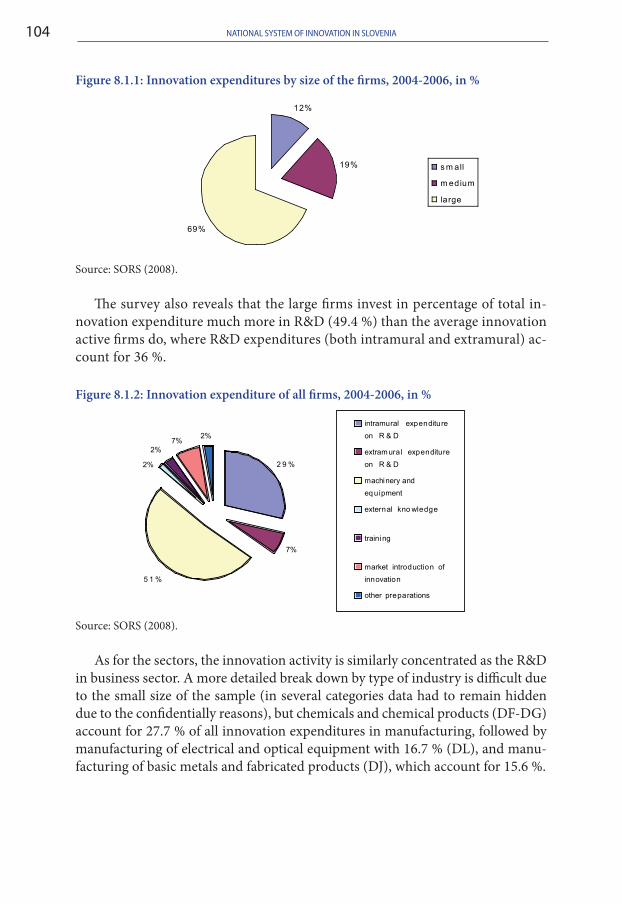
NatioNal system of iNNovatioN iN sloveNia104
Figure 8.1.1: Innovation expenditures by size of the firms, 2004-2006, in %
Source: SORS (2008).
The survey also reveals that the large firms invest in percentage of total in-novation expenditure much more in R&D (49.4 %) than the average innovation active firms do, where R&D expenditures (both intramural and extramural) ac-count for 36 %.
Figure 8.1.2: Innovation expenditure of all firms, 2004-2006, in %
Source: SORS (2008).
As for the sectors, the innovation activity is similarly concentrated as the R&D in business sector. A more detailed break down by type of industry is difficult due to the small size of the sample (in several categories data had to remain hidden due to the confidentially reasons), but chemicals and chemical products (DF-DG) account for 27.7 % of all innovation expenditures in manufacturing, followed by manufacturing of electrical and optical equipment with 16.7 % (DL), and manu-facturing of basic metals and fabricated products (DJ), which account for 15.6 %.
12%
19%
69%
s m all
m edium
large
2 9 %
7%
5 1 %
2%
2% 7%
2%
intramural expenditure
on R & D
extramural expenditure
on R & D
machinery and
equipment
external kno wledge
training
market introduction of
innovation
other preparations
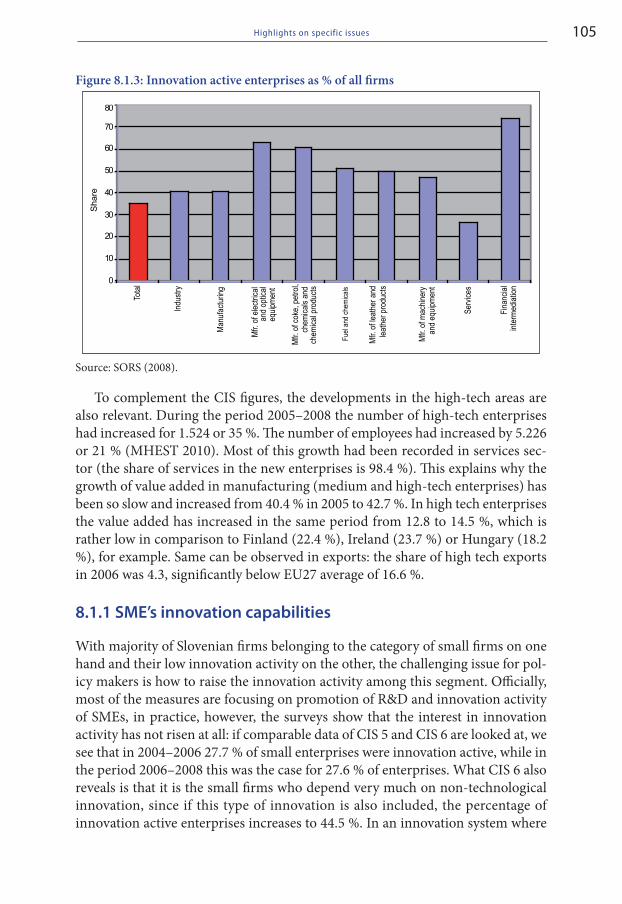
105Highlights on specific issues
Figure 8.1.3: Innovation active enterprises as % of all firms
Source: SORS (2008).
To complement the CIS figures, the developments in the high-tech areas are also relevant. During the period 2005–2008 the number of high-tech enterprises had increased for 1.524 or 35 %. The number of employees had increased by 5.226 or 21 % (MHEST 2010). Most of this growth had been recorded in services sec-tor (the share of services in the new enterprises is 98.4 %). This explains why the growth of value added in manufacturing (medium and high-tech enterprises) has been so slow and increased from 40.4 % in 2005 to 42.7 %. In high tech enterprises the value added has increased in the same period from 12.8 to 14.5 %, which is rather low in comparison to Finland (22.4 %), Ireland (23.7 %) or Hungary (18.2 %), for example. Same can be observed in exports: the share of high tech exports in 2006 was 4.3, significantly below EU27 average of 16.6 %.
8.1.1 sme’s innovation capabilities
With majority of Slovenian firms belonging to the category of small firms on one hand and their low innovation activity on the other, the challenging issue for pol-icy makers is how to raise the innovation activity among this segment. Officially, most of the measures are focusing on promotion of R&D and innovation activity of SMEs, in practice, however, the surveys show that the interest in innovation activity has not risen at all: if comparable data of CIS 5 and CIS 6 are looked at, we see that in 2004–2006 27.7 % of small enterprises were innovation active, while in the period 2006–2008 this was the case for 27.6 % of enterprises. What CIS 6 also reveals is that it is the small firms who depend very much on non-technological innovation, since if this type of innovation is also included, the percentage of innovation active enterprises increases to 44.5 %. In an innovation system where
0
10
20
30
40
50
60
70
80
Tota
l
Indu
stry
Man
ufac
turin
g
Mfr.
of e
lect
rical
and
optic
aleq
uipm
ent
Mfr.
of c
oke,
pet
rol,
chem
ical
s an
dch
emic
al p
rodu
cts
Fuel
and
che
mic
als
Mfr.
of l
eath
er a
ndle
athe
r pro
duct
s
Mfr.
of m
achi
nery
and
equi
pmen
t
Serv
ices
Fina
ncia
lin
term
edia
tion
Sh
are
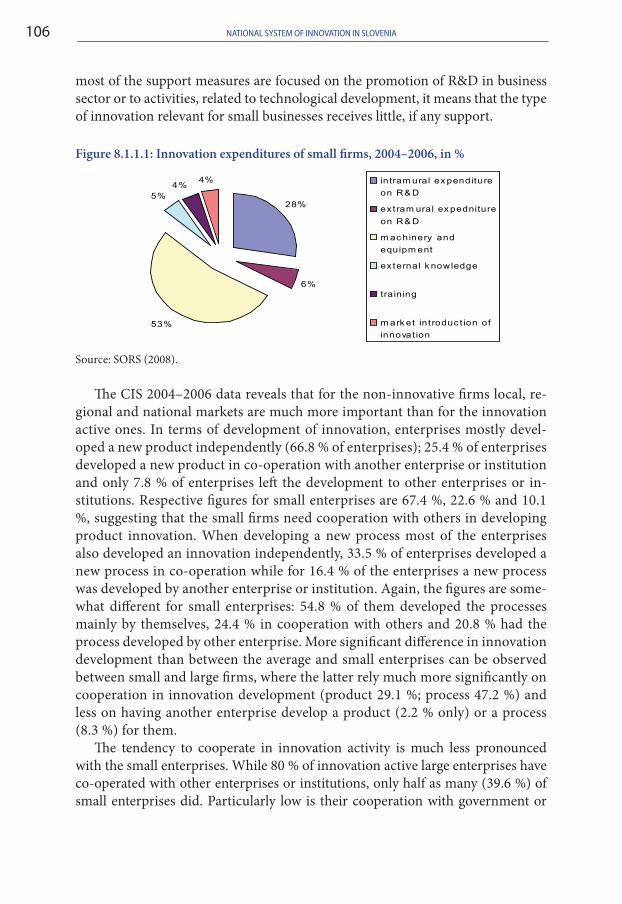
NatioNal system of iNNovatioN iN sloveNia106
most of the support measures are focused on the promotion of R&D in business sector or to activities, related to technological development, it means that the type of innovation relevant for small businesses receives little, if any support.
Figure 8.1.1.1: Innovation expenditures of small firms, 2004–2006, in %
Source: SORS (2008).
The CIS 2004–2006 data reveals that for the non-innovative firms local, re-gional and national markets are much more important than for the innovation active ones. In terms of development of innovation, enterprises mostly devel-oped a new product independently (66.8 % of enterprises); 25.4 % of enterprises developed a new product in co-operation with another enterprise or institution and only 7.8 % of enterprises left the development to other enterprises or in-stitutions. Respective figures for small enterprises are 67.4 %, 22.6 % and 10.1 %, suggesting that the small firms need cooperation with others in developing product innovation. When developing a new process most of the enterprises also developed an innovation independently, 33.5 % of enterprises developed a new process in co-operation while for 16.4 % of the enterprises a new process was developed by another enterprise or institution. Again, the figures are some-what different for small enterprises: 54.8 % of them developed the processes mainly by themselves, 24.4 % in cooperation with others and 20.8 % had the process developed by other enterprise. More significant difference in innovation development than between the average and small enterprises can be observed between small and large firms, where the latter rely much more significantly on cooperation in innovation development (product 29.1 %; process 47.2 %) and less on having another enterprise develop a product (2.2 % only) or a process (8.3 %) for them.
The tendency to cooperate in innovation activity is much less pronounced with the small enterprises. While 80 % of innovation active large enterprises have co-operated with other enterprises or institutions, only half as many (39.6 %) of small enterprises did. Particularly low is their cooperation with government or
28%
6%
53%
5%4%
4% intram ural ex penditure
on R& D
ex tram ural ex pedniture
on R& D
m ac hinery and
equipm ent
ex ternal k nowledge
training
m ark et int roduc t ion of
innovat ion
107Highlights on specific issues
public research institutes (only 9.1 %) and HEI (13.6 %).77 This also needs to receive more attention by policy makers: is it low capability of small enterprises which determines their low levels of cooperation or are there other factors (too high costs, non-responsiveness of HEI/public research institutes etc.). A more detailed research as to the types of innovation activity practiced by small enter-prises, and especially the reasons for in-activity in innovation by small enter-prises is needed.
The research on innovation cooperation has so far focused more on the types of cooperation but not segregated by the firm size. Jaklic et al. (2008) explored the importance of innovation cooperation for the innovation activity of Slovenian enterprises. They focused on the question of what kind of innovation cooperation is the most ‘productive’ for innovation activities, and whether the location and foreign ownership of innovation cooperation matters. Probit estimations con-firmed external innovation cooperation as one of the most important incentives for innovation activity, after R&D spending. However, a significant influence was only confirmed for domestic and not for international innovation cooperation in general. The efficiency varies also by type of partners; while inter-firm innova-tion cooperation significantly increases the probability of innovation, this was not found regarding cooperation with universities and R&D institutes. The impact of innovation cooperation differs by distance; the contribution of EU partners to innovation activity was the highest (higher than that of domestic partners), while partners from other locations may even decrease the probability of innovation.
The statistical results do not tell the whole story. There are several Slovenian SMEs, which have innovated and exported successfully. They are increasingly present in internationalisation and innovation activities and their share among ex-porter and investors abroad is relatively higher than in other Central and Eastern European Countries (CEEC) (Svetličič et al. 2007). Several of them have shown that successful innovation and export is possible, despite poor brand recognition abroad. Such firms may provide a standard for others to follow (EIU 2008) and for their experience to be used in the development of policy measures.
8.1.2 Public policies to foster innovation capabilities of businesses
Programme of Measures to Stimulate Entrepreneurship and Competitiveness 2007–2013 covers four main areas:
promoting entrepreneurship and a business friendly environment; •skills for business; •
77 On the other hand, large firms cite 38.8 % of cooperation with public research institutes and as much as 53.8 % of cooperation with HEI.
NatioNal system of iNNovatioN iN sloveNia108
development and innovation in industry and •helping small and medium-sized enterprises through equity and debt •financing.
Each area lists the planned support measures and the targets to be achieved within this period. Many of the listed measures are already in existence; the new programme basically reinforces their role in the entrepreneurial support frame-work and opens possibility for long-term funding through the use of Structural Funds. Most of the planned activities and measures are not only aimed at the start-ups but provide an overall support to all SMEs.
Several measures have already been explained. Among them are:Promotion of VEM focal points;•Support to technology/business parks and incubators;•Voucher scheme for consultancy services;•Mobility scheme;•Subsidies to start-ups in technology parks/incubators;•Subsidised credit and bank guarantees to SMEs, with special scheme for enter-•prises with up to 9 employees;Subsidies for purchasing of new technical equipment, technology etc. for SMEs.•
For the potential entrepreneurs support programmes under the Operational Programme “Developing of Human Resources” are also of interest: several pro-grammes in entrepreneurial training are planned with special attention to em-ployability, self-employment, life-long learning, entrepreneurial and management skills etc.
As already mentioned, in addition to the government, several other institutions are also involved in promoting entrepreneurship. The Chamber of Commerce and Industry provides info desk to new entrepreneurs and offers consultancy, so does the Chamber of Crafts. Local communities, especially larger ones, like the City of Ljubljana, have their own entrepreneurship promotion centres, where SMEs can find necessary information and support for their ideas. Also, some private consultancy firms are engaged in providing assistance to SMEs, either through voucher scheme, financed by PAEFI or their service is being subsidised by the local community.
Here it is worth mentioning some other non-governmental initiatives promot-ing entrepreneurship: the project called ‘gazelles’ and a new competition on the most promising start-up, launched in 2007/2008. The national competition for the best Gazelle was started by the business journal through first making the list of fastest growing Slovenian SMEs. The project developed in 2001 in six regional competitions and the final central one, where the winners from the regions face each other. From 2006 on, the organizer of the project Gazelle, the newspaper company Dnevnik established cooperation with the programme EUROPE first 500, so the Slovenian companies could enter the competition at the European
109Highlights on specific issues
level for the European Business Award. The entire activity is getting increasing media attention and is now sponsored by the Ministry of Economy as well.
Within the new project START UP: Slovenia, the competition for the best start-up company in Slovenia was launched in 2008 by the university incubator Tovarna podjemov (Factory of ideas) in cooperation with several other private and government institutions. The project invites young companies (under three years) or potential entrepreneurs to present themselves, their innovative ideas and programmes. The winner receives a prize of 10.000 EUR in cash and a voucher for 5.000 EUR for entrepreneurial training. The winners were announced during the innovation conference PODIM in spring each year, an event which already by itself is gaining media attention. The organizers plan to expand the project inter-nationally to include also start-ups from other ex-Yugoslav states.
8.2 HUMAN RESOURCES FOR STI
The issue of sufficiently educated and trained human resources is one of the cen-tral topics for the future development of Slovenian NIS. Not only is it important from the viewpoint of having adequate supply of new researchers, but equally so in raising the educational attainment of the entrepreneurs in SMEs and the overall educational level of labour force. Analyses show a positive correlation between the share of population with tertiary education and the economic development of the society measured in GDP per inhabitant at purchasing-power parity (IMAD 2010). Slovenia is approaching its target of enrolling more than half of respective generation in tertiary education. Still, the enrolment is particularly high in social sciences, economics and law, and rather low in the area of science and technology- remaining at around 20 % of enrolment. Some of the issues, related to HEI have already been discussed in earlier parts of the report – here we focus in particular on the issue of human resources for S&T.
8.2.1 Current or prospective mismatches between supply and demand of human resources in science and technology
The lack of S&T graduates is a relatively new challenge and a difficult one to re-solve, since nothing in education system moves quickly. In this respect the promo-tion of enrolment in S&T programmes. will be crucial. The government has tried to encourage enrolment by offering better scholarship options to S&T students as well as limiting the enrolment in the most popular programmes (law, economics, social sciences), yet so far these measures have only slowly resulted in shifts in students’ preferences. In 2005, the share of S&T tertiary students at all levels was 21.0 %, by 2008 it has increased to 25.2 % of all enrolled (114.391 students) (SORS data base on education).
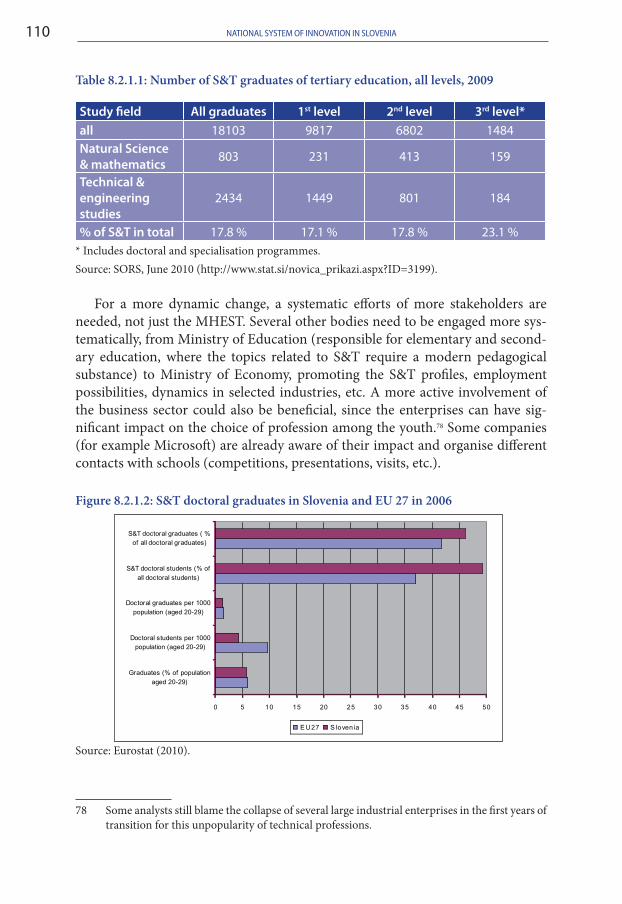
NatioNal system of iNNovatioN iN sloveNia110
Table 8.2.1.1: Number of S&T graduates of tertiary education, all levels, 2009
study field all graduates 1st level 2nd level 3rd level*all 18103 9817 6802 1484Natural science & mathematics 803 231 413 159
technical & engineering studies
2434 1449 801 184
% of s&t in total 17.8 % 17.1 % 17.8 % 23.1 %* Includes doctoral and specialisation programmes.Source: SORS, June 2010 (http://www.stat.si/novica_prikazi.aspx?ID=3199).
For a more dynamic change, a systematic efforts of more stakeholders are needed, not just the MHEST. Several other bodies need to be engaged more sys-tematically, from Ministry of Education (responsible for elementary and second-ary education, where the topics related to S&T require a modern pedagogical substance) to Ministry of Economy, promoting the S&T profiles, employment possibilities, dynamics in selected industries, etc. A more active involvement of the business sector could also be beneficial, since the enterprises can have sig-nificant impact on the choice of profession among the youth.78 Some companies (for example Microsoft) are already aware of their impact and organise different contacts with schools (competitions, presentations, visits, etc.).
Figure 8.2.1.2: S&T doctoral graduates in Slovenia and EU 27 in 2006
Source: Eurostat (2010).
78 Some analysts still blame the collapse of several large industrial enterprises in the first years of transition for this unpopularity of technical professions.
0 5 10 15 20 25 30 35 40 45 50
Graduates (% of population
aged 20-29)
Doctoral students per 1000population (aged 20-29)
Doctoral graduates per 1000
population (aged 20-29)
S&T doctoral students (% of
all doctoral students)
S&T doctoral graduates ( %of all doctoral graduates)
E U27 S lovenia
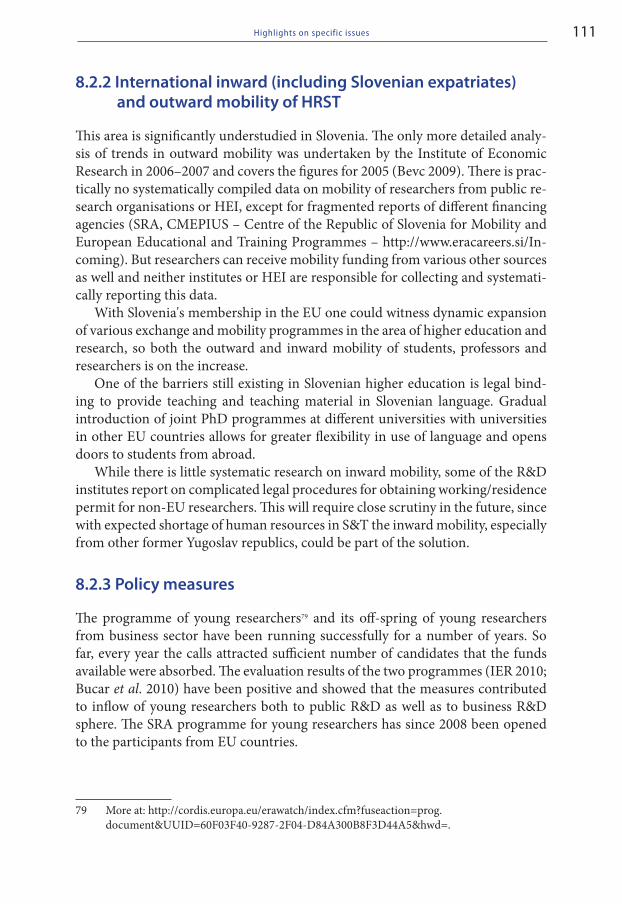
111Highlights on specific issues
8.2.2 international inward (including slovenian expatriates) and outward mobility of HRst
This area is significantly understudied in Slovenia. The only more detailed analy-sis of trends in outward mobility was undertaken by the Institute of Economic Research in 2006–2007 and covers the figures for 2005 (Bevc 2009). There is prac-tically no systematically compiled data on mobility of researchers from public re-search organisations or HEI, except for fragmented reports of different financing agencies (SRA, CMEPIUS – Centre of the Republic of Slovenia for Mobility and European Educational and Training Programmes – http://www.eracareers.si/In-coming). But researchers can receive mobility funding from various other sources as well and neither institutes or HEI are responsible for collecting and systemati-cally reporting this data.
With Slovenia's membership in the EU one could witness dynamic expansion of various exchange and mobility programmes in the area of higher education and research, so both the outward and inward mobility of students, professors and researchers is on the increase.
One of the barriers still existing in Slovenian higher education is legal bind-ing to provide teaching and teaching material in Slovenian language. Gradual introduction of joint PhD programmes at different universities with universities in other EU countries allows for greater flexibility in use of language and opens doors to students from abroad.
While there is little systematic research on inward mobility, some of the R&D institutes report on complicated legal procedures for obtaining working/residence permit for non-EU researchers. This will require close scrutiny in the future, since with expected shortage of human resources in S&T the inward mobility, especially from other former Yugoslav republics, could be part of the solution.
8.2.3 Policy measures
The programme of young researchers79 and its off-spring of young researchers from business sector have been running successfully for a number of years. So far, every year the calls attracted sufficient number of candidates that the funds available were absorbed. The evaluation results of the two programmes (IER 2010; Bucar et al. 2010) have been positive and showed that the measures contributed to inflow of young researchers both to public R&D as well as to business R&D sphere. The SRA programme for young researchers has since 2008 been opened to the participants from EU countries.
79 More at: http://cordis.europa.eu/erawatch/index.cfm?fuseaction=prog.document&UUID=60F03F40-9287-2F04-D84A300B8F3D44A5&hwd=.
NatioNal system of iNNovatioN iN sloveNia112
In the long run, stable and stimulating scholarship policy encouraging the en-rolment in S&T studies is needed. Also, all policy measures, focusing on popu-larisation of science and researchers as a profession have an important impact on the decisions of the younger generation. More actions of this kind have been undertaken by MHEST and Ministry of education, also in combination with vari-ous activities of EU (Science days, for example).
In the area of promoting inward mobility, SRA has introduced a special meas-ure where financing is provided to a visiting renowned researcher from abroad,80 who joins for up to three months to one of the research programme groups and helps increase the international publication output of the Slovenian team. This measure was introduced to help Slovenian researchers increase the quality of their work and not to promote mobility, for which several bilateral cooperation agree-ments are available as well as EU programmes (Marie Curie, for example).
8.3 ACCESS AND USE OF INTERNATIONAL KNOWLEDGE AND THE INTERNATIONALISATION OF R&D
8.3.1 flow of technological knowledge
Existing studies on the effect of internationalisation (inward and outward) empha-size the importance of internationalization for innovation activity (see also 2.3). In CEEC new ideas have come mainly from multinational companies whose technol-ogy and ‘know-how’ has not always benefited locally-owned firms. A report81 pub-lished by the Economist Intelligence Unit and sponsored by Oracle concludes that CEE’s dependence on foreign investment for innovation could damage the region’s long-term economic growth prospects. The research reveals that CEE countries will continue to under-perform on innovation over the next five years, unless the re-gion’s governments, universities and local businesses work together to improve the innovation environment. This will require a boost in direct inputs – such as R&D spending, better science education and IT infrastructure – and improvements in
80 See at: http://www.arrs.gov.si/sl/progproj/rproj/razpisi/08/razp-tuji-razisk-09.asp. 81 The research is based on three main components: a survey of 370 executives operating in
CEE, carried out in Spring 2008; the Economist Intelligence Unit’s own innovation model; and 20 in-depth interviews with C-level executives, consultants and other experts in the field. In addition, we conducted an extensive programme of desk research. Over half of the execu-tives surveyed are based in the CEE; all operate significant business in the region; two-fifths have annual global revenues below $100m and 16 % over $10bn; over half are either C-suite executives or board members and over one-quarter are CEOs or managing directors, in all representing 19 different industries.
113Highlights on specific issues
the overall business environment, for example by reducing bureaucracy, creating better tax incentives and increasing the flexibility of labour markets. Currently, Slovenia tops the Economist Intelligence Unit’s innovation ranking in Central and Eastern Europe – though it ranks only 24th globally – followed closely by Hungary, Czech Republic and Estonia.
Contrary to other CEEC, Slovenia did not rely on foreign innovation signifi-cantly. High (no. 1) ranking of Slovenia in the report of Economist intelligence unit may thus be a result of the fact that most of the innovation in Slovenia in the past two decades has come from locally owned firms. In other CEE mostly came from the investments of multinational companies (MNCs), on which local firms have come to rely for new ideas and technology. This over-reliance leaves the region’s economies vulnerable, should those MNCs leave for lower-cost mar-kets. Local firms therefore need to innovate not only to generate an independent flow of new products and ideas, but also to increase their value to multinational investors and hopefully encourage them to invest further in higher value facilities. This will require governments, universities and local businesses to work together, creating intelligent and precisely focused financial incentives, improving links be-tween business and universities, and facilitating a flow of talented and technically skilled graduates into business start-ups and SMEs.
The level of inward FDI presented in chapter 2 suggested that Slovenia can-not (and does not) rely on foreign innovation to sustain long-term growth. FDI inflows in Slovenia are relatively modest despite massive foreign direct investment into the region. MNC innovation brings some benefits to domestic enterprises and the introduction of modern production and management methods, but evi-dence show insufficient ‘spillovers’ of technology and ‘know-how’ into the domes-tic economy (Bučar, Rojec and Stare 2009).
As regards transfer of R&D activities the surveys among foreign affiliates in Slovenia identified poor transfer of R&D activities, though foreign affiliates have above average R&D spending. According to 2008 survey the average R&D spending among foreign affiliates exceeds 3.2 % of revenues. 20 % of foreign affiliates have own R&D department, average number of employees in that department is 9.2. The highest spillover effects have been identified within firms for organizational and marketing knowledge, while technology transfer was evaluated as less significant (Burger et al. 2010).
In OFDI and outward internationalization the highest barrier is lack of human resources and knowledge, lack of skilled people willing to do internationaliza-tion – this seem to be also the biggest barriers toward more intensive innovation activity.
The outward dimension also illustrates modest transfer of R&D activity. Though Slovenian enterprises are generally highly internationalised (especially as regard trade and marketing, and increasingly also production function) and di-versify foreign activities rapidly R&D is one of the least internationalized business functions. According to the only available survey only 2.2 of enterprises with
NatioNal system of iNNovatioN iN sloveNia114
foreign investments abroad transferred or expand R&D activities into foreign market (Jaklič and Svetličič 2003: 143). Yet some case study evidence suggests that in some highly intensive R&D sectors some enterprises have started commission-ing R&D abroad, which may be the first step towards internationalisation in this area as well (Bučar and Rojec 2009).
8.3.2 Collaboration in international R&d programmes and initiatives
The integration of the Slovenian research sphere into the ERA is one of the priori-ties in the area of international cooperation and as such actively supported by the Ministry of Higher Education, Science and Technology. The active participation of researchers in the ERA is called for in the National Research and Development Programme, 2006–2010, as well.
The Ministry of Higher Education, Science and Technology and SRA promote and inform the Slovenian research public about the conditions of co-operation and calls for proposals, published by the European Commission. SRA also stimu-lates the participation in FP calls by awarding additional financial resources to the research programme groups if successful in EU projects and gives a symbolic award to all successful applicants to FP calls.
According to the final report of the European Commission, published by the Ministry of Higher Education, Science and Technology,82 on the 6th Framework Programme, Slovenian institutions submitted 3898 applications and were suc-cessful in 616 cases, achieving a rate of success of 15.8 %. While most applications were filed by the higher education and R&D institutions, as many as 22.5 % were submitted by small and medium enterprises and industrial organisations. Out of 503 projects, where institutions from Slovenia cooperated, most projects were in IT area (20 %), followed by projects in sustainable development & global change (12 %), nanotechnology, materials and processes 9.7 % and scientific policy sup-port (8 %). Overall, Slovenia participated in all areas of 6th FP, mostly in STREPs 28.2 %, in SSA 19.3 % and CA 16.3 %. The total value of the resources that Slovenia had received was 76.4 million EUR, which compares well with 34.8 contributions to the 6th FP. The amounts in individual contracts vary significantly depending on the instrument or the programme. According to the first estimates, the FP7 results will be even better for Slovenian researchers, since already in first two years of the programme approximately 44 million EUR of funds have been secured.
82 More at: http://www.rtd.si/slo/6op/gradivo/zaklj-por-07022008.asp.
115
9. summaRy aNd CoNCludiNg tHougHts
Slovenian innovation system has over the years evolved through complex relation-ship of relatively influential public R&D sector, increasing presence of business as the key investor in R&D and innovation and a search for optimal governance of innovation policy. In its ambition to secure the country long-term sustainable economic and social development, Slovenia is looking at the national innovation system with expectation to develop R&D and innovation capacities as important sources and determinants of economic growth.
With stable macroeconomic conditions and dynamic economic growth since 1997 Slovenia has made considerable progress in catching up with the EU both in terms of GDP per capita and labour productivity. Recent economic crisis has re-duced foreign demand, one of the main drivers of Slovenian economic development and economic activity declined sharply in late 2008 and 2009. The crisis has exposed several structural weaknesses, particularly the fact that Slovenia’s GDP growth is overly dependent on low-technology industries and traditional services, which limit the competitive edge of its economy. A quick return to the trajectory of economic recovery and improvement of the population’s welfare is therefore a great challenge for Slovenia, especially as the economic crisis severely affected the medium-term fiscal position and availability of sources of finance, and as the level of potential GDP also dropped. Relatively low growth of economic activity and employment in the coming years will be reflected in modest growth in general government revenue, which will make the consolidation of public finances even harder.
Slovenia is making slow, but continuous progress in its innovation perform-ance. In a time of economic crisis, catching up with more advanced countries is an even greater challenge for Slovenia than in the years of strong economic growth. Immediate strategic shifts to improve economic competitiveness amid a concurrent consolidation and restructuring of public finances are necessary and strengthening innovation policy is one of the important elements.
In terms of R&D input indicators (the number of researchers, the amount of public R&D investment, and the high level of business R&D investment), Slovenia scores relatively well in comparison to the EU average and is grouped in the cat-egory of ‘moderate innovator’. More problematic is the output side, particularly if measured by number of innovative firms, high tech export or the number of patents (EIS 2009). The level of research and development (R&D) investment in Slovenia in recent years has been around 1.5 % of Gross Domestic Product (GDP) for several years now, with small oscillations, but under the EU-27 average. In
NatioNal system of iNNovatioN iN sloveNia116
the year 2008 the percentage was 1.66 % of GDP or 616.9 million EUR for R&D (SORS 2010), up from 1.5 in 2007. The increase was the highest in the business enterprise sector (by 25.7 % in real terms). The share of business sector in total R&D investments increased to 63 % in 2008 (which represents 387.5 mil-lion EUR), and was followed by the government sector with 31 % (193.1 million EUR).
Over the years, Slovenia has developed a rather complex scheme of institu-tions for R&D and innovation policy implementation, set up with the ambition to provide for as complete an innovation system as possible. Yet sometimes it seemed as if the main emphasis was more on the number of different instruments and institutions than on the quality of their work. The support institutions can be grouped according to their main tasks in the following categories:
Government executing/funding agencies:• Slovenian Research Agency, Slov-enian Technology Agency, Public Agency for Entrepreneurship and Foreign Investment, Slovenian Enterprise Fund.‘Bridging’ institutions• like technology centres, technology platforms, centres of excellence, clusters.Technology/innovation/entrepreneurship support institutions• like technol-ogy parks, business and university incubators, technology transfer offices, VEM-points, regional development agencies, etc.Financial intermediaries• : venture funds, business angels association, etc. Interest organizations• : Chamber of Commerce and Industry, Chamber of Craft and Small Business of Slovenia, etc.
In compliance with 2002 Law on Research and Development, Slovenia estab-lished two Agencies in the field of R&D and innovation: the Agency for Scientific Research (SRA) and the Agency for Technology Development (TIA). The idea behind such institutional setting was that the agencies (each in its sphere) would be responsible for permanent, professional and independent selection process of projects and programmes, which are to be financed from public resources. While SRA is focused on financing public R&D resources primarily to public research institutes and higher education institutions, TIA is the central agency in support of business sector R&D and technology development.
Relatively extensive support network is often criticised for its low effectiveness due to insufficient coordination and specialisation, with no clear demarcation of the tasks. Since facilitation of the knowledge flows is an important R&D and development policy orientation, the challenge of coordinated approach to de-signing the most efficient network, combining the roles of university incubators, technology parks, technology centres, platforms, centres of excellence, regional development agencies, clusters, business promotion centres, etc. in a coherent and transparent support system should be given more policy attention.
The institutional framework of innovation policy has gone through several changes since Slovenia’s independence, reflecting in part the search for the most
117summary and concluding thoughts
efficient division of tasks between different ministries and in part the influence of the science lobby and, to a lesser extent, business communities. Each of the past elections had brought forward new ideas on how to best organise the government to be more supportive to science, technology and innovation. Currently (2010), the innovation policy is the responsibility of the Ministry of Higher Education, Science and Technology, the Ministry of Economy and to some extent also the two Government Offices: the Office for Development and European Affairs and the Office for Local Self-management and Regional Development. Each of the Ministries has its executive agencies through which most of the policy measures are executed. Ministry of Economy directs the implementation of its programme through the Public Agency for Entrepreneurship and Foreign Investment, through Technology Agency and Slovene Enterprise Fund. MHEST has transferred the implementation of most of its measures to Technology Agency and Slovene Re-search Agency.
With the more recent R&D and innovation policy documents, one can ob-serve significant level of coherence, in part because the Slovenian Development Strategy and the National Research and Development Programme were prepared simultaneously and with reference to one another. These documents are novel in a sense that the R&D and increased innovation efforts by the business sector are seen as the key inputs into increased competitiveness and therefore more dynamic economic growth. This clear linkage of R&D and economic policy has not been so explicitly pronounced in the past. Also important is the stress on socio-economic relevance of research and expectations that the increased public investment is to be aimed at the innovation activity of the business sector. From the bird’s eye per-spective R&D and innovation policy looks well formulated even if maybe a bit too optimistic in setting the goals. But policy documents are only the broad frame-work; it is the implementation which reflects the efficacy of innovation policy. Here Slovenia has experienced several problems: from insufficient coordination of the measures to slow and complex administrative system in delivery of support to business R&D and innovation.
One of the pressing issues in the innovation policy formulation is the integra-tion of existing structures and actors in the process of research priority iden-tification. Each of the ‘tools’ applied so far (elements of technology foresights, policy debates, initiatives of Competitiveness council, discussions of technology platforms, etc.) provided some input, but no mechanism exists which would put all these together and provide for non-biased assessment and proposal for priori-ties in R&D and innovation policy. This partly explains why priority setting has remained a very sensitive issue in Slovenian R&D and innovation system and if/when agreed, the priorities have usually remained at a very broad level. In prac-tice, from 2009 on both the Slovenian Research Agency as well as the Ministry for Higher Education, Science and Technology do apply priorities at the level of specific topics/science areas- partly in line with the priorities set in the National Research and Development Programme and partly with topics identified by
NatioNal system of iNNovatioN iN sloveNia118
Competitiveness council- in the public calls for R&D projects and programmes (for example, centres of excellence call).
Slovenia has several measures to support R&D and innovation. The number of measures in a particular priority area does not necessarily reflect their impor-tance; it is the budget allocation where the strength of the measure is reflected. There is no doubt that in the innovation system so far, the support to R&D, espe-cially public R&D, has been seen as most important, with gradual development of other measures. With the significant amount of additional resources coming from the Cohesion funds, the business related R&D measures have gained in their im-portance. The EU Innovation Policy Trendchart database on Slovenia includes 22 measures, from the funding schemes for business and public R&D to the measures promoting linkages between business and public R&D sector and the measures, supporting intermediary institutions. The overall assessment of the current range of the support measures has to acknowledge their wide range and rather exten-sive coverage of different challenges. A closer look reveals overlapping and poor coordination, a relatively high level of user unfriendliness, especially towards the small businesses as well as other ‘delivery’ problems. So, instead of only design-ing new measures, Slovenian innovation policy should focus on streamlining the existing ones.
This however does not mean that new measures are not going to be needed, since new challenges may result from the current schemes. A close monitoring of the absorption capacity of the business sector is required. Also the ability of pub-lic R&D to deliver effectively the support under existing policy measures should be regularly assessed. An evaluation and reporting practice has significantly im-proved over the recent years, even though not at the same pace for all the impor-tant actors, so there remains room for further development.
The issue of sufficiently educated and trained human resources is one of the central topics for the future development of Slovenian NIS. Not only is it im-portant from the viewpoint of having adequate supply of new researchers, but equally so in raising the educational attainment of the entrepreneurs in SMEs and the overall educational level of labour force. Slovenia is approaching its target of enrolling more than half of respective generation in tertiary education, yet the quality of HEI is more problematic (student/teacher ratio, long studying time). The international mobility of researchers is increasing but is as yet insufficiently monitored to enable policy response.
The problem with Slovenian innovation system often lies in details: the imple-mentation of the instruments is still subject to serious problems of efficiency of public administration and good governance. The already complicated process of budget negotiations and re-negotiations, which had often postponed the approval of support programmes and resulted in changes in the instruments, has been ad-ditionally complicated by the fact that many of the R&D and innovation measures are co-financed by the EU Structural Funds. This co-financing has brought con-siderable and welcome increase of resources, but with it also a need for improved
119summary and concluding thoughts
coordination and transparency of policies and measures. A careful appraisal of delivery system is needed, where the needs of the recipients should be of primary concern.
When looking at the Slovenian innovation policy from the perspective of cor-rectly identified challenges and the wide scope of different instruments and sup-port institutions, one could assess the policy as relatively well conceptualised one. The innovation policy design has been under significant influence of the good practices seen in EU. Both, the challenges, identified by the policy papers as well as the measures proposed, can be assessed as the ‘right’ ones.
This can be attributed to the fact that the policy is conceptualised in rather broad terms and even the measures remain at relatively general level. At the same time, none of the identified challenges to NIS are of the short-time character: they all require a persistent, well-coordinated long-term action. Even the priori-ties within the National Research and Development Programme are still very gen-eral and broadly defined. To achieve efficient R&D and innovation policy mix, a more thorough analysis of various measures and instruments and their results needs to be undertaken, keeping in mind the existing scientific and technological potentials of Slovenian science community, the production and competitive ca-pabilities of business sector and the ambition and opportunities, opening to Slov-enian R&D in European Research Area. For a small country, finding an optimal combination of various national and international resources to fund its scientific and technological development is essential, especially if the R&D and innovation is to contribute to its economic and social development. So far, the public R&D policy and the support for business R&D and innovation had little in common at the operational level.
Many of the challenges, faced by the NIS, are of the structural character and therefore require a prolonged, stable and well-coordinated policy response. One of the areas where continuous policy attention should be focused, is the large seg-ment of non-innovative SMEs. The lack of interest in some industrial sectors for R&D and innovation, and especially SMEs in these sectors, is the results of sev-eral, sometimes conflicting reasons: from the lack of competition (certain serv-ices) to lack of financial and human resources in long neglected sectors, which were traditionally not considered as R&D important (like textiles, food process-ing etc.). In many ways, Slovenian R&D and innovation framework needs certain stability in terms of measures and instruments. This would give the companies a chance to get used to the offered support which is available to them on a regu-lar, sustained basis. It would provide an opportunity to analyse the impact of the measures over medium-term period and see where the barriers to their efficiency are most pronounced.
One of the key policy documents in R&D and innovation area, the National Research and Development programme, is ending in 2010, so the preparations are on the way designing the new programme. The ambition of the policy makers in R&D and innovation should be to design a policy mix, where the comprehensive
NatioNal system of iNNovatioN iN sloveNia120
system of institutions, policies, documents and measures would be combined in a coherent and complementary manner. This should encompass all the different instruments in support of public R&D, business R&D, innovation and entrepre-neurship promotion as well as promotion of participation of Slovenian R&D in ERA. In assessing the R&D and innovation system today, one has a feeling that different institutions are so concerned with their own activities and measures (trees) that no one really sees the system as a whole (the forest). So to paraphrase: while the ‘trees’ are important, it is the ‘forest’ which really makes an impact on socio-economic development of a country. On the other hand, in designing the innovation policy, it is not enough to identify the ‘right’ challenges, not even to design appropriate measures – one also needs to implement them efficiently if the results should be forthcoming. And what a Slovenian innovation story tells is that too often it is the gritty bitty detail which gets insufficient attention and ‘ruins’ an overall effect of otherwise well-thought policy measure.
While the R&D and innovation policy is an important building block of NIS, the policy in this area alone cannot bring about the changes needed in overall socio-economic environment. The very concept of national innovation system is based on interaction between various actors and policies. If R&D and innovation activity are to contribute to the economic growth by technological restructuring and increased competitiveness, then R&D and innovation policy should not be treated as a stand-alone policy, but integrated in overall economic policy of the country and treated with sufficient attention in budget negotiations as well.
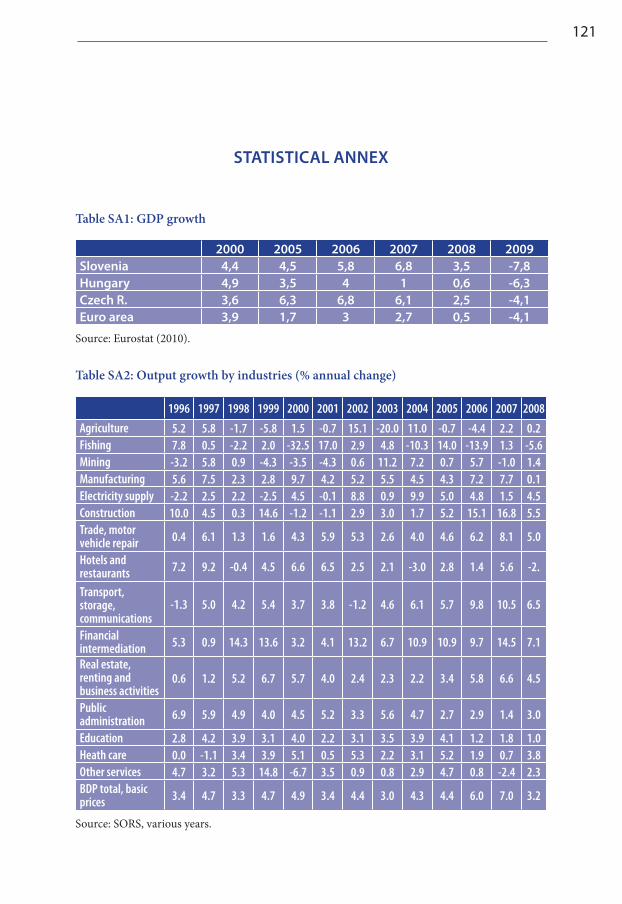
121
statistiCal aNNex
Table SA1: GDP growth
2000 2005 2006 2007 2008 2009slovenia 4,4 4,5 5,8 6,8 3,5 -7,8Hungary 4,9 3,5 4 1 0,6 -6,3Czech R. 3,6 6,3 6,8 6,1 2,5 -4,1euro area 3,9 1,7 3 2,7 0,5 -4,1
Source: Eurostat (2010).
Table SA2: Output growth by industries (% annual change)
1996 1997 1998 1999 2000 2001 2002 2003 2004 2005 2006 2007 2008
Agriculture 5.2 5.8 -1.7 -5.8 1.5 -0.7 15.1 -20.0 11.0 -0.7 -4.4 2.2 0.2Fishing 7.8 0.5 -2.2 2.0 -32.5 17.0 2.9 4.8 -10.3 14.0 -13.9 1.3 -5.6Mining -3.2 5.8 0.9 -4.3 -3.5 -4.3 0.6 11.2 7.2 0.7 5.7 -1.0 1.4Manufacturing 5.6 7.5 2.3 2.8 9.7 4.2 5.2 5.5 4.5 4.3 7.2 7.7 0.1Electricity supply -2.2 2.5 2.2 -2.5 4.5 -0.1 8.8 0.9 9.9 5.0 4.8 1.5 4.5Construction 10.0 4.5 0.3 14.6 -1.2 -1.1 2.9 3.0 1.7 5.2 15.1 16.8 5.5Trade, motor vehicle repair 0.4 6.1 1.3 1.6 4.3 5.9 5.3 2.6 4.0 4.6 6.2 8.1 5.0
Hotels and restaurants 7.2 9.2 -0.4 4.5 6.6 6.5 2.5 2.1 -3.0 2.8 1.4 5.6 -2.
Transport, storage, communications
-1.3 5.0 4.2 5.4 3.7 3.8 -1.2 4.6 6.1 5.7 9.8 10.5 6.5
Financial intermediation 5.3 0.9 14.3 13.6 3.2 4.1 13.2 6.7 10.9 10.9 9.7 14.5 7.1
Real estate, renting and business activities
0.6 1.2 5.2 6.7 5.7 4.0 2.4 2.3 2.2 3.4 5.8 6.6 4.5
Public administration 6.9 5.9 4.9 4.0 4.5 5.2 3.3 5.6 4.7 2.7 2.9 1.4 3.0
Education 2.8 4.2 3.9 3.1 4.0 2.2 3.1 3.5 3.9 4.1 1.2 1.8 1.0Heath care 0.0 -1.1 3.4 3.9 5.1 0.5 5.3 2.2 3.1 5.2 1.9 0.7 3.8Other services 4.7 3.2 5.3 14.8 -6.7 3.5 0.9 0.8 2.9 4.7 0.8 -2.4 2.3BDP total, basic prices 3.4 4.7 3.3 4.7 4.9 3.4 4.4 3.0 4.3 4.4 6.0 7.0 3.2
Source: SORS, various years.
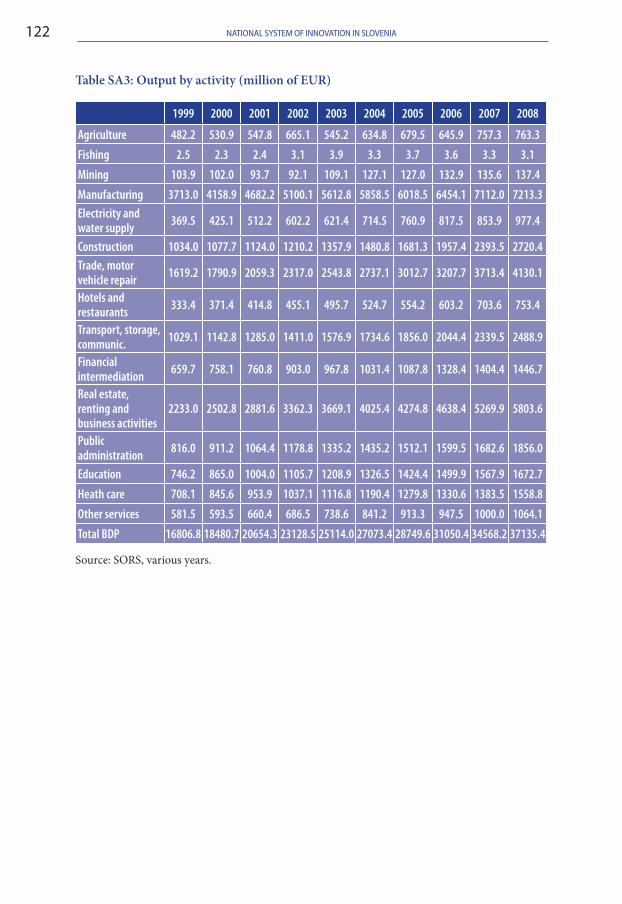
NatioNal system of iNNovatioN iN sloveNia122
Table SA3: Output by activity (million of EUR)
1999 2000 2001 2002 2003 2004 2005 2006 2007 2008
Agriculture 482.2 530.9 547.8 665.1 545.2 634.8 679.5 645.9 757.3 763.3
Fishing 2.5 2.3 2.4 3.1 3.9 3.3 3.7 3.6 3.3 3.1
Mining 103.9 102.0 93.7 92.1 109.1 127.1 127.0 132.9 135.6 137.4
Manufacturing 3713.0 4158.9 4682.2 5100.1 5612.8 5858.5 6018.5 6454.1 7112.0 7213.3Electricity and water supply 369.5 425.1 512.2 602.2 621.4 714.5 760.9 817.5 853.9 977.4
Construction 1034.0 1077.7 1124.0 1210.2 1357.9 1480.8 1681.3 1957.4 2393.5 2720.4Trade, motor vehicle repair 1619.2 1790.9 2059.3 2317.0 2543.8 2737.1 3012.7 3207.7 3713.4 4130.1
Hotels and restaurants 333.4 371.4 414.8 455.1 495.7 524.7 554.2 603.2 703.6 753.4
Transport, storage, communic. 1029.1 1142.8 1285.0 1411.0 1576.9 1734.6 1856.0 2044.4 2339.5 2488.9
Financial intermediation 659.7 758.1 760.8 903.0 967.8 1031.4 1087.8 1328.4 1404.4 1446.7
Real estate, renting and business activities
2233.0 2502.8 2881.6 3362.3 3669.1 4025.4 4274.8 4638.4 5269.9 5803.6
Public administration 816.0 911.2 1064.4 1178.8 1335.2 1435.2 1512.1 1599.5 1682.6 1856.0
Education 746.2 865.0 1004.0 1105.7 1208.9 1326.5 1424.4 1499.9 1567.9 1672.7
Heath care 708.1 845.6 953.9 1037.1 1116.8 1190.4 1279.8 1330.6 1383.5 1558.8
Other services 581.5 593.5 660.4 686.5 738.6 841.2 913.3 947.5 1000.0 1064.1
Total BDP 16806.8 18480.7 20654.3 23128.5 25114.0 27073.4 28749.6 31050.4 34568.2 37135.4
Source: SORS, various years.
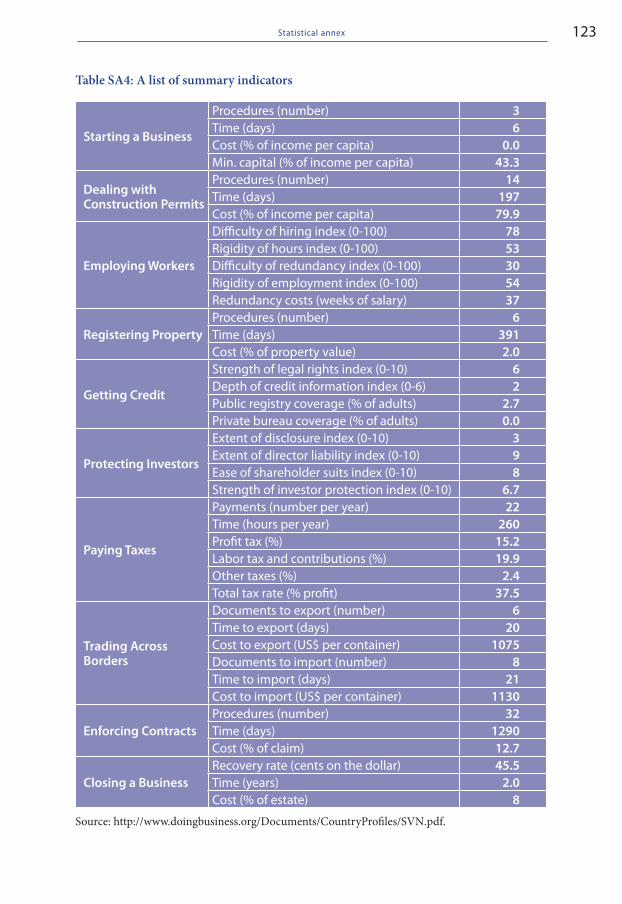
123statistical annex
Table SA4: A list of summary indicators
starting a business
Procedures (number) 3Time (days) 6Cost (% of income per capita) 0.0Min. capital (% of income per capita) 43.3
dealing with Construction Permits
Procedures (number) 14Time (days) 197Cost (% of income per capita) 79.9
employing Workers
Difficulty of hiring index (0-100) 78Rigidity of hours index (0-100) 53Difficulty of redundancy index (0-100) 30Rigidity of employment index (0-100) 54Redundancy costs (weeks of salary) 37
Registering PropertyProcedures (number) 6Time (days) 391Cost (% of property value) 2.0
getting Credit
Strength of legal rights index (0-10) 6Depth of credit information index (0-6) 2Public registry coverage (% of adults) 2.7Private bureau coverage (% of adults) 0.0
Protecting investors
Extent of disclosure index (0-10) 3Extent of director liability index (0-10) 9Ease of shareholder suits index (0-10) 8Strength of investor protection index (0-10) 6.7
Paying taxes
Payments (number per year) 22Time (hours per year) 260Profit tax (%) 15.2Labor tax and contributions (%) 19.9Other taxes (%) 2.4Total tax rate (% profit) 37.5
trading across borders
Documents to export (number) 6Time to export (days) 20Cost to export (US$ per container) 1075Documents to import (number) 8Time to import (days) 21Cost to import (US$ per container) 1130
enforcing Contracts Procedures (number) 32Time (days) 1290Cost (% of claim) 12.7
Closing a business Recovery rate (cents on the dollar) 45.5Time (years) 2.0Cost (% of estate) 8
Source: http://www.doingbusiness.org/Documents/CountryProfiles/SVN.pdf.
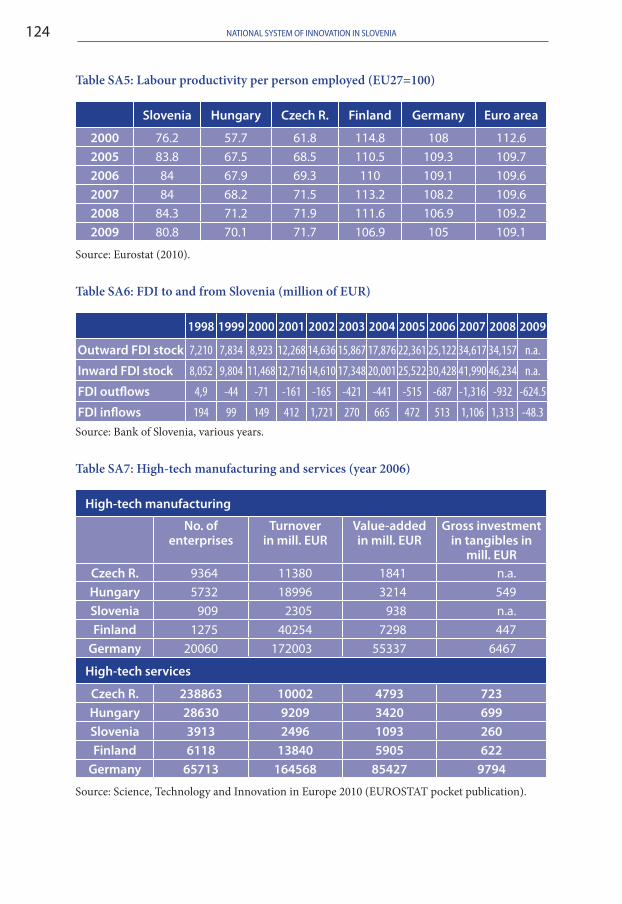
NatioNal system of iNNovatioN iN sloveNia124
Table SA5: Labour productivity per person employed (EU27=100)
slovenia Hungary Czech R. finland germany euro area
2000 76.2 57.7 61.8 114.8 108 112.62005 83.8 67.5 68.5 110.5 109.3 109.72006 84 67.9 69.3 110 109.1 109.62007 84 68.2 71.5 113.2 108.2 109.62008 84.3 71.2 71.9 111.6 106.9 109.22009 80.8 70.1 71.7 106.9 105 109.1
Source: Eurostat (2010).
Table SA6: FDI to and from Slovenia (million of EUR)
1998 1999 2000 2001 2002 2003 2004 2005 2006 2007 2008 2009
outward fdi stock 7,210 7,834 8,923 12,268 14,636 15,867 17,876 22,361 25,122 34,617 34,157 n.a.
inward fdi stock 8,052 9,804 11,468 12,716 14,610 17,348 20,001 25,522 30,428 41,990 46,234 n.a.
fdi outflows 4,9 -44 -71 -161 -165 -421 -441 -515 -687 -1,316 -932 -624.5
fdi inflows 194 99 149 412 1,721 270 665 472 513 1,106 1,313 -48.3Source: Bank of Slovenia, various years.
Table SA7: High-tech manufacturing and services (year 2006)
High-tech manufacturing
No. of enterprises
turnover in mill. euR
value-added in mill. euR
gross investment in tangibles in
mill. euRCzech R. 9364 11380 1841 n.a.Hungary 5732 18996 3214 549slovenia 909 2305 938 n.a.finland 1275 40254 7298 447
germany 20060 172003 55337 6467
High-tech services
Czech R. 238863 10002 4793 723Hungary 28630 9209 3420 699slovenia 3913 2496 1093 260finland 6118 13840 5905 622
germany 65713 164568 85427 9794
Source: Science, Technology and Innovation in Europe 2010 (EUROSTAT pocket publication).
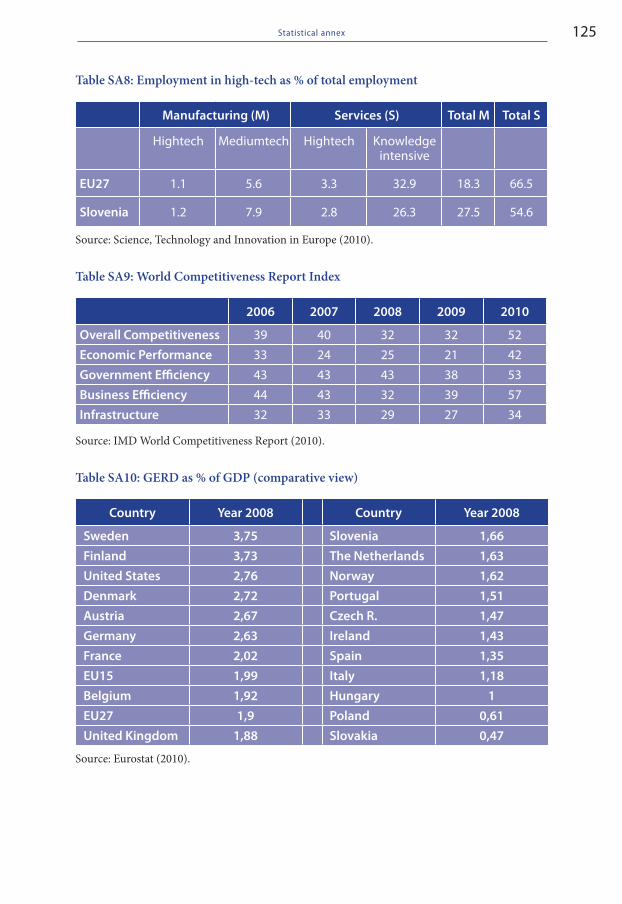
125statistical annex
Table SA8: Employment in high-tech as % of total employment
manufacturing (m) services (s) total m total s
Hightech Mediumtech Hightech Knowledge intensive
eu27 1.1 5.6 3.3 32.9 18.3 66.5
slovenia 1.2 7.9 2.8 26.3 27.5 54.6
Source: Science, Technology and Innovation in Europe (2010).
Table SA9: World Competitiveness Report Index
2006 2007 2008 2009 2010
overall Competitiveness 39 40 32 32 52economic Performance 33 24 25 21 42government efficiency 43 43 43 38 53business efficiency 44 43 32 39 57infrastructure 32 33 29 27 34
Source: IMD World Competitiveness Report (2010).
Table SA10: GERD as % of GDP (comparative view)
Country year 2008 Country year 2008
sweden 3,75 slovenia 1,66finland 3,73 the Netherlands 1,63united states 2,76 Norway 1,62denmark 2,72 Portugal 1,51austria 2,67 Czech R. 1,47germany 2,63 ireland 1,43france 2,02 spain 1,35eu15 1,99 italy 1,18belgium 1,92 Hungary 1eu27 1,9 Poland 0,61united Kingdom 1,88 slovakia 0,47
Source: Eurostat (2010).
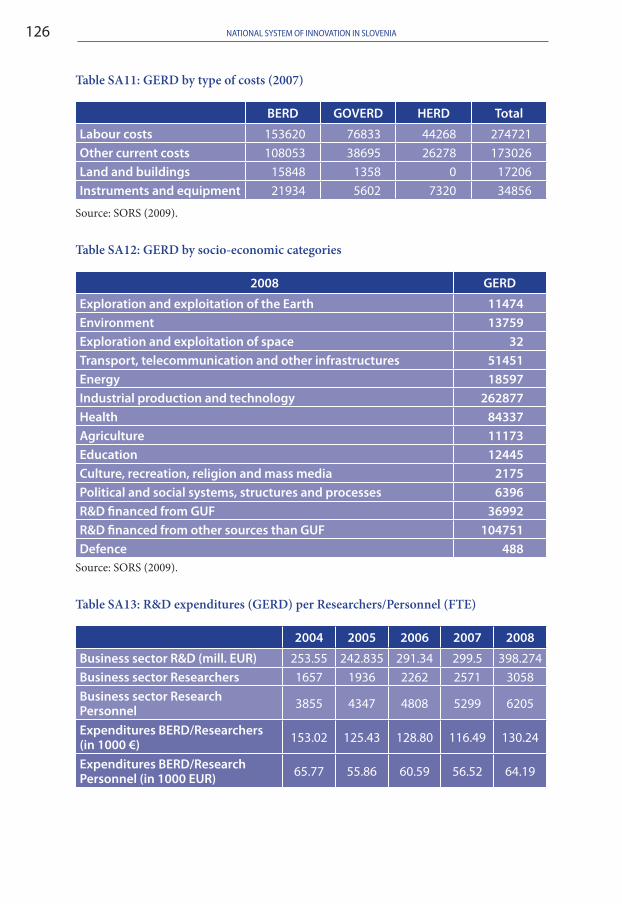
NatioNal system of iNNovatioN iN sloveNia126
Table SA11: GERD by type of costs (2007)
beRd goveRd HeRd total
labour costs 153620 76833 44268 274721other current costs 108053 38695 26278 173026land and buildings 15848 1358 0 17206instruments and equipment 21934 5602 7320 34856
Source: SORS (2009).
Table SA12: GERD by socio-economic categories
2008 geRd
exploration and exploitation of the earth 11474environment 13759exploration and exploitation of space 32transport, telecommunication and other infrastructures 51451energy 18597industrial production and technology 262877Health 84337agriculture 11173education 12445Culture, recreation, religion and mass media 2175Political and social systems, structures and processes 6396R&d financed from guf 36992R&d financed from other sources than guf 104751defence 488
Source: SORS (2009).
Table SA13: R&D expenditures (GERD) per Researchers/Personnel (FTE)
2004 2005 2006 2007 2008
business sector R&d (mill. euR) 253.55 242.835 291.34 299.5 398.274business sector Researchers 1657 1936 2262 2571 3058business sector Research Personnel 3855 4347 4808 5299 6205
expenditures beRd/Researchers (in 1000 €) 153.02 125.43 128.80 116.49 130.24
expenditures beRd/Research Personnel (in 1000 euR) 65.77 55.86 60.59 56.52 64.19
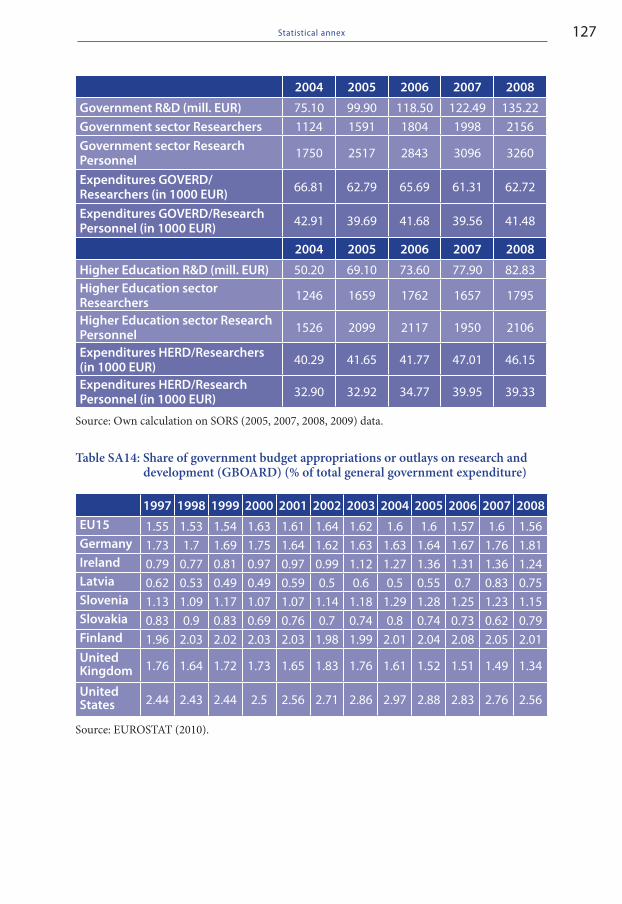
127statistical annex
2004 2005 2006 2007 2008
government R&d (mill. euR) 75.10 99.90 118.50 122.49 135.22government sector Researchers 1124 1591 1804 1998 2156government sector Research Personnel 1750 2517 2843 3096 3260
expenditures goveRd/Researchers (in 1000 euR) 66.81 62.79 65.69 61.31 62.72
expenditures goveRd/Research Personnel (in 1000 euR) 42.91 39.69 41.68 39.56 41.48
2004 2005 2006 2007 2008
Higher education R&d (mill. euR) 50.20 69.10 73.60 77.90 82.83Higher education sector Researchers 1246 1659 1762 1657 1795
Higher education sector Research Personnel 1526 2099 2117 1950 2106
expenditures HeRd/Researchers (in 1000 euR) 40.29 41.65 41.77 47.01 46.15
expenditures HeRd/Research Personnel (in 1000 euR) 32.90 32.92 34.77 39.95 39.33
Source: Own calculation on SORS (2005, 2007, 2008, 2009) data.
Table SA14: Share of government budget appropriations or outlays on research and development (GBOARD) (% of total general government expenditure)
1997 1998 1999 2000 2001 2002 2003 2004 2005 2006 2007 2008eu15 1.55 1.53 1.54 1.63 1.61 1.64 1.62 1.6 1.6 1.57 1.6 1.56germany 1.73 1.7 1.69 1.75 1.64 1.62 1.63 1.63 1.64 1.67 1.76 1.81ireland 0.79 0.77 0.81 0.97 0.97 0.99 1.12 1.27 1.36 1.31 1.36 1.24latvia 0.62 0.53 0.49 0.49 0.59 0.5 0.6 0.5 0.55 0.7 0.83 0.75slovenia 1.13 1.09 1.17 1.07 1.07 1.14 1.18 1.29 1.28 1.25 1.23 1.15slovakia 0.83 0.9 0.83 0.69 0.76 0.7 0.74 0.8 0.74 0.73 0.62 0.79finland 1.96 2.03 2.02 2.03 2.03 1.98 1.99 2.01 2.04 2.08 2.05 2.01united Kingdom 1.76 1.64 1.72 1.73 1.65 1.83 1.76 1.61 1.52 1.51 1.49 1.34
united states 2.44 2.43 2.44 2.5 2.56 2.71 2.86 2.97 2.88 2.83 2.76 2.56
Source: EUROSTAT (2010).
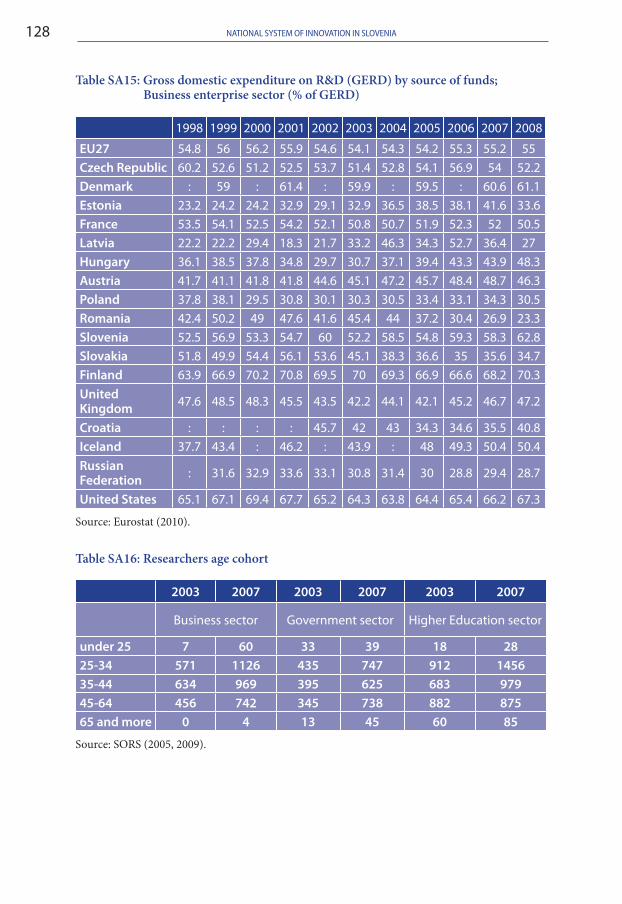
NatioNal system of iNNovatioN iN sloveNia128
Table SA15: Gross domestic expenditure on R&D (GERD) by source of funds; Business enterprise sector (% of GERD)
1998 1999 2000 2001 2002 2003 2004 2005 2006 2007 2008
eu27 54.8 56 56.2 55.9 54.6 54.1 54.3 54.2 55.3 55.2 55Czech Republic 60.2 52.6 51.2 52.5 53.7 51.4 52.8 54.1 56.9 54 52.2denmark : 59 : 61.4 : 59.9 : 59.5 : 60.6 61.1estonia 23.2 24.2 24.2 32.9 29.1 32.9 36.5 38.5 38.1 41.6 33.6france 53.5 54.1 52.5 54.2 52.1 50.8 50.7 51.9 52.3 52 50.5latvia 22.2 22.2 29.4 18.3 21.7 33.2 46.3 34.3 52.7 36.4 27Hungary 36.1 38.5 37.8 34.8 29.7 30.7 37.1 39.4 43.3 43.9 48.3austria 41.7 41.1 41.8 41.8 44.6 45.1 47.2 45.7 48.4 48.7 46.3Poland 37.8 38.1 29.5 30.8 30.1 30.3 30.5 33.4 33.1 34.3 30.5Romania 42.4 50.2 49 47.6 41.6 45.4 44 37.2 30.4 26.9 23.3slovenia 52.5 56.9 53.3 54.7 60 52.2 58.5 54.8 59.3 58.3 62.8slovakia 51.8 49.9 54.4 56.1 53.6 45.1 38.3 36.6 35 35.6 34.7finland 63.9 66.9 70.2 70.8 69.5 70 69.3 66.9 66.6 68.2 70.3united Kingdom 47.6 48.5 48.3 45.5 43.5 42.2 44.1 42.1 45.2 46.7 47.2
Croatia : : : : 45.7 42 43 34.3 34.6 35.5 40.8iceland 37.7 43.4 : 46.2 : 43.9 : 48 49.3 50.4 50.4Russian federation : 31.6 32.9 33.6 33.1 30.8 31.4 30 28.8 29.4 28.7
united states 65.1 67.1 69.4 67.7 65.2 64.3 63.8 64.4 65.4 66.2 67.3
Source: Eurostat (2010).
Table SA16: Researchers age cohort
2003 2007 2003 2007 2003 2007
Business sector Government sector Higher Education sector
under 25 7 60 33 39 18 2825-34 571 1126 435 747 912 145635-44 634 969 395 625 683 97945-64 456 742 345 738 882 87565 and more 0 4 13 45 60 85
Source: SORS (2005, 2009).
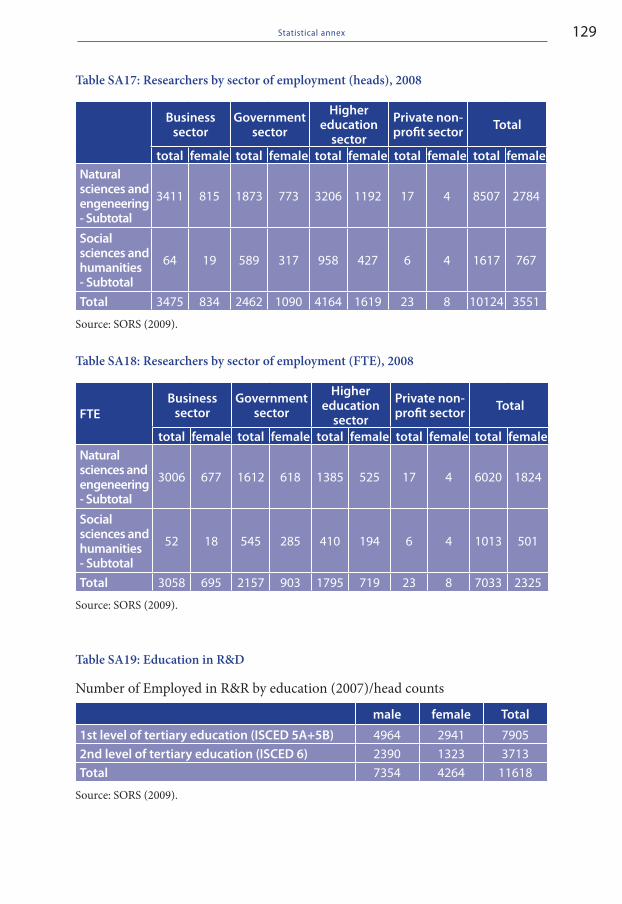
129statistical annex
Table SA17: Researchers by sector of employment (heads), 2008
business sector
government sector
Higher education
sector
Private non-profit sector total
total female total female total female total female total femaleNatural sciences and engeneering - subtotal
3411 815 1873 773 3206 1192 17 4 8507 2784
social sciences and humanities - subtotal
64 19 589 317 958 427 6 4 1617 767
total 3475 834 2462 1090 4164 1619 23 8 10124 3551
Source: SORS (2009).
Table SA18: Researchers by sector of employment (FTE), 2008
ftebusiness
sectorgovernment
sector
Higher education
sector
Private non-profit sector total
total female total female total female total female total femaleNatural sciences and engeneering - subtotal
3006 677 1612 618 1385 525 17 4 6020 1824
social sciences and humanities - subtotal
52 18 545 285 410 194 6 4 1013 501
total 3058 695 2157 903 1795 719 23 8 7033 2325
Source: SORS (2009).
Table SA19: Education in R&D
Number of Employed in R&R by education (2007)/head counts
male female total
1st level of tertiary education (isCed 5a+5b) 4964 2941 79052nd level of tertiary education (isCed 6) 2390 1323 3713total 7354 4264 11618
Source: SORS (2009).
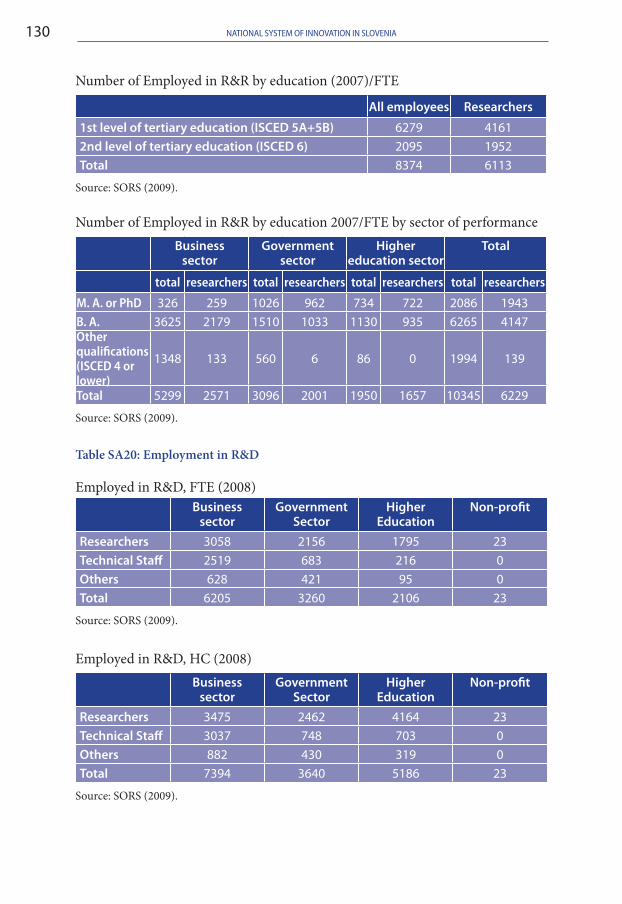
NatioNal system of iNNovatioN iN sloveNia130
Number of Employed in R&R by education (2007)/FTE
all employees Researchers
1st level of tertiary education (isCed 5a+5b) 6279 41612nd level of tertiary education (isCed 6) 2095 1952total 8374 6113
Source: SORS (2009).
Number of Employed in R&R by education 2007/FTE by sector of performance business
sectorgovernment
sectorHigher
education sectortotal
total researchers total researchers total researchers total researchers
M. A. or PhD 326 259 1026 962 734 722 2086 1943B. A. 3625 2179 1510 1033 1130 935 6265 4147Other qualifications (ISCED 4 or lower)
1348 133 560 6 86 0 1994 139
Total 5299 2571 3096 2001 1950 1657 10345 6229
Source: SORS (2009).
Table SA20: Employment in R&D
Employed in R&D, FTE (2008) business
sectorgovernment
sectorHigher
educationNon-profit
Researchers 3058 2156 1795 23technical staff 2519 683 216 0others 628 421 95 0total 6205 3260 2106 23
Source: SORS (2009).
Employed in R&D, HC (2008) business
sectorgovernment
sectorHigher
educationNon-profit
Researchers 3475 2462 4164 23technical staff 3037 748 703 0others 882 430 319 0total 7394 3640 5186 23
Source: SORS (2009).
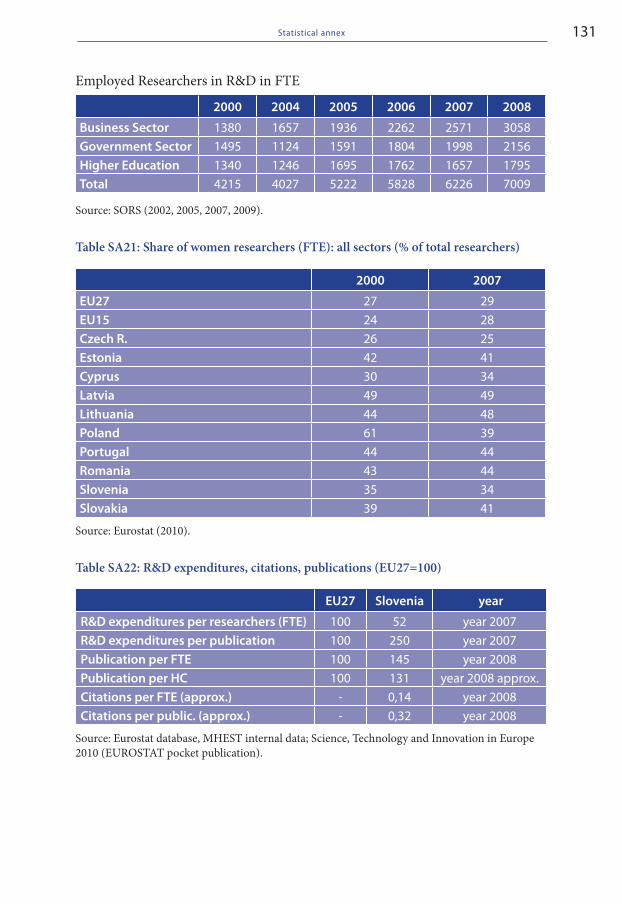
131statistical annex
Employed Researchers in R&D in FTE
2000 2004 2005 2006 2007 2008
business sector 1380 1657 1936 2262 2571 3058government sector 1495 1124 1591 1804 1998 2156Higher education 1340 1246 1695 1762 1657 1795total 4215 4027 5222 5828 6226 7009
Source: SORS (2002, 2005, 2007, 2009).
Table SA21: Share of women researchers (FTE): all sectors (% of total researchers)
2000 2007
eu27 27 29eu15 24 28Czech R. 26 25estonia 42 41Cyprus 30 34latvia 49 49lithuania 44 48Poland 61 39Portugal 44 44Romania 43 44slovenia 35 34slovakia 39 41
Source: Eurostat (2010).
Table SA22: R&D expenditures, citations, publications (EU27=100)
eu27 slovenia year
R&d expenditures per researchers (fte) 100 52 year 2007R&d expenditures per publication 100 250 year 2007Publication per fte 100 145 year 2008Publication per HC 100 131 year 2008 approx.Citations per fte (approx.) - 0,14 year 2008Citations per public. (approx.) - 0,32 year 2008
Source: Eurostat database, MHEST internal data; Science, Technology and Innovation in Europe 2010 (EUROSTAT pocket publication).
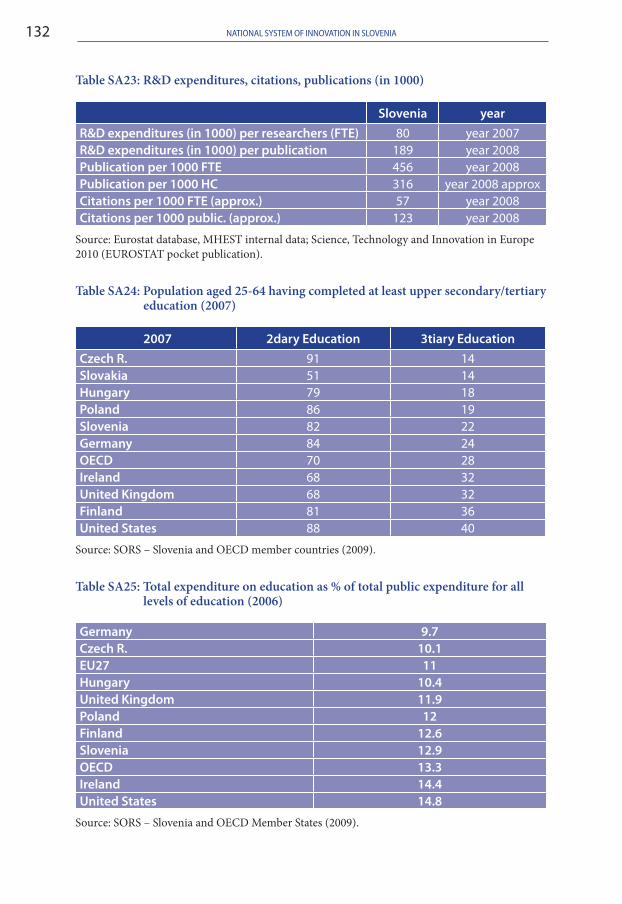
NatioNal system of iNNovatioN iN sloveNia132
Table SA23: R&D expenditures, citations, publications (in 1000)
slovenia yearR&d expenditures (in 1000) per researchers (fte) 80 year 2007R&d expenditures (in 1000) per publication 189 year 2008Publication per 1000 fte 456 year 2008Publication per 1000 HC 316 year 2008 approxCitations per 1000 fte (approx.) 57 year 2008Citations per 1000 public. (approx.) 123 year 2008
Source: Eurostat database, MHEST internal data; Science, Technology and Innovation in Europe 2010 (EUROSTAT pocket publication).
Table SA24: Population aged 25-64 having completed at least upper secondary/tertiary education (2007)
2007 2dary education 3tiary educationCzech R. 91 14slovakia 51 14Hungary 79 18Poland 86 19slovenia 82 22germany 84 24oeCd 70 28ireland 68 32united Kingdom 68 32finland 81 36united states 88 40
Source: SORS – Slovenia and OECD member countries (2009).
Table SA25: Total expenditure on education as % of total public expenditure for all levels of education (2006)
germany 9.7Czech R. 10.1eu27 11Hungary 10.4united Kingdom 11.9Poland 12finland 12.6slovenia 12.9oeCd 13.3ireland 14.4united states 14.8
Source: SORS – Slovenia and OECD Member States (2009).
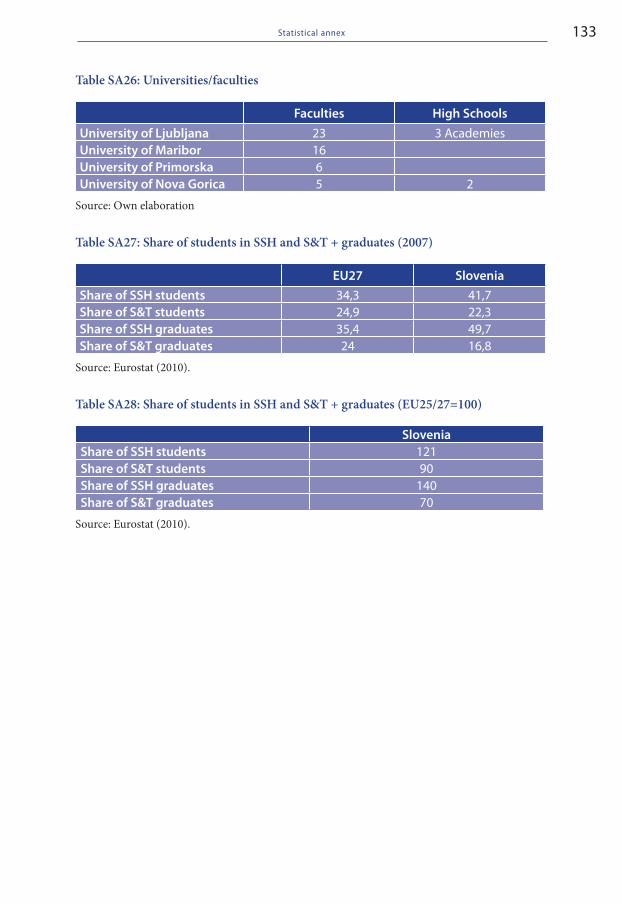
133statistical annex
Table SA26: Universities/faculties
faculties High schoolsuniversity of ljubljana 23 3 Academiesuniversity of maribor 16university of Primorska 6university of Nova gorica 5 2
Source: Own elaboration
Table SA27: Share of students in SSH and S&T + graduates (2007)
eu27 sloveniashare of ssH students 34,3 41,7share of s&t students 24,9 22,3share of ssH graduates 35,4 49,7share of s&t graduates 24 16,8
Source: Eurostat (2010).
Table SA28: Share of students in SSH and S&T + graduates (EU25/27=100)
sloveniashare of ssH students 121share of s&t students 90share of ssH graduates 140share of s&t graduates 70
Source: Eurostat (2010).
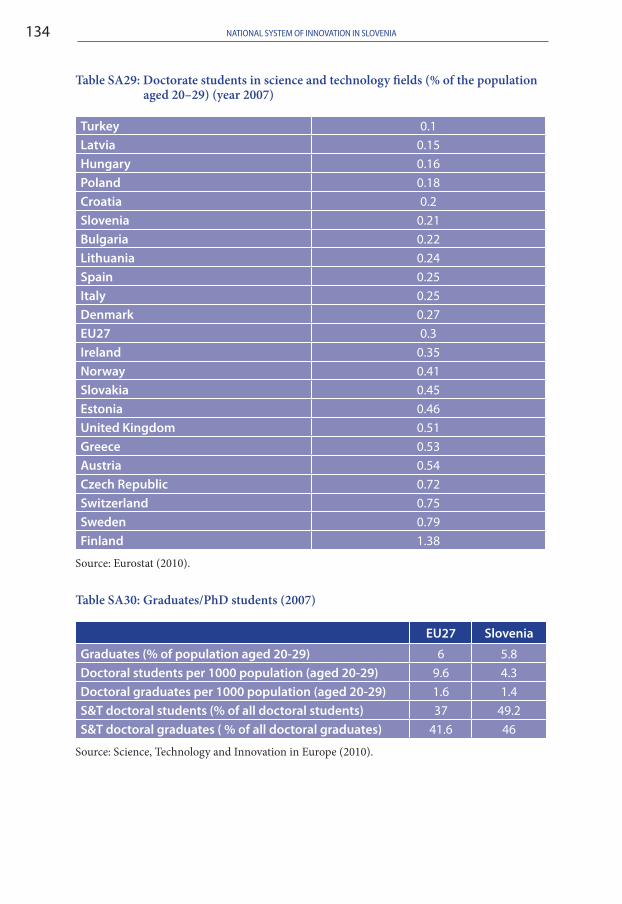
NatioNal system of iNNovatioN iN sloveNia134
Table SA29: Doctorate students in science and technology fields (% of the population aged 20–29) (year 2007)
turkey 0.1latvia 0.15Hungary 0.16Poland 0.18Croatia 0.2slovenia 0.21bulgaria 0.22lithuania 0.24spain 0.25italy 0.25denmark 0.27eu27 0.3ireland 0.35Norway 0.41slovakia 0.45estonia 0.46united Kingdom 0.51greece 0.53austria 0.54Czech Republic 0.72switzerland 0.75sweden 0.79finland 1.38
Source: Eurostat (2010).
Table SA30: Graduates/PhD students (2007)
eu27 slovenia
graduates (% of population aged 20-29) 6 5.8doctoral students per 1000 population (aged 20-29) 9.6 4.3doctoral graduates per 1000 population (aged 20-29) 1.6 1.4s&t doctoral students (% of all doctoral students) 37 49.2s&t doctoral graduates ( % of all doctoral graduates) 41.6 46
Source: Science, Technology and Innovation in Europe (2010).
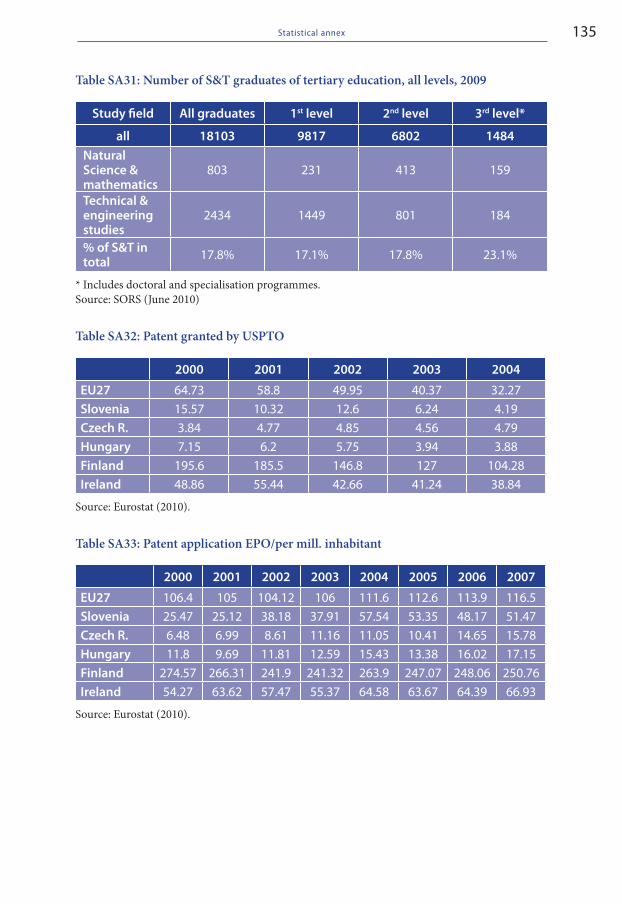
135statistical annex
Table SA31: Number of S&T graduates of tertiary education, all levels, 2009
study field all graduates 1st level 2nd level 3rd level*
all 18103 9817 6802 1484Natural science & mathematics
803 231 413 159
technical & engineering studies
2434 1449 801 184
% of s&t in total 17.8% 17.1% 17.8% 23.1%
* Includes doctoral and specialisation programmes.Source: SORS (June 2010)
Table SA32: Patent granted by USPTO
2000 2001 2002 2003 2004
eu27 64.73 58.8 49.95 40.37 32.27slovenia 15.57 10.32 12.6 6.24 4.19Czech R. 3.84 4.77 4.85 4.56 4.79Hungary 7.15 6.2 5.75 3.94 3.88finland 195.6 185.5 146.8 127 104.28ireland 48.86 55.44 42.66 41.24 38.84
Source: Eurostat (2010).
Table SA33: Patent application EPO/per mill. inhabitant
2000 2001 2002 2003 2004 2005 2006 2007
eu27 106.4 105 104.12 106 111.6 112.6 113.9 116.5slovenia 25.47 25.12 38.18 37.91 57.54 53.35 48.17 51.47Czech R. 6.48 6.99 8.61 11.16 11.05 10.41 14.65 15.78Hungary 11.8 9.69 11.81 12.59 15.43 13.38 16.02 17.15finland 274.57 266.31 241.9 241.32 263.9 247.07 248.06 250.76ireland 54.27 63.62 57.47 55.37 64.58 63.67 64.39 66.93
Source: Eurostat (2010).
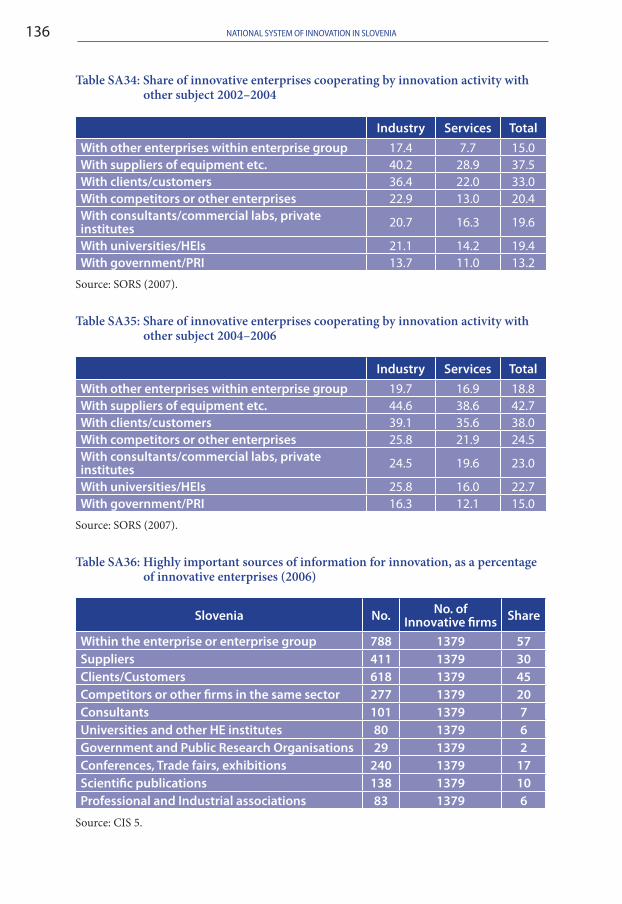
NatioNal system of iNNovatioN iN sloveNia136
Table SA34: Share of innovative enterprises cooperating by innovation activity with other subject 2002–2004
industry services totalWith other enterprises within enterprise group 17.4 7.7 15.0With suppliers of equipment etc. 40.2 28.9 37.5With clients/customers 36.4 22.0 33.0With competitors or other enterprises 22.9 13.0 20.4With consultants/commercial labs, private institutes 20.7 16.3 19.6
With universities/Heis 21.1 14.2 19.4With government/PRi 13.7 11.0 13.2
Source: SORS (2007).
Table SA35: Share of innovative enterprises cooperating by innovation activity with other subject 2004–2006
industry services totalWith other enterprises within enterprise group 19.7 16.9 18.8With suppliers of equipment etc. 44.6 38.6 42.7With clients/customers 39.1 35.6 38.0With competitors or other enterprises 25.8 21.9 24.5With consultants/commercial labs, private institutes 24.5 19.6 23.0
With universities/Heis 25.8 16.0 22.7With government/PRi 16.3 12.1 15.0
Source: SORS (2007).
Table SA36: Highly important sources of information for innovation, as a percentage of innovative enterprises (2006)
slovenia No. No. of innovative firms share
Within the enterprise or enterprise group 788 1379 57suppliers 411 1379 30Clients/Customers 618 1379 45Competitors or other firms in the same sector 277 1379 20Consultants 101 1379 7universities and other He institutes 80 1379 6government and Public Research organisations 29 1379 2Conferences, trade fairs, exhibitions 240 1379 17scientific publications 138 1379 10Professional and industrial associations 83 1379 6
Source: CIS 5.
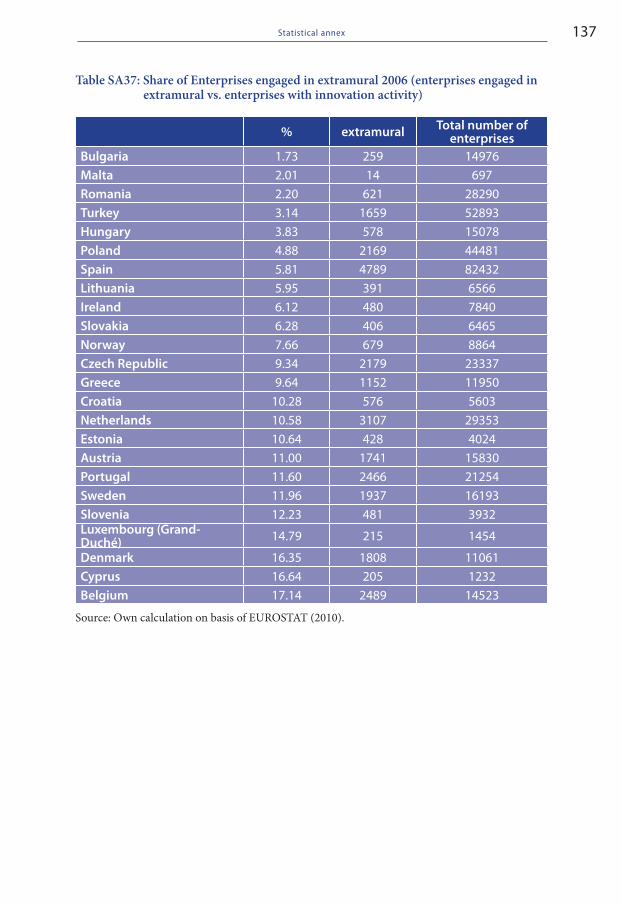
137statistical annex
Table SA37: Share of Enterprises engaged in extramural 2006 (enterprises engaged in extramural vs. enterprises with innovation activity)
% extramural total number of enterprises
bulgaria 1.73 259 14976malta 2.01 14 697Romania 2.20 621 28290turkey 3.14 1659 52893Hungary 3.83 578 15078Poland 4.88 2169 44481spain 5.81 4789 82432lithuania 5.95 391 6566ireland 6.12 480 7840slovakia 6.28 406 6465Norway 7.66 679 8864Czech Republic 9.34 2179 23337greece 9.64 1152 11950Croatia 10.28 576 5603Netherlands 10.58 3107 29353estonia 10.64 428 4024austria 11.00 1741 15830Portugal 11.60 2466 21254sweden 11.96 1937 16193slovenia 12.23 481 3932luxembourg (grand-duché) 14.79 215 1454
denmark 16.35 1808 11061Cyprus 16.64 205 1232belgium 17.14 2489 14523
Source: Own calculation on basis of EUROSTAT (2010).
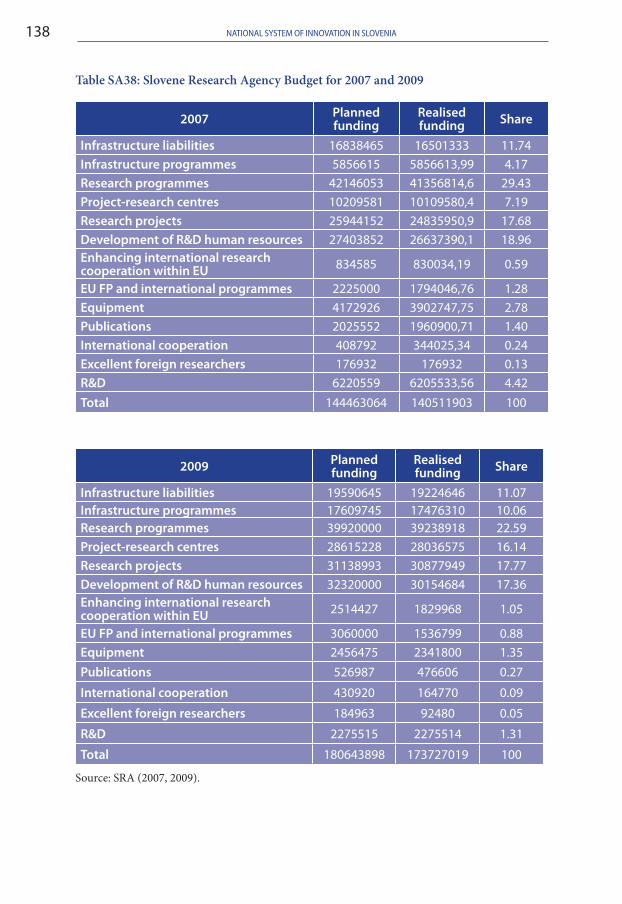
NatioNal system of iNNovatioN iN sloveNia138
Table SA38: Slovene Research Agency Budget for 2007 and 2009
2007 Planned funding
Realised funding share
infrastructure liabilities 16838465 16501333 11.74infrastructure programmes 5856615 5856613,99 4.17Research programmes 42146053 41356814,6 29.43Project-research centres 10209581 10109580,4 7.19Research projects 25944152 24835950,9 17.68development of R&d human resources 27403852 26637390,1 18.96enhancing international research cooperation within eu 834585 830034,19 0.59
eu fP and international programmes 2225000 1794046,76 1.28equipment 4172926 3902747,75 2.78Publications 2025552 1960900,71 1.40international cooperation 408792 344025,34 0.24excellent foreign researchers 176932 176932 0.13R&d 6220559 6205533,56 4.42total 144463064 140511903 100
2009 Planned funding
Realised funding share
infrastructure liabilities 19590645 19224646 11.07infrastructure programmes 17609745 17476310 10.06Research programmes 39920000 39238918 22.59Project-research centres 28615228 28036575 16.14Research projects 31138993 30877949 17.77development of R&d human resources 32320000 30154684 17.36enhancing international research cooperation within eu 2514427 1829968 1.05
eu fP and international programmes 3060000 1536799 0.88equipment 2456475 2341800 1.35Publications 526987 476606 0.27
international cooperation 430920 164770 0.09
excellent foreign researchers 184963 92480 0.05
R&d 2275515 2275514 1.31
total 180643898 173727019 100
Source: SRA (2007, 2009).
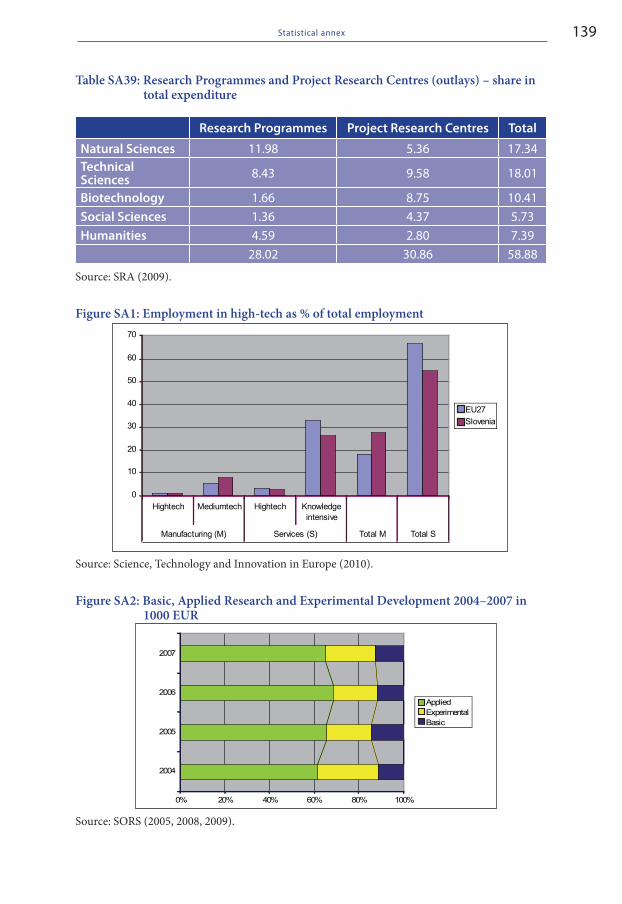
139statistical annex
Table SA39: Research Programmes and Project Research Centres (outlays) – share in total expenditure
Research Programmes Project Research Centres total
Natural sciences 11.98 5.36 17.34technical sciences 8.43 9.58 18.01
biotechnology 1.66 8.75 10.41social sciences 1.36 4.37 5.73Humanities 4.59 2.80 7.39
28.02 30.86 58.88
Source: SRA (2009).
Figure SA1: Employment in high-tech as % of total employment
Source: Science, Technology and Innovation in Europe (2010).
Figure SA2: Basic, Applied Research and Experimental Development 2004–2007 in 1000 EUR
Source: SORS (2005, 2008, 2009).
0
10
20
30
40
50
60
70
Hightech Mediumtech Hightech Knowledgeintensive
Manufacturing (M) Services (S) Total M Total S
EU27Slovenia
0% 20% 40% 60% 80% 100%
2004
2005
2006
2007
Year
AppliedExperimentalBasic
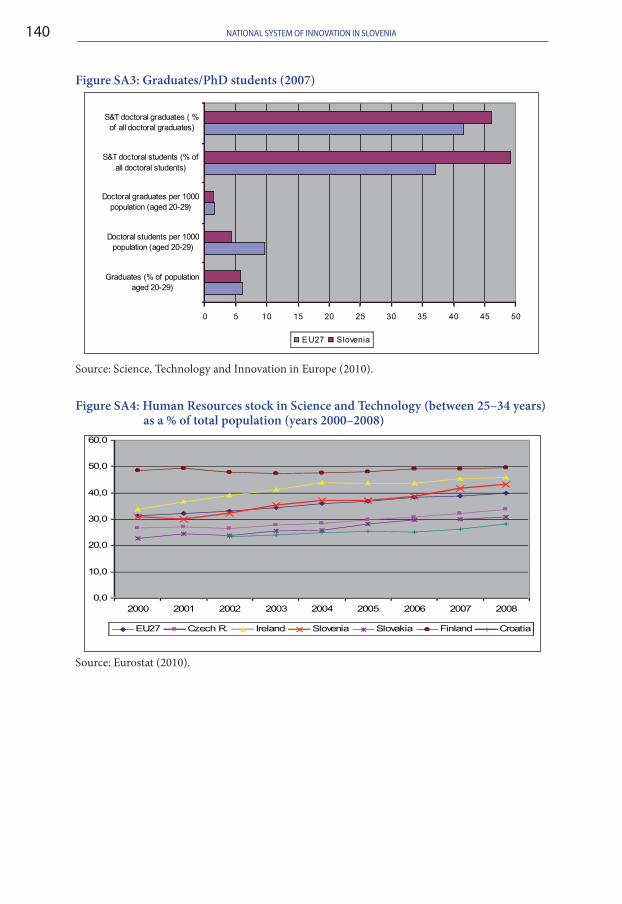
NatioNal system of iNNovatioN iN sloveNia140
Figure SA3: Graduates/PhD students (2007)
Source: Science, Technology and Innovation in Europe (2010).
Figure SA4: Human Resources stock in Science and Technology (between 25–34 years) as a % of total population (years 2000–2008)
Source: Eurostat (2010).
0 5 10 15 20 25 30 35 40 45 50
Graduates (% of populationaged 20-29)
Doctoral students per 1000population (aged 20-29)
Doctoral graduates per 1000population (aged 20-29)
S&T doctoral students (% ofall doctoral students)
S&T doctoral graduates ( %of all doctoral graduates)
EU27 Slovenia
0,0
10,0
20,0
30,0
40,0
50,0
60,0
2000 2001 2002 2003 2004 2005 2006 2007 2008
EU27 Czech R. Ireland Slovenia Slovakia Finland Croatia
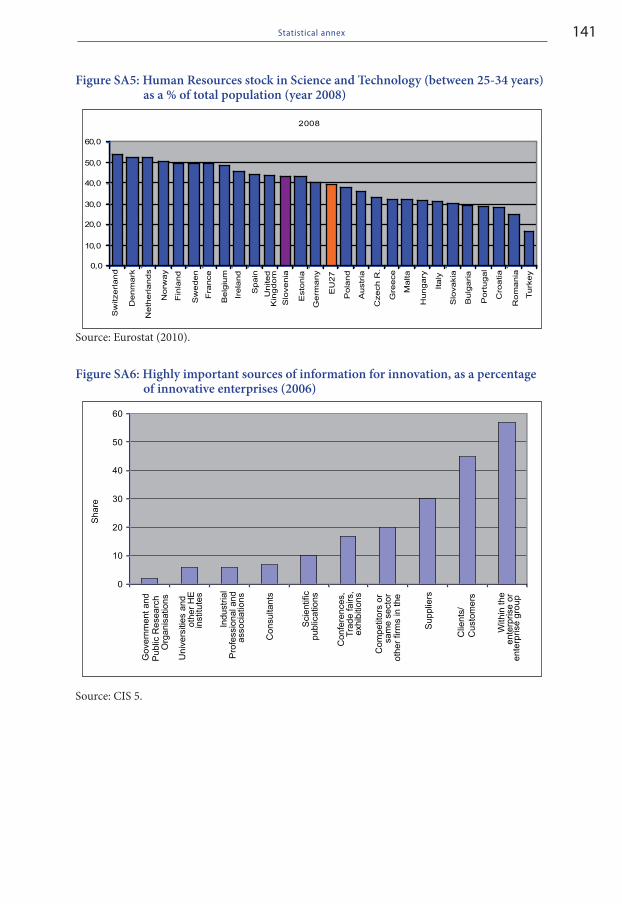
141statistical annex
Figure SA5: Human Resources stock in Science and Technology (between 25-34 years) as a % of total population (year 2008)
Source: Eurostat (2010).
Figure SA6: Highly important sources of information for innovation, as a percentage of innovative enterprises (2006)
Source: CIS 5.
2008
0,0
10,0
20,0
30,0
40,0
50,0
60,0
Sw
itze
rla
nd
De
nm
ark
Ne
the
rla
nd
s
No
rwa
y
Fin
lan
d
Sw
ed
en
Fra
nce
Be
lgiu
m
Ire
lan
d
Un
ite
d
Kin
gd
om
Sp
ain
Slo
ve
nia
Esto
nia
Ge
rma
ny
EU
27
Po
lan
d
Au
str
ia
Cze
ch
R.
Gre
ece
Ma
lta
Hu
ng
ary
Ita
ly
Slo
va
kia
Bu
lga
ria
Po
rtu
ga
l
Cro
atia
Ro
ma
nia
Tu
rke
y
0
10
20
30
40
50
60
Go
vern
me
nt
an
dP
ub
lic R
ese
arc
hO
rga
nis
atio
ns
Un
ive
rsiti
es
an
do
the
r H
E
Pro
fess
ion
al a
nd
Ind
ust
rial
ass
oci
atio
ns
Co
nsu
ltan
ts
Sci
en
tific
pu
blic
atio
ns
Co
nfe
ren
ces,
Tra
de
fa
irs,
exh
ibiti
on
s
Co
mp
etit
ors
or
oth
er
firm
s in
th
esa
me
se
cto
r
Su
pp
liers
Clie
nts
/C
ust
om
ers
With
in t
he
en
terp
rise
or
en
terp
rise
gro
up
Sh
are
inst
itute
s

143
RefeReNCes
Bank of Slovenia (2010) Monthly Bulletin, April 2010. Slovenia: Bank of Slovenia. Bank of Slovenia (2010) Monthly Bulletin, June 2010. Slovenia: Bank of Slovenia. Bank of Slovenia (2010) Price stability Report, April 2010. Slovenia: Bank of Slovenia. Bevc, M. (2009) Analiza trendov v emigraciji in meddržavni mobilnosti znanstvenikov
v državah EU in OECD. Študija v okviru projekta »Beg možganov med raziskovalci v sloveniji s posebnim ozirom na absolvente Programa mladih raziskovalcev in Programa mladih raziskovalcev za gospodarstvo«. Ljubljana: Inštitut za ekonomska raziskovanja.
Bučar, M. (2009) ERAWATCH Country Report 2008: An assessment of research system and policies in slovenia. JRC Scientific and Technical Reports. Luxembourg: Office for Of-ficial Publications of the European Communities.
Bučar, M. (2009) ERAWATCH Country Report 2009: Analysis of policy mixes to foster R&D investment and to contribute to the ERA slovenia. JRC Scientific and Technical Reports. Luxembourg: Office for Official Publications of the European Communities.
Bučar, M., A. Burger, B. Udovič, D. Kavaš, K. Koman, S. Knežević and P. Stanovnik (2010) Učinkovitost ukrepov Ministrstva za visoko šolstvo, znanost in tehnologijo za spodbu-janje inovacij in tehnološkega razvoja v slovenskih podjetij v letih 2005–2007: ciljni raziskovalni program. (Effectiveness of the MHEST measures for promotion of innova-tion and technology development in Slovenian enterprises in 2005–2007). Ljubljana: Fakulteta za družbene vede.
Bučar, M. and M. Rojec (2009) Cases of science-industry cooperation in slovenian food and chemical industries, (Electronic book series CIR Analyses). Ljubljana: Faculty of Social Sci-ences. Available at: http://www.mednarodni-odnosi.si/cmo/CIR/CIR1BucarRojec.pdf .
Bučar, M., M. Rojec and M. Stare (2009) Backward FDI linkages as a channel for transfer-Backward FDI linkages as a channel for transfer-ring technology and building innovation capability: the case of Slovenia. European journal of development research 21 (1): 137–53. Available at: http://www.palgrave-jour-nals.com/ejdr/journal/v21/n1/full/ejdr2008110a.html.
Bučar, M. and M. Stare (2006) From quantity to quality: critical assessment of Slovenia’s potential for knowledge-based growth. In K. Piech and S. Radošević (eds.) The knowl-edge-based economy in Central and Eastern Europe: countries and industries in a process of change, 239–55. Basingstoke and New York: Palgrave Macmillan.
Bučar M. and M. Stare (2010) From Policy Imitation to Policy Learning: governance of innovation policy in the new EU member states. GARNET’s JERP 5.3.6: “Technology, Innovation and Governance”. Policy brief No.3.
Bučar, M. and P. Stanovnik (1999) Some Implications for the Science and Technology System in a Transition Economy: the Case of Slovenia. In C. Brundenius et al. (eds.) Reconstruction or Destruction? s&T at stake in Transition Economies, 97–125. Hydera-bad: Universities Press (India) Ltd.
Burger, A., A. Jaklič and M. Rojec (2008) Exporting and company performance in Slov-enia: self-selection and/or learning by exporting? Ekon. čas. 56 (2): 131–53.
NatioNal system of iNNovatioN iN sloveNia144
Damijan Pavlič, J., Č. Kostevc, and M. Rojec (2009) Does Innovation Help the Good or the Poor Performing Firms? LICOS Discussion Paper No. 230/2009.
Damijan Pavlič, J., Č. Kostevc and S. Polanec (2010) From innovation to exporting or vice versa? The World Economy 32 (2): 374–98.
Economist Intelligence Unit (2009) A new ranking of the world’s most innovative countries; An EIU report, April 2009, sponsored by Cisco. Available at: http://graphics.eiu.com/PDF/Cisco_Innovation_Complete.pdf.
Economist Intelligence Unit (2010) A time for new ideas: Innovation in Central Eastern Europe.
Edquist, C., ed. (1997) systems of Innovation: Technologies, Institutions, and Organizations. London: Pinter Publisher.
ERAWATCH research inventory (2008) Data on slovenian R&D. Available at: http://cordis.europa.eu/erawatch/index.cfm?fuseaction=search.resultList.
EU (2002) EU Innovation Trend Chart on Innovation: Country Report on slovenia 2001–2002, prepared by Economist Intelligence Unit.
EU (2003) EU Innovation Trend Chart on Innovation: Country Report on slovenia, March 2003. Available at: http://www.proinno-europe.eu/page/innovation-and-innovation-policy-slovenia.
EU (2004) EU Innovation Trend Chart on Innovation: Country Report on slovenia, septem-ber 2003–August 2004. Available at: http://www.proinno-europe.eu/page/innovation-and-innovation-policy-slovenia.
EU (2005) EU Innovation Trend Chart on Innovation: Country Report on slovenia 2004–2005, Available at: http://trendchart.cordis.lu/country_reports.cfm.
EU (2007) EU Innovation Trend Chart on Innovation: Country Report on slovenia 2006–2007. Available at: http://trendchart.cordis.lu/country_reports.cfm.
EU (2008) PRO INNO Innovation Trend Chart on Innovation: Country Report on slov- Trend Chart on Innovation: Country Report on slov-enia 2007. Available at: http://www.proinno-europe.eu/trendchart/annual-country-reports.
EU (2009) PRO INNO Innovation Trend Chart on Innovation: Country Report on slov- Trend Chart on Innovation: Country Report on slov-enia 2008. Available at: http://www.proinno-europe.eu/trendchart/annual-country-reports.
EU (2010) Innovation Trend Chart on Innovation: Country Report on slovenia 2007. Avail-able at: http://www.proinno-europe.eu/trendchart/annual-country-reports.
European Commission (2009) European Innovation scoreboard 2008, Comparative analy-sis of Innovation Performance, INNO Metrics. Available at: http://www.proinno-Eu-rope.eu/index.cfm?fuseaction=page.display&topicID=437&parentID=51.
European Commission (2010) European Innovation scoreboard 2009 Comparative analysis of Innovation Performance, INNO Metrics. Available at: http://www.proinno-europe.eu/page/european-innovation-scoreboard-2009.
Eurostat (2009) Data available at Eurostat webpage. Available at: http://epp.eurostat.ec.europa.eu/portal/page/portal/eurostat/home.
Furman, J. L., M. Porter and S. Stern (2002) The Determinants of National Innovative Capacity. Research Policy 31: 899–933.
IER (2010) Evalvacija programa »Mladi raziskovalci iz gospodarstva« (Evaluation of the programme Young researchers from business sector) in Bučar et al., Učinkovitost ukrepov Ministrstva za visoko šolstvo, znanost in tehnologijo za spodbujanje inovacij in tehnološkega razvoja v slovenskih podjetij v letih 2005–2007: ciljni raziskovalni program. (Effectiveness
145references
of the MHEST measures for promotion of innovation and technology development in Slovenian enterprises in 2005–2007). Ljubljana: Fakulteta za družbene vede.
IMAD (2005) slovenian Development strategy 2006–2013. Ljubljana. Institute for Macr-oeconomic Analysis and Development. Available at: http://www.gov.si/umar/aprojekt/asrs/ssd.php.
IMAD (2010) Development report 2010. Available at: http://www.umar.gov.si/en/publications/?no_cache=1.
INNO – Policy TrendChart – Policy Trends and Appraisal Report SLOVENIA 2008. Available at: http://www.proinno-Europe.eu/extranet/upload/countryreports/Coun-try_Report_Slovenia_2008.pdf.
Jaklič, A. (2006) Razvojna vloga slovenskih multinacionalk. Teorija in praksa 43 (1/2): 123–44.
Jaklič, A. (2007) Creating multinational enterprises in transition economies: examining the impact of firms’ factor endowments in Slovenia. Economic and Business Review 9 (1): 79 –102.
Jaklič, A., J. Damijan and M. Rojec (2008) Innovation cooperation and innovation activity of slovenian enterprises. LICOS discussion paper series 201/2008.
Jaklič, A. and M. Svetličič (2003) The outward direct investment from CEECs: can their firms compete in the global market? Journal for East European management studies 8(1): 67–83.
Kotnik, P. (2005) Innovative and R&D activities of Slovenian firms. In J. Prašnikar (ed.) Me-dium-sized firms and economic growth, 157–68. New York: Nova Science Publishers.
Kozmus, D. and R. Verčko (2010) Pregled človeškega potenciala v raziskovalno razvojni dejavnosti v sloveniji. Mimeo and MVZT.
Law on Research and Development (2002) Official Gazette of the Rep. of slovenia, Nov. 2002.
Mali, F. and M. Bučar (2008) Dejavniki prenosa znanja iz akademske sfere v gospodarstvo ter vrednotenje intermediarnih institucij, zaključno poročilo CRP 1000-06-280250.
Mesl, M. and M. Bučar (2008) Evalvacija gospodarske relevance rezultatov in programov centrov odličnosti. Ljubljana: Koncept. Available at: http://www.euskladi.si/publikac-ije/studije_in_vrednotenja/datoteke/Evalvacija%20gospodarske%20relevance%20re-zultatov.pdf.
Ministry of Economy (2007) Programme of Measures to promote entrepreneurship and competitiveness 2007–2013. Available at: http://www.mg.gov.si/fileadmin/mg.gov.si/pageuploads/DPK/Program_ukrepov_angl_071009.pdf.
MHEST (2010) Analiza NRRP 2006–2010 in Analiza Nacionalnega programa visokega šolstva 2007 –2010 (Analysis of national research and development programme 2006–2010 and national programme of higher education 2007–2010). Available at: http://www.mvzt.gov.si/fileadmin/mvzt.gov.si/pageuploads/doc/dokumenti_tehnologija/Inovativna_Slovenija/analiza_NRRP_NPVS.pdf .
Nacionalni strateški referenčni okvir 2007–2013 (National Strategic Reference Framework 2007–2013). Available at: http://www.svlr.gov.si/fileadmin/svlsrp.gov.si/pageuploads/KOHEZIJA/kohezija-200207/nsro-vlada-150207_koncno.pdf.
The Ministry of Higher education, Science and Technology (2005) National Research and Development Programme 2006–2010. Available at: http://www.uradni-list.si/1/content?id=67936.
NatioNal system of iNNovatioN iN sloveNia146
Office for Growth of the Rep. of Slovenia (2006) The Framework for social and economic reforms for increasing the welfare in slovenia. Available at: http://www.svr.gov.si/filead-min/srs.gov.si/pageuploads/Brosura_Okrvir_reform_ANG.pdf.
Office of Government for Local Self Government and Regional Policy (2007) Operativni program krepitve regionalnih razvojnih potencialov 2007–2013. (Operational Pro-gramme for strengthening regional development potentials 2007–2013. Available at: http://www.svlr.gov.si/fileadmin/svlsrp.gov.si/pageuploads/KOHEZIJA/OP_RR_USKLA-JENO_08_06_07_poslano.pdf.
Rebernik M., P. Tominc and K. Pušnik (2010) slovensko podjetništvo v času krize. GEM Slovenija 2009. Maribor: Ekonomsko-poslovna fakulteta.
Republic of Slovenia (2005) National Reform Programme for Achieving the Lisbon strategy Goals. Available at: http://www.umar.gov.si/fileadmin/user_upload/projects/04_alizb-strategija.pdf.
Republic of Slovenia, Office for growth (2008) National Reform Programme for Achieving the Lisbon strategy Goals – Implementation Report. Available at: http://www.svr.gov.si/fileadmin/srs.gov.si/pageuploads/Dokumenti/SI-NRP2008-en.pdf.
Sorčan, S., F. Demšar and T. Valenci (2008) Znanstveno raziskovanje v sloveniji: prim-erjalna analiza. (Scientific research in Slovenia – comparative analyses). Ljubljana: Javna agencija za razsikovalno dejavnost Republike Slovenije.
SORS (2009) R&D Activity 2007.Available at: http://www.stat.si/eng/novica_prikazi.aspx?ID=2179.
Stare M. and M. Bucar (2007) Service Innovation Policy Mapping Study Slovenia, IPPs Policy Mapping – slovenia.
Stare M. and M. Bucar (2009) Driving Forces of Innovations Towards Services – Inclusive Innovation Policy in the New Member States. socialiniai mokslai 1 (63): 7–14.
SORS (2009) Data available at the Slovenian Statistical Office. Available at: http://www.stat.si/indikatorji.asp?ID=12.
Stanovnik, P., M. Bevc, M. Bučar, S. Kukar, N. Murovec, R. Slabe Ereket, S. Uršič, F. Adam, D. Podmenik and T. Drašič (2006) Konkurenčnost slovenije 2001–2006: analiza uresničevanja ciljev CRP. Ljubljana: Inštitut za ekonomska raziskovanja.
Svetličič, M., A. Jaklič. and A. Burger (2007) Internationalization of small and medium-size enterprises from selected Central European economies. East. Europ. econ. 45 (4): 36–65.
UNCTAD (2009) World Investment Report Transnational Corporations, Agricultural Pro-duction and Development. Geneva: UNCTAD.
Van Stel, A. J., M. A. Carree, and R. Thurik (2005) The Effect of Entrepreneurial Activity on National Economic Growth. small Business Economics 24 (3): 311–21.
WEF (2010) The Global Competitiveness Report 2009–2010. Available at: http://www.wefo-rum.org/documents/GCR09/index.html.
147
A
Agency for Scientific Research (SRA) · 54, 92, 116
B
Bank of Slovenia · 18, 19Barcelona Strategy · 80Barcelona target · 34Bevc, M. · 111Bridging institutions
Centres of excellence · 53, 65, 66, 116Clusters · 53, 57Technology centres · 41, 53, 57, 116Technology platforms · 53
Bučar, M. 34, 45, 46, 55, 67, 68, 115, 116 Burger, A. · 25, 113
C
Citation index · 39CMEPIUS – Centre of the Republic of
Slovenia for Mobility and European Educational and Training Programmes · 111
Cohesion Fund · 74, 95Cohesion regions · 72, 75Competitiveness · 18, 74, 76Consolidation of public finances · 15, 115Co-operative Online Bibliographic System
and Services (COBISS) · 94
D
Damijan J. · 24, 25Domestic demand · 15, 16, 20
E
Economic crisis · 15, 16, 19, 33Economic freedom · 27, 28Economist Intelligence Unit (EIU) · 24,
112, 113Edquist, C. · 13Employment
Unemployment · 18, 20Unemployment rate · 18
Employment protection · 27Endogenous Growth Theory · 24Entrepreneurial culture · 25Equity financing · 60, 85ERA-NET · 68EUREKA programme · 67European Commission · 67, 72, 114European Innovation Policy · 80European Innovation Scoreboard · 23, 45European Innovation Survey (EIS) · 45European Investment Fund · 56European Patent office (EPO) · 40European Regional Development Fund
(ERDF) · 55, 74European Social Fund · 74European Technology Platform (ETP) ·
68EUROSTARS programme · 67Export growth · 20
F
Fiscal Policy · 18Foreign direct investment (FDI) · 15, 24,
48Furman, J.L. · 13
iNdex
NatioNal system of iNNovatioN iN sloveNia148
G
Gazelles project · 108GDP per capita · 75, 115General government debt · 18General government deficit · 18, 19Government spending · 15, 20, 28
H
High value-added jobs · 17Human capital · 24
I
Import growth · 20Income per capita · 25Inflation · 18Information System on Slovenian Science
(SICRIS) · 41, 94Innovation
Direct inputs in innovation index · 23Environment · 23, 91, 97Expenditures · 104, 106Infrastructure · 13, 58National innovation capacity · 13NIS - National innovation system · 47,
99Institute of Economic Research · 111Interest organizations
Chamber of Commerce and Industry · 53, 60, 79, 108
Chamber of Craft and Small Business · 53, 60, 116
International trade · 15, 21Structure of trade · 22Trade partners · 22
J
Jaklič, A. · 25, 114Joint technology Initiative · 68
K
Kotnik, P. · 23
L
Labour productivity · 18, 115Law on Higher education · 13, 51Law on Research and Development · 72,
76, 94Lisbon agenda · 29Lisbon Strategy · 71, 80Low-technology industries · 15
M
Ministries, Government offices and AgenciesCompetition Protection Office · 29Ministry of Defence · 55, 86Ministry of Economy · 56, 71Ministry of Education, Science and
Sport · 69Ministry of Higher Education, Science
and Technology · 54, 65, 71Office for Development and European
Affairs · 71, 117Office for Growth · 71, 81Office for Local Self-management and
Regional Development · 71, 117Public Agency for Higher education ·
51
N
National Council for Science and Technology · 51, 79
National Programme for Higher Education · 13
National Research and Development Programme · 34, 77, 78, 80
National Strategic Reference Framework · 73, 76
Non-profit research organisations · 52
149index
O
Organisation for Economic Cooperation (OECD) · 27, 29
Ownership structure · 18
P
Patent applications · 40, 41, 42PHARE programme · 80Private consumption · 15, 20Privatization · 28, 29Programme of Measures for
Entrepreneurship and Competitiveness · 75, 77, 107
Public Agency for Entrepreneurship and Foreign Investment (PAEFI) · 53, 56, 86
Public funds · 31, 67, 93Public research organisations · 31, 51, 71,
91Public sector expenditures · 33
R
R&DGross R&D expenditures · 33, 36
R&D Input indicators · 32, 115Research personnel · 69Rojec, M. · 24, 65, 113, 114
S
SID Bank · 56, 57Slovenian Enterprise Fund · 53, 56, 71, 85Slovenian Exit Strategy · 19, 57Slovenian Research Agency · 54, 88, 94,
116Slovenian Science Foundation (SSF) · 53Slovenian Technology Agency (TIA) · 53,
55, 56
Small and medium enterprises (SME) · 56, 85, 87, 103, 105
Stability Programme · 19Stanovnik, P. · 31, 94Stare, M. · 32, 43, 44, 53, 83, 113Statistical Office of the Republic of
Slovenia (SORS) · 20, 33, 44Structural Fund · 82, 97Support institutions
Incubators · 53, 58, 59Regional development agencies · 53, 59Technology parks · 47, 53, 58Technology Transfer Offices · 53, 59,
116VEM-points · 53, 90
SWOT Analysis · 99
T
Technology transfer · 89, 113The National Reform Programme for
Achieving the Lisbon Strategy Goals · 34, 77
Transition · 28, 31, 110TWINNING · 80
U
United Nations Conference on Trade and Development (OECD) · 15
V
VALOR project · 55, 86Venture capital · 59, 60
Y
Young researchers from business sector · 65, 88
Young researchers programme · 38, 54, 88