Embed Size (px)
Citation preview

Give Red Tape a Good Name
Norman Faull
Lean Institute Africa
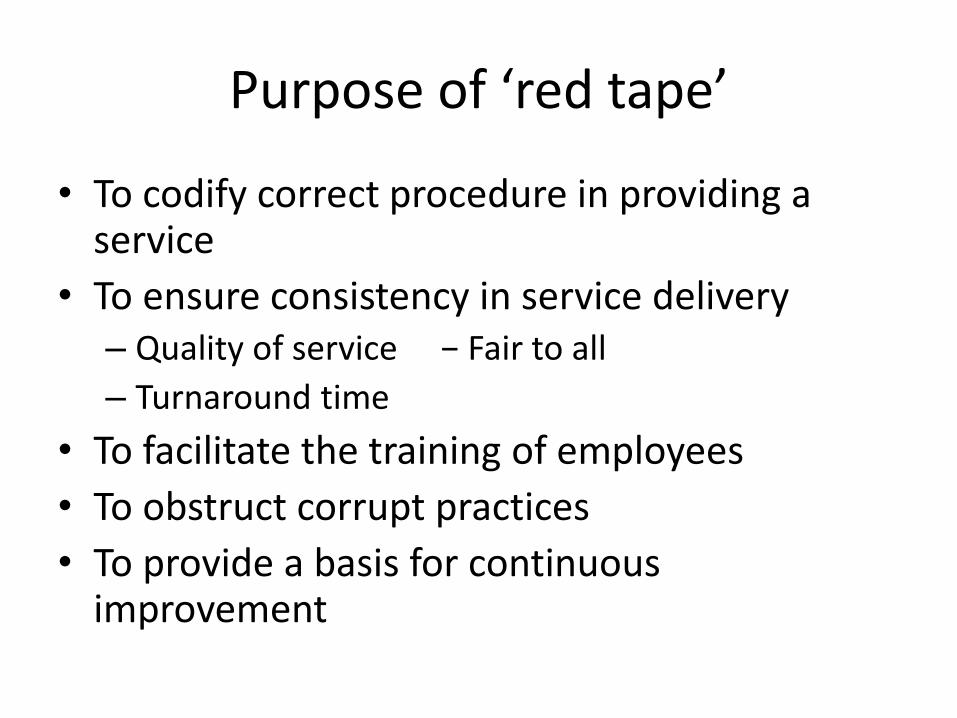
Purpose of ‘red tape’
• To codify correct procedure in providing a service
• To ensure consistency in service delivery – Quality of service − Fair to all
– Turnaround time
• To facilitate the training of employees
• To obstruct corrupt practices
• To provide a basis for continuous improvement
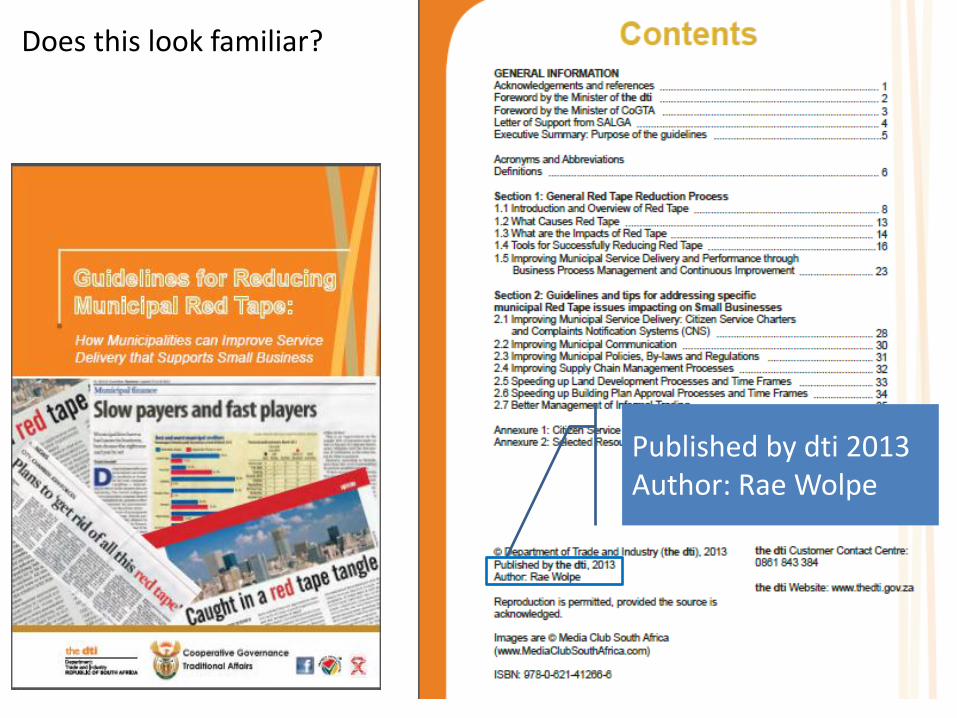
Does this look familiar?
Published by dti 2013 Author: Rae Wolpe
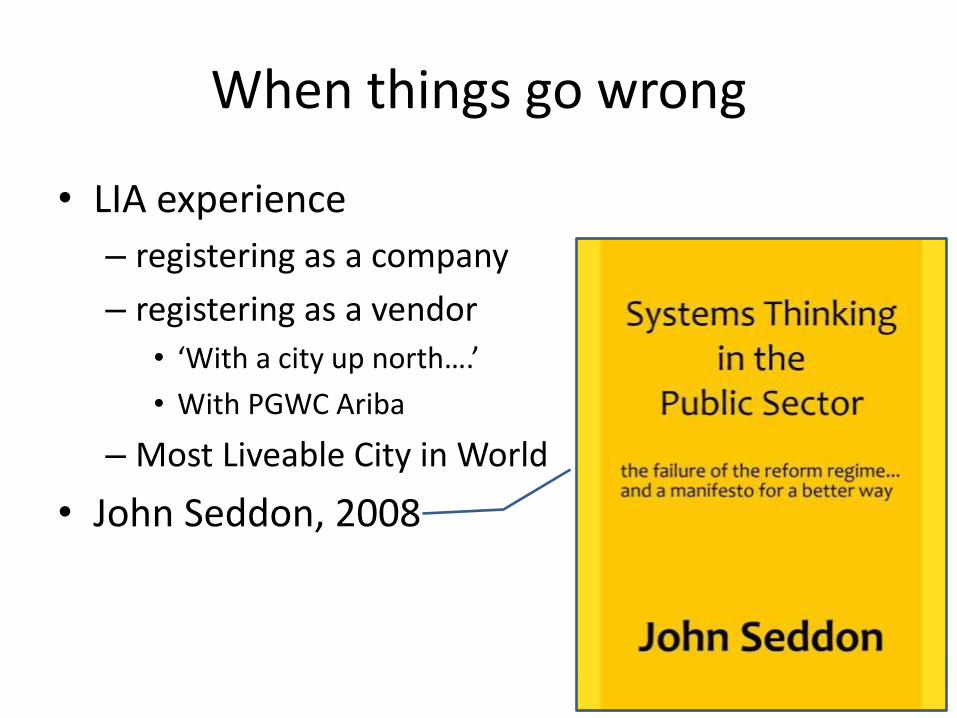
When things go wrong
• LIA experience
– registering as a company
– registering as a vendor
• ‘With a city up north….’
• With PGWC Ariba
– Most Liveable City in World
• John Seddon, 2008
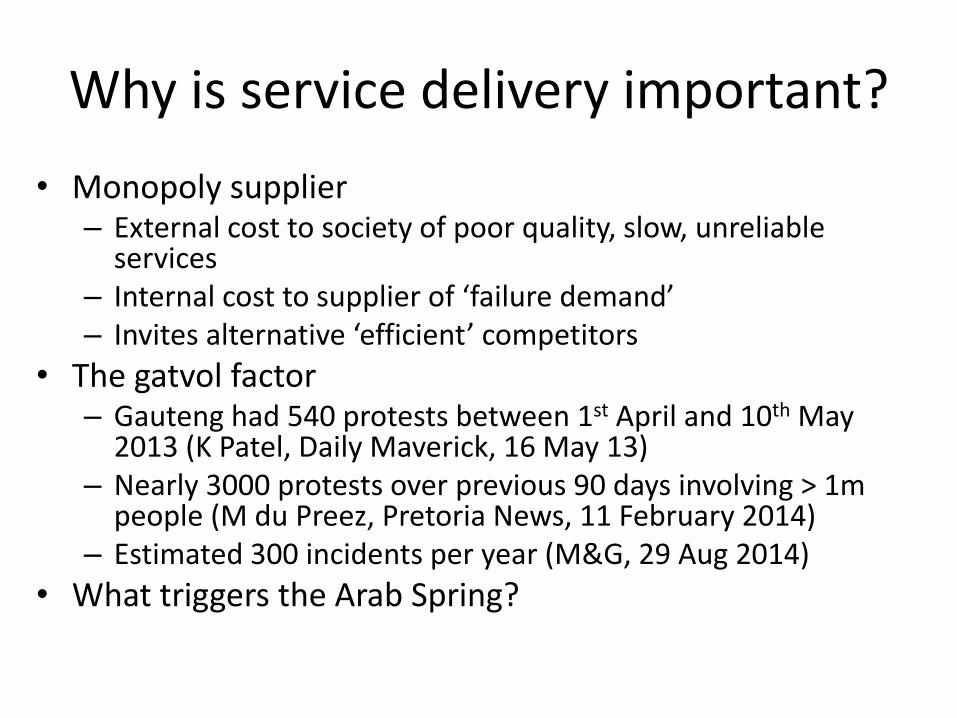
Why is service delivery important?
• Monopoly supplier – External cost to society of poor quality, slow, unreliable
services – Internal cost to supplier of ‘failure demand’ – Invites alternative ‘efficient’ competitors
• The gatvol factor – Gauteng had 540 protests between 1st April and 10th May
2013 (K Patel, Daily Maverick, 16 May 13) – Nearly 3000 protests over previous 90 days involving > 1m
people (M du Preez, Pretoria News, 11 February 2014) – Estimated 300 incidents per year (M&G, 29 Aug 2014)
• What triggers the Arab Spring?
What is annoying people?
The causes of protest range from the popular shorthand of “service delivery” to the slightly
more considered view that people are demanding public service, not necessarily
service delivery. These explanations point to a weak local
government, inadequate service delivery to the most needy, or local government failure with poor political oversight of officials and a lack of responsiveness and accountability by political representatives.
M&G, 29 Aug 2014
Business Process Reengineering
• Rose to popularity in early 1990’s • focusing on the analysis and design of workflows and
business processes within an organization. BPR aimed to help organizations fundamentally rethink how they do their work in order to dramatically improve customer service, cut operational costs, and become world-class competitors
• The most frequent critique against BPR concerns the strict focus on efficiency and technology and the disregard of people in the organization that is subjected to a reengineering initiative. Very often, the label BPR was used for major workforce reductions.
http://en.wikipedia.org/wiki/Business_process_reengineering#Critique; 14 September 2014
Key concepts for workflow improvement
• Efficiency matrix insights – Stability – Prioritise Flow – Let resource efficiency follow
• Functional silos interrupt flow • Batching interrupts flow • Rework (‘failure demand’) disrupts flow • Basic tools
– Mapping − 5S – Visual Management − Triage!
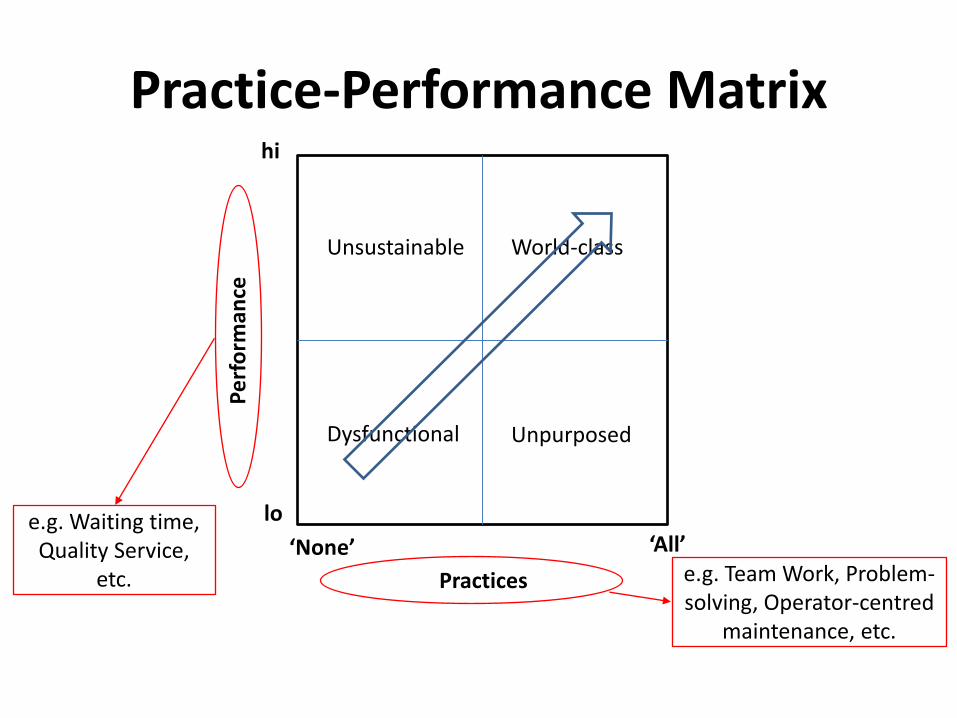
Practice-Performance Matrix
Pe
rfo
rman
ce
Practices
lo
hi
‘All’ e.g. Waiting time, Quality Service,
etc. e.g. Team Work, Problem-solving, Operator-centred
maintenance, etc.
‘None’
Dysfunctional
Unsustainable
Unpurposed
World-class
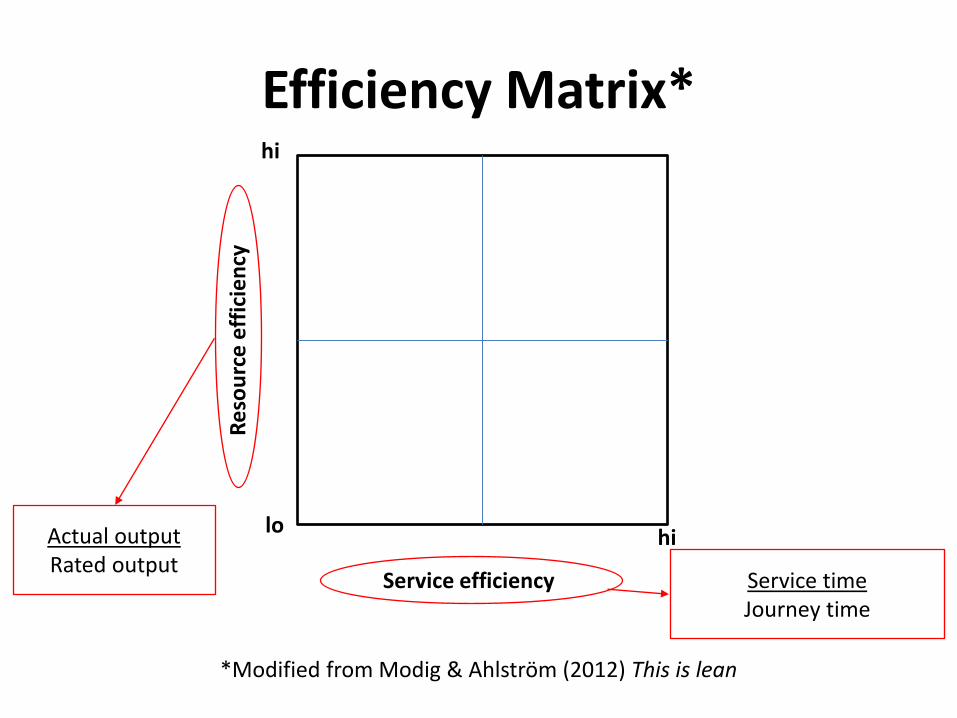
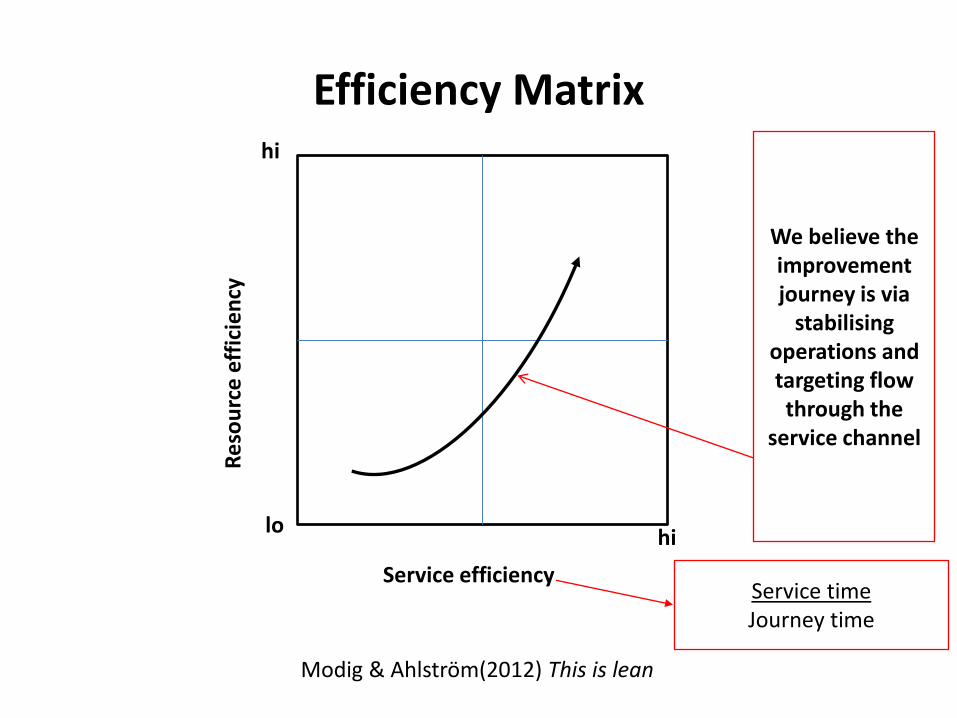
Efficiency Matrix*
*Modified from Modig & Ahlström (2012) This is lean
Re
sou
rce
eff
icie
ncy
Service efficiency
lo
hi
hi Actual output Rated output
Service time Journey time
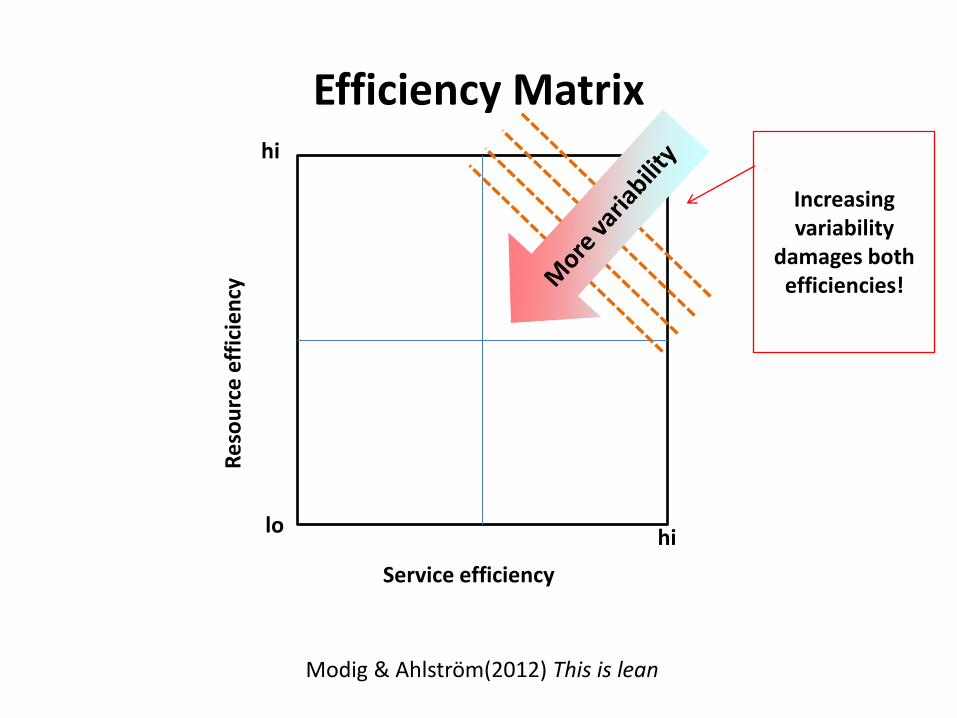
Efficiency Matrix
Modig & Ahlström(2012) This is lean
Re
sou
rce
eff
icie
ncy
Service efficiency
lo
hi
hi
Increasing variability
damages both efficiencies!
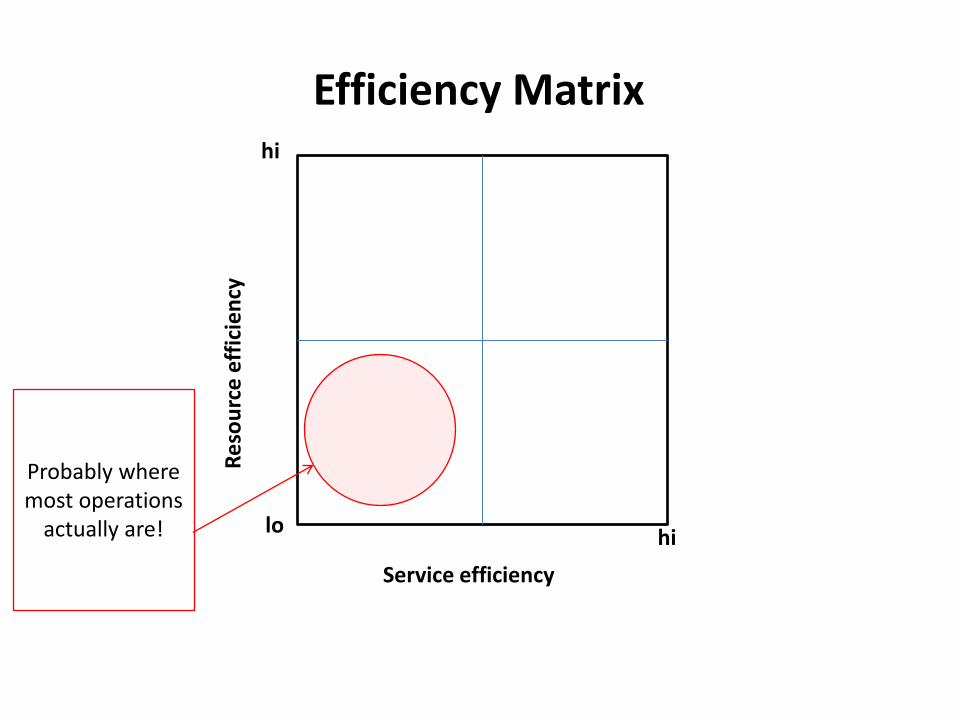
Efficiency Matrix
Re
sou
rce
eff
icie
ncy
Service efficiency
lo
hi
hi
Probably where most operations
actually are!
Efficiency Matrix
Modig & Ahlström(2012) This is lean
Re
sou
rce
eff
icie
ncy
Service efficiency
lo
hi
hi
We believe the improvement journey is via
stabilising operations and targeting flow through the
service channel
Service time Journey time
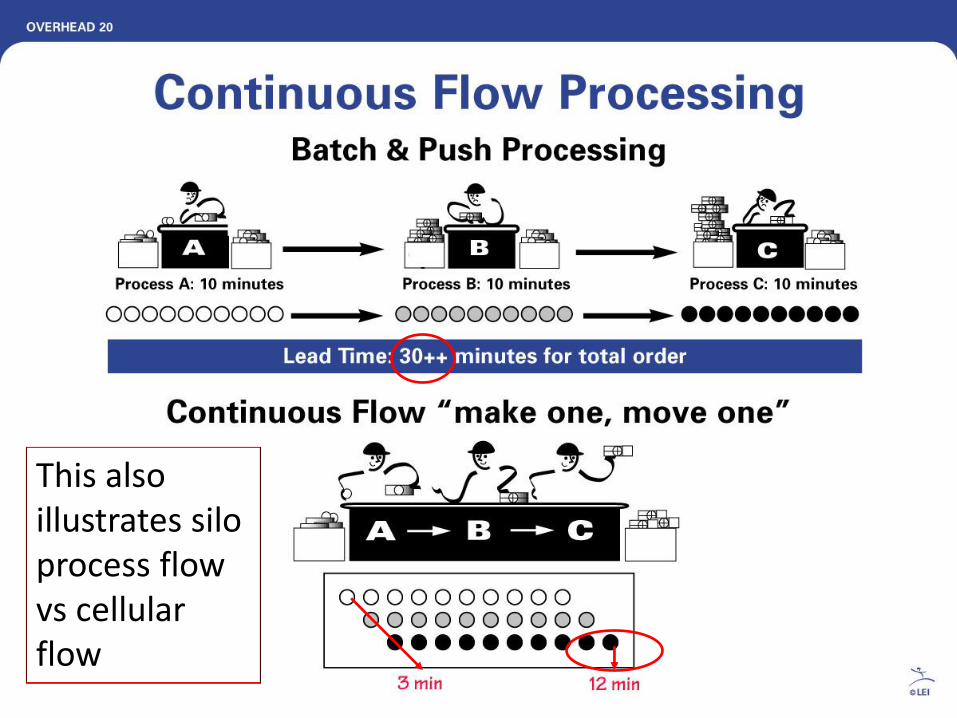
This also illustrates silo process flow vs cellular flow
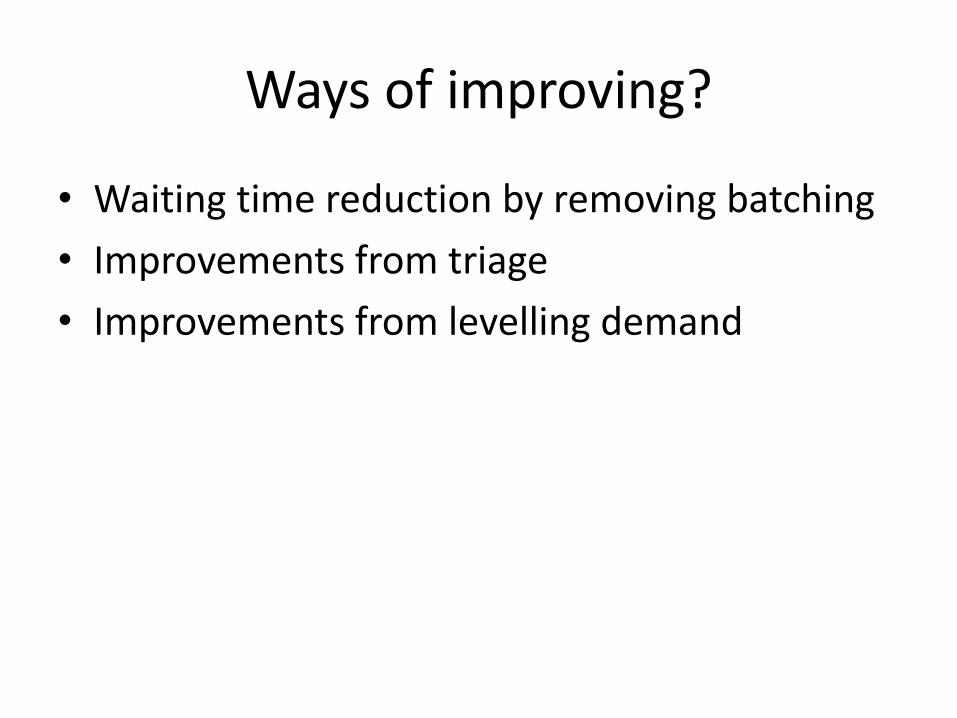
Ways of improving?
• Waiting time reduction by removing batching
• Improvements from triage
• Improvements from levelling demand
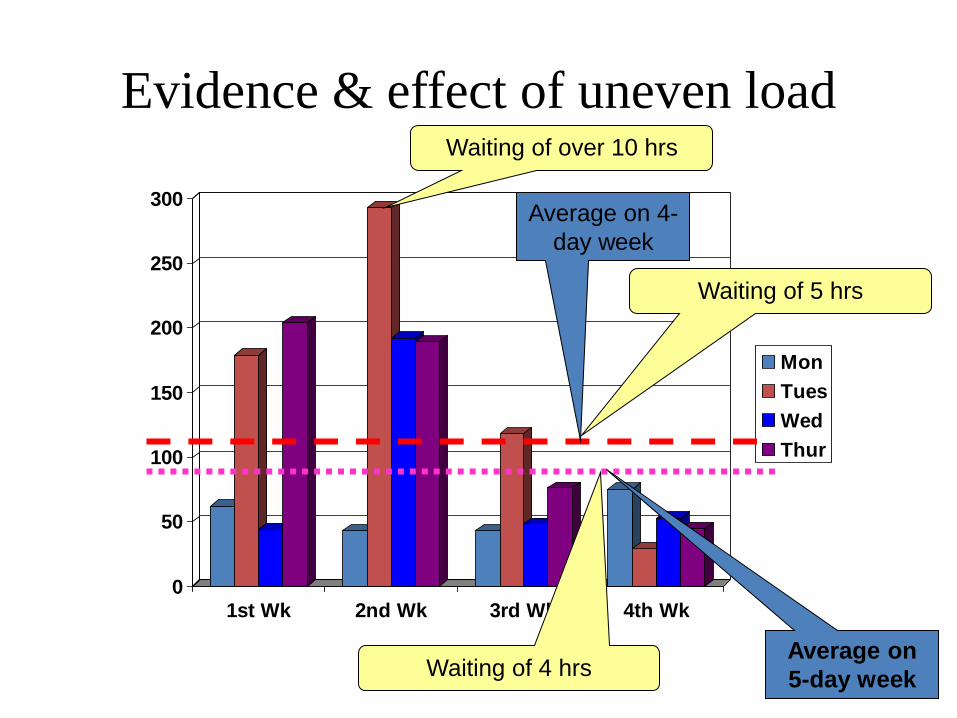
Evidence & effect of uneven load
0
50
100
150
200
250
300
1st Wk 2nd Wk 3rd Wk 4th Wk
Mon
Tues
Wed
Thur
Average on 4-
day week
Average on
5-day week
Waiting of over 10 hrs
Waiting of 5 hrs
Waiting of 4 hrs
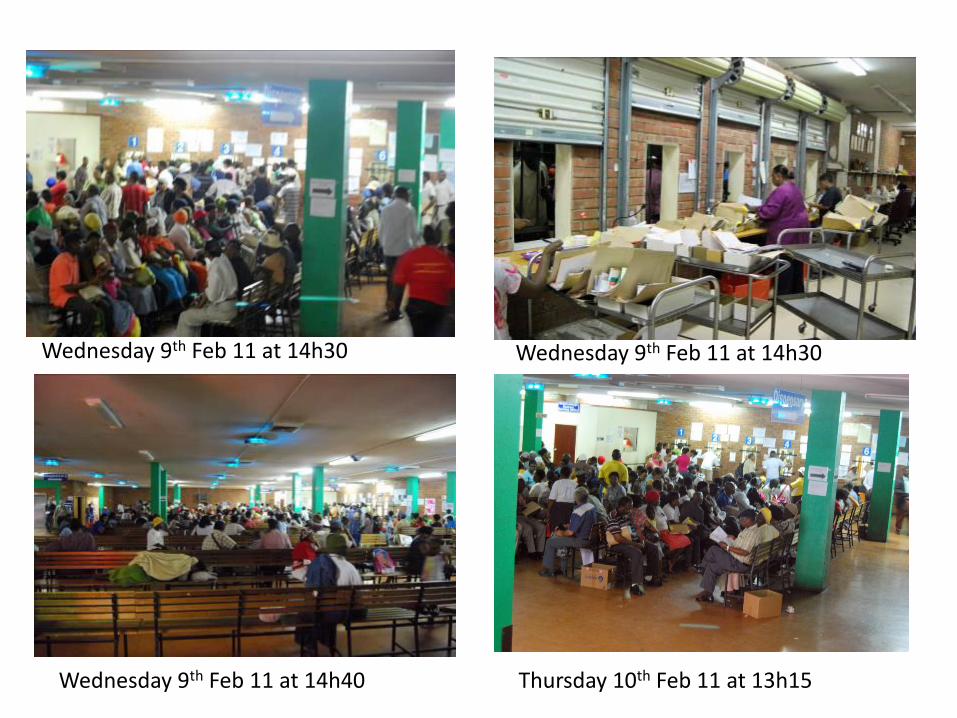
Wednesday 9th Feb 11 at 14h30 Wednesday 9th Feb 11 at 14h30
Wednesday 9th Feb 11 at 14h40 Thursday 10th Feb 11 at 13h15
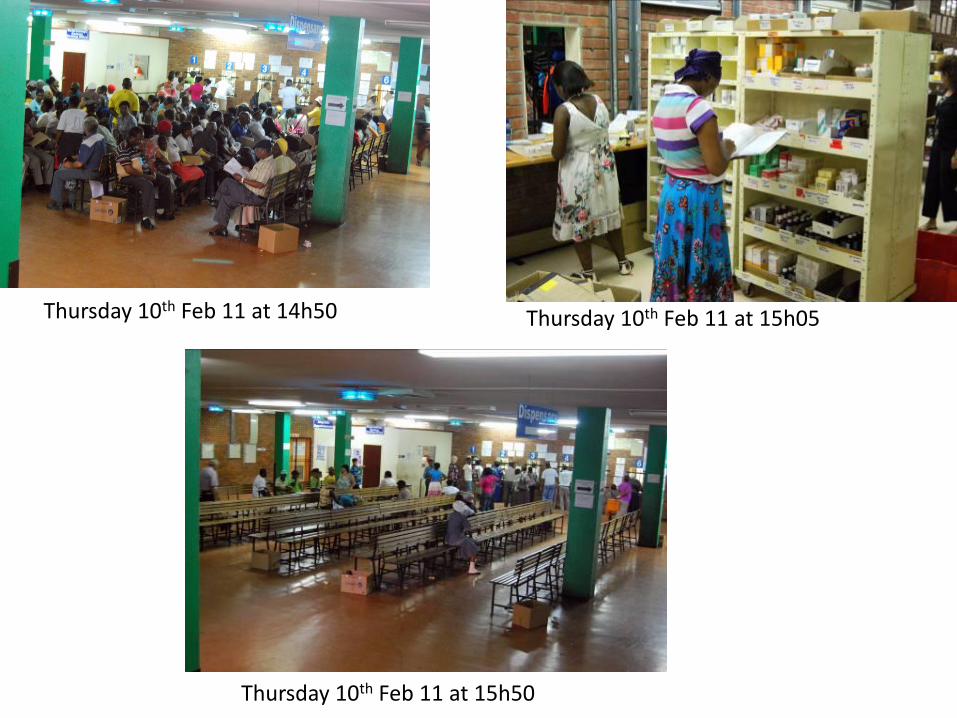
Thursday 10th Feb 11 at 14h50 Thursday 10th Feb 11 at 15h05
Thursday 10th Feb 11 at 15h50
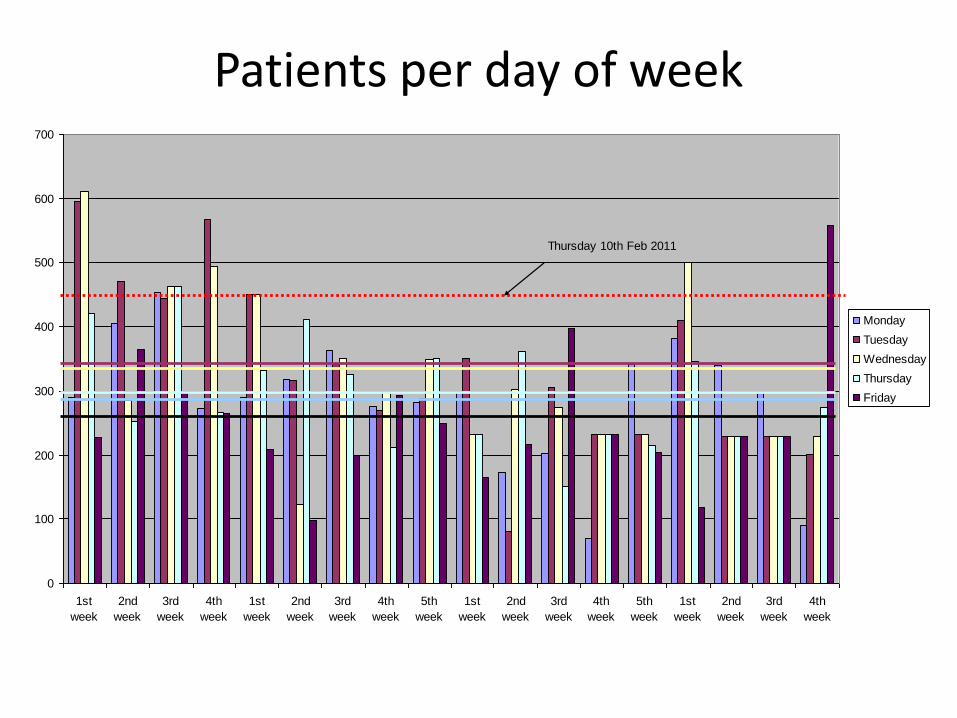
Patients per day of week
0
100
200
300
400
500
600
700
1st
week
2nd
week
3rd
week
4th
week
1st
week
2nd
week
3rd
week
4th
week
5th
week
1st
week
2nd
week
3rd
week
4th
week
5th
week
1st
week
2nd
week
3rd
week
4th
week
Monday
Tuesday
Wednesday
Thursday
Friday
Thursday 10th Feb 2011
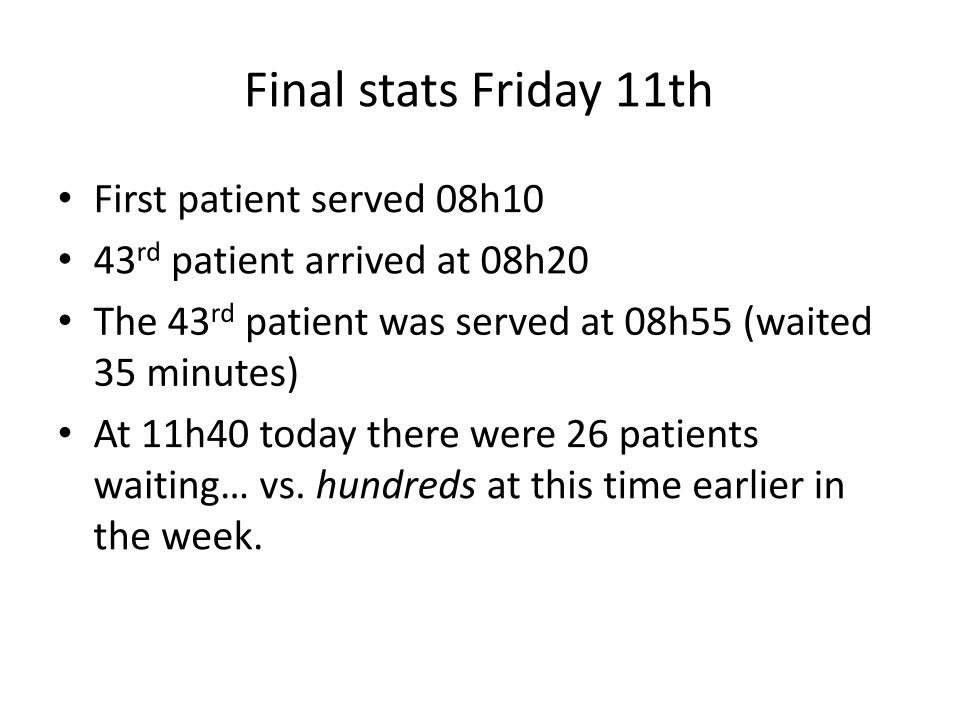
Final stats Friday 11th
• First patient served 08h10
• 43rd patient arrived at 08h20
• The 43rd patient was served at 08h55 (waited 35 minutes)
• At 11h40 today there were 26 patients waiting… vs. hundreds at this time earlier in the week.
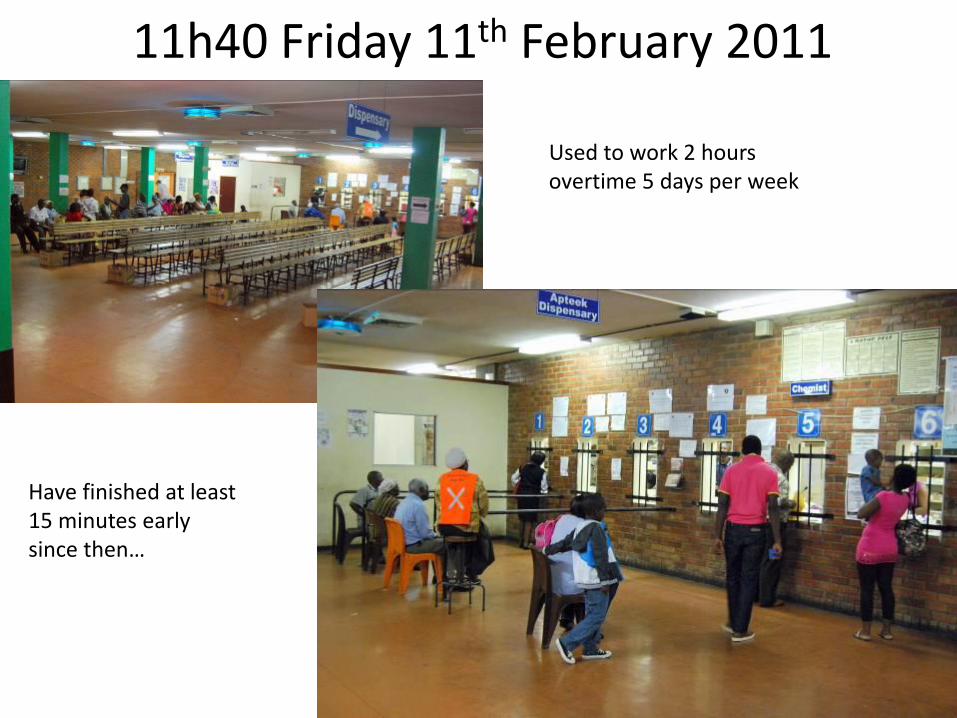
11h40 Friday 11th February 2011
Used to work 2 hours overtime 5 days per week
Have finished at least 15 minutes early since then…
min
60 8 min min
Fin
ge
rprin
ting
Eye
Te
stin
g
En
qu
iries
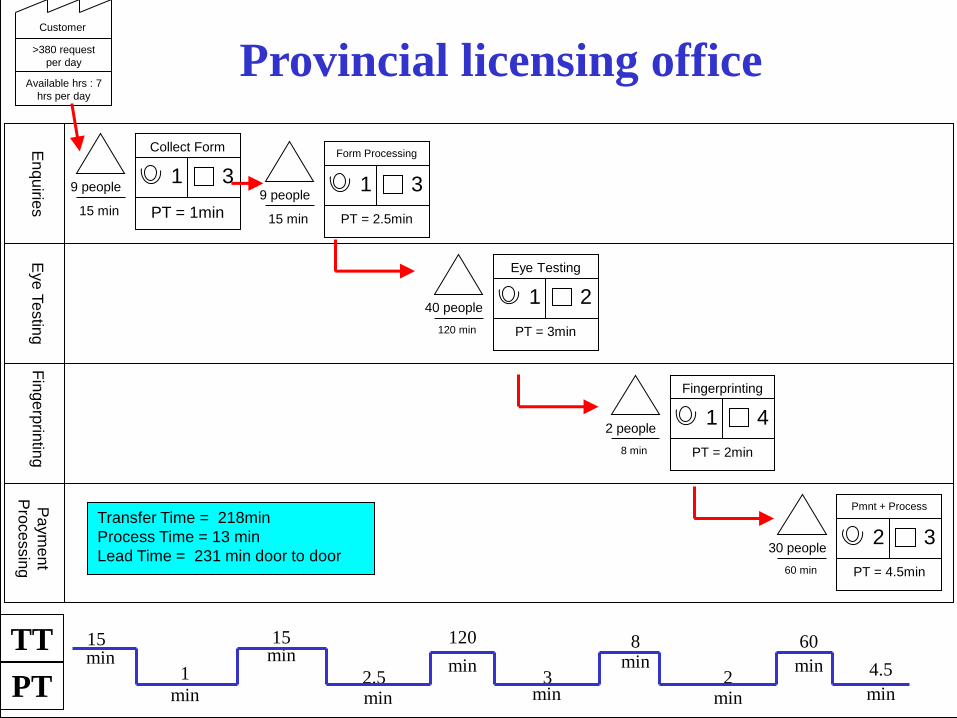
>380 request
per day
Available hrs : 7
hrs per day
Customer
Collect Form
PT = 1min
3 1
15 min
9 people
TT
PT
15 min
1
min
15 min
2.5 min min
3 4.5
Transfer Time = 218min
Process Time = 13 min
Lead Time = 231 min door to door
Form Processing
PT = 2.5min
3 1
15 min
9 people
Eye Testing
PT = 3min
2 1
120 min
40 people
Fingerprinting
PT = 2min
4 1
8 min
2 people
Pmnt + Process
PT = 4.5min
3 2
60 min
30 people
Pa
ym
en
t
Pro
ce
ssin
g
min
120
2 min
Provincial licensing office
Red tape reduction can give ‘red tape’ a good name by improving service to the
people
Thank you!
Consistent use of agreed best practices/standard work procedures
+ Continuous improvement