Embed Size (px)
Citation preview
DES MOINES AREA MPOPolicy Committee Meeting
May 28, 2015

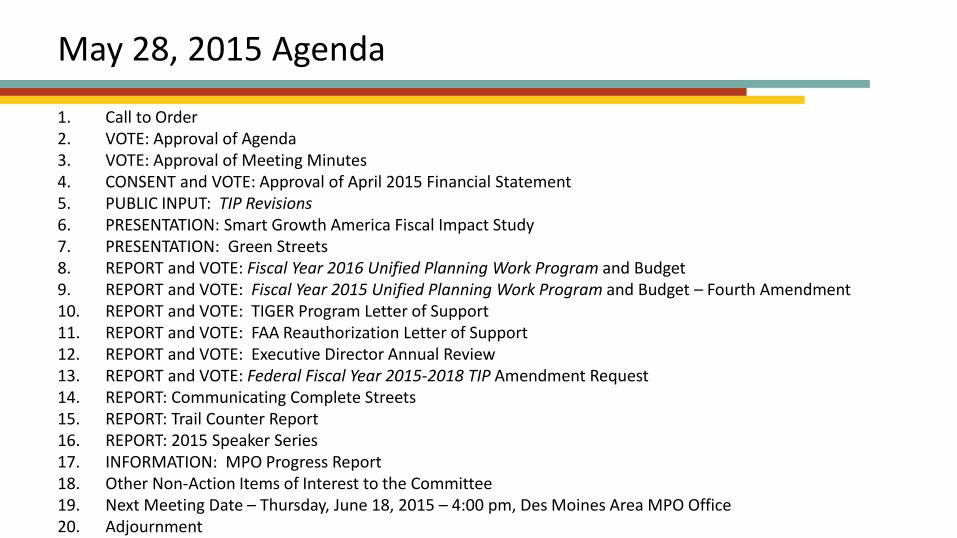
May 28, 2015 Agenda
1. Call to Order2. VOTE: Approval of Agenda3. VOTE: Approval of Meeting Minutes4. CONSENT and VOTE: Approval of April 2015 Financial Statement5. PUBLIC INPUT: TIP Revisions6. PRESENTATION: Smart Growth America Fiscal Impact Study7. PRESENTATION: Green Streets8. REPORT and VOTE: Fiscal Year 2016 Unified Planning Work Program and Budget9. REPORT and VOTE: Fiscal Year 2015 Unified Planning Work Program and Budget – Fourth Amendment10. REPORT and VOTE: TIGER Program Letter of Support11. REPORT and VOTE: FAA Reauthorization Letter of Support 12. REPORT and VOTE: Executive Director Annual Review13. REPORT and VOTE: Federal Fiscal Year 2015-2018 TIP Amendment Request14. REPORT: Communicating Complete Streets15. REPORT: Trail Counter Report16. REPORT: 2015 Speaker Series17. INFORMATION: MPO Progress Report18. Other Non-Action Items of Interest to the Committee19. Next Meeting Date – Thursday, June 18, 2015 – 4:00 pm, Des Moines Area MPO Office20. Adjournment
PUBLIC COMMENT
FFY 2015-2018 Transportation Improvement Program Revision Request

Fiscal Implications of Development Patterns
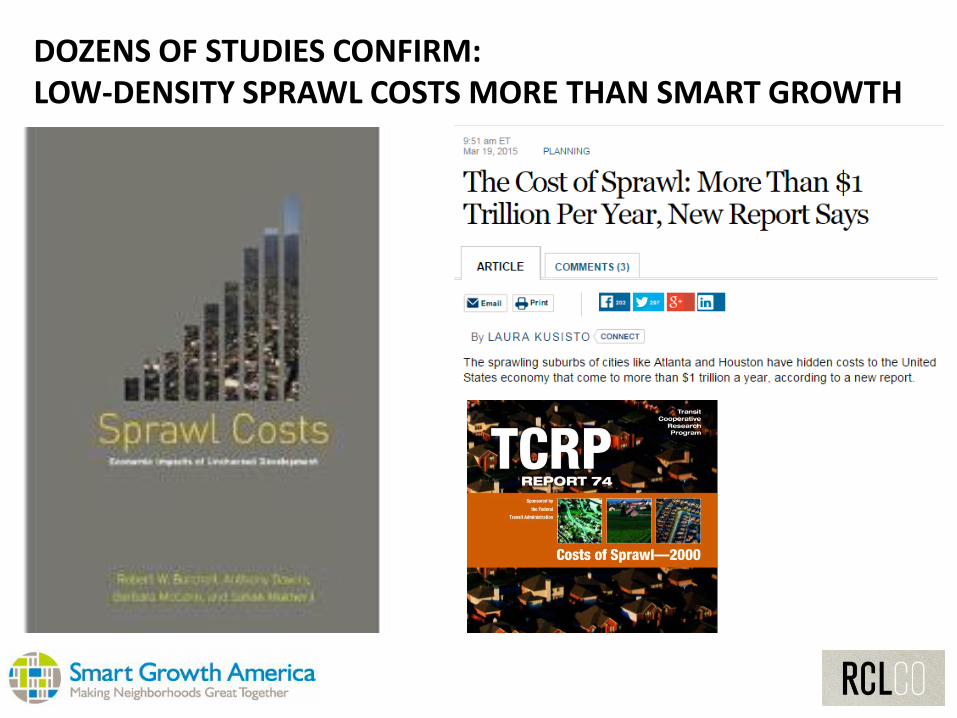
DOZENS OF STUDIES CONFIRM: LOW-DENSITY SPRAWL COSTS MORE THAN SMART GROWTH
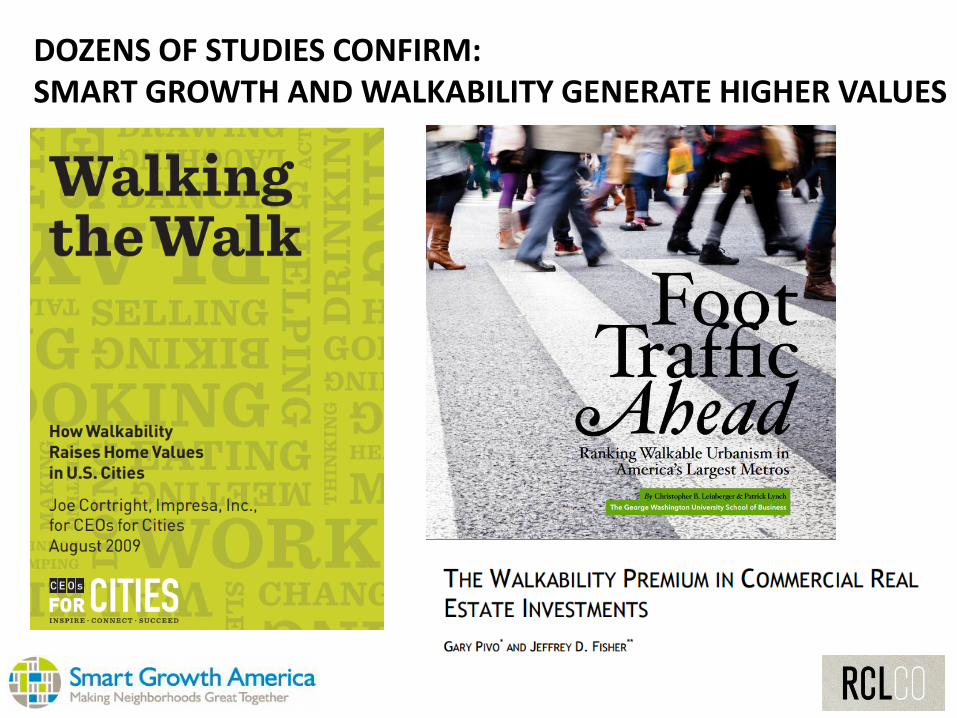
DOZENS OF STUDIES CONFIRM: SMART GROWTH AND WALKABILITY GENERATE HIGHER VALUES
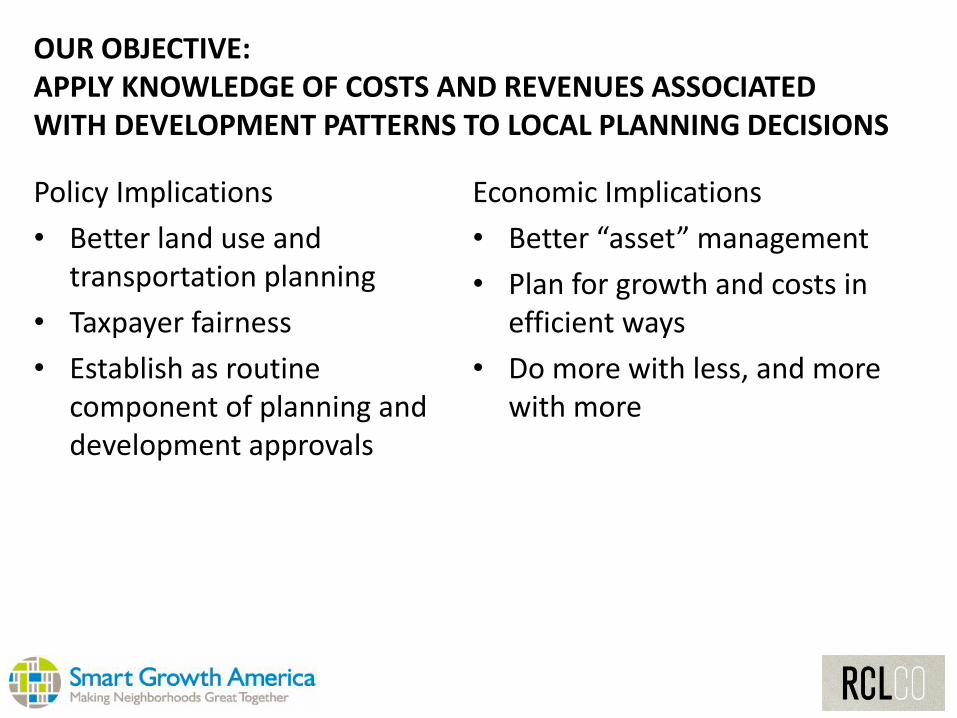
Policy Implications
• Better land use and transportation planning
• Taxpayer fairness
• Establish as routine component of planning and development approvals
Economic Implications
• Better “asset” management
• Plan for growth and costs in efficient ways
• Do more with less, and more with more
OUR OBJECTIVE: APPLY KNOWLEDGE OF COSTS AND REVENUES ASSOCIATED WITH DEVELOPMENT PATTERNS TO LOCAL PLANNING DECISIONS
OVERVIEW OF COST ANALYSIS
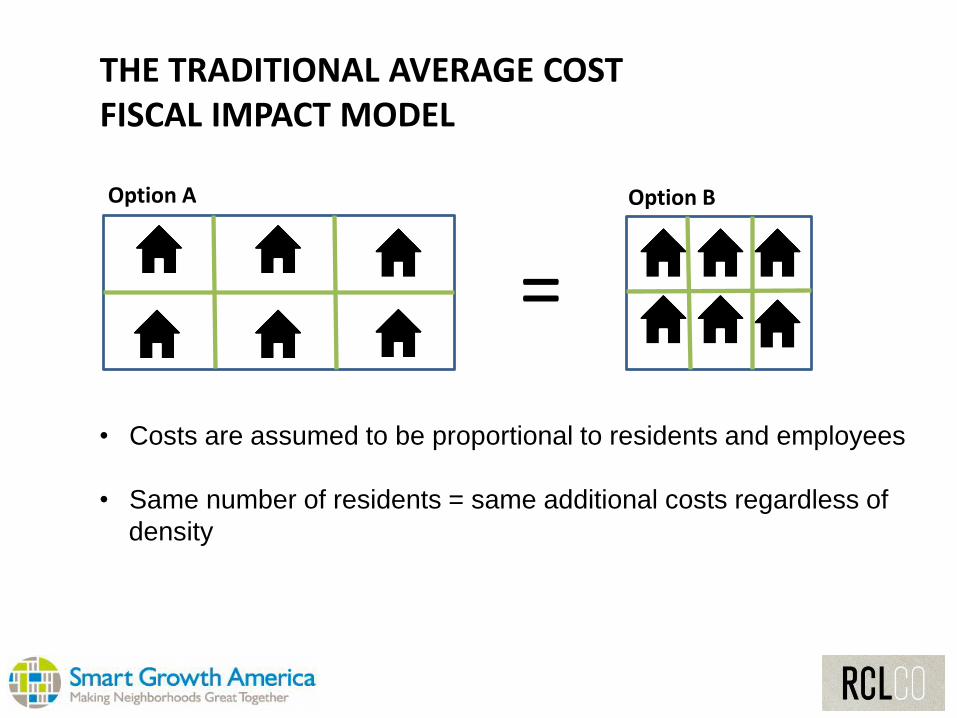
THE TRADITIONAL AVERAGE COST FISCAL IMPACT MODEL
=
Option A Option B
• Costs are assumed to be proportional to residents and employees
• Same number of residents = same additional costs regardless of
density
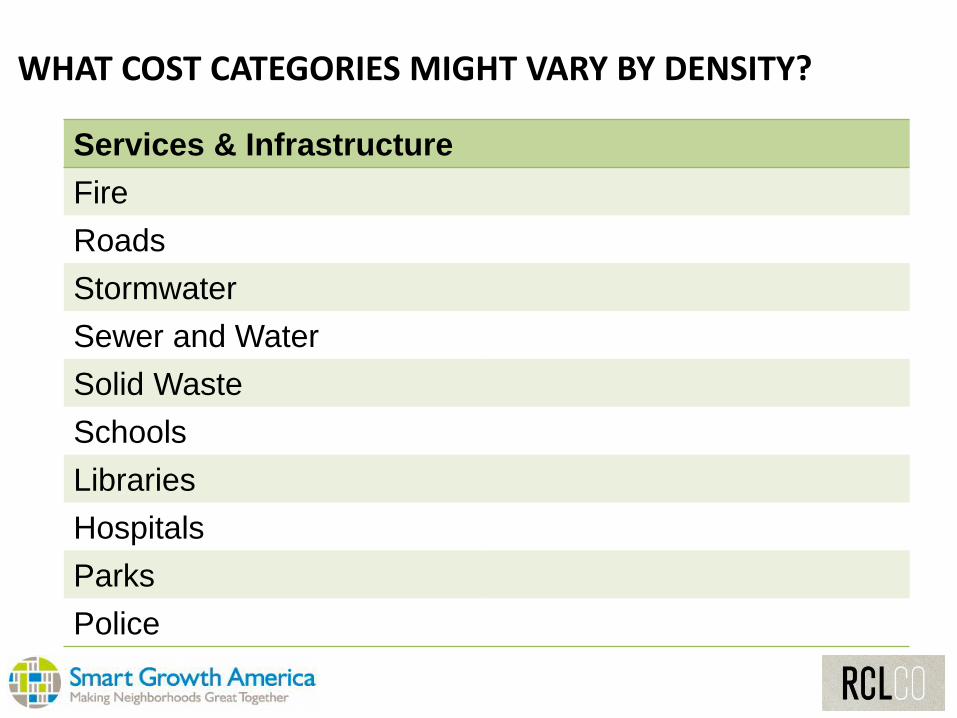
WHAT COST CATEGORIES MIGHT VARY BY DENSITY?
Services & Infrastructure
Fire
Roads
Stormwater
Sewer and Water
Solid Waste
Schools
Libraries
Hospitals
Parks
Police
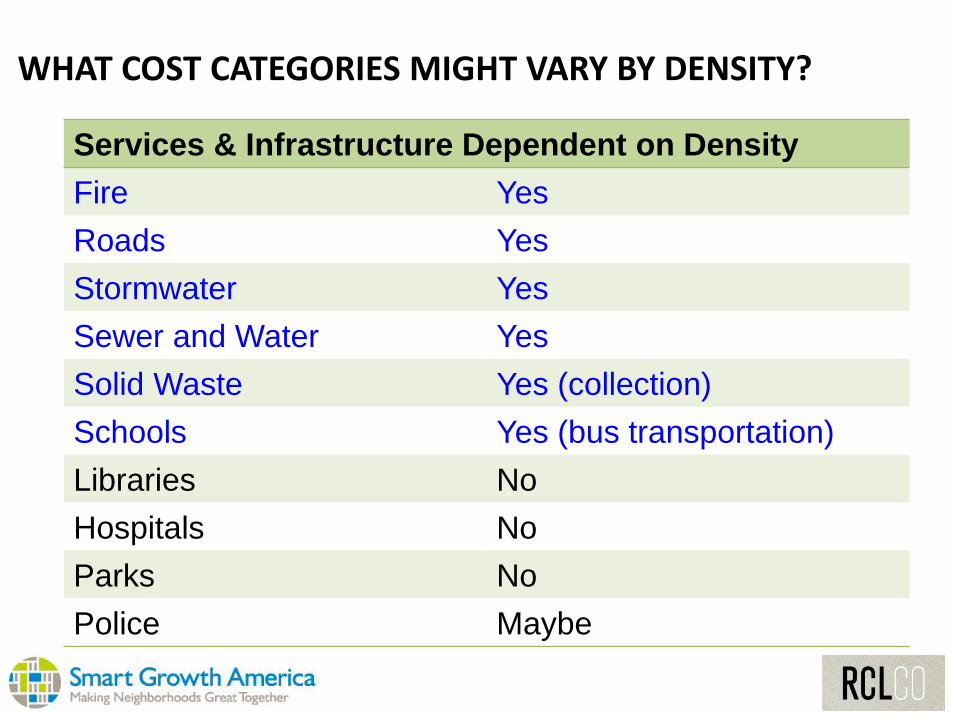
Services & Infrastructure Dependent on Density
Fire Yes
Roads Yes
Stormwater Yes
Sewer and Water Yes
Solid Waste Yes (collection)
Schools Yes (bus transportation)
Libraries No
Hospitals No
Parks No
Police Maybe
WHAT COST CATEGORIES MIGHT VARY BY DENSITY?
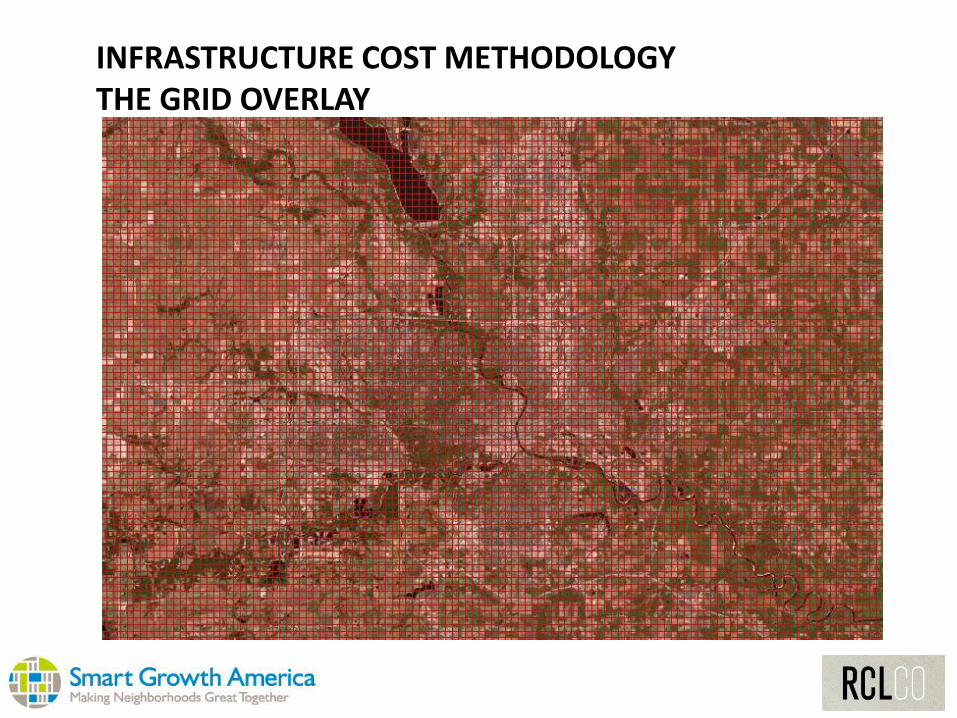
INFRASTRUCTURE COST METHODOLOGY THE GRID OVERLAY
y = 69.07x-0.599
R² = 0.9479
0
10
20
30
40
50
60
0 100 200 300
Ro
ad L
engt
h (
ft.)
per
Cap
ita
(Res
iden
ts a
nd
Em
plo
yees
)
Residents and Employees per Acre
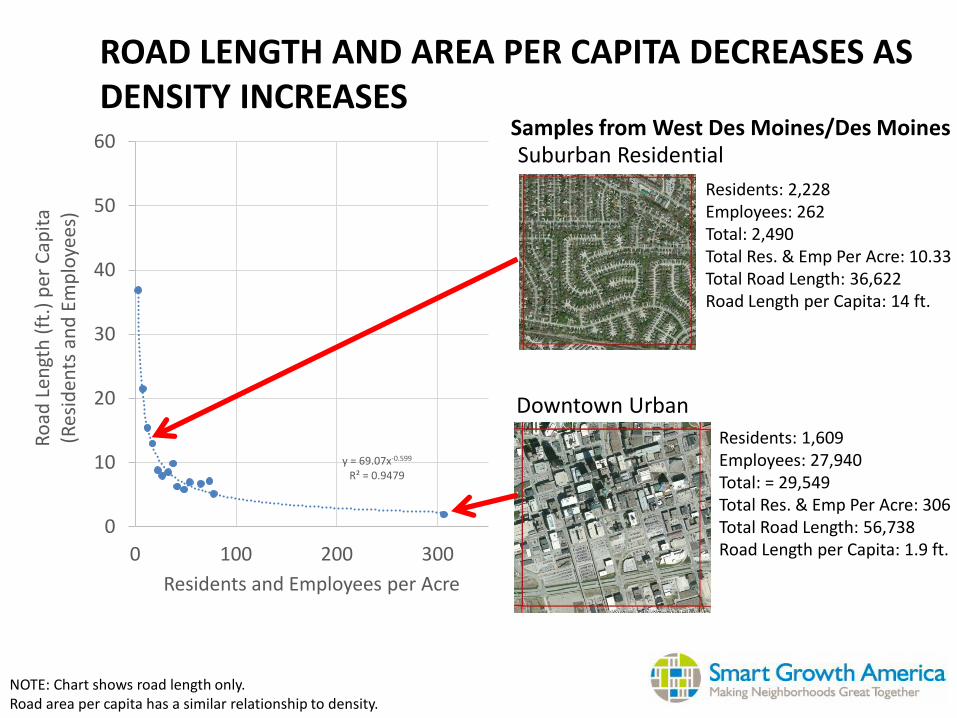
ROAD LENGTH AND AREA PER CAPITA DECREASES AS DENSITY INCREASES
Samples from West Des Moines/Des Moines
Residents: 2,228Employees: 262Total: 2,490Total Res. & Emp Per Acre: 10.33 Total Road Length: 36,622Road Length per Capita: 14 ft.
Suburban Residential
Downtown Urban
Residents: 1,609Employees: 27,940Total: = 29,549Total Res. & Emp Per Acre: 306 Total Road Length: 56,738Road Length per Capita: 1.9 ft.
NOTE: Chart shows road length only. Road area per capita has a similar relationship to density.
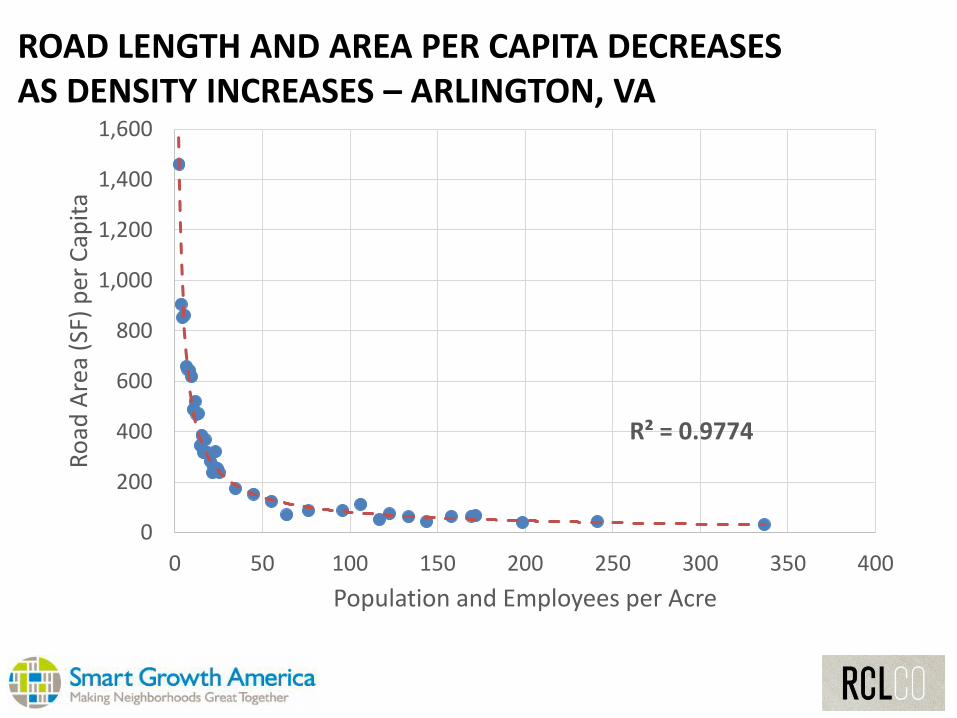
R² = 0.9774
0
200
400
600
800
1,000
1,200
1,400
1,600
0 50 100 150 200 250 300 350 400
Ro
ad A
rea
(SF)
per
Cap
ita
Population and Employees per Acre
ROAD LENGTH AND AREA PER CAPITA DECREASES AS DENSITY INCREASES – ARLINGTON, VA
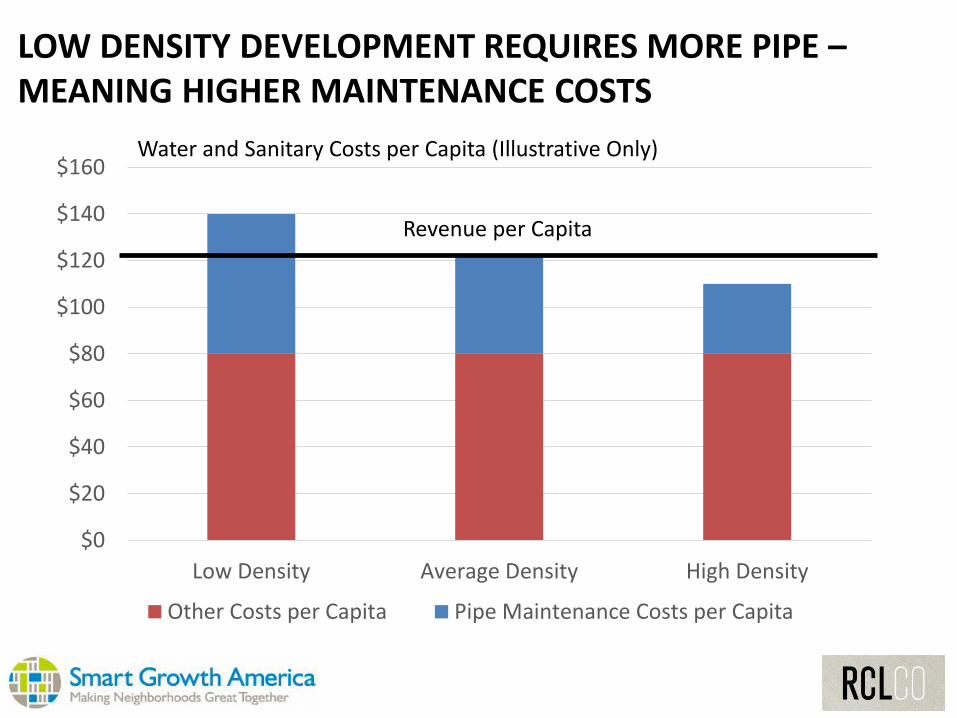
$0
$20
$40
$60
$80
$100
$120
$140
$160
Low Density Average Density High Density
Other Costs per Capita Pipe Maintenance Costs per Capita
Revenue per Capita
LOW DENSITY DEVELOPMENT REQUIRES MORE PIPE –MEANING HIGHER MAINTENANCE COSTS
Water and Sanitary Costs per Capita (Illustrative Only)
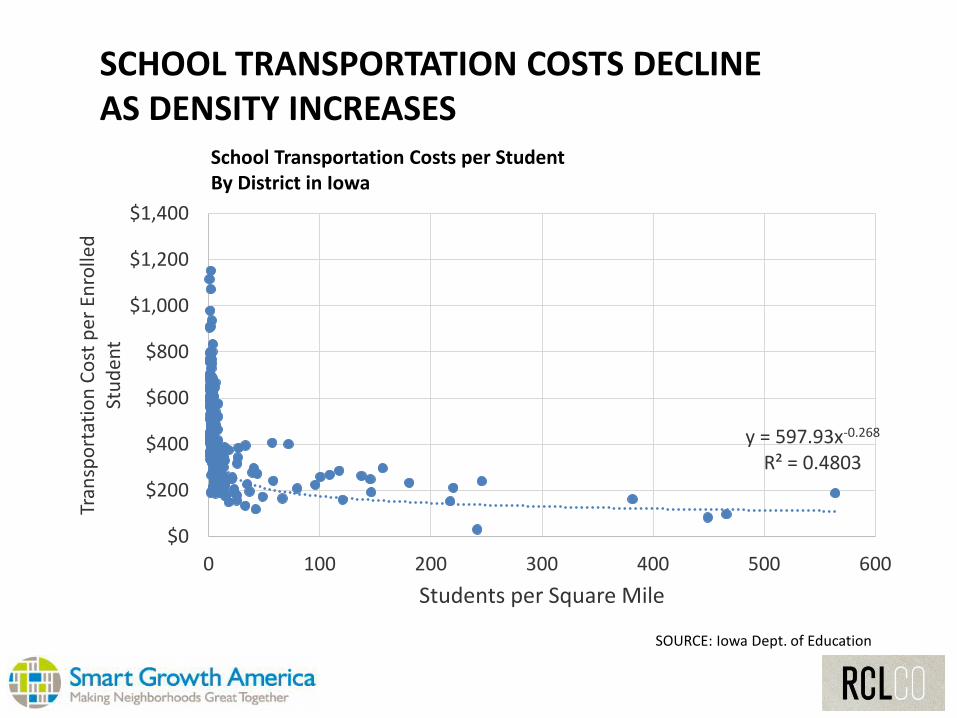
School Transportation Costs per StudentBy District in Iowa
SCHOOL TRANSPORTATION COSTS DECLINE AS DENSITY INCREASES
SOURCE: Iowa Dept. of Education
y = 597.93x-0.268
R² = 0.4803
$0
$200
$400
$600
$800
$1,000
$1,200
$1,400
0 100 200 300 400 500 600
Tran
spo
rtat
ion
Co
st p
er E
nro
lled
St
ud
ent
Students per Square Mile
SGA MODEL IS BASED ON ANTICIPATED NUMBER OF STUDENTS IN THE “WALK ZONE”
0
200
400
600
800
1,000
1,200
1,400
Bus ElibigleElementary
Students
Bus EligibleMiddle
Students
Bus ElibigleHigh School
Students
2 Units per Acre 4 Units per Acre
8 Units per Acre 12 Units per Acre
• Not specific to
existing school
situation
• Key determinants are
size of the schools,
radius of the walk
zone, and students
per unit
• Chart assumes 1-mile
walk zone and school
sizes of 400, 600, and
1,600 and single-
family detached units
• Does not account for
route distance/time
Bus Eligible
Elementary
Students
Bus Eligible
High School
Students
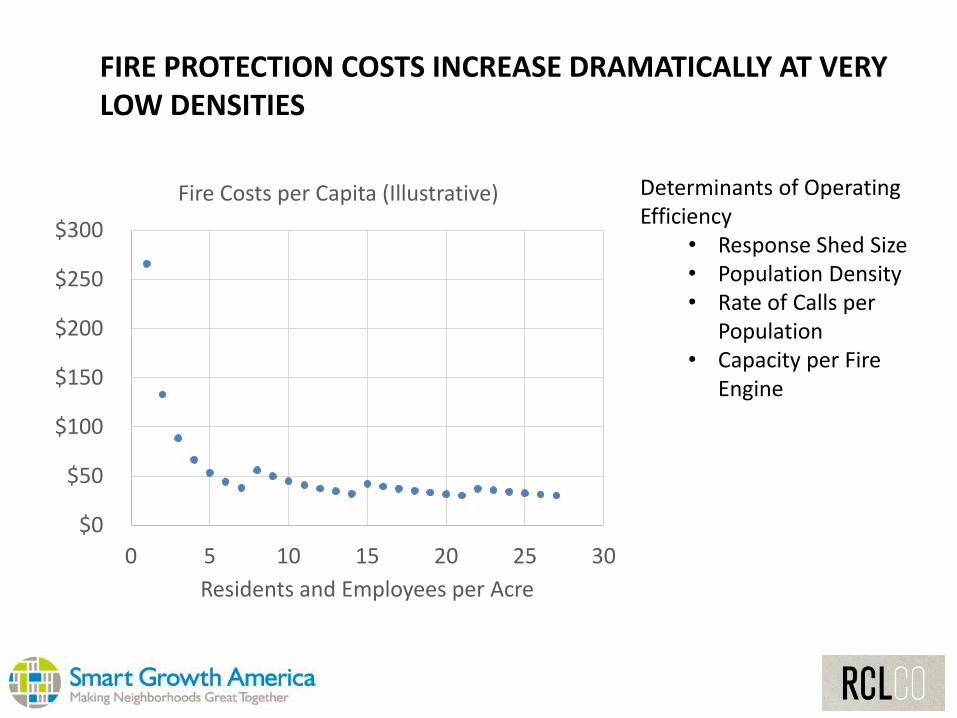
FIRE PROTECTION COSTS INCREASE DRAMATICALLY AT VERY LOW DENSITIES
Determinants of Operating Efficiency
• Response Shed Size• Population Density• Rate of Calls per
Population• Capacity per Fire
Engine
$0
$50
$100
$150
$200
$250
$300
0 5 10 15 20 25 30
Residents and Employees per Acre
Fire Costs per Capita (Illustrative)
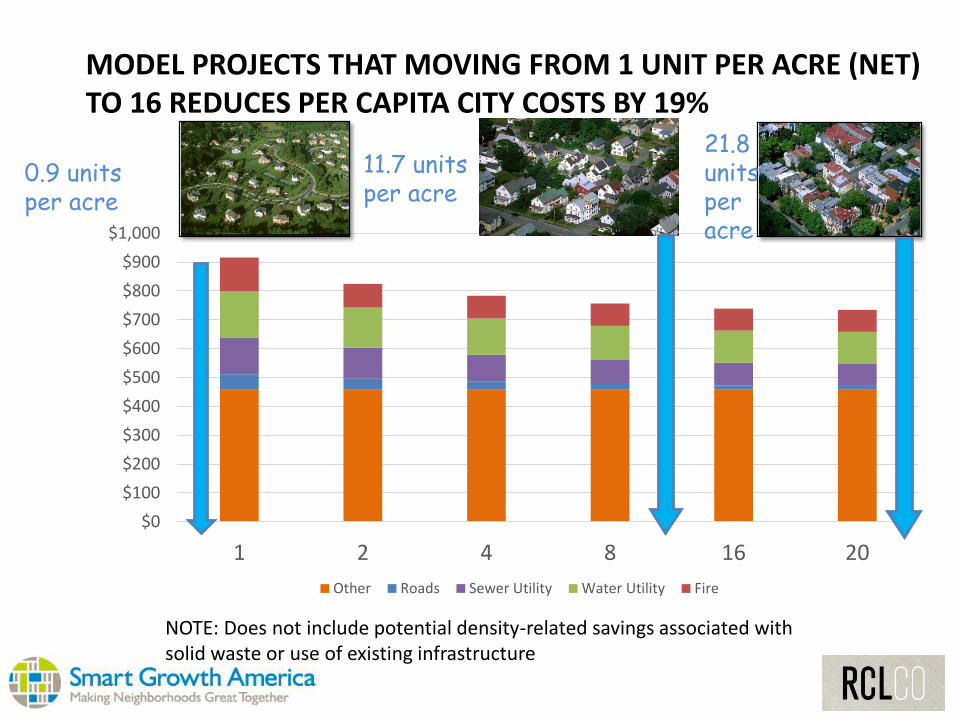
$0
$100
$200
$300
$400
$500
$600
$700
$800
$900
$1,000
1 2 4 8 16 20
Other Roads Sewer Utility Water Utility Fire
MODEL PROJECTS THAT MOVING FROM 1 UNIT PER ACRE (NET) TO 16 REDUCES PER CAPITA CITY COSTS BY 19%
NOTE: Does not include potential density-related savings associated with solid waste or use of existing infrastructure
21.8 units per acre
0.9 units per acre
11.7 units per acre
OVERVIEW OF REVENUE ANALYSIS
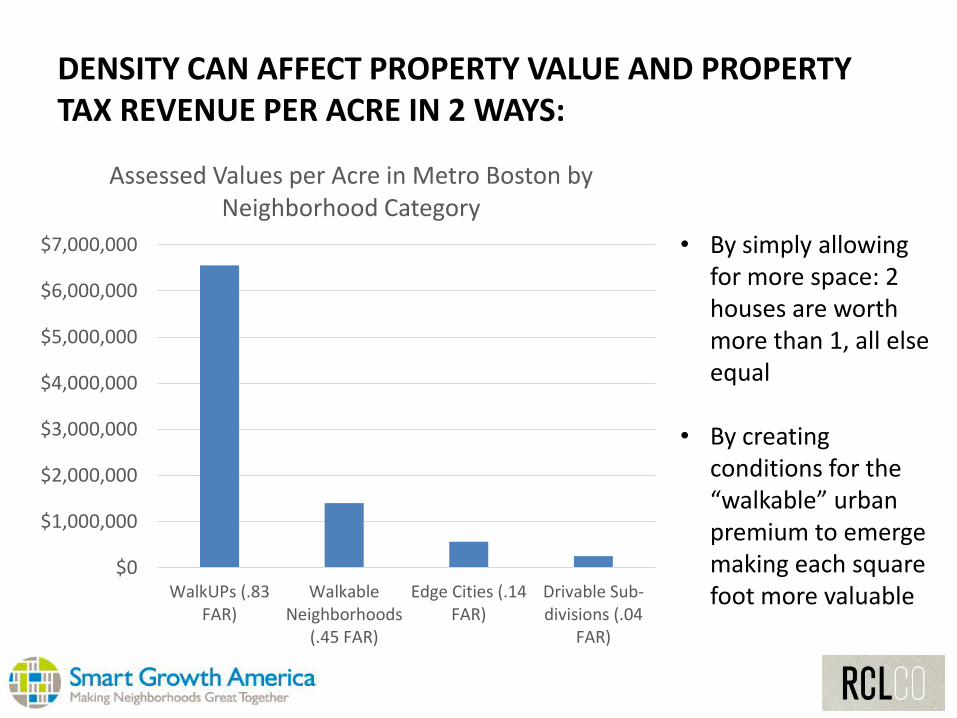
DENSITY CAN AFFECT PROPERTY VALUE AND PROPERTY TAX REVENUE PER ACRE IN 2 WAYS:
18
• By simply allowing for more space: 2 houses are worth more than 1, all else equal
• By creating conditions for the “walkable” urban premium to emerge making each square foot more valuable
$0
$1,000,000
$2,000,000
$3,000,000
$4,000,000
$5,000,000
$6,000,000
$7,000,000
WalkUPs (.83FAR)
WalkableNeighborhoods
(.45 FAR)
Edge Cities (.14FAR)
Drivable Sub-divisions (.04
FAR)
Assessed Values per Acre in Metro Boston by Neighborhood Category
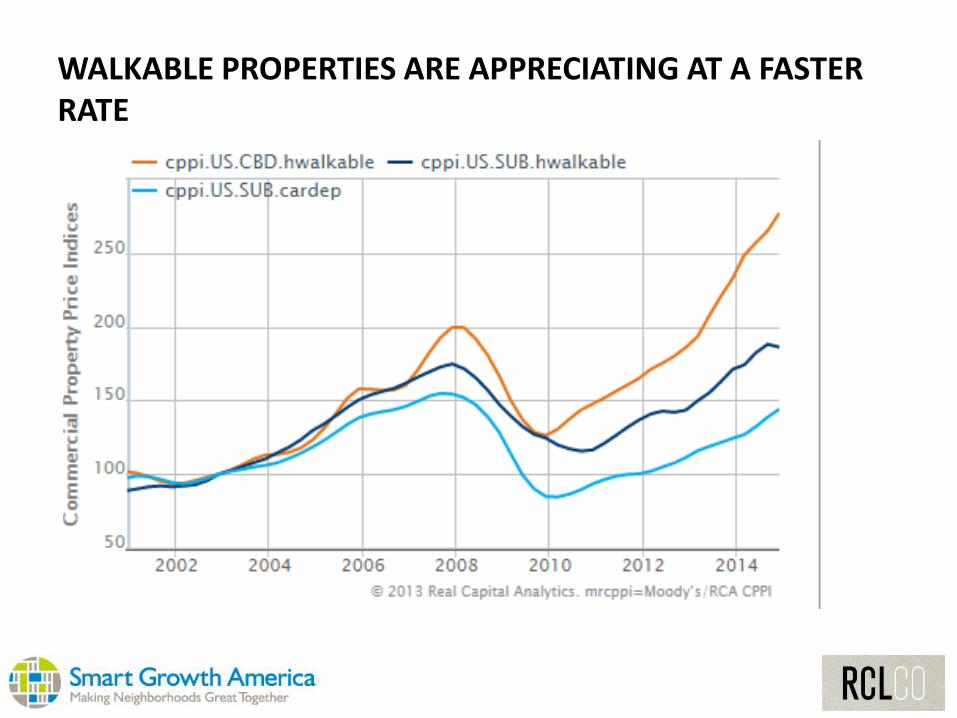
WALKABLE PROPERTIES ARE APPRECIATING AT A FASTER RATE
19
SUMMARY OF RESULTS IN WEST DES MOINES
SCENARIOS EVALUATED:
Unit Type Low Density Base
Density
Higher
Density
Walkable Urban
Large Lot SFD 150 150 150 0
Standard/Small SFD 5,000 5,000 5,000 1,500
Townhouses 1,125 1,125 1,125 3,275
Multifamily Units 3,000 3,000 3,000 4,500
Total Units 9,275 9,275 9,275 9,275
Total Gross Acres 2,654 2,188 1,728 783
Net Residential
Density
5.5 6.9 10.8 22.4
Commercial SF 2,690,000 2,690,000 2,690,000 2,690,000
TOTAL NET FISCAL IMPACT INCREASES WITH HIGHER DENSITY
$0
$2,000,000
$4,000,000
$6,000,000
$8,000,000
$10,000,000
$12,000,000
Low Density Base Density Higher Density Walkable Urban
Projected Net Fiscal Impact per Acre by Scenario
City of West Des Moines West Des Moines School District
IMPROVEMENTS IN NET FISCAL IMPACT PER ACRE ARE MUCH MORE DRAMATIC
$0
$2,000
$4,000
$6,000
$8,000
$10,000
$12,000
$14,000
$16,000
$18,000
$20,000
Low Density Base Density Higher Density Walkable Urban
Projected Net Fiscal Impact per Acre by Scenario
City of West Des Moines West Des Moines School District
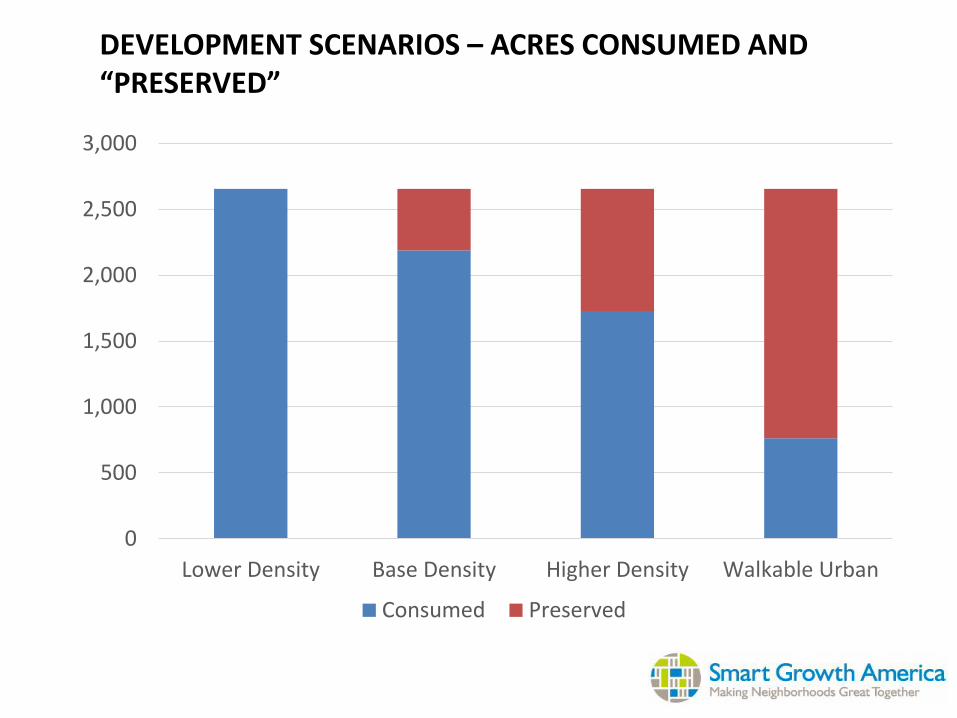
DEVELOPMENT SCENARIOS – ACRES CONSUMED AND “PRESERVED”
0
500
1,000
1,500
2,000
2,500
3,000
Lower Density Base Density Higher Density Walkable Urban
Consumed Preserved
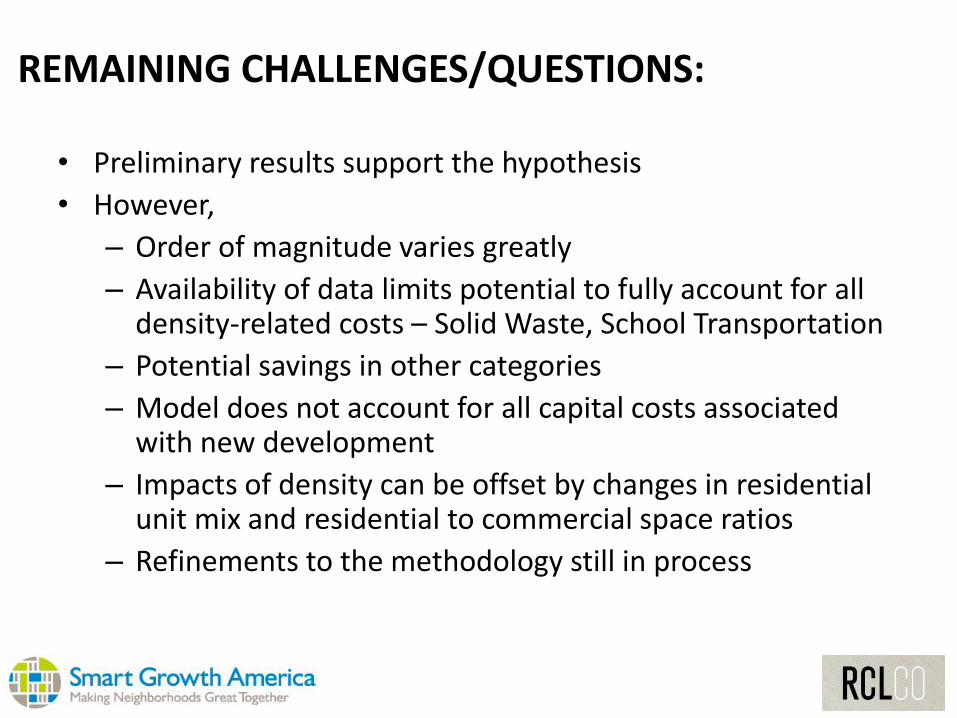
• Preliminary results support the hypothesis
• However,
– Order of magnitude varies greatly
– Availability of data limits potential to fully account for all density-related costs – Solid Waste, School Transportation
– Potential savings in other categories
– Model does not account for all capital costs associated with new development
– Impacts of density can be offset by changes in residential unit mix and residential to commercial space ratios
– Refinements to the methodology still in process
REMAINING CHALLENGES/QUESTIONS:
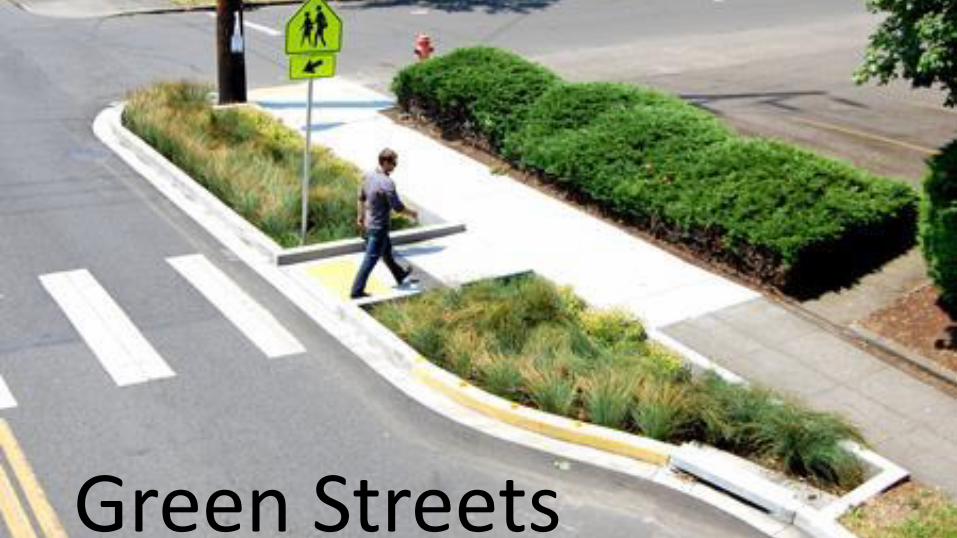
Green Streets
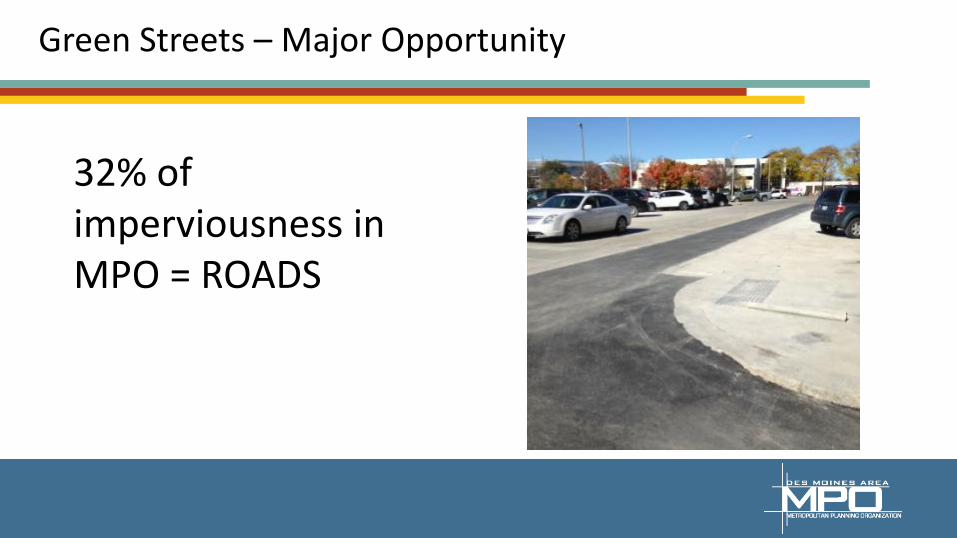
Green Streets – Major Opportunity
32% of imperviousness in MPO = ROADS
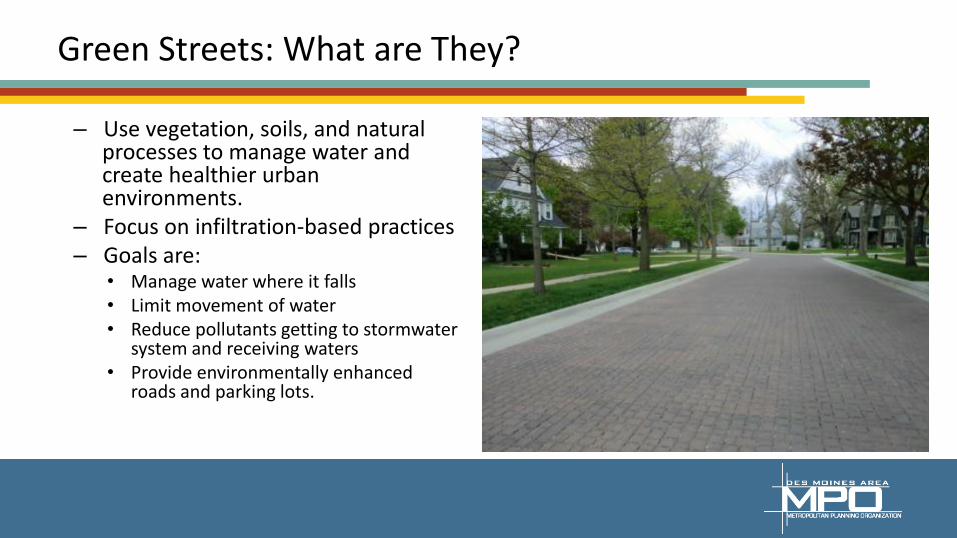
Green Streets: What are They?
– Use vegetation, soils, and natural processes to manage water and create healthier urban environments.
– Focus on infiltration-based practices– Goals are:
• Manage water where it falls• Limit movement of water• Reduce pollutants getting to stormwater
system and receiving waters• Provide environmentally enhanced
roads and parking lots.
Benefits of Green Streets
• Reduced stormwater sent via pipe into receiving streams, rivers and lakes
• Reduced flooding and localized ponding
• Reduced long-term maintenance costs and improved road durability
• Improved water quality
• Improved aesthetics
Green Streets & Regional Plans
The Tomorrow Plan: Goal 2: Improve the region’s environmental health and access to the outdoors• Build a region-wide greenways system• Develop a regional stormwater approach that includes natural systems• Expand tree canopy and regional park capacity –acres, facilities, programs, and connections
Capital Crossroads: Natural Capital• Work to preserve and sustain Central Iowa’s rivers, streams, and watersheds• Effectively manage stormwater issues in Central Iowa• Secure and leverage resources to enhance and protect Central Iowa’s natural environments
FourmileCreek Watershed Management AuthorityRecommends Green Streets Implementation
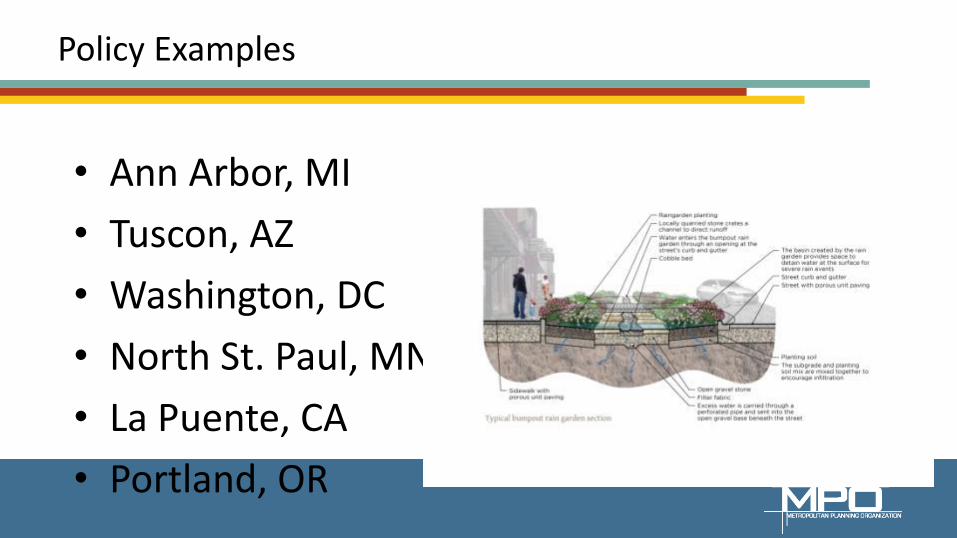
Policy Examples
• Ann Arbor, MI
• Tuscon, AZ
• Washington, DC
• North St. Paul, MN
• La Puente, CA
• Portland, OR
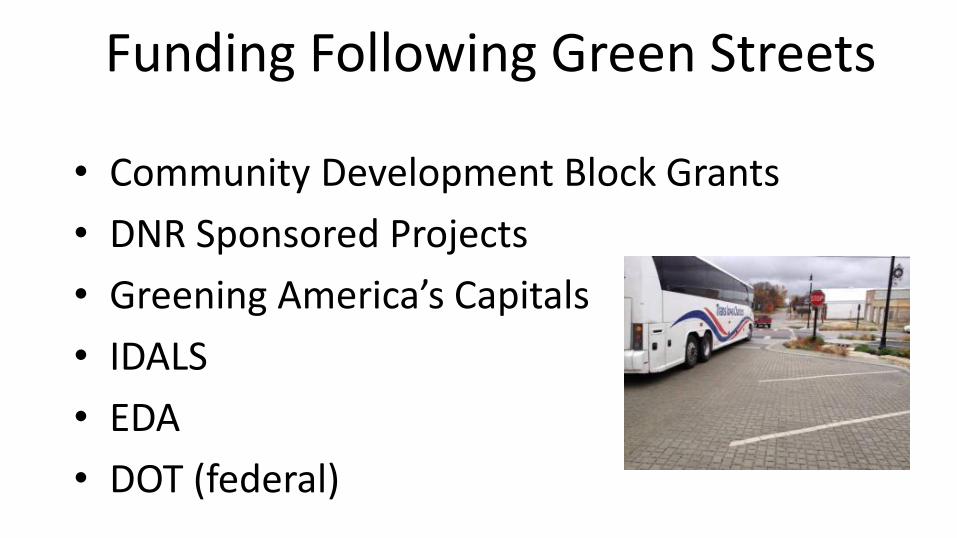
Funding Following Green Streets
• Community Development Block Grants
• DNR Sponsored Projects
• Greening America’s Capitals
• IDALS
• EDA
• DOT (federal)

Funding Following Green Streets• Community Development Block Grants
• DNR Sponsored Projects
• Greening America’s Capitals
• IDALS
• EDA
• DOT (federal)
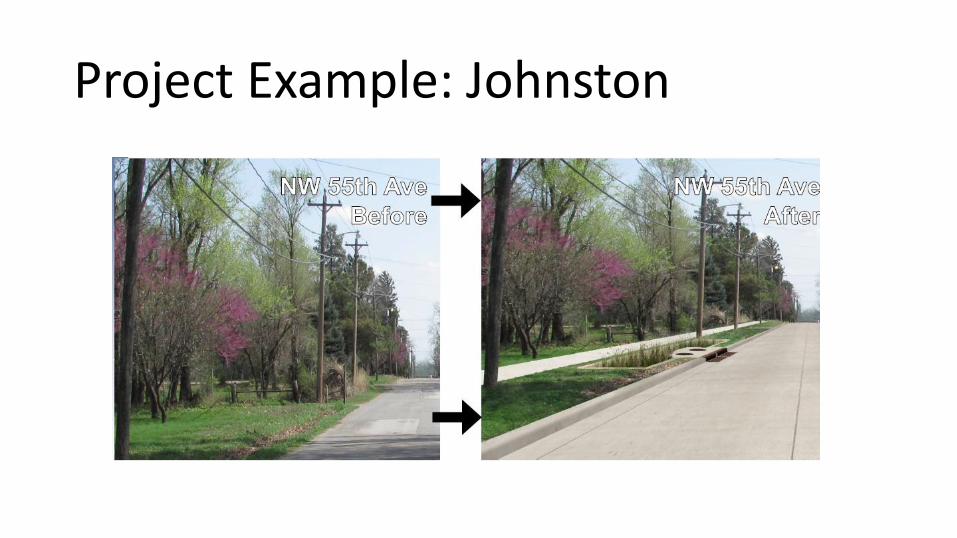
Project Example: Johnston
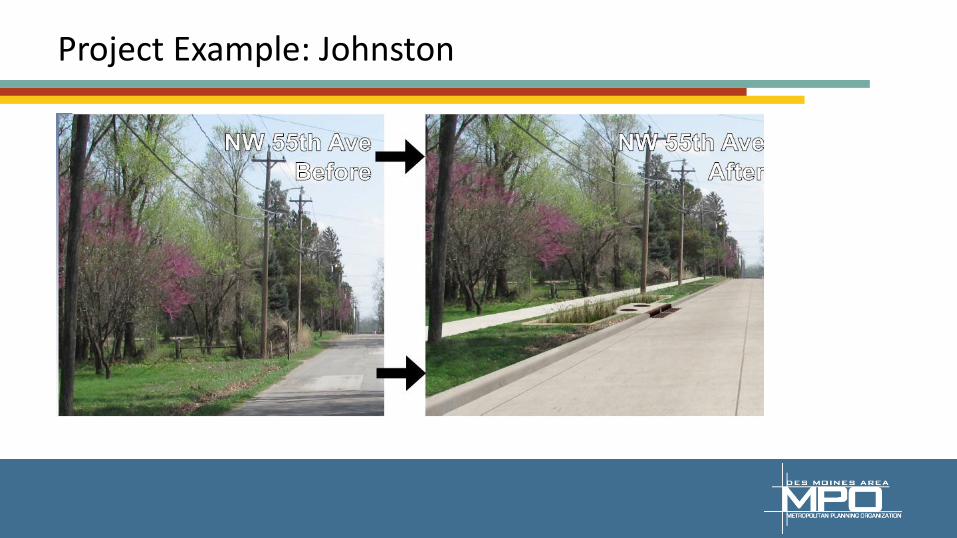
Project Example: Johnston
Project Example: Johnston
Why• Significant failures experienced from the systems
designed and installed over the past years• Sustainable long-term solution to the storm drainage
issue• Linear treatment for the first flush required by storm
water standards were a possible solution to purchasing more property for local or regional detention systems
Project Example: Johnston
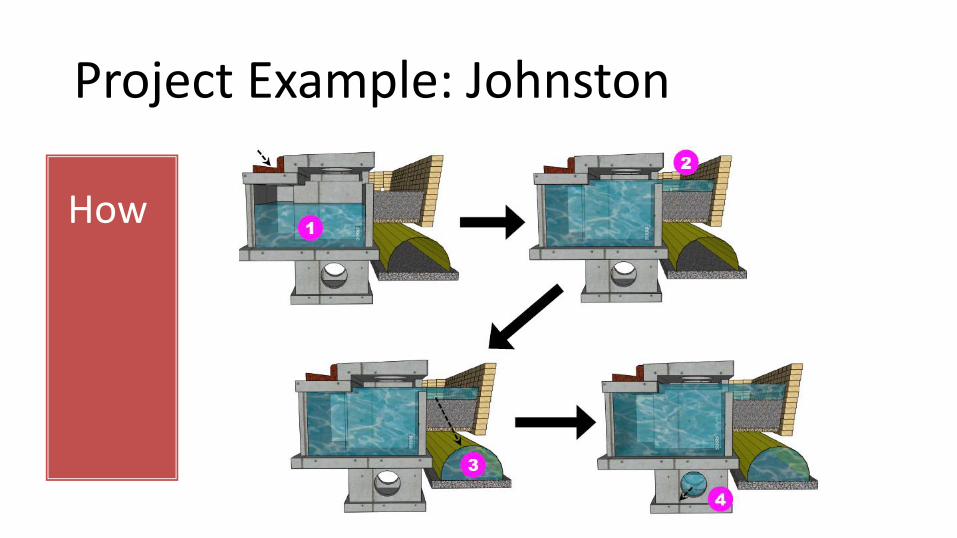
How
Project Example: Johnston
Benefits• Achieved in the right of way in a linear process • Saves cost in pipe since the largest pipe required is 15
inches (conventional storm sewer design require a 30-36 inches)
• Significant cost savings by avoiding property acquisition for a detention basin is avoided which results in significant
• CDBG funds from the IEDA and design assistance from Urban Conservationists Wayne and Jennifer.
• Design intent to divert and infiltrate the first flush (1 ¼ inch event) as required by the storm water standards.
Project Example: Johnston
Benefits• Refined to treat up to 2 ¼ inch event with no release and
convey a 6 inch event for the initial project design without surcharging.
• Met water quality requirement • New system will not create a burden on the existing storm
sewer that provide the outlet. • Negated the need to build a parallel storm sewer to the
outlet existing sewer by reducing the impact of the new storm system.
• Improved aesthetics of neighborhood
Project Example: Johnston
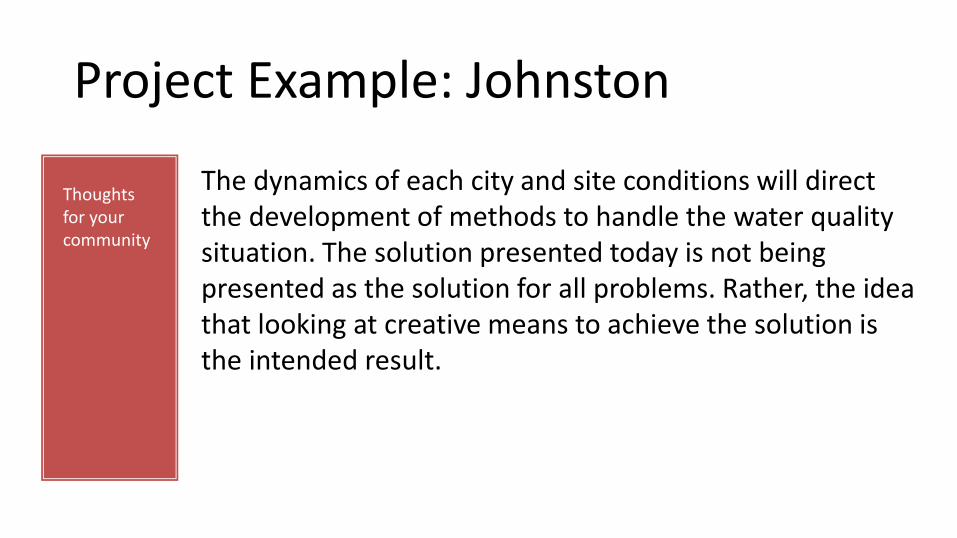
Thoughts for your community
• We are all stewards of our environment • Look to new and innovative approaches to handling the
changing dynamics that we are confronted with. • Storm water requirements as unfunded mandates but
old standards for design are producing costly projects to repair years of erosion.
• Johnston has incurred millions of dollars in cost in recent years to repair erosion issues resulting from the old standards.
Project Example: Johnston
Thoughts for your community
The dynamics of each city and site conditions will direct the development of methods to handle the water quality situation. The solution presented today is not being presented as the solution for all problems. Rather, the idea that looking at creative means to achieve the solution is the intended result.
Project Example: Johnston
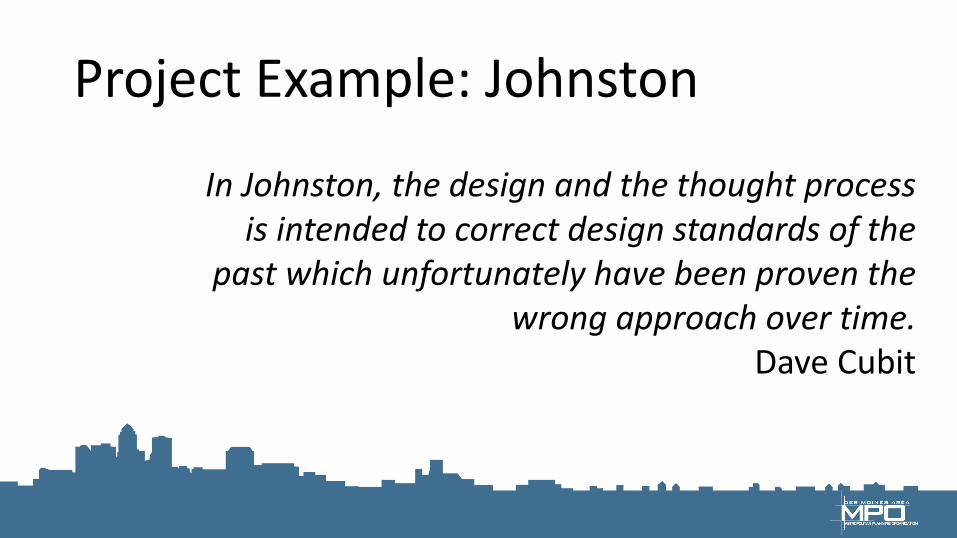
In Johnston, the design and the thought process is intended to correct design standards of the
past which unfortunately have been proven the wrong approach over time.
Dave Cubit
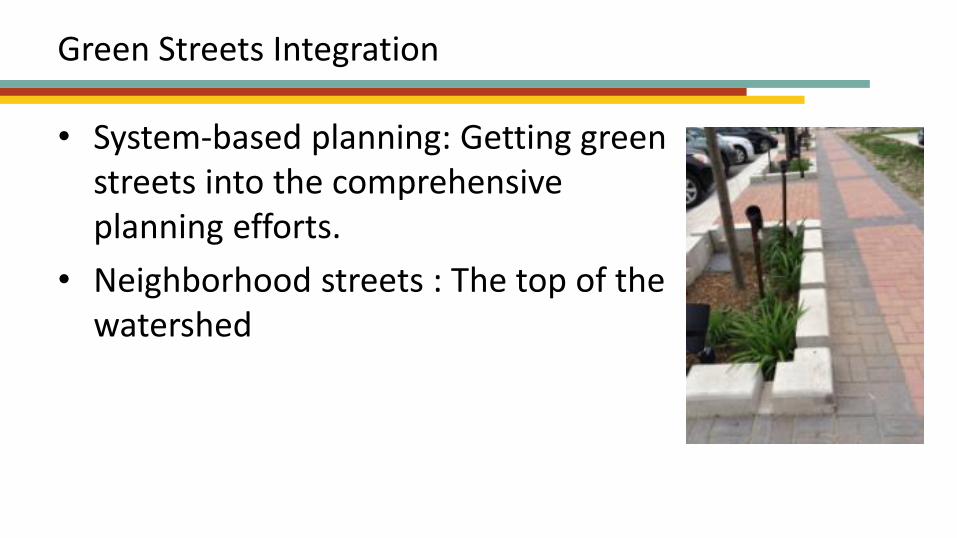
Green Streets Integration
• System-based planning: Getting green streets into the comprehensive planning efforts.
• Neighborhood streets : The top of the watershed
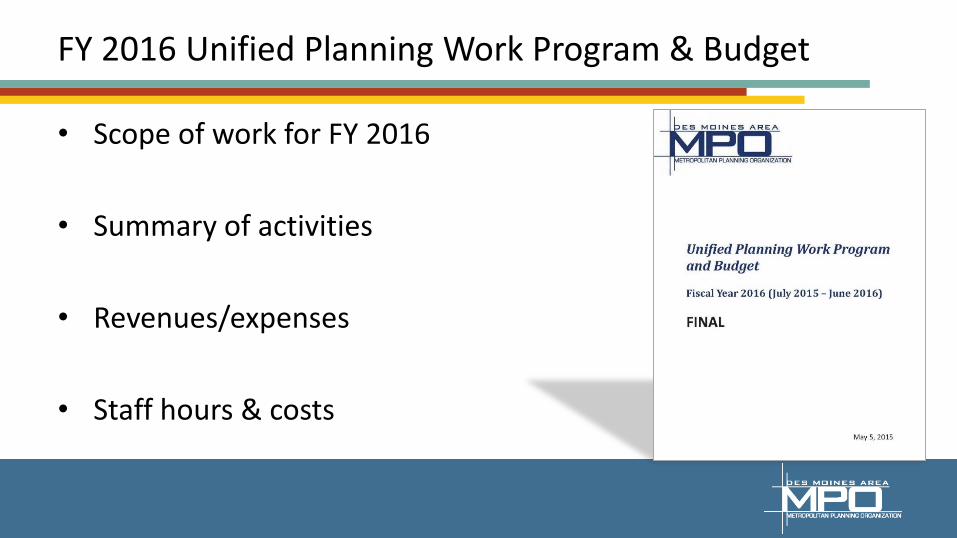
FY 2016 Unified Planning Work Program & Budget
• Scope of work for FY 2016
• Summary of activities
• Revenues/expenses
• Staff hours & costs
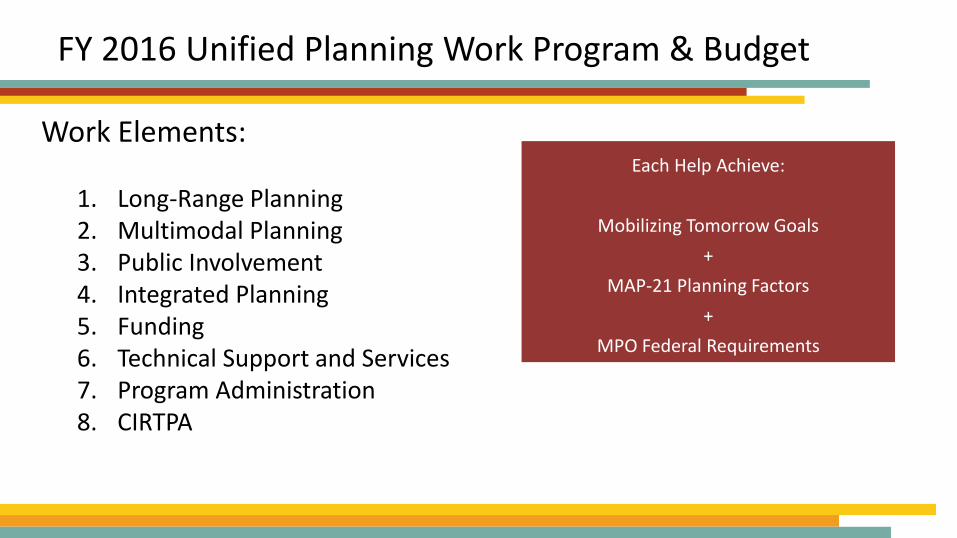
Work Elements:
1. Long-Range Planning2. Multimodal Planning3. Public Involvement4. Integrated Planning5. Funding6. Technical Support and Services7. Program Administration8. CIRTPA
Each Help Achieve:
Mobilizing Tomorrow Goals
+
MAP-21 Planning Factors
+
MPO Federal Requirements
FY 2016 Unified Planning Work Program & Budget
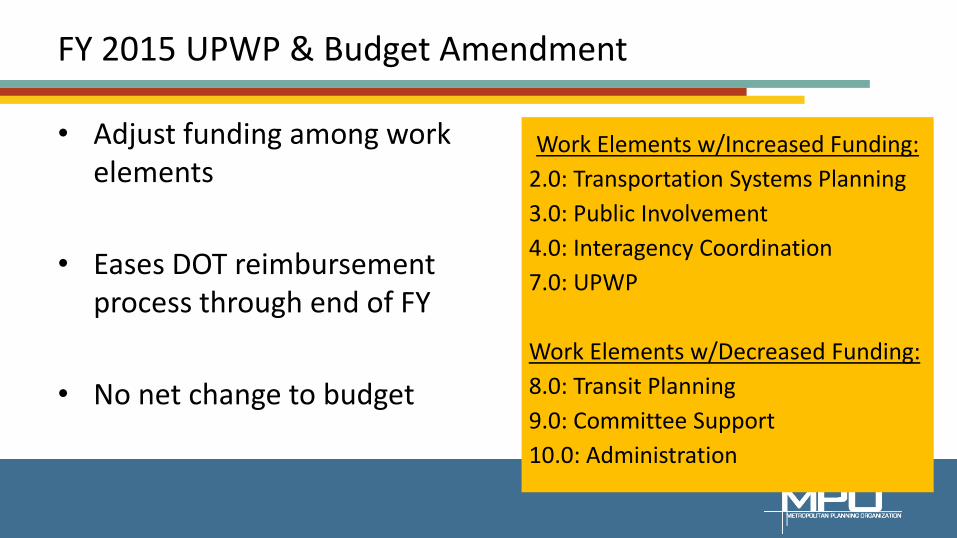
FY 2015 UPWP & Budget Amendment
• Adjust funding among work elements
• Eases DOT reimbursement process through end of FY
• No net change to budget
Work Elements w/Increased Funding:
2.0: Transportation Systems Planning
3.0: Public Involvement
4.0: Interagency Coordination
7.0: UPWP
Work Elements w/Decreased Funding:
8.0: Transit Planning
9.0: Committee Support
10.0: Administration
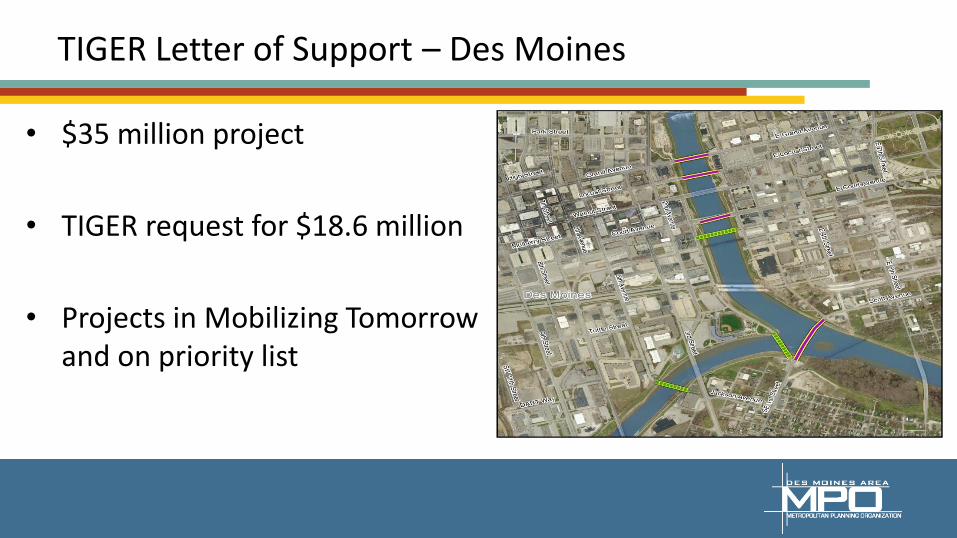
TIGER Letter of Support – Des Moines
• $35 million project
• TIGER request for $18.6 million
• Projects in Mobilizing Tomorrow and on priority list
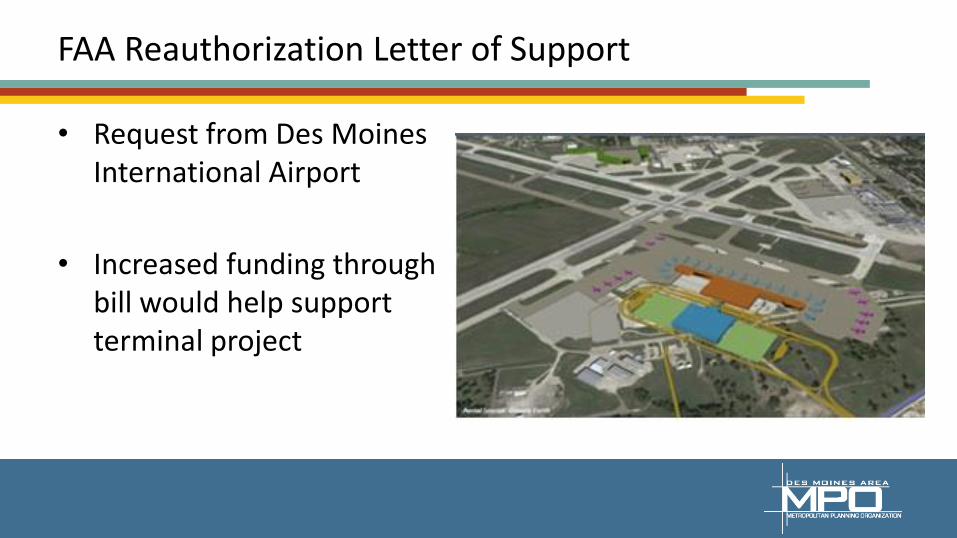
FAA Reauthorization Letter of Support
• Request from Des Moines International Airport
• Increased funding through bill would help support terminal project
Executive Director Annual Review
• Annual review survey issued in early 2015
• Review committee:
– Kyle Mertz, City of Altoona
– Gary Lorenz, City of Ankeny
– Ruth Randleman, City of Carlisle
– Joe Gatto, City of Des Moines
– Tom Hadden, City of West Des Moines

FFY 2015-2018 TIP Revision Request
• TPMS #33886: Safe Routes to School –School Zone Flashing Beacons project
• Federal Aid Amount: $80,000
• Total Cost: $110,000
• Type of Funding: TAP
• Change: Move project forward from FFY 2019 to FFY 2015 by adding the project into the FFY 2015-2018 TIP
THE CASE FOR COMPLETE STREETSMessaging for your community
May 28, 2015
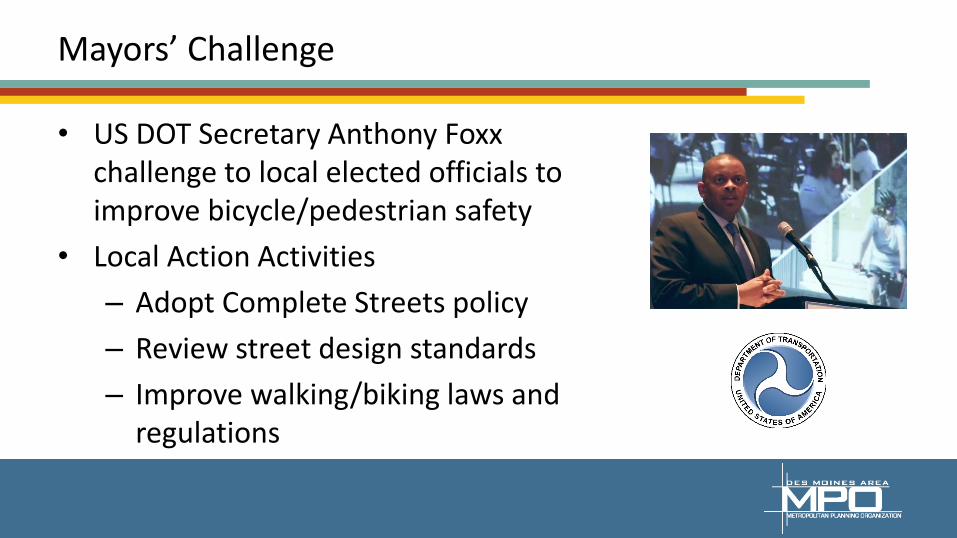
Mayors’ Challenge
• US DOT Secretary Anthony Foxx challenge to local elected officials to improve bicycle/pedestrian safety
• Local Action Activities
– Adopt Complete Streets policy
– Review street design standards
– Improve walking/biking laws and regulations
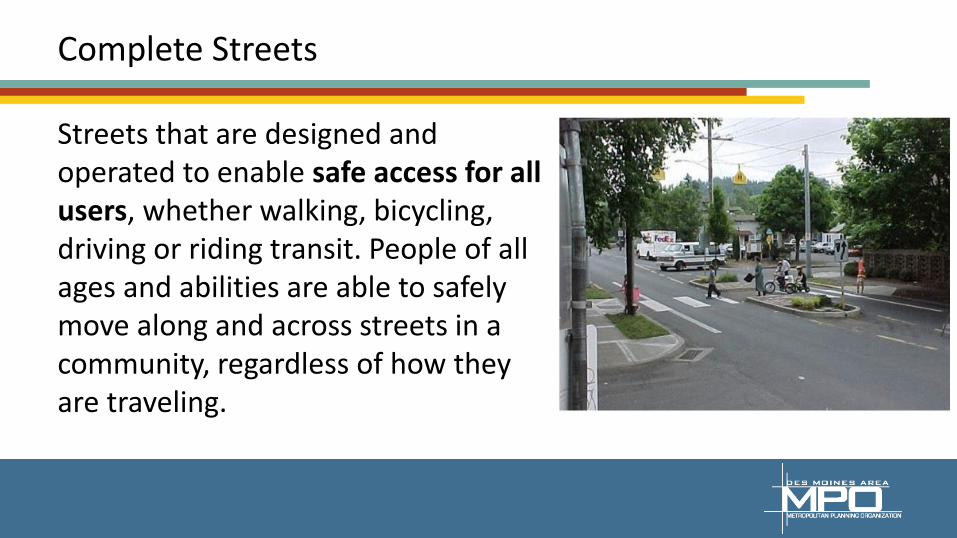
Complete Streets
Streets that are designed and operated to enable safe access for all users, whether walking, bicycling, driving or riding transit. People of all ages and abilities are able to safely move along and across streets in a community, regardless of how they are traveling.
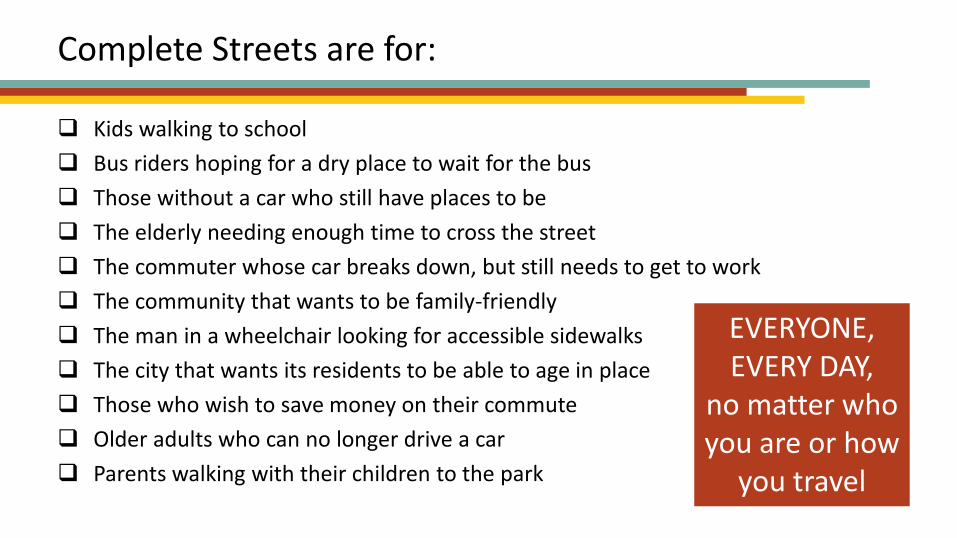
Complete Streets are for:
Kids walking to school
Bus riders hoping for a dry place to wait for the bus
Those without a car who still have places to be
The elderly needing enough time to cross the street
The commuter whose car breaks down, but still needs to get to work
The community that wants to be family-friendly
The man in a wheelchair looking for accessible sidewalks
The city that wants its residents to be able to age in place
Those who wish to save money on their commute
Older adults who can no longer drive a car
Parents walking with their children to the park
EVERYONE,EVERY DAY,
no matter who you are or how
you travel
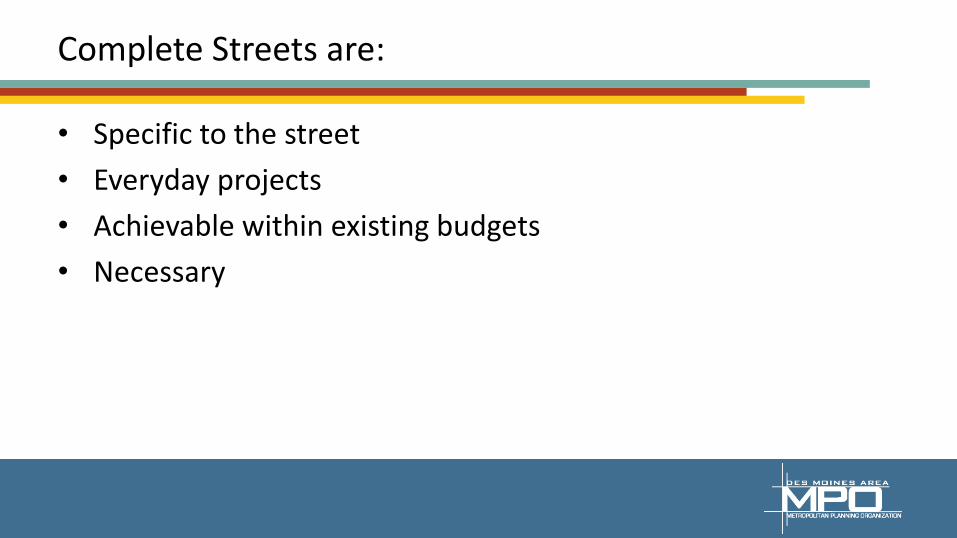
Complete Streets are:
• Specific to the street
• Everyday projects
• Achievable within existing budgets
• Necessary
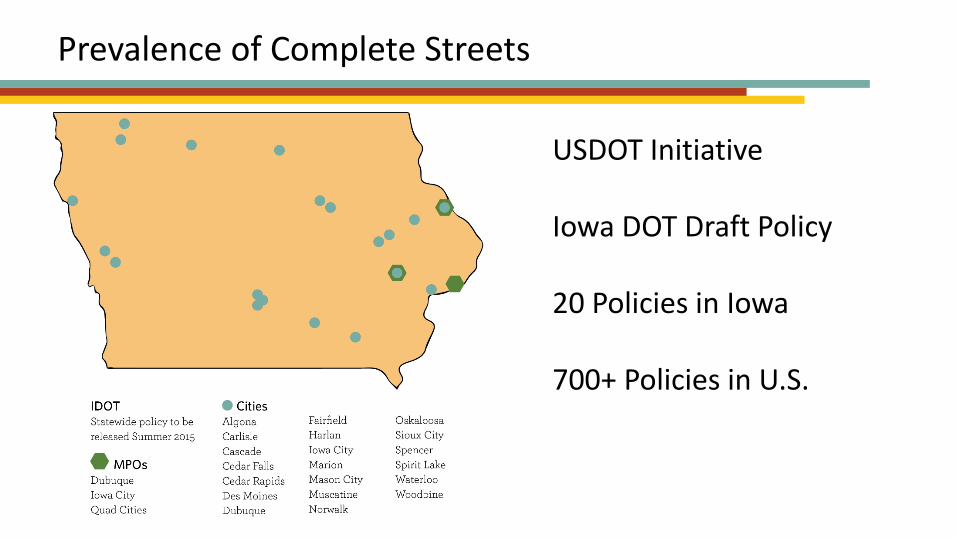
Prevalence of Complete Streets
USDOT Initiative
Iowa DOT Draft Policy
20 Policies in Iowa
700+ Policies in U.S.

12
3
4
Healthy
Safe
Prosperous
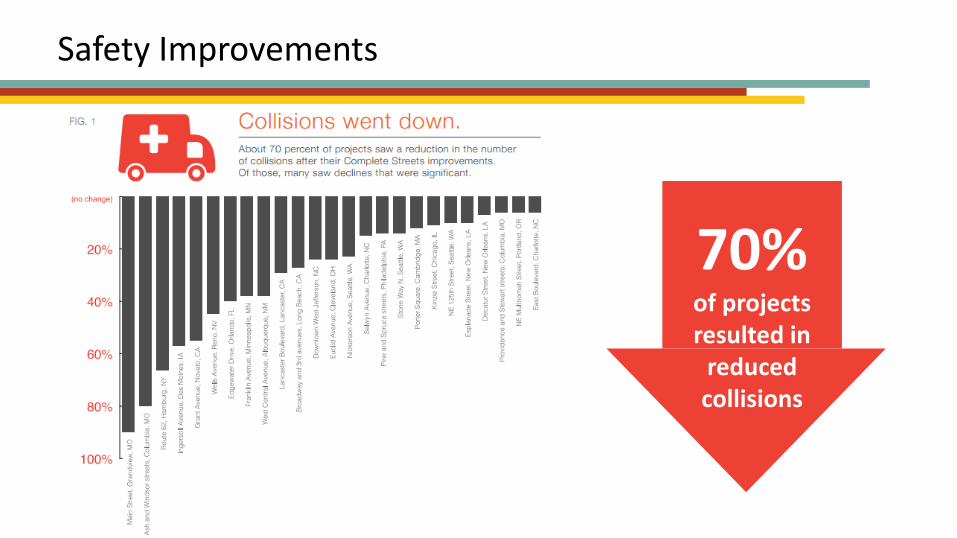
Safety Improvements
70% of projects resulted in
reduced collisions
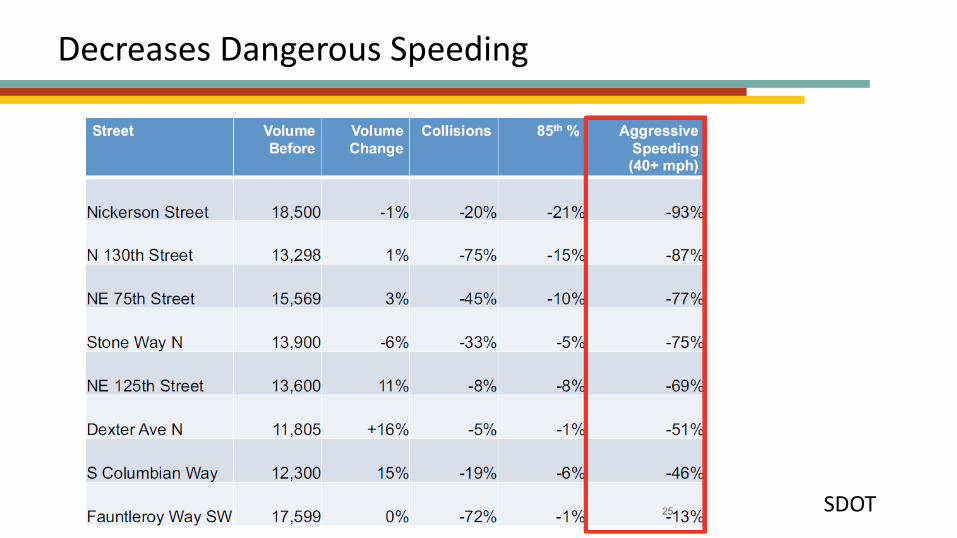
Decreases Dangerous Speeding
SDOT
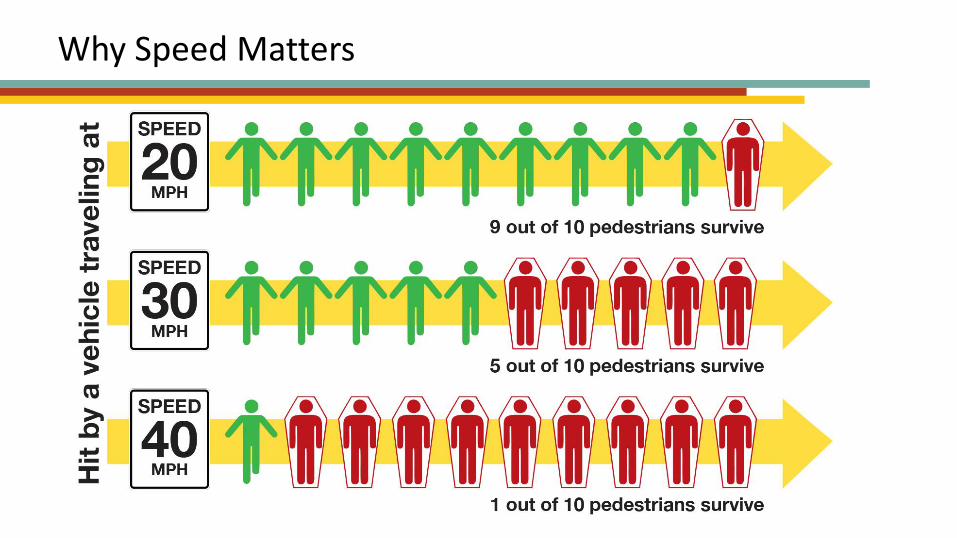
Why Speed Matters

3
4
21
Prosperous
Healthy
Safe
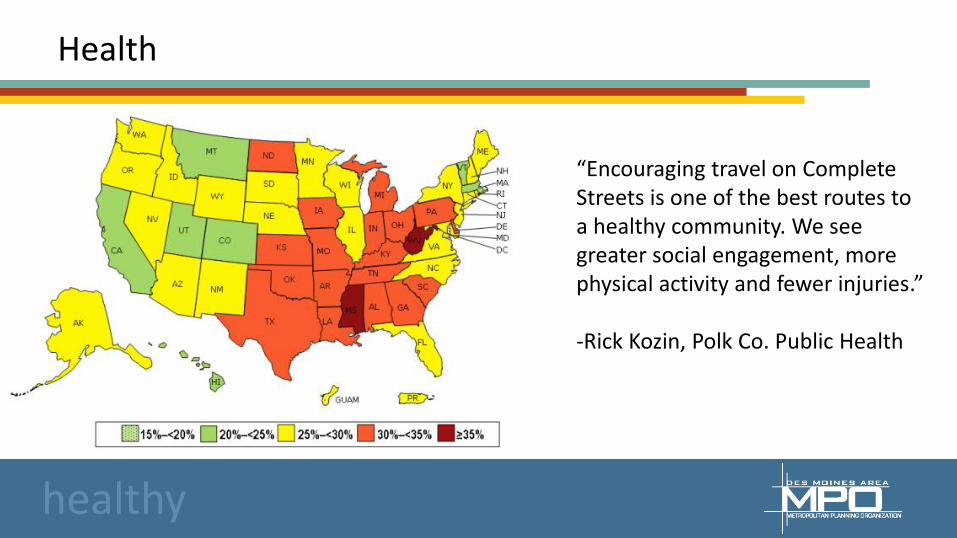
Health
“Encouraging travel on Complete Streets is one of the best routes to a healthy community. We see greater social engagement, more physical activity and fewer injuries.”
-Rick Kozin, Polk Co. Public Health
healthy
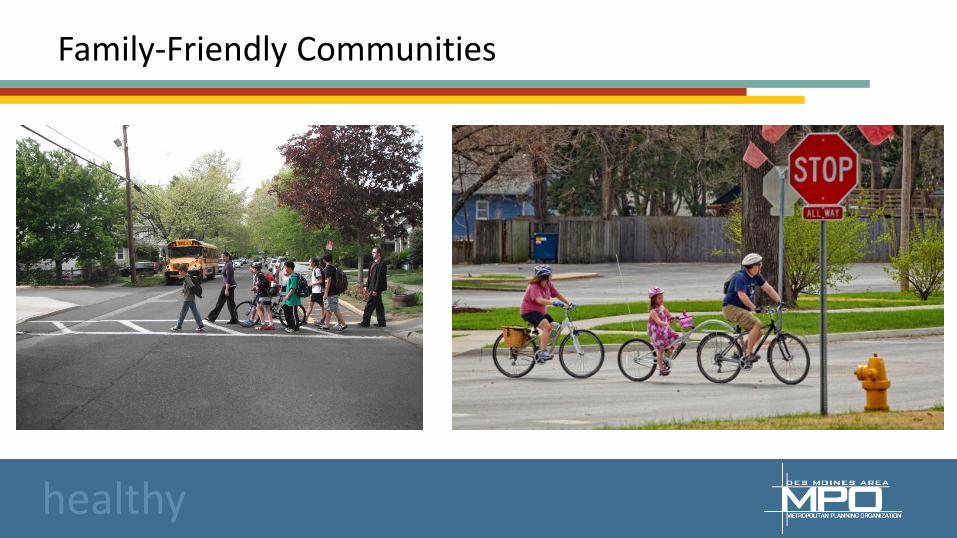
Family-Friendly Communities
healthy
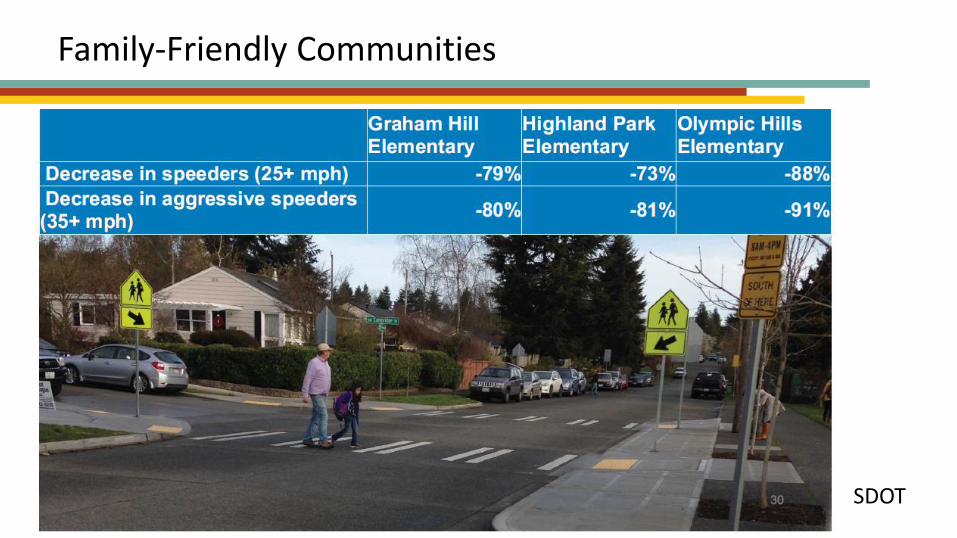
Family-Friendly Communities
SDOT
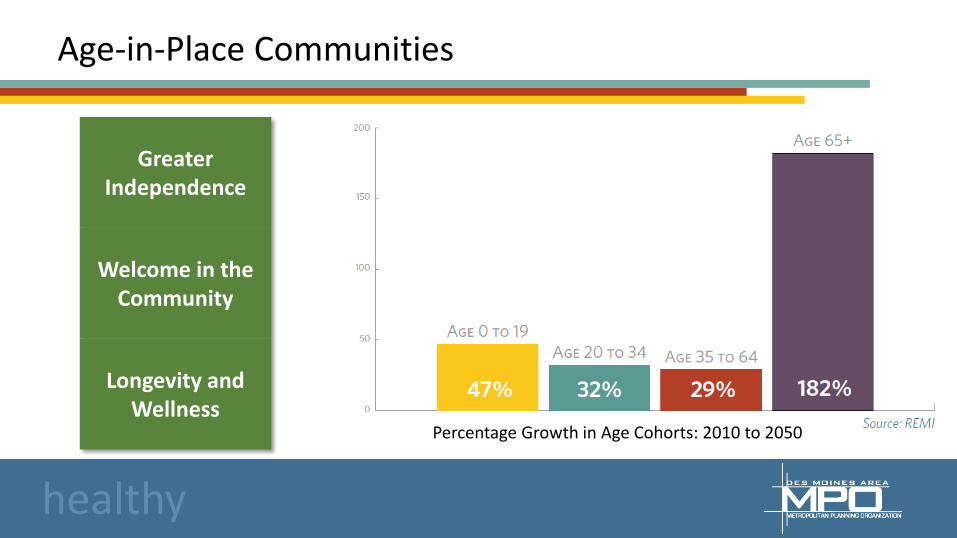
Age-in-Place Communities
Greater Independence
Welcome in the Community
Longevity and Wellness
Percentage Growth in Age Cohorts: 2010 to 2050
healthy

4
1
32
Safe
Prosperous
Healthy
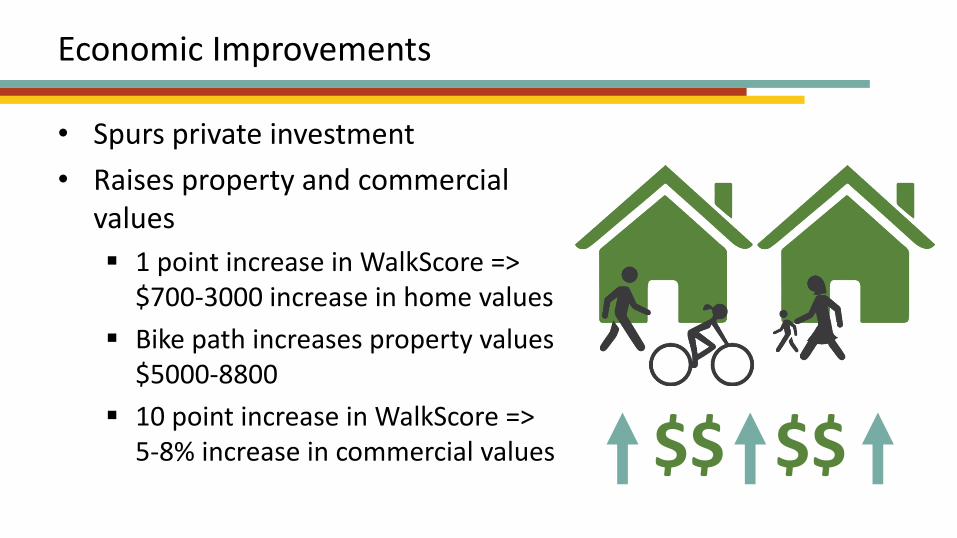
Economic Improvements
• Spurs private investment
• Raises property and commercial values
1 point increase in WalkScore => $700-3000 increase in home values
Bike path increases property values $5000-8800
10 point increase in WalkScore => 5-8% increase in commercial values $$ $$
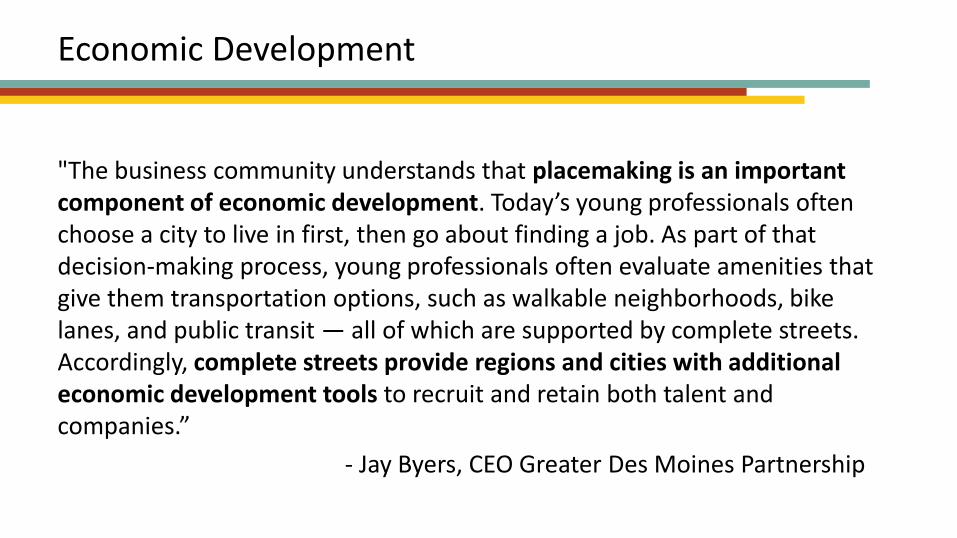
Economic Development
"The business community understands that placemaking is an important component of economic development. Today’s young professionals often choose a city to live in first, then go about finding a job. As part of that decision-making process, young professionals often evaluate amenities that give them transportation options, such as walkable neighborhoods, bike lanes, and public transit — all of which are supported by complete streets. Accordingly, complete streets provide regions and cities with additional economic development tools to recruit and retain both talent and companies.”
- Jay Byers, CEO Greater Des Moines Partnership
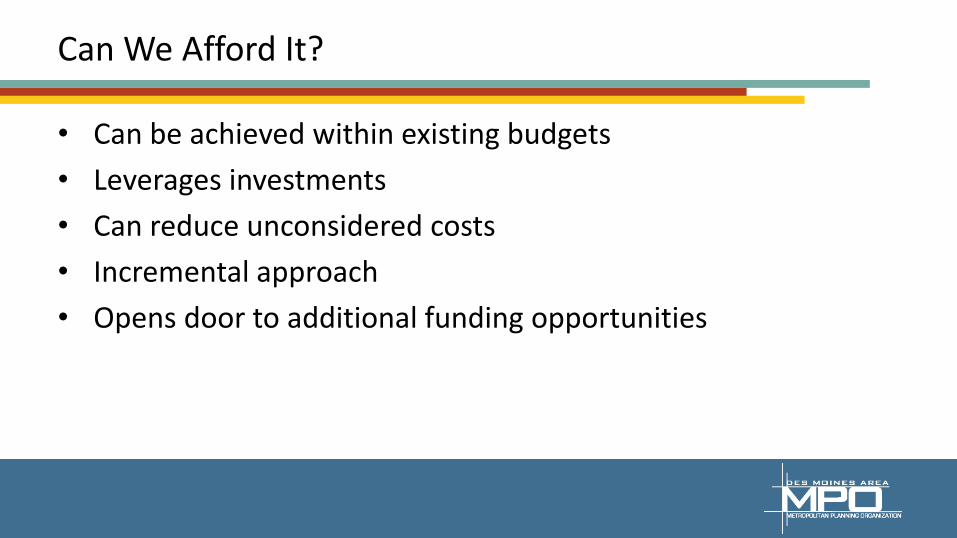
Can We Afford It?
• Can be achieved within existing budgets
• Leverages investments
• Can reduce unconsidered costs
• Incremental approach
• Opens door to additional funding opportunities
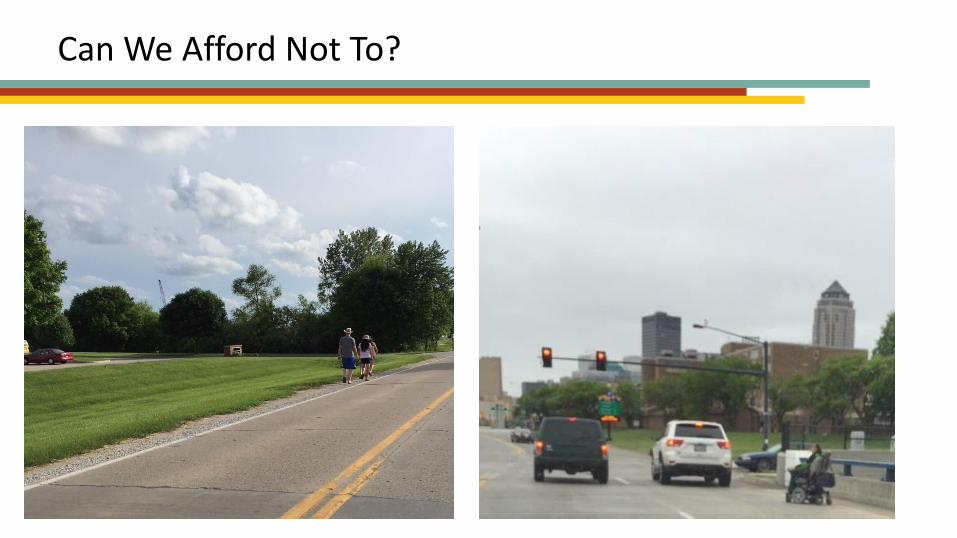
Can We Afford Not To?
Communicating Complete Streets
• Safe, healthy, prosperous
• Planning for people, families, communities
• Tell stories, connect to values
• This is achievable, necessary and valuable
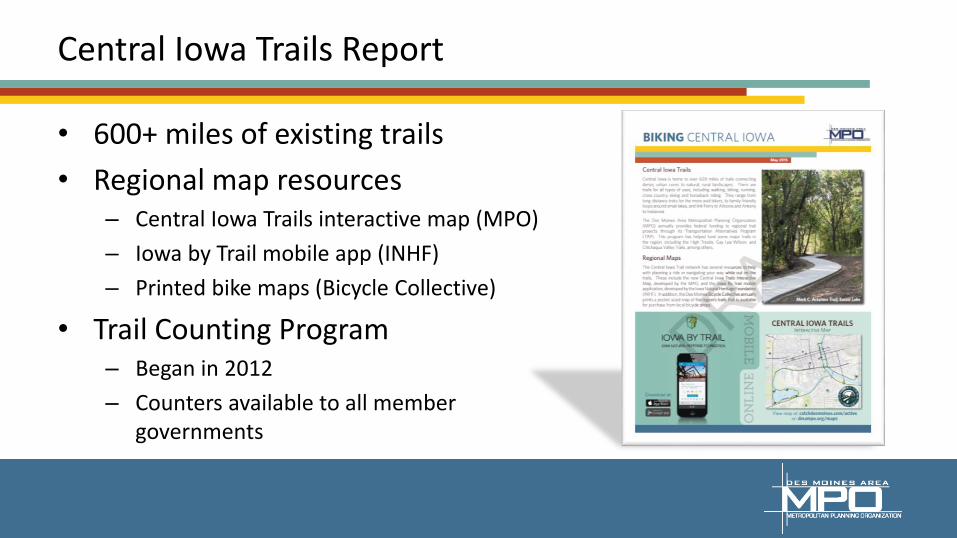
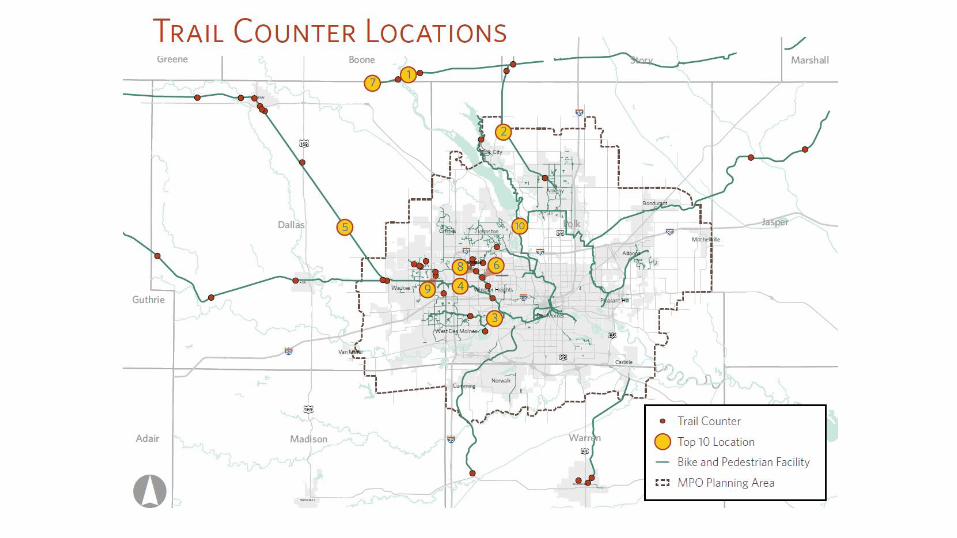
Central Iowa Trails Report
• 600+ miles of existing trails
• Regional map resources– Central Iowa Trails interactive map (MPO)
– Iowa by Trail mobile app (INHF)
– Printed bike maps (Bicycle Collective)
• Trail Counting Program– Began in 2012
– Counters available to all member governments
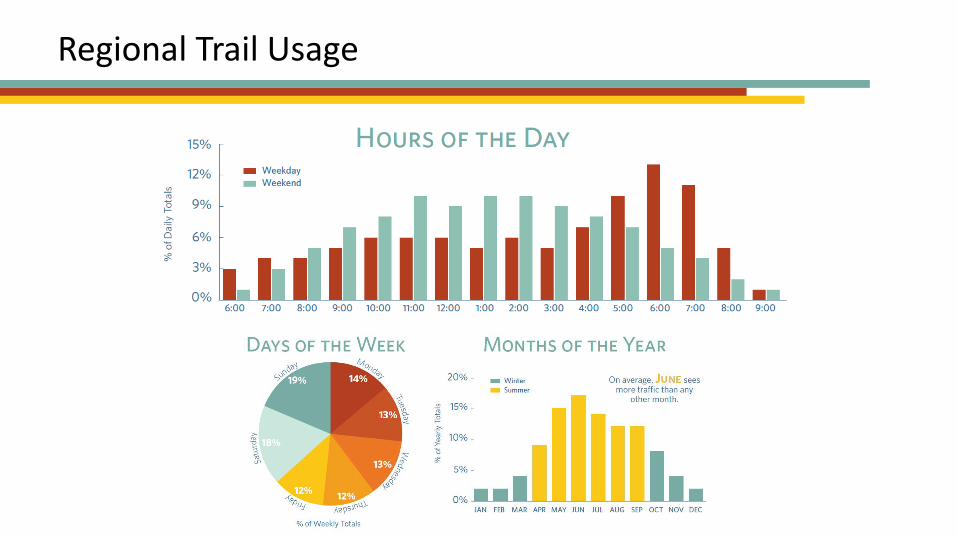
Regional Trail Usage
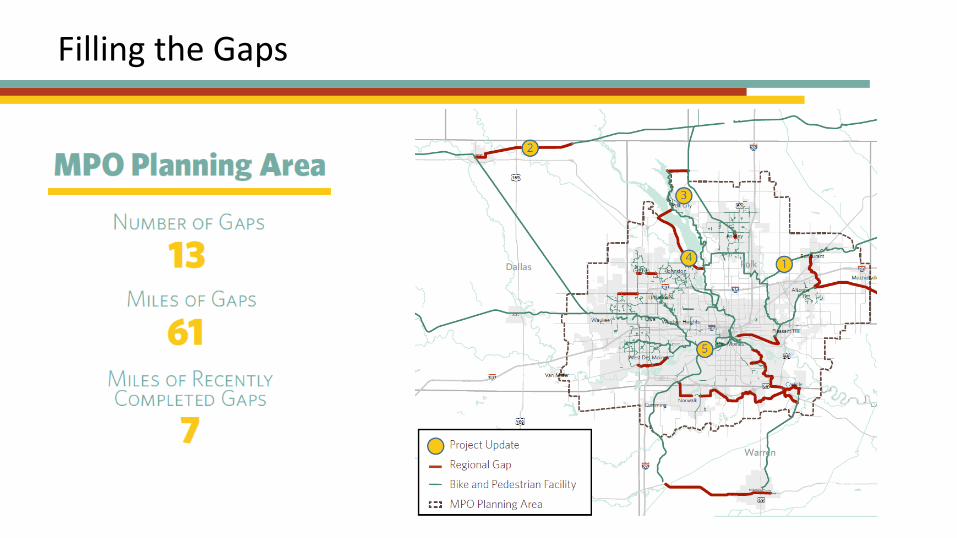
Filling the Gaps
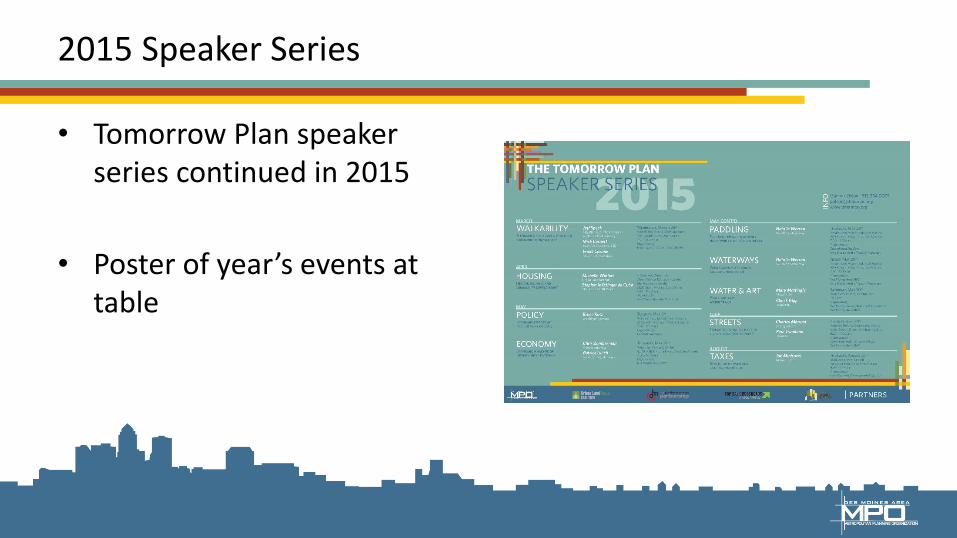
2015 Speaker Series
• Tomorrow Plan speaker series continued in 2015
• Poster of year’s events at table
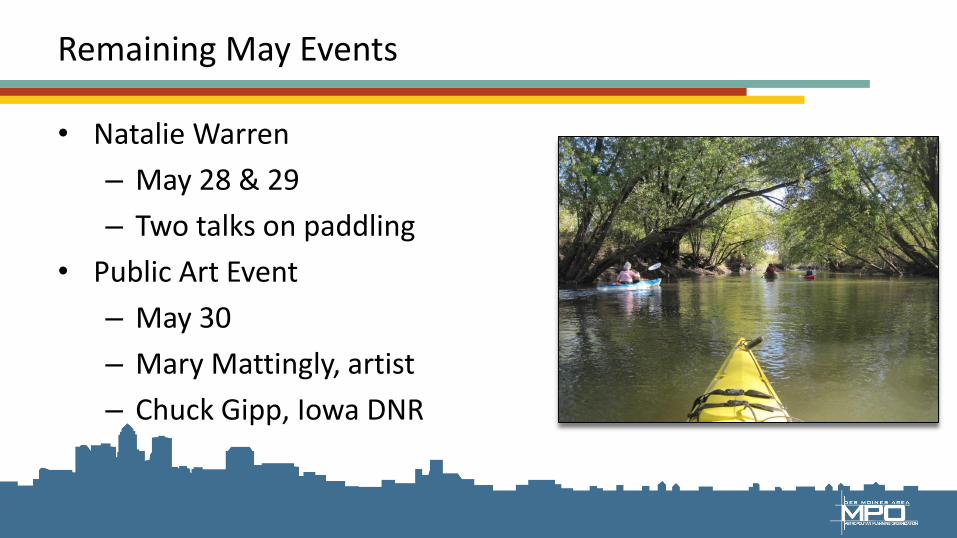
Remaining May Events
• Natalie Warren
– May 28 & 29
– Two talks on paddling
• Public Art Event
– May 30
– Mary Mattingly, artist
– Chuck Gipp, Iowa DNR
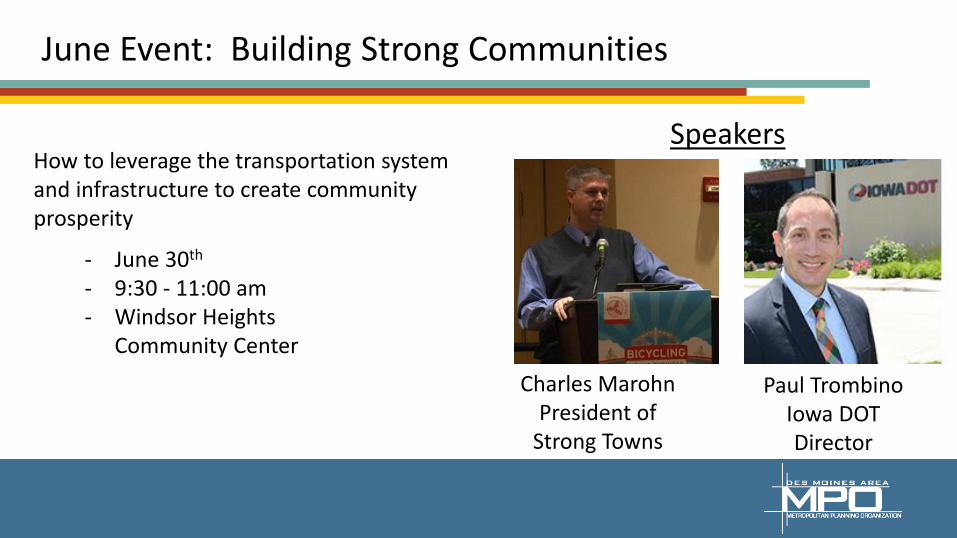
June Event: Building Strong Communities
Speakers
Charles MarohnPresident of
Strong Towns
Paul TrombinoIowa DOT Director
- June 30th
- 9:30 - 11:00 am- Windsor Heights
Community Center
How to leverage the transportation system and infrastructure to create community prosperity
May 28, 2015 Agenda
1. Call to Order2. VOTE: Approval of Agenda3. VOTE: Approval of Meeting Minutes4. CONSENT and VOTE: Approval of April 2015 Financial Statement5. PUBLIC INPUT: TIP Revisions6. PRESENTATION: Smart Growth America Fiscal Impact Study7. PRESENTATION: Green Streets8. REPORT and VOTE: Fiscal Year 2016 Unified Planning Work Program and Budget9. REPORT and VOTE: Fiscal Year 2015 Unified Planning Work Program and Budget – Fourth Amendment10. REPORT and VOTE: TIGER Program Letter of Support11. REPORT and VOTE: FAA Reauthorization Letter of Support 12. REPORT and VOTE: Executive Director Annual Review13. REPORT and VOTE: Federal Fiscal Year 2015-2018 TIP Amendment Request14. REPORT: Communicating Complete Streets15. REPORT: Trail Counter Report16. REPORT: 2015 Speaker Series17. INFORMATION: MPO Progress Report18. Other Non-Action Items of Interest to the Committee19. Next Meeting Date – Thursday, June 18, 2015 – 4:00 pm, Des Moines Area MPO Office20. Adjournment