Embed Size (px)
Citation preview
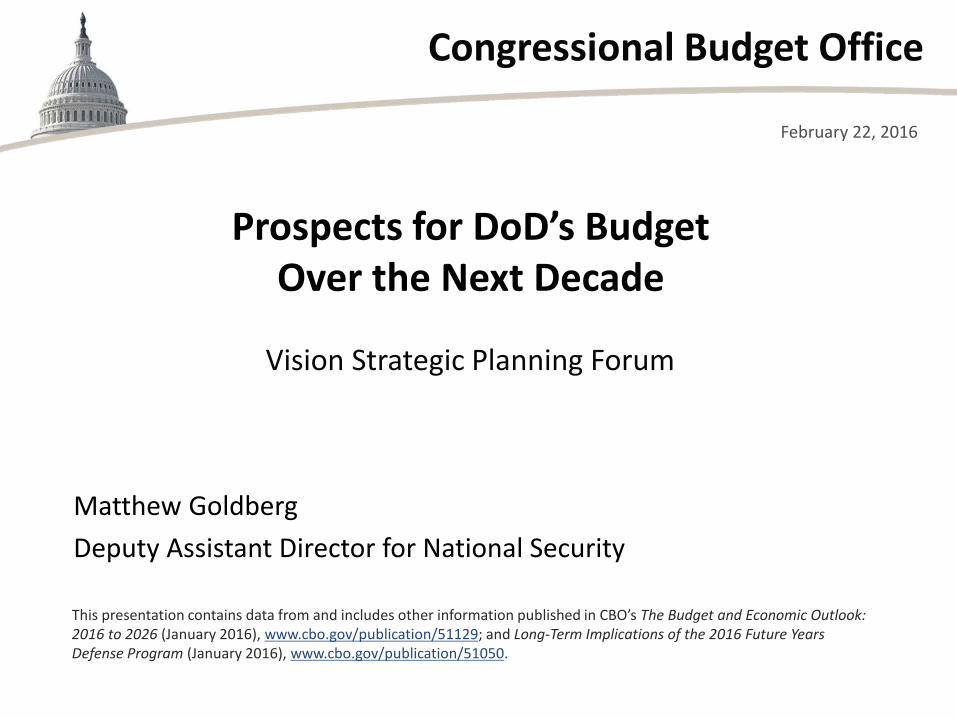
Congressional Budget Office
Vision Strategic Planning Forum
February 22, 2016
Matthew Goldberg Deputy Assistant Director for National Security This presentation contains data from and includes other information published in CBO’s The Budget and Economic Outlook: 2016 to 2026 (January 2016), www.cbo.gov/publication/51129; and Long-Term Implications of the 2016 Future Years Defense Program (January 2016), www.cbo.gov/publication/51050.
Prospects for DoD’s Budget Over the Next Decade
1 CO N GR ES S IO N A L B UDGE T O F F IC E
The U.S. Fiscal Situation
2 CO N GR ES S IO N A L B UDGE T O F F IC E
CBO projects the budget outlook if current laws governing taxes and spending generally remain unchanged.
Relative to the size of the economy, mandatory spending and interest payments are projected to rise while revenues remain relatively flat.
3 CO N GR ES S IO N A L B UDGE T O F F IC E
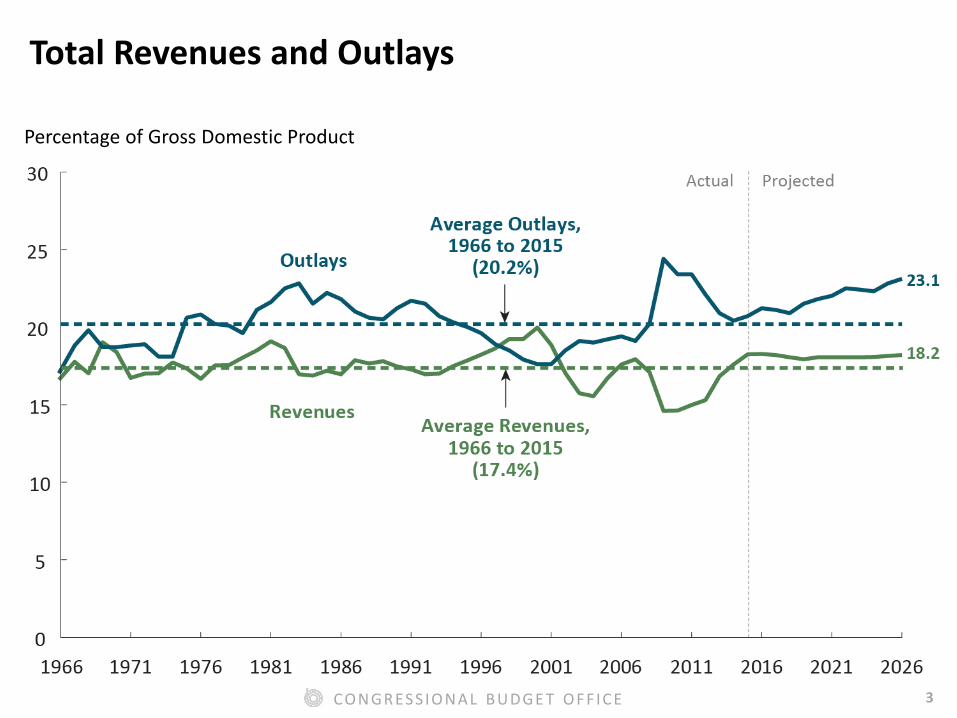
Total Revenues and Outlays
Percentage of Gross Domestic Product
4 CO N GR ES S IO N A L B UDGE T O F F IC E
CBO projects that, under current law, the deficit would remain slightly below 3 percent of gross domestic product (GDP) through 2018, but then start to rise, reaching 4.9 percent in 2026.
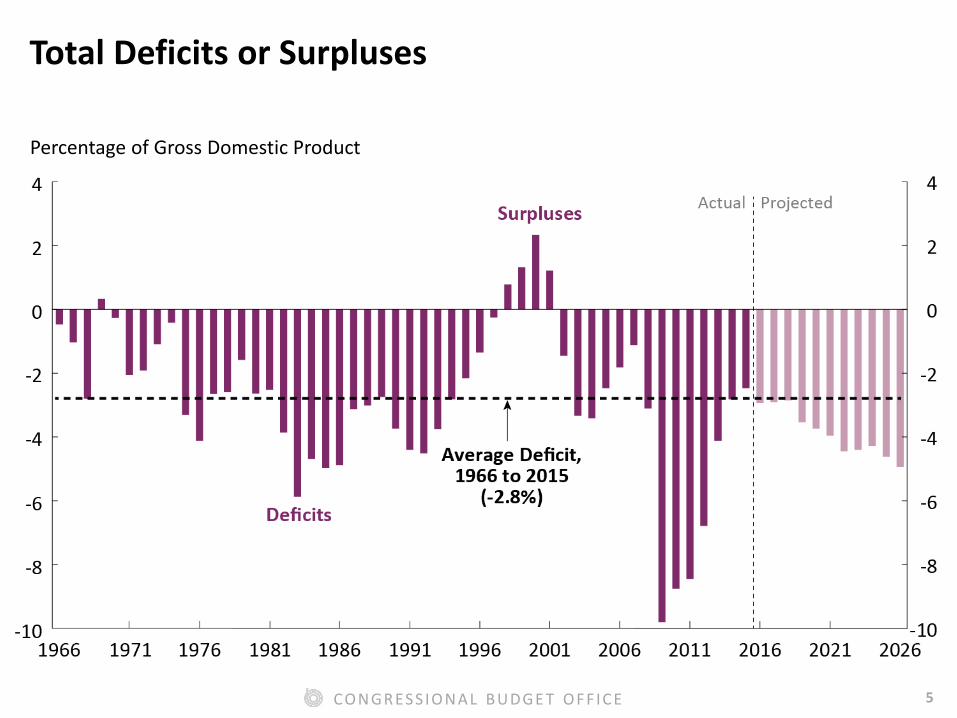
5 CO N GR ES S IO N A L B UDGE T O F F IC E
Total Deficits or Surpluses
Percentage of Gross Domestic Product
6 CO N GR ES S IO N A L B UDGE T O F F IC E
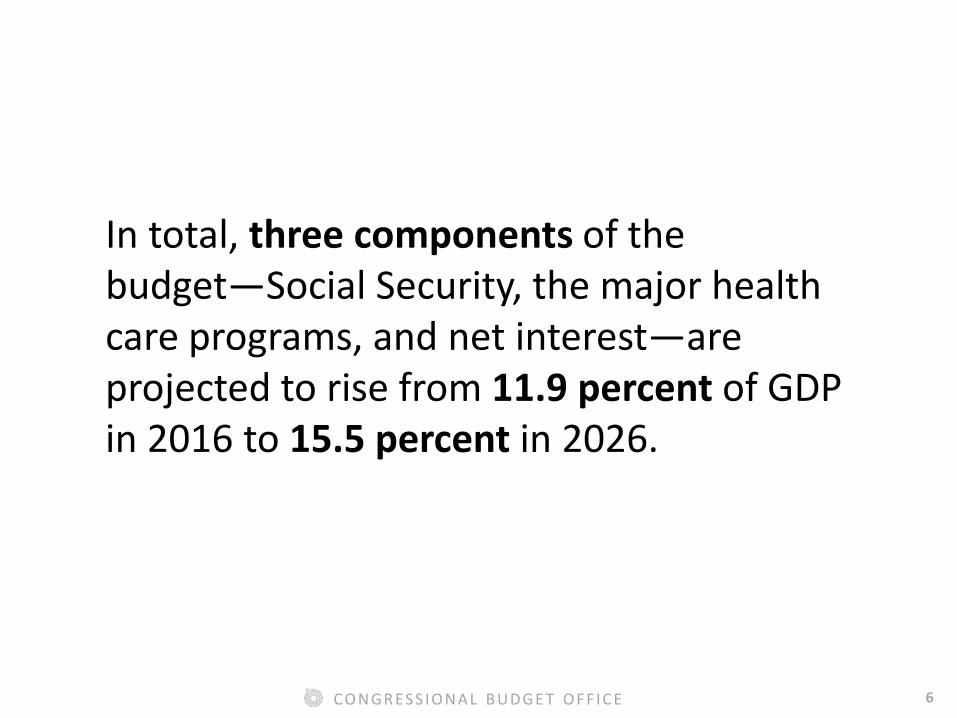
In total, three components of the budget—Social Security, the major health care programs, and net interest—are projected to rise from 11.9 percent of GDP in 2016 to 15.5 percent in 2026.

7 CO N GR ES S IO N A L B UDGE T O F F IC E
Spending and Revenues Projected in CBO’s Baseline, Compared With Actual Values in 1966 and 1991
Percentage of Gross Domestic Product
8 CO N GR ES S IO N A L B UDGE T O F F IC E
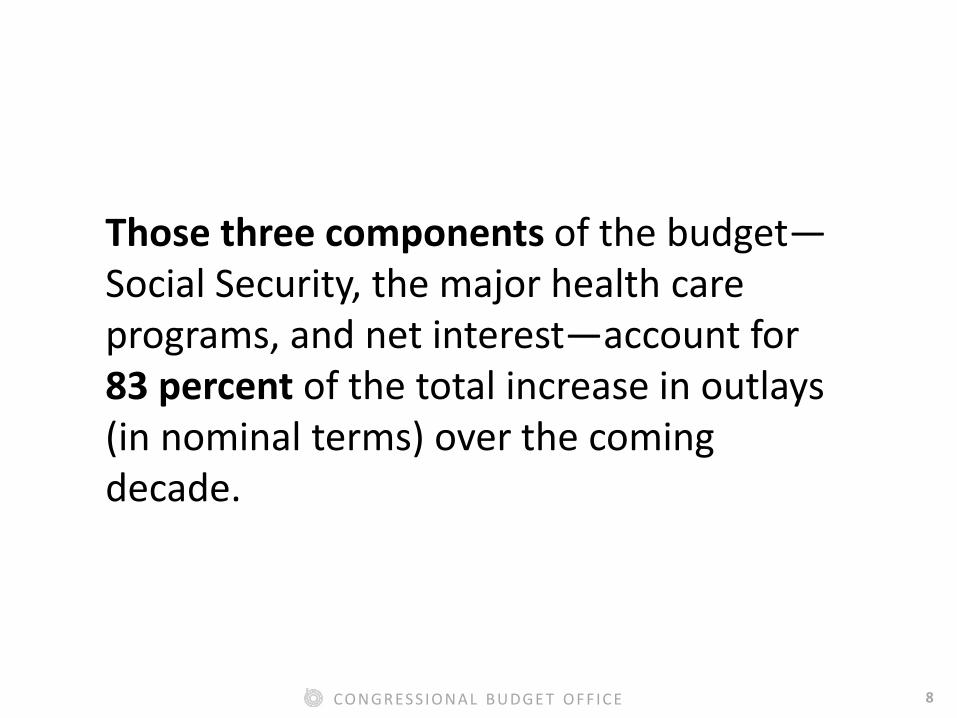
Those three components of the budget—Social Security, the major health care programs, and net interest—account for 83 percent of the total increase in outlays (in nominal terms) over the coming decade.
9 CO N GR ES S IO N A L B UDGE T O F F IC E
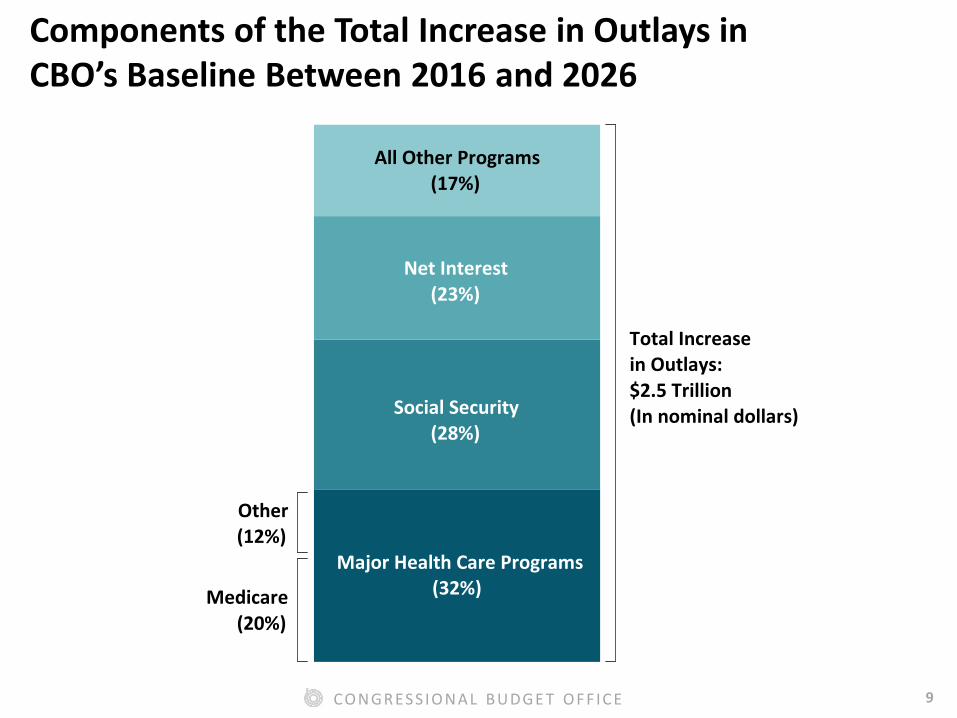
Components of the Total Increase in Outlays in CBO’s Baseline Between 2016 and 2026
Total Increasein Outlays:$2.5 Trillion(In nominal dollars)
All Other Programs(17%)
Net Interest(23%)
Social Security(28%)
Major Health Care Programs(32%)Medicare
(20%)
Other(12%)
10 CO N GR ES S IO N A L B UDGE T O F F IC E
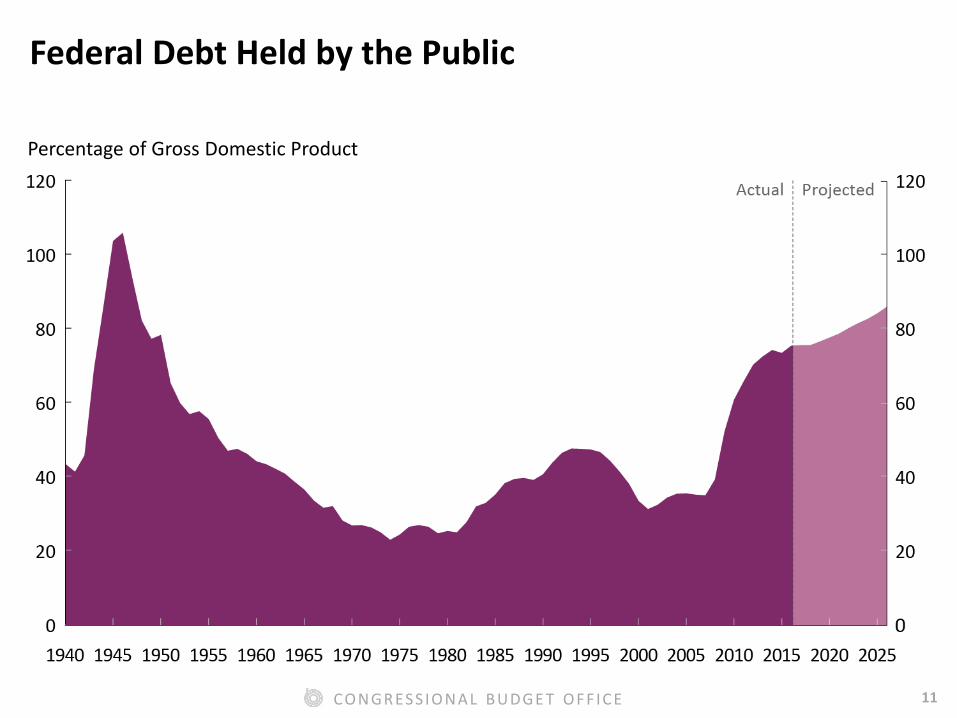
Debt held by the public is projected to increase from 76 percent of GDP in 2016 to 86 percent at the end of 2026.
At the end of 2026, federal debt would be the highest as a percentage of GDP since just after World War II.
11 CO N GR ES S IO N A L B UDGE T O F F IC E
Federal Debt Held by the Public
Percentage of Gross Domestic Product
12 CO N GR ES S IO N A L B UDGE T O F F IC E
The Budget Control Act and the Department of Defense

13 CO N GR ES S IO N A L B UDGE T O F F IC E
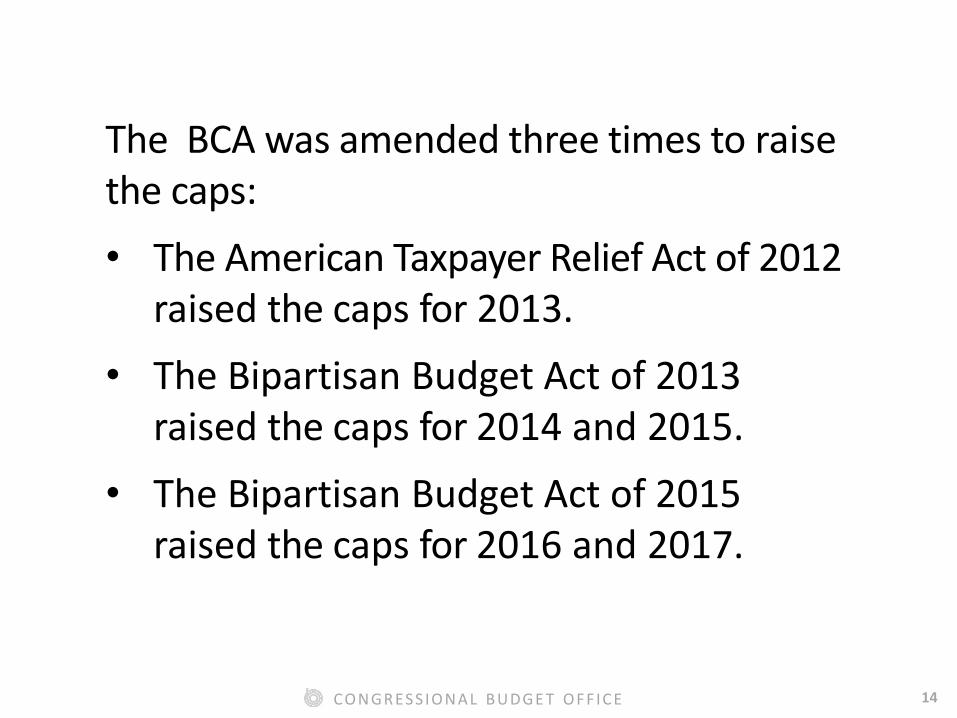
The Budget Control Act of 2011 (BCA) placed separate caps on defense and nondefense discretionary funding through 2021.
Roughly half of discretionary spending is for national defense, and almost all of that is carried out by the Department of Defense (DoD).
14 CO N GR ES S IO N A L B UDGE T O F F IC E
The BCA was amended three times to raise the caps: • The American Taxpayer Relief Act of 2012
raised the caps for 2013. • The Bipartisan Budget Act of 2013
raised the caps for 2014 and 2015. • The Bipartisan Budget Act of 2015
raised the caps for 2016 and 2017.
15 CO N GR ES S IO N A L B UDGE T O F F IC E
Funding for overseas contingency operations (OCO) is not constrained by the caps.
Such funding was originally intended for operations in Iraq, Afghanistan, and elsewhere.
In practice, the Congress has provided OCO funding for other purposes.
16 CO N GR ES S IO N A L B UDGE T O F F IC E
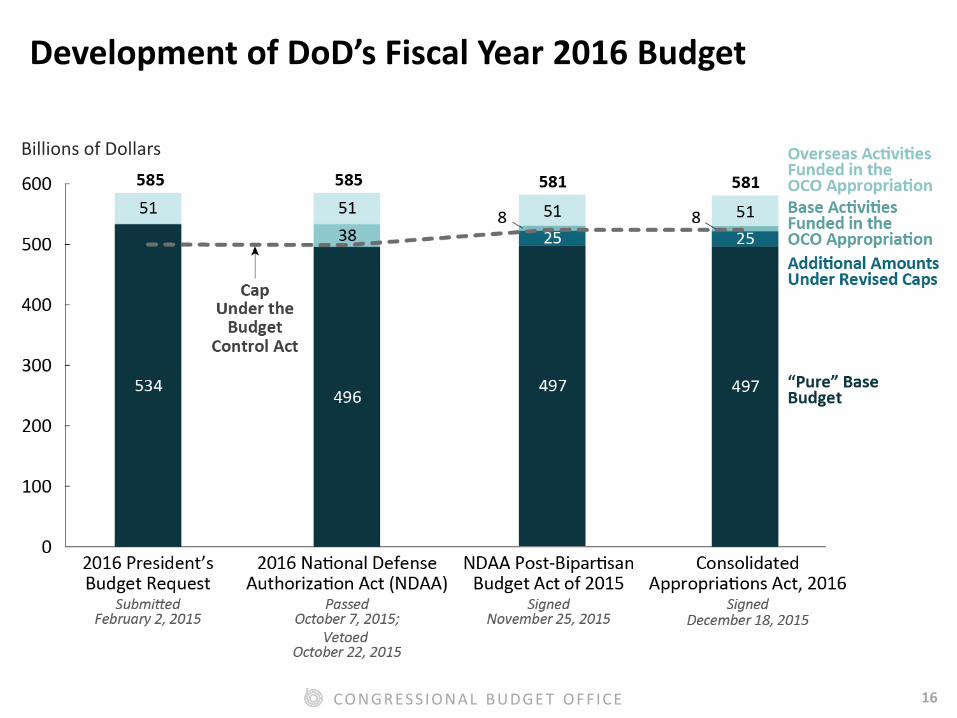
Development of DoD’s Fiscal Year 2016 Budget
Billions of Dollars
17 CO N GR ES S IO N A L B UDGE T O F F IC E
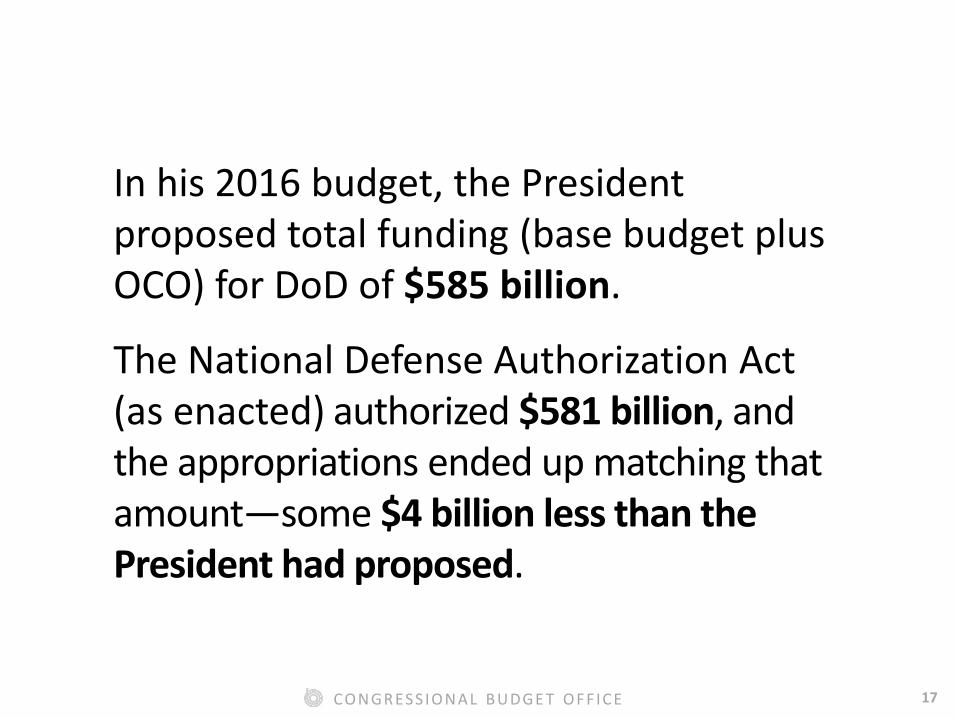
In his 2016 budget, the President proposed total funding (base budget plus OCO) for DoD of $585 billion.
The National Defense Authorization Act (as enacted) authorized $581 billion, and the appropriations ended up matching that amount—some $4 billion less than the President had proposed.
18 CO N GR ES S IO N A L B UDGE T O F F IC E
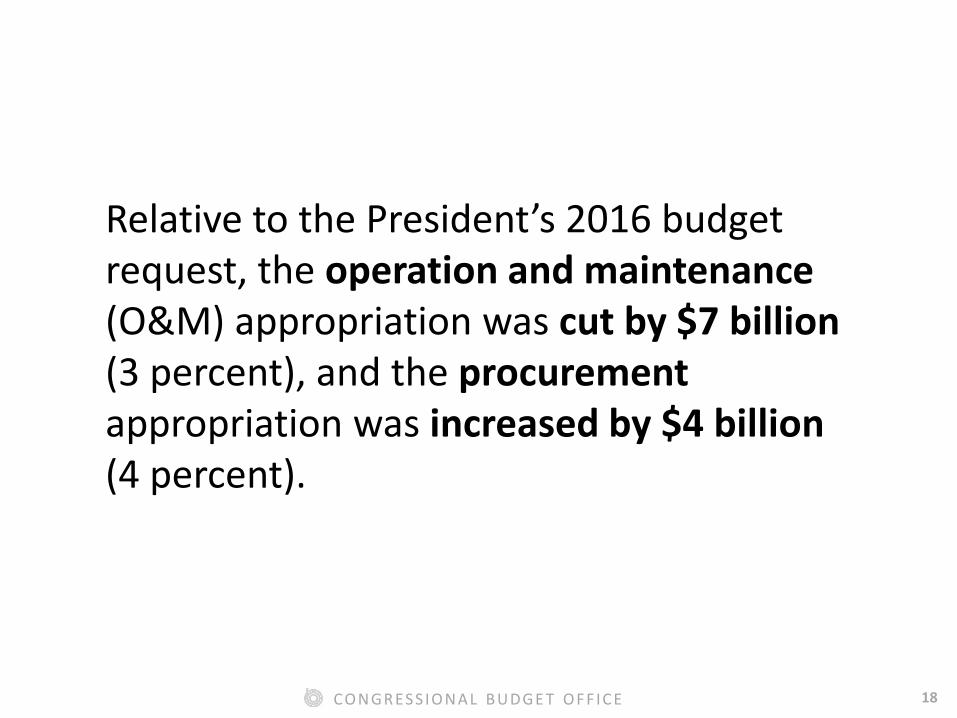
Relative to the President’s 2016 budget request, the operation and maintenance (O&M) appropriation was cut by $7 billion (3 percent), and the procurement appropriation was increased by $4 billion (4 percent).
19 CO N GR ES S IO N A L B UDGE T O F F IC E
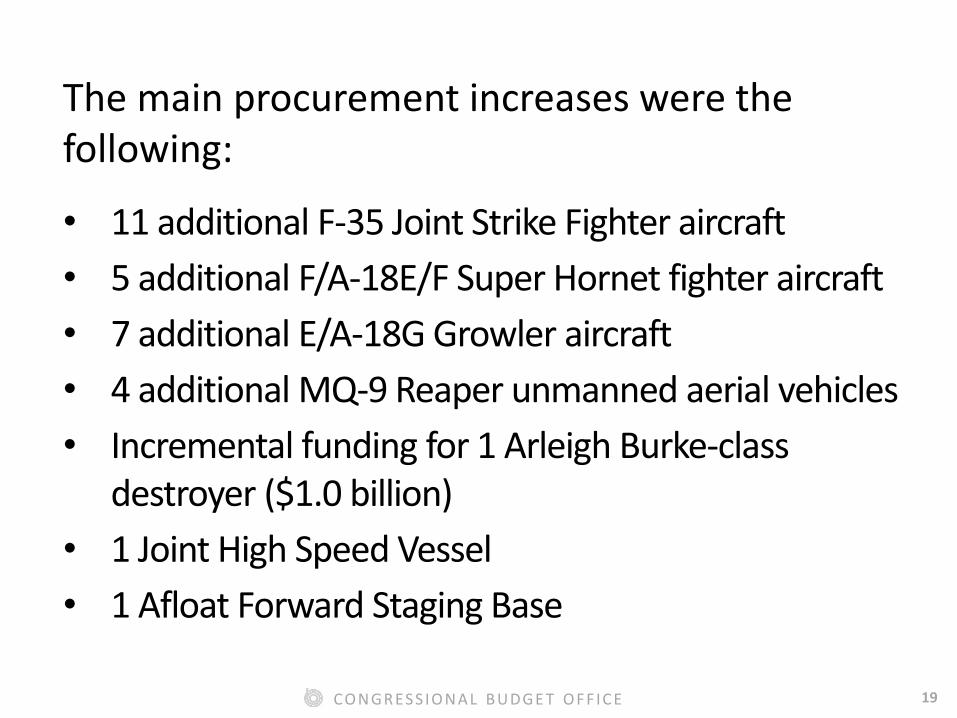
The main procurement increases were the following:
• 11 additional F-35 Joint Strike Fighter aircraft • 5 additional F/A-18E/F Super Hornet fighter aircraft • 7 additional E/A-18G Growler aircraft • 4 additional MQ-9 Reaper unmanned aerial vehicles • Incremental funding for 1 Arleigh Burke-class
destroyer ($1.0 billion) • 1 Joint High Speed Vessel • 1 Afloat Forward Staging Base
20 CO N GR ES S IO N A L B UDGE T O F F IC E
DoD’s Five-year Plan (2016–2020) and CBO’s Extension to 2030
21 CO N GR ES S IO N A L B UDGE T O F F IC E
DoD’s Future Years Defense Program (FYDP) gives its detailed funding plan over a five-year window.
The FYDP is submitted to the Congress annually along with the President’s budget; the FYDP for 2016–2020 accompanied the President’s 2016 budget.
CBO projected the costs of DoD’s plans through 2030.
22 CO N GR ES S IO N A L B UDGE T O F F IC E
CBO’s projection was based on DoD’s cost estimates in the 2016 FYDP as well as DoD’s longer-term estimates, if available.
Total costs would be higher if they were to grow at rates similar to those observed in DoD’s recent budgets.
23 CO N GR ES S IO N A L B UDGE T O F F IC E
CBO’s analysis was not a forecast or prediction of future budgets.
Rather, CBO estimated the resources needed to implement the programs and policies that would be put into place in the 2016–2020 FYDP time frame.
24 CO N GR ES S IO N A L B UDGE T O F F IC E
OCO funding has been a significant share of DoD’s budget during the past fifteen years.
The 2017 President’s budget request includes OCO funding of $59 billion for DoD.
$5 billion of that request is for what are ordinarily base-budget activities, including procurement.
25 CO N GR ES S IO N A L B UDGE T O F F IC E
The 2017 OCO request is not reflected in CBO’s analysis of the 2016 FYDP but will be included in CBO’s upcoming analysis of the 2017 FYDP.
26 CO N GR ES S IO N A L B UDGE T O F F IC E
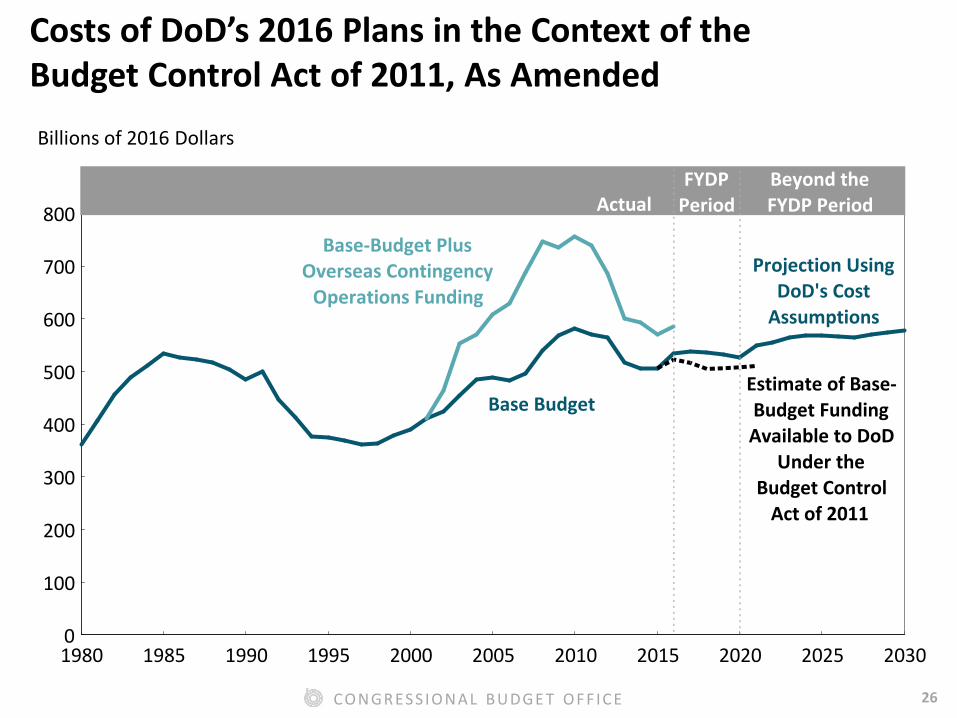
Costs of DoD’s 2016 Plans in the Context of the Budget Control Act of 2011, As Amended Billions of 2016 Dollars
1980 1985 1990 1995 2000 2005 2010 2015 2020 2025 20300
100
200
300
400
500
600
700
800
Base Budget
Base-Budget PlusOverseas Contingency
Operations Funding
ActualFYDP
PeriodBeyond theFYDP Period
Estimate of Base-Budget FundingAvailable to DoD
Under theBudget Control
Act of 2011
Projection UsingDoD's Cost
Assumptions
27 CO N GR ES S IO N A L B UDGE T O F F IC E
DoD’s estimates of the costs of the 2016 FYDP exceed the BCA’s limits by a total of $107 billion (in 2016 dollars) from 2017 to 2020.
CBO projects a steep increase in acquisition costs starting in 2021, suggesting that weapons development and procurement is being deferred until beyond the FYDP period.
28 CO N GR ES S IO N A L B UDGE T O F F IC E
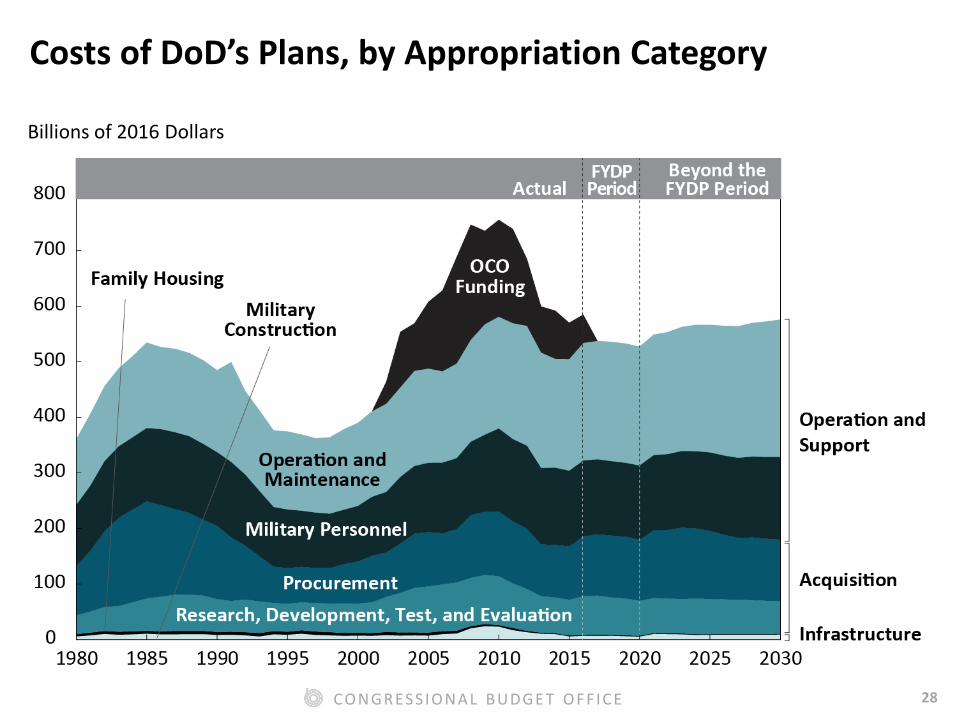
Costs of DoD’s Plans, by Appropriation Category
Billions of 2016 Dollars
29 CO N GR ES S IO N A L B UDGE T O F F IC E
The Congress has not always approved DoD’s plans to cap military pay raises below the growth rate of the employment cost index (ECI), increase fees for military health care, or initiate another round of base realignment and closure (BRAC).
30 CO N GR ES S IO N A L B UDGE T O F F IC E
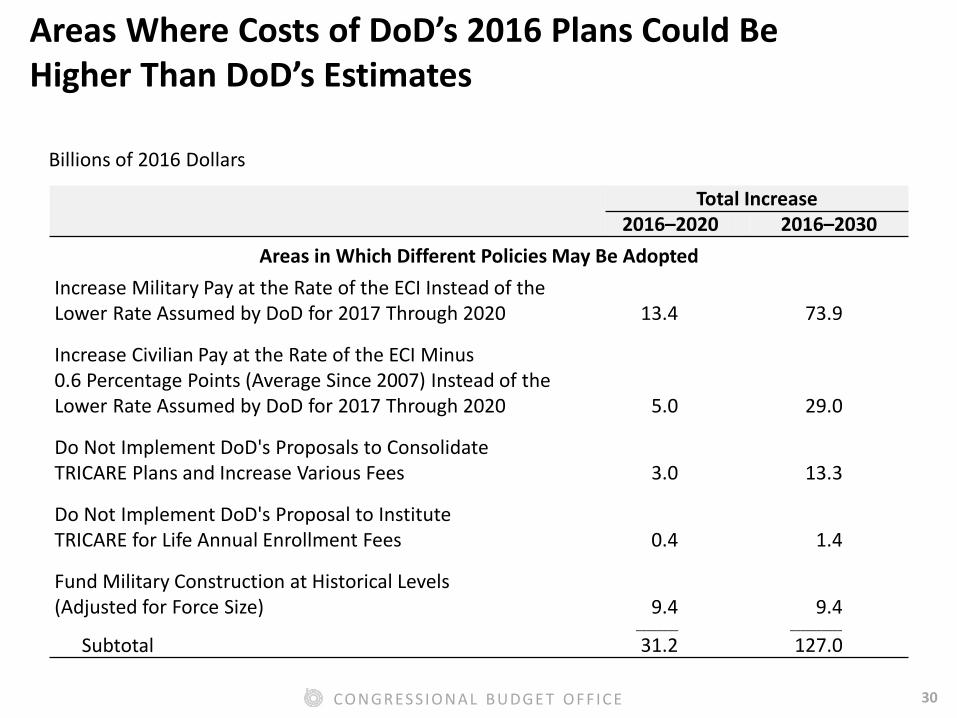
Areas Where Costs of DoD’s 2016 Plans Could Be Higher Than DoD’s Estimates
Total Increase 2016–2020 2016–2030
Areas in Which Different Policies May Be Adopted Increase Military Pay at the Rate of the ECI Instead of the Lower Rate Assumed by DoD for 2017 Through 2020 13.4 73.9
Increase Civilian Pay at the Rate of the ECI Minus 0.6 Percentage Points (Average Since 2007) Instead of the Lower Rate Assumed by DoD for 2017 Through 2020 5.0 29.0
Do Not Implement DoD's Proposals to Consolidate TRICARE Plans and Increase Various Fees 3.0 13.3
Do Not Implement DoD's Proposal to Institute TRICARE for Life Annual Enrollment Fees 0.4 1.4
Fund Military Construction at Historical Levels (Adjusted for Force Size) 9.4 9.4
________ __________
Subtotal 31.2 127.0
Billions of 2016 Dollars
31 CO N GR ES S IO N A L B UDGE T O F F IC E
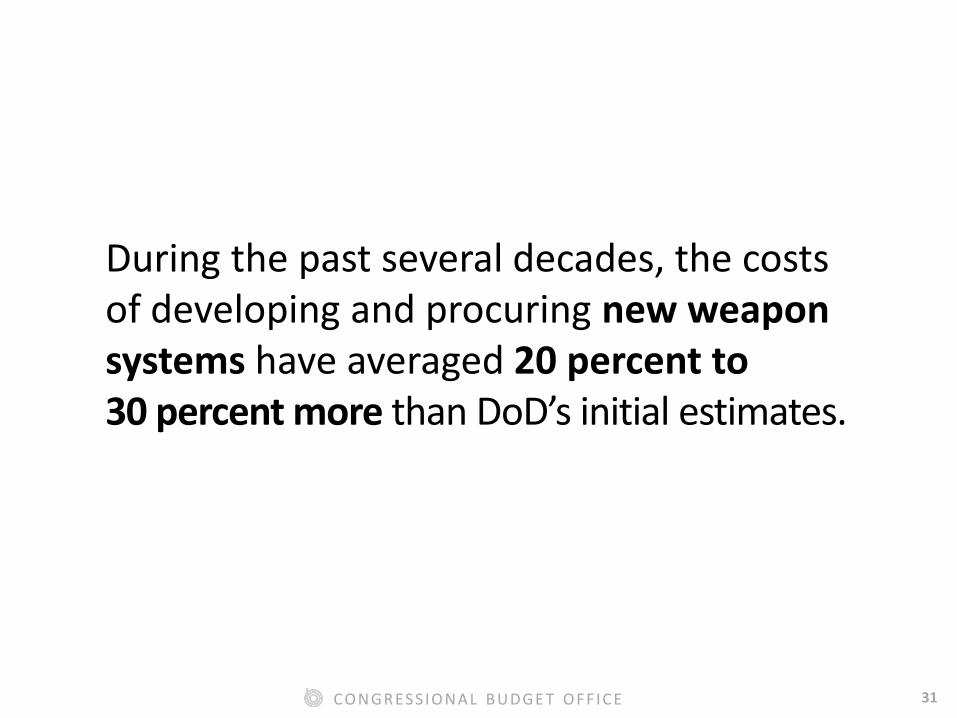
During the past several decades, the costs of developing and procuring new weapon systems have averaged 20 percent to 30 percent more than DoD’s initial estimates.
32 CO N GR ES S IO N A L B UDGE T O F F IC E
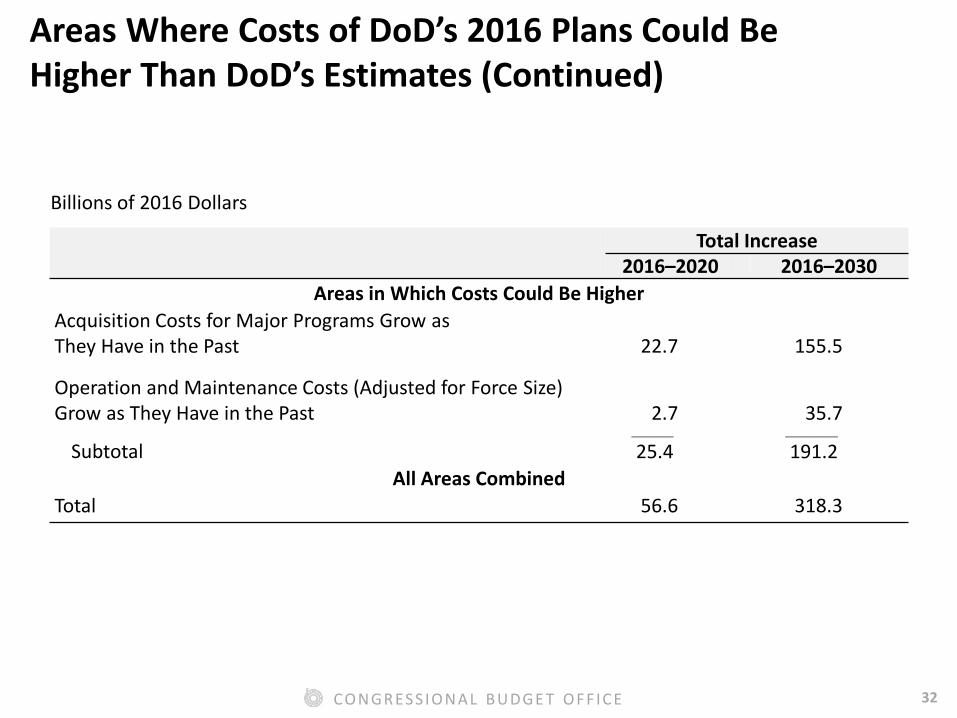
Areas Where Costs of DoD’s 2016 Plans Could Be Higher Than DoD’s Estimates (Continued)
Total Increase 2016–2020 2016–2030
Areas in Which Costs Could Be Higher Acquisition Costs for Major Programs Grow as They Have in the Past 22.7 155.5
Operation and Maintenance Costs (Adjusted for Force Size) Grow as They Have in the Past 2.7 35.7
________ __________
Subtotal 25.4 191.2 All Areas Combined
Total 56.6 318.3
Billions of 2016 Dollars

33 CO N GR ES S IO N A L B UDGE T O F F IC E
If the Congress rejects certain cost-saving proposals that it has not accepted in the past, and if costs for weapon systems continue to rise as they have in the past, funding required to implement the Administration’s plans would exceed the BCA caps by $162 billion (in 2016 dollars) over the 2017–2020 period.