Embed Size (px)
Citation preview

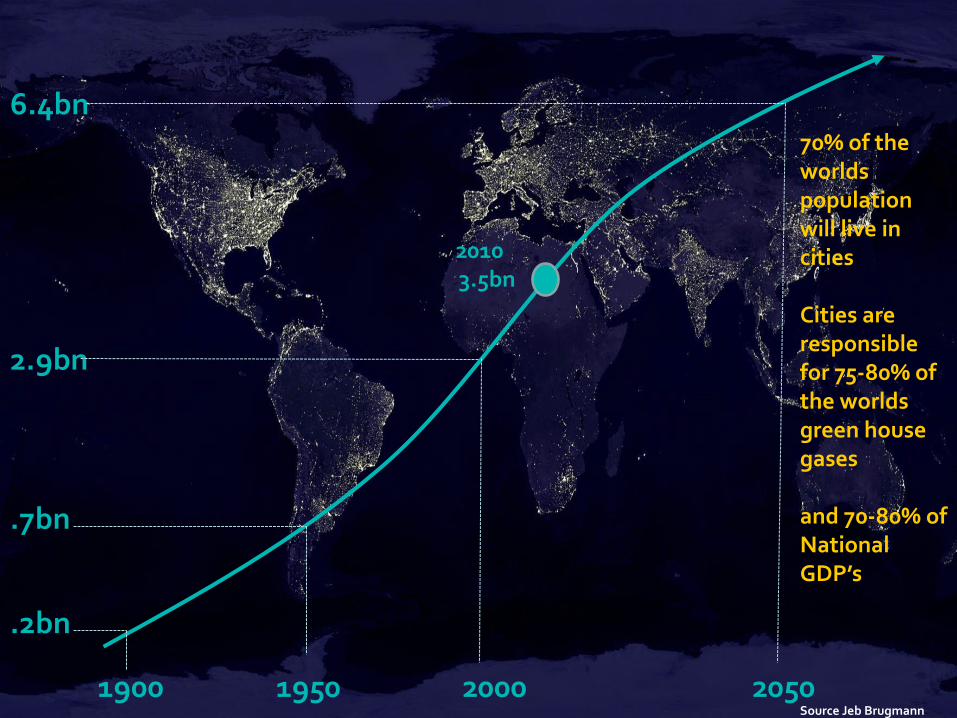
1900 1950 2000 2050
.7bn
.2bn
2.9bn
6.4bn
2010 3.5bn
70% of the worlds population will live in cities Cities are responsible for 75-80% of the worlds green house gases and 70-80% of National GDP’s Source Jeb Brugmann
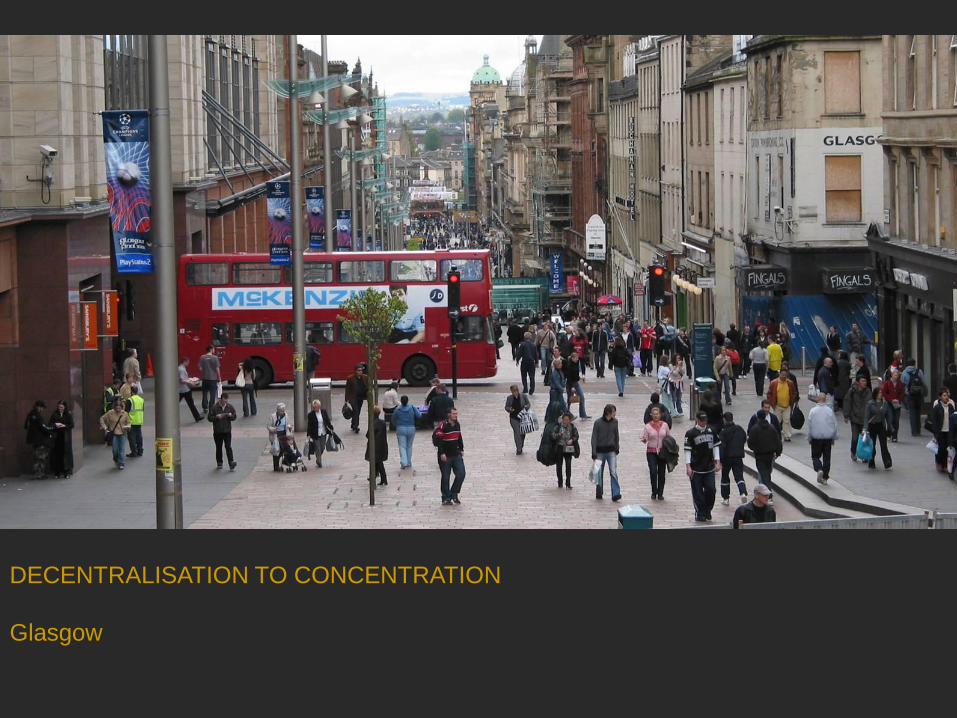
DECENTRALISATION TO CONCENTRATION
Glasgow
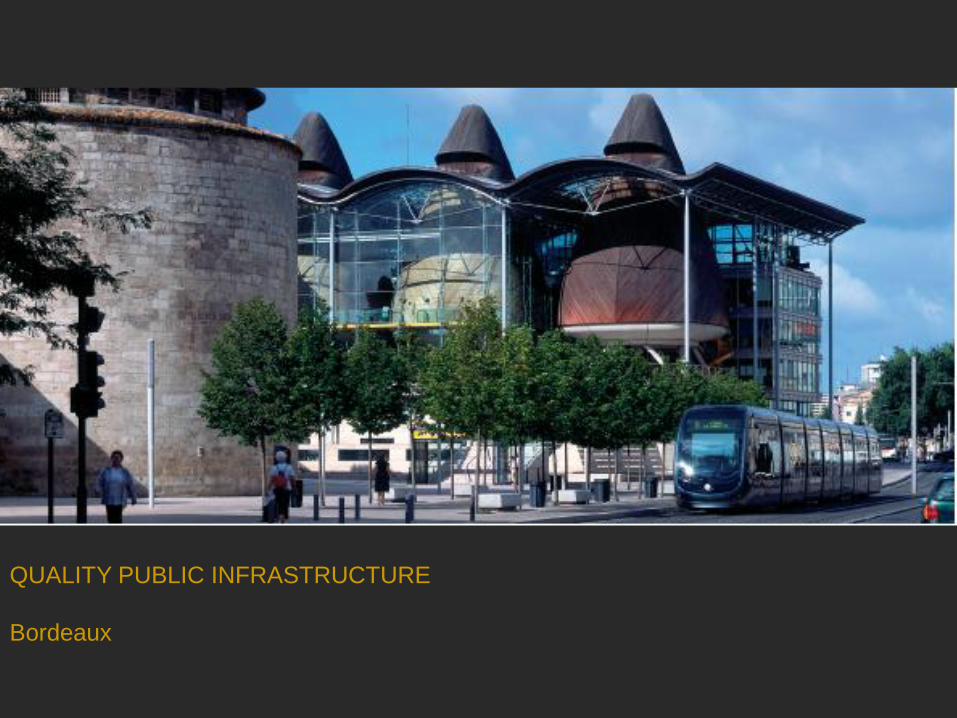
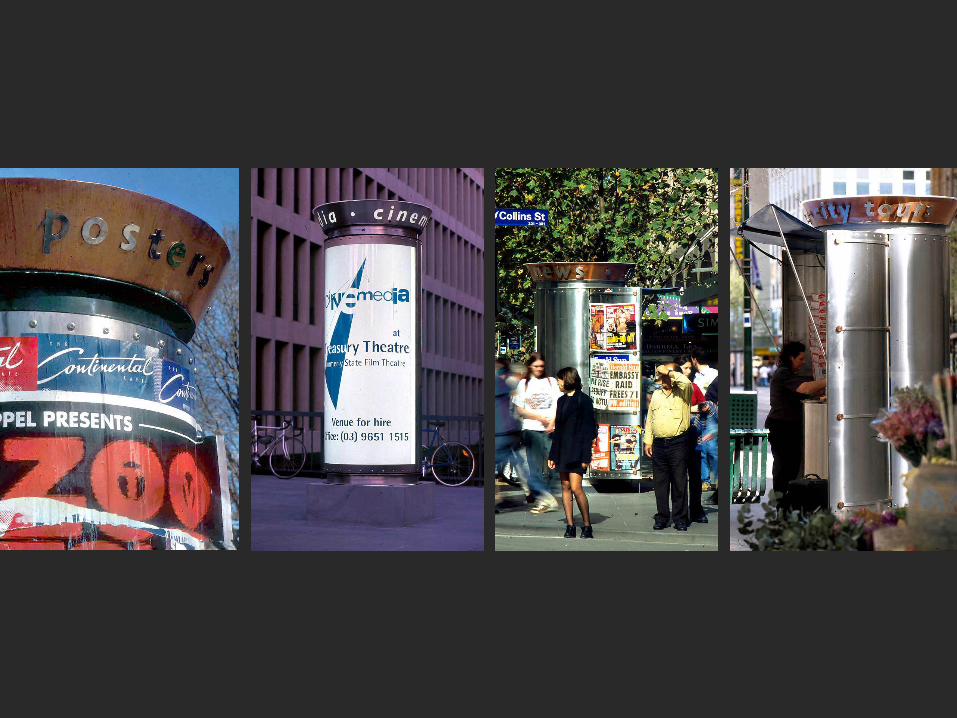
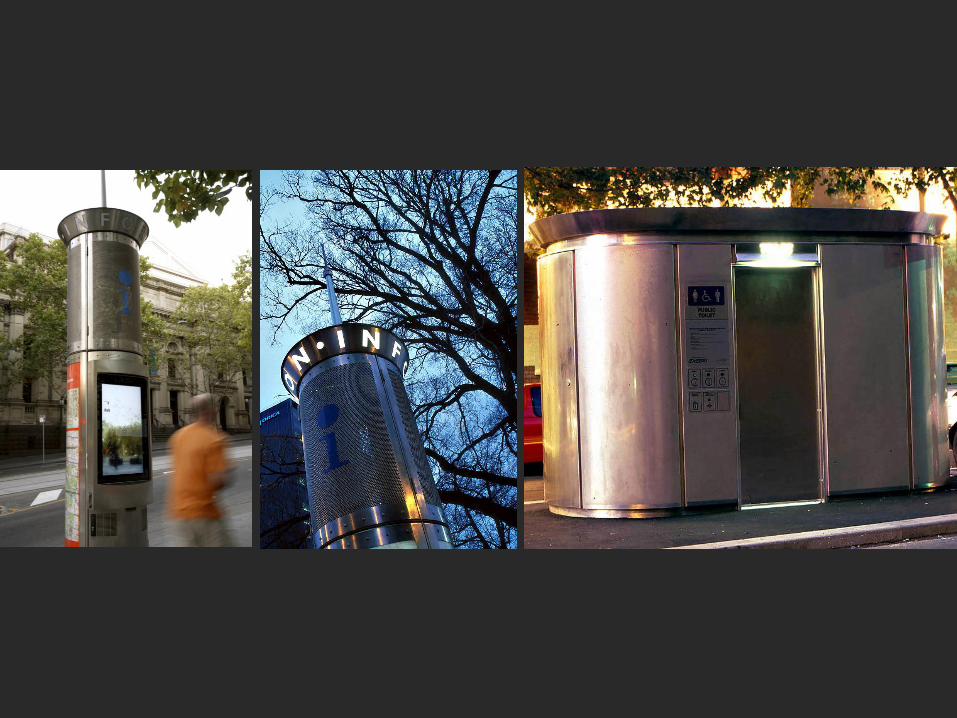
QUALITY PUBLIC INFRASTRUCTURE
Bordeaux
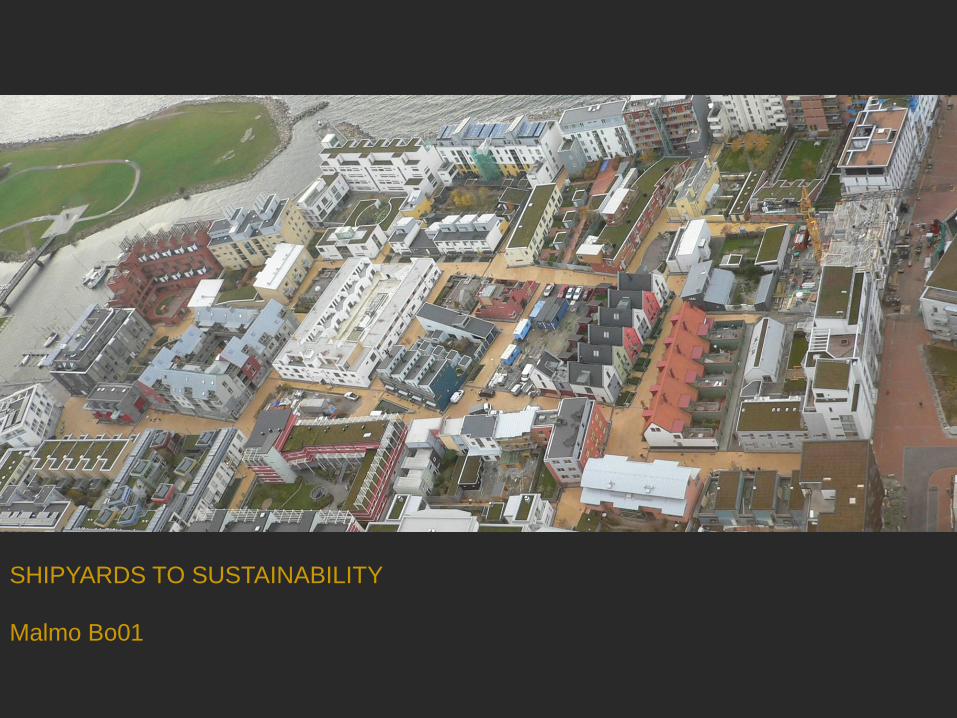
SHIPYARDS TO SUSTAINABILITY
Malmo Bo01
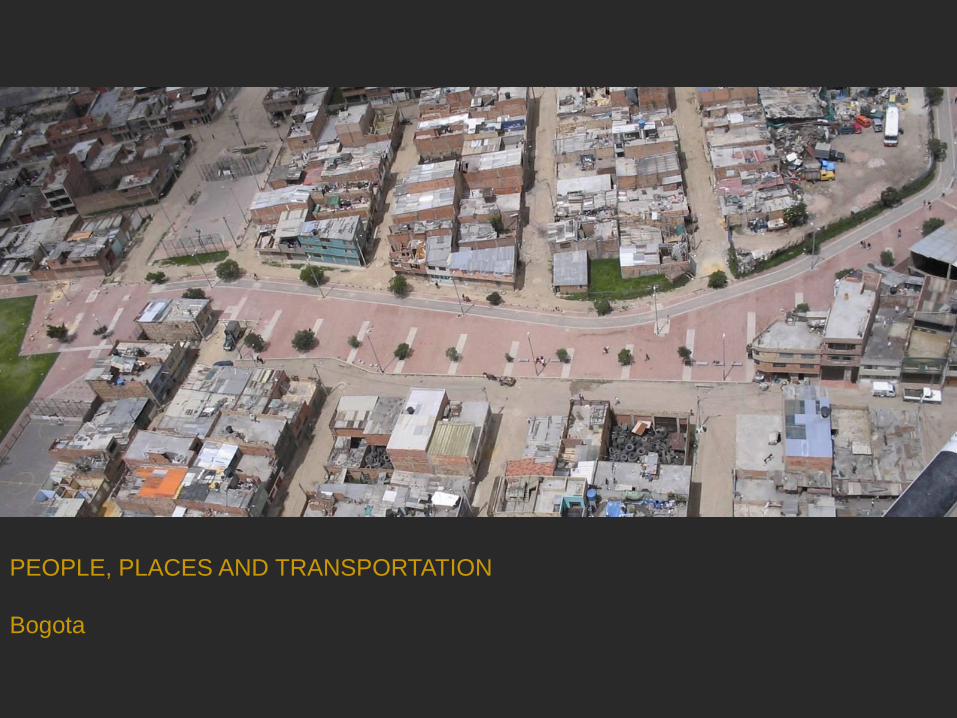
PEOPLE, PLACES AND TRANSPORTATION
Bogota
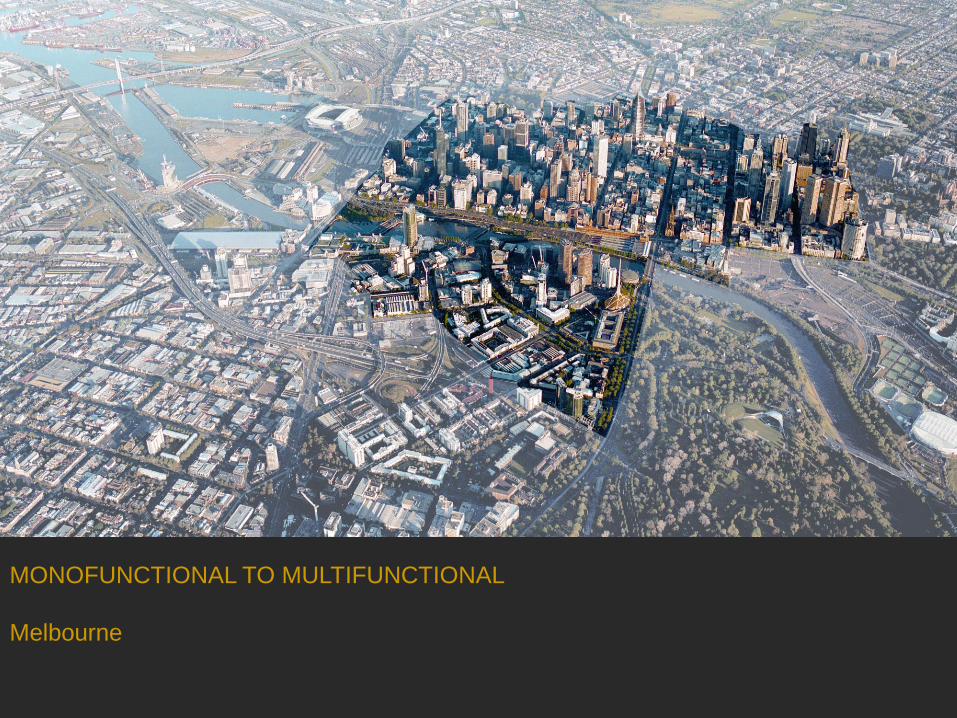
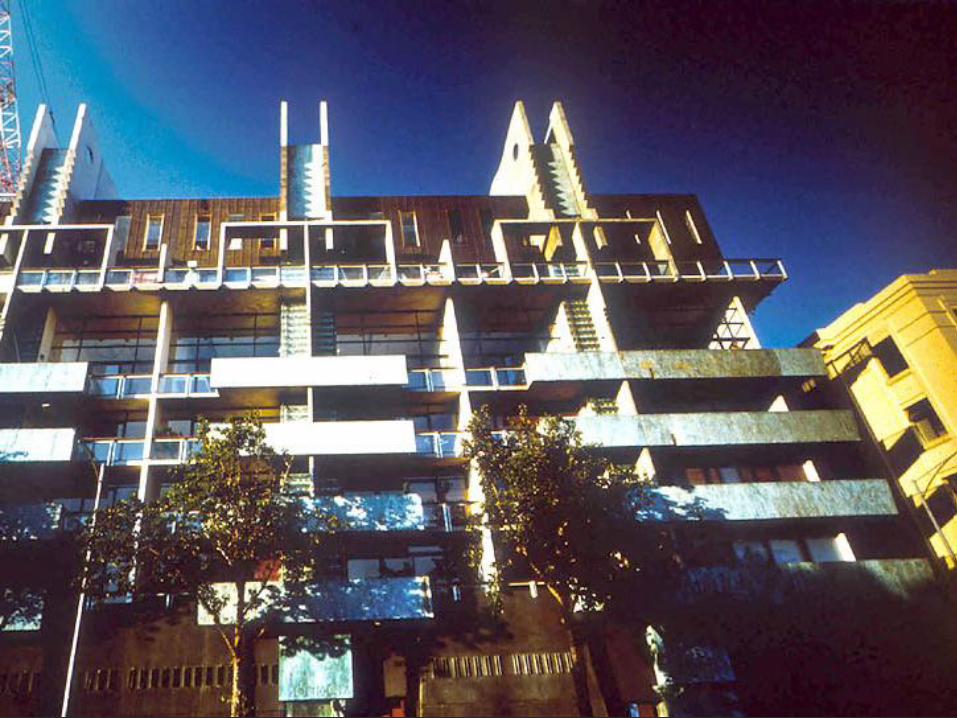
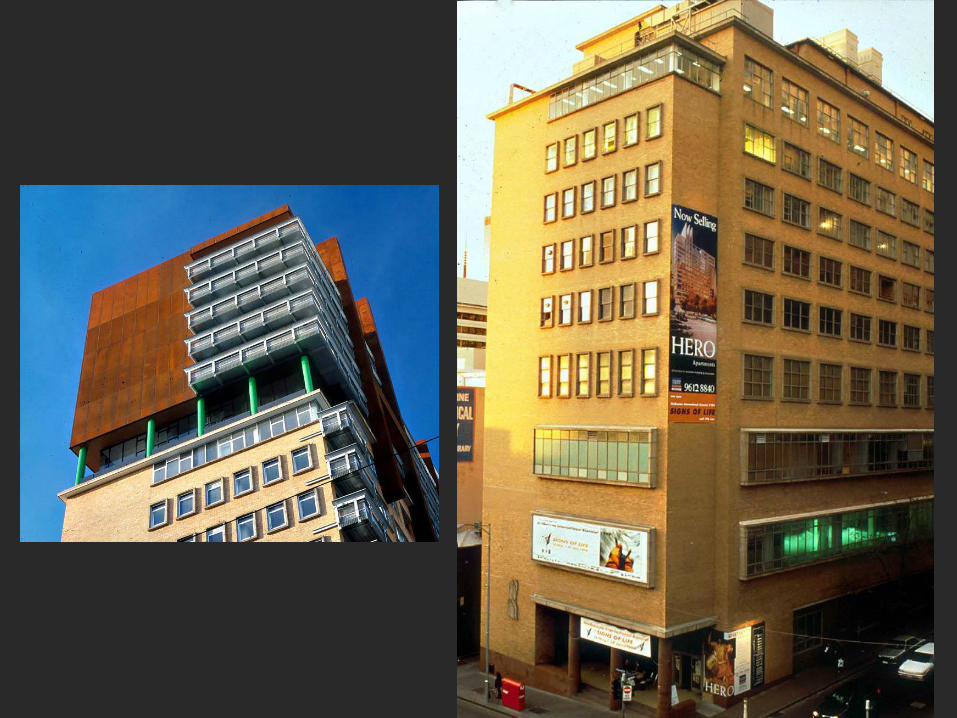
MONOFUNCTIONAL TO MULTIFUNCTIONAL
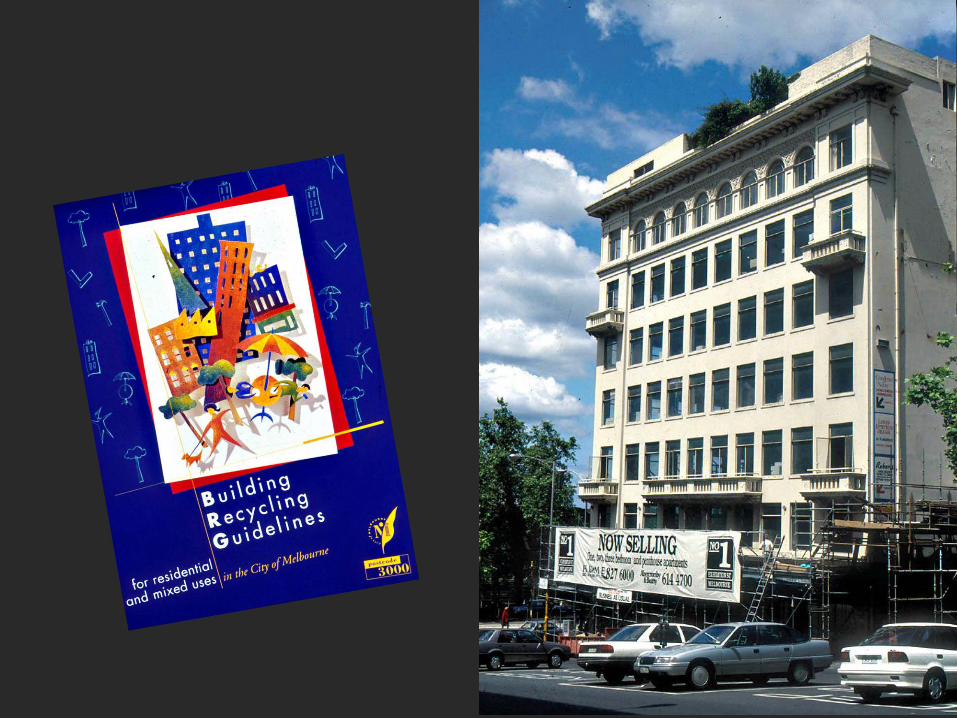
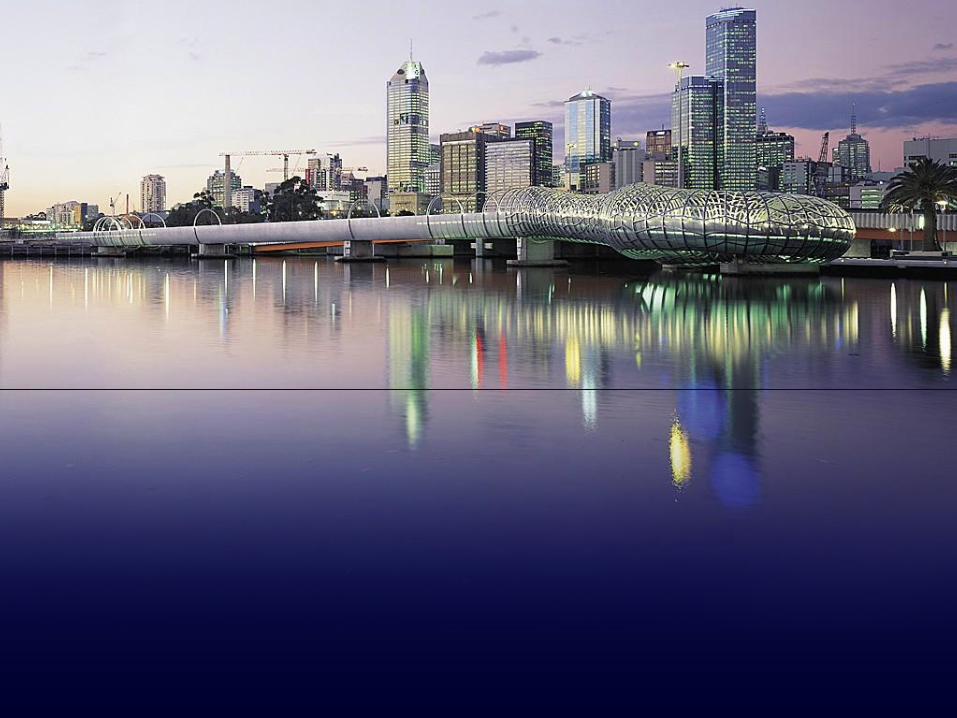
Melbourne
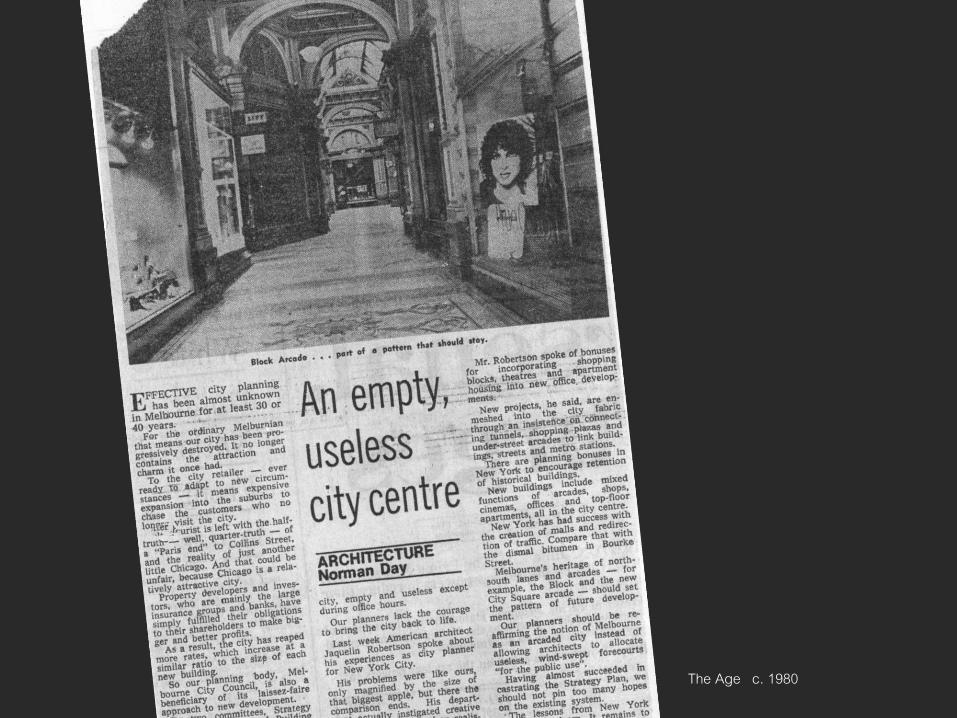
The Age c. 1980
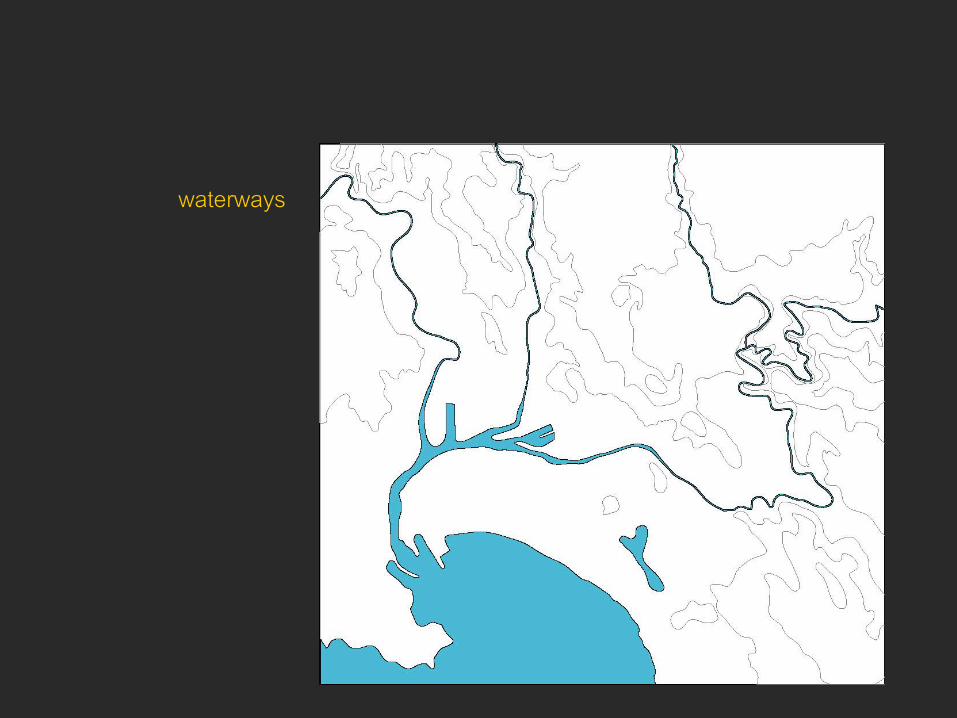
waterways
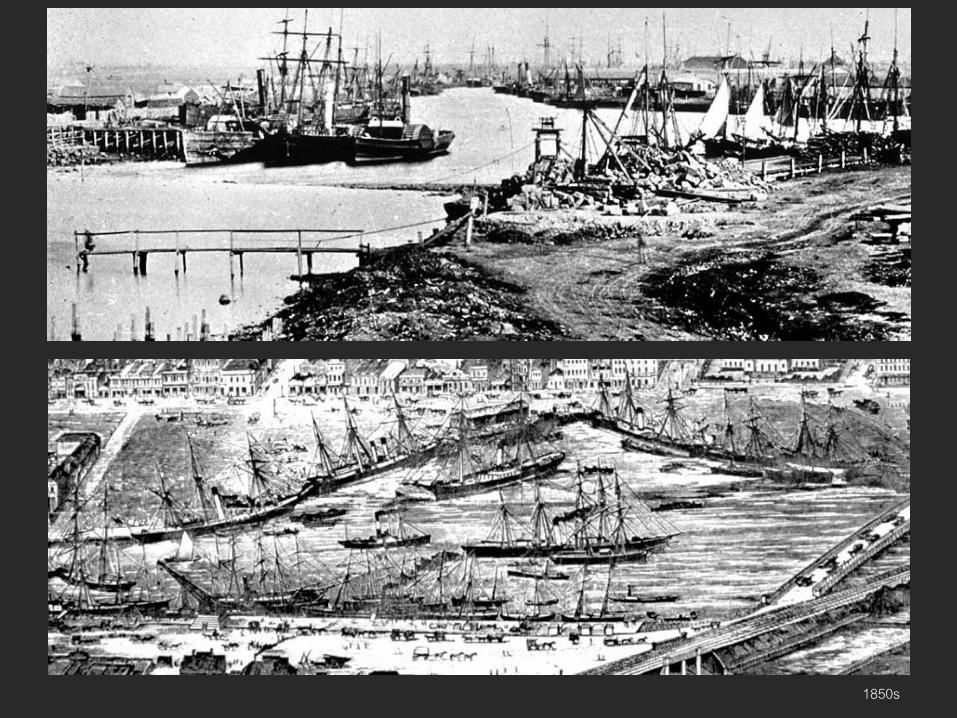
1850s
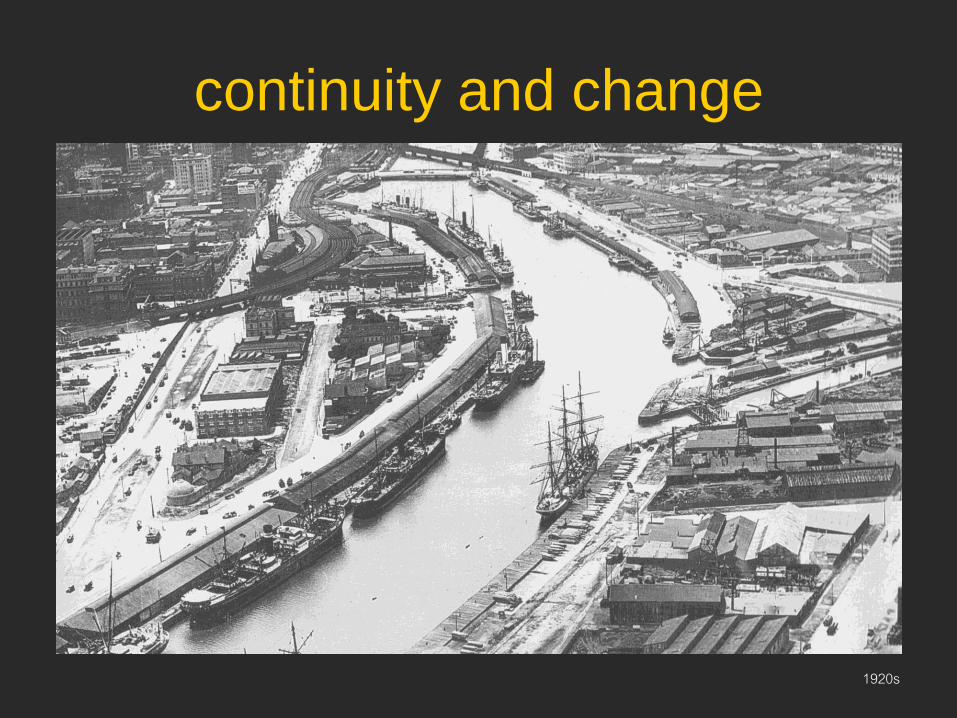
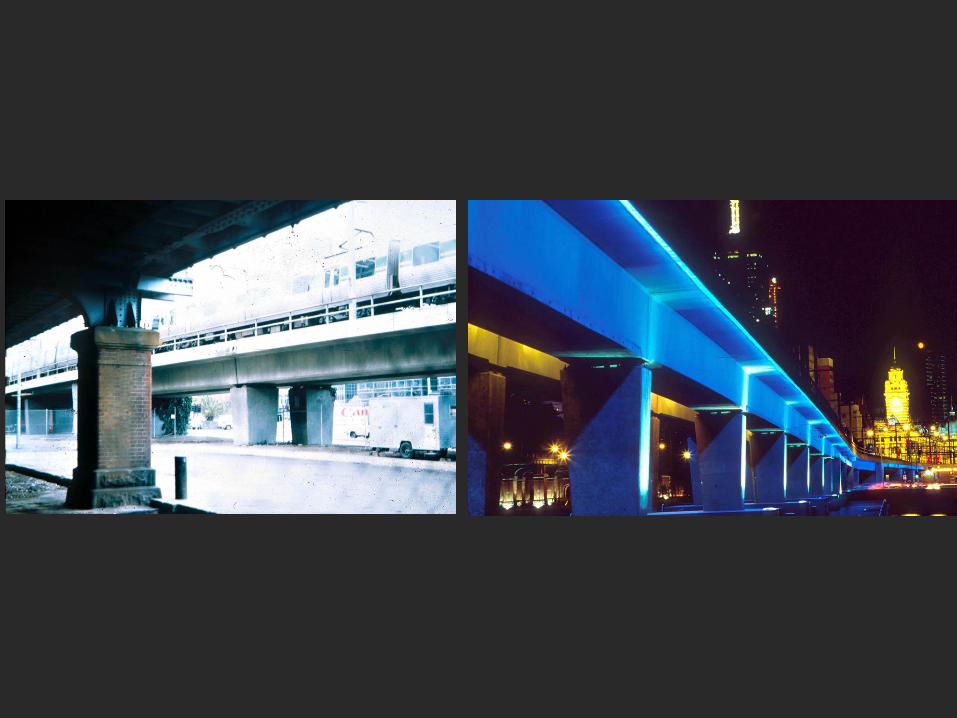
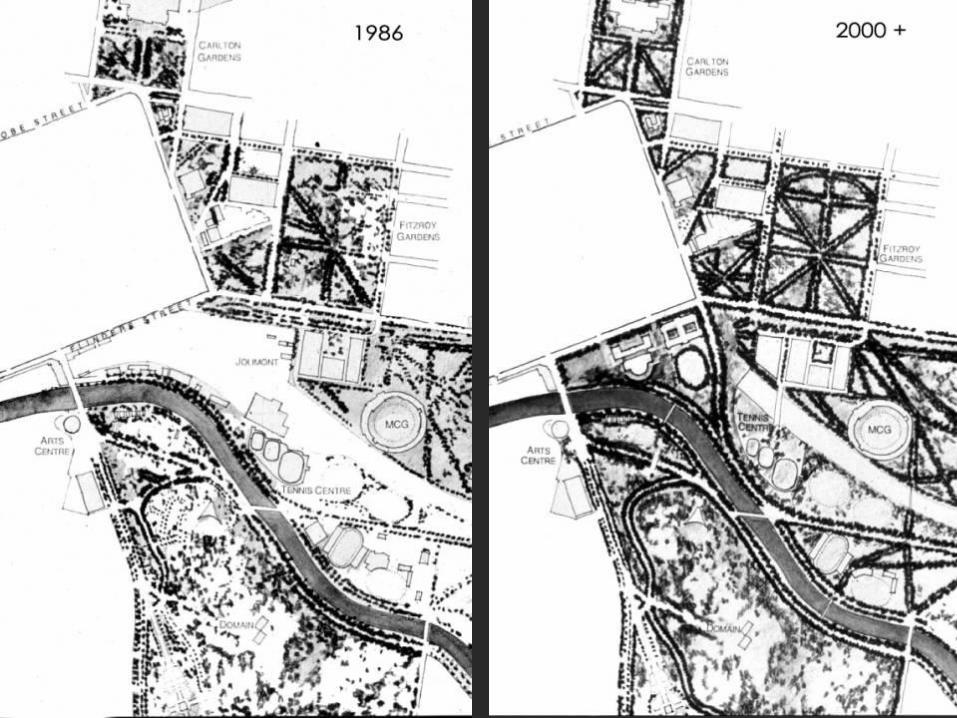
continuity and change
1920s
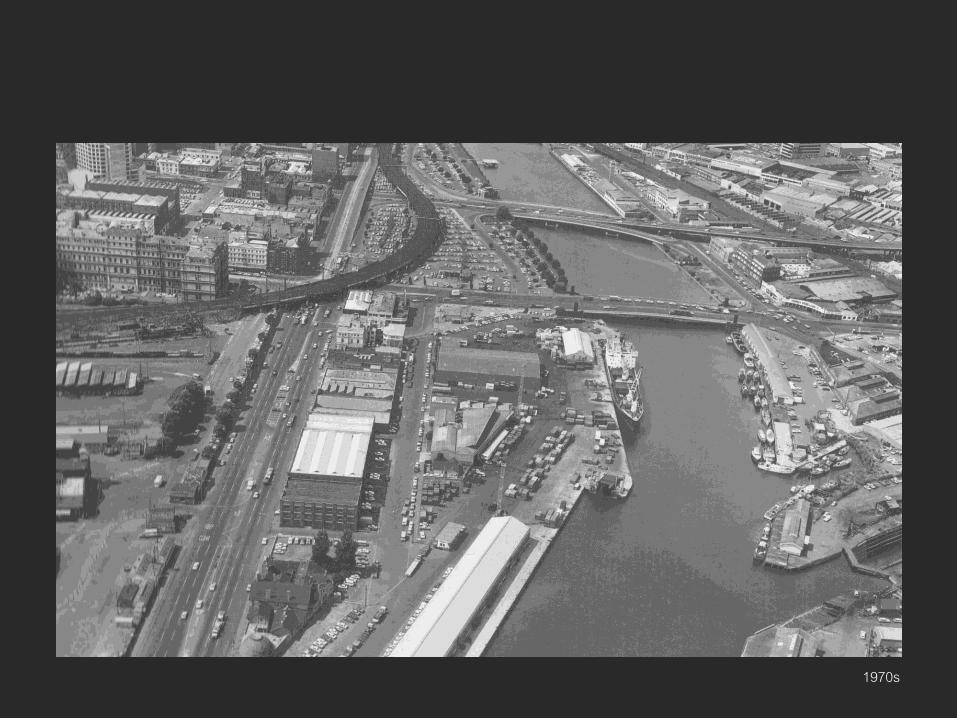
1970s
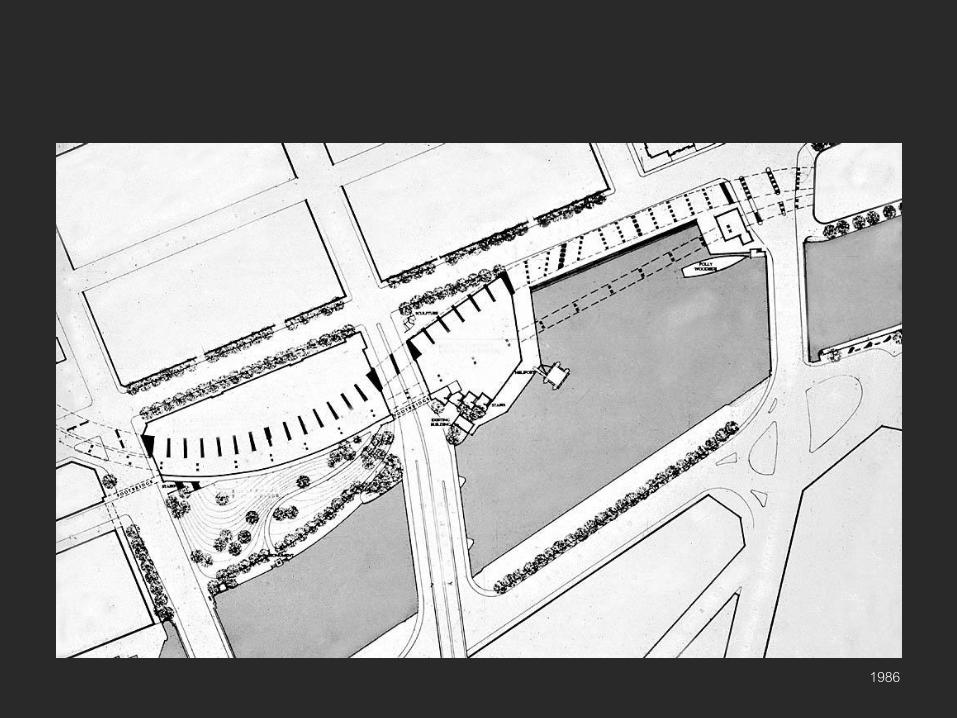
1986
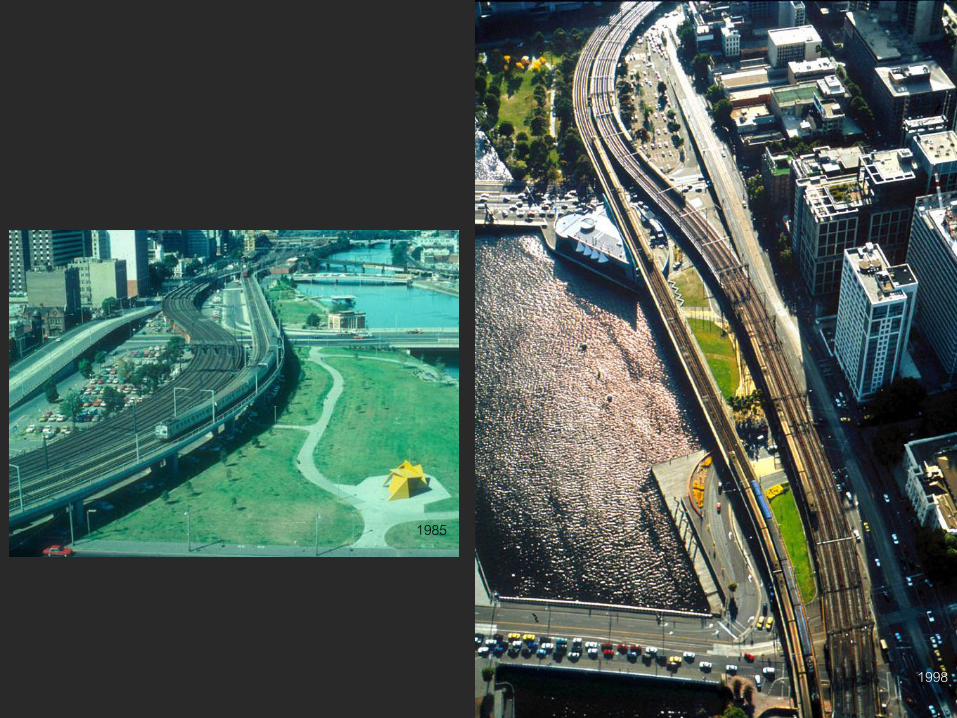
1998
1985
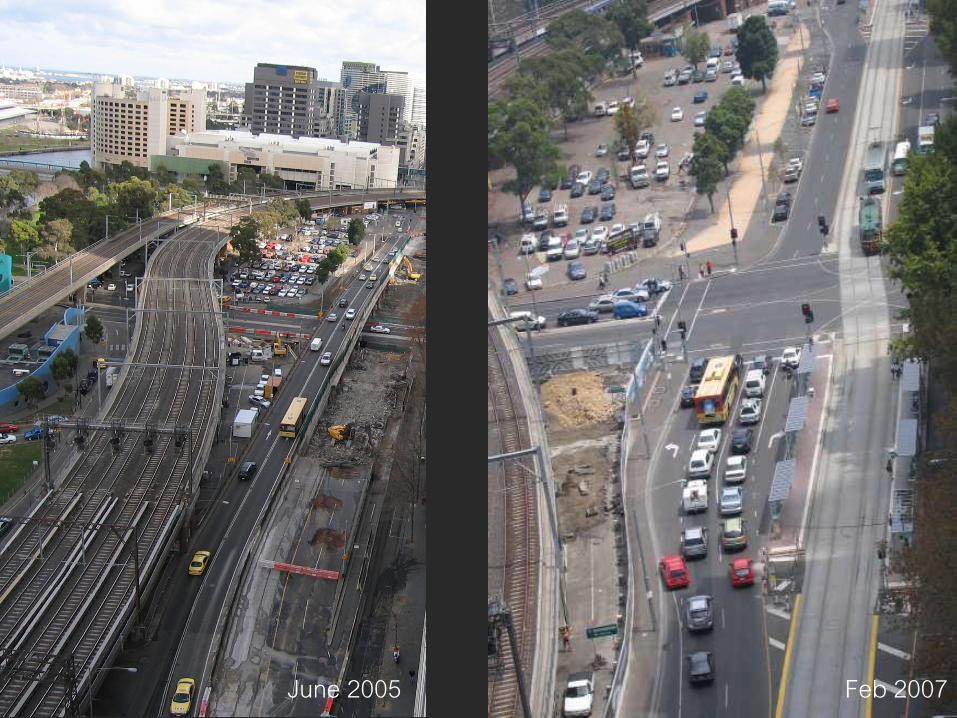
June 2005 Feb 2007
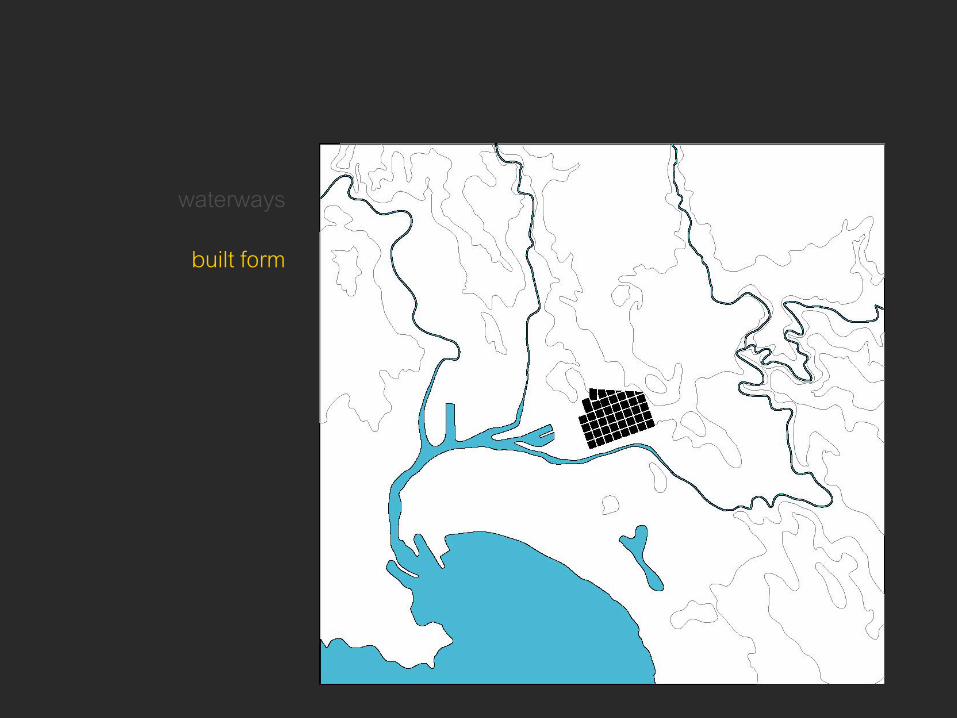
waterways
built form

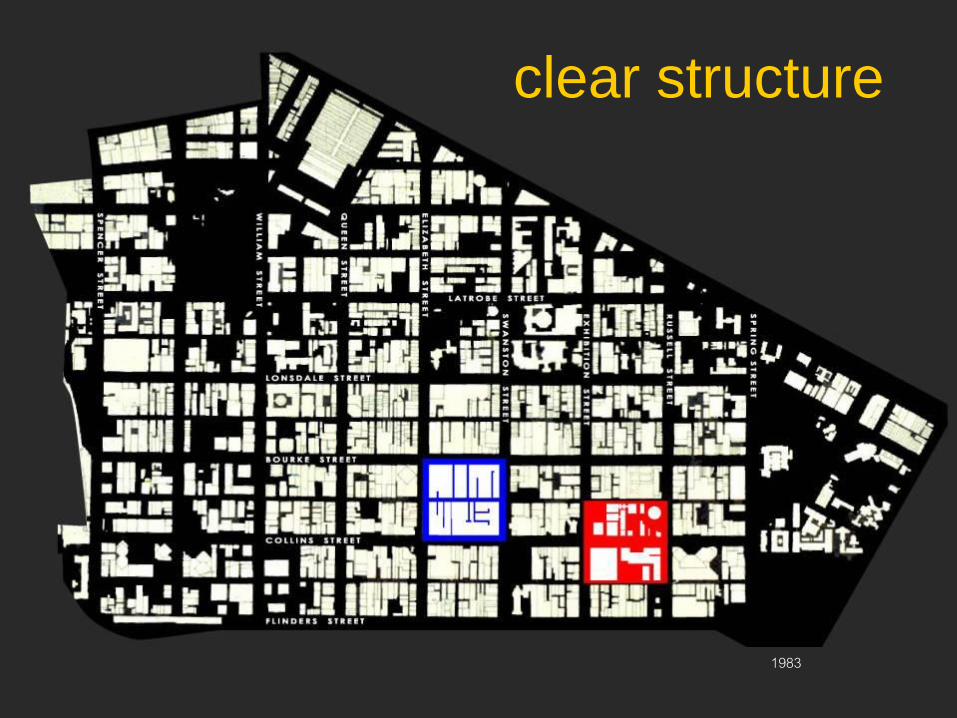
clear structure
1983
clear structure
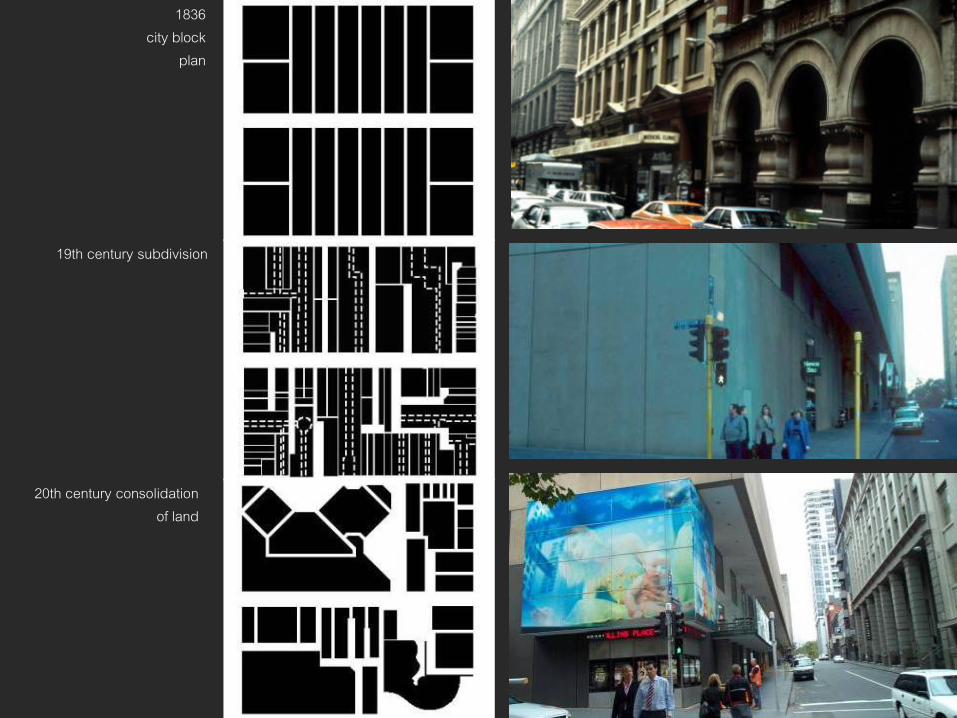
1836 city block
plan
19th century subdivision
20th century consolidation of land
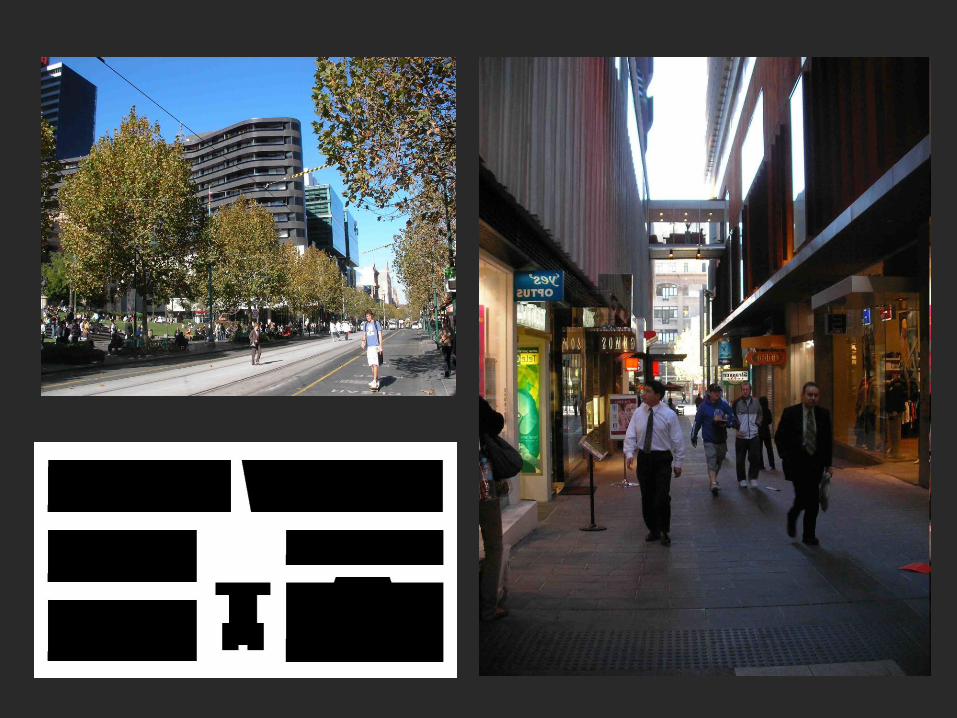
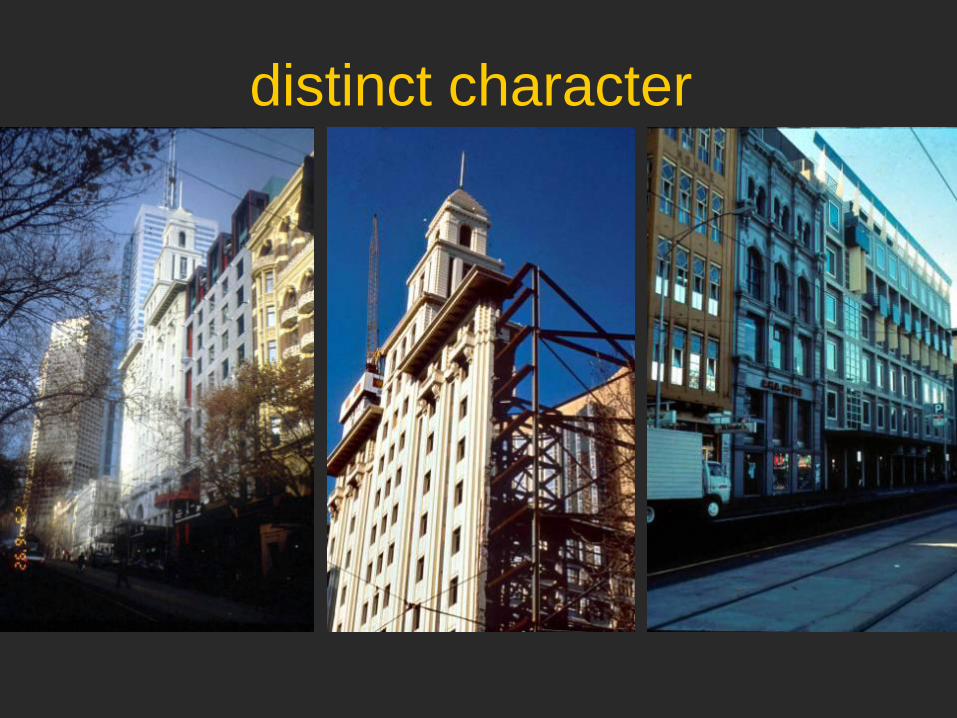
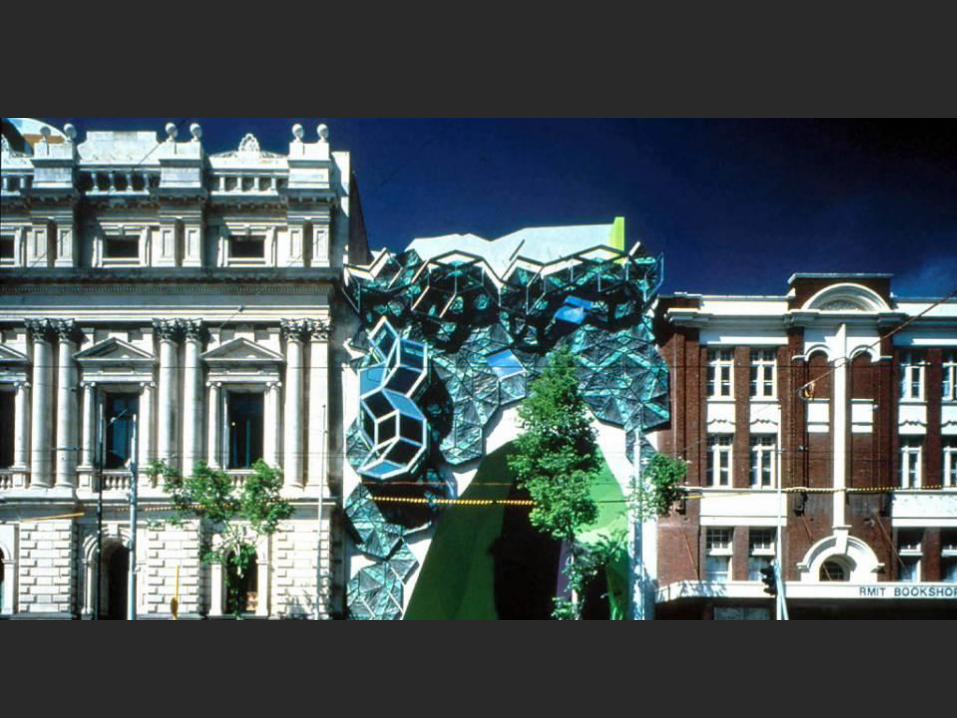
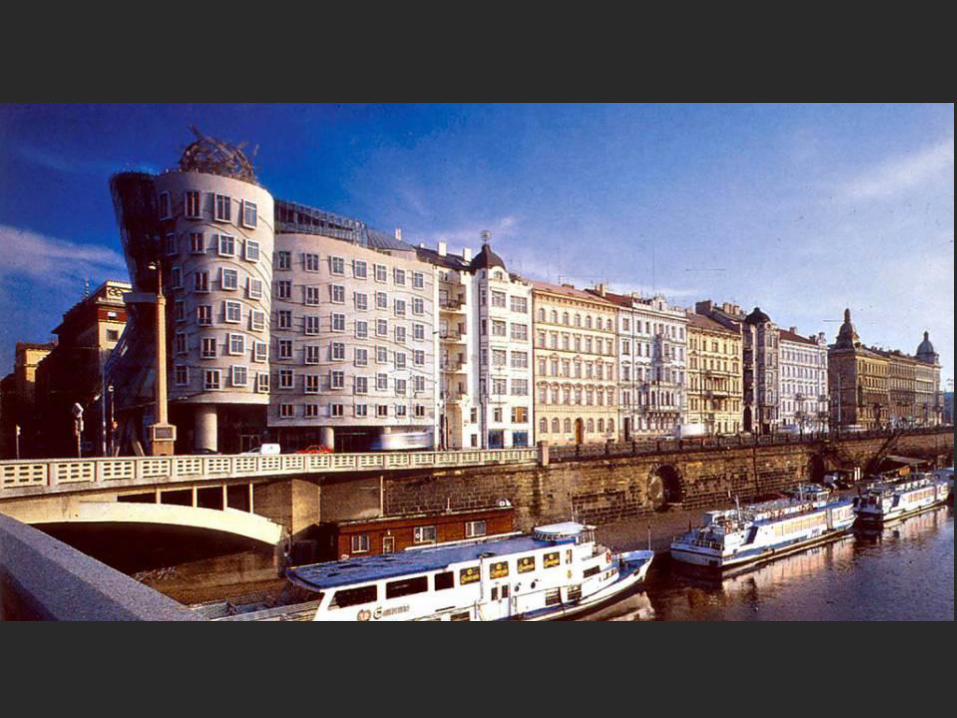
distinct character
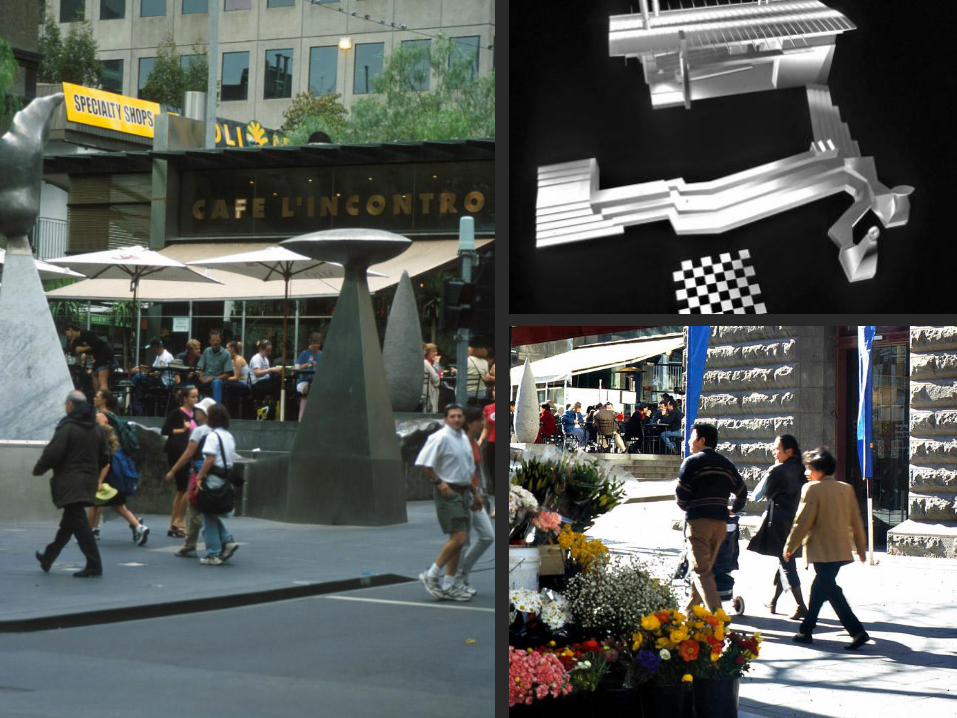
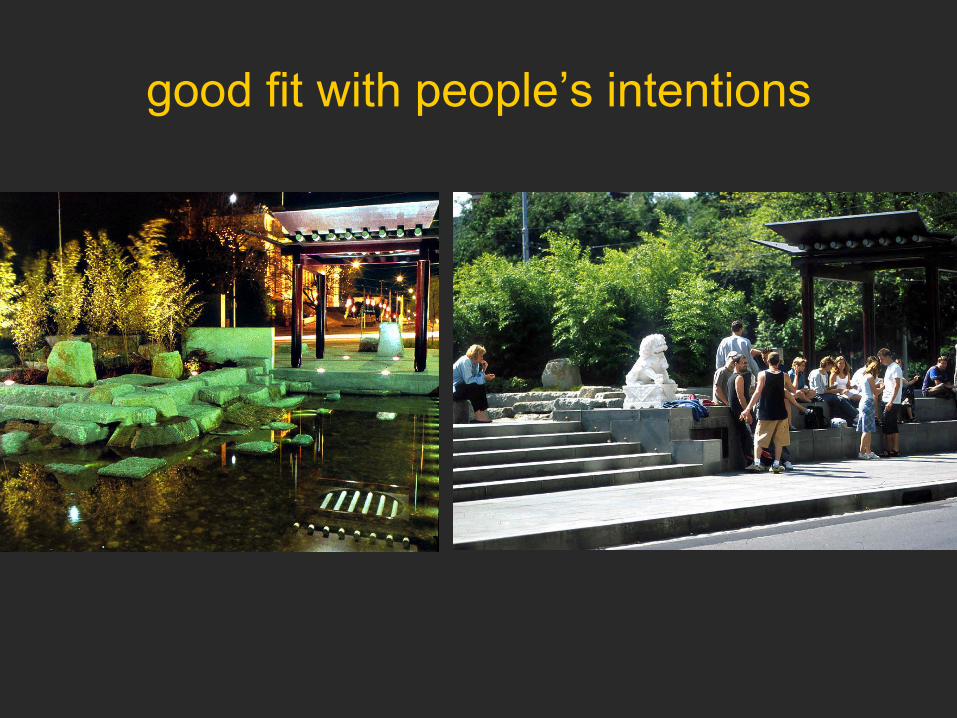
good fit with people’s intentions

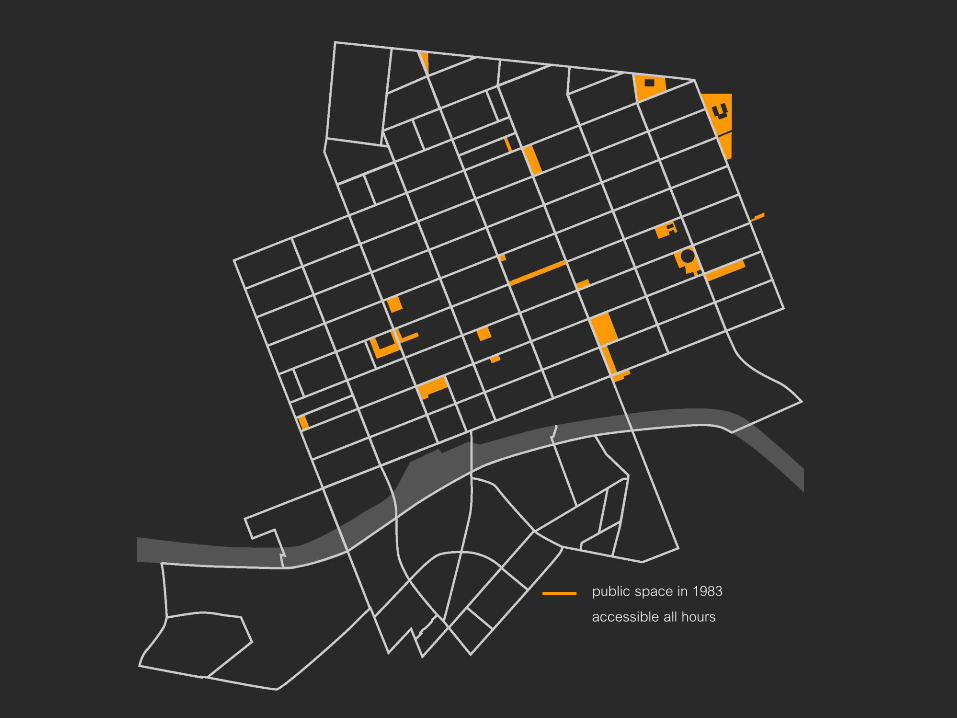
public space in 1983 accessible all hours

public space in 2004 accessible all hours
accessible business hours
pedestrian zone - lunchtimes

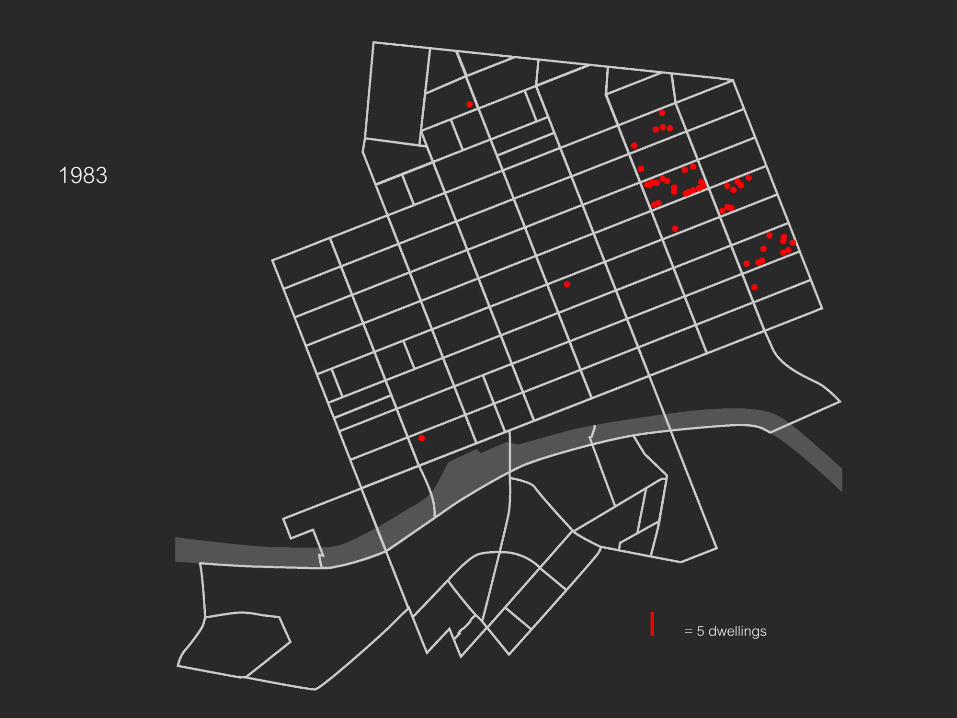
1983
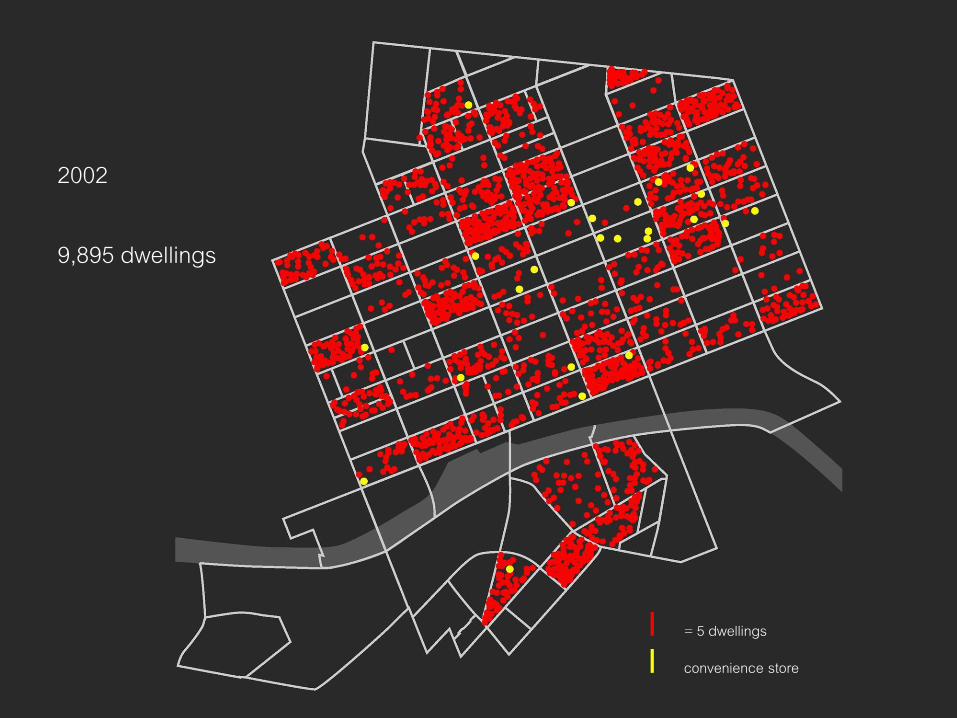
l = 5 dwellings
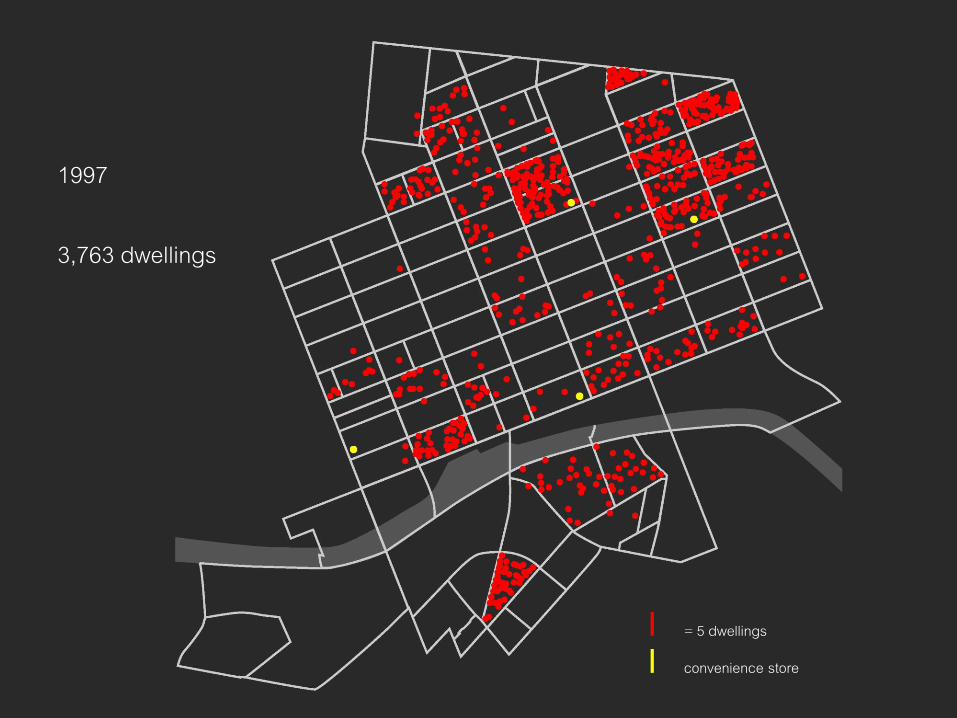
1997
3,763 dwellings
l = 5 dwellings
l convenience store
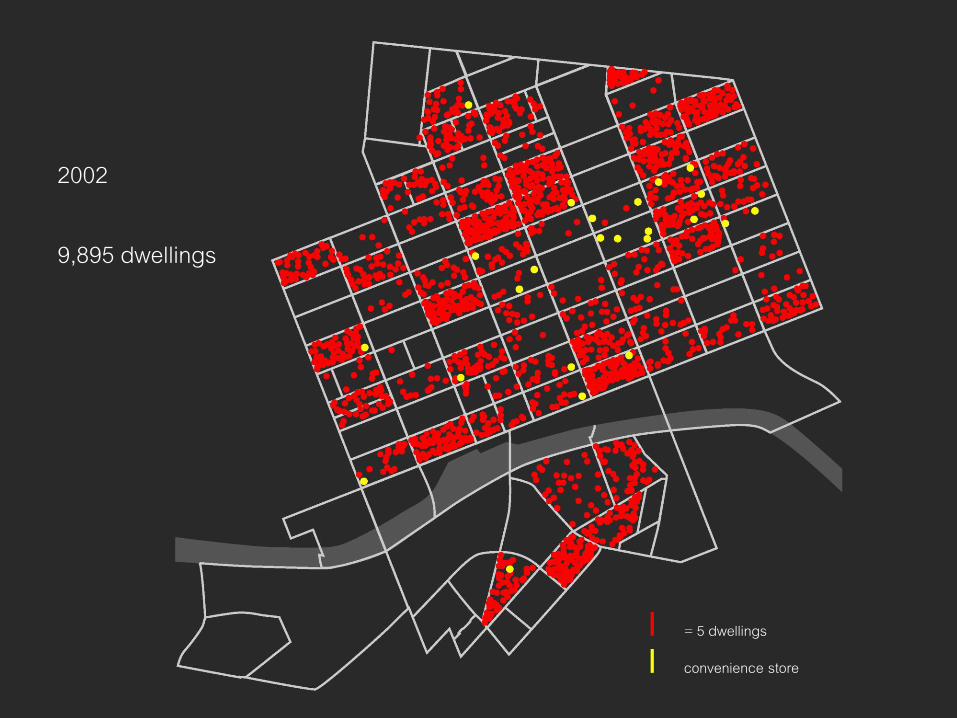
l = 5 dwellings
l convenience store
2002
9,895 dwellings
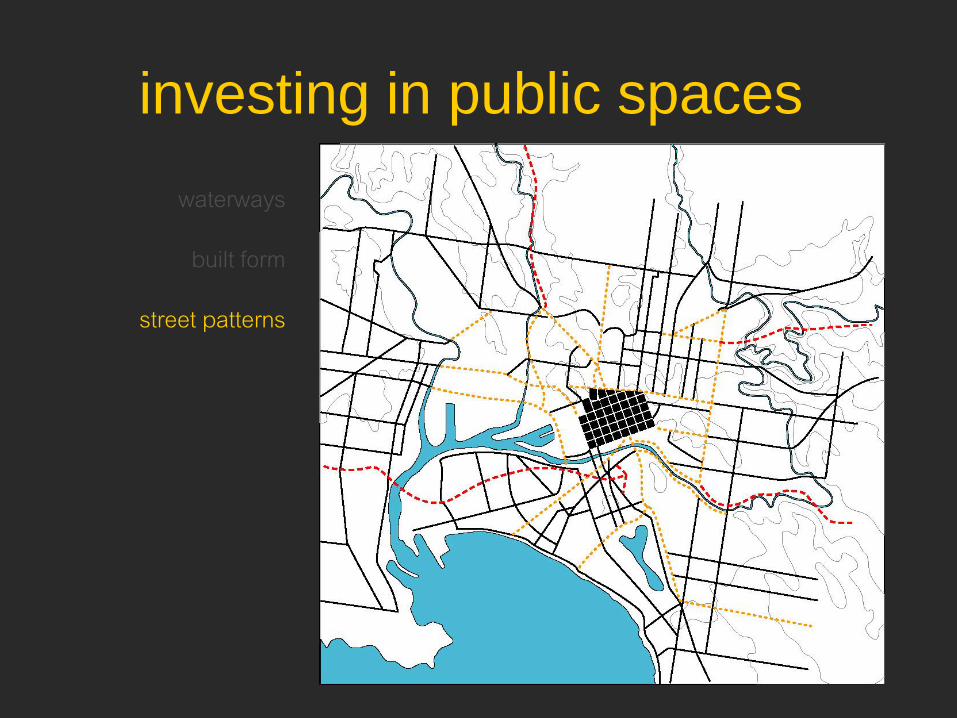
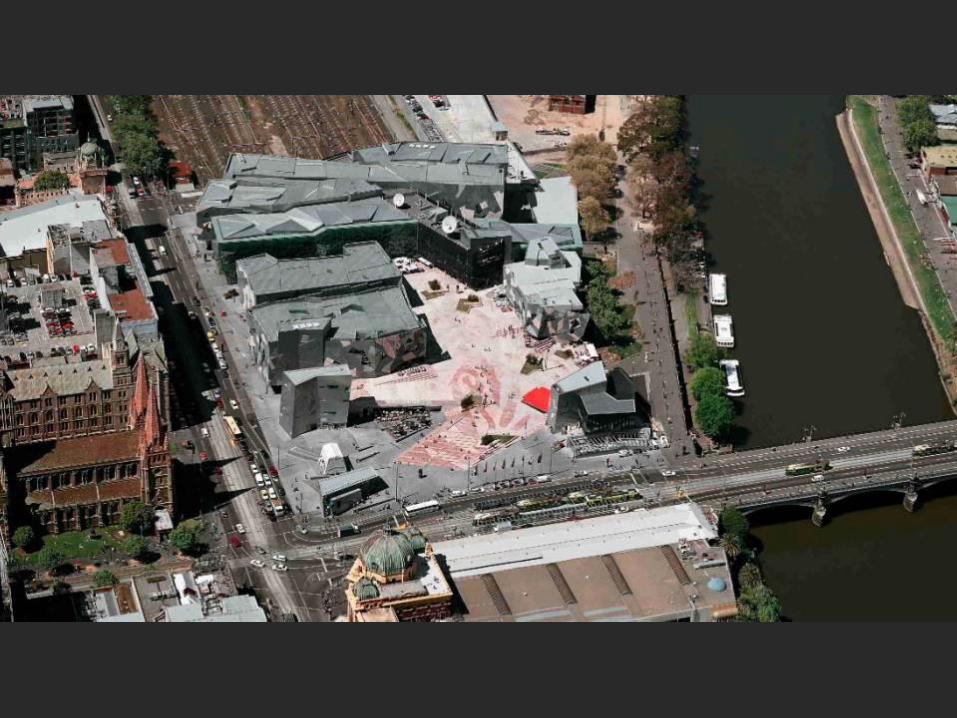
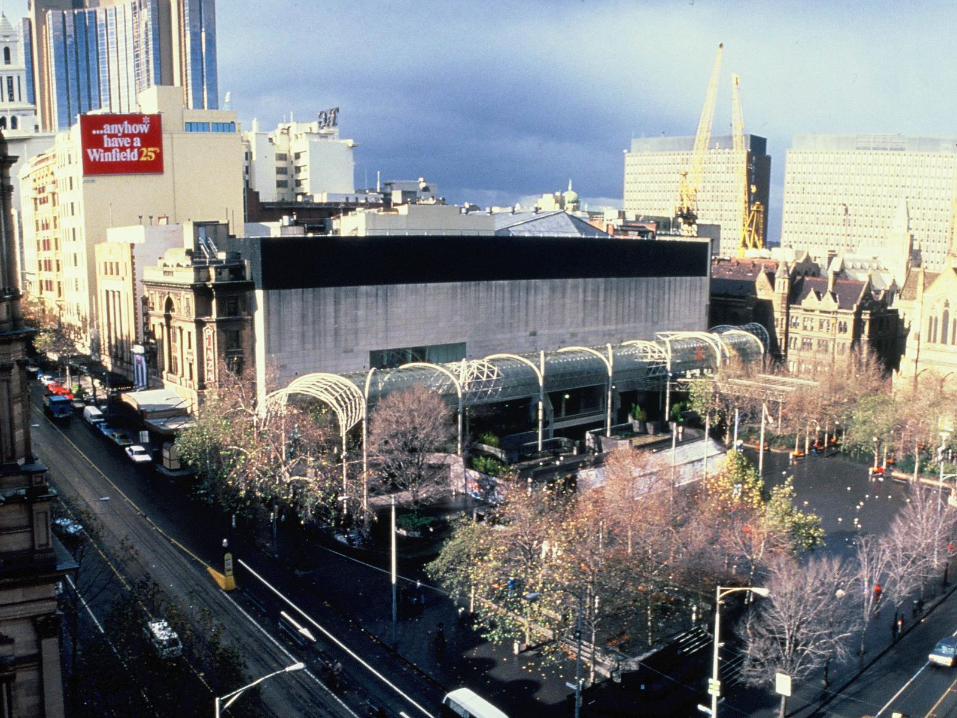
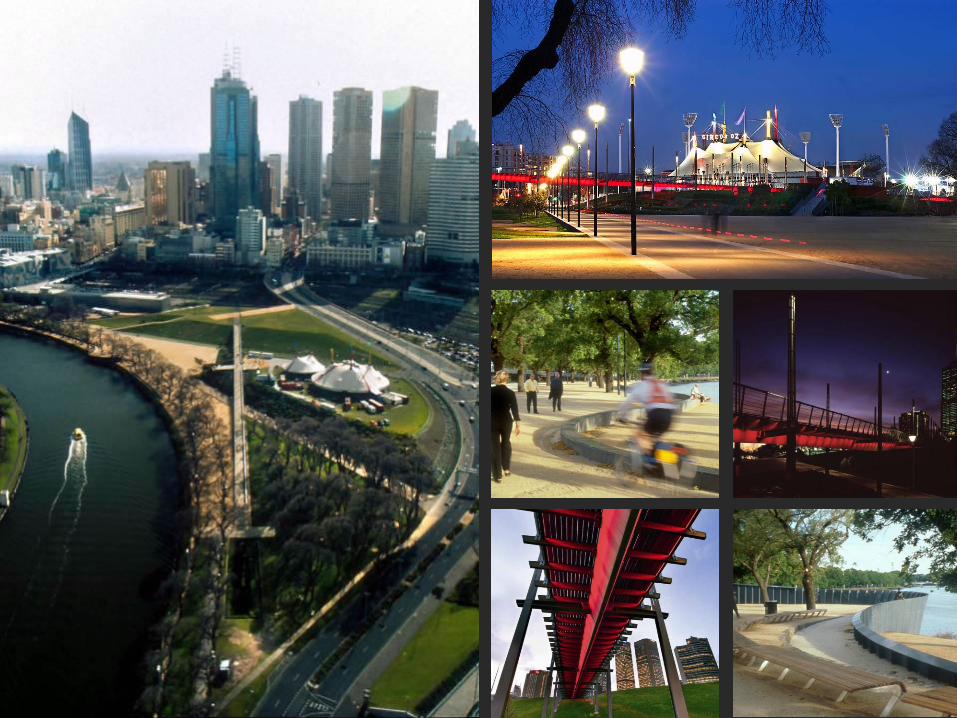
investing in public spaces
waterways
built form
street patterns
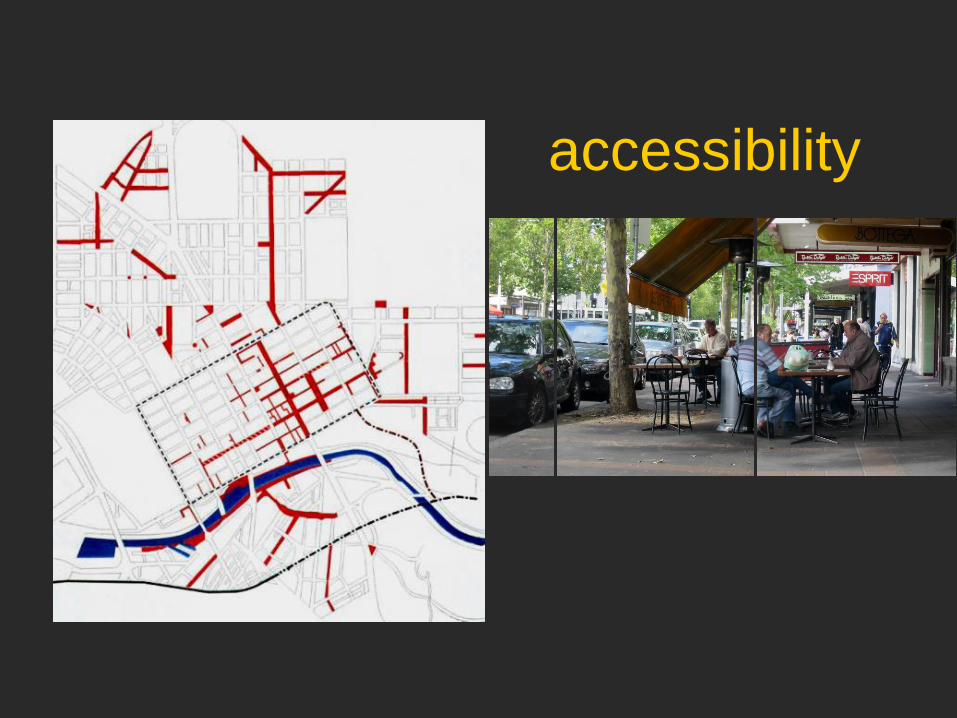
accessibility
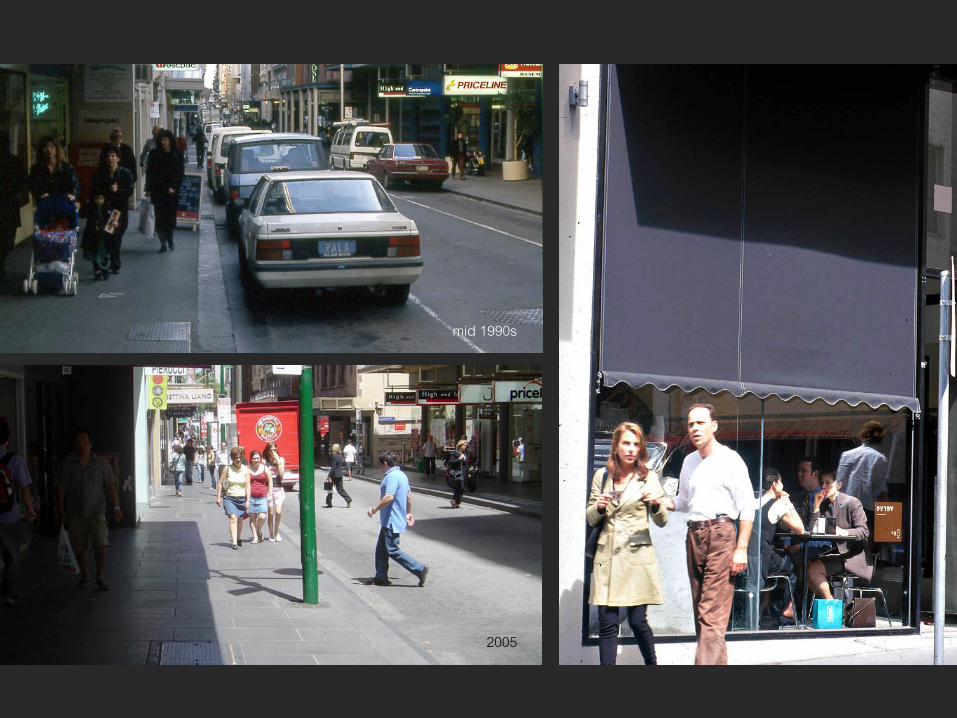
2005
mid 1990s
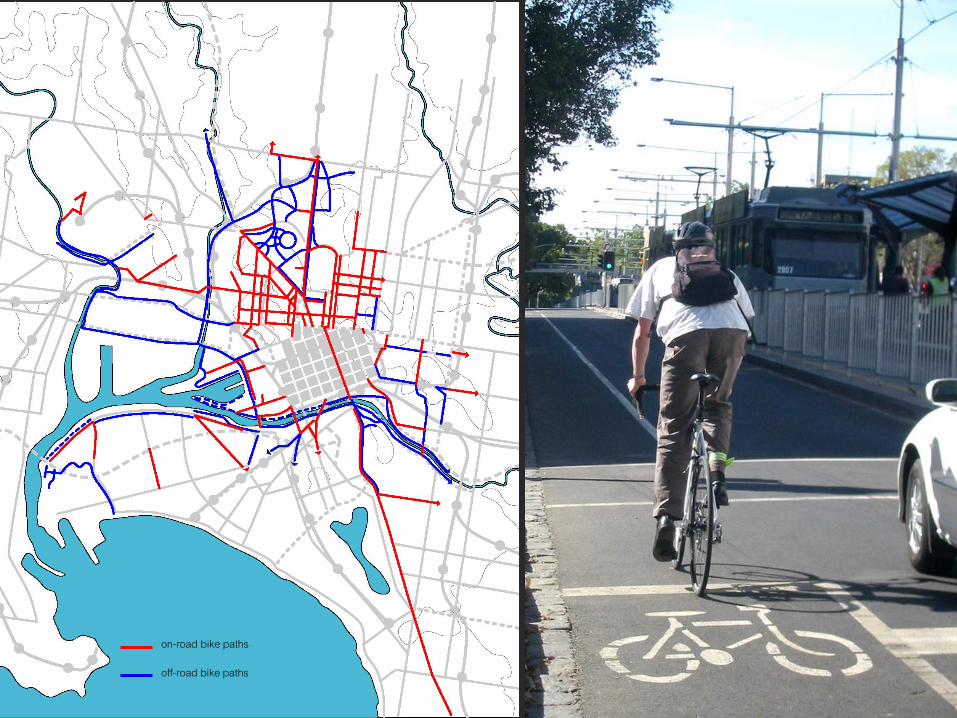
on-road bike paths
off-road bike paths
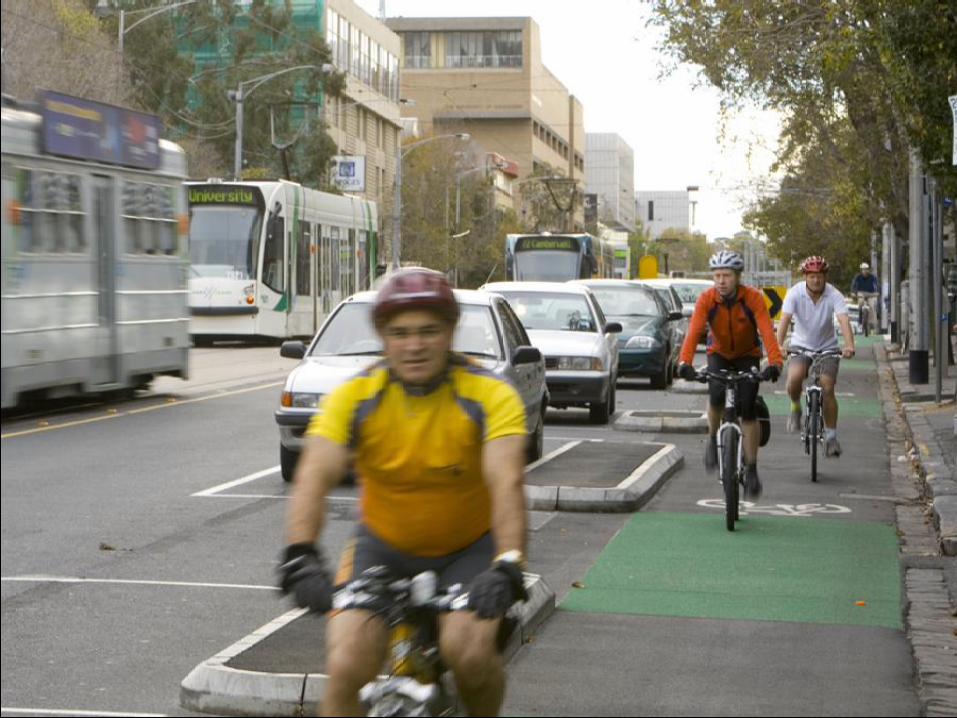
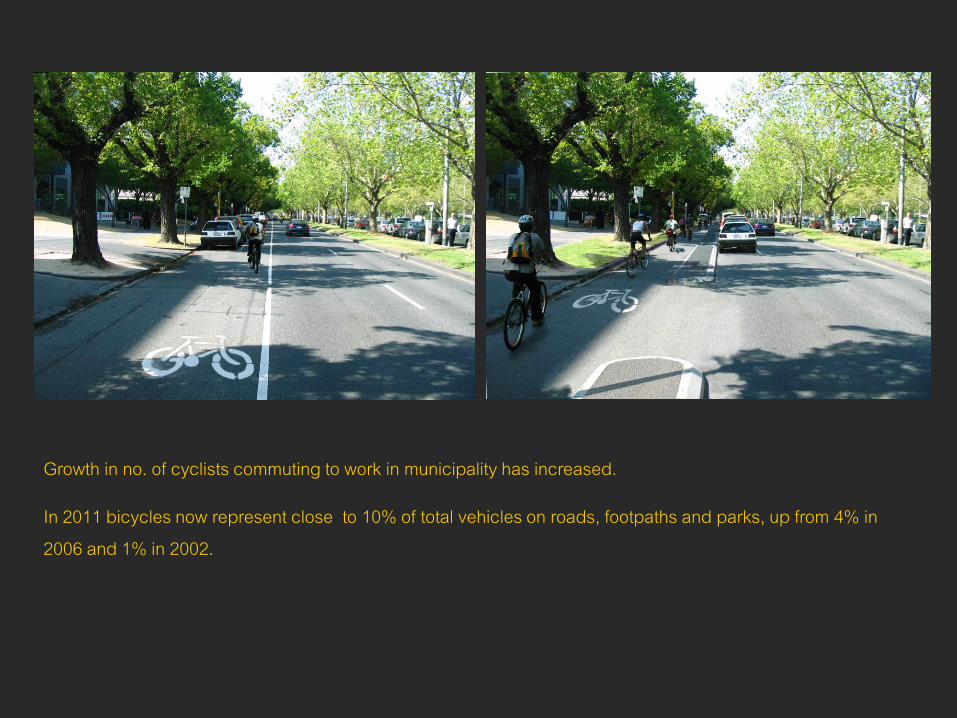
Growth in no. of cyclists commuting to work in municipality has increased.
In 2011 bicycles now represent close to 10% of total vehicles on roads, footpaths and parks, up from 4% in 2006 and 1% in 2002.
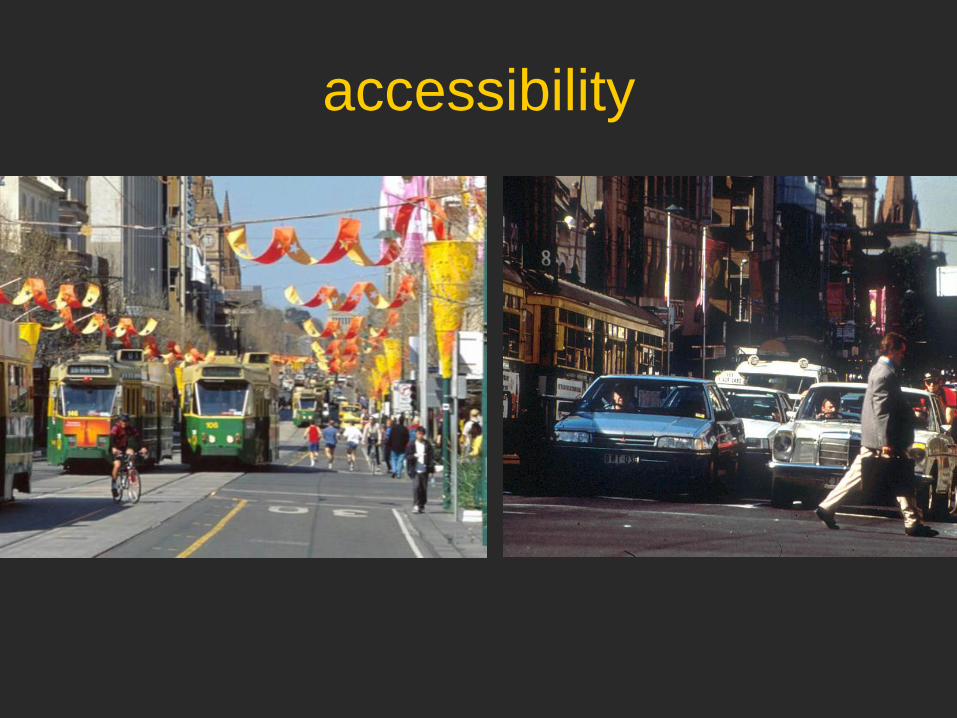
accessibility
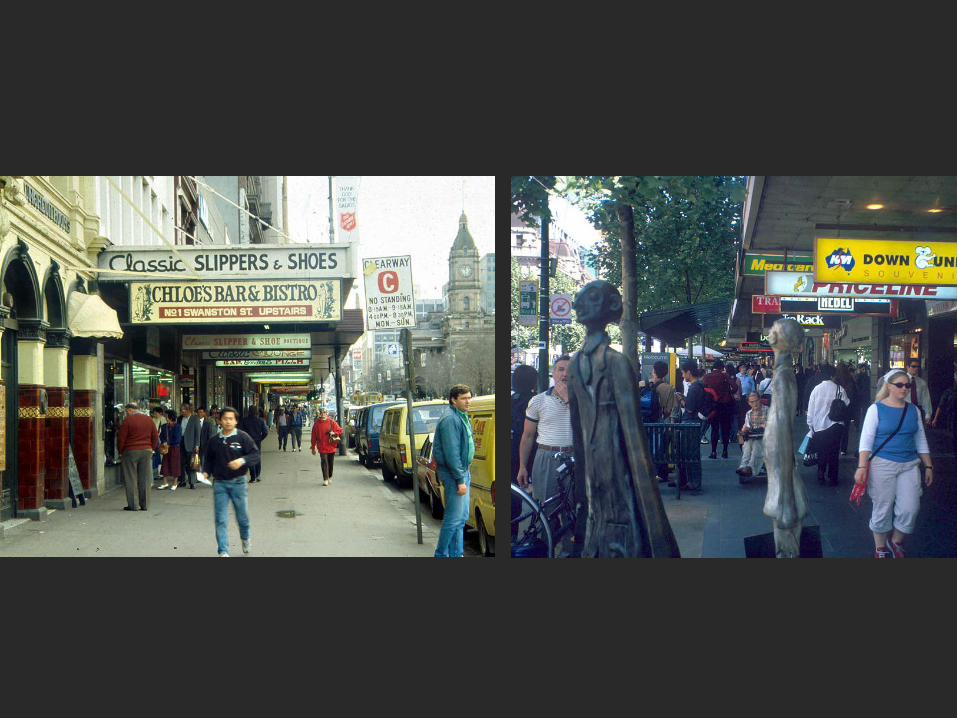
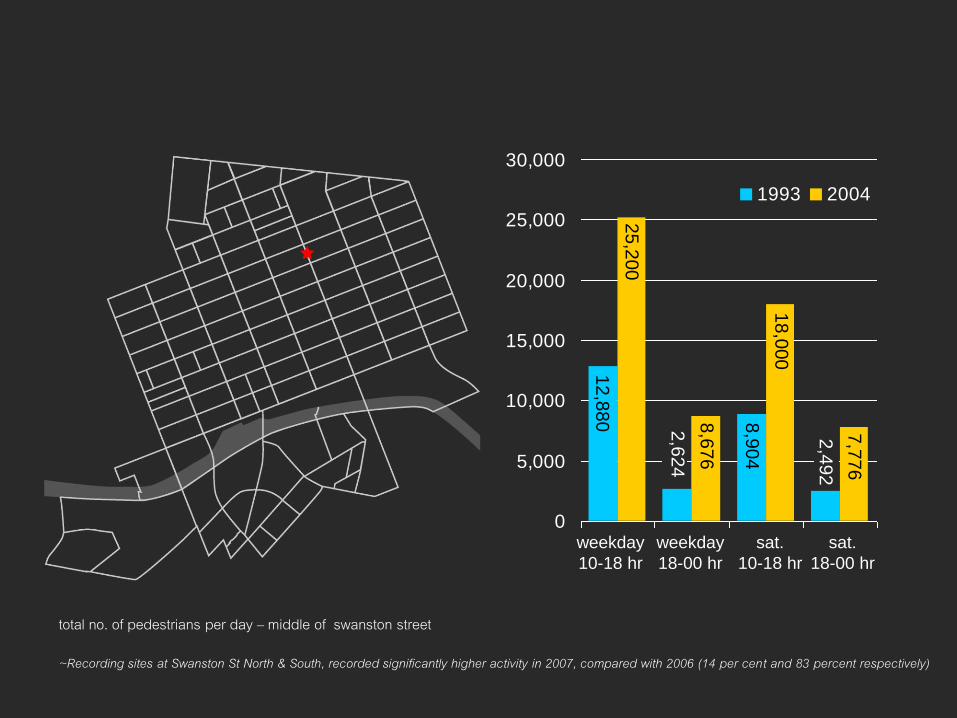
total no. of pedestrians per day – middle of swanston street
~Recording sites at Swanston St North & South, recorded significantly higher activity in 2007, compared with 2006 (14 per cent and 83 percent respectively)
0
5,000
10,000
15,000
20,000
25,000
30,000
1993 2004
12
,88
0
25
,20
0
8,6
76
8,9
04
18
,00
0
7,7
76
2,6
24
2,4
92
weekday
10-18 hr
weekday
18-00 hr
sat.
10-18 hr
sat.
18-00 hr
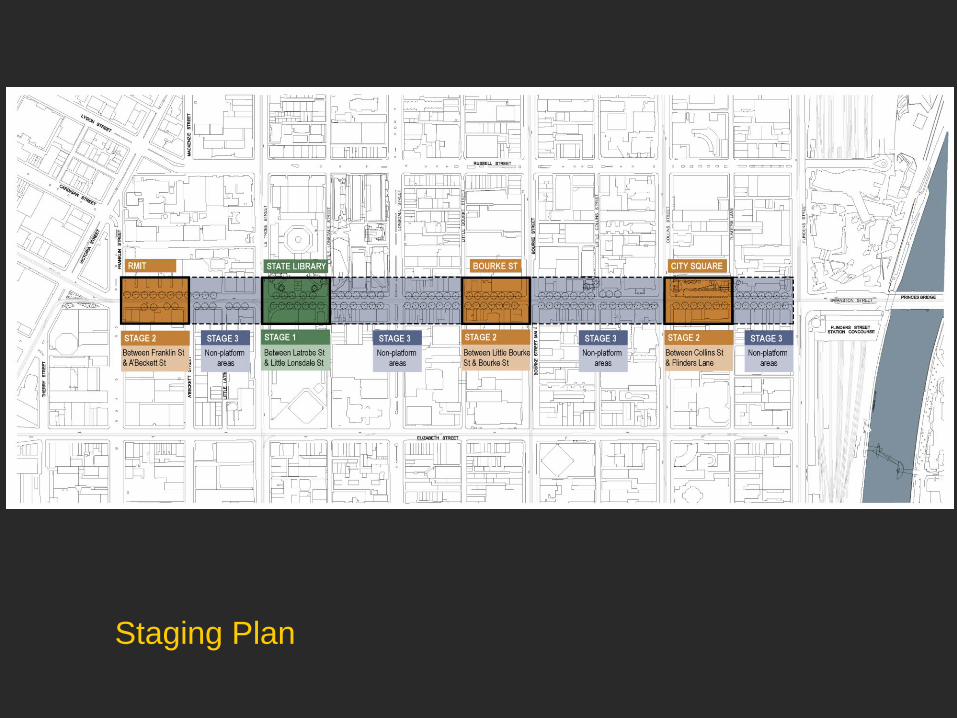
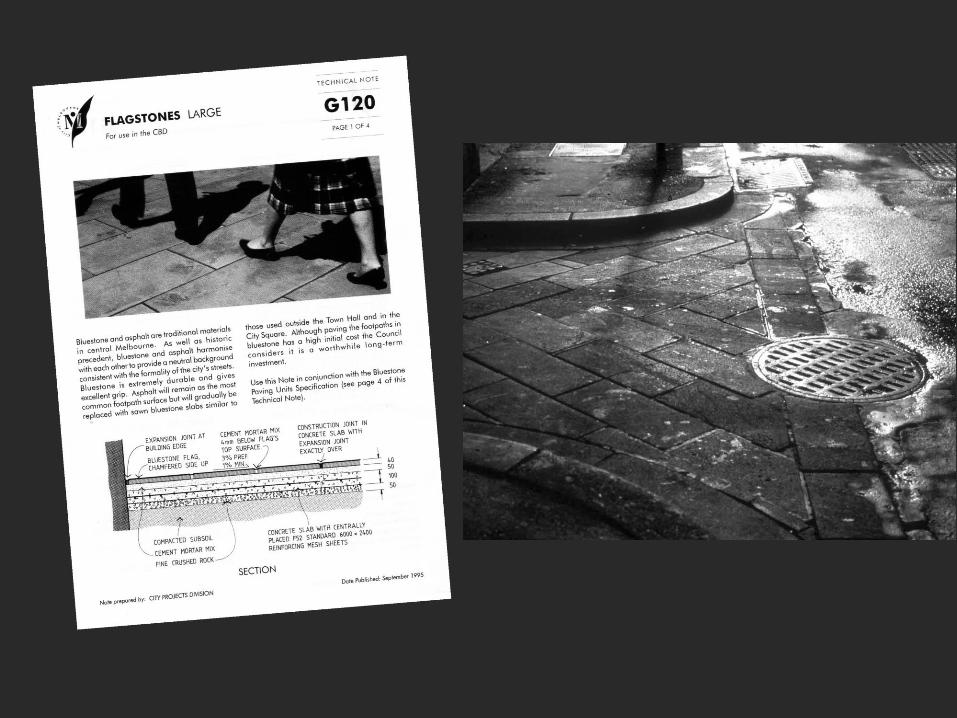
Staging Plan
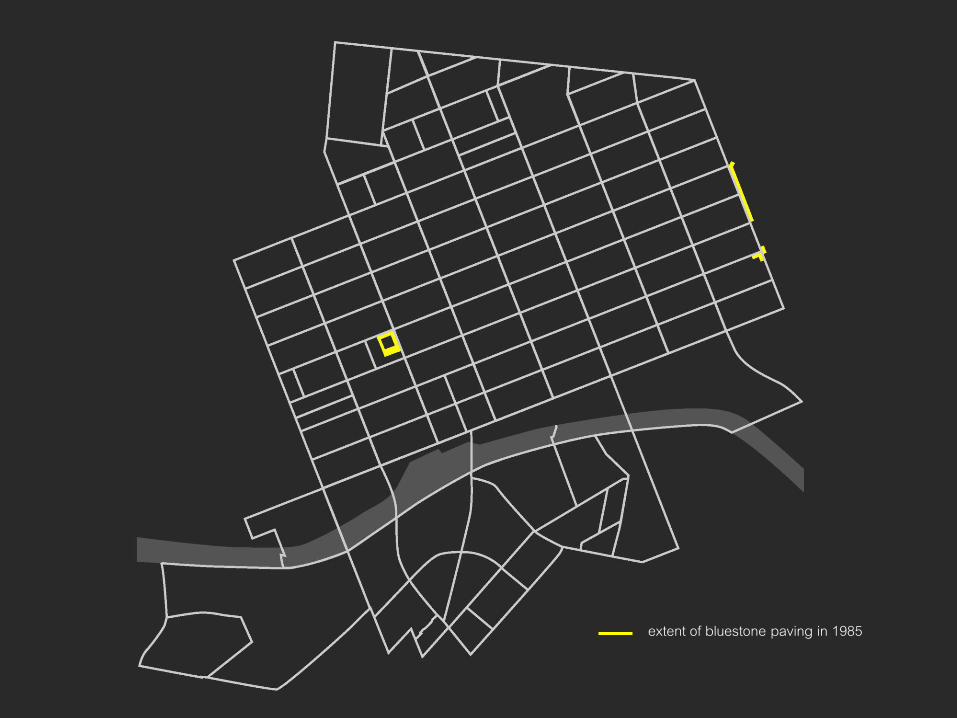
extent of bluestone paving in 1985
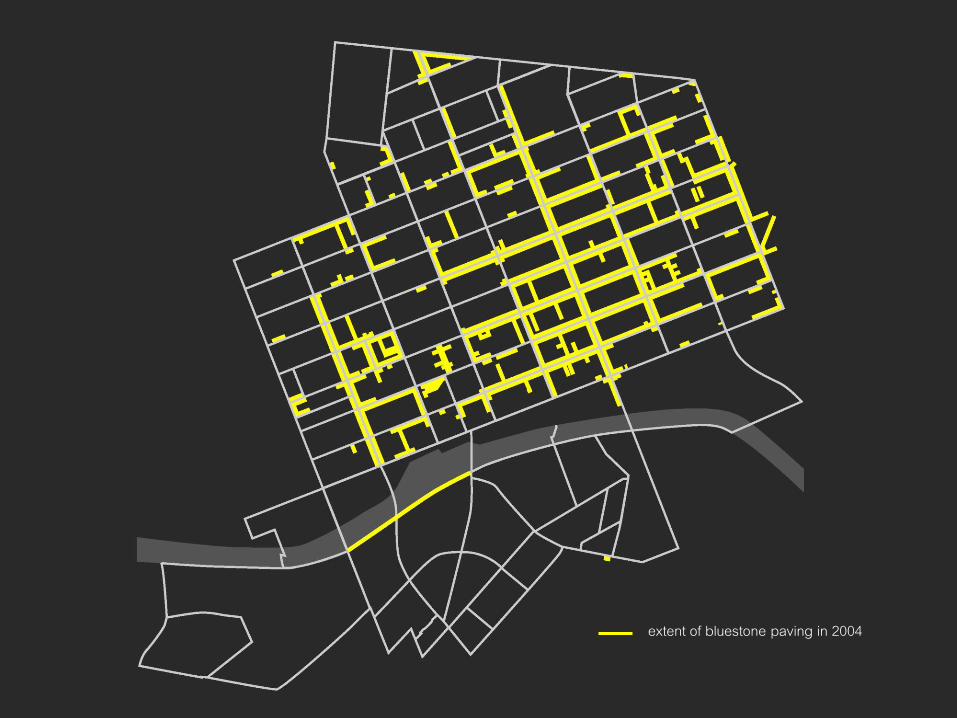
extent of bluestone paving in 2004
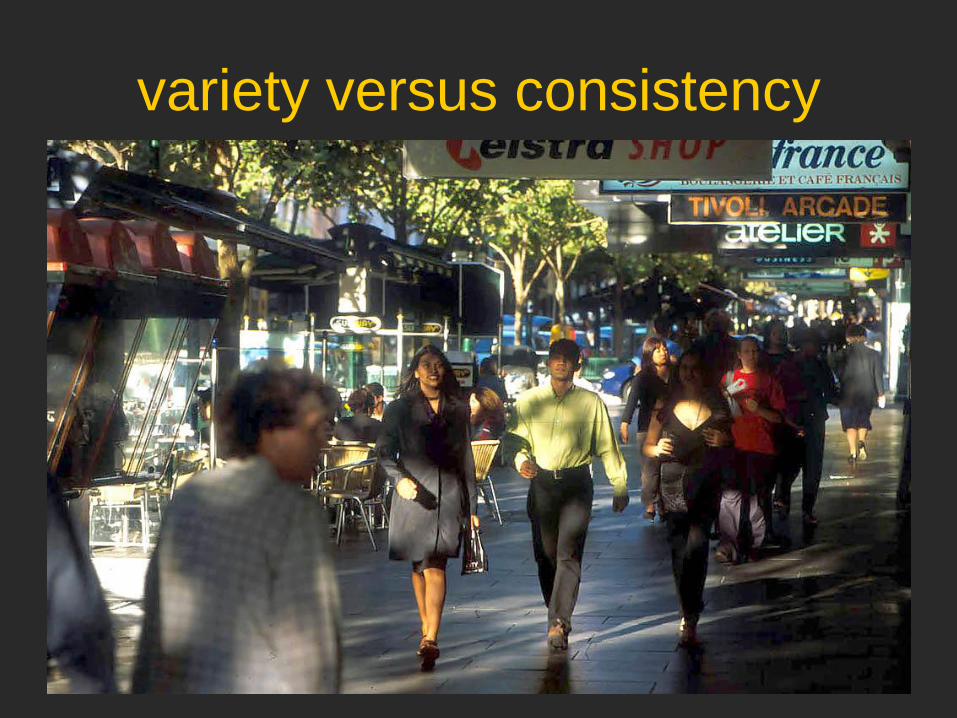
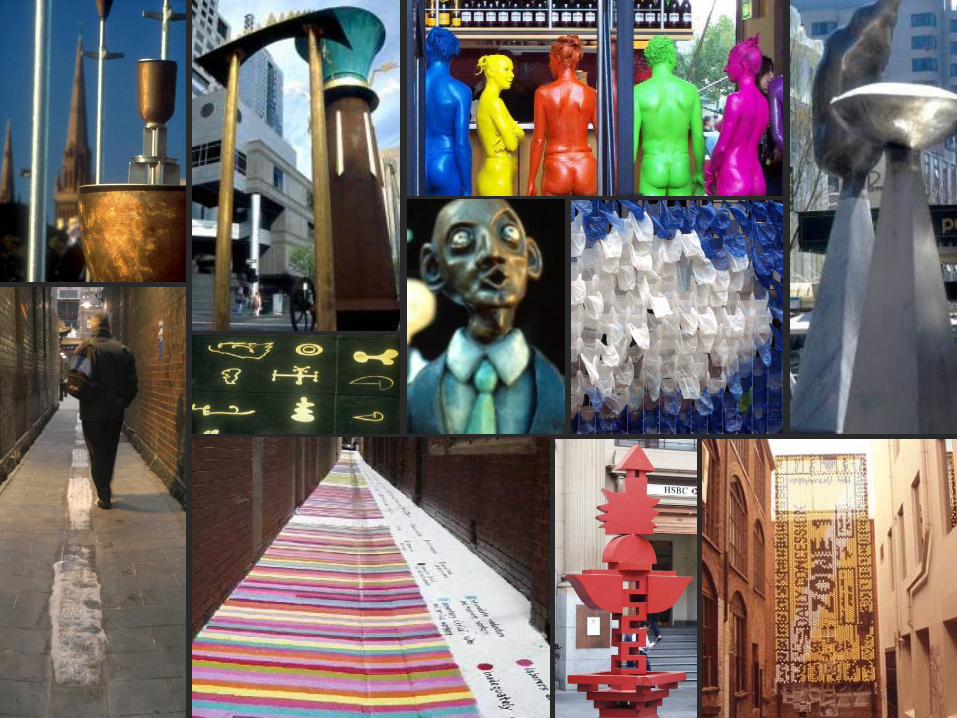
variety versus consistency
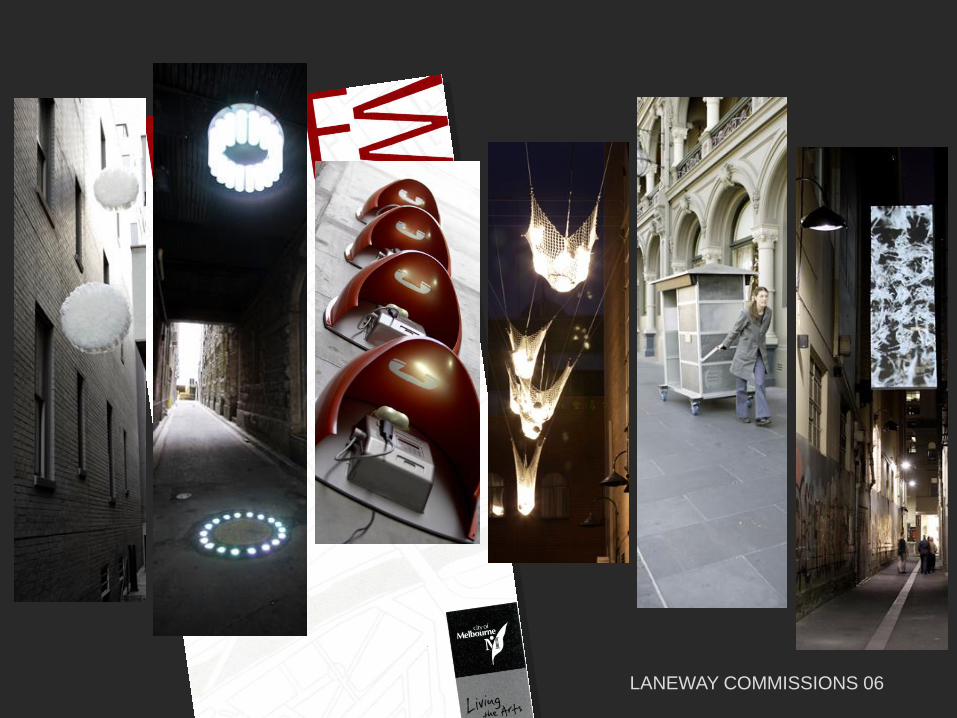
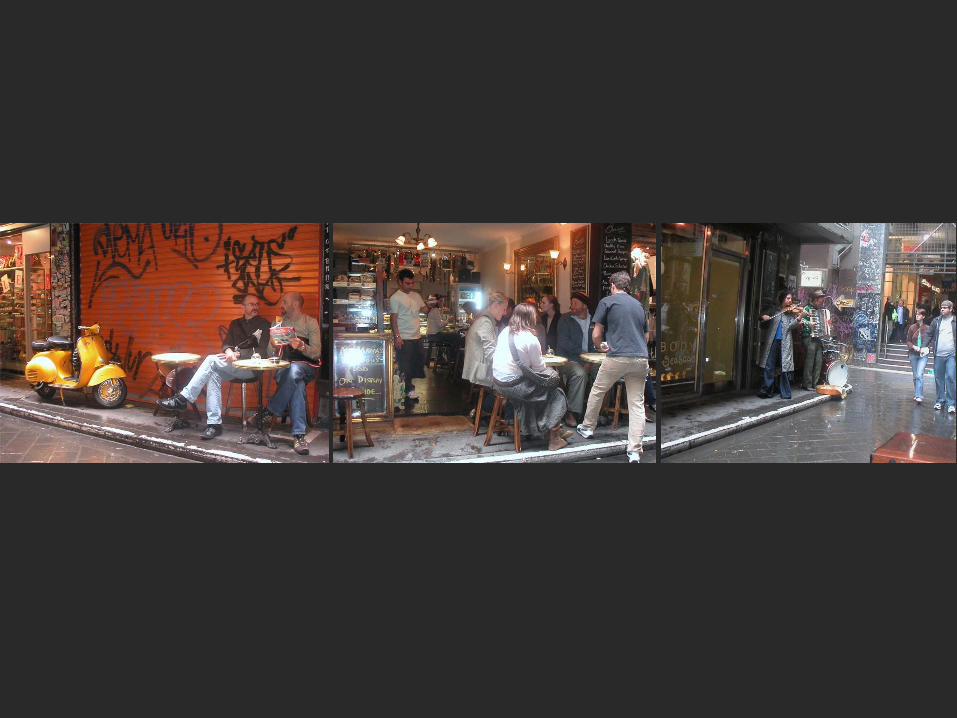
LANEWAY COMMISSIONS 06
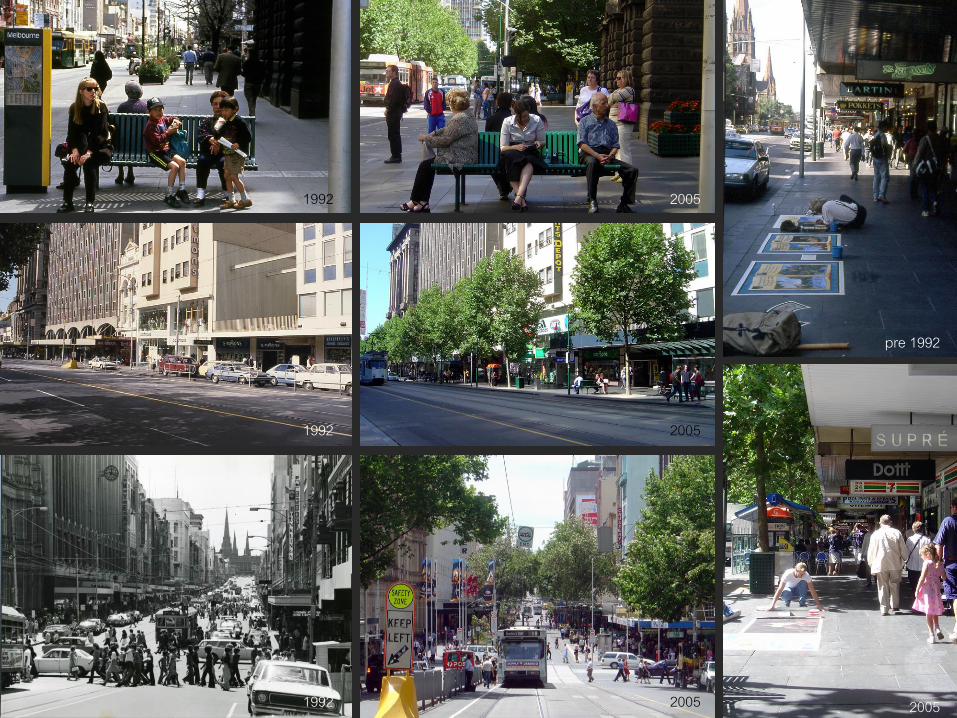
1992 2005
pre 1992
2005
1992 2005
1992 2005
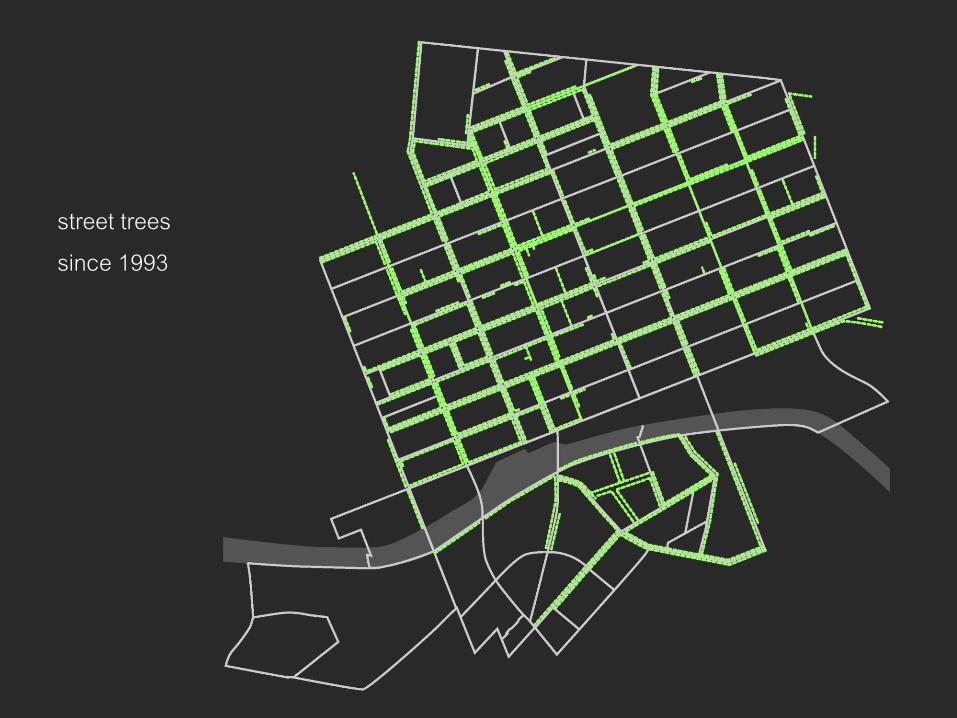
street trees since 1993
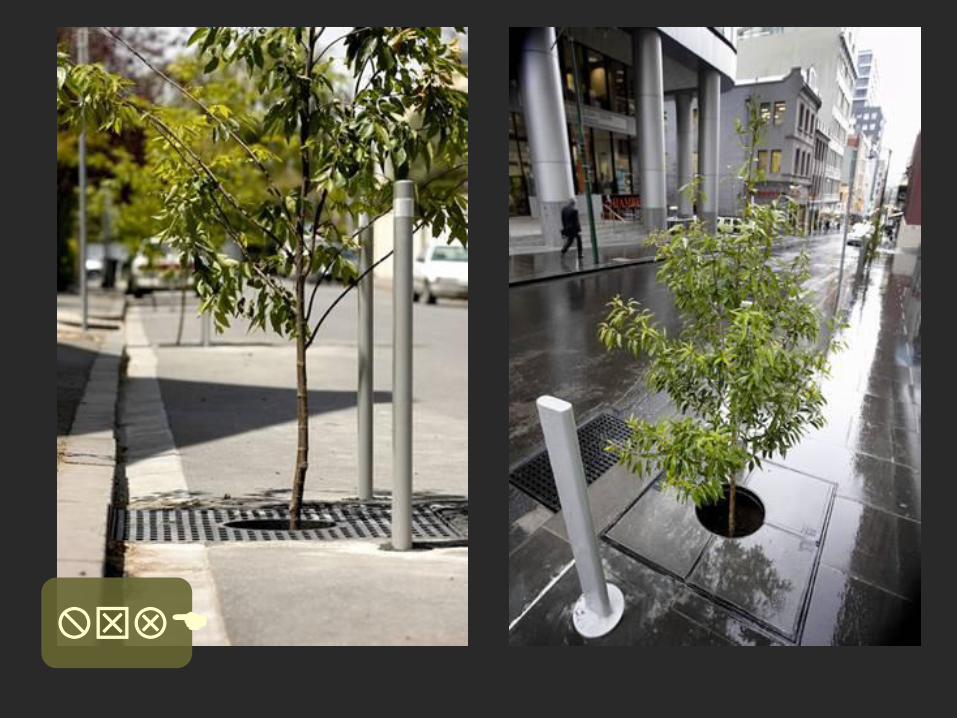
WSUD
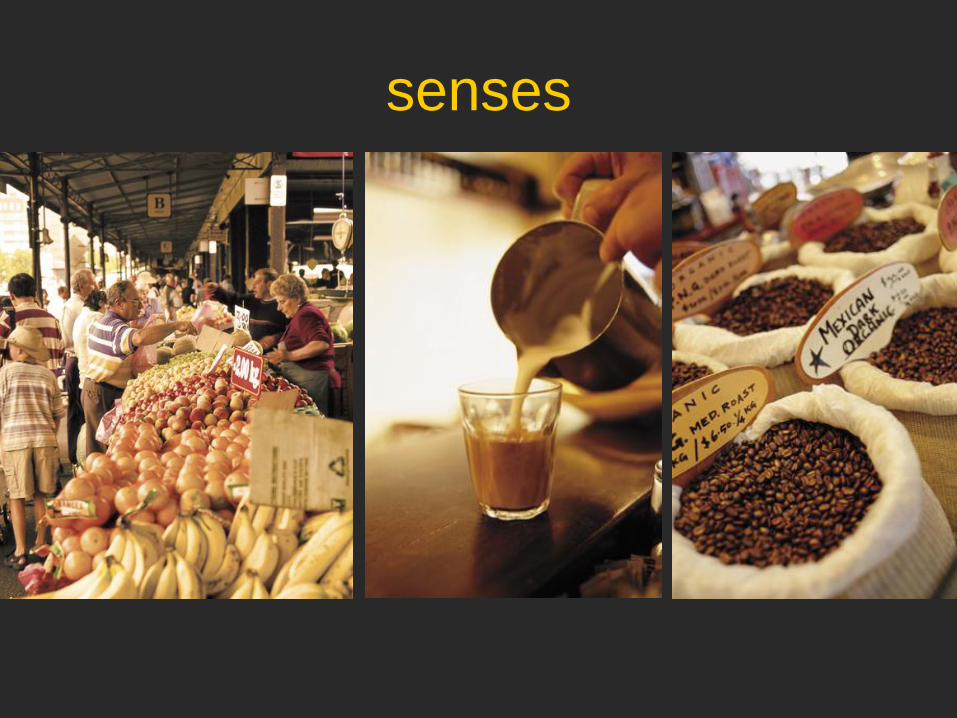
senses
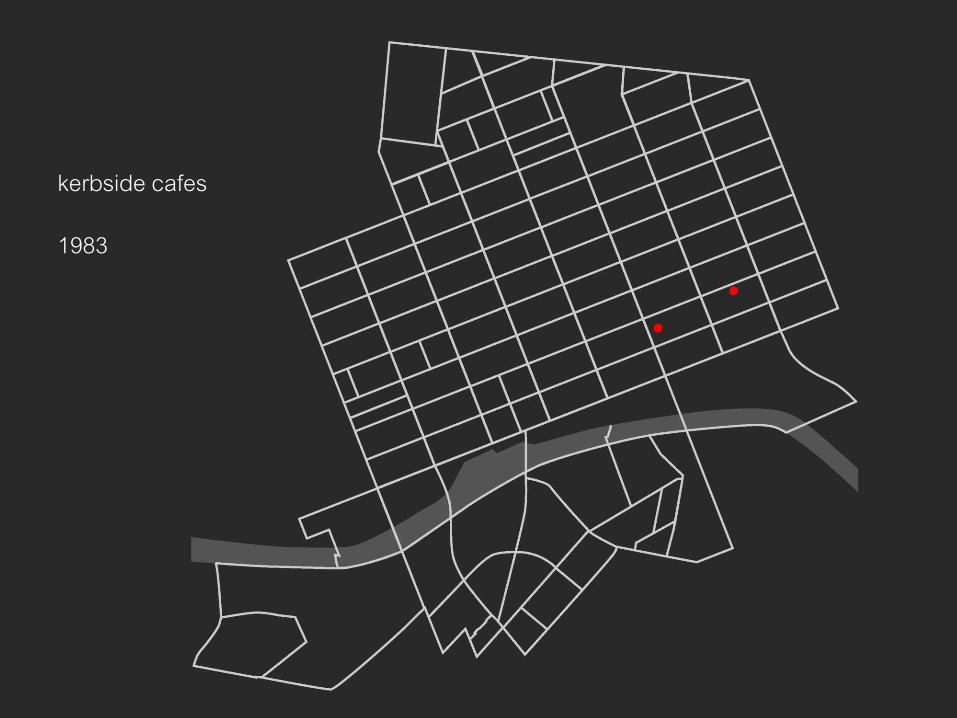
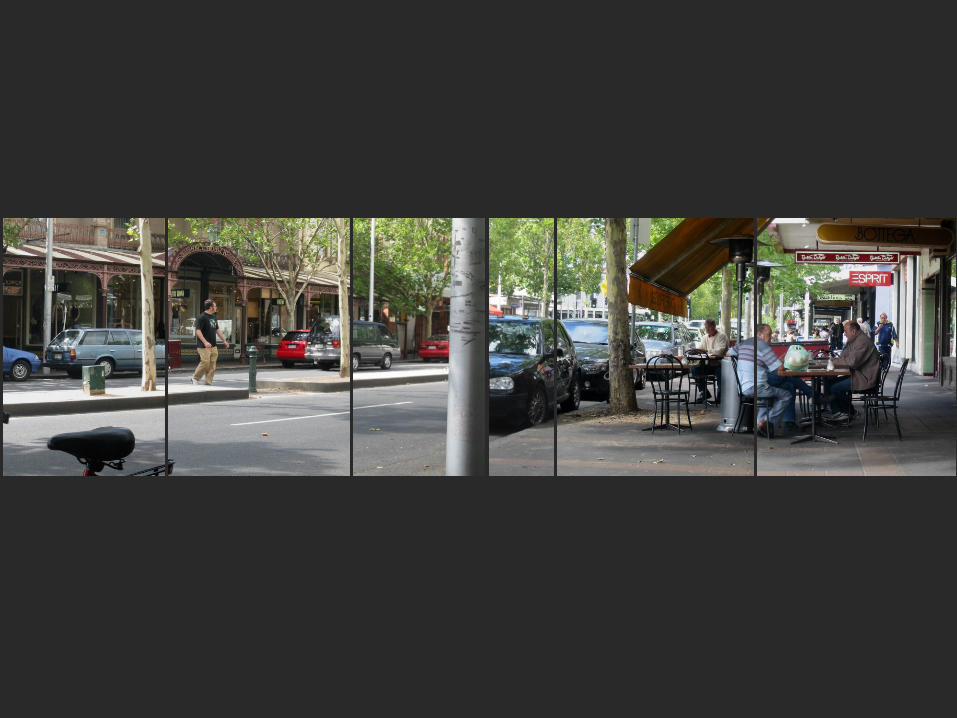
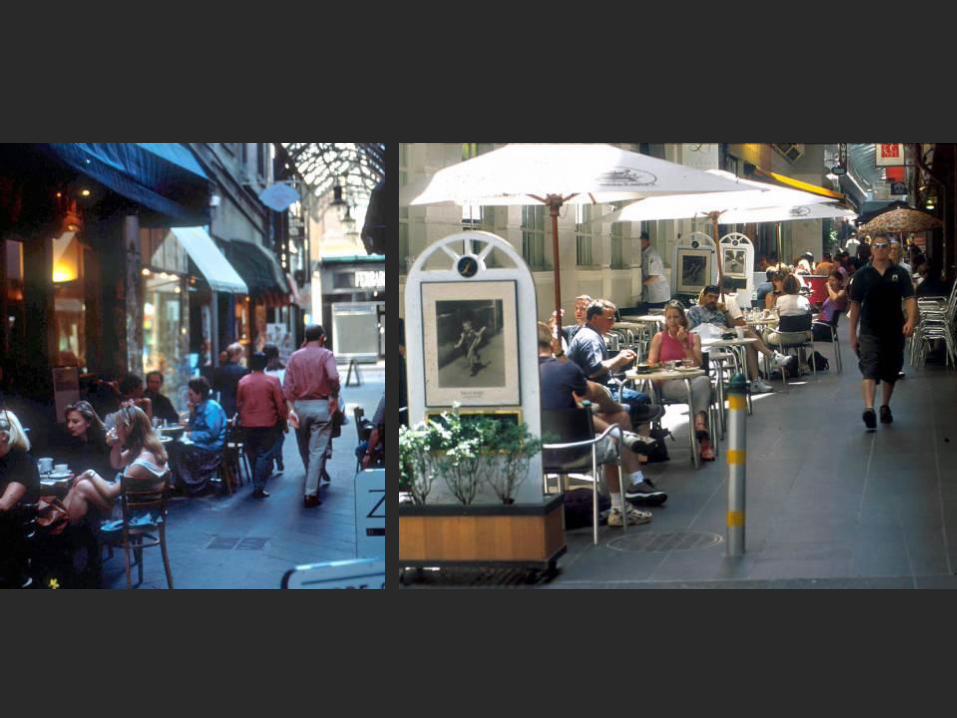
kerbside cafes
1983
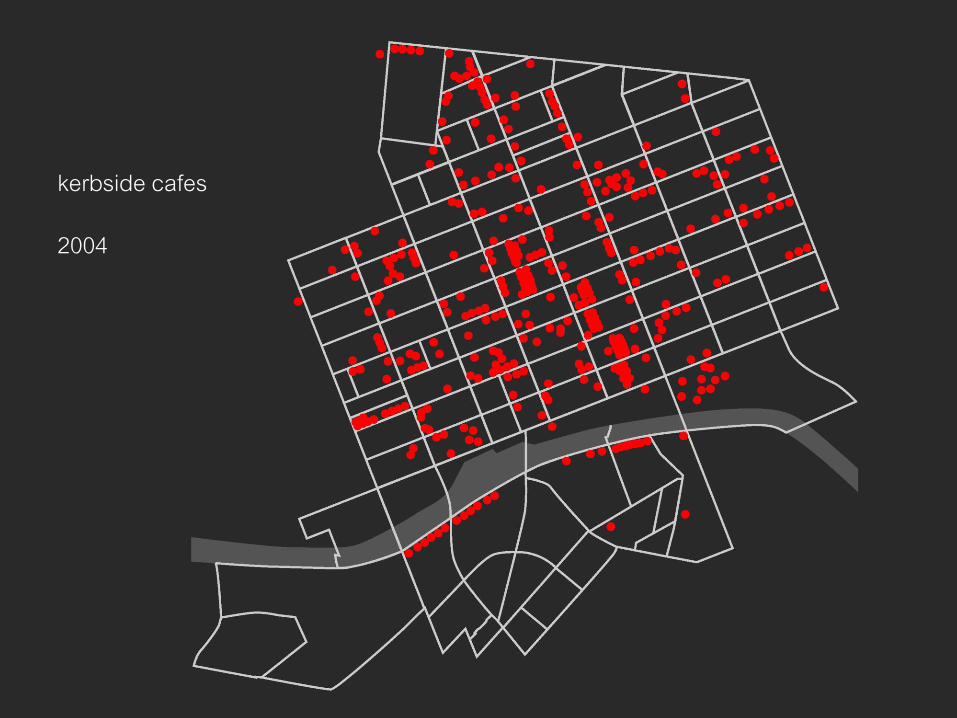
kerbside cafes
2004
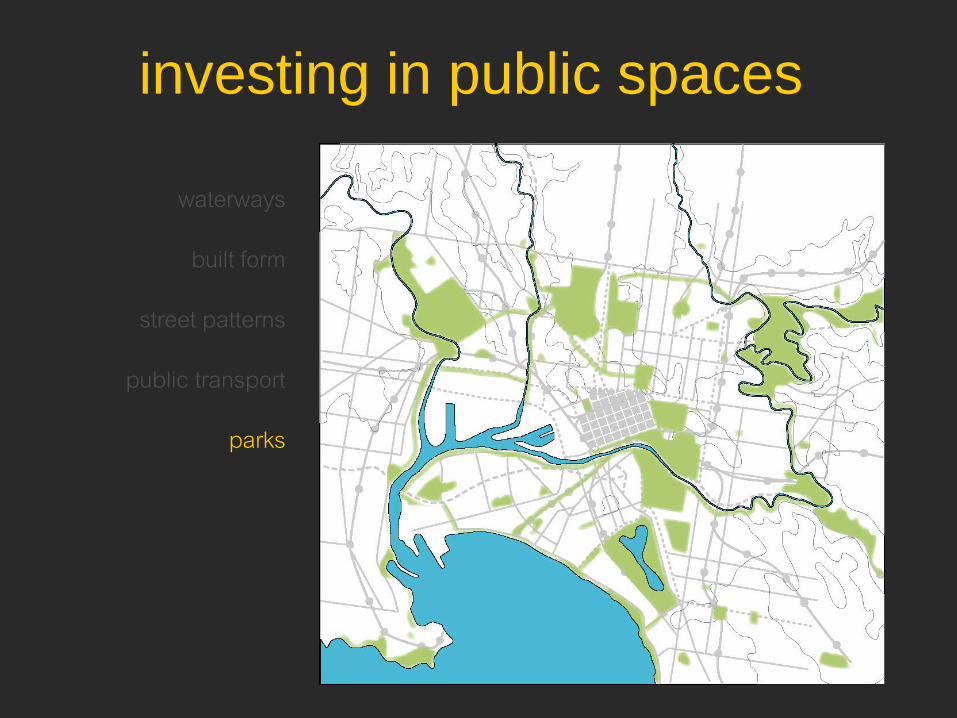
investing in public spaces
waterways
built form
street patterns
public transport
parks
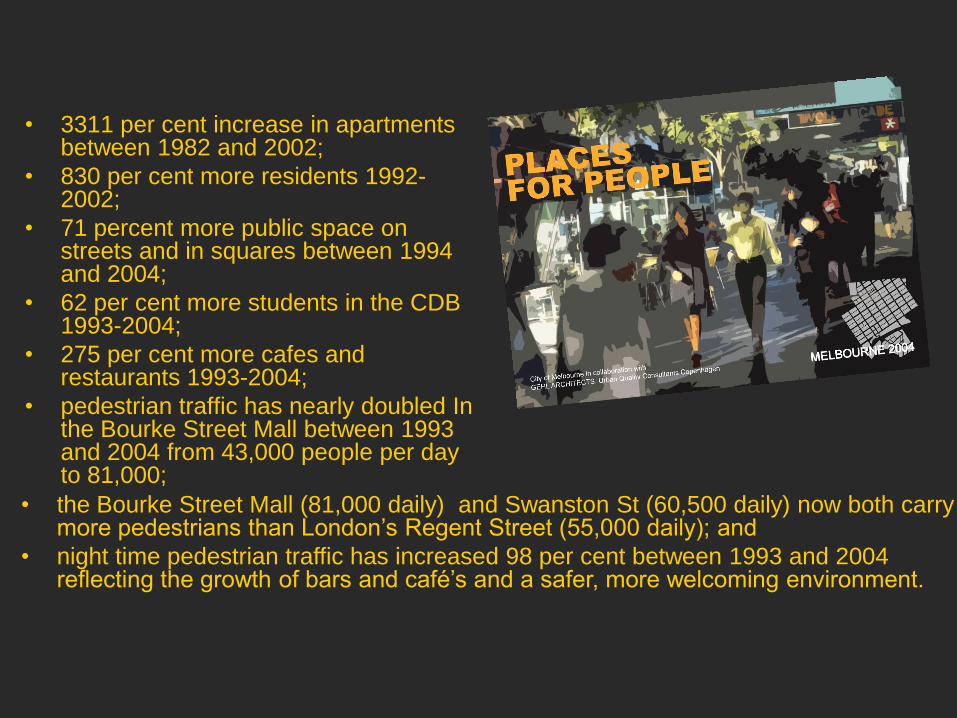
• 3311 per cent increase in apartments between 1982 and 2002;
• 830 per cent more residents 1992-2002;
• 71 percent more public space on streets and in squares between 1994 and 2004;
• 62 per cent more students in the CDB 1993-2004;
• 275 per cent more cafes and restaurants 1993-2004;
• pedestrian traffic has nearly doubled In the Bourke Street Mall between 1993 and 2004 from 43,000 people per day to 81,000;
• the Bourke Street Mall (81,000 daily) and Swanston St (60,500 daily) now both carry more pedestrians than London’s Regent Street (55,000 daily); and
• night time pedestrian traffic has increased 98 per cent between 1993 and 2004 reflecting the growth of bars and café’s and a safer, more welcoming environment.
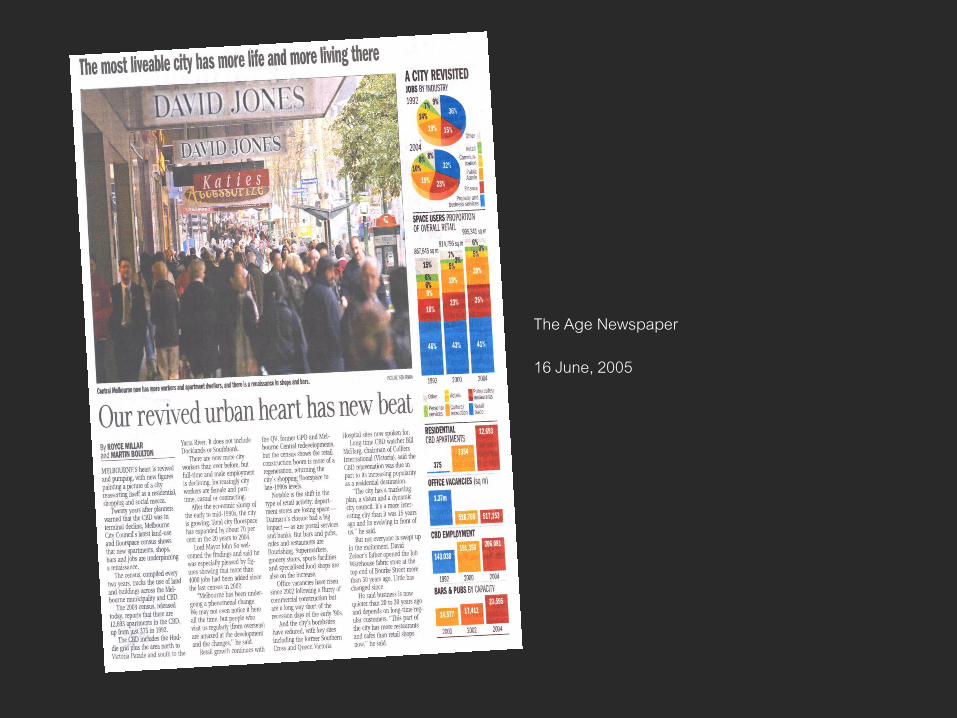
The Age Newspaper
16 June, 2005
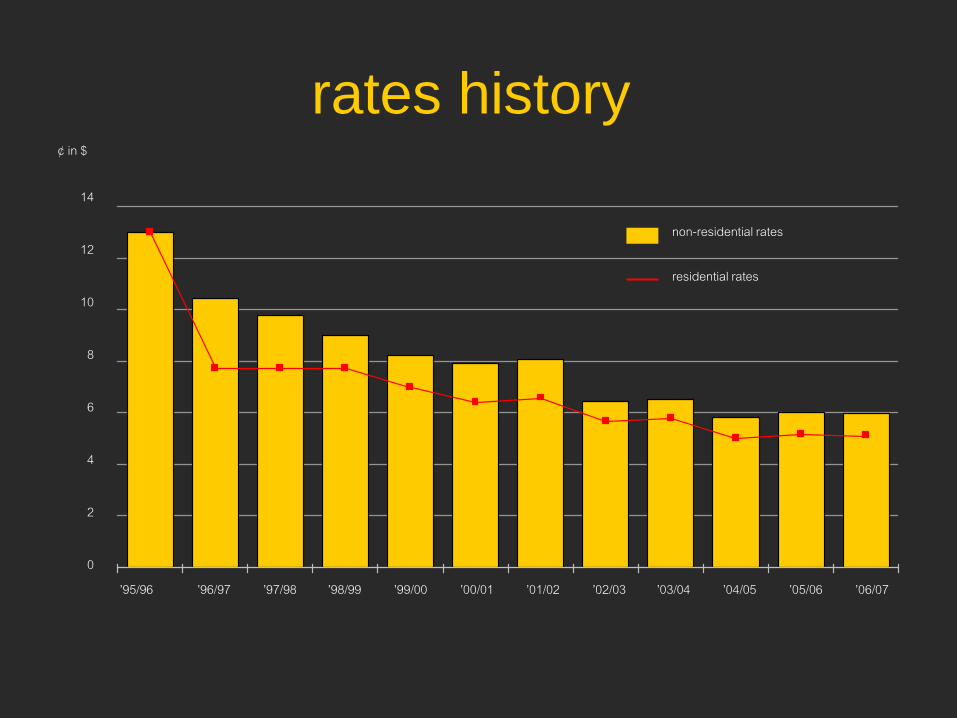
rates history
’95/96 ’96/97 ’97/98 ’98/99 ’99/00 ’00/01 ’01/02 ’02/03 ’03/04 ’04/05 ’05/06 ’06/07
14
12
10
8
6
4
2
0
¢ in $
non-residential rates
residential rates
public melbourne urban design strategy
public melbourne urban design strategy
public melbourne
urban design strategy
public melbourne urban design strategy
public melbourne urban design strategy
public melbourne
sustainability. . .
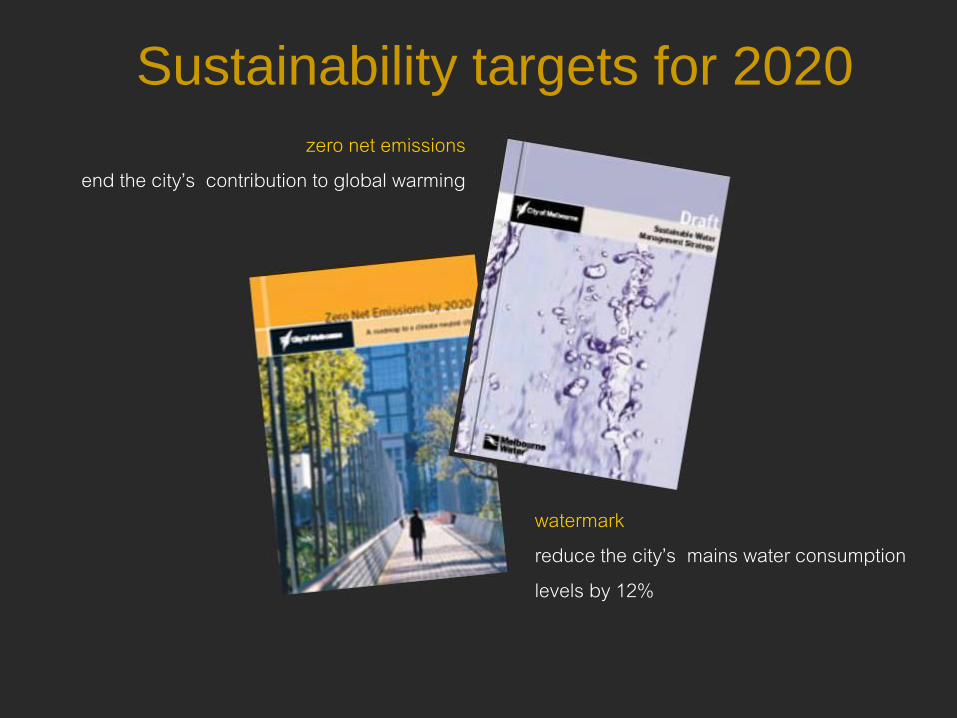
Sustainability targets for 2020
zero net emissions end the city’s contribution to global warming
watermark reduce the city’s mains water consumption levels by 12%
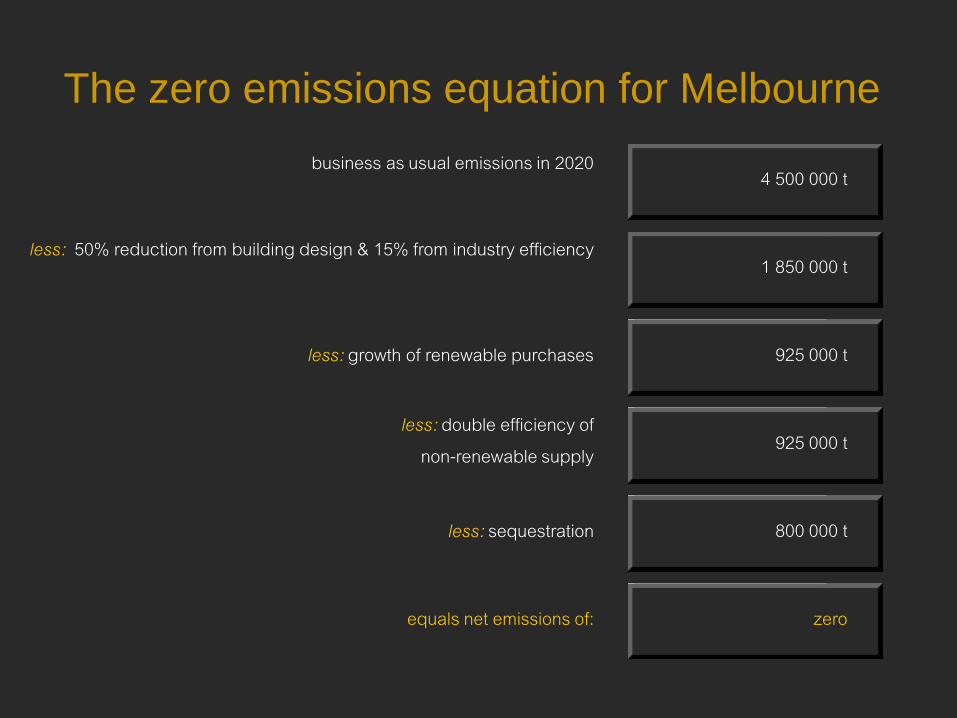
The zero emissions equation for Melbourne
4 500 000 t
1 850 000 t
925 000 t
925 000 t
800 000 t
zero
business as usual emissions in 2020
less: 50% reduction from building design & 15% from industry efficiency
less: growth of renewable purchases
less: double efficiency of non-renewable supply
less: sequestration
equals net emissions of:
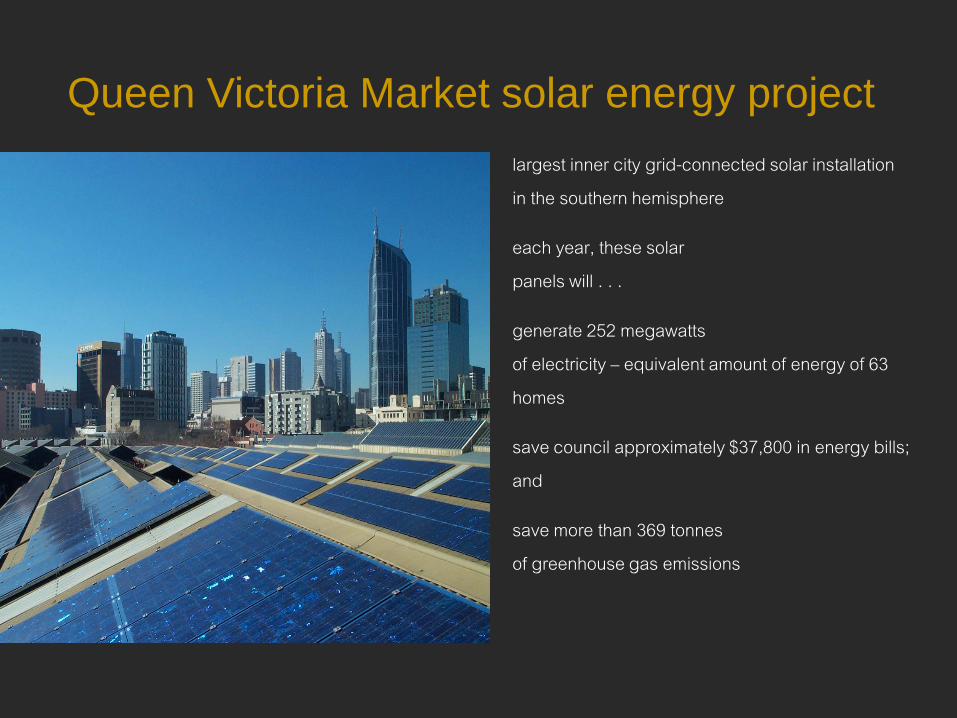
Queen Victoria Market solar energy project
largest inner city grid-connected solar installation in the southern hemisphere
each year, these solar panels will . . .
generate 252 megawatts of electricity – equivalent amount of energy of 63 homes
save council approximately $37,800 in energy bills; and
save more than 369 tonnes of greenhouse gas emissions
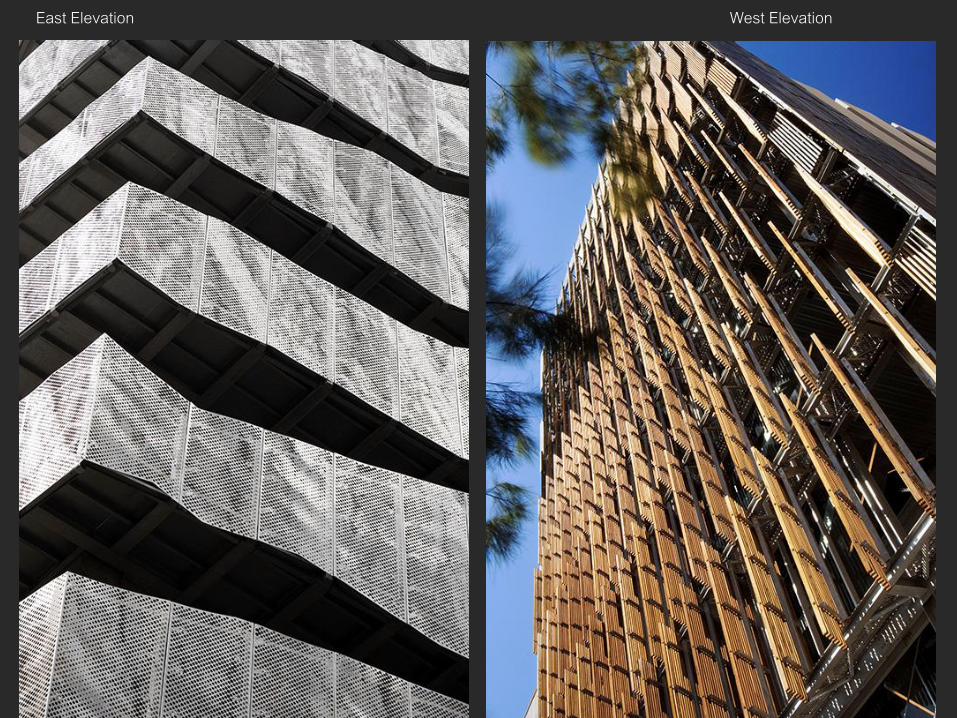
East Elevation
West Elevation
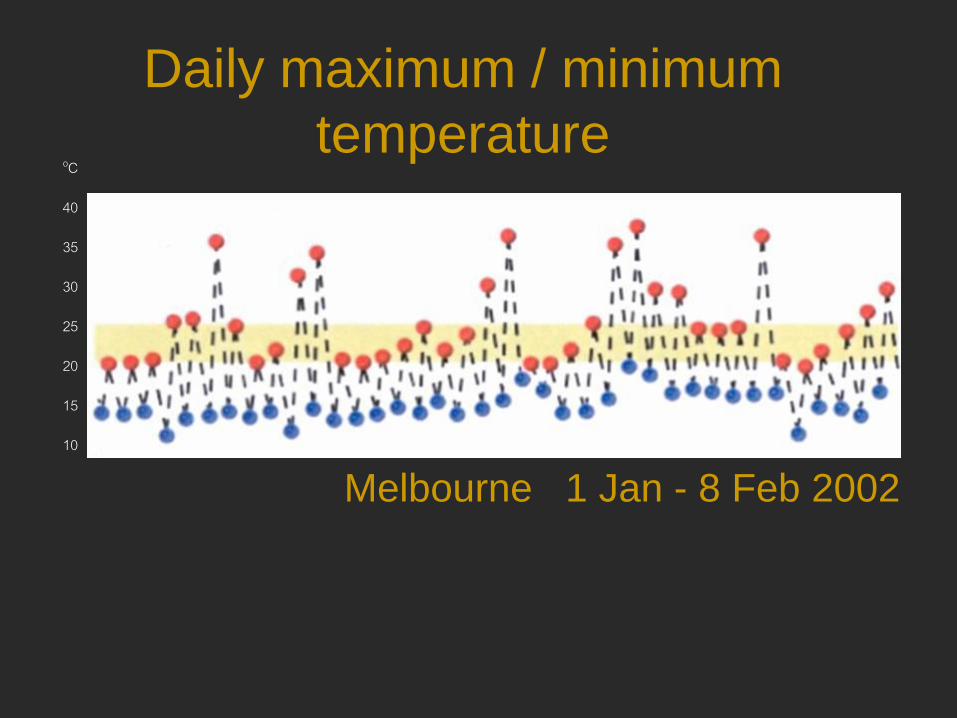
Daily maximum / minimum
temperature
Melbourne 1 Jan - 8 Feb 2002
oC
40
35
30
25
20
15
10
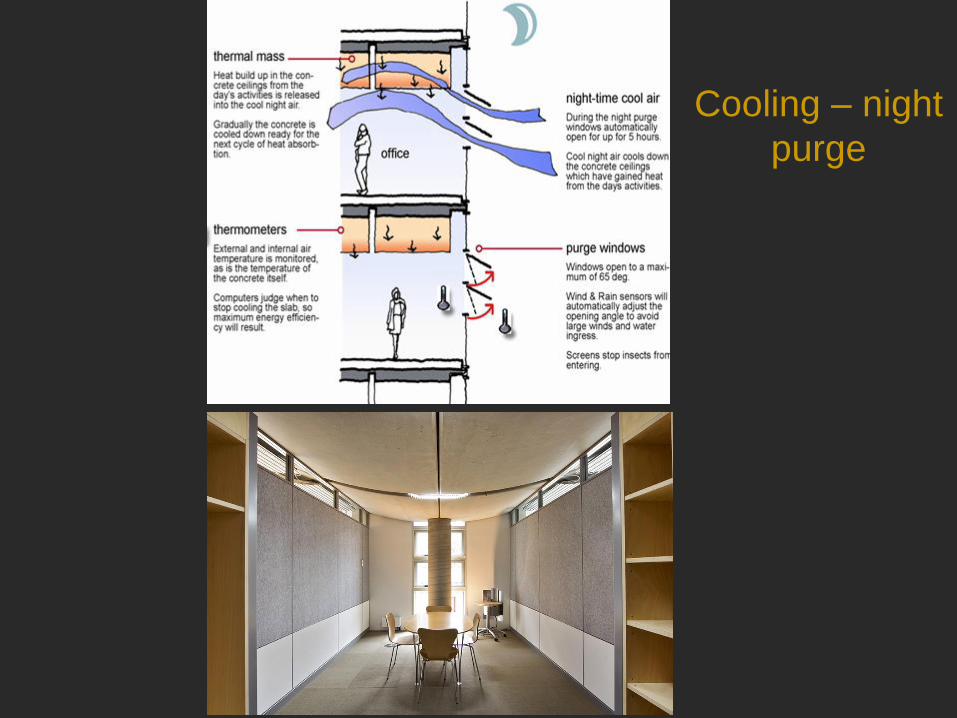
Cooling – night
purge
Looking back to go forward
‘Our current approach to city design is increasingly
financially, socially and environmentally
unsustainable.

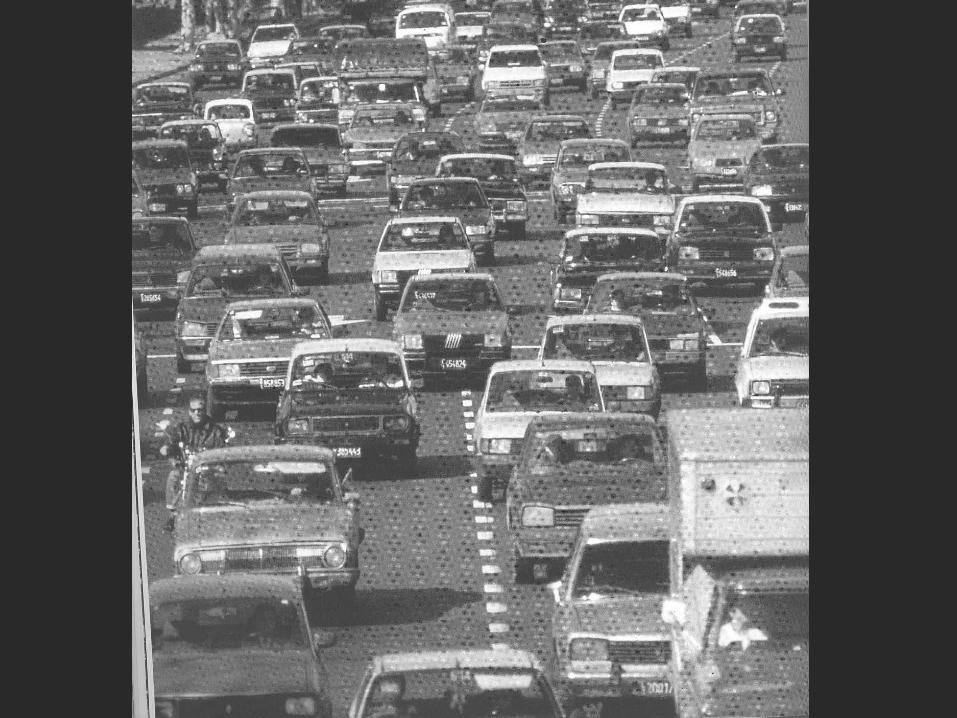
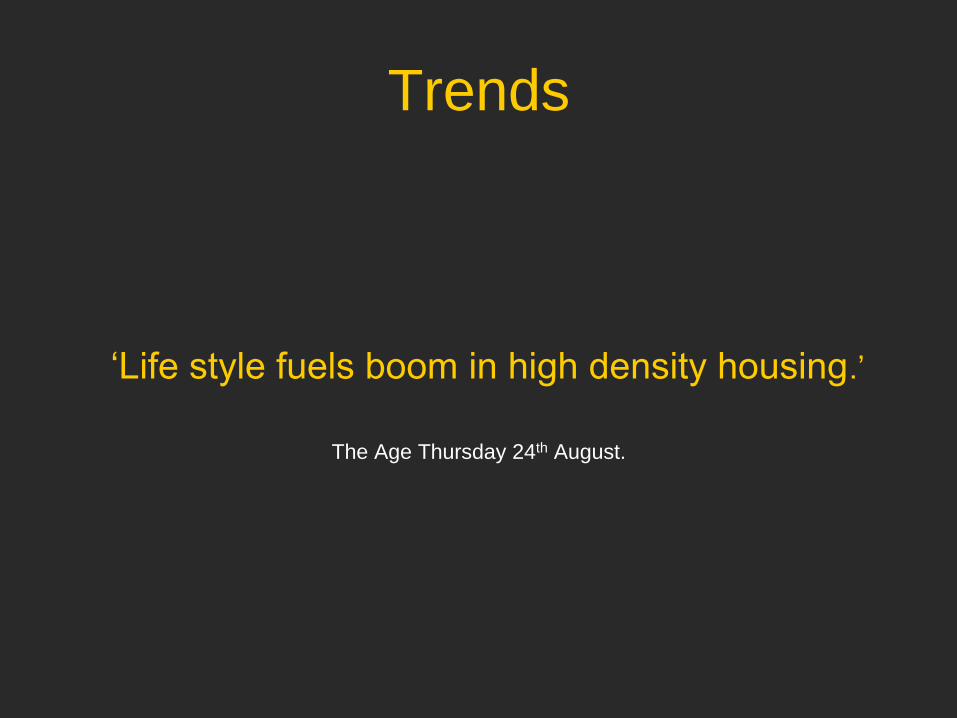
Trends
‘Life style fuels boom in high density housing.’
The Age Thursday 24th August.
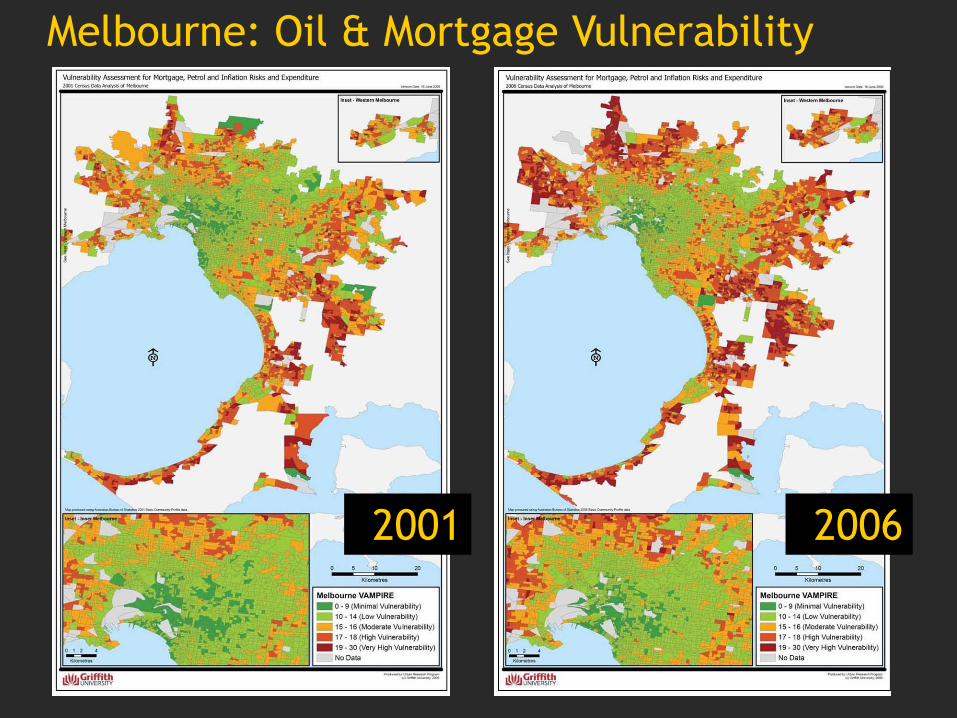
Melbourne: Oil & Mortgage Vulnerability
2001 2006
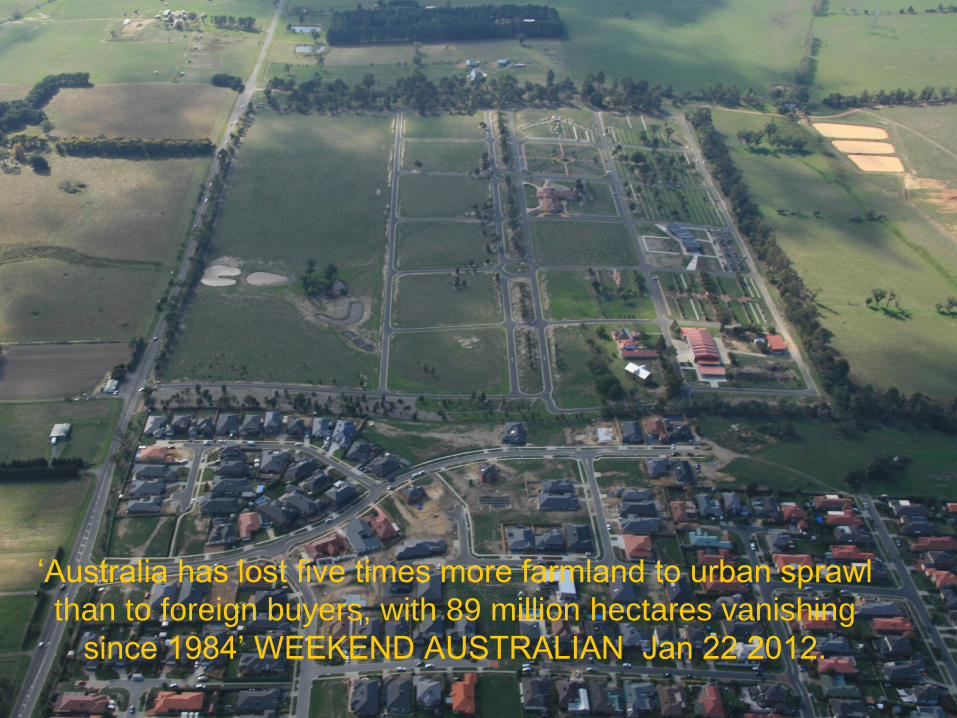
‘Australia has lost five times more farmland to urban sprawl
than to foreign buyers, with 89 million hectares vanishing
since 1984’ WEEKEND AUSTRALIAN Jan 22 2012.
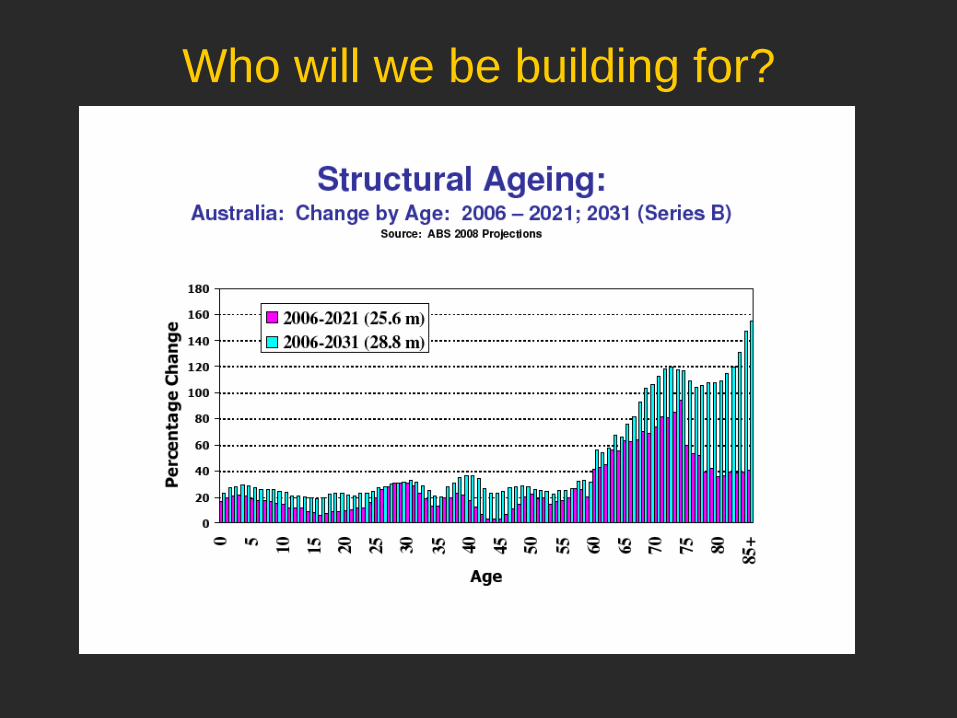
Who will we be building for?
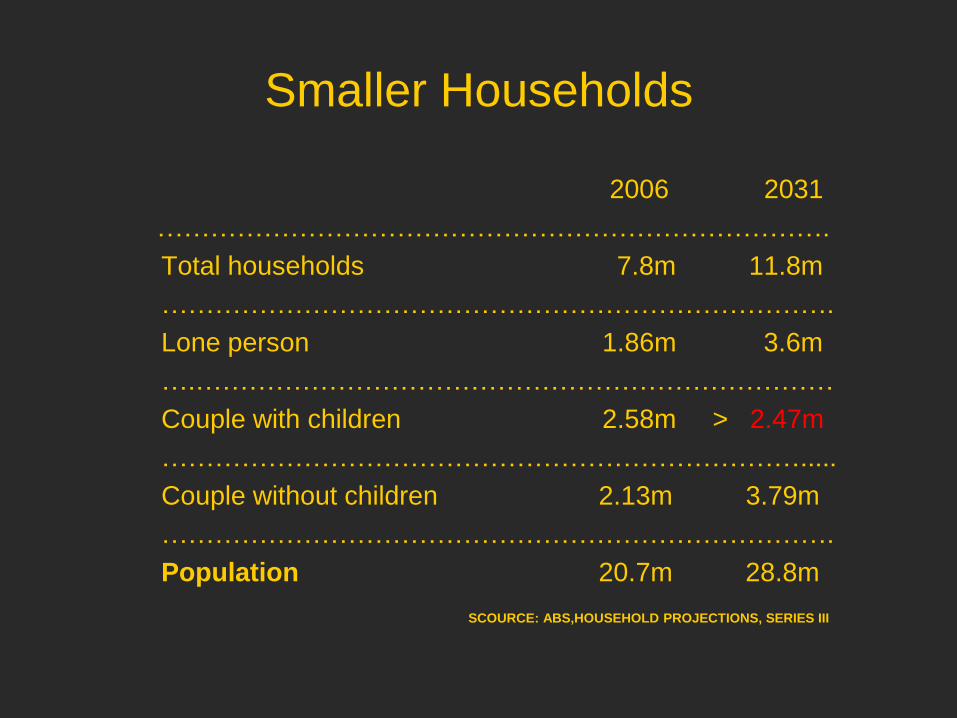
Smaller Households
2006 2031
………………………………………………………………….
Total households 7.8m 11.8m
………………………………………………………………….
Lone person 1.86m 3.6m
….………………………………………………………………
Couple with children 2.58m > 2.47m
……………………………………………………………….....
Couple without children 2.13m 3.79m
………………………………………………………………….
Population 20.7m 28.8m
SCOURCE: ABS,HOUSEHOLD PROJECTIONS, SERIES III
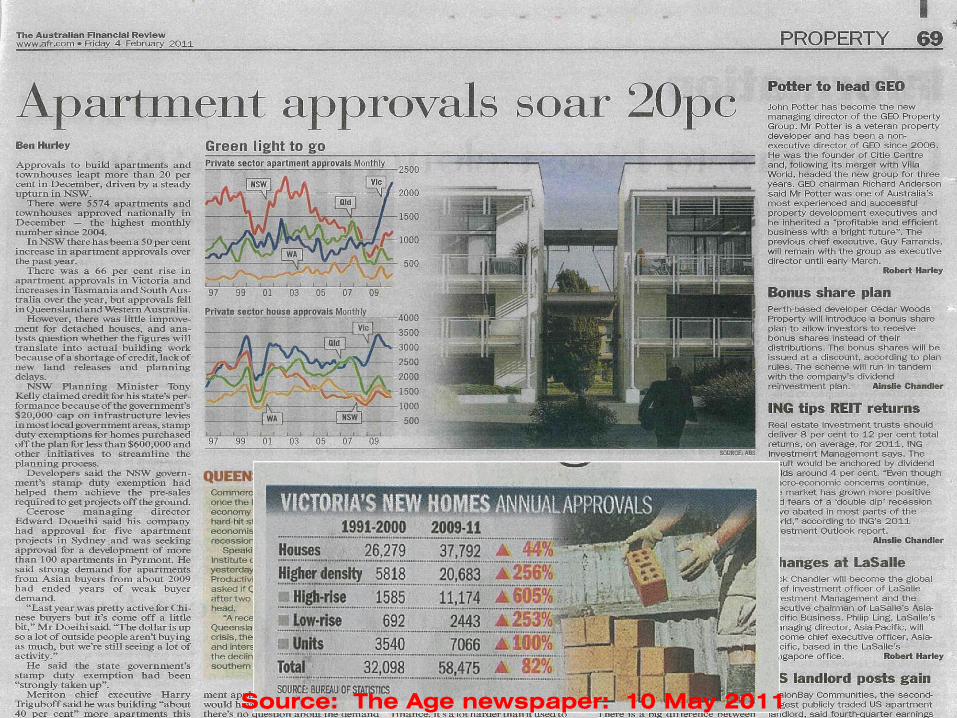
Source: The Age newspaper: 10 May 2011
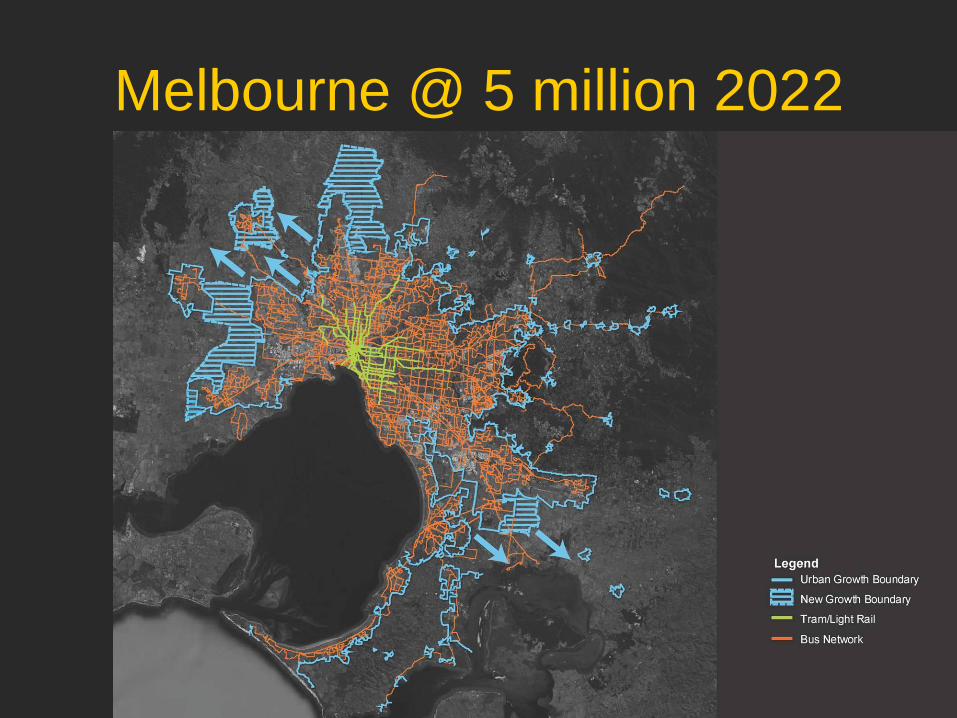
Melbourne @ 5 million 2022
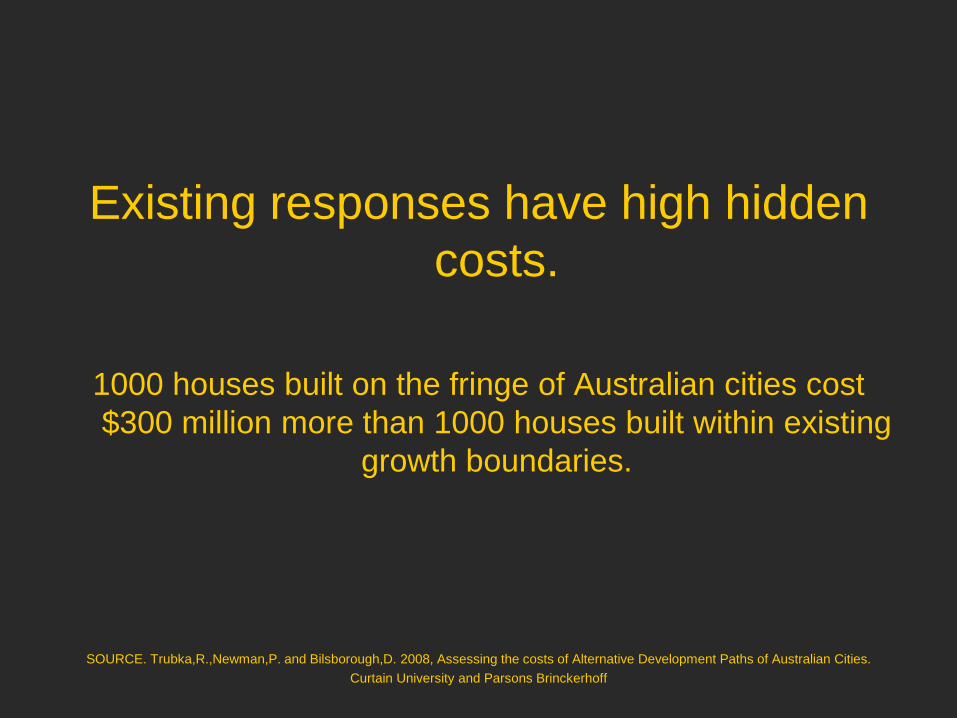
Existing responses have high hidden
costs.
1000 houses built on the fringe of Australian cities cost
$300 million more than 1000 houses built within existing
growth boundaries.
SOURCE. Trubka,R.,Newman,P. and Bilsborough,D. 2008, Assessing the costs of Alternative Development Paths of Australian Cities.
Curtain University and Parsons Brinckerhoff
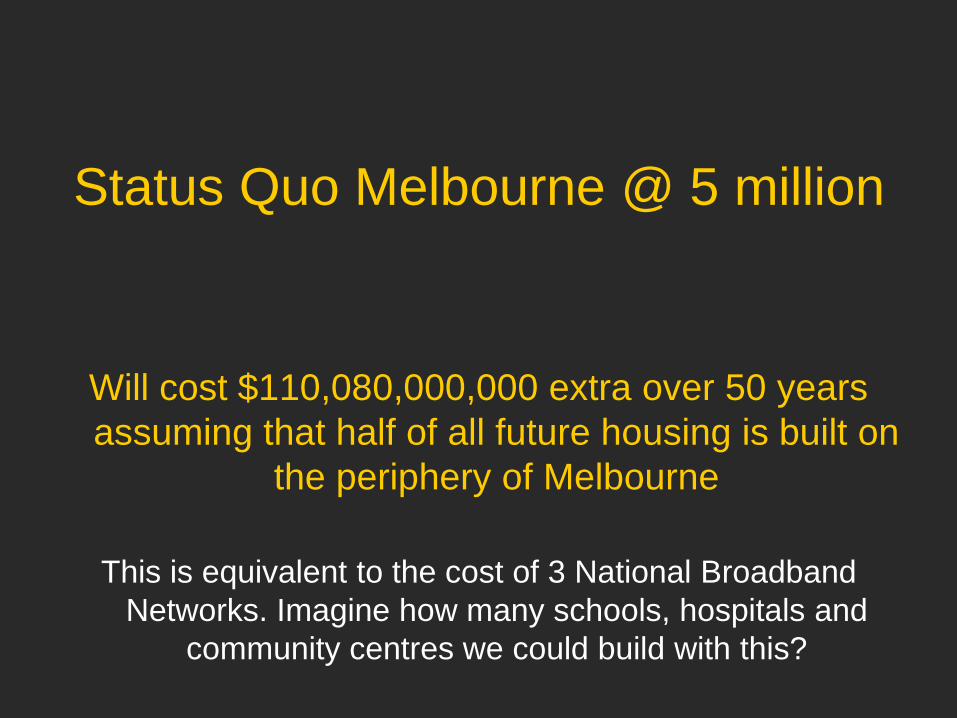
Status Quo Melbourne @ 5 million
Will cost $110,080,000,000 extra over 50 years
assuming that half of all future housing is built on
the periphery of Melbourne
This is equivalent to the cost of 3 National Broadband
Networks. Imagine how many schools, hospitals and
community centres we could build with this?
0.0%
0.5%
1.0%
1.5%
2.0%
2.5%
3.0%
3.5%
4.0%
4.5%
5.0%
5.5%
6.0%
6.5%
7.0%
7.5%
8.0%
F1
96
0
F1
96
2
F1
96
4
F1
96
6
F1
96
8
F1
97
0
F1
97
2
F1
97
4
F1
97
6
F1
97
8
F1
98
0
F1
98
2
F1
98
4
F1
98
6
F1
98
8
F1
99
0
F1
99
2
F1
99
4
F1
99
6
F1
99
8
F2
00
0
F2
00
2
F2
00
4
F2
00
6
F2
00
8
F2
01
0
F2
01
2
F2
01
4
F2
01
6
F2
01
8
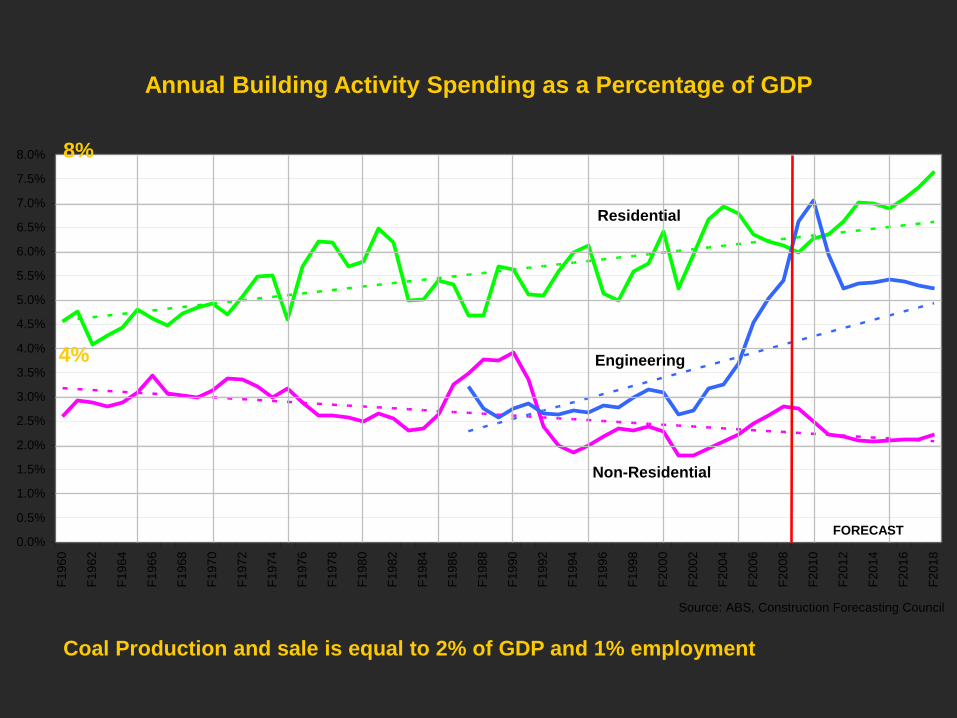
Source: ABS, Construction Forecasting Council
FORECAST
Residential
Engineering
Non-Residential
Annual Building Activity Spending as a Percentage of GDP
8%
4%
Coal Production and sale is equal to 2% of GDP and 1% employment
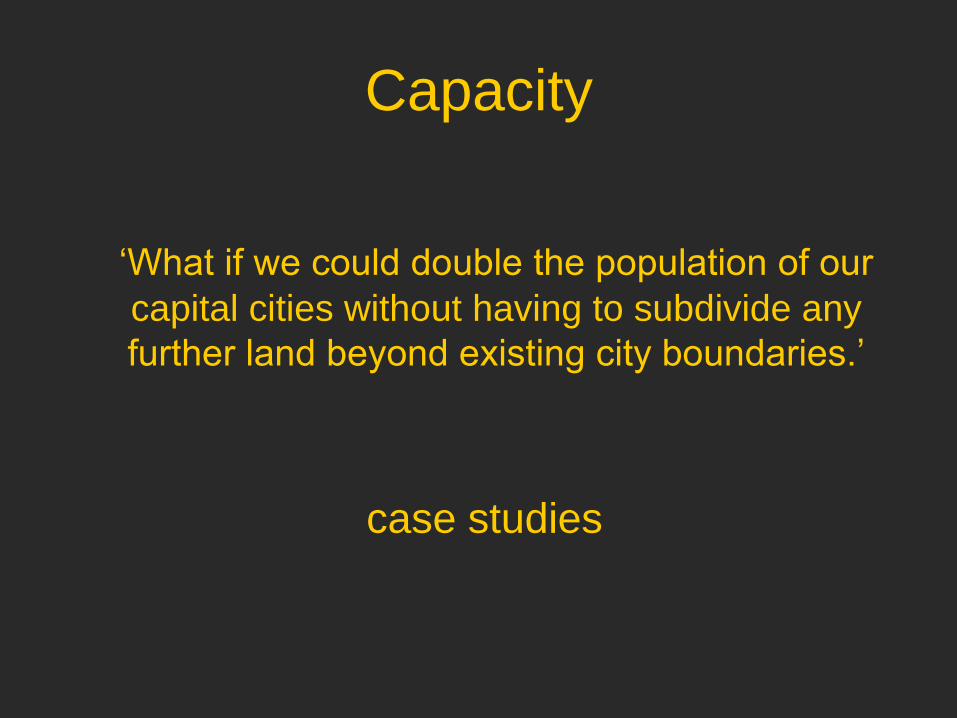
Capacity
‘What if we could double the population of our
capital cities without having to subdivide any
further land beyond existing city boundaries.’
case studies
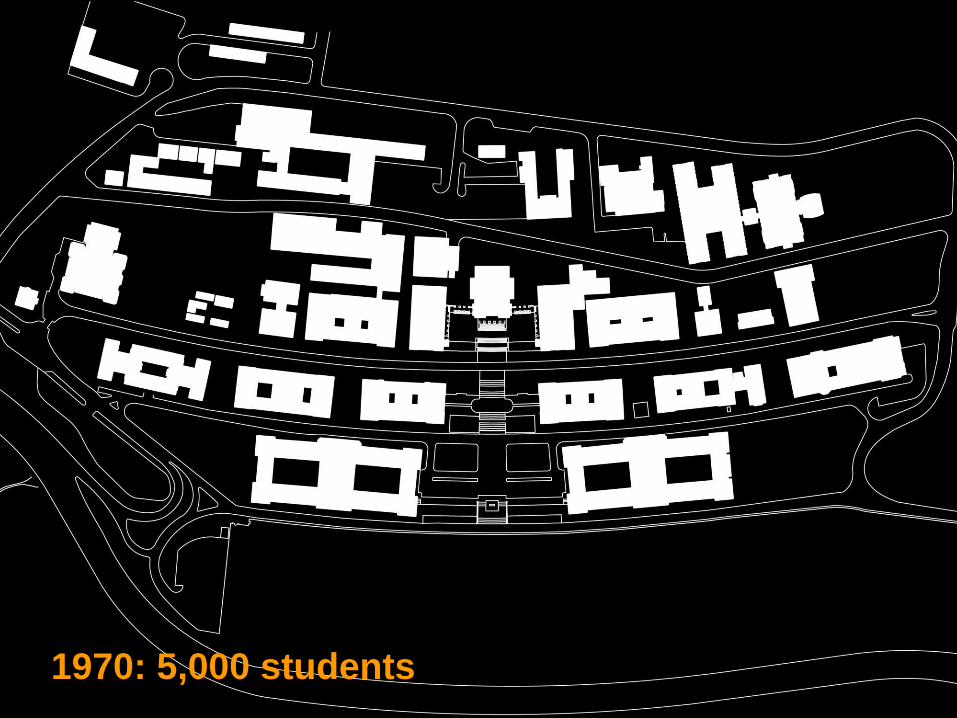
1970: 5,000 students
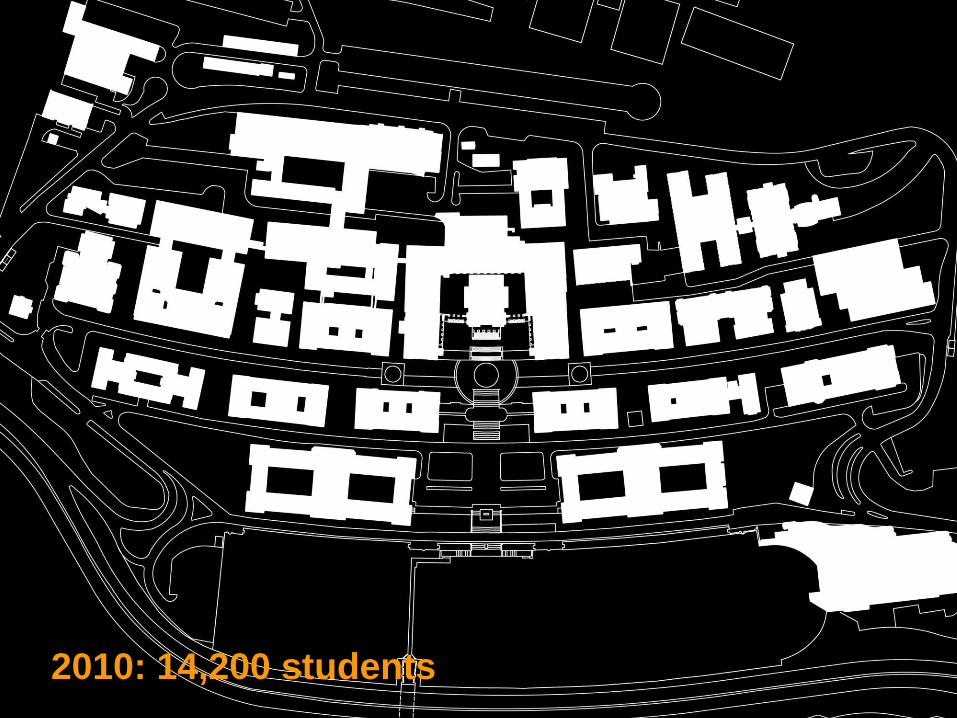
2010: 14,200 students
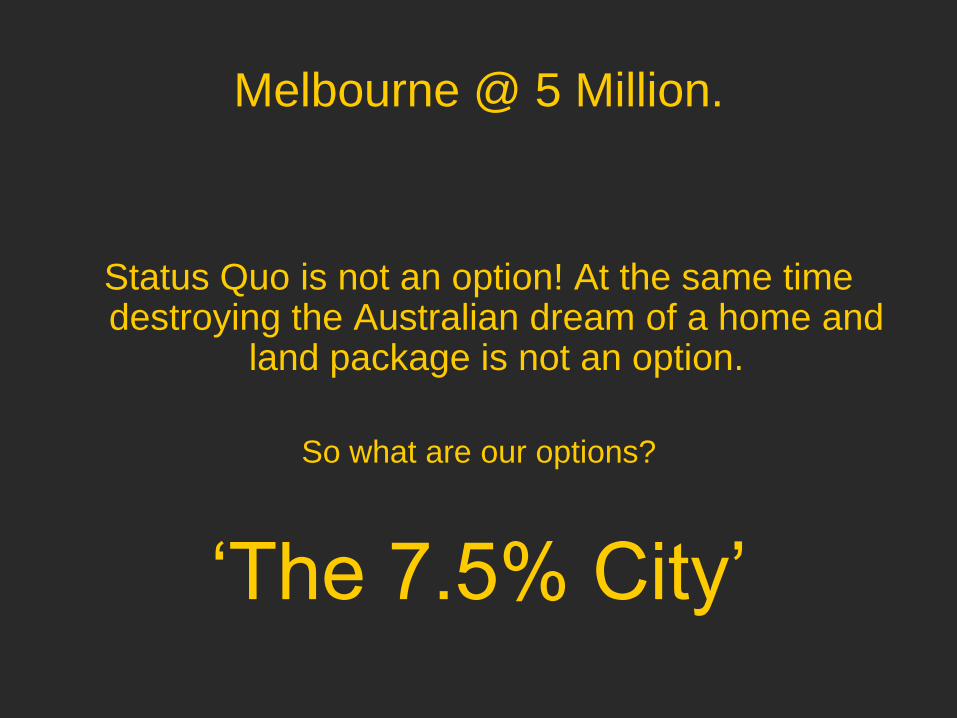
Melbourne @ 5 Million.
Status Quo is not an option! At the same time destroying the Australian dream of a home and
land package is not an option.
So what are our options?
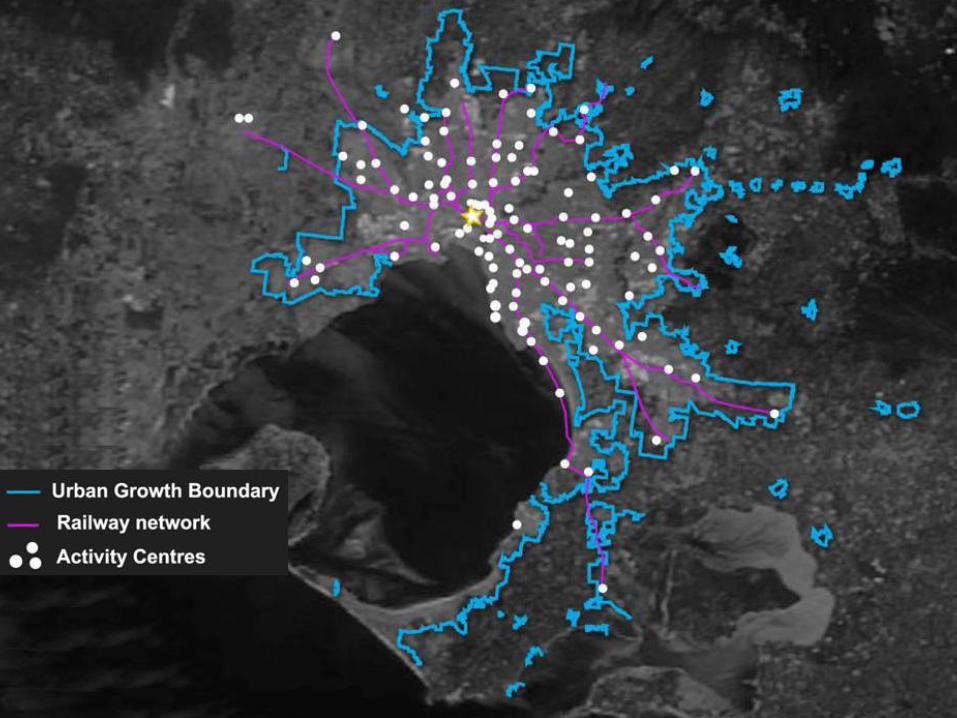
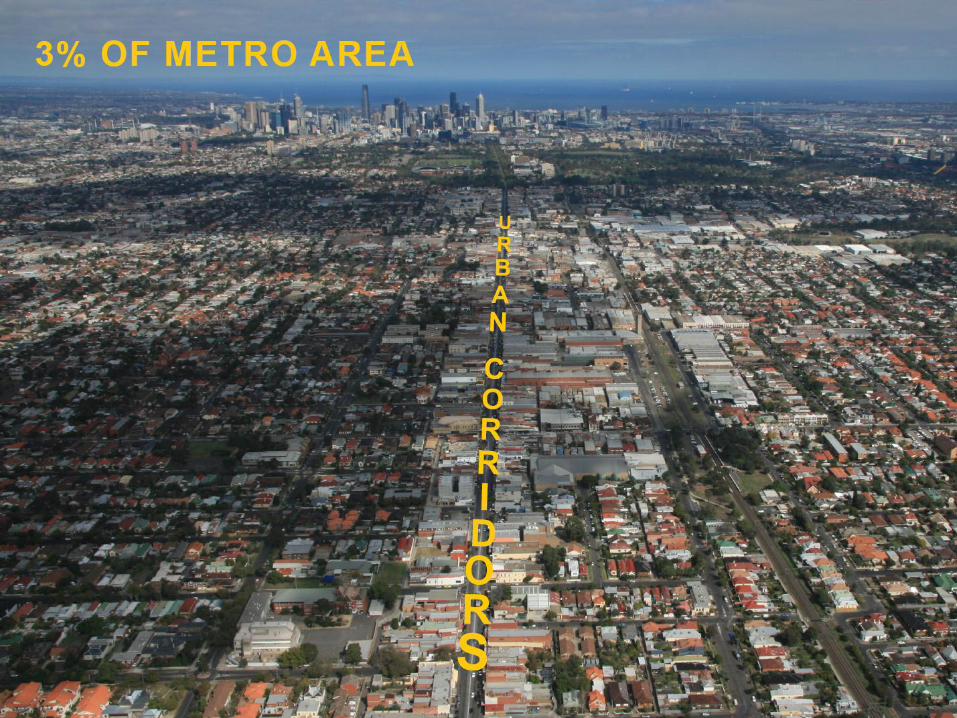
‘The 7.5% City’

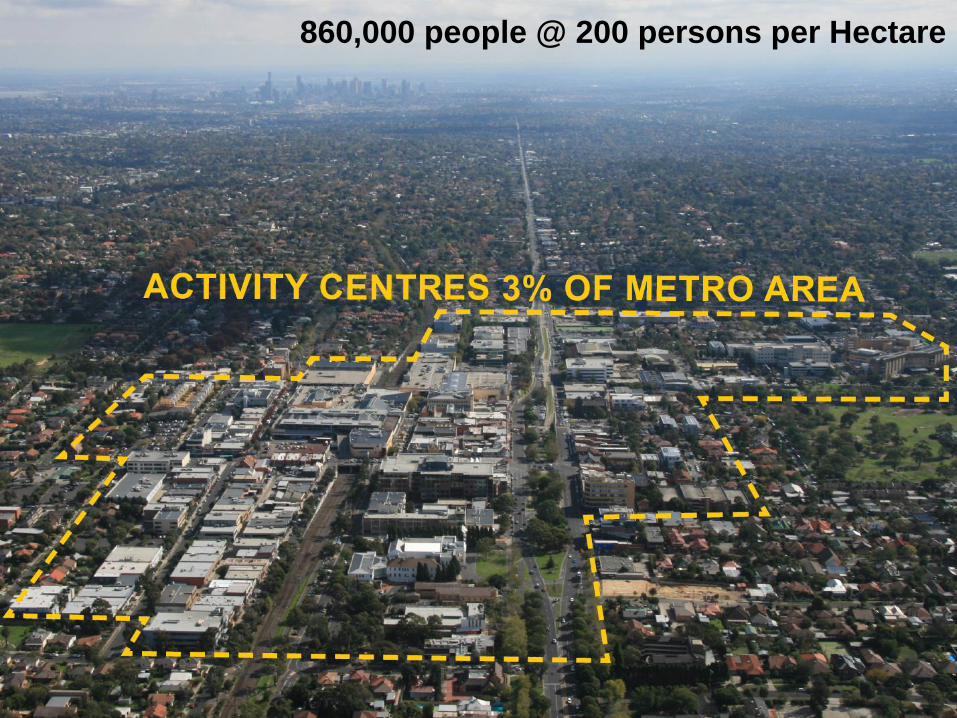
860,000 people @ 200 persons per Hectare
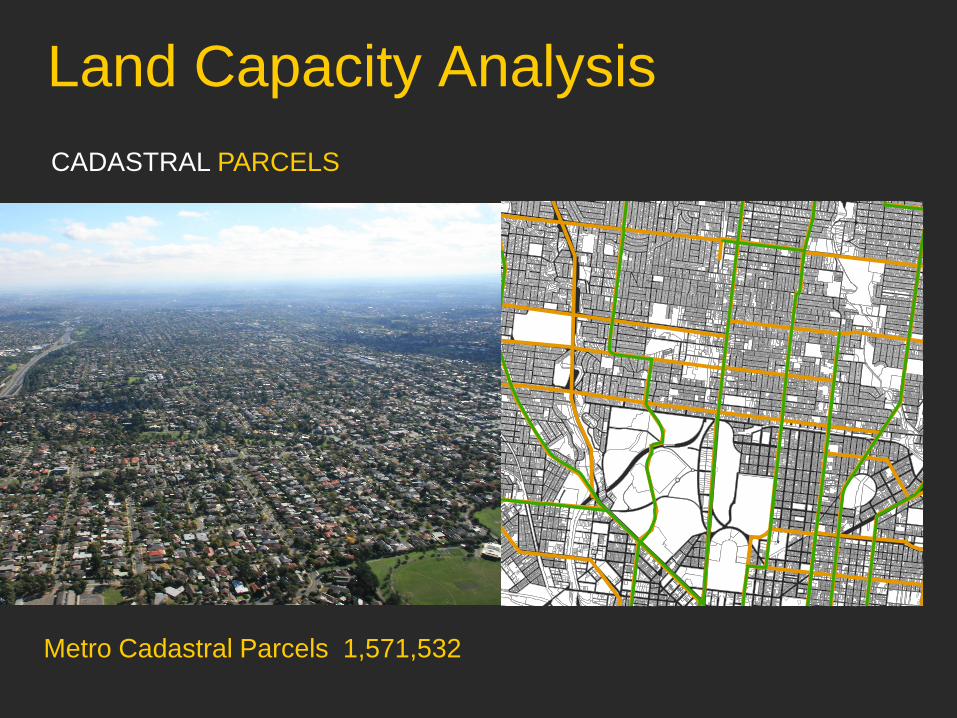
Land Capacity Analysis
Metro Cadastral Parcels 1,571,532
CADASTRAL PARCELS

Land Capacity Analysis
Less SPECIAL ZONES eg. CBD
Total = 121,608 sites
SELECT PARCELS
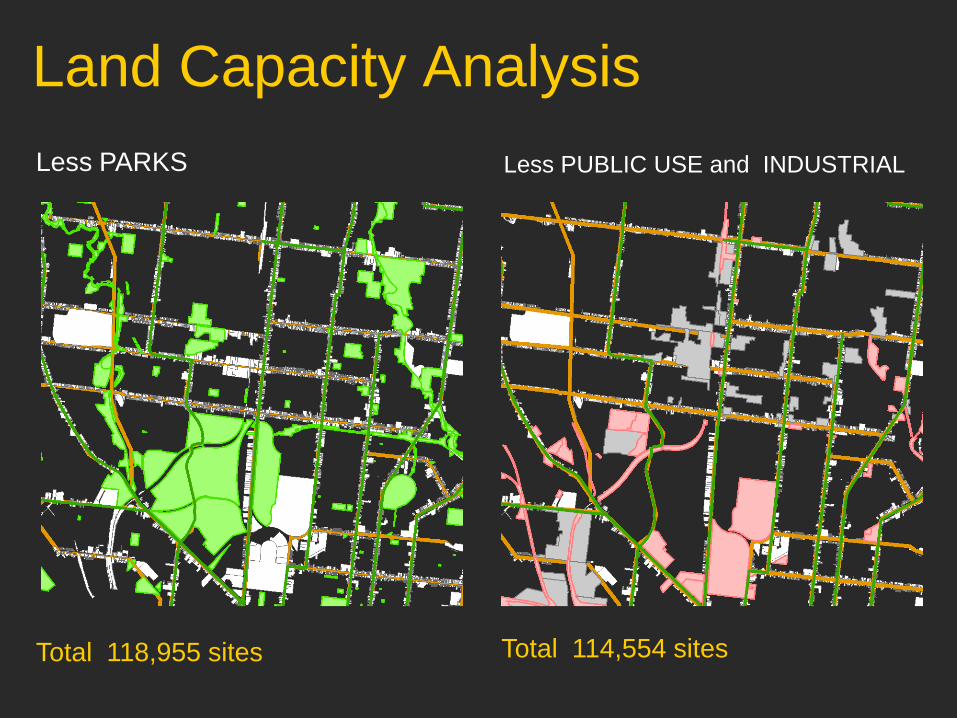
Land Capacity Analysis
Total 118,955 sites
Less PARKS Less PUBLIC USE and INDUSTRIAL
Total 114,554 sites
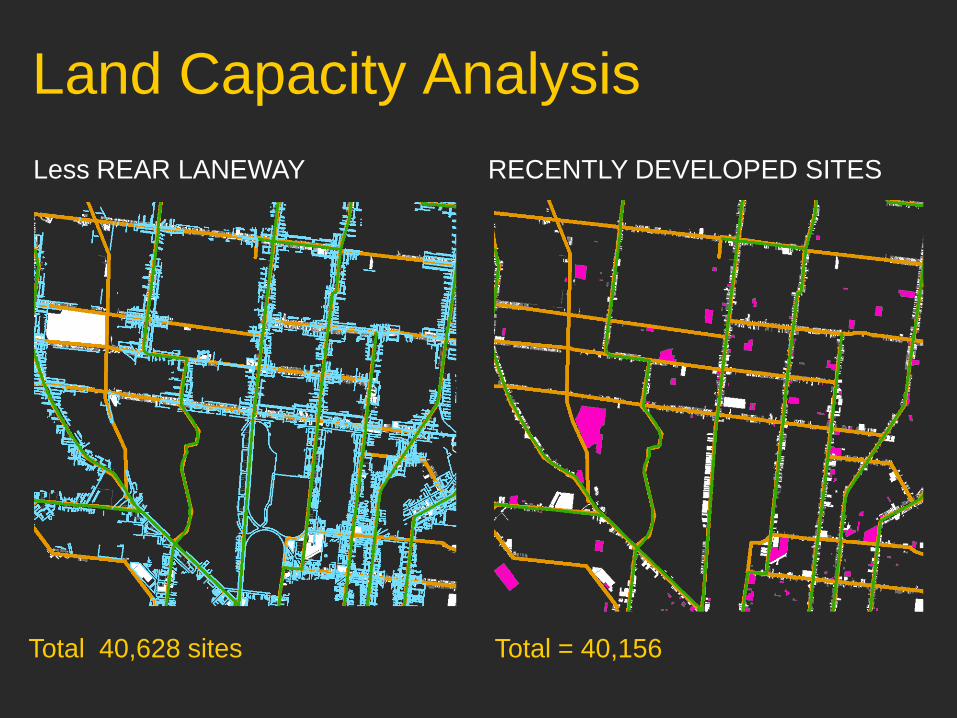
Land Capacity Analysis
Less REAR LANEWAY
Total 40,628 sites
RECENTLY DEVELOPED SITES
Total = 40,156
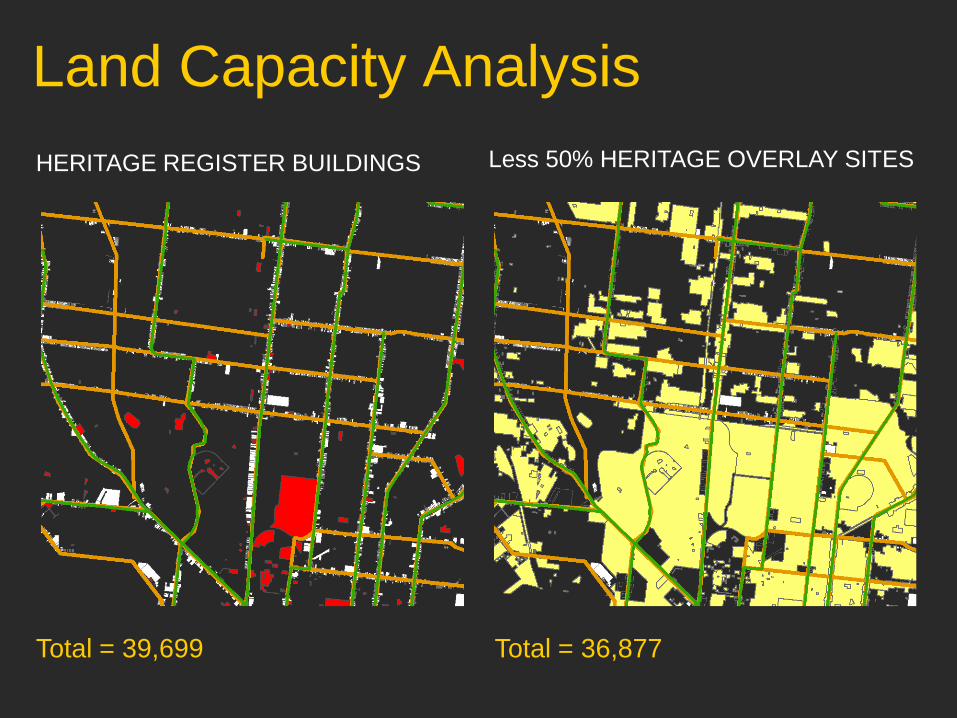
Land Capacity Analysis
HERITAGE REGISTER BUILDINGS Less 50% HERITAGE OVERLAY SITES
Total = 39,699 Total = 36,877
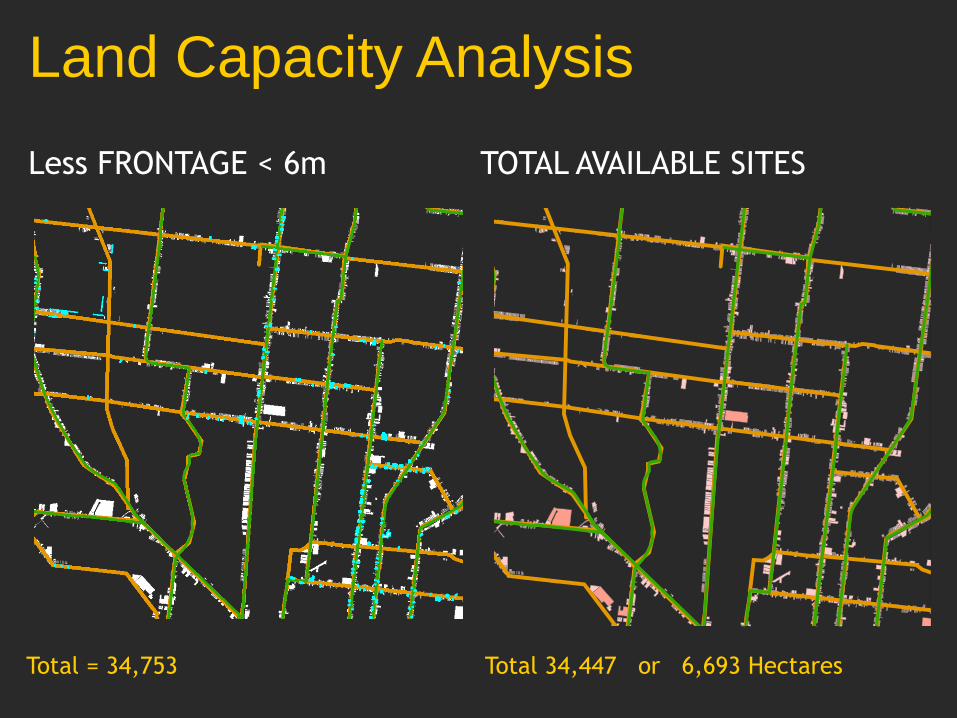
Less FRONTAGE < 6m TOTAL AVAILABLE SITES
Total = 34,753 Total 34,447 or 6,693 Hectares
Land Capacity Analysis
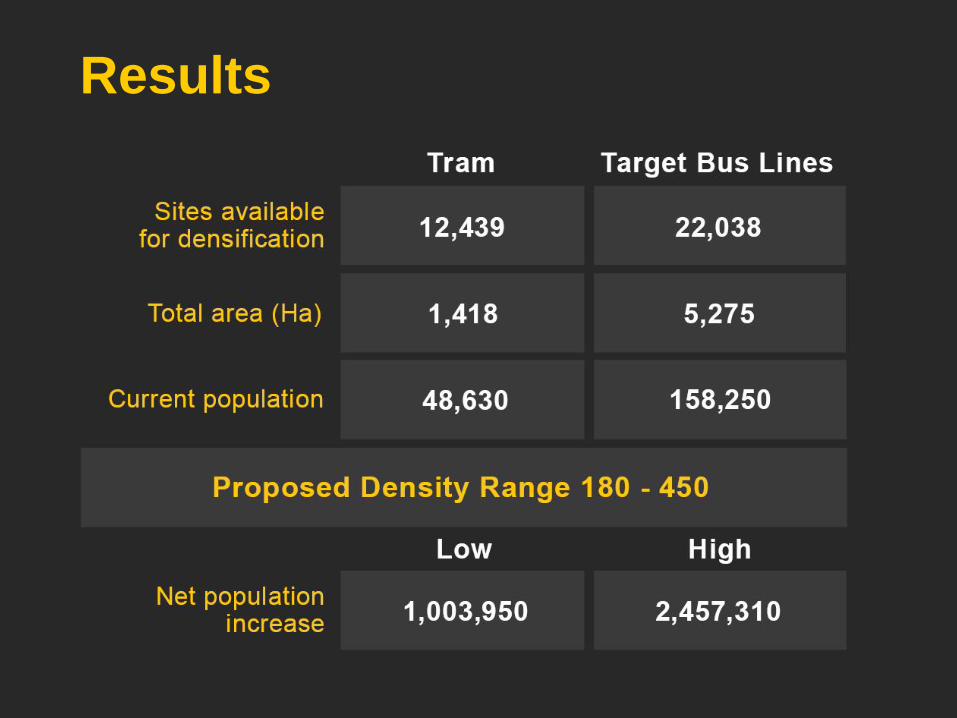
Results
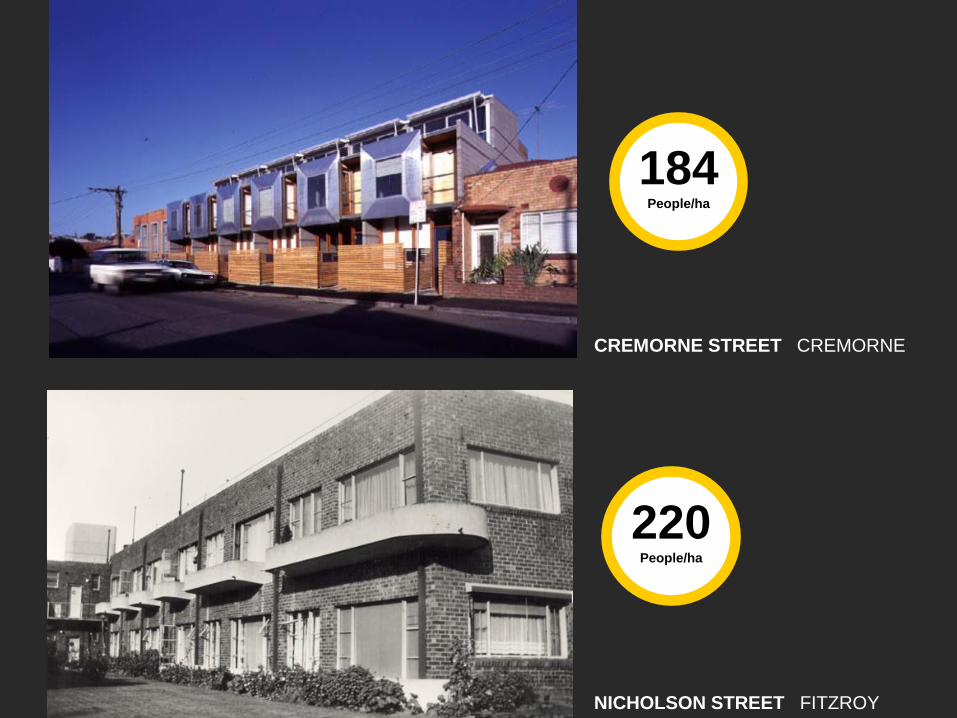
184 People/ha
220 People/ha
CREMORNE STREET CREMORNE
NICHOLSON STREET FITZROY
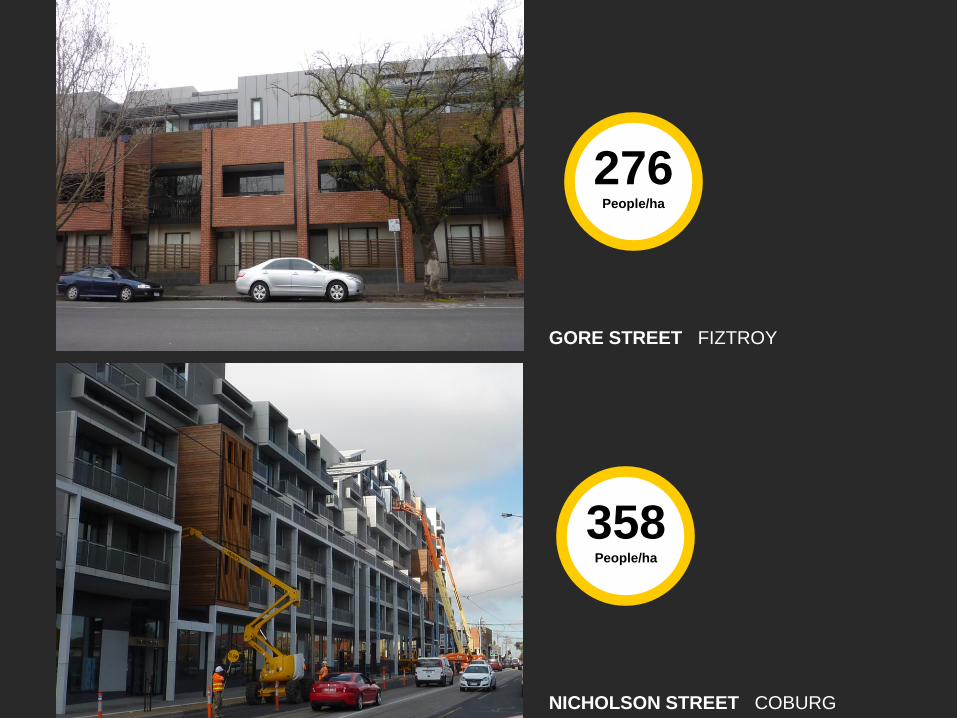
276 People/ha
358 People/ha
GORE STREET FIZTROY
NICHOLSON STREET COBURG
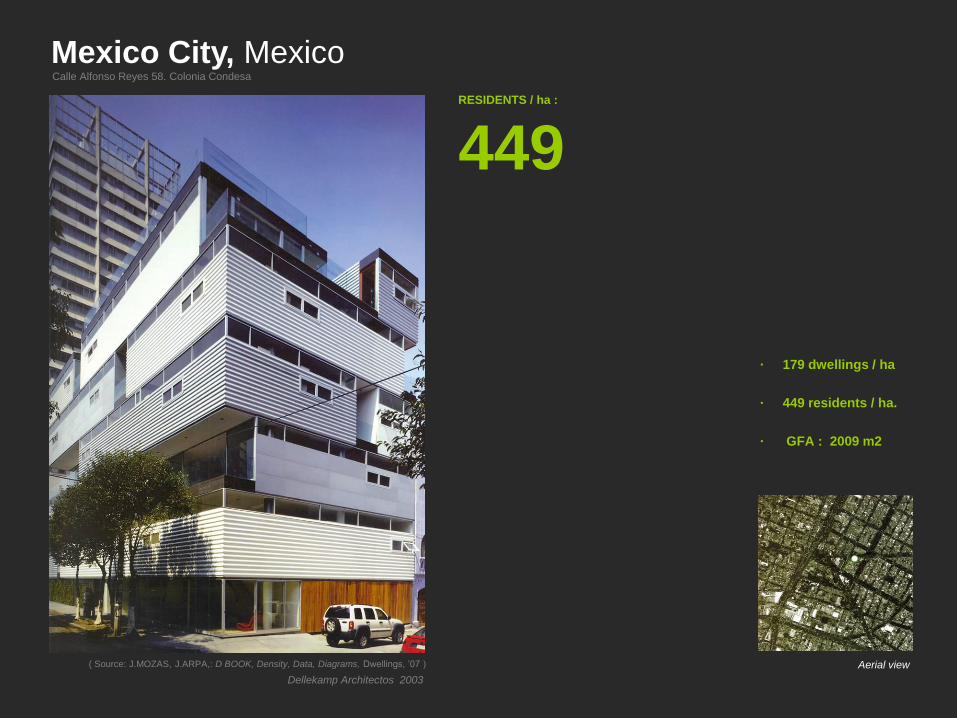
· 179 dwellings / ha
· 449 residents / ha.
· GFA : 2009 m2
Mexico City, Mexico
Dellekamp Architectos 2003
Aerial view
449 RESIDENTS / ha :
( Source: J.MOZAS, J.ARPA,: D BOOK, Density, Data, Diagrams, Dwellings, ’07 )
Calle Alfonso Reyes 58. Colonia Condesa
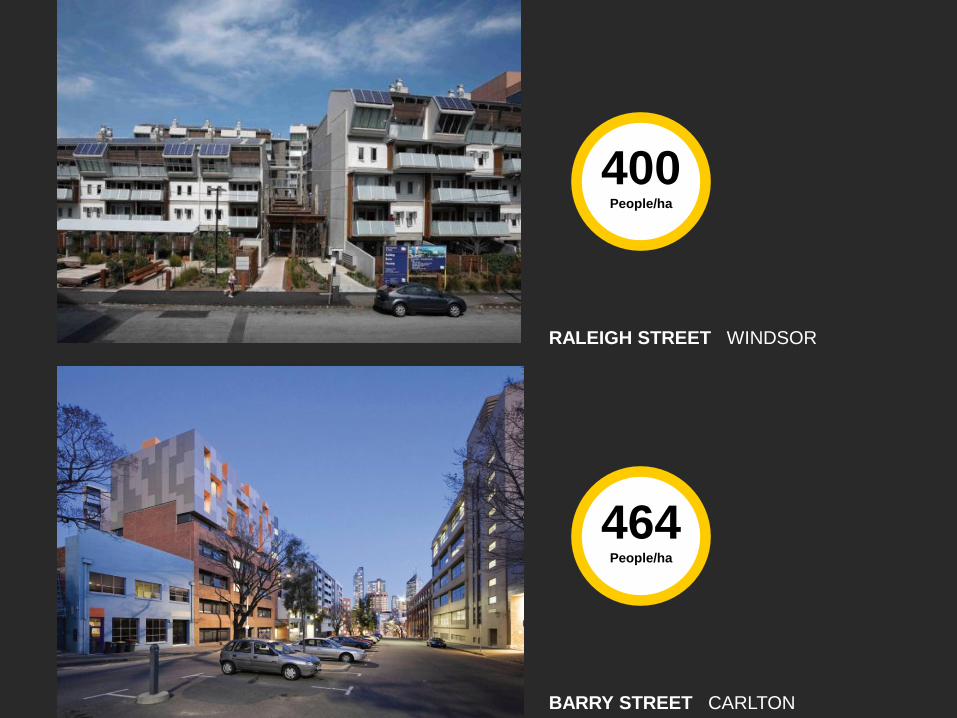
464 People/ha
400 People/ha
RALEIGH STREET WINDSOR
BARRY STREET CARLTON
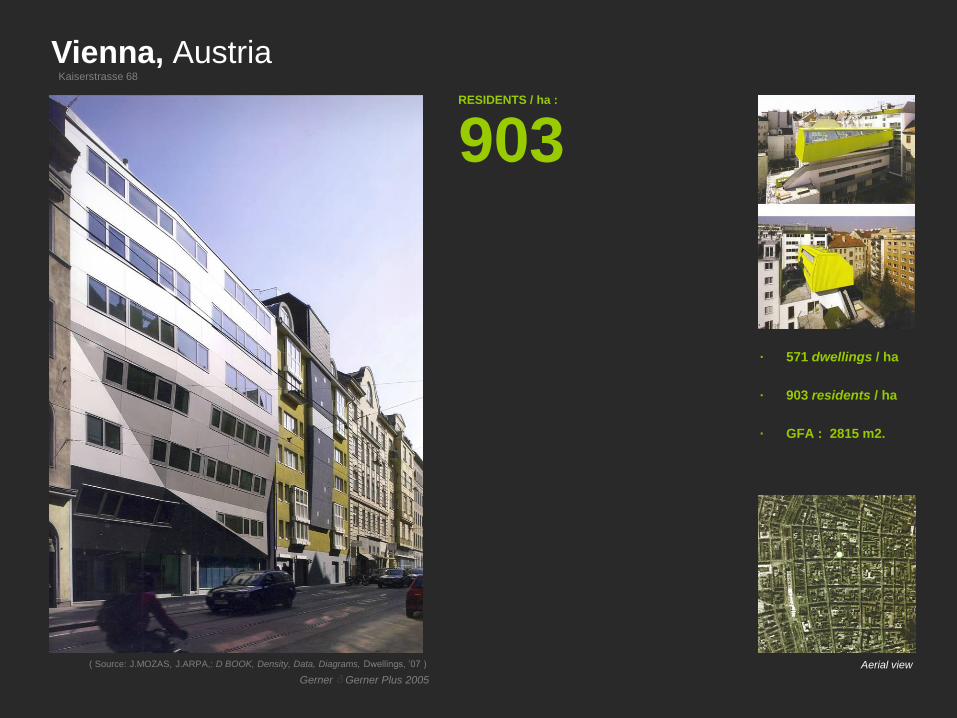
· 571 dwellings / ha
· 903 residents / ha
· GFA : 2815 m2.
Vienna, Austria
Gerner ۫ Gerner Plus 2005
Aerial view
903 RESIDENTS / ha :
( Source: J.MOZAS, J.ARPA,: D BOOK, Density, Data, Diagrams, Dwellings, ’07 )
Kaiserstrasse 68
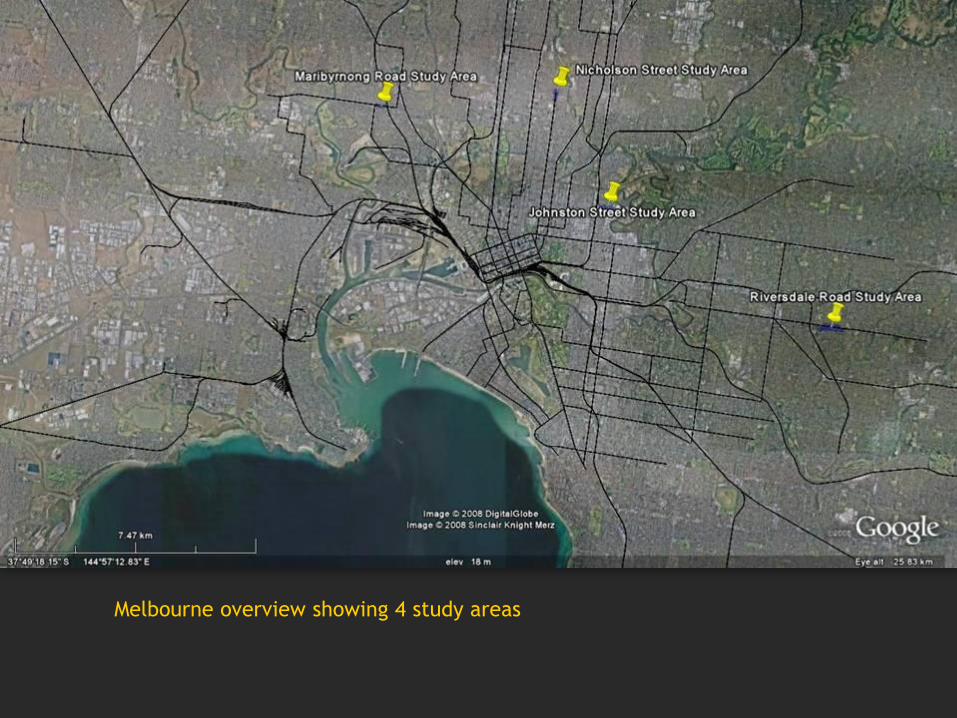
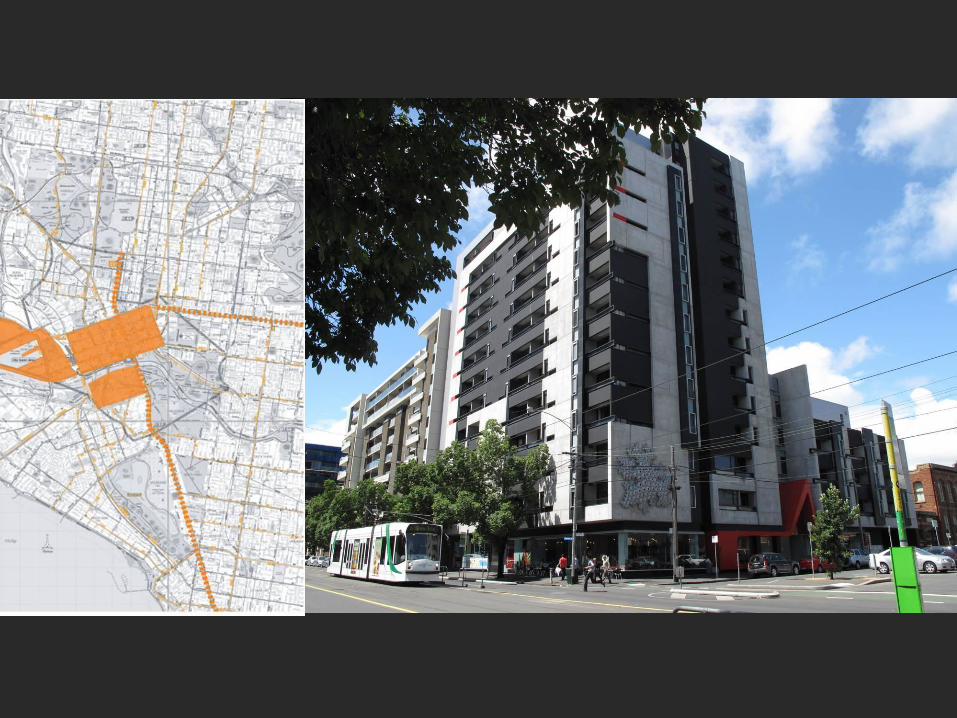
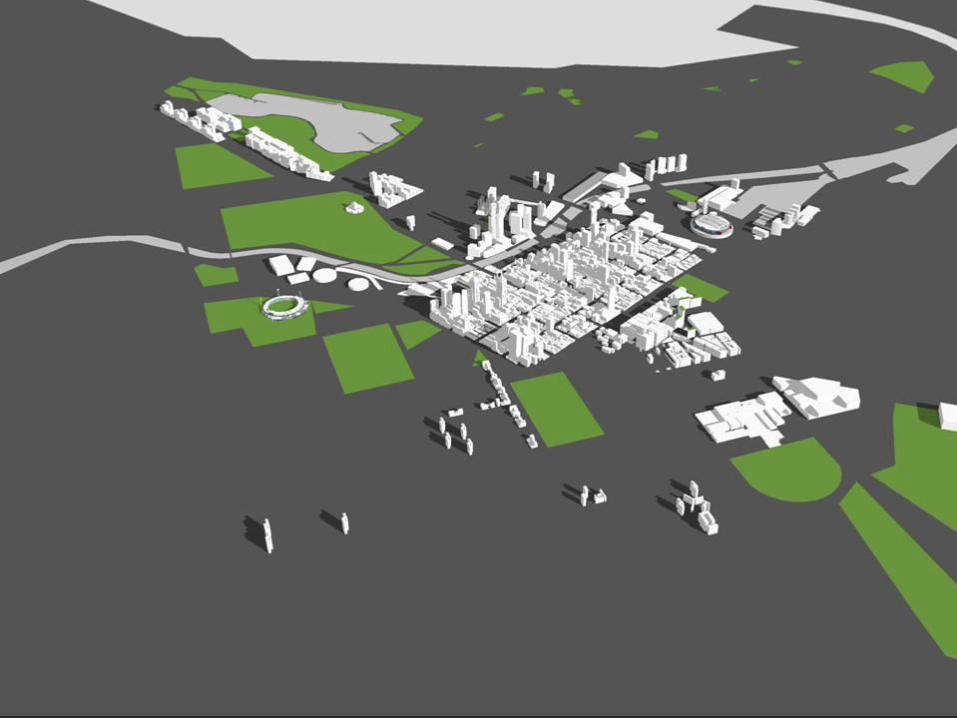
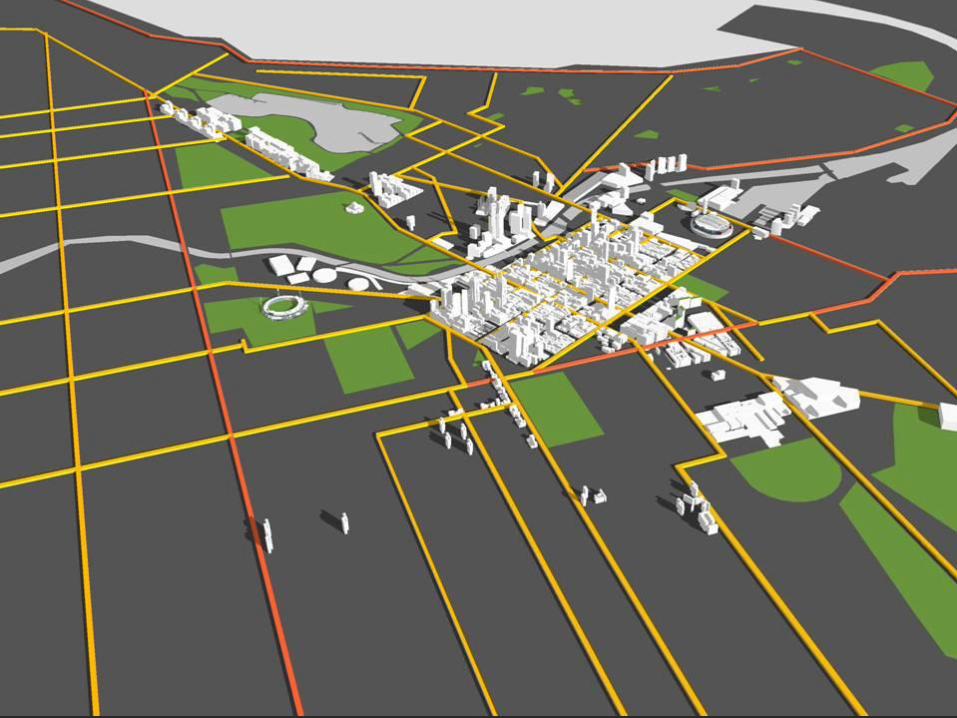
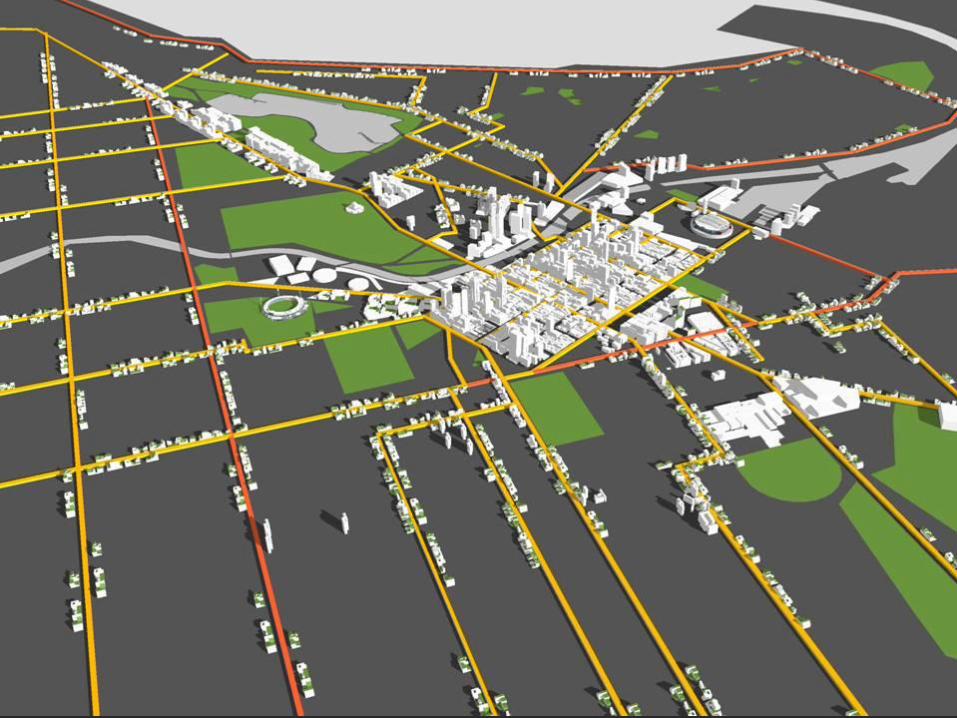
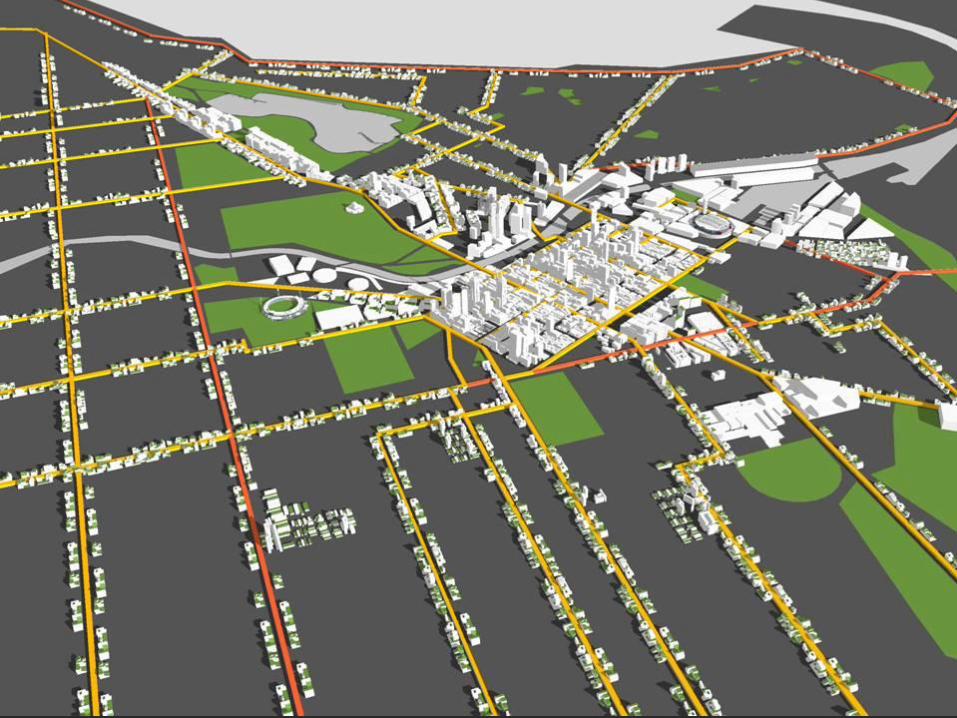
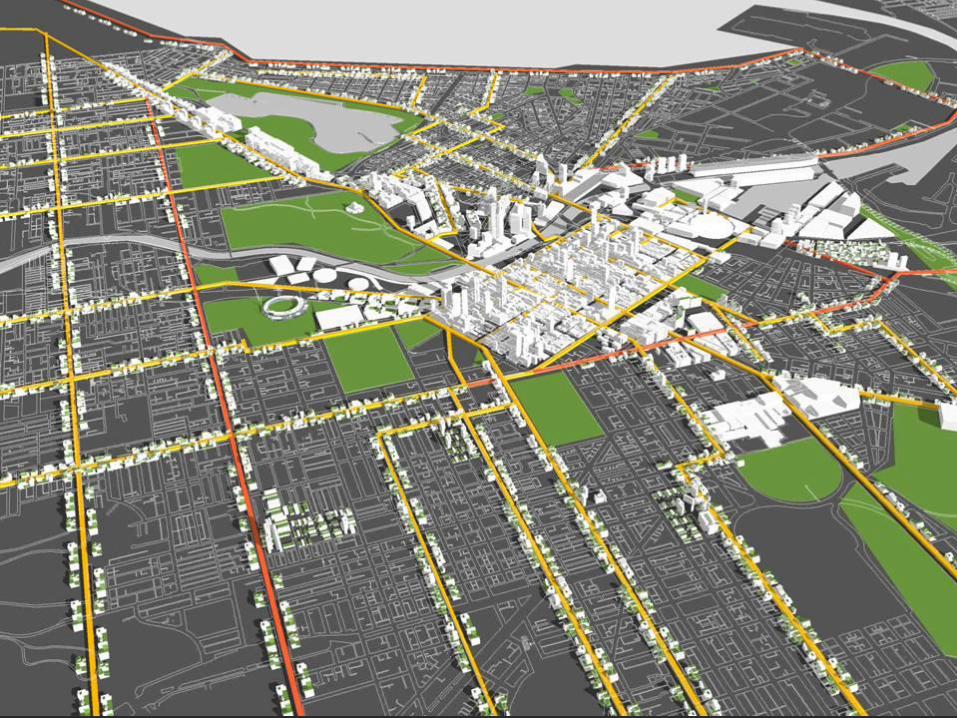
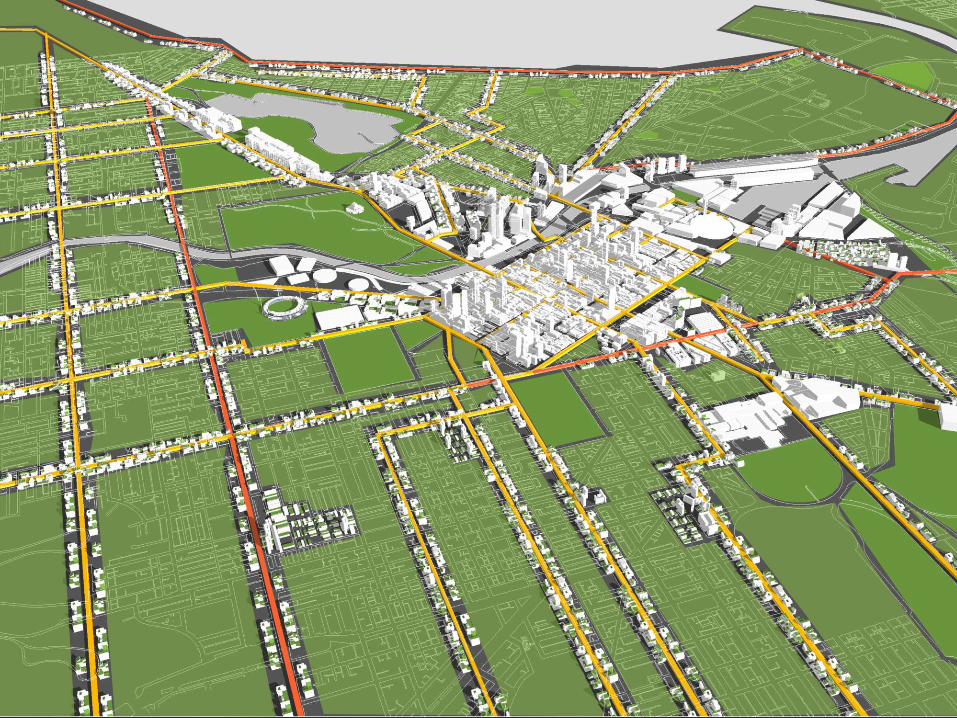
Melbourne overview showing 4 study areas
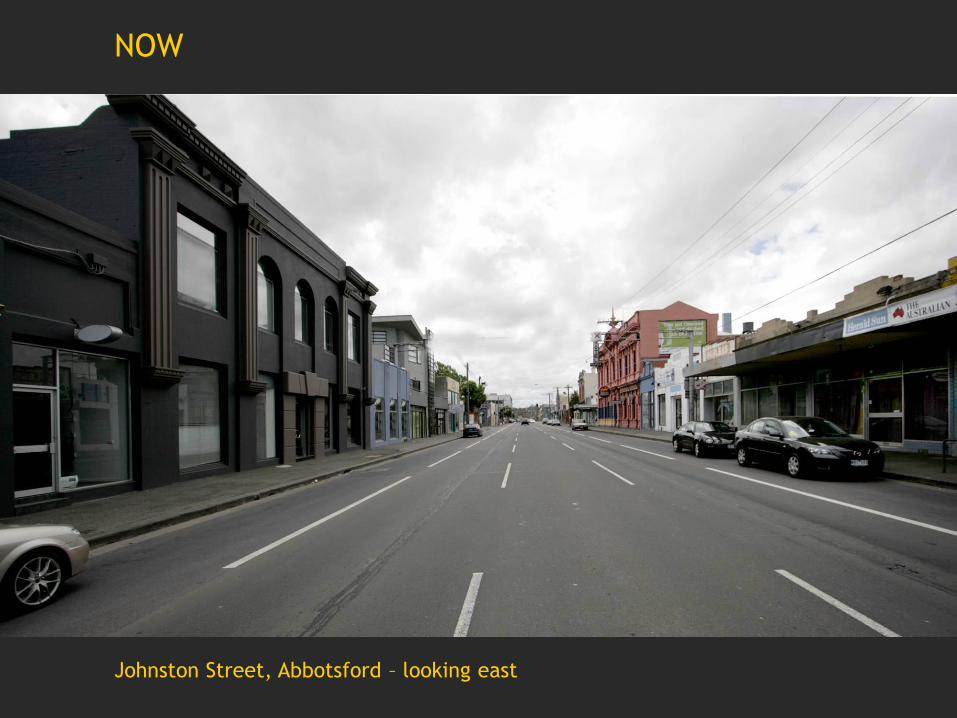
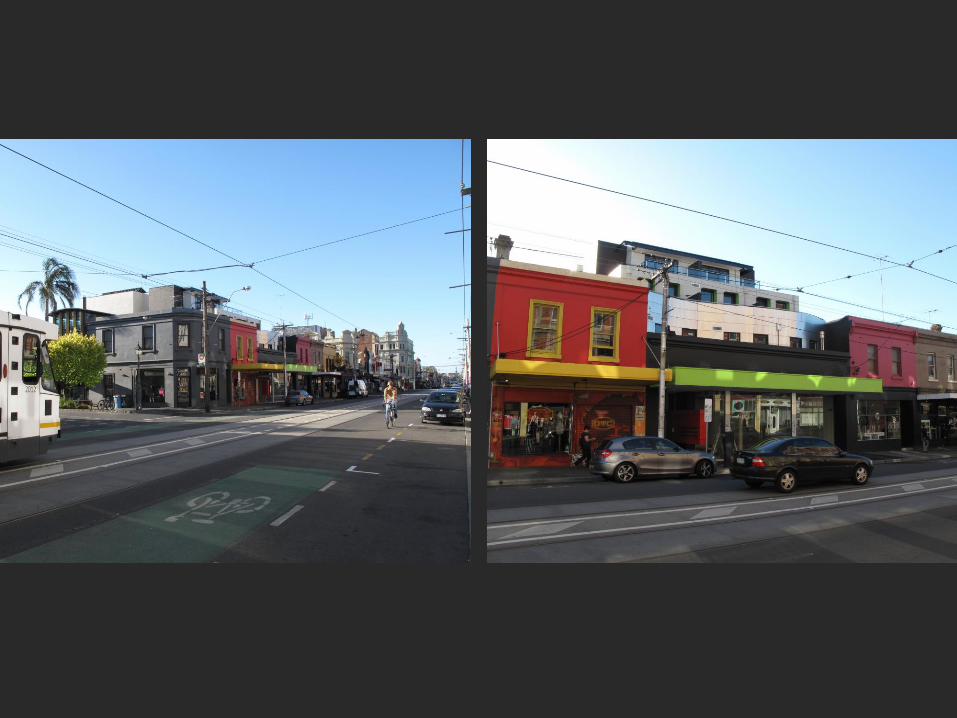
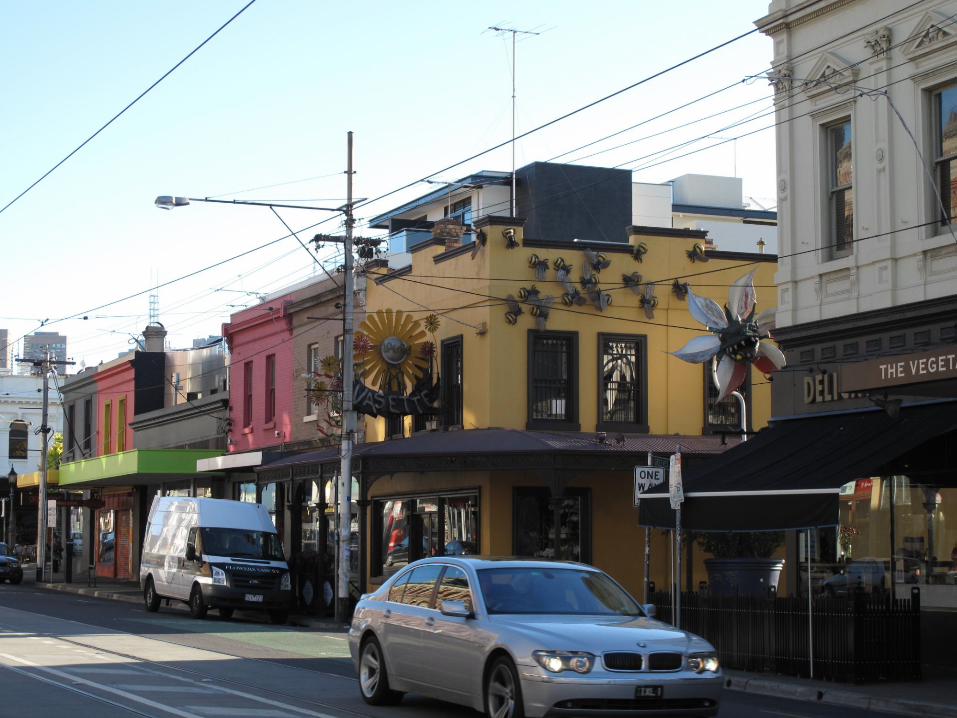
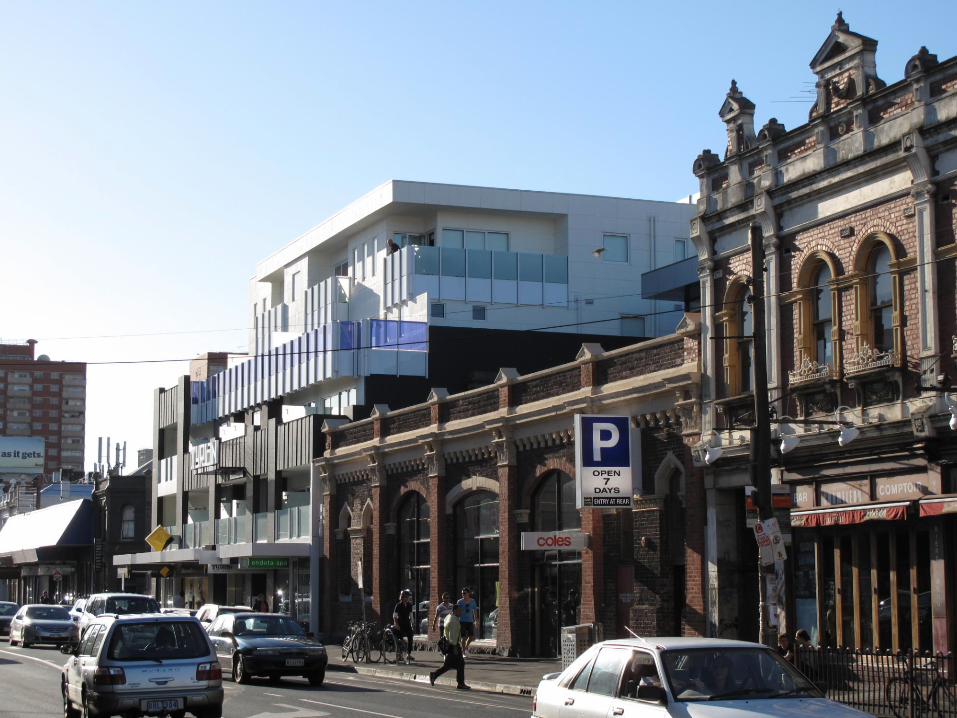
NOW
Johnston Street, Abbotsford – looking east

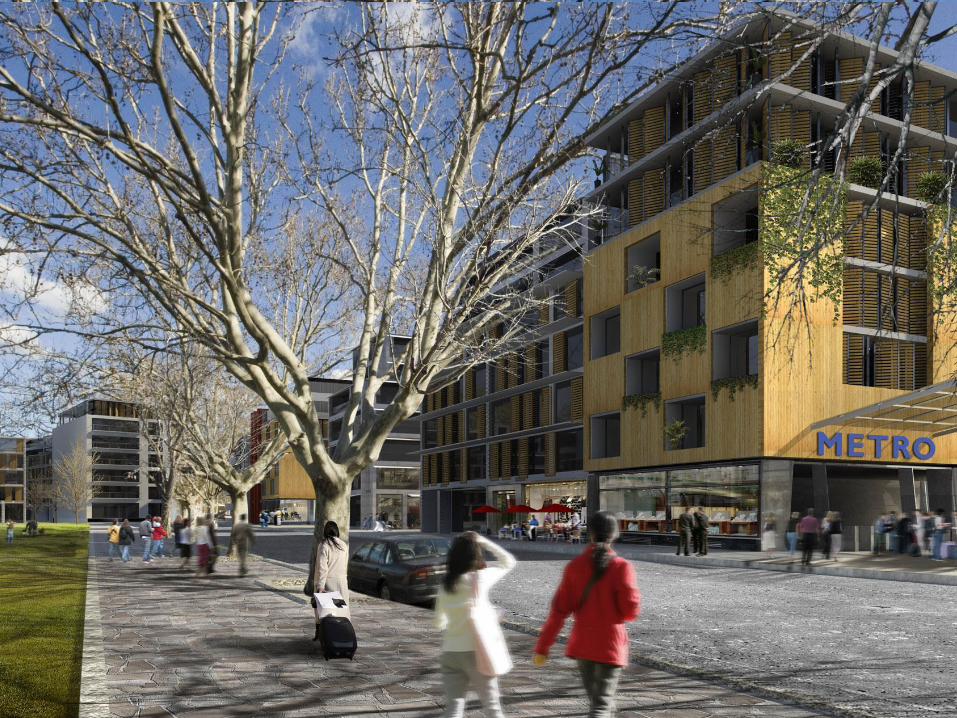
POSSIBLE FUTURE
Johnston Street, Abbotsford – artists impression
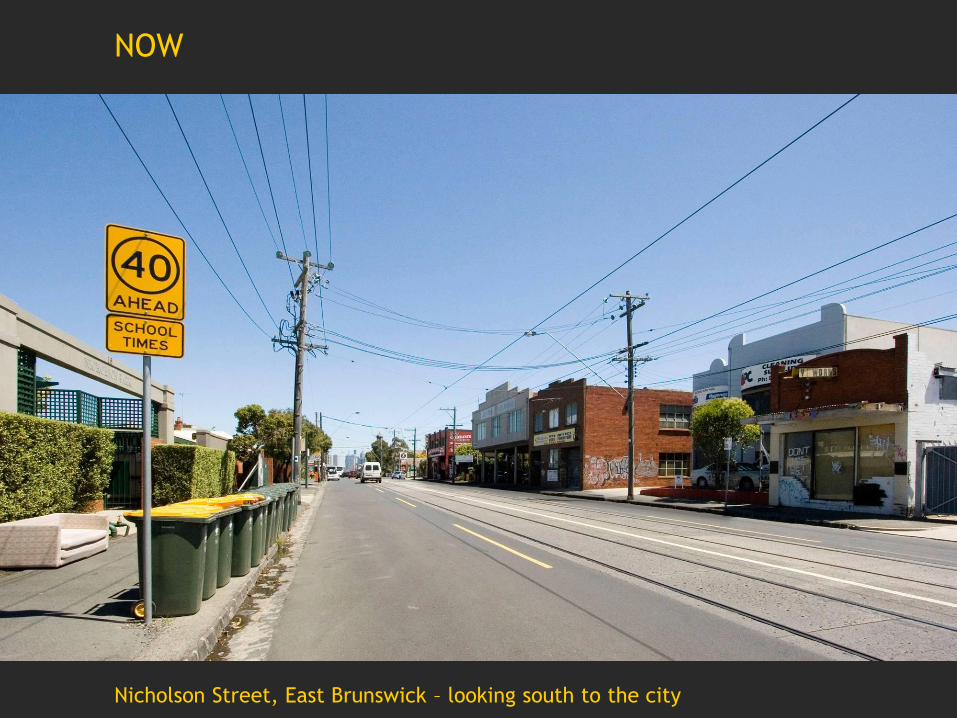
NOW
Nicholson Street, East Brunswick – looking south to the city
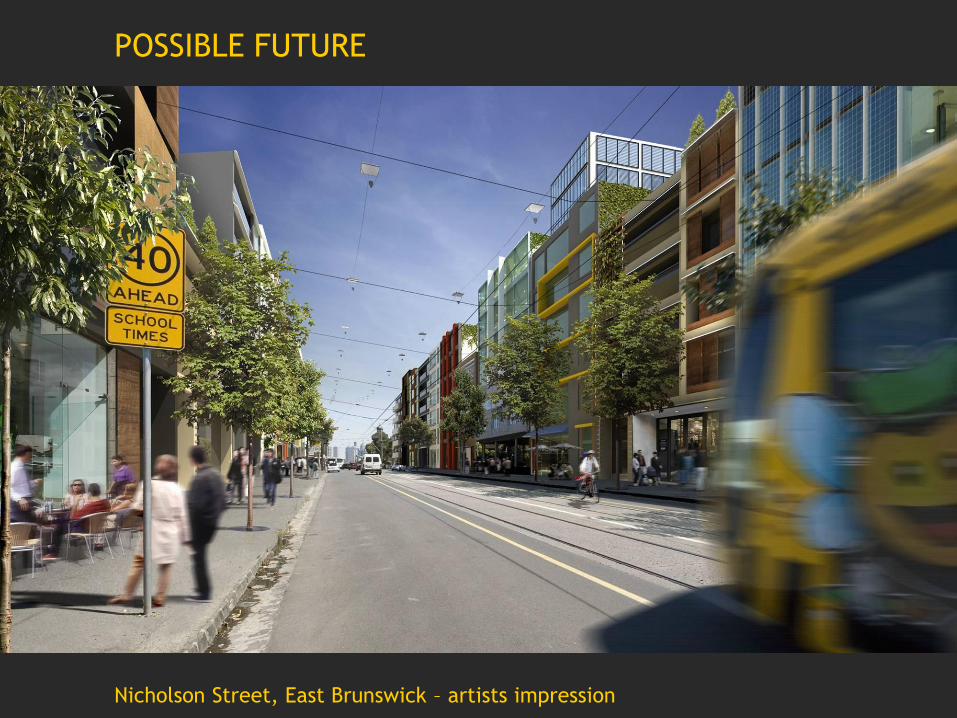
POSSIBLE FUTURE
Nicholson Street, East Brunswick – artists impression

NOW
Maribyrnong Road, – looking west to Union Road
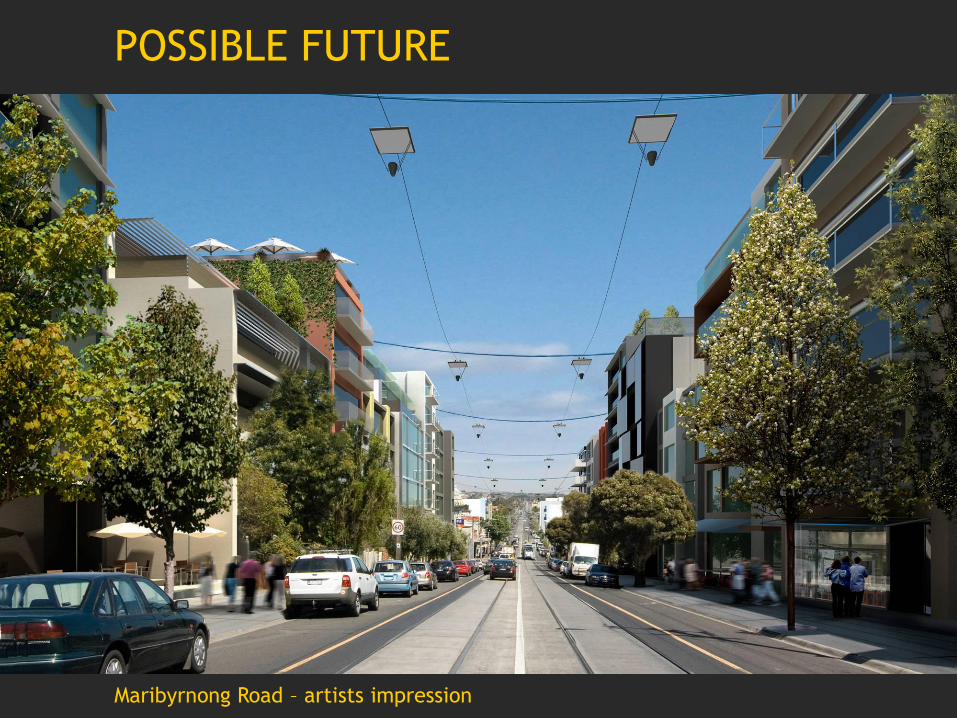
POSSIBLE FUTURE
Maribyrnong Road – artists impression
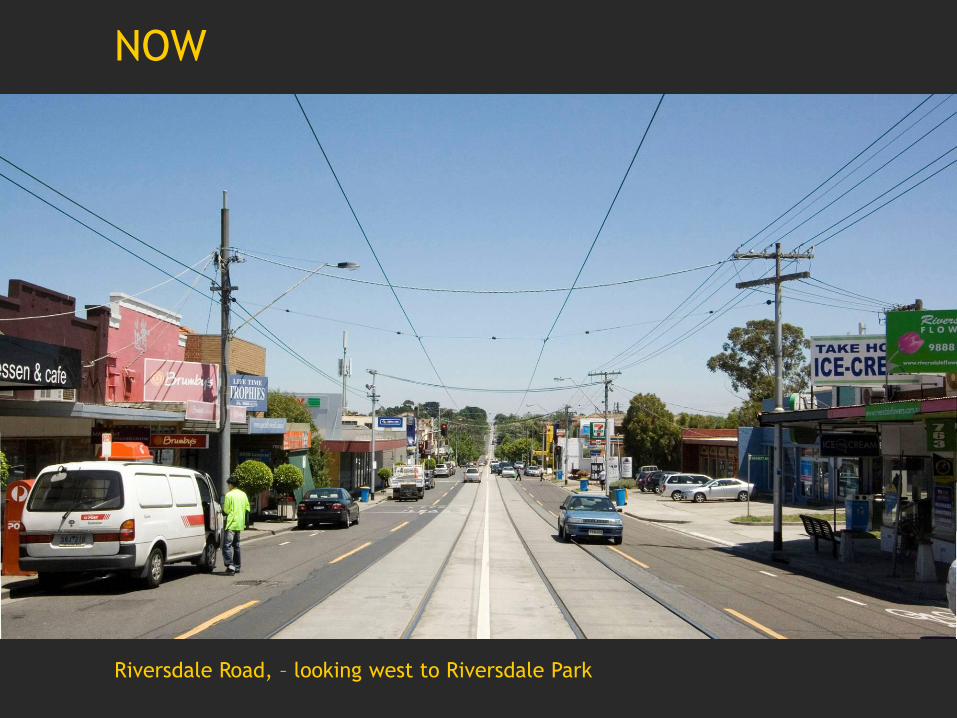
NOW
Riversdale Road, – looking west to Riversdale Park
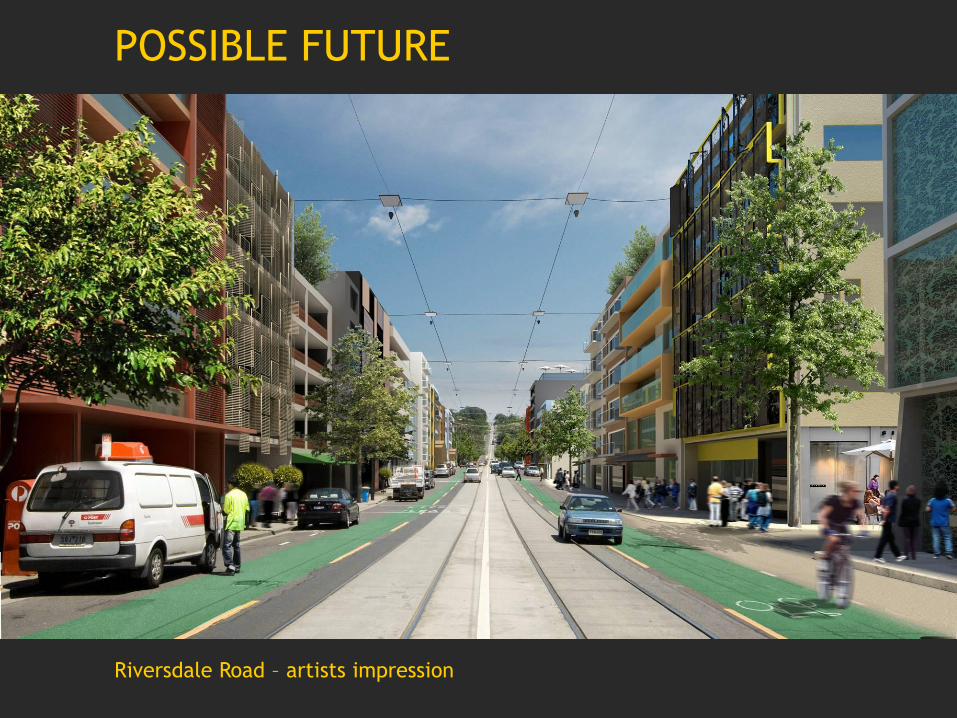
POSSIBLE FUTURE
Riversdale Road – artists impression
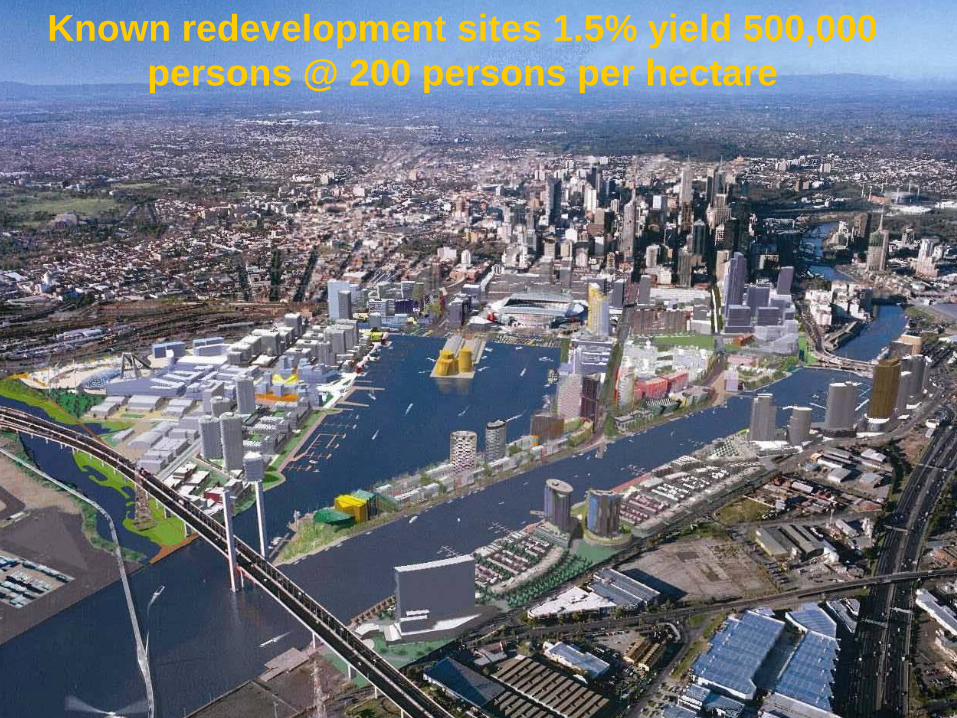
Known redevelopment sites 1.5% yield 500,000
persons @ 200 persons per hectare
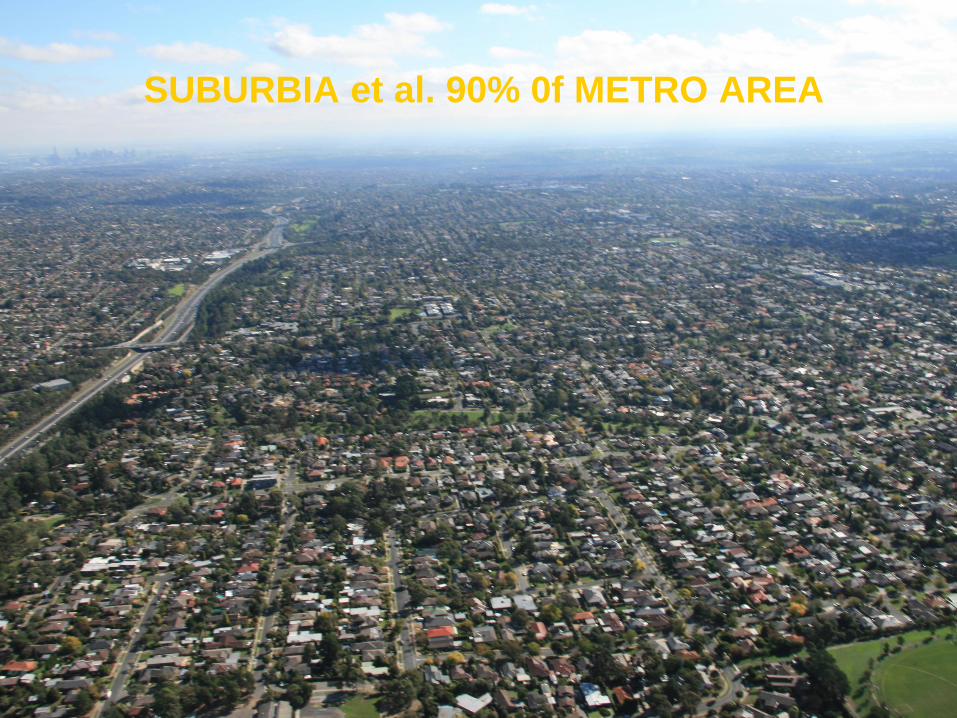
SUBURBIA et al. 90% 0f METRO AREA
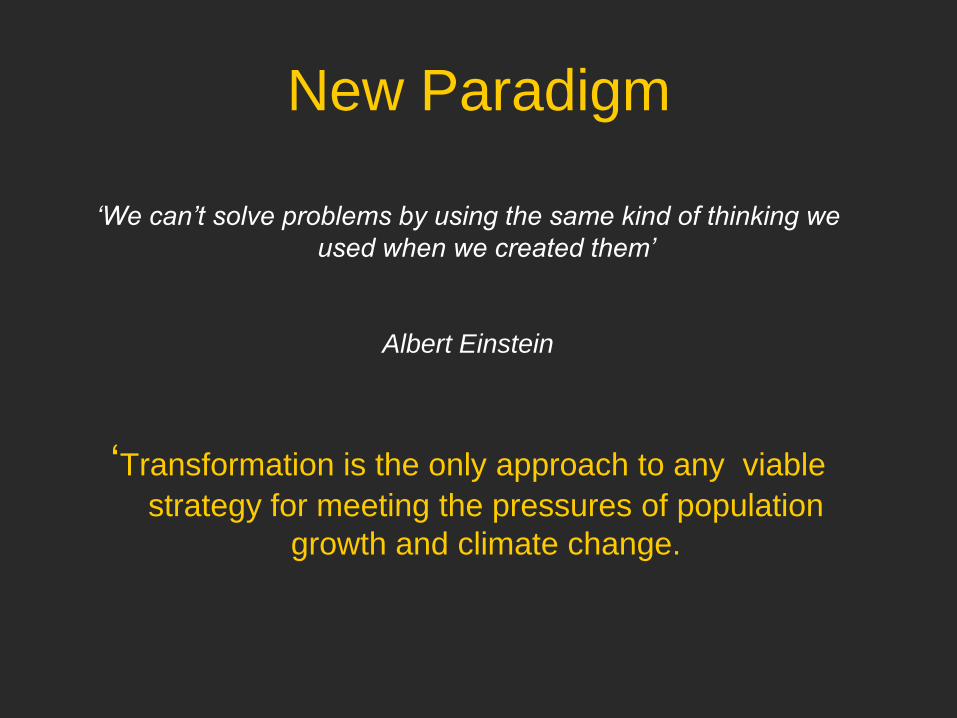
New Paradigm
‘We can’t solve problems by using the same kind of thinking we
used when we created them’
Albert Einstein
‘Transformation is the only approach to any viable
strategy for meeting the pressures of population
growth and climate change.
l = 5 dwellings
l convenience store
2002
9,895 dwellings
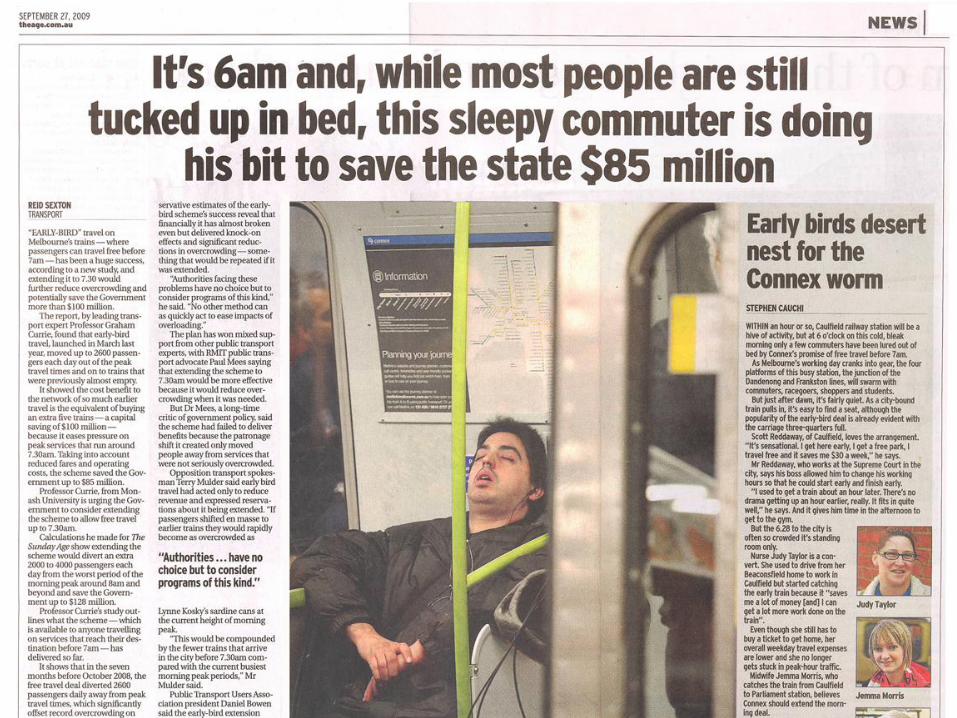
SOURCE: THE SUNDAY AGE, 27.09.09
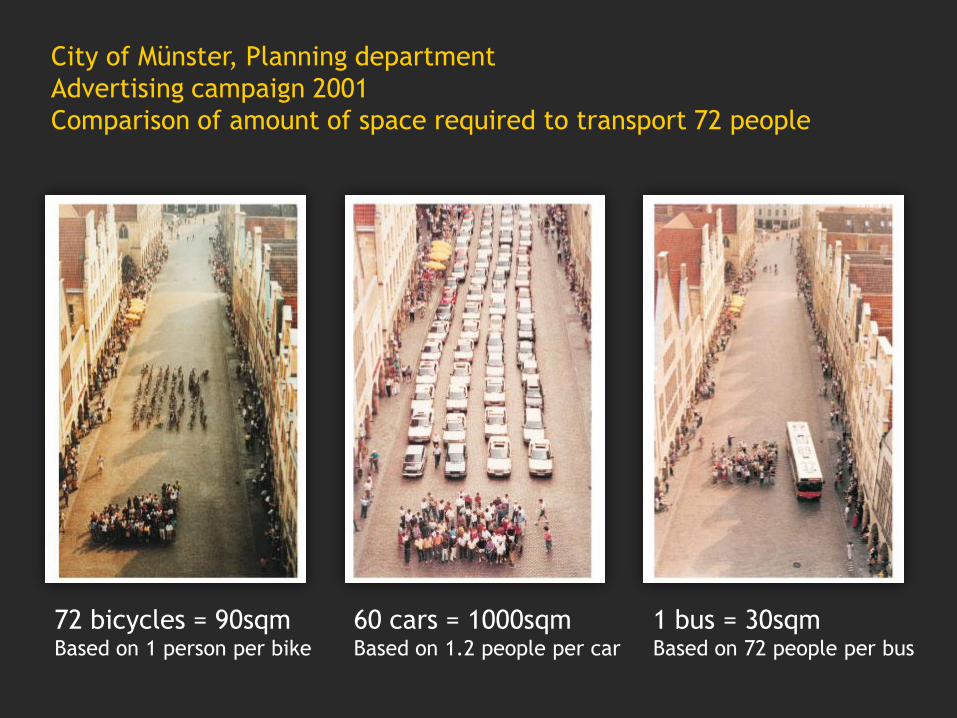
City of Münster, Planning department
Advertising campaign 2001
Comparison of amount of space required to transport 72 people
72 bicycles = 90sqm Based on 1 person per bike
60 cars = 1000sqm Based on 1.2 people per car
1 bus = 30sqm Based on 72 people per bus
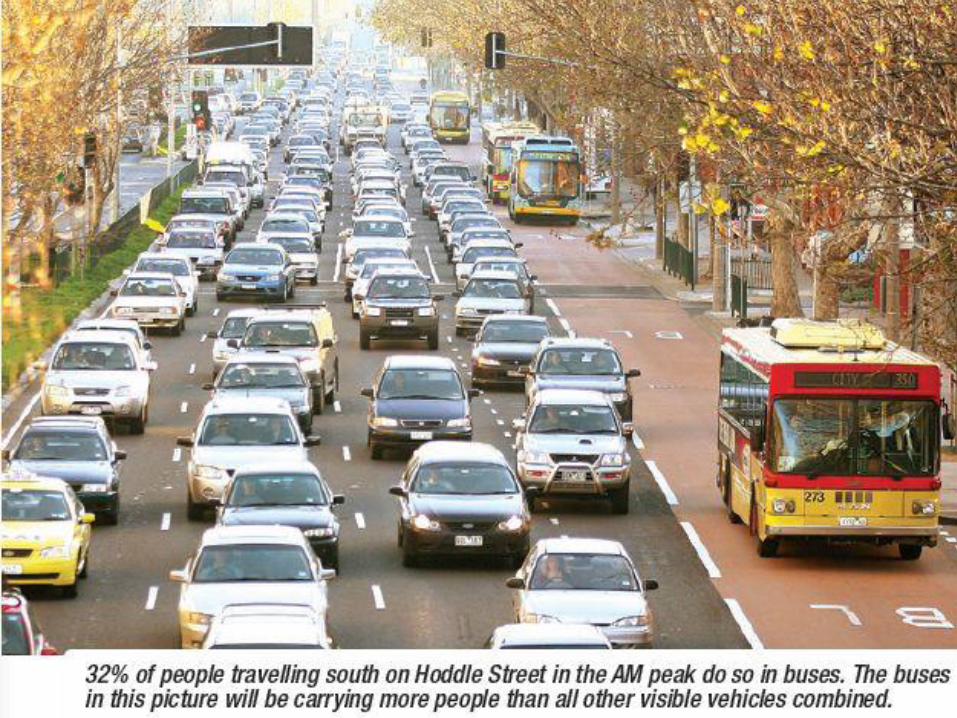
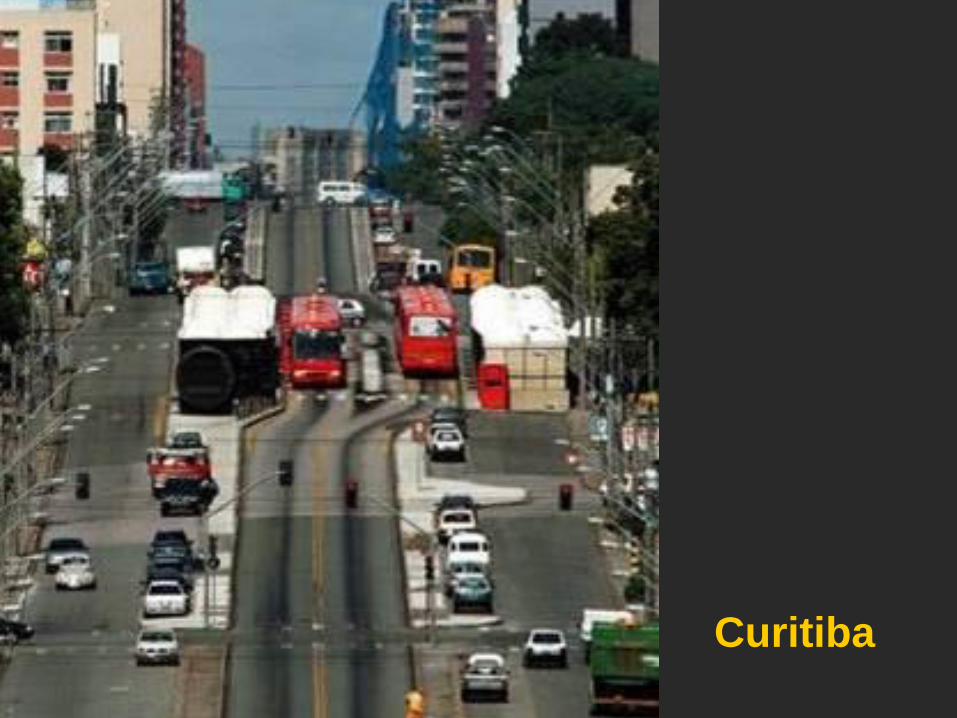
Curitiba
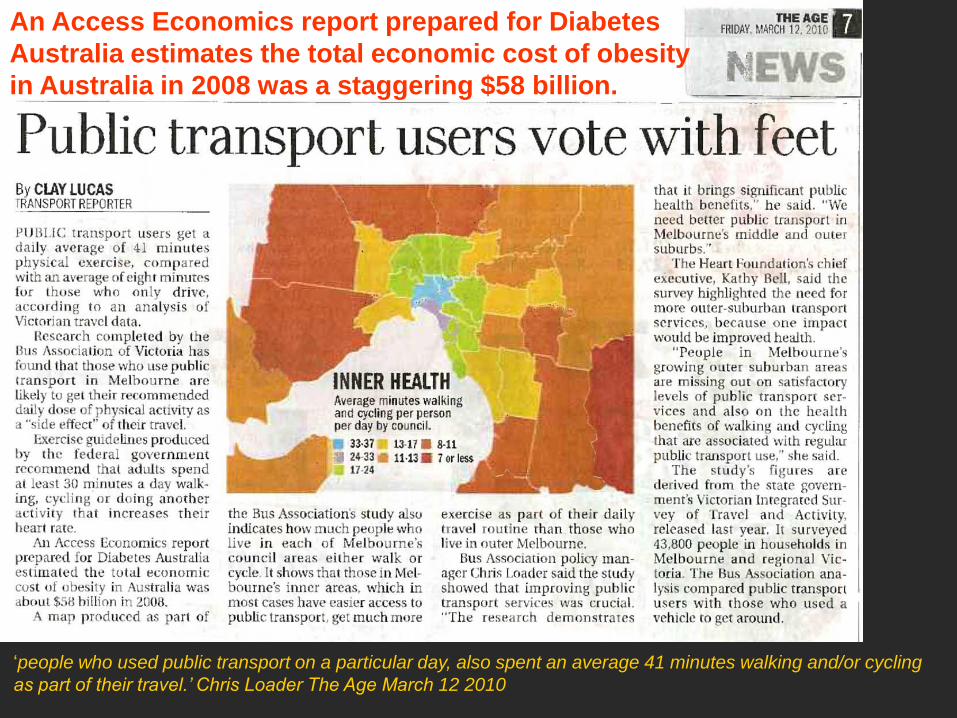
An Access Economics report prepared for Diabetes
Australia estimates the total economic cost of obesity
in Australia in 2008 was a staggering $58 billion.
‘people who used public transport on a particular day, also spent an average 41 minutes walking and/or cycling
as part of their travel.’ Chris Loader The Age March 12 2010
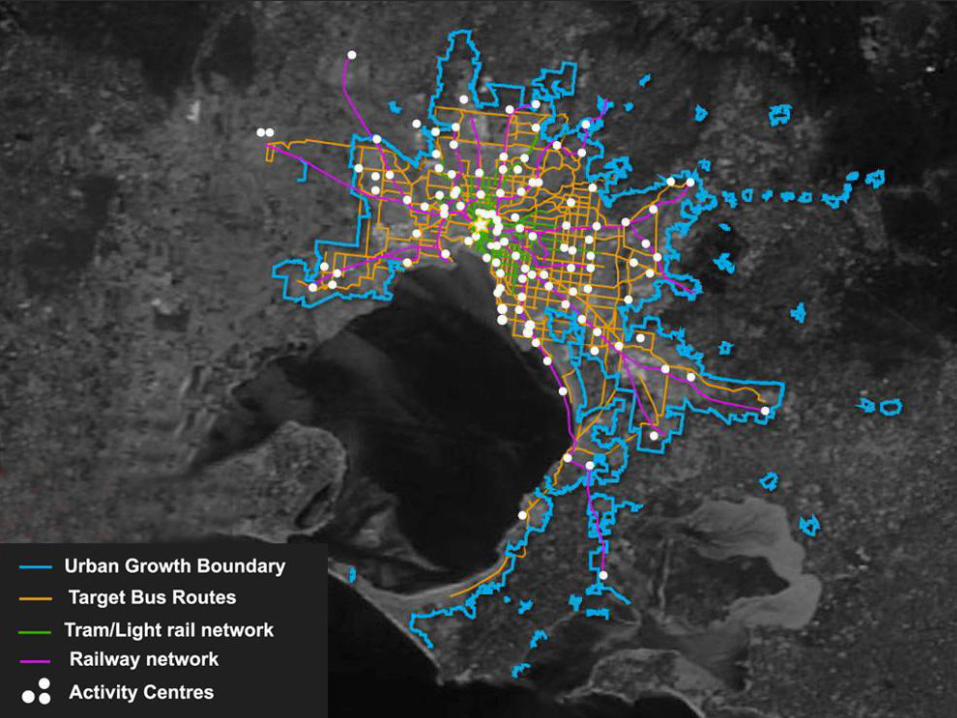
Implementation
‘Transformation can best be achieved through a
rationalization of the existing approach to Planning
Schemes.’
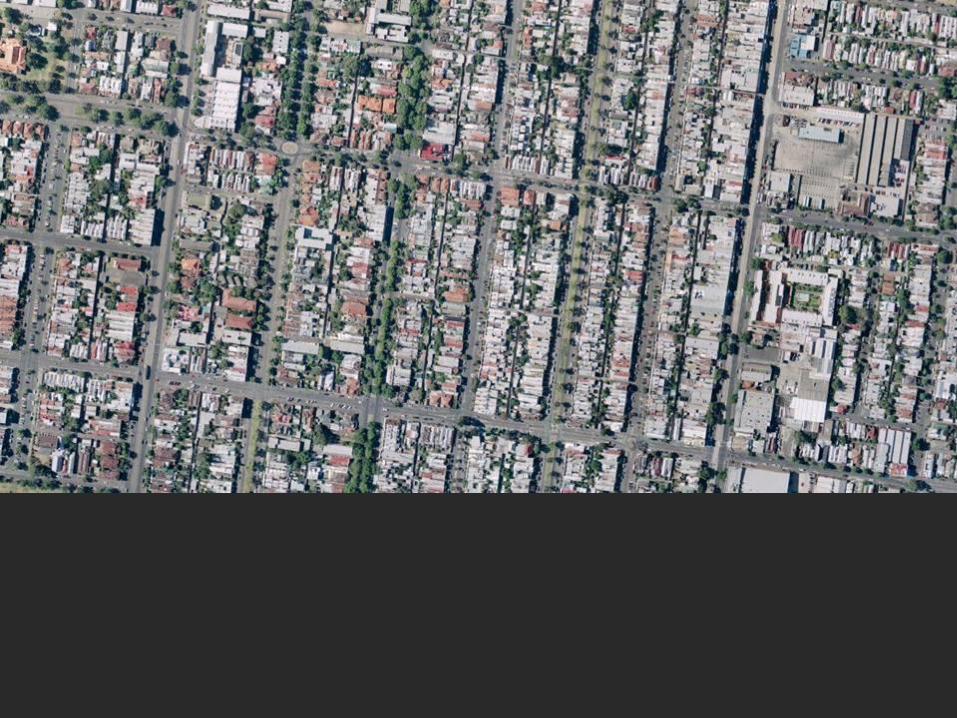
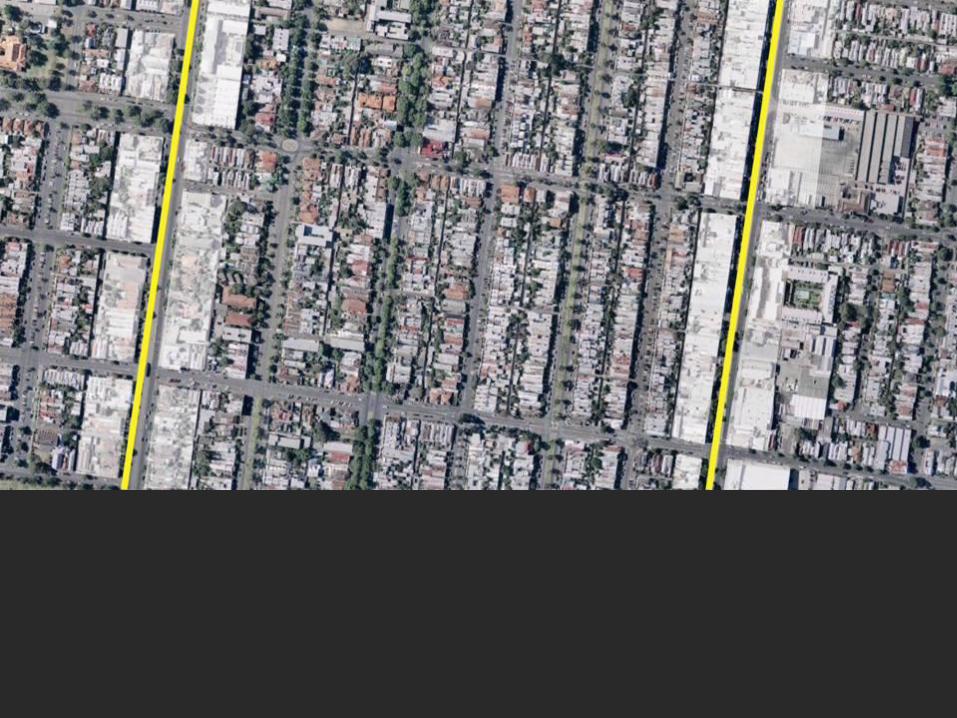
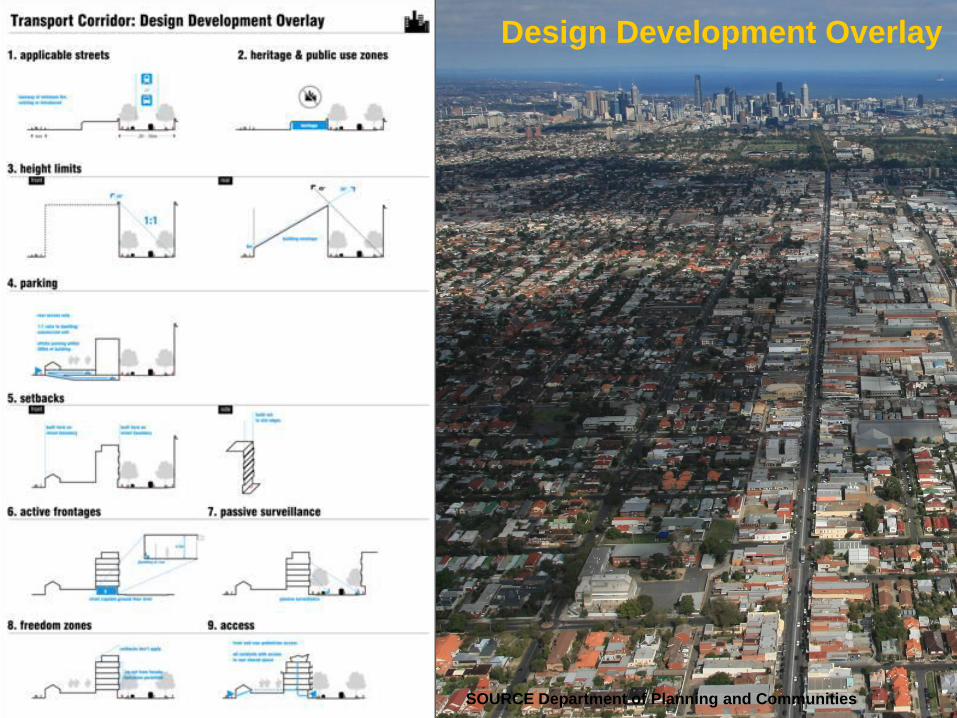
SOURCE Department of Planning and Communities
Design Development Overlay
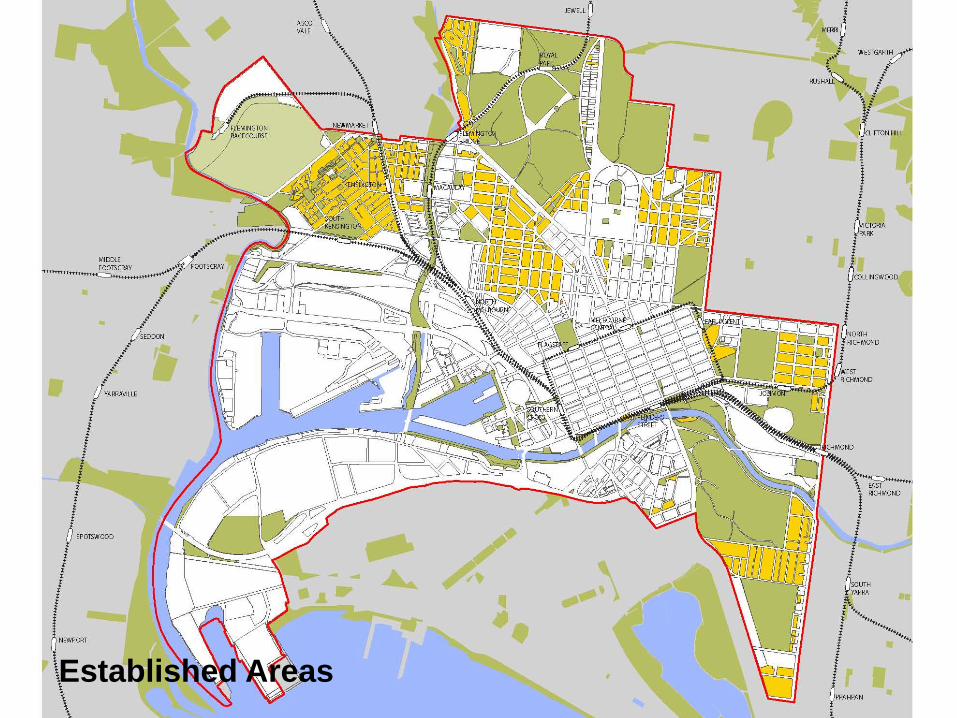
Established Areas
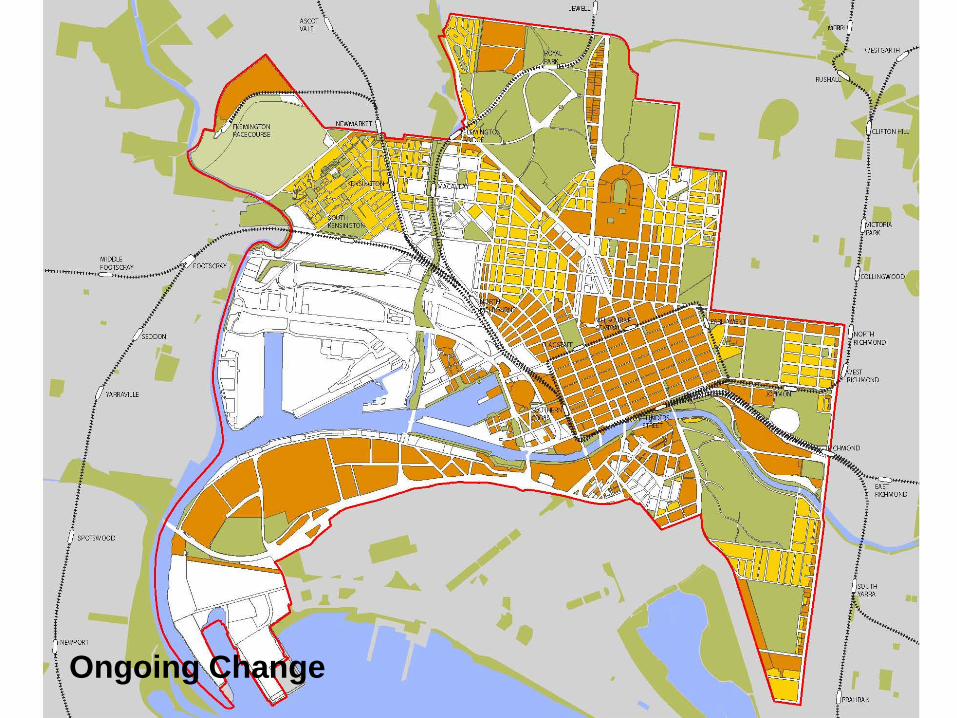
Ongoing Change
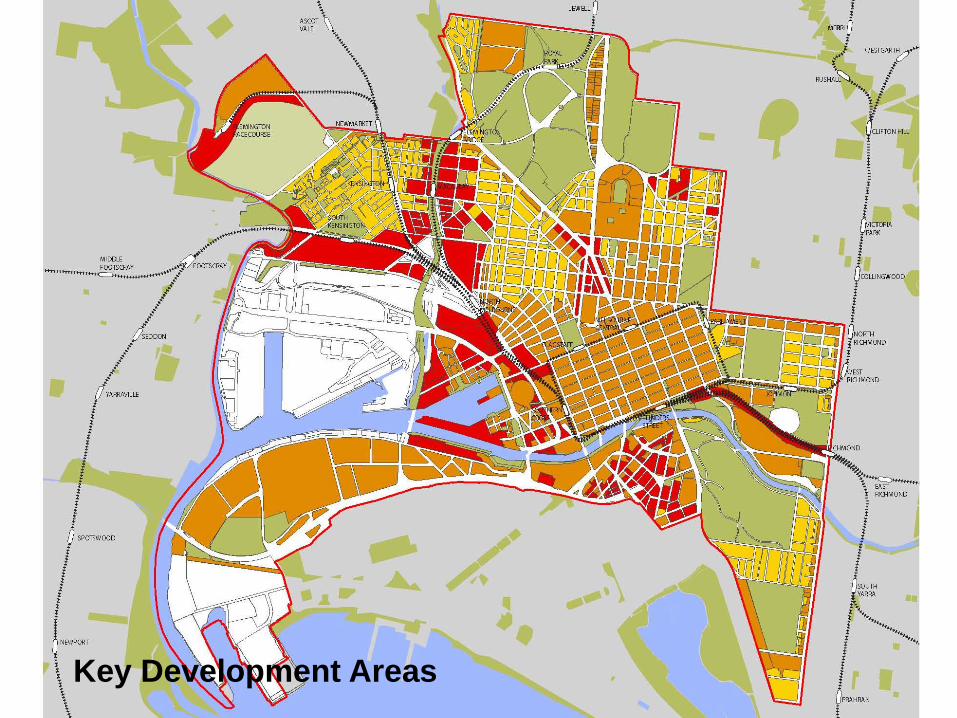
Key Development Areas
DRAFT IMAGE

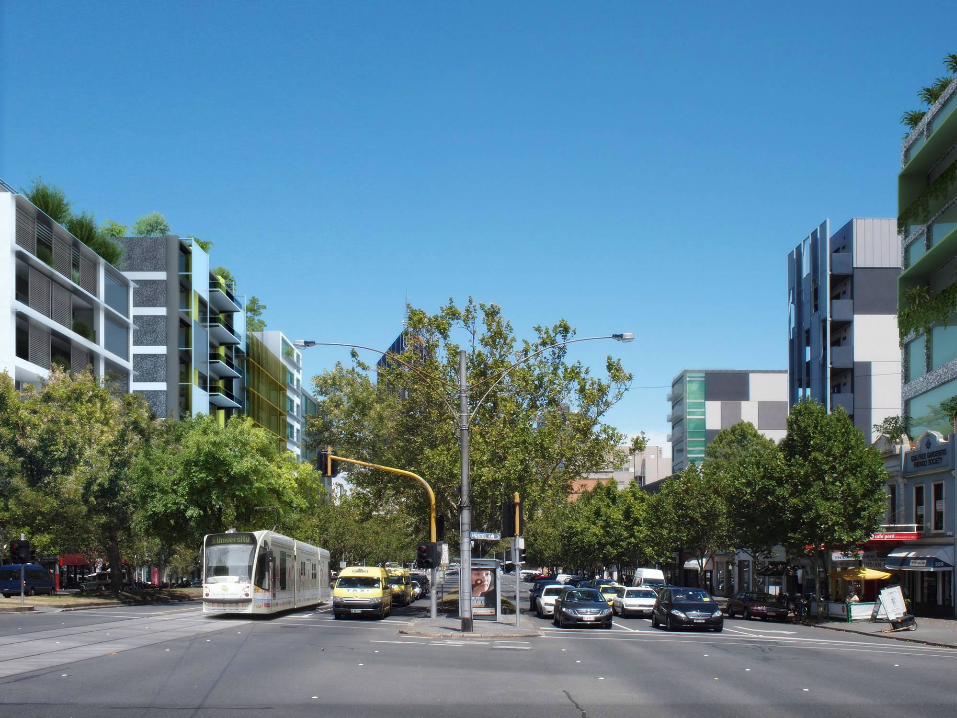
Engaging the community
‘Success is a political as well as a design solution. We
need to visualise the future in order to take the fear out
of the debate’
THE CHARACTER OF
URBAN INTENSIFICATION
ARC Research Project
University of Melbourne Ian Woodcock, Kim Dovey, Simon Wollan and Ammon Beyerle
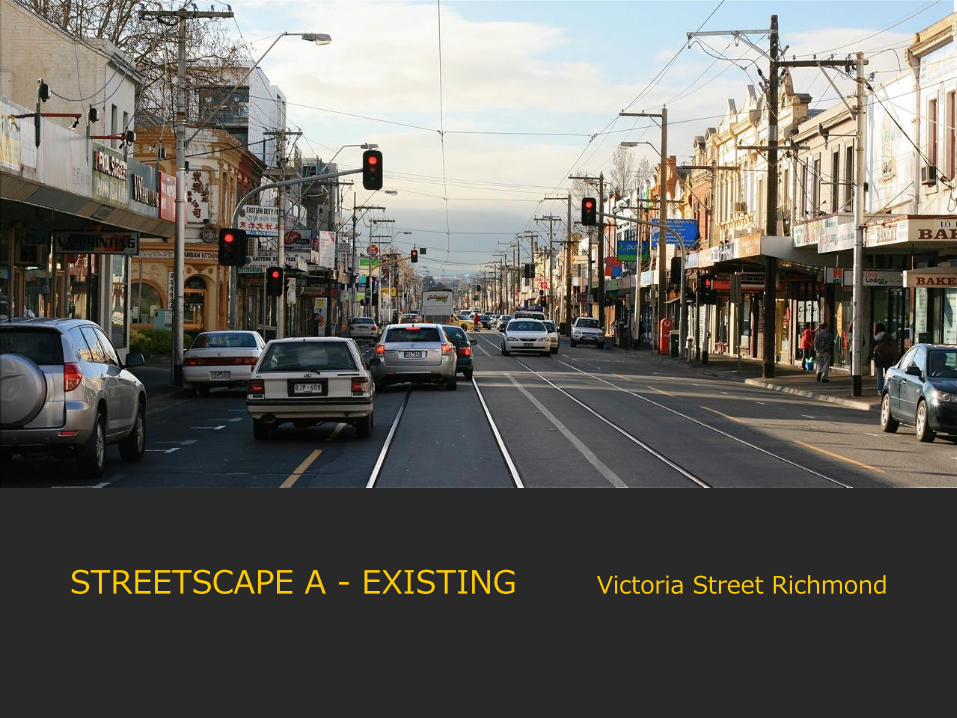
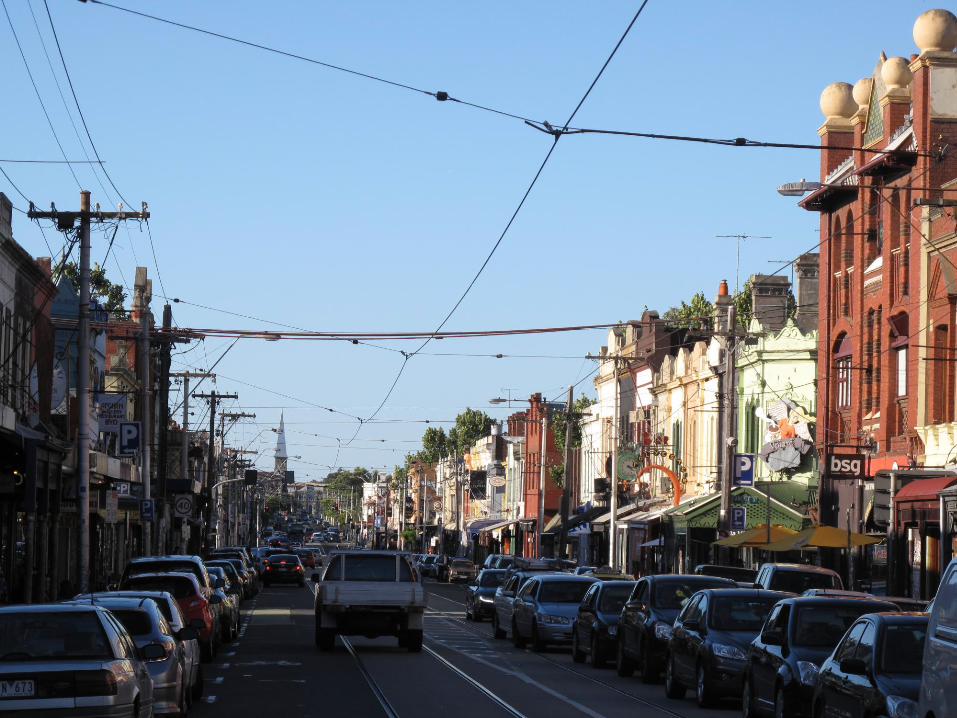
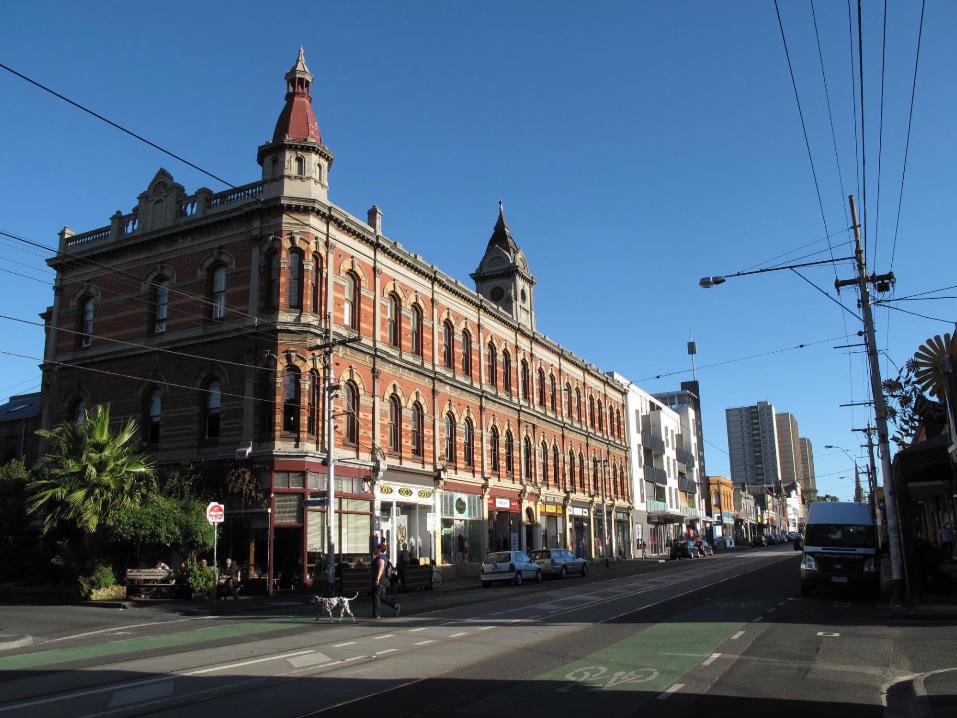
STREETSCAPE A - EXISTING Victoria Street Richmond
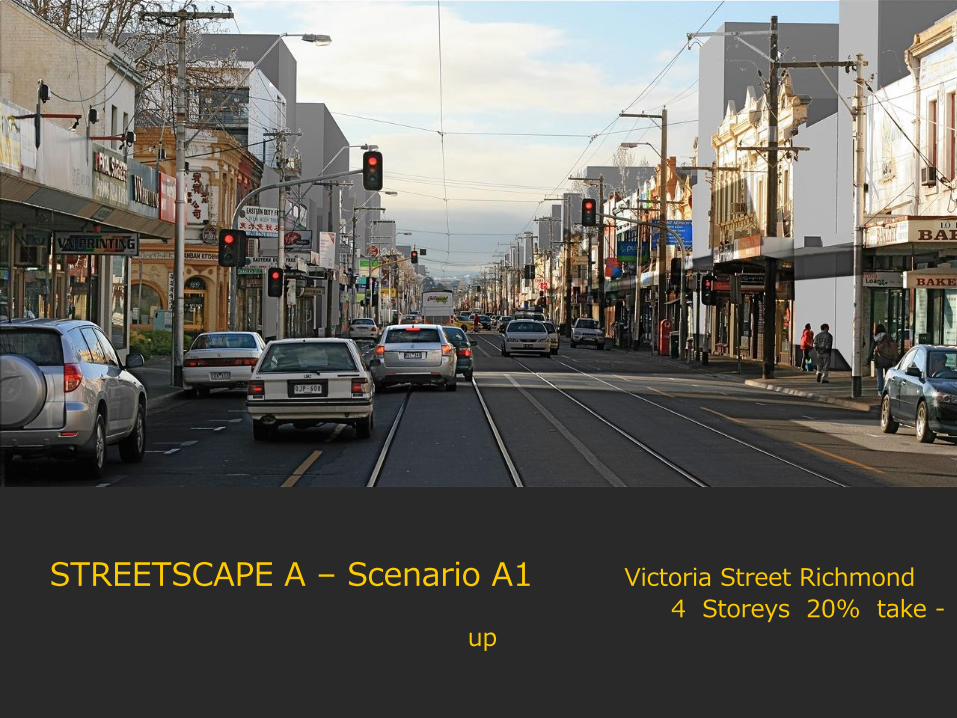
STREETSCAPE A – Scenario A1 Victoria Street Richmond
4 Storeys 20% take - up
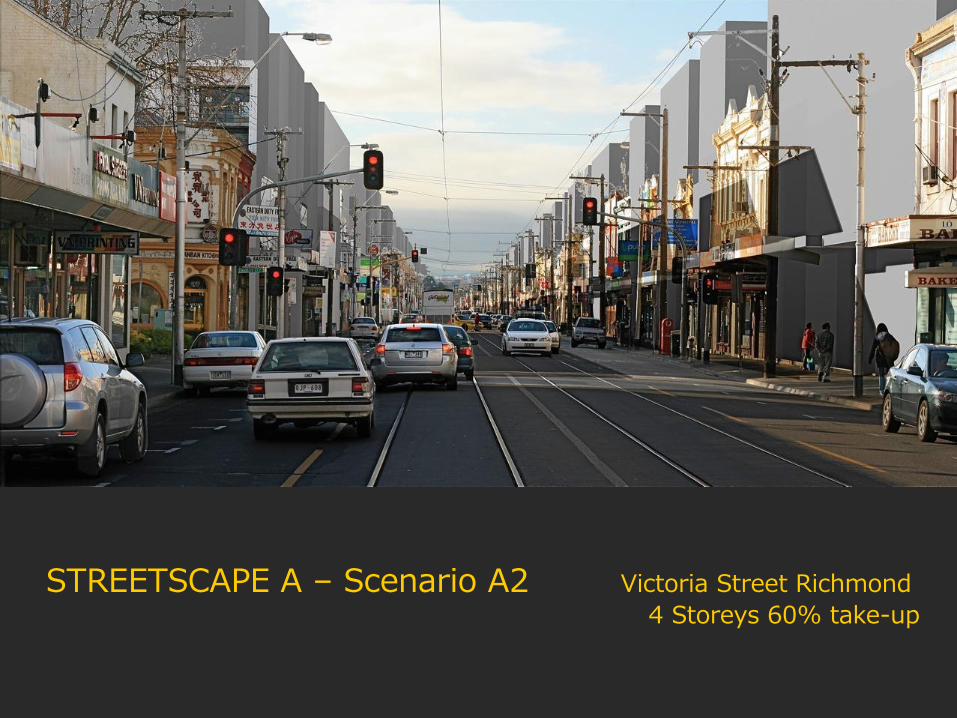
STREETSCAPE A – Scenario A2 Victoria Street Richmond
4 Storeys 60% take-up
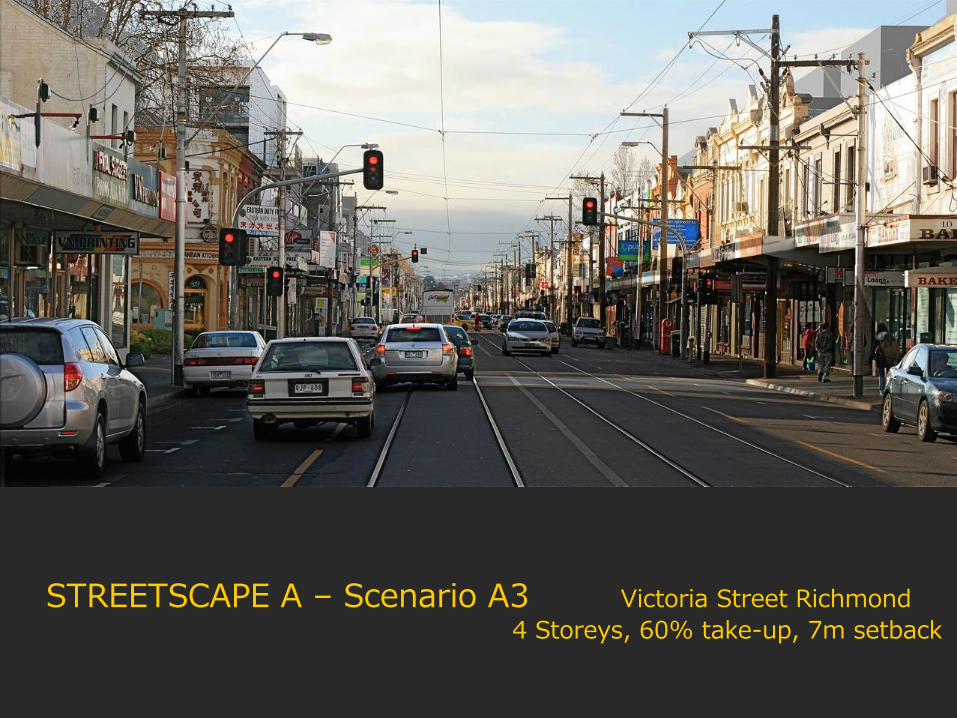
STREETSCAPE A – Scenario A3 Victoria Street Richmond
4 Storeys, 60% take-up, 7m setback
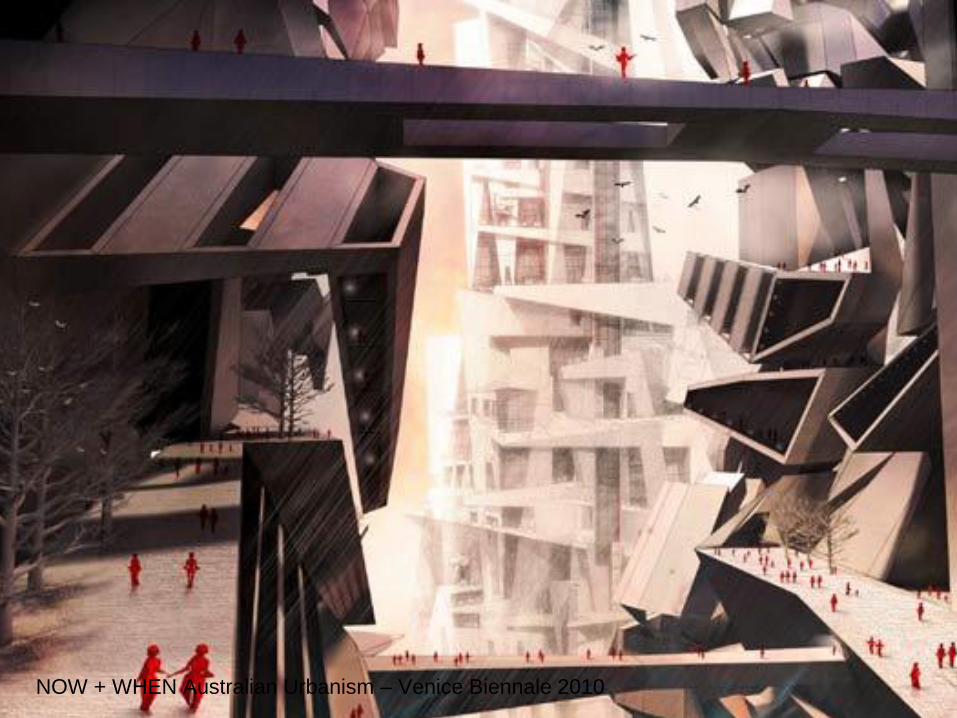
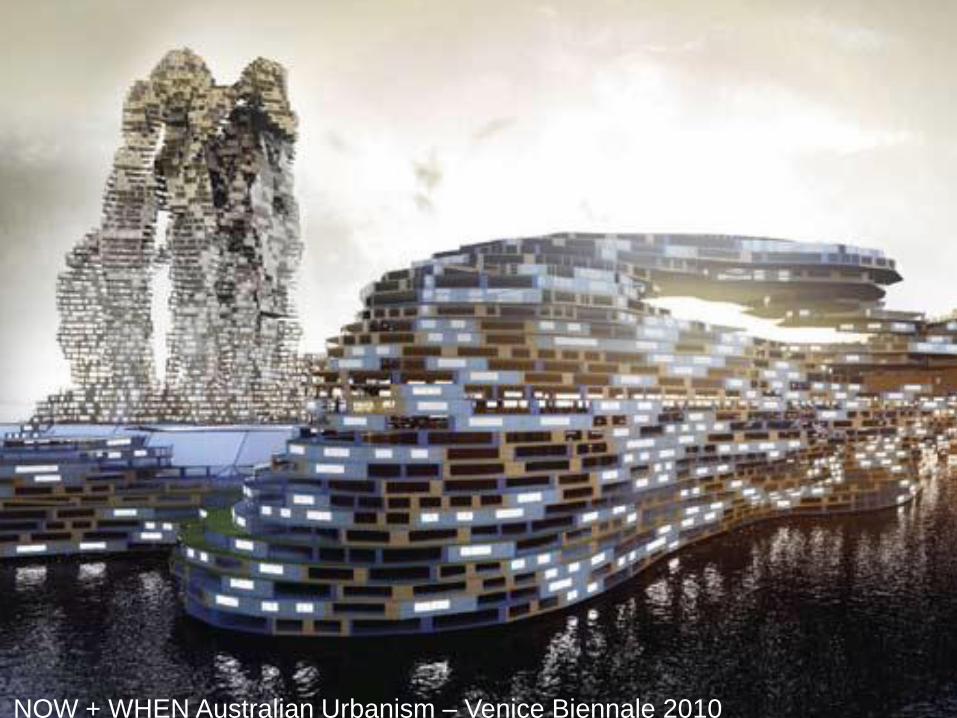
NOW + WHEN Australian Urbanism – Venice Biennale 2010
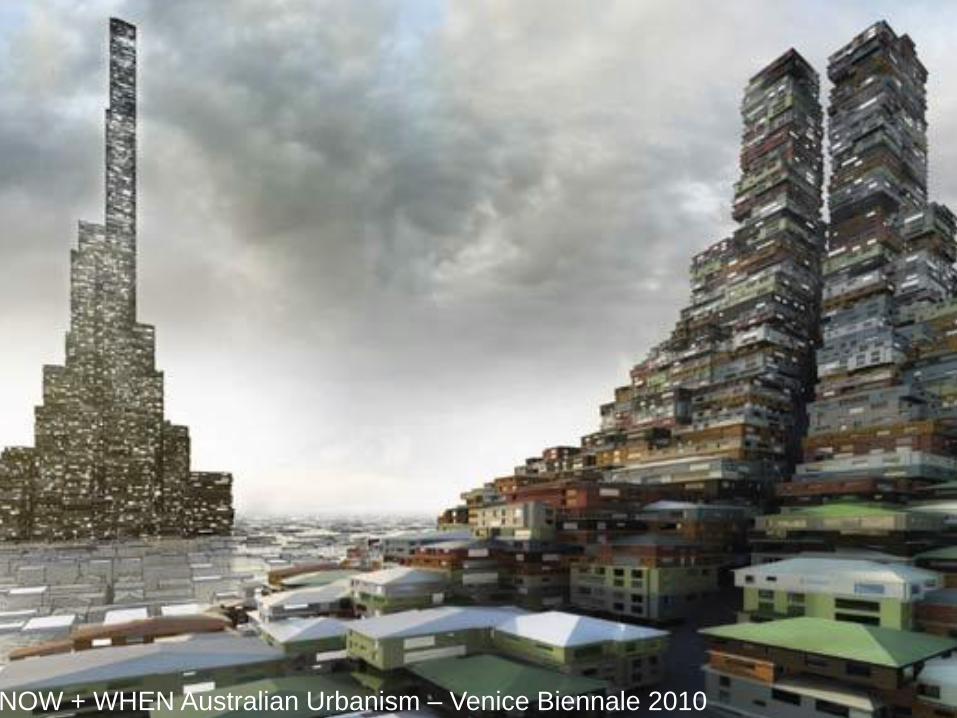
NOW + WHEN Australian Urbanism – Venice Biennale 2010
NOW + WHEN Australian Urbanism – Venice Biennale 2010
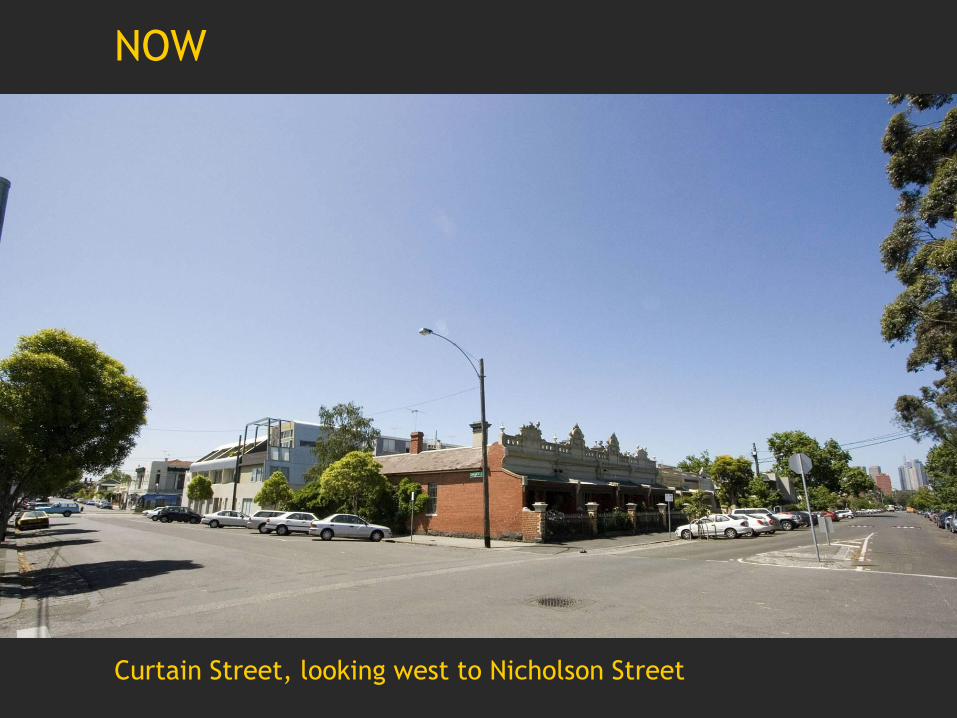
NOW
Curtain Street, looking west to Nicholson Street
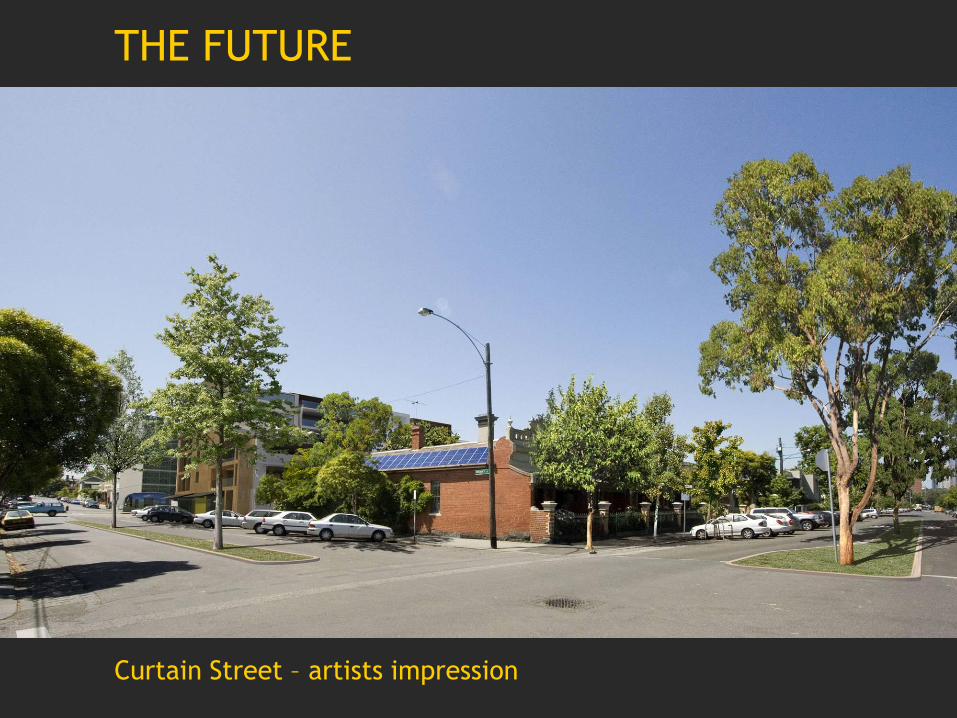
THE FUTURE
Curtain Street – artists impression
![ROBERT ADAMS: THE PLACE WE LIVE, A ......2 ROBERT ADAMS: THE PLACE WE LIVE, A RETROSPECTIVE SELECTION OF PHOTOGRAPHS, 1964–2009 [01] Robert Adams, Northeast of Keota, Colorado, 1969,](https://img.pdfslide.net/doc/110x75/5f38e0ad7e8dfb647d13ff8d/robert-adams-the-place-we-live-a-2-robert-adams-the-place-we-live-a.jpg)