Embed Size (px)
Citation preview
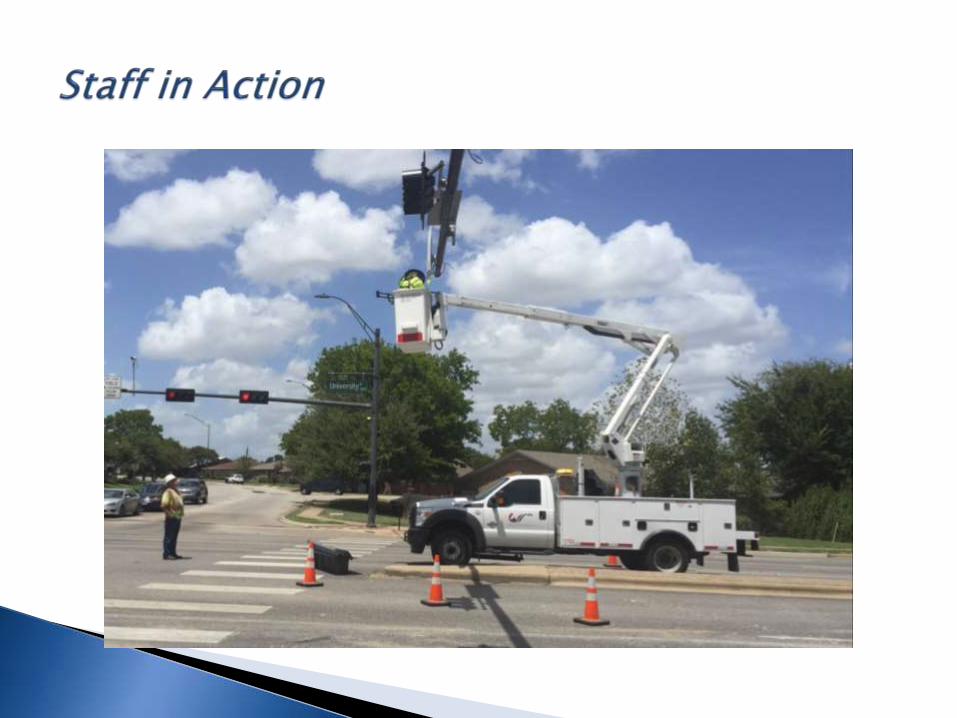
College Station City Council – August 24, 2017Troy Rother
City Traffic Engineer
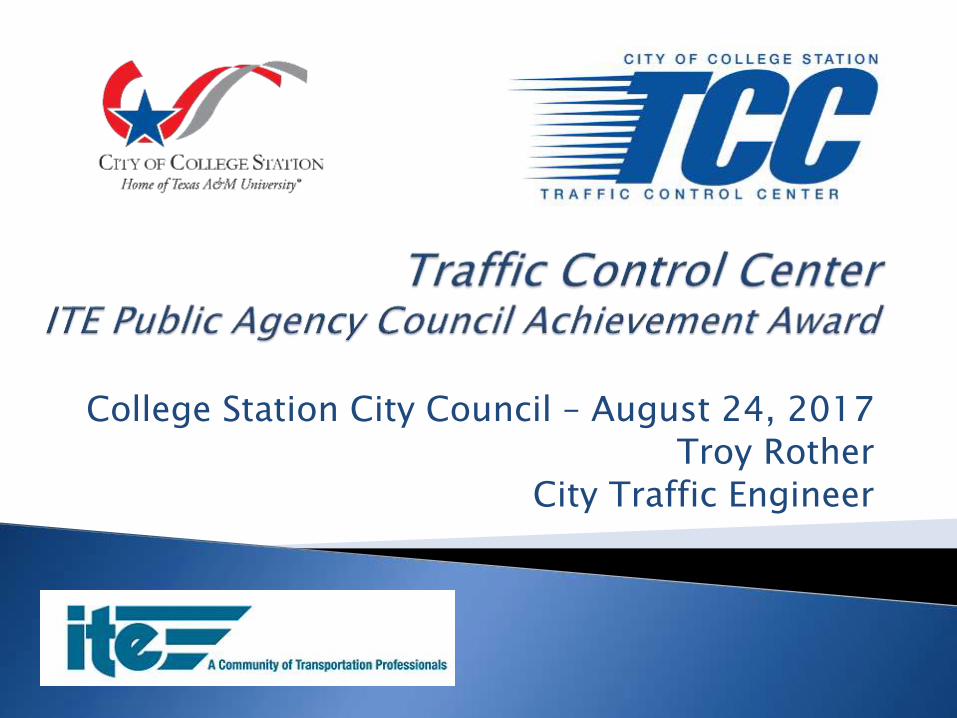
12 Traffic Division Staff◦ 3 engineers◦ 1 superintendent◦ 1 signal foremen ◦ 3 signal technicians◦ 1 sign foreman◦ 3 signs technicians
Equipment◦ 79 Traffic Signals◦ 60 School Zone Flashers◦ 59 Vehicle Detection Cameras◦ 52 Pan Tilt Zoom Cameras
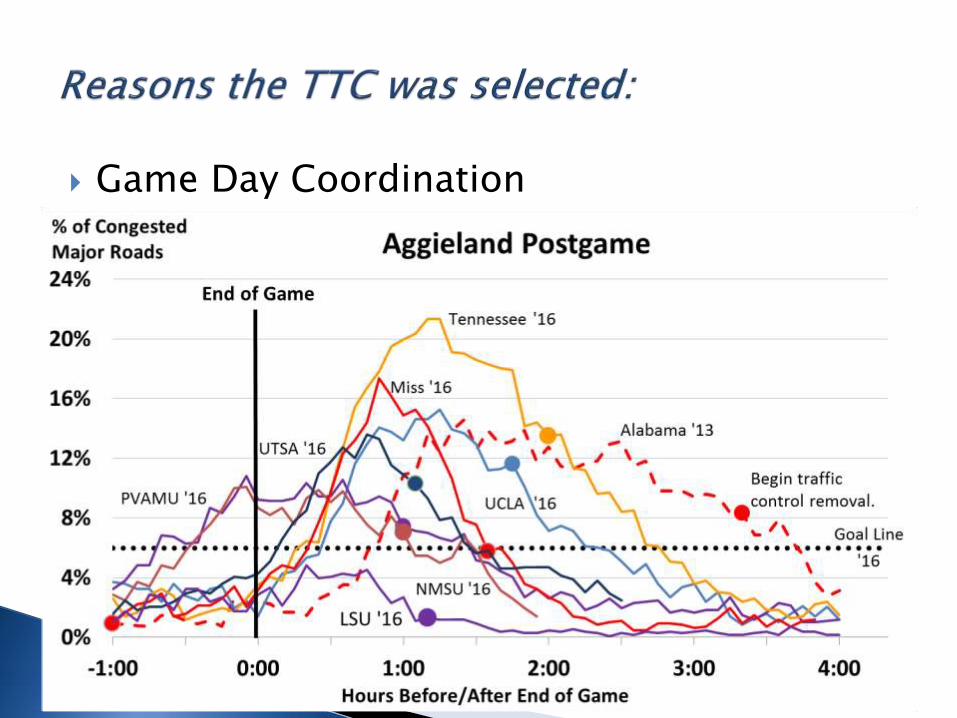
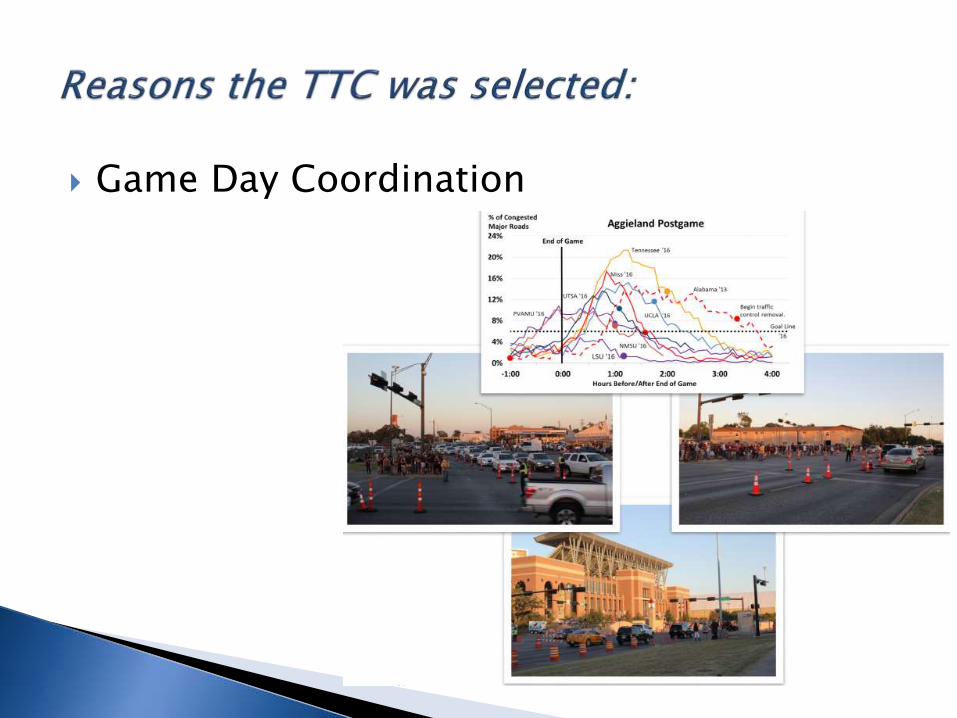
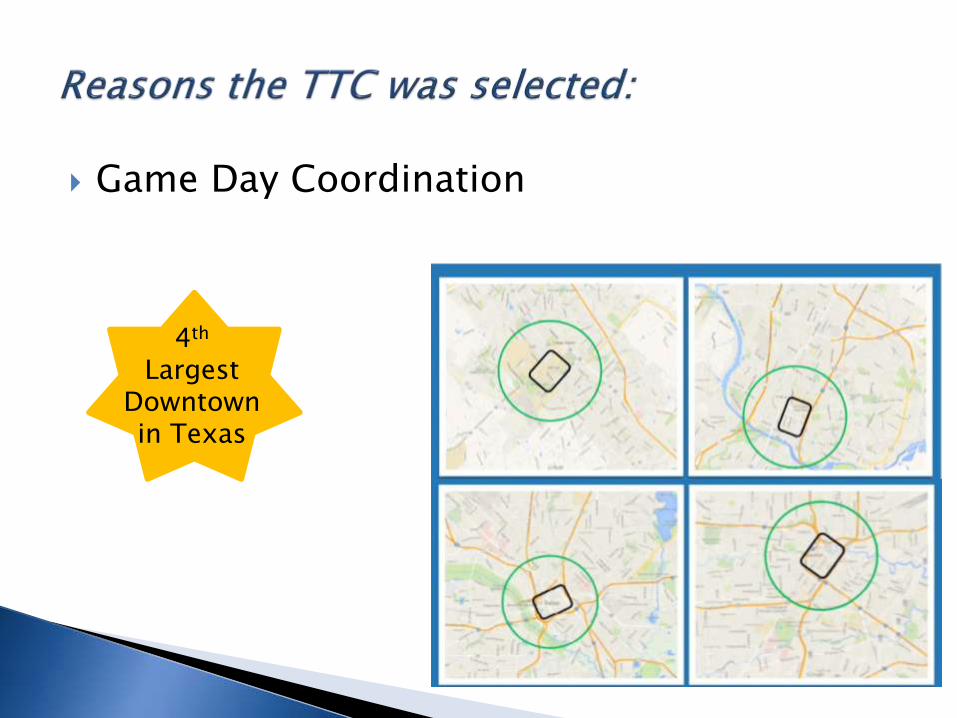
Game Day Coordination
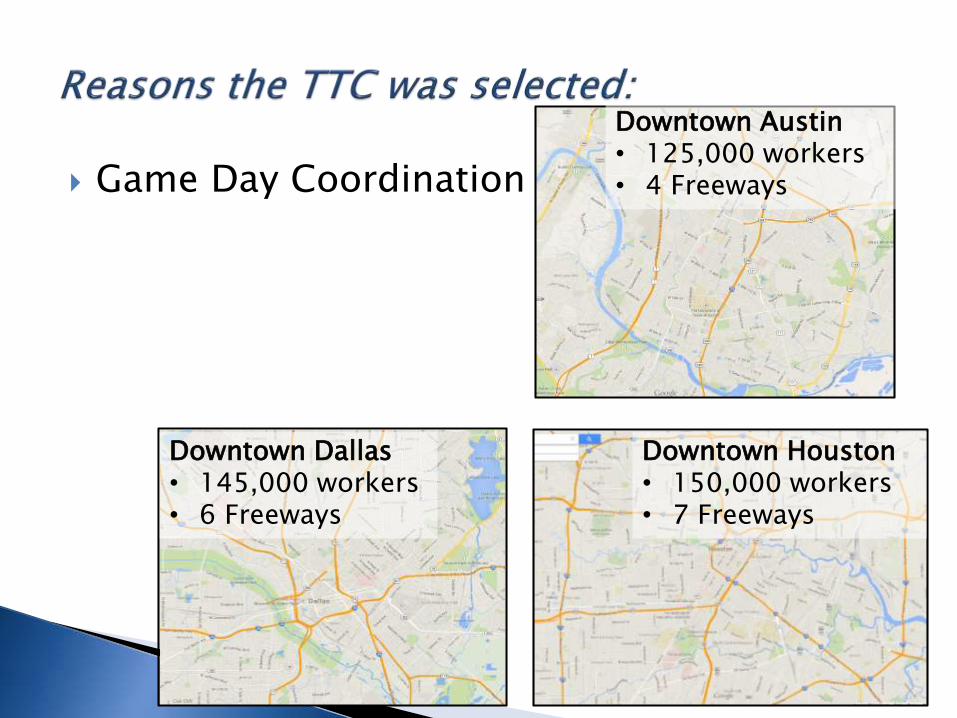
Game Day Coordination
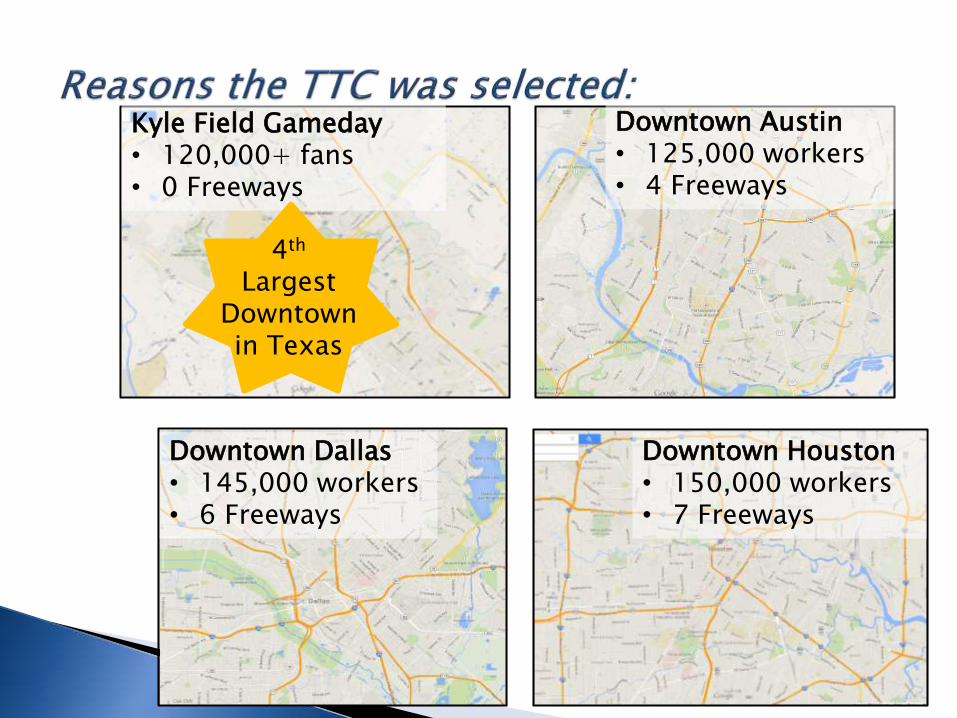
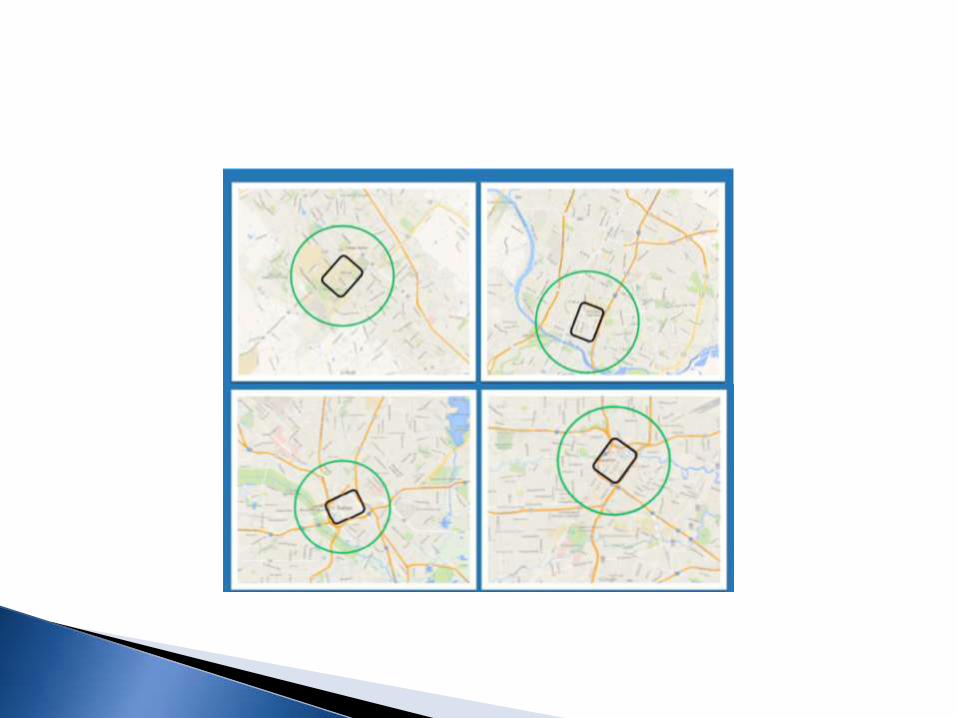
Downtown Houston• 150,000 workers• 7 Freeways
Downtown Dallas• 145,000 workers• 6 Freeways
Downtown Austin• 125,000 workers• 4 Freeways
Downtown Houston• 150,000 workers• 7 Freeways
Downtown Dallas• 145,000 workers• 6 Freeways
Downtown Austin• 125,000 workers• 4 Freeways
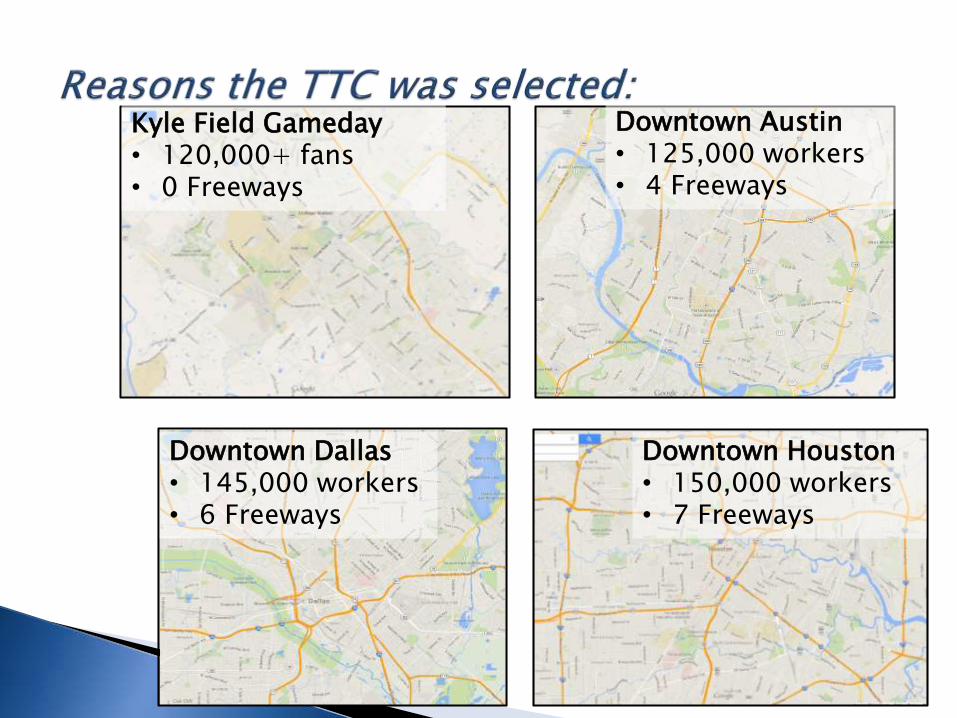
Kyle Field Gameday• 120,000+ fans• 0 Freeways
Downtown Houston• 150,000 workers• 7 Freeways
Downtown Dallas• 145,000 workers• 6 Freeways
Downtown Austin• 125,000 workers• 4 Freeways
Kyle Field Gameday• 120,000+ fans• 0 Freeways
4th
Largest Downtownin Texas
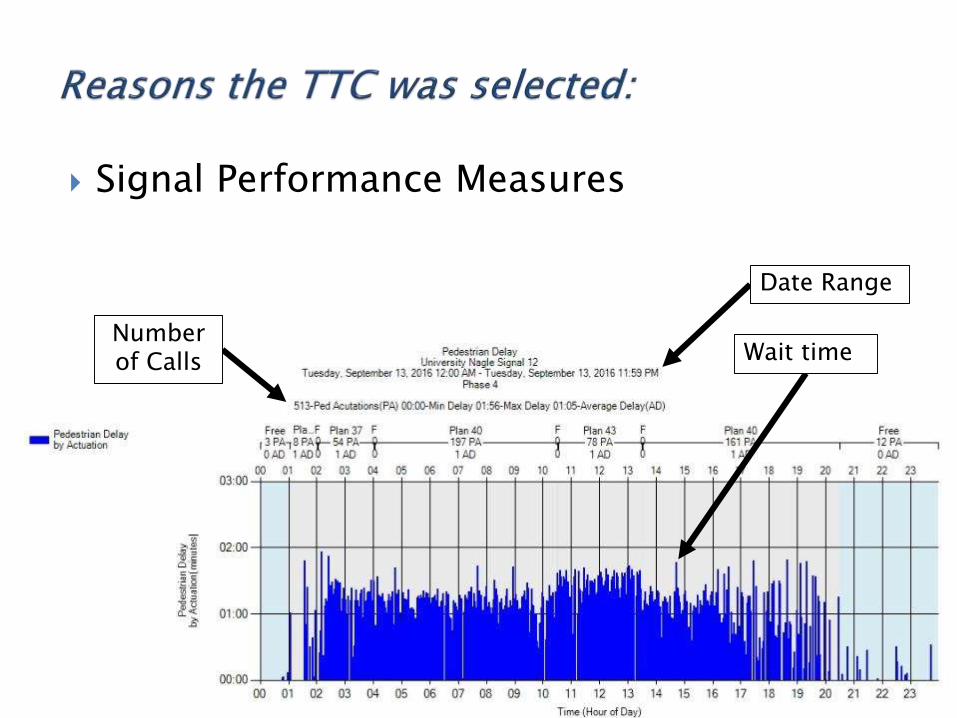
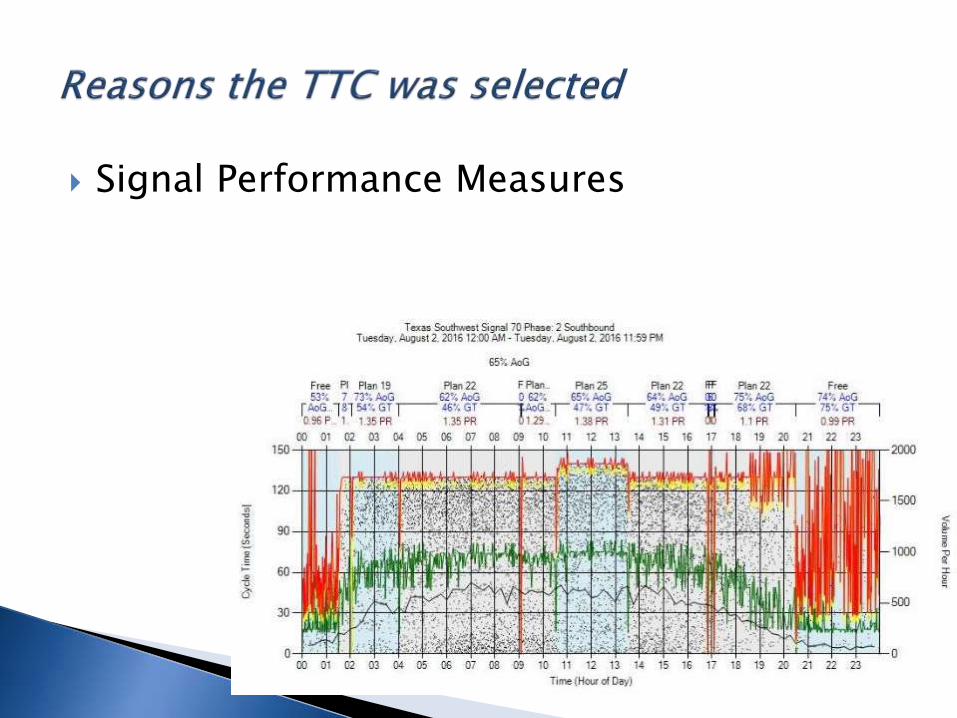
Signal Performance Measures
Wait timeNumber of Calls
Date Range
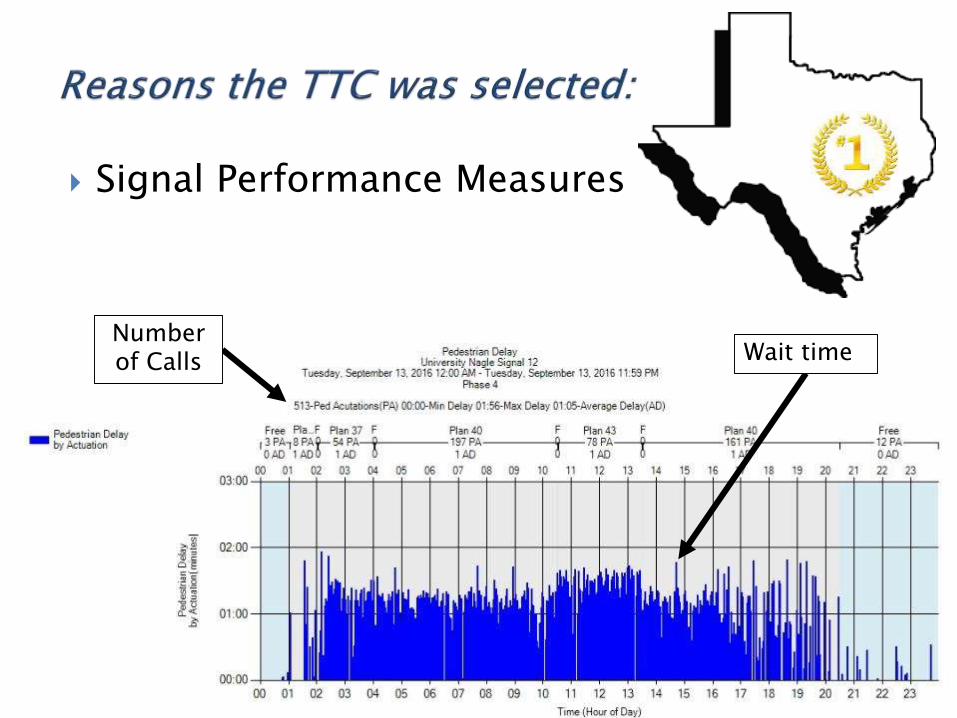
Signal Performance Measures
Wait timeNumber of Calls

College Station City Council – August 24, 2017Troy Rother
City Traffic Engineer
Game Day Coordination
Game Day Coordination
4th
Largest Downtownin Texas

Signal Performance Measures
Signal Performance Measures
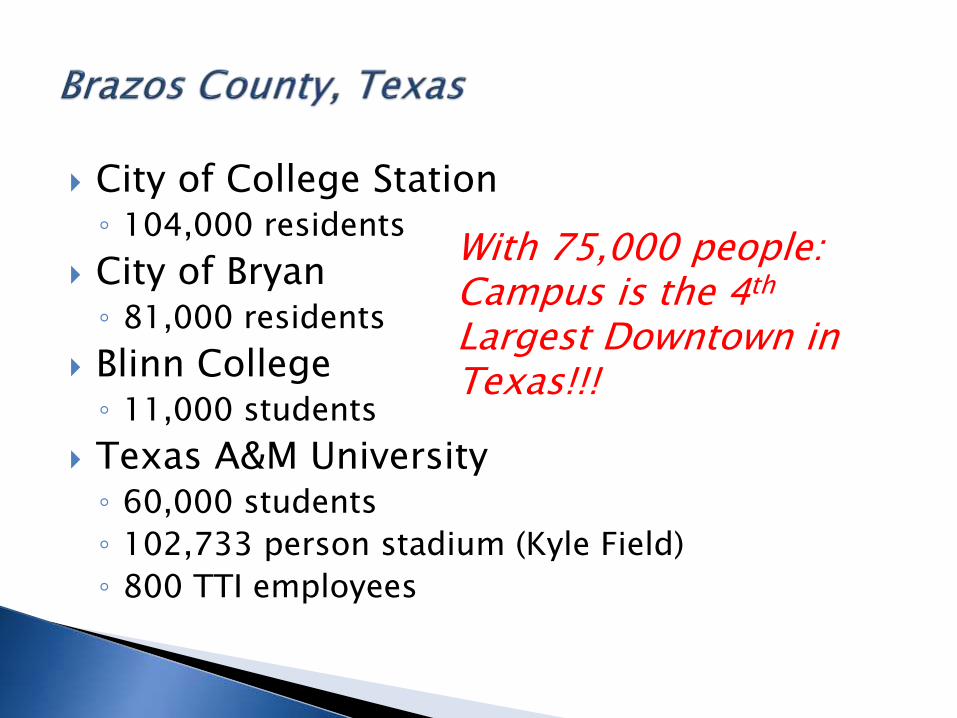
City of College Station◦ 104,000 residents
City of Bryan◦ 81,000 residents
Blinn College◦ 11,000 students
Texas A&M University◦ 60,000 students
◦ 102,733 person stadium (Kyle Field)
◦ 800 TTI employees
With 75,000 people: Campus is the 4th
Largest Downtown in Texas!!!
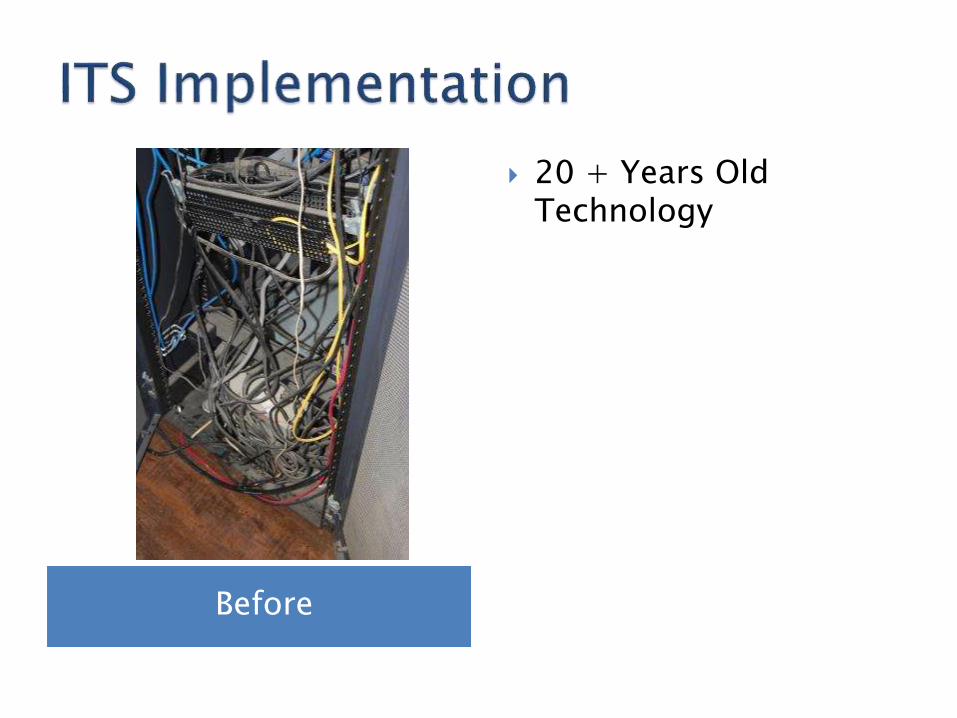
Before
20 + Years Old Technology

Before
20 + Years Old Technology
Parts only available on eBay
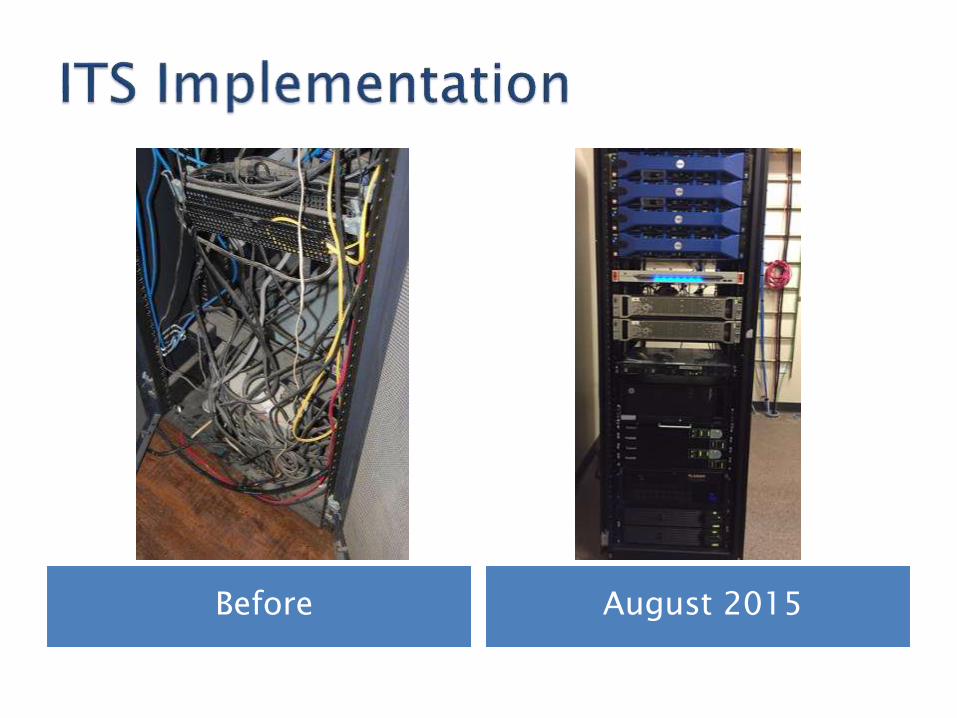
Before August 2015
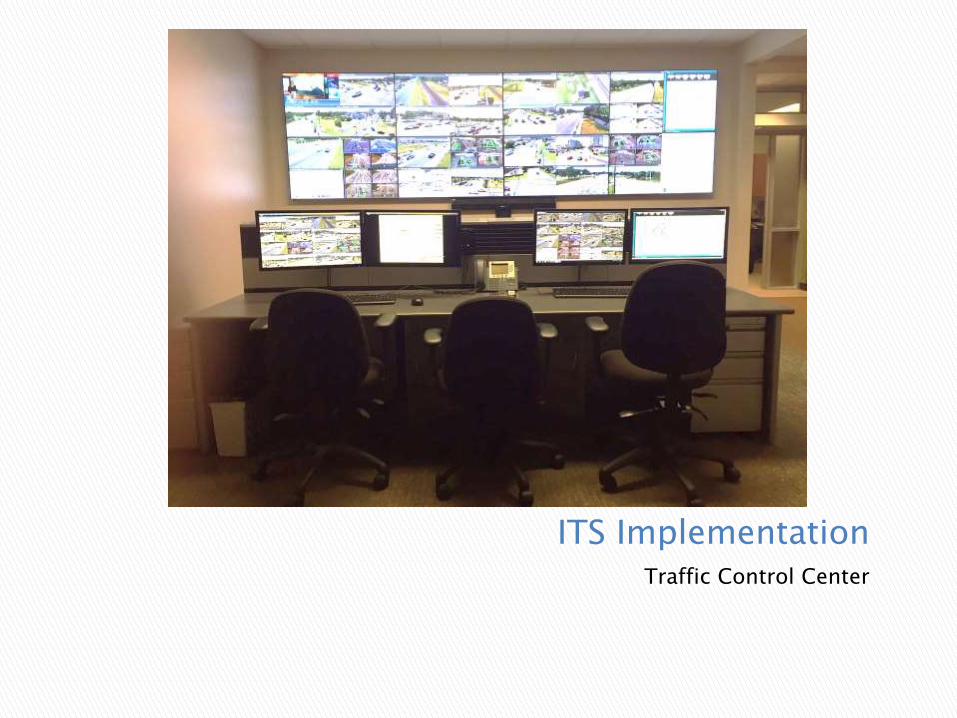
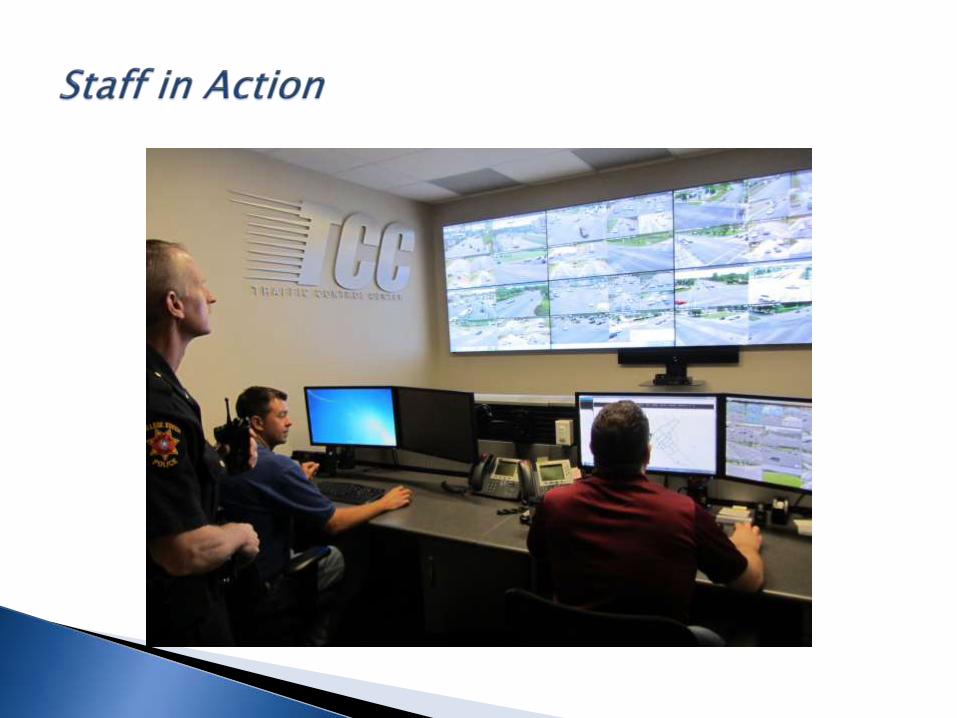
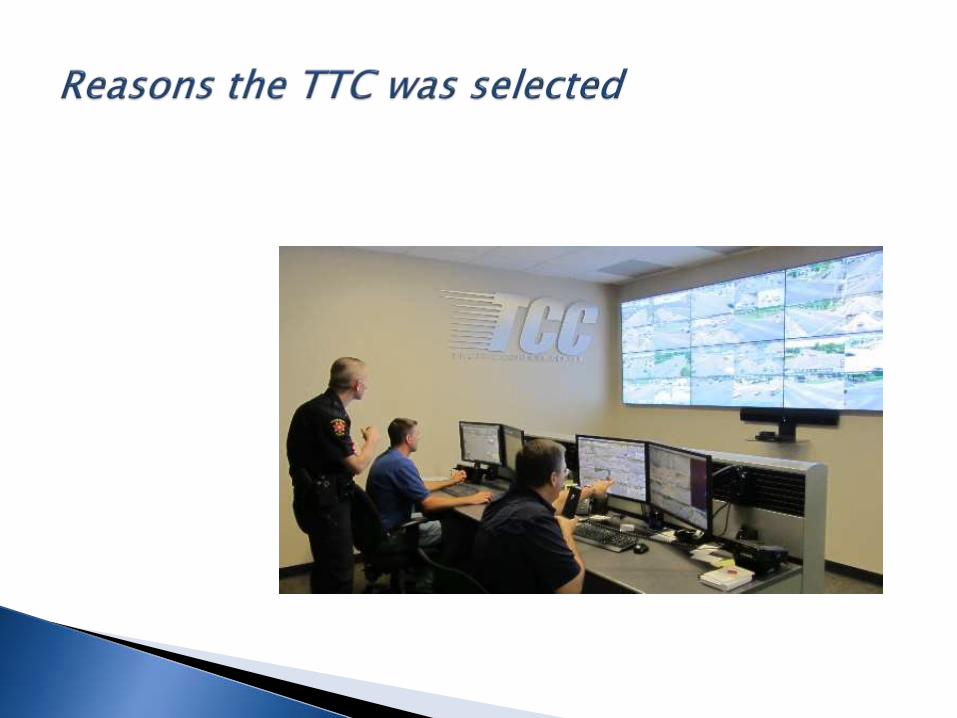
ITS ImplementationTraffic Control Center
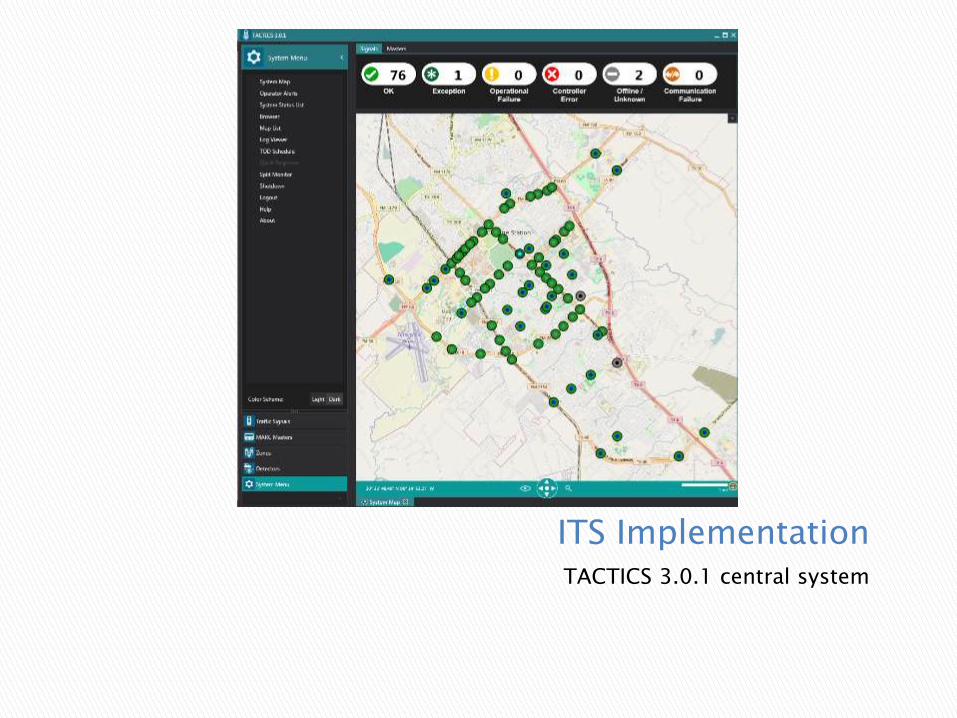
ITS ImplementationTACTICS 3.0.1 central system
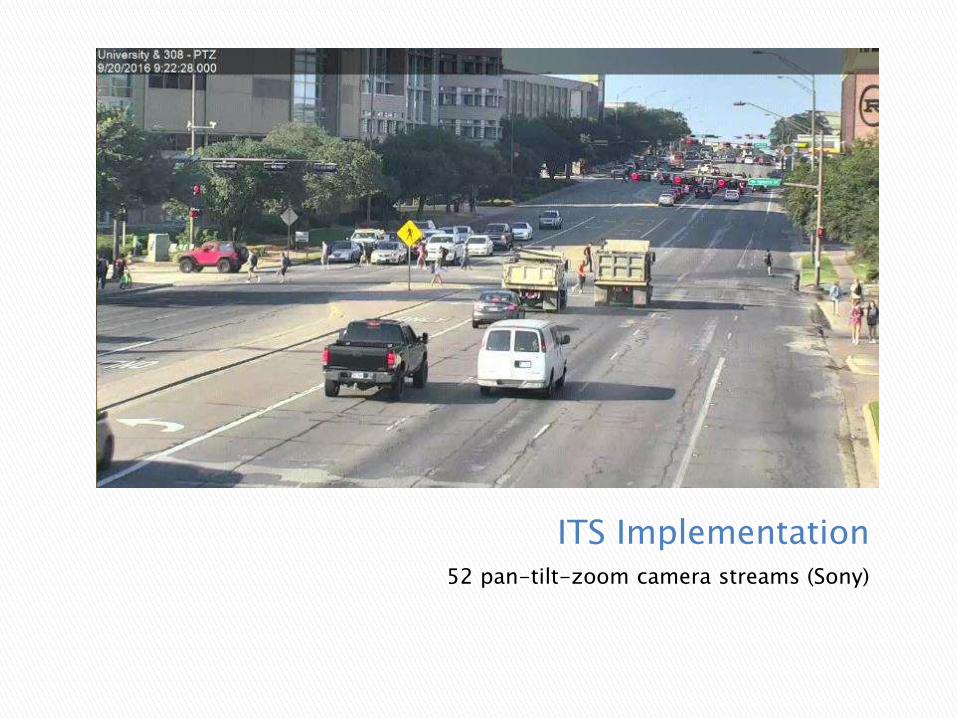
ITS Implementation52 pan-tilt-zoom camera streams (Sony)
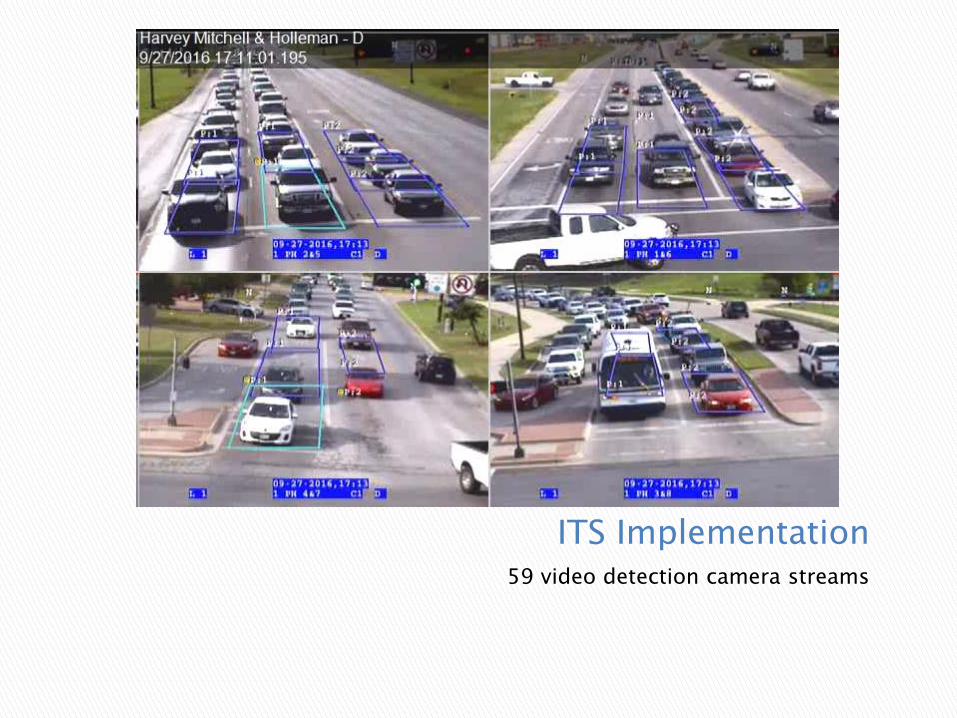
ITS Implementation59 video detection camera streams
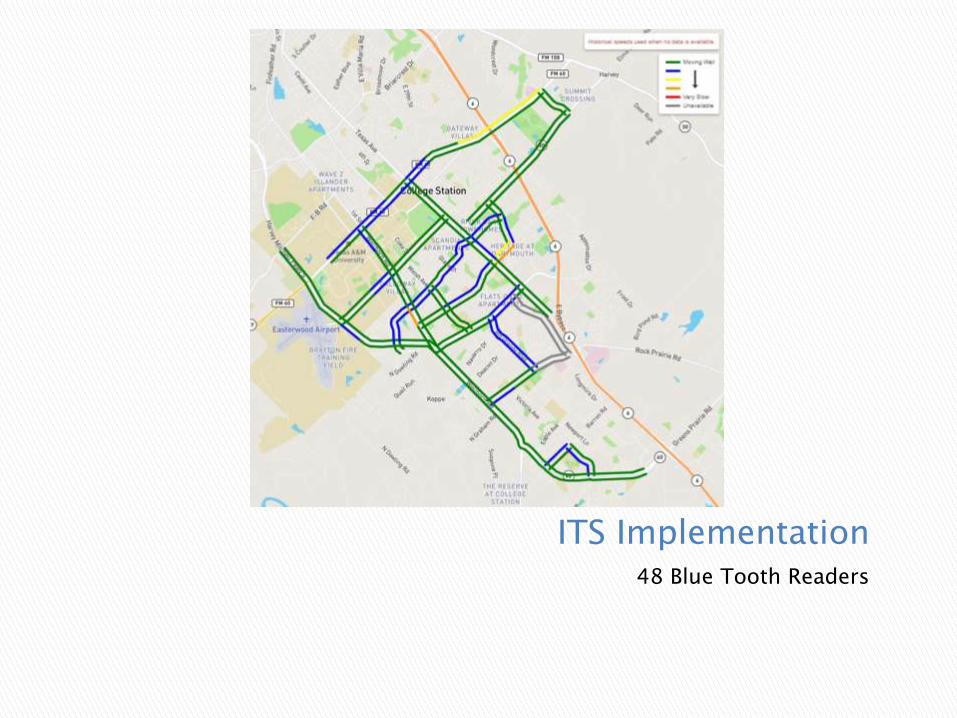
ITS Implementation48 Blue Tooth Readers
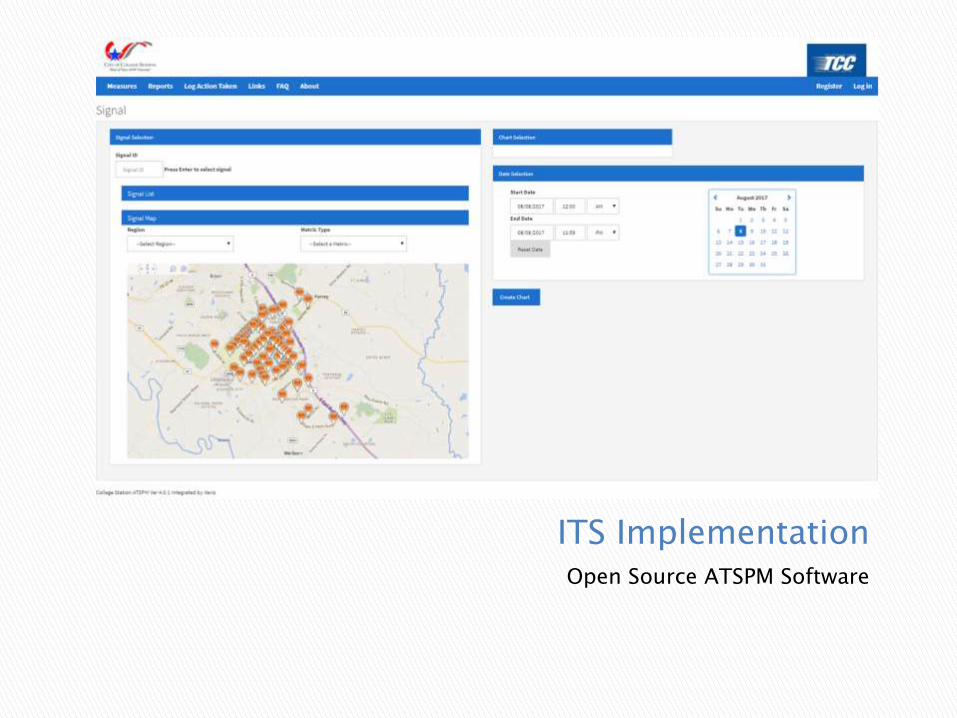
ITS ImplementationOpen Source ATSPM Software
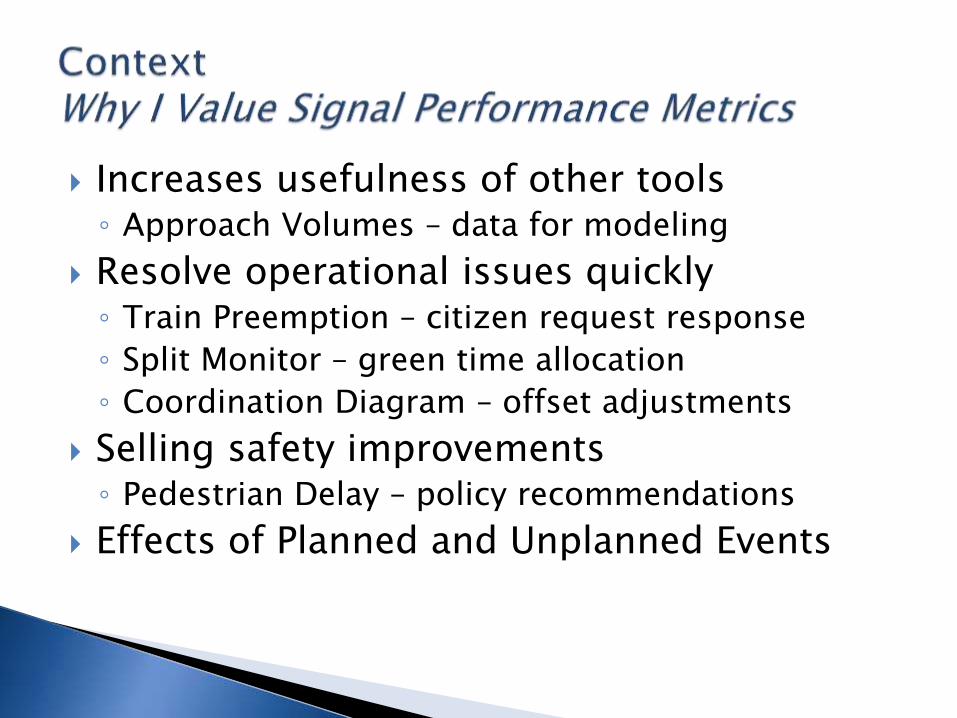
Increases usefulness of other tools◦ Approach Volumes – data for modeling
Resolve operational issues quickly◦ Train Preemption – citizen request response
◦ Split Monitor – green time allocation
◦ Coordination Diagram – offset adjustments
Selling safety improvements◦ Pedestrian Delay – policy recommendations
Effects of Planned and Unplanned Events
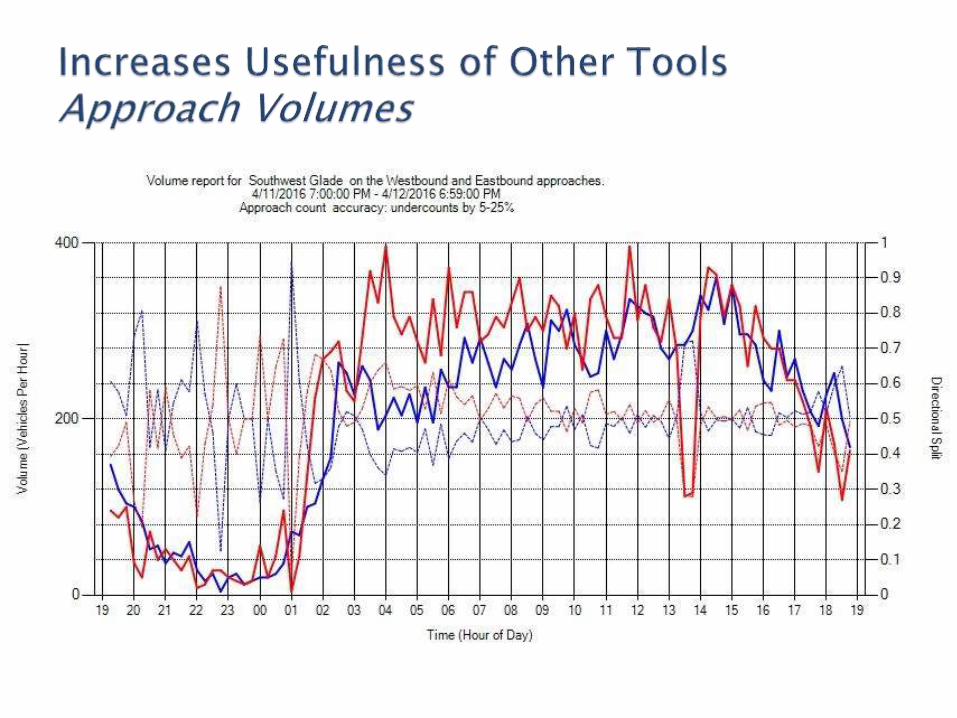
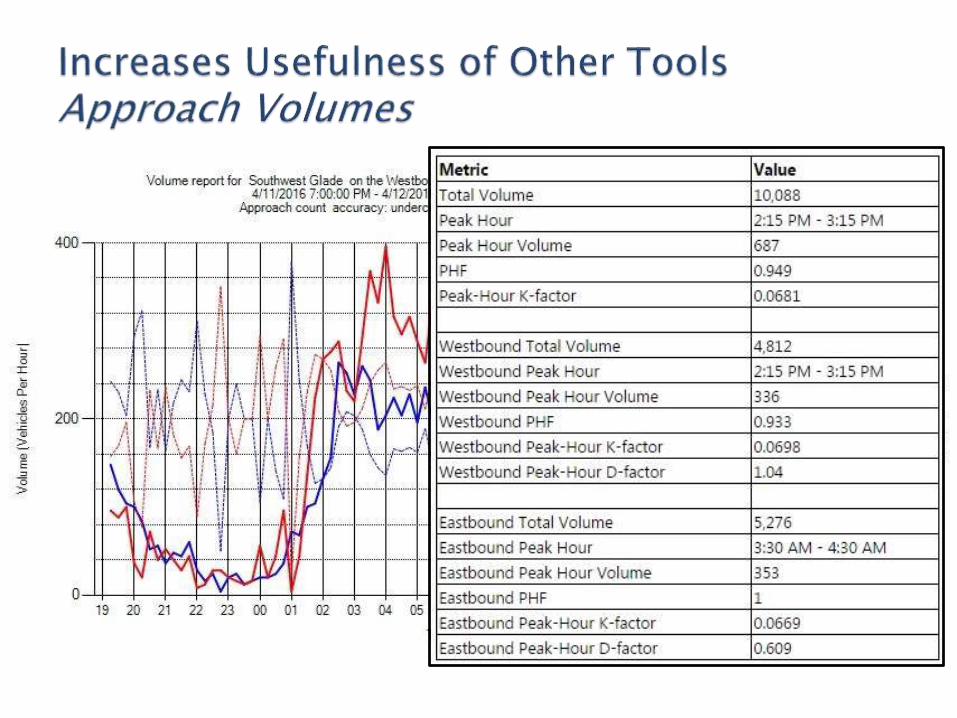
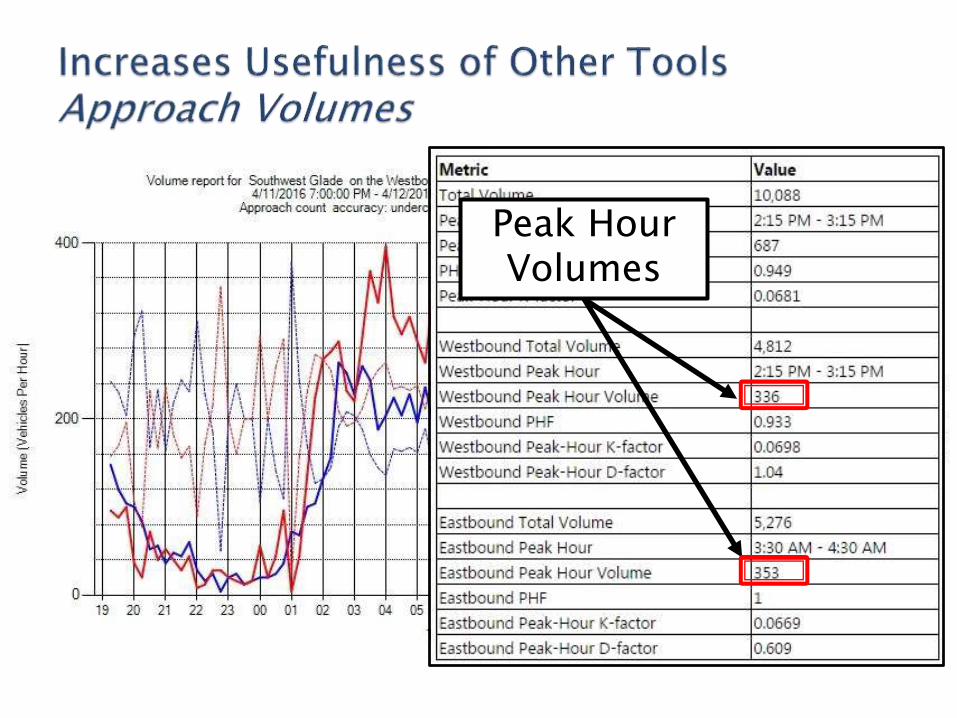
Peak Hour Volumes
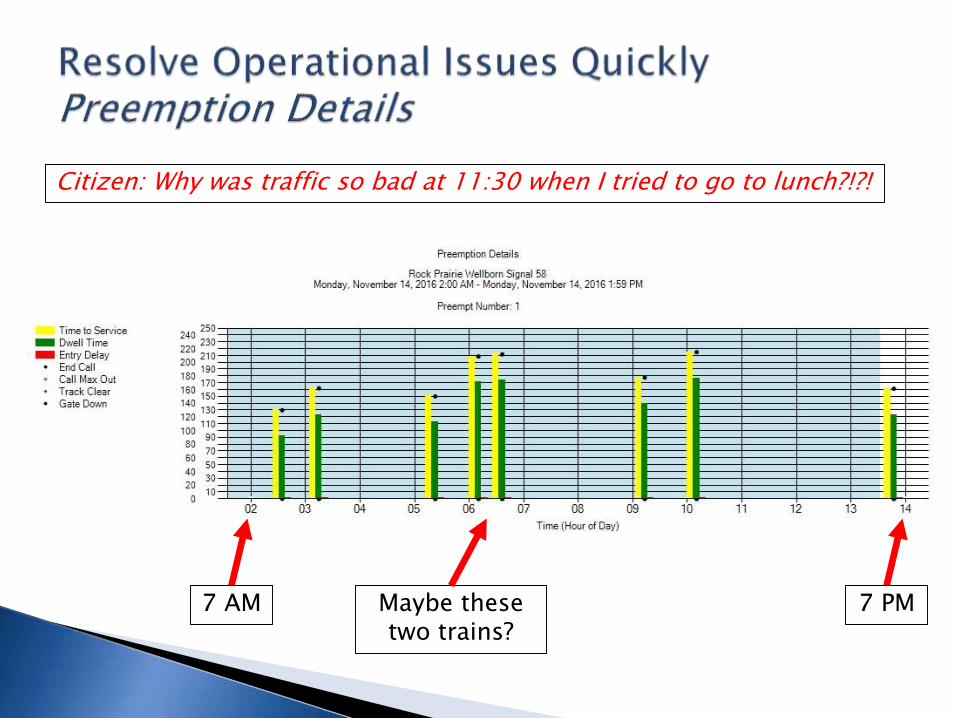
7 AM 7 PMMaybe these two trains?
Citizen: Why was traffic so bad at 11:30 when I tried to go to lunch?!?!
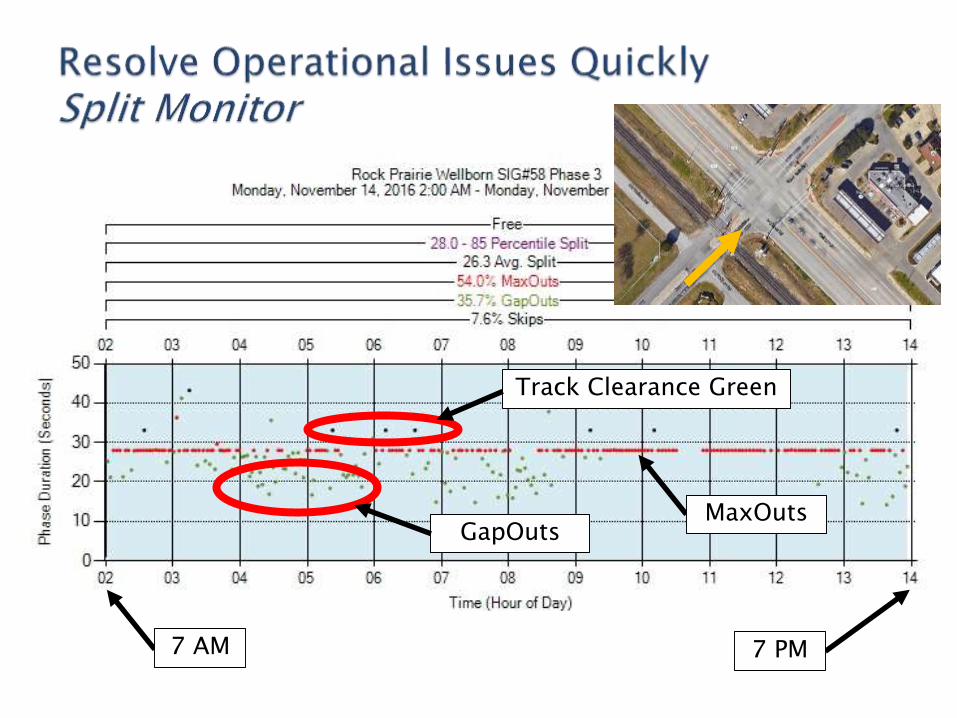
MaxOutsGapOuts
Track Clearance Green
7 AM 7 PM
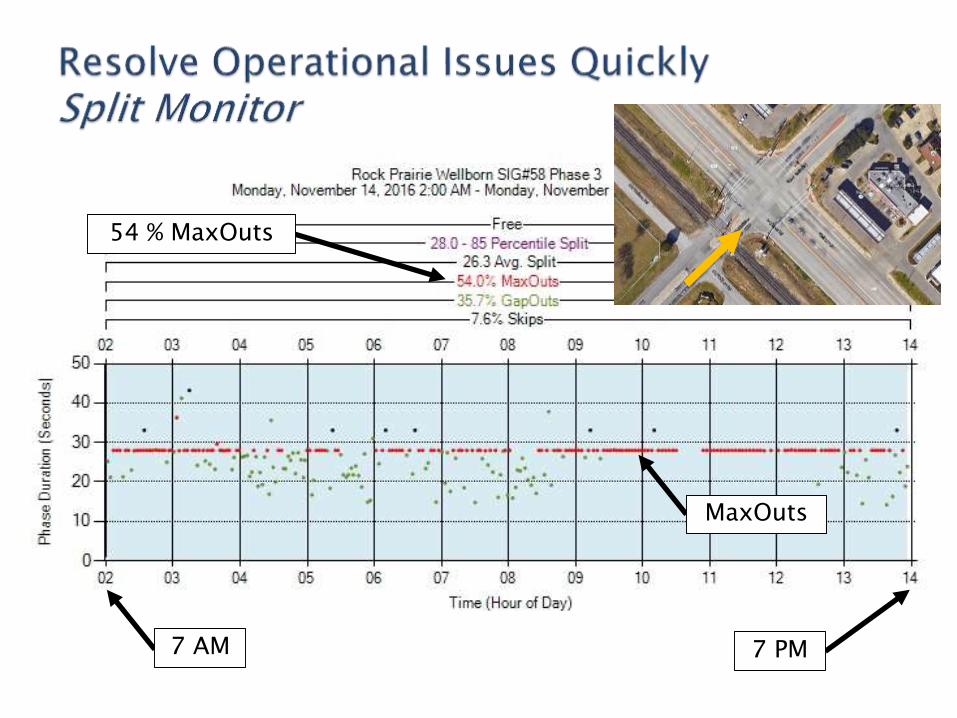
MaxOuts
7 AM 7 PM
54 % MaxOuts
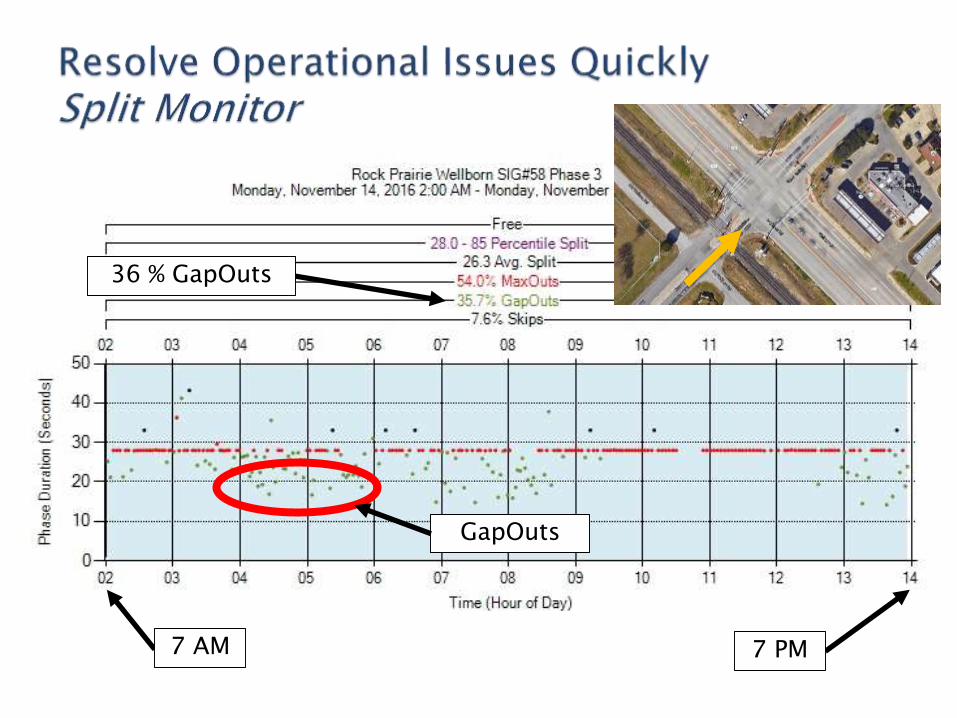
GapOuts
7 AM 7 PM
36 % GapOuts
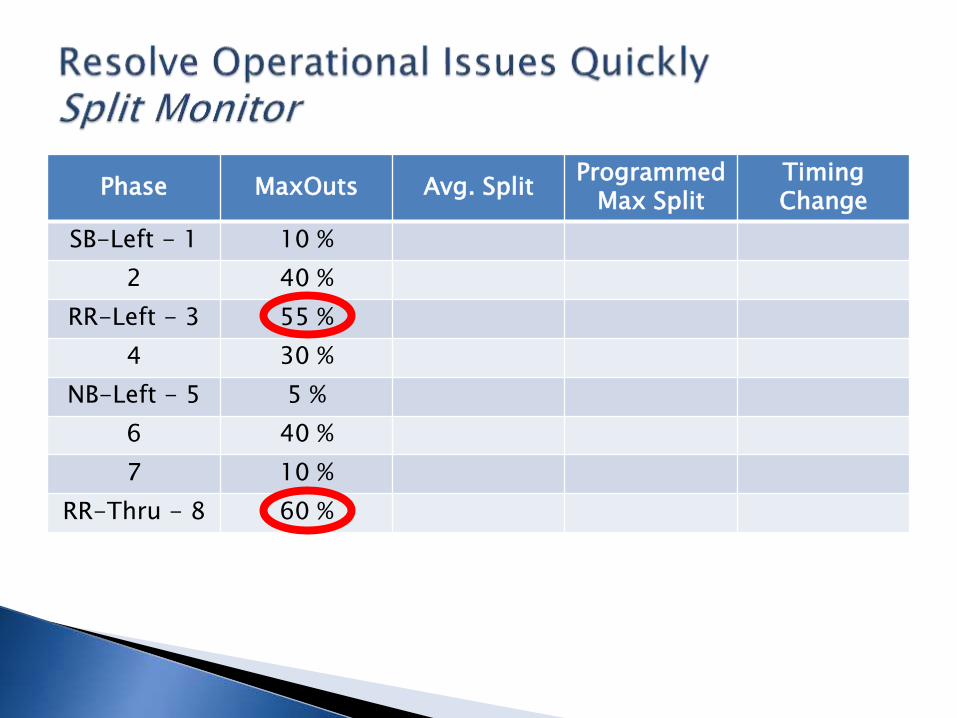
Phase MaxOuts Avg. SplitProgrammed
Max SplitTiming Change
SB-Left - 1 10 %
2 40 %
RR-Left - 3 55 %
4 30 %
NB-Left - 5 5 %
6 40 %
7 10 %
RR-Thru - 8 60 %

Phase MaxOuts Avg. SplitProgrammed
Max SplitTiming Change
SB-Left - 1 10 %
2 40 %
RR-Left - 3 55 %
4 30 %
NB-Left - 5 5 %
6 40 %
7 10 %
RR-Thru - 8 60 %

Phase MaxOuts Avg. SplitProgrammed
Max SplitTiming Change
SB-Left - 1 10 %
2 40 %
RR-Left - 3 55 %
4 30 %
NB-Left - 5 5 %
6 40 %
7 10 %
RR-Thru - 8 60 %
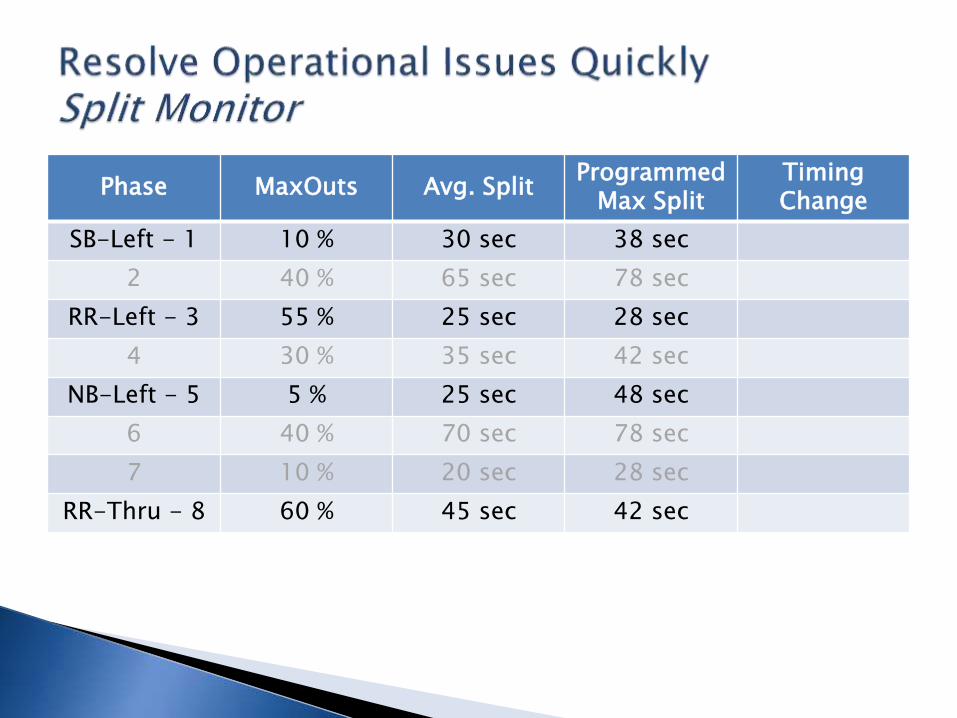
Phase MaxOuts Avg. SplitProgrammed
Max SplitTiming Change
SB-Left - 1 10 % 30 sec 38 sec
2 40 % 65 sec 78 sec
RR-Left - 3 55 % 25 sec 28 sec
4 30 % 35 sec 42 sec
NB-Left - 5 5 % 25 sec 48 sec
6 40 % 70 sec 78 sec
7 10 % 20 sec 28 sec
RR-Thru - 8 60 % 45 sec 42 sec
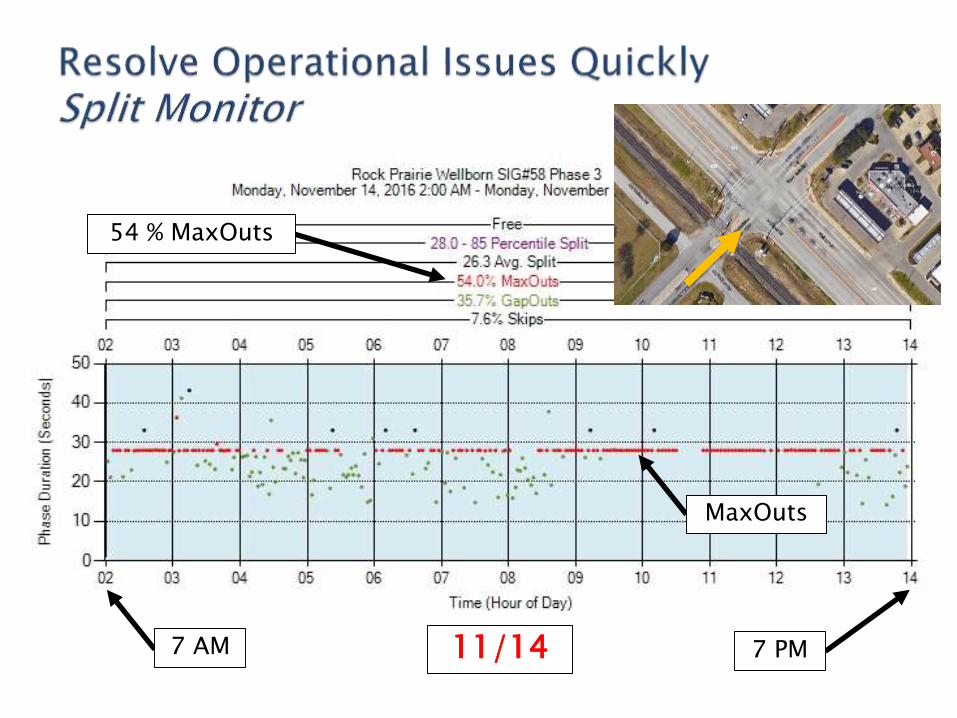
MaxOuts
7 AM 7 PM
54 % MaxOuts
11/14
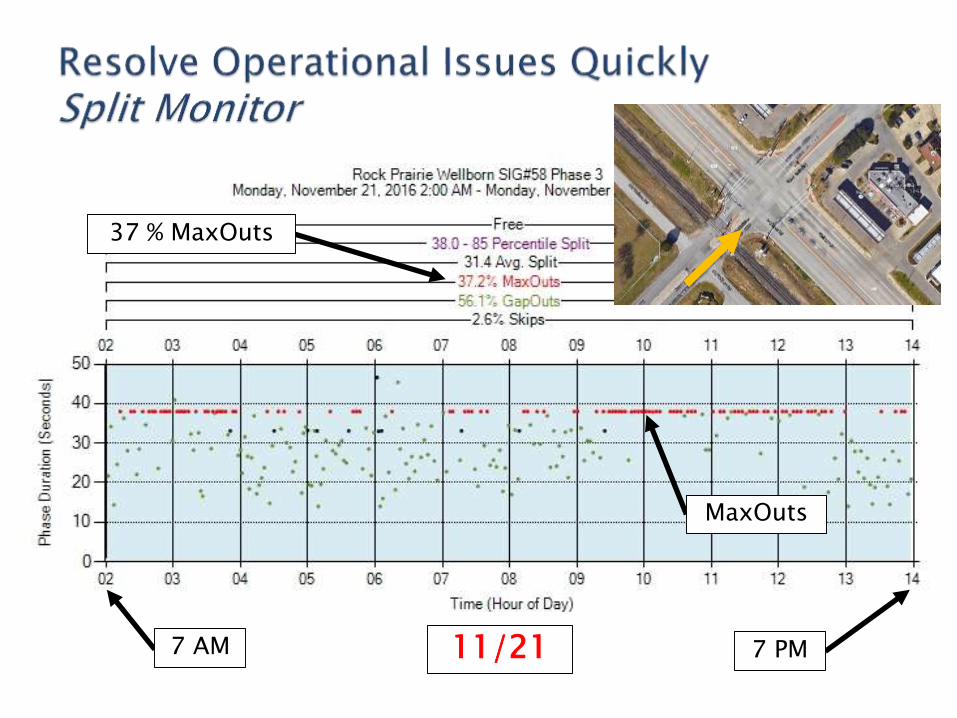
MaxOuts
7 AM 7 PM
37 % MaxOuts
11/21
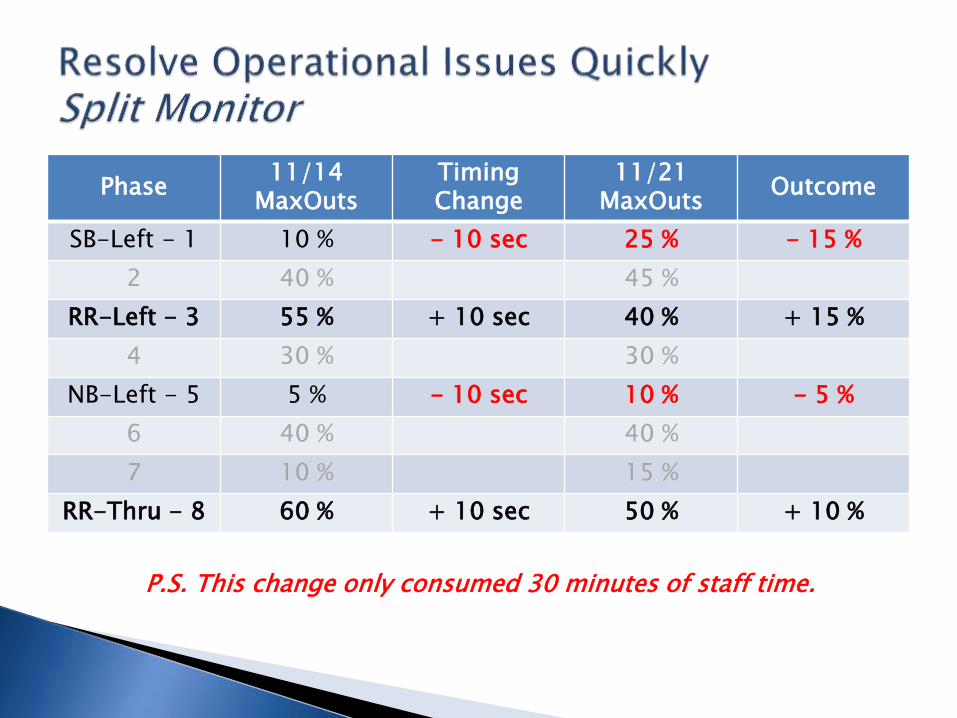
Phase11/14
MaxOutsTiming Change
11/21MaxOuts
Outcome
SB-Left - 1 10 % - 10 sec 25 % - 15 %
2 40 % 45 %
RR-Left - 3 55 % + 10 sec 40 % + 15 %
4 30 % 30 %
NB-Left - 5 5 % - 10 sec 10 % - 5 %
6 40 % 40 %
7 10 % 15 %
RR-Thru - 8 60 % + 10 sec 50 % + 10 %
P.S. This change only consumed 30 minutes of staff time.
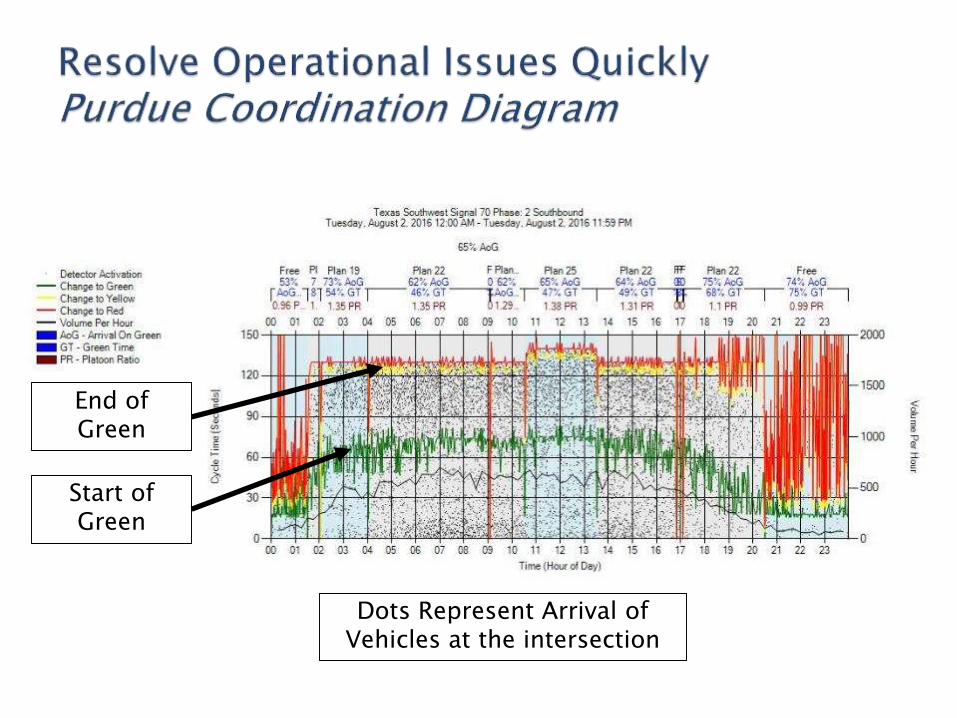
Start of Green
End of Green
Dots Represent Arrival of Vehicles at the intersection
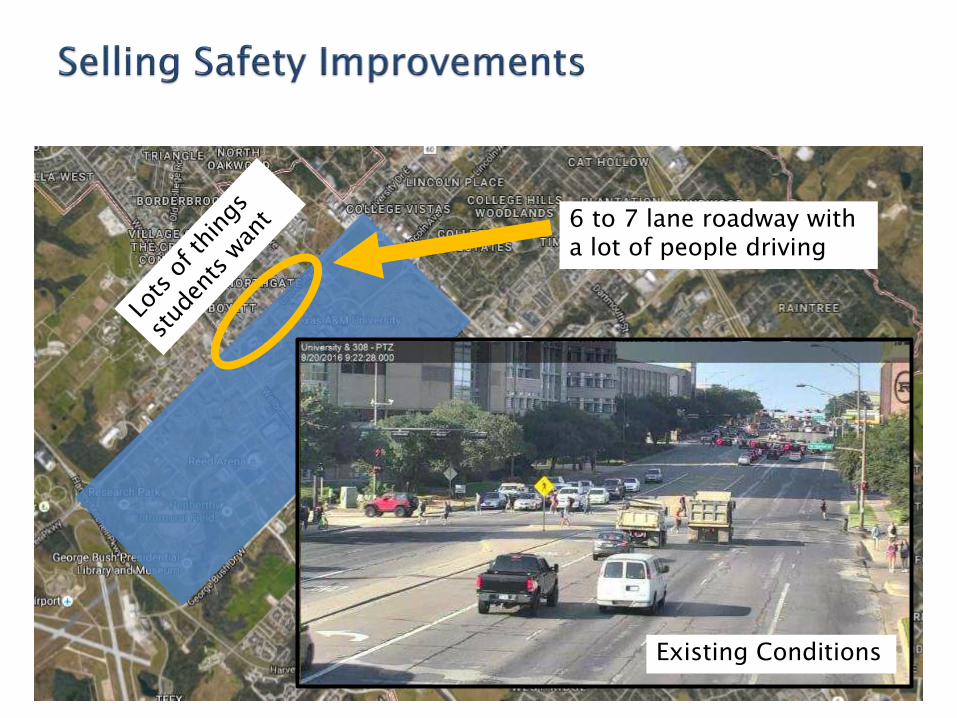
6 to 7 lane roadway with a lot of people driving
Existing Conditions
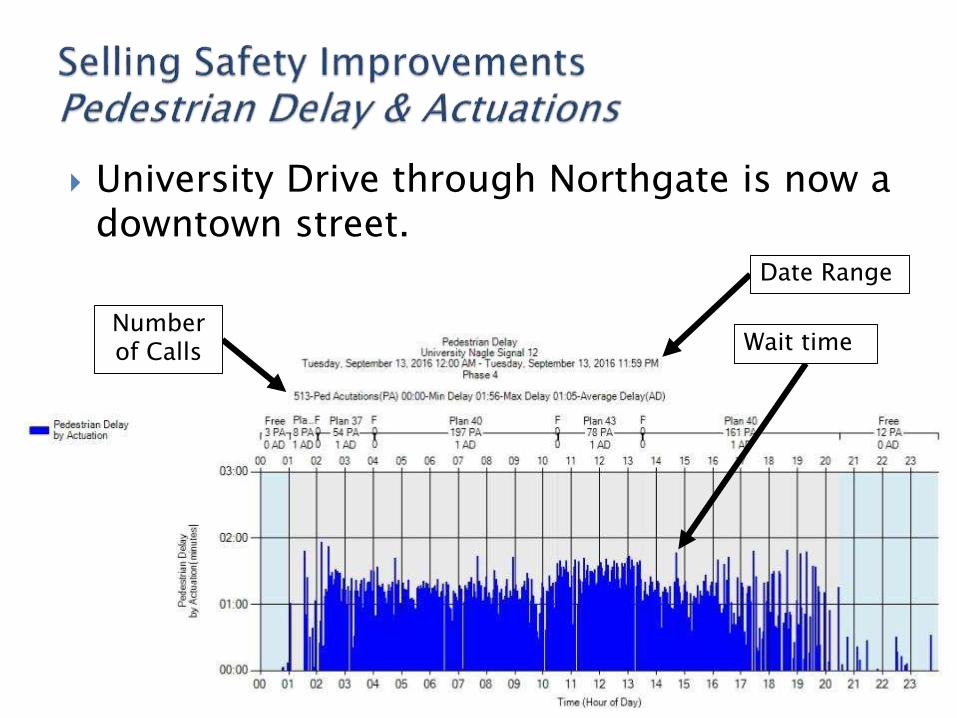
University Drive through Northgate is now a downtown street.
Wait timeNumber of Calls
Date Range
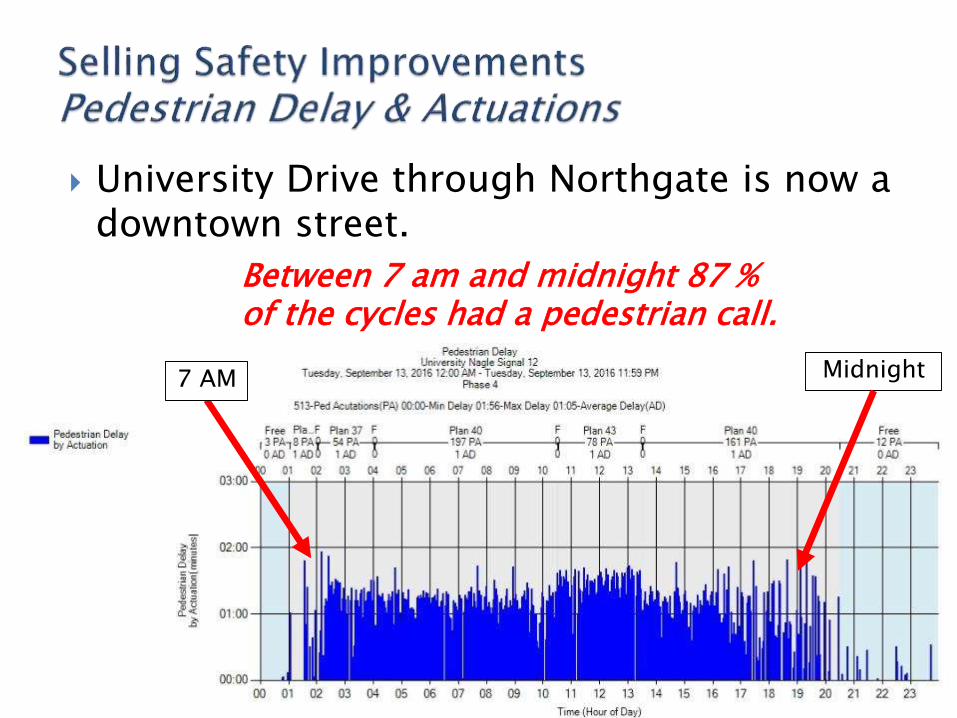
University Drive through Northgate is now a downtown street.
7 AM Midnight
Between 7 am and midnight 87 % of the cycles had a pedestrian call.
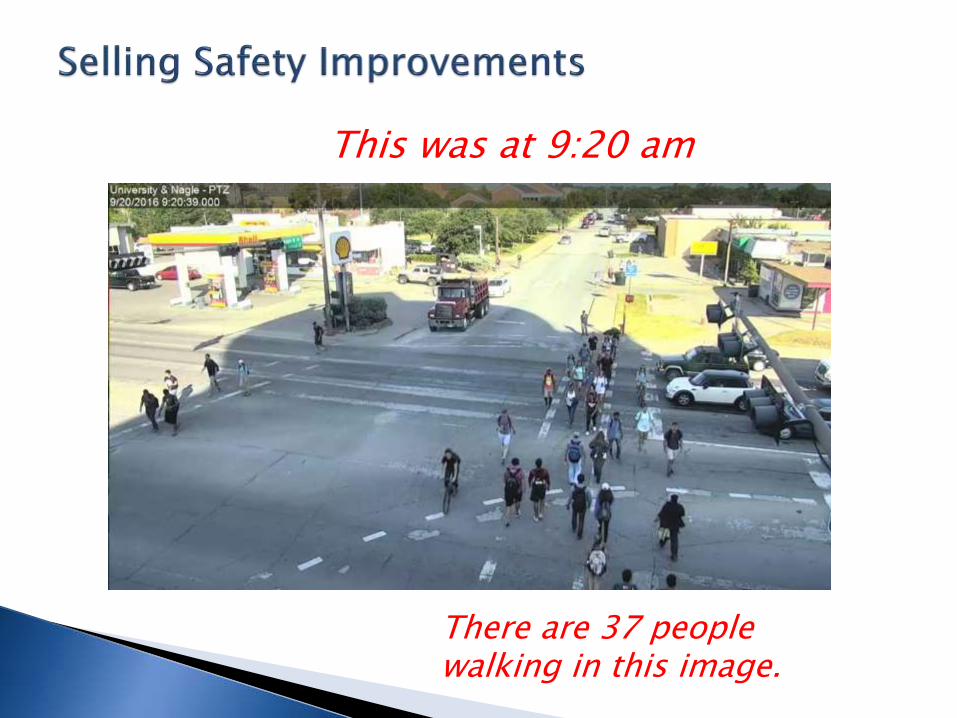
This was at 9:20 am
There are 37 people walking in this image.
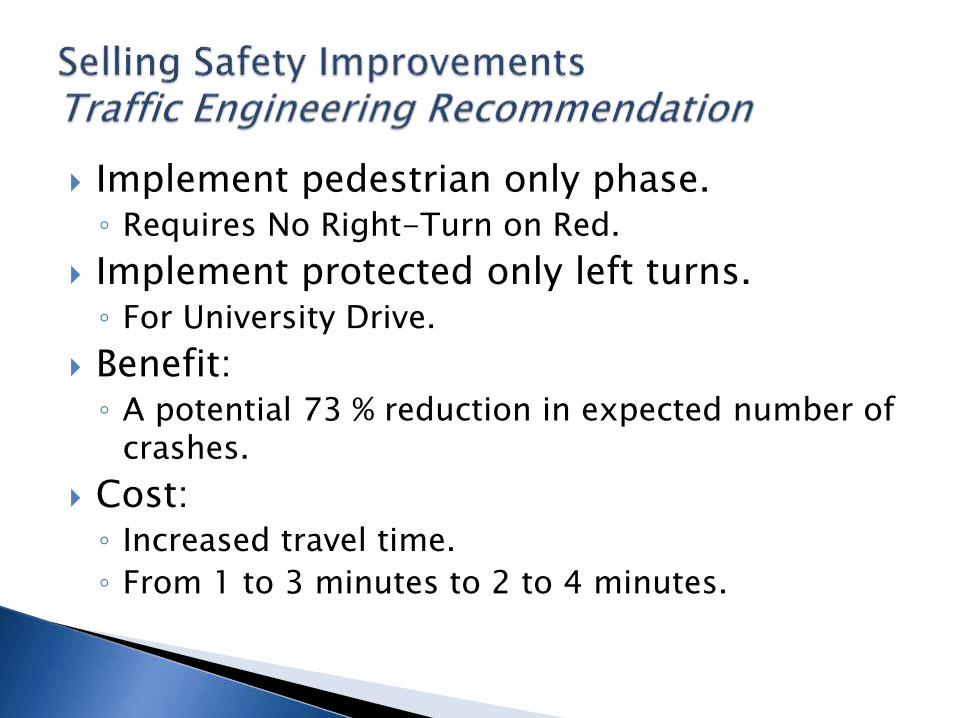
Implement pedestrian only phase.◦ Requires No Right-Turn on Red.
Implement pedestrian only phase.◦ Requires No Right-Turn on Red.
Implement protected only left turns. ◦ For University Drive.
Implement pedestrian only phase.◦ Requires No Right-Turn on Red.
Implement protected only left turns. ◦ For University Drive.
Benefit:◦ A potential 73 % reduction in expected number of
crashes.
Implement pedestrian only phase.◦ Requires No Right-Turn on Red.
Implement protected only left turns. ◦ For University Drive.
Benefit:◦ A potential 73 % reduction in expected number of
crashes.
Cost:◦ Increased travel time.
◦ From 1 to 3 minutes to 2 to 4 minutes.
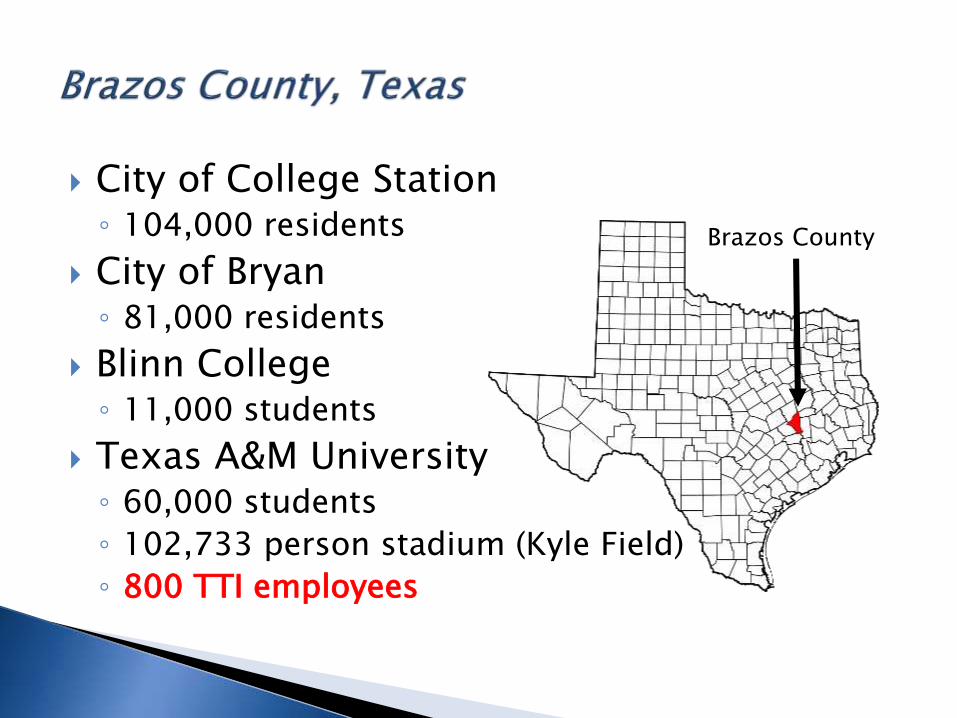
City of College Station◦ 104,000 residents
City of Bryan◦ 81,000 residents
Blinn College◦ 11,000 students
Texas A&M University◦ 60,000 students
◦ 102,733 person stadium (Kyle Field)
◦ 800 TTI employees
Brazos County