Embed Size (px)
Citation preview
Congressional Budget Office
Understanding the 2016 Budget Outlook
Presentation to the American Academy of Actuaries Washington, D.C.
November 4, 2016
Keith Hall Director
This presentation draws on An Update to the Budget and Economic Outlook: 2016 to 2026 (August 2016), www.cbo.gov/publication/51908; The Long-Term Budget Outlook (July 2016), www.cbo.gov/publication/51580; Federal Subsidies for Health Insurance Coverage for People Under Age 65: 2016 to 2026 (March 2016), www.cbo.gov/publication/51385; and related CBO publications.

1 CO N GR ES S IO N A L B UDGE T O F F IC E
CBO’s Budget Projections Through 2026 as of August 2016

2 CO N GR ES S IO N A L B UDGE T O F F IC E
CBO provides objective, nonpartisan information to the Congress.
CBO produces estimates of the effects of changes in federal policies and makes baseline projections of federal spending, revenues, and deficits under current law.
3 CO N GR ES S IO N A L B UDGE T O F F IC E
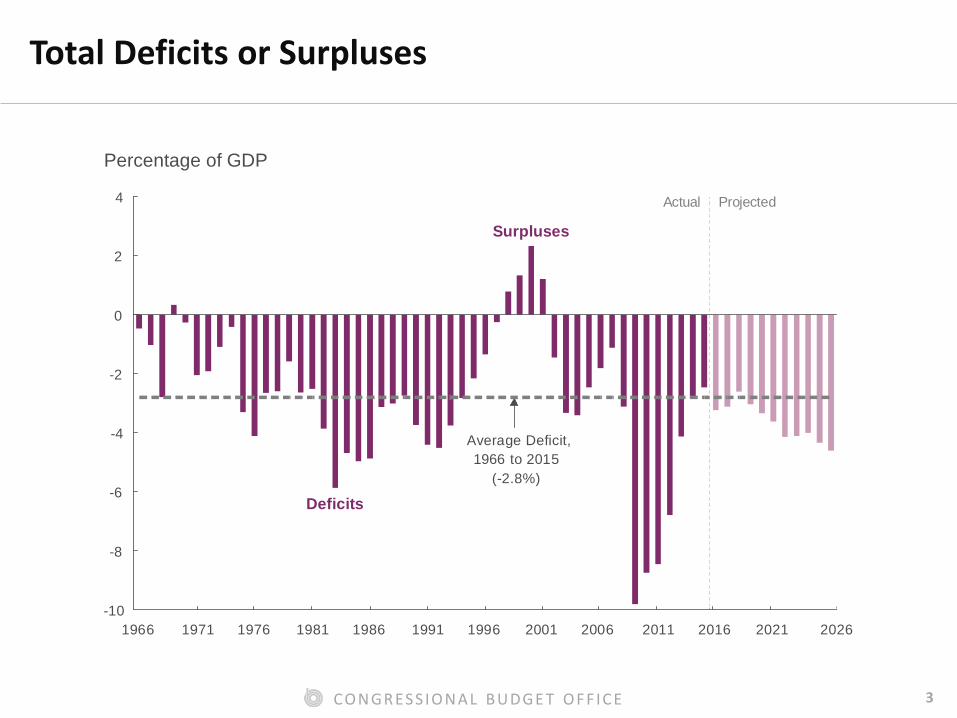
Total Deficits or Surpluses
Percentage of GDP
Actual Projected
Deficits
Surpluses
Average Deficit,1966 to 2015
(-2.8%)
1966 1971 1976 1981 1986 1991 1996 2001 2006 2011 2016 2021 2026-10
-8
-6
-4
-2
0
2
4
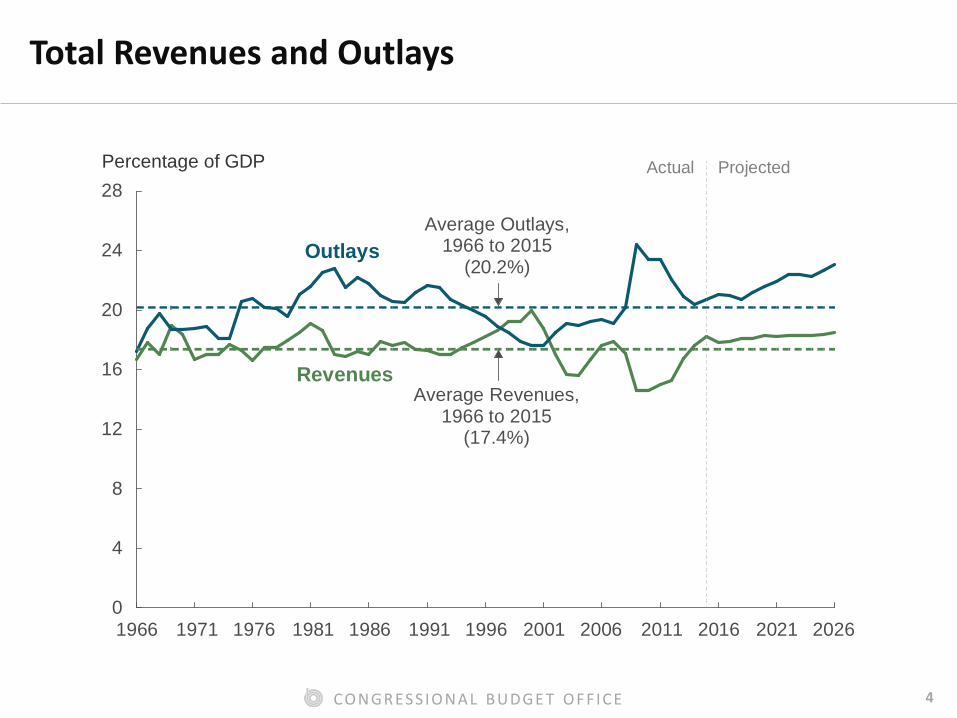
4 CO N GR ES S IO N A L B UDGE T O F F IC E
Total Revenues and Outlays
Percentage of GDP
1966 1971 1976 1981 1986 1991 1996 2001 2006 2011 2016 2021 20260
4
8
12
16
20
24
28
Outlays
Revenues
Average Outlays,1966 to 2015
(20.2%)
Average Revenues,1966 to 2015
(17.4%)
Actual Projected
5 CO N GR ES S IO N A L B UDGE T O F F IC E
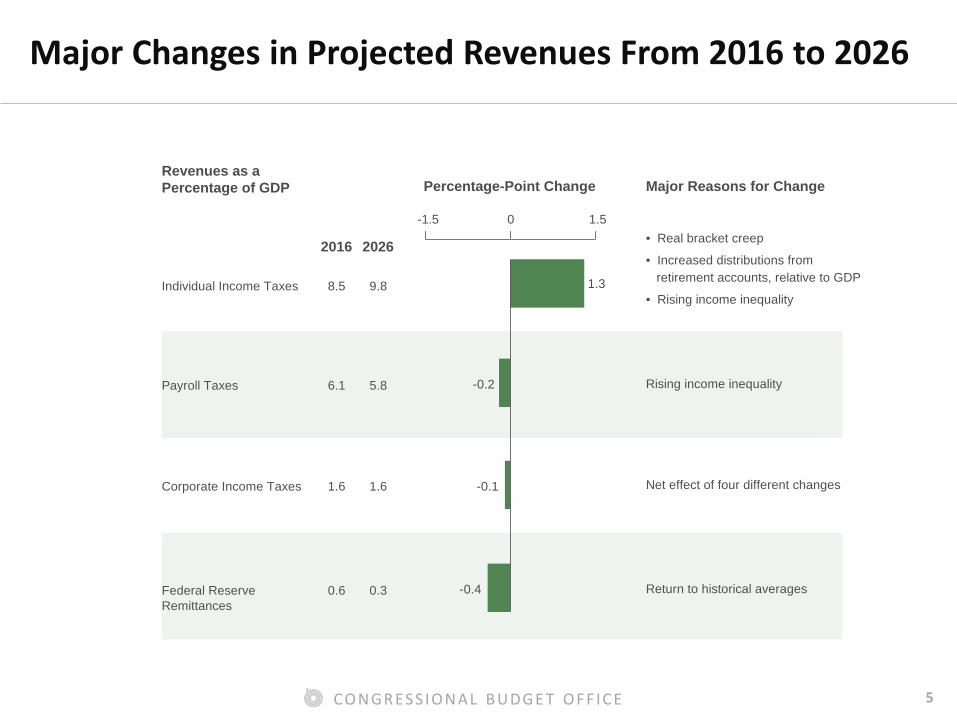
Major Changes in Projected Revenues From 2016 to 2026
Percentage-Point ChangeRevenues as aPercentage of GDP Major Reasons for Change
Individual Income Taxes
• Real bracket creep
• Increased distributions from retirement accounts, relative to GDP
• Rising income inequality
Payroll Taxes
Corporate Income Taxes
Federal ReserveRemittances
2016
8.5 9.8
6.1 5.8
1.6 1.6
0.6 0.3
2026
Rising income inequality
Net effect of four different changes
Return to historical averages
1.3
-0.2
-0.1
-0.4
-1.5 0 1.5
6 CO N GR ES S IO N A L B UDGE T O F F IC E
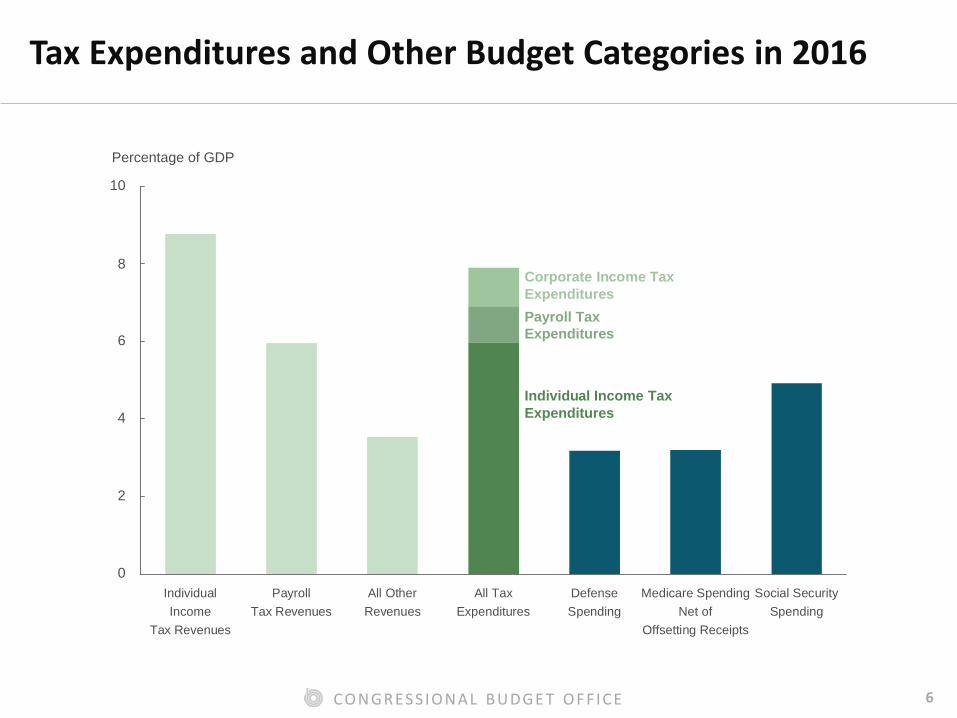
Tax Expenditures and Other Budget Categories in 2016
IndividualIncome
Tax Revenues
PayrollTax Revenues
All OtherRevenues
All TaxExpenditures
DefenseSpending
Medicare SpendingNet of
Offsetting Receipts
Social SecuritySpending
0
2
4
6
8
10
Corporate Income TaxExpendituresPayroll TaxExpenditures
Individual Income TaxExpenditures
Percentage of GDP
7 CO N GR ES S IO N A L B UDGE T O F F IC E
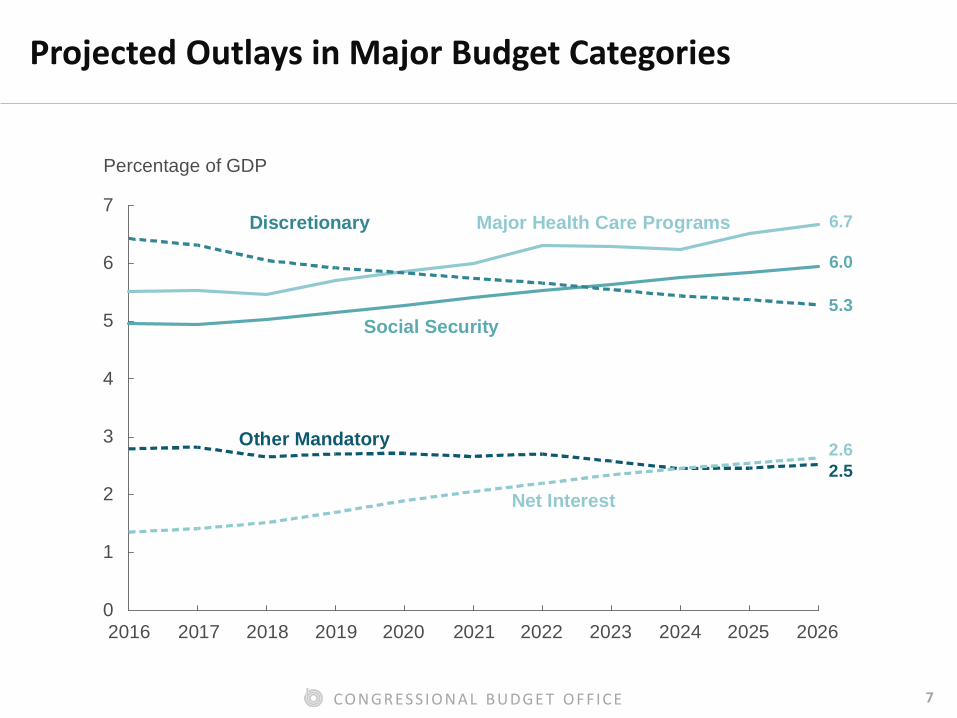
Projected Outlays in Major Budget Categories
Percentage of GDP
2016 2017 2018 2019 2020 2021 2022 2023 2024 2025 20260
1
2
3
4
5
6
7Discretionary Major Health Care Programs
Social Security
Net Interest
Other Mandatory
6.7
6.0
5.3
2.62.5
8 CO N GR ES S IO N A L B UDGE T O F F IC E
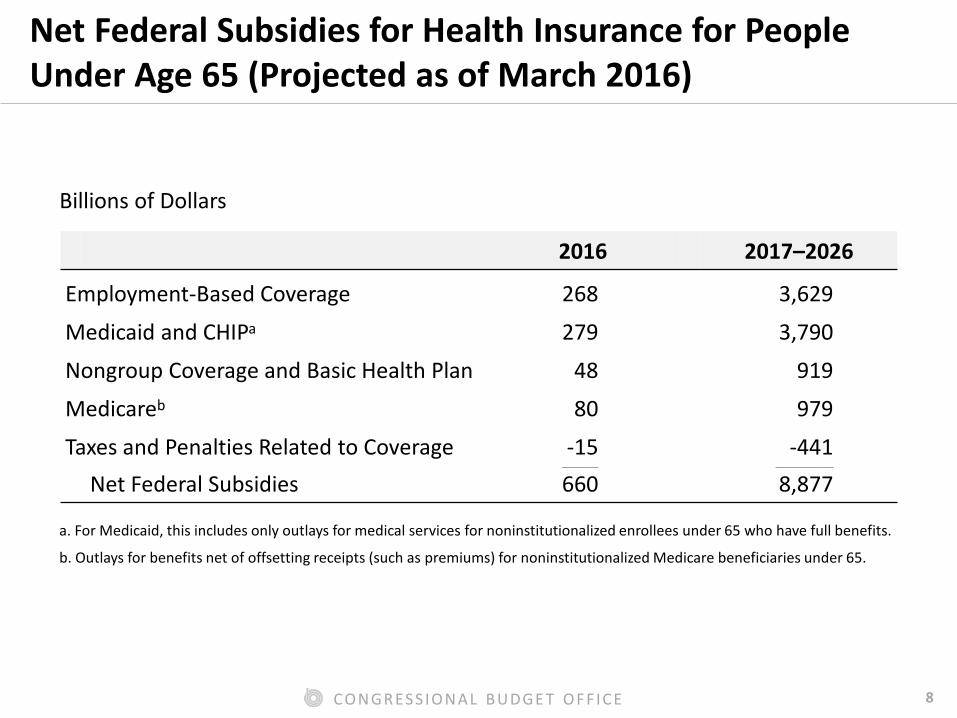
Net Federal Subsidies for Health Insurance for People Under Age 65 (Projected as of March 2016)
Billions of Dollars
2016 2017–2026
Employment-Based Coverage 268 3,629
Medicaid and CHIPa 279 3,790
Nongroup Coverage and Basic Health Plan 48 919
Medicareb 80 979
Taxes and Penalties Related to Coverage -15 -441 ______________ ______________________
Net Federal Subsidies 660 8,877
a. For Medicaid, this includes only outlays for medical services for noninstitutionalized enrollees under 65 who have full benefits.
b. Outlays for benefits net of offsetting receipts (such as premiums) for noninstitutionalized Medicare beneficiaries under 65.

9 CO N GR ES S IO N A L B UDGE T O F F IC E
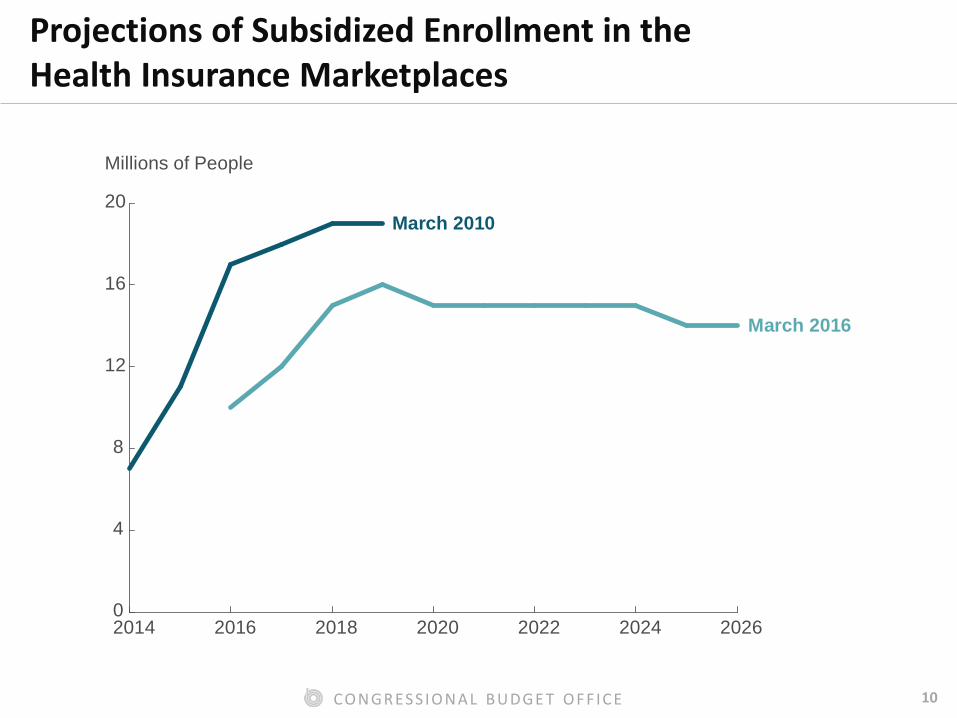
CBO usually updates its baseline projections three times a year. The spring baseline is the major update for the Affordable Care Act (ACA) marketplaces.
Types of changes include these:
• Changes in law;
• Changes in CBO’s economic forecast; and
• Technical changes from new information, data, regulations, and modeling assumptions.
10 CO N GR ES S IO N A L B UDGE T O F F IC E
Projections of Subsidized Enrollment in the Health Insurance Marketplaces
Millions of People
2014 2016 2018 2020 2022 2024 20260
4
8
12
16
20March 2010
March 2016
11 CO N GR ES S IO N A L B UDGE T O F F IC E
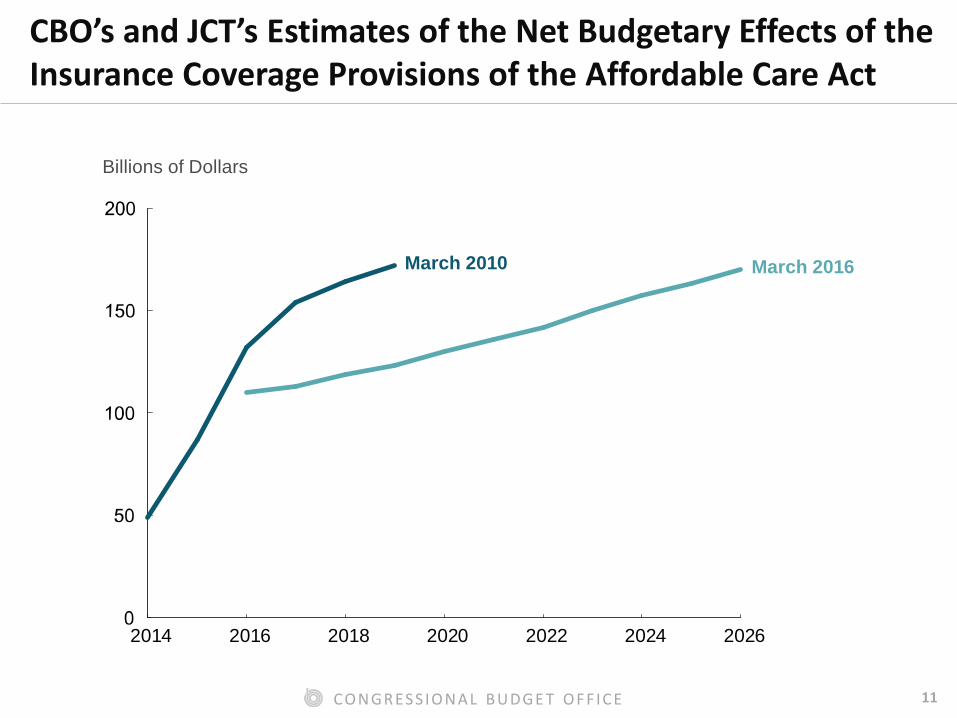
CBO’s and JCT’s Estimates of the Net Budgetary Effects of the Insurance Coverage Provisions of the Affordable Care Act
Billions of Dollars
2014 2016 2018 2020 2022 2024 2026
March 2010 March 2016

12 CO N GR ES S IO N A L B UDGE T O F F IC E
Factors contributing to the lower projections include these:
• Slower-than-expected growth in enrollment through the health insurance marketplaces;
• The slowdown in the overall growth of health care costs; and
• The U.S. Supreme Court’s decision that made the expansion of eligibility for Medicaid optional for states.

13 CO N GR ES S IO N A L B UDGE T O F F IC E
CBO’s Budget Projections Through 2046 as of July 2016

14 CO N GR ES S IO N A L B UDGE T O F F IC E
Federal Debt, Outlays, and Revenues
Percentage of GDP
2000 2005 2010 2015 2020 2025 2030 2035 2040 2045
0
50
100
150
Federal Debt Heldby the Public
Actual Extended Baseline Projection
Outlays
Revenues
15 CO N GR ES S IO N A L B UDGE T O F F IC E
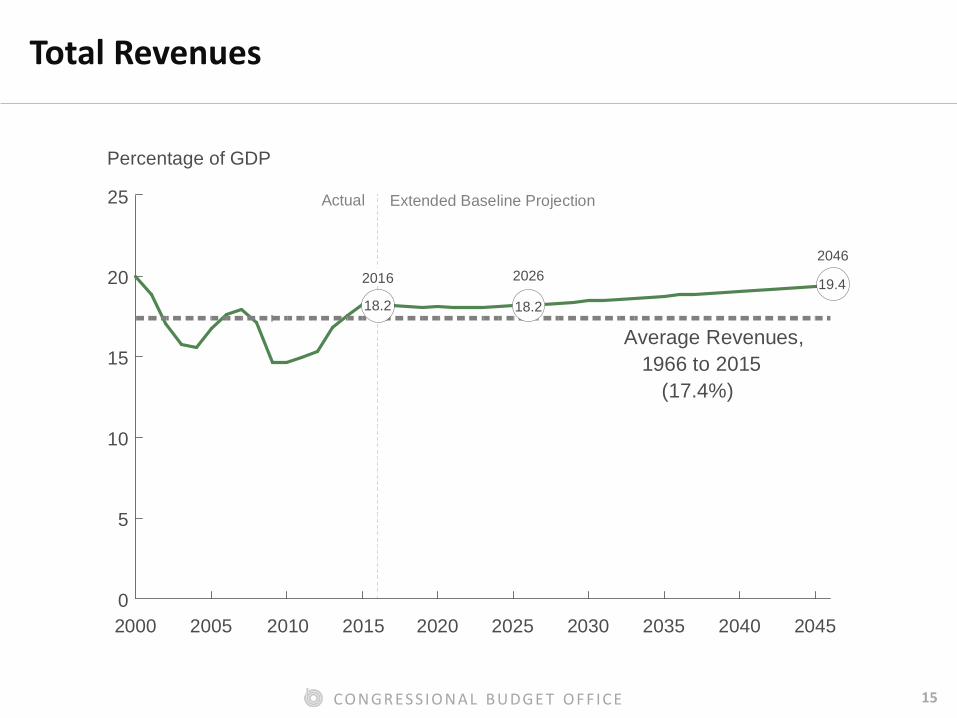
Total Revenues
Percentage of GDP
2016
2000 2005 2010 2015 2020 2025 2030 2035 2040 20450
5
10
15
20
25 Actual Extended Baseline Projection
Average Revenues,1966 to 2015
(17.4%)
20262046
18.2 18.219.4
16 CO N GR ES S IO N A L B UDGE T O F F IC E
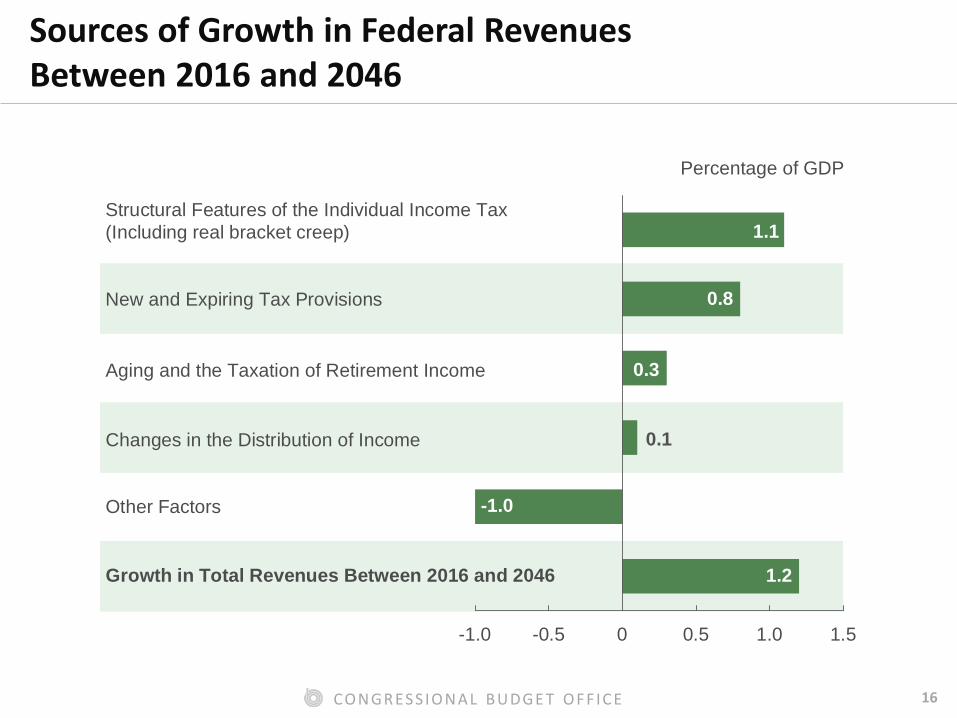
Sources of Growth in Federal Revenues Between 2016 and 2046
Percentage of GDP
-1.0 -0.5 0 0.5 1.0 1.5
Growth in Total Revenues Between 2016 and 2046
Other Factors
Changes in the Distribution of Income
Aging and the Taxation of Retirement Income
Structural Features of the Individual Income Tax(Including real bracket creep)
New and Expiring Tax Provisions
1.1
0.8
0.3
0.1
-1.0
1.2

17 CO N GR ES S IO N A L B UDGE T O F F IC E
Components of Federal Spending
Percentage of GDP
Social Security
Other NoninterestSpending
Major Health CarePrograms
Net Interest
Actual Extended Baseline Projection
2000 2005 2010 2015 2020 2025 2030 2035 2040 2045
15
10
5
0
18 CO N GR ES S IO N A L B UDGE T O F F IC E
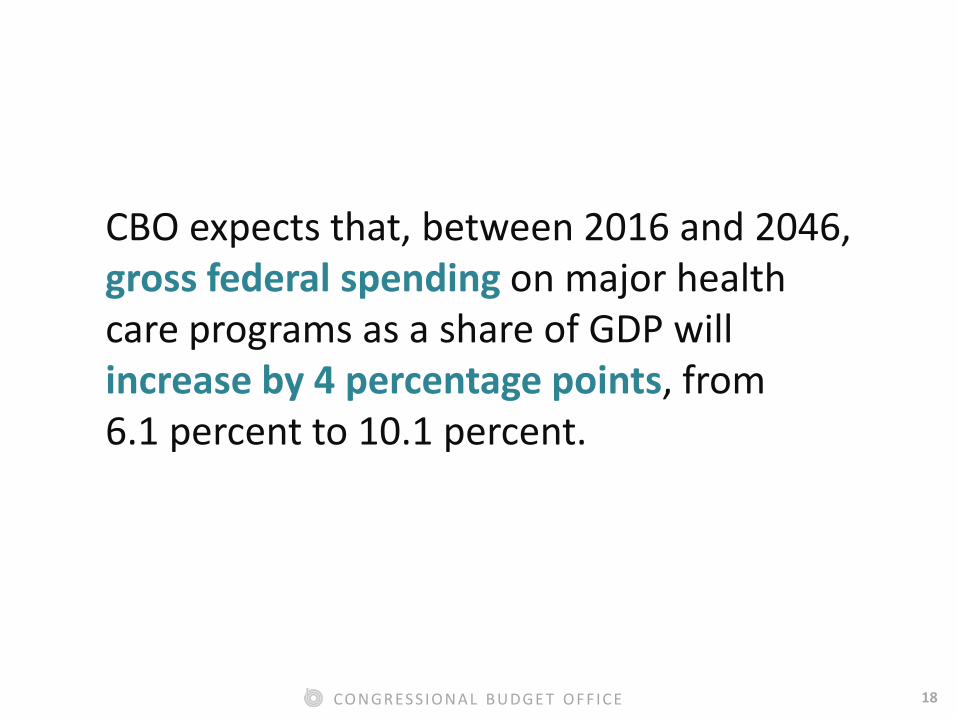
CBO expects that, between 2016 and 2046, gross federal spending on major health care programs as a share of GDP will increase by 4 percentage points, from 6.1 percent to 10.1 percent.
19 CO N GR ES S IO N A L B UDGE T O F F IC E
Of that total, 2.2 percentage points come from excess cost growth, meaning that spending per beneficiary, adjusted for demographic changes, will grow more quickly than potential GDP per capita.
The other 1.8 percentage points come from the aging of the population, mostly because aging makes more people eligible for Medicare and increases costs per enrollee.
20 CO N GR ES S IO N A L B UDGE T O F F IC E
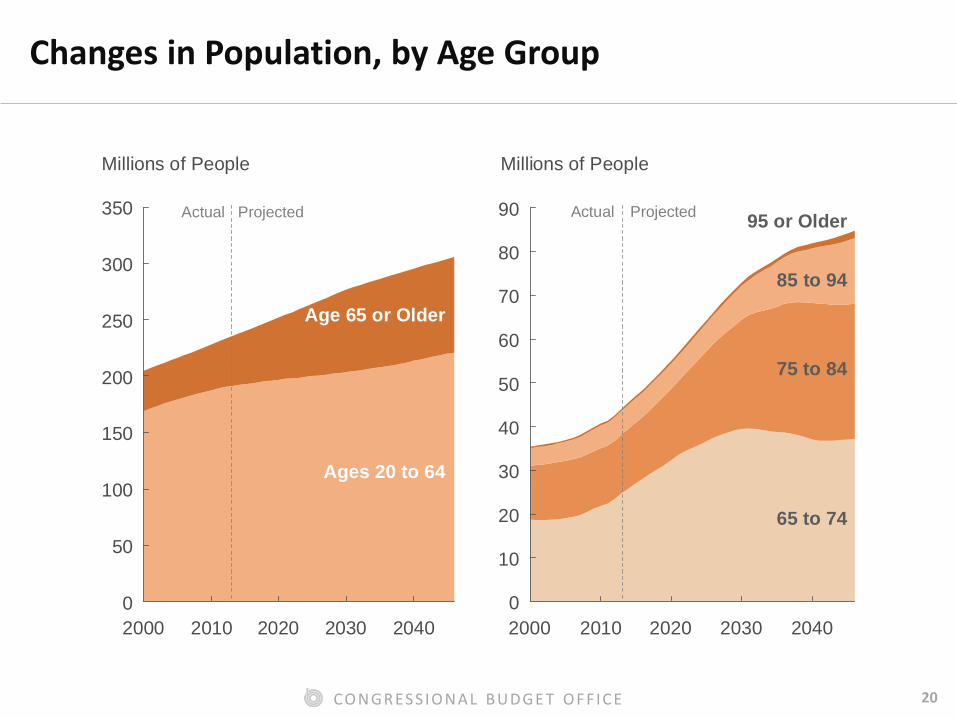
Changes in Population, by Age Group
Millions of People Millions of People
2000 2010 2020 2030 20400
50
100
150
200
250
300
350
Age 65 or Older
Ages 20 to 64
Actual Projected
2000 2010 2020 2030 20400
10
20
30
40
50
60
70
80
90
65 to 74
75 to 84
85 to 94
95 or OlderActual Projected

21 CO N GR ES S IO N A L B UDGE T O F F IC E
Tax Revenues and Outlays for Social Security
Percentage of GDP
2000 2005 2010 2015 2020 2025 2030 2035 2040 20450
1
2
3
4
5
6
7 Actual Projected
Outlays
Tax Revenues
22 CO N GR ES S IO N A L B UDGE T O F F IC E
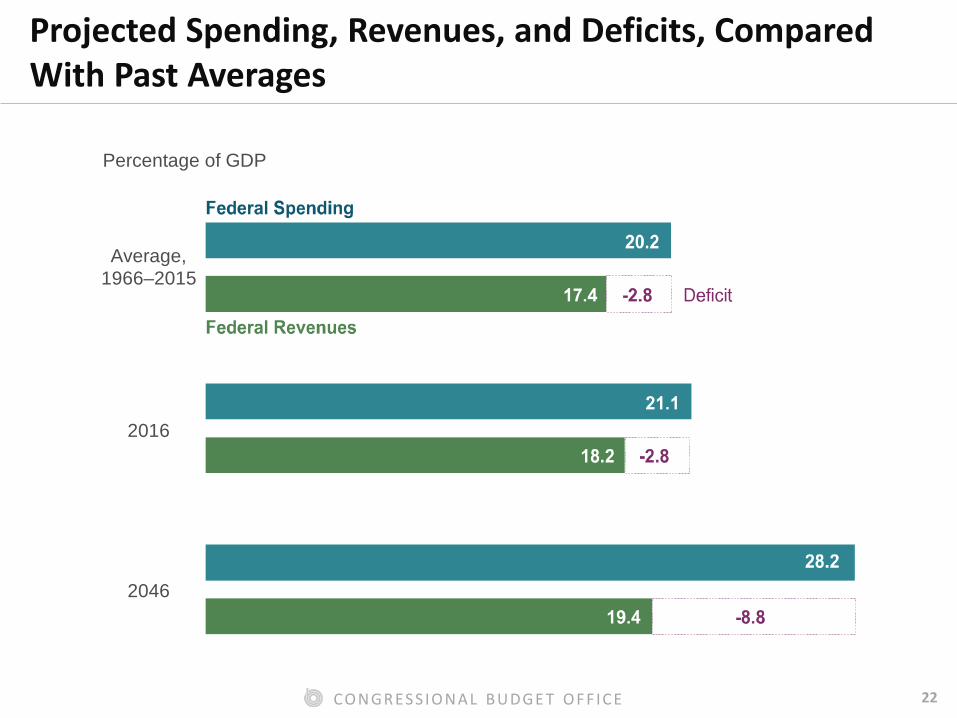
Projected Spending, Revenues, and Deficits, Compared With Past Averages
Percentage of GDP
Average,1966–2015
2016
2046

23 CO N GR ES S IO N A L B UDGE T O F F IC E
Federal Debt Held by the Public
Percentage of GDP
0
25
50
75
100
125
150
Civil War World War I
GreatDepression
World War II
Actual ExtendedBaselineProjection
1790 1810 1830 1850 1870 1890 1910 1930 1950 1970 1990 2010 2030
24 CO N GR ES S IO N A L B UDGE T O F F IC E
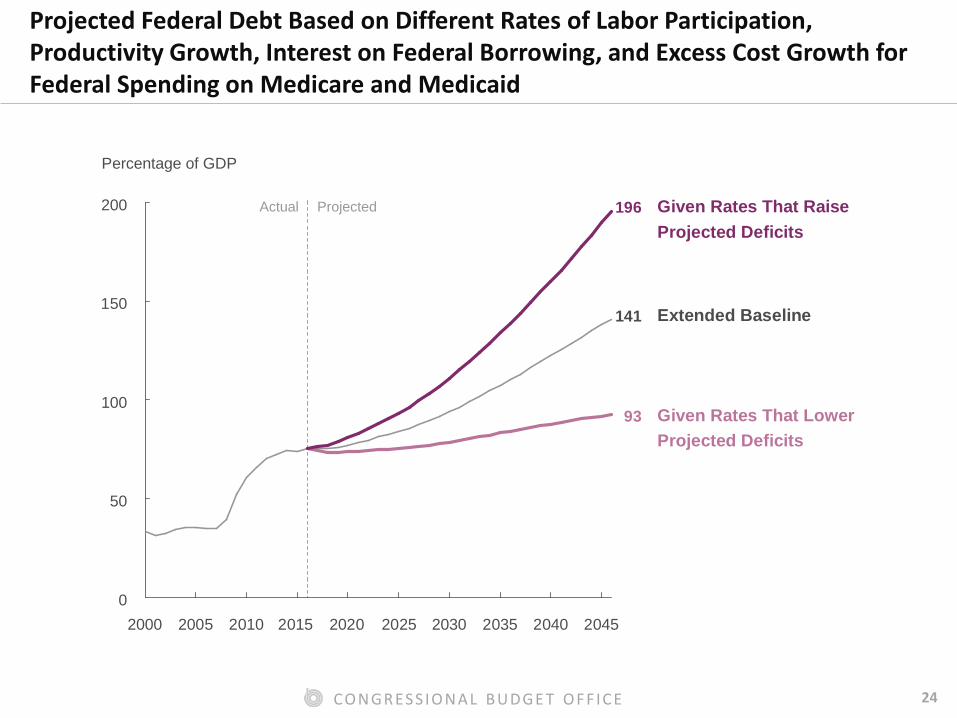
Projected Federal Debt Based on Different Rates of Labor Participation, Productivity Growth, Interest on Federal Borrowing, and Excess Cost Growth for Federal Spending on Medicare and Medicaid
Actual Projected
Percentage of GDP
2000 2005 2010 2015 2020 2025 2030 2035 2040 20450
50
100
150
200
Extended Baseline
Given Rates That LowerProjected Deficits
Given Rates That RaiseProjected Deficits
141
196
93
25 CO N GR ES S IO N A L B UDGE T O F F IC E
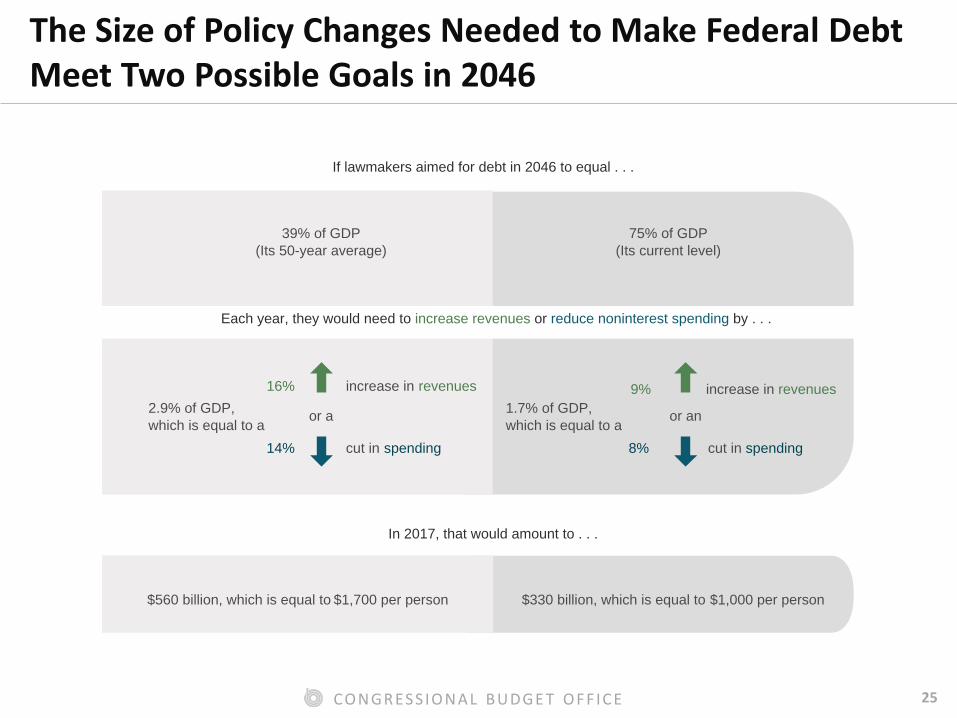
The Size of Policy Changes Needed to Make Federal Debt Meet Two Possible Goals in 2046
39% of GDP(Its 50-year average)
75% of GDP(Its current level)
In 2017, that would amount to . . .
$560 billion, which is equal to $1,700 per person $330 billion, which is equal to $1,000 per person
2.9% of GDP,which is equal to a
1.7% of GDP,which is equal to a
16% increase in revenues
14% cut in spending
9% increase in revenues
8% cut in spending
or a or an
If lawmakers aimed for debt in 2046 to equal . . .
Each year, they would need to increase revenues or reduce noninterest spending by . . .

26 CO N GR ES S IO N A L B UDGE T O F F IC E
Notes
Slide 6. The budgetary effects of tax expenditures were projected by CBO using estimates from the staff of the Joint Committee on Taxation, which were prepared before the enactment of the Consolidated Appropriations Act, 2016, and do not include the effects of that law.
Slide 17. Spending on major health care programs consists of spending on Medicare (net of offsetting receipts), Medicaid, and the Children’s Health Insurance Program, as well as outlays to subsidize health insurance purchased through the marketplaces established under the Affordable Care Act and related spending.