Embed Size (px)
Citation preview

Young Gazelles and Aging Turtles:Politics and the determinants of employment creation
in the ME Private Sector
By Hassan Aly*, Ayhab Saad**, Yousef Daoud**, and Amr Ragab**
Ohio State University* and the Doha Institute for Graduate Studies**
December 2016
1
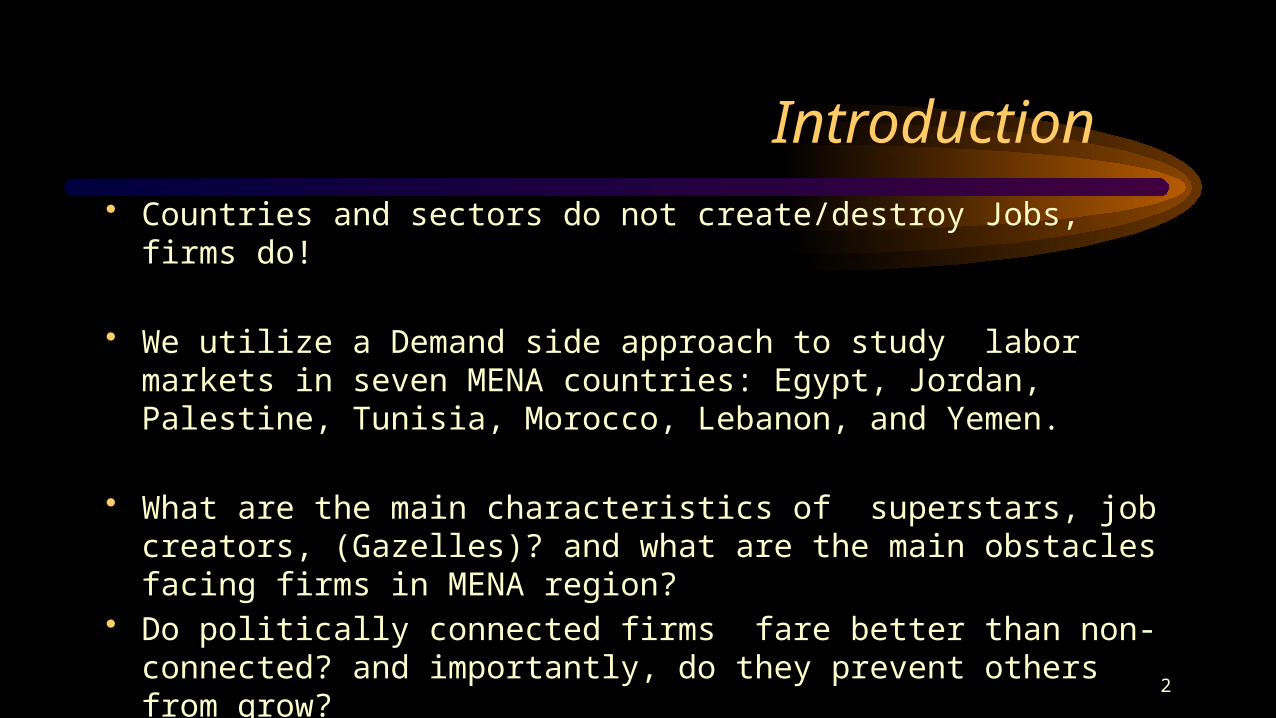
Introduction Introduction• Countries and sectors do not create/destroy Jobs, firms do!
• We utilize a Demand side approach to study labor markets in seven MENA countries: Egypt, Jordan, Palestine, Tunisia, Morocco, Lebanon, and Yemen.
• What are the main characteristics of superstars, job creators, (Gazelles)? and what are the main obstacles facing firms in MENA region?
• Do politically connected firms fare better than non-connected? and importantly, do they prevent others from grow?
• We use World Bank WES (World Enterprise Survey) 2013 to address these questions 2

Motivation (why do we care about gazelles?)
• Overall countries’ labor market performance seems to be strongly associated with the prevalence of gazelles in the market
• In the ME, Gazelle firms comprise a small proportion of
the total firms, but contribute largely to job creation (total job added in the seven countries)
3

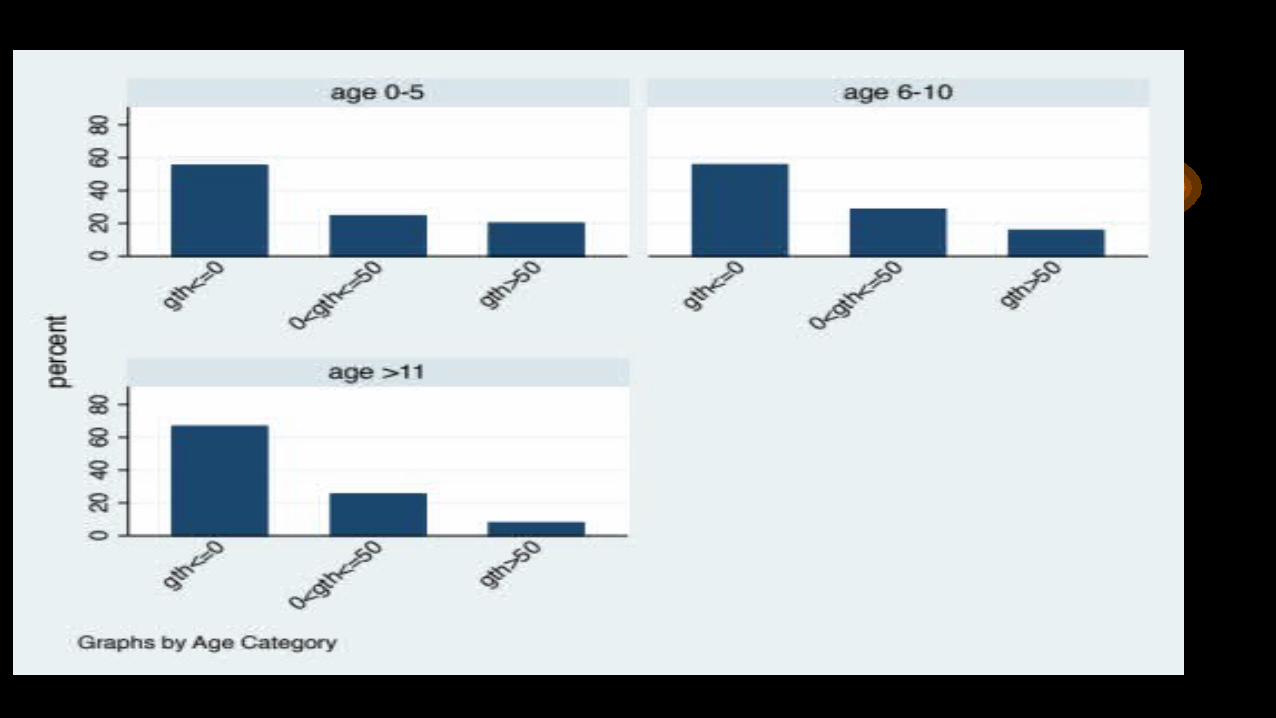
How we define Gazelle, Turtle, and Burden Firms• (Group 1) Gazelle firms; these are the fast growing firms that
increased the number of workers by more than 50 percent during the period 2009-2012;
• (Group 2) Turtle firms; firms that have achieved a reasonable employment growth (1-49 percent) during 2009-2012, and
• (Group 3) Burden (downsizing) firms; firms with zero or negative employment growth (group 0).
4

Tabulation of employment growth categories over country and industry Country/Industry Downsizing Turtles Gazelles Total N % N % N % N %
Egypt 1,850 77.1 420 17.5 130 5.4 2,400 100
Tunisia 326 57.4 174 30.6 68 12.0 568 100
Yemen 197 59.2 87 26.1 49 14.7 333 100
Palestine 144 43.2 101 30.3 88 26.4 333 100
Jordan 225 45.0 217 43.4 58 11.6 500 100
Morocco 174 46.7 142 38.1 57 15.3 373 100
Lebanon 297 57.1 148 28.5 75 14.4 520 100
Total 3,213 63.9 1,289 25.6 525 10.4 5,027 100

ME TURTLES • The Middle East Labor Demand side, is dominated by a large
proportion of 'turtle' firms that hardly contribute to increasing labor demand
• These firms do not just represent the majority of firms in the region, but they also tend to be the more mature firms with relatively lesser financial constraints.
• On the other hand, a small number of ‘gazelle’ firms carry more than their weight when it comes to job creation
6


Major Findings (1): Age matters
• Young firms create more jobs on average
• The likelihood of being gazelles is much larger among young firms compared to old firms
• These finding robust across countries and sectors
9


• Major Finding (2): once controlled for age, large and medium firms seem to grow faster than small firms
11


• Major Finding (3): Small firms are more financially constrained than large firms.
• Major Finding (4): Financially constrained firms are not younger than financially unconstrained firms
• Major Finding (5): Investment in R&D or NM is positively related to job creation
13

Multinomial Logit Estimates of the Basic Model
Coefficient$
Downsizing Reference group
Turtles Average wage 0.0000271**
0.00000962
Average rent -0.160***
0.0308
Sales growth 0.324***
0.0218
Constant -1.171***
0.121
Gazelles Average wage 0.0000397***
0.00000985
Average rent 0.0128***
0.00188
Sales growth 0.466***
0.0204
Constant -2.487***
0.0539
N 1850
Pseudo R2 0.031
Log pseudo-likelihood -1435.894 14

Multinomial Logit estimates of the
Extended Model
Turtles Gazelles
Average wage 1.58E-05*** 2.54E-05***
Average rent -0.277*** -0.355***
Sales growth 0.256*** 0.484***
Sales/worker 2009 -3.3E-05* -0.000590*
Skilled/non-skilled labor ratio 0.0223 -0.0593***
Male Top Manager 0.201 0.370**
Top Manager Experience -0.00384 -0.0182***
females amongst the owners -0.138 0.397***
Secondary & Vocational -0.299*** -0.681***
Preparatory or some sec. -0.827*** -0.980***
Primary 0.0333 -13.25***
Incomplete Primary or none -1.288*** 0.766
Involved in export activity 0.353*** 0.133
Firm Age -0.0160*** -0.0196***
Small >=5 & <=19 14.97*** -0.0789
Medium >=20 & <=99 14.96*** -0.138
Large >=100 15.70*** 0.856
16

Spend on formal R&D activities -0.428*** -0.930***
Have Overdraft Facility -0.605*** -0.187
Has a line of credit or loan 0.342*** 0.404***
Minor -0.621*** -0.910***
Moderate -0.203*** 0.645***
Major 0.105*** -0.379*
Very Severe 0.360*** 0.550
Electricity, gas and water 0.972*** 27.18***
Construction -14.93*** -1.518***
Wholesale and retail trade 1.417*** 0.593***
Hotels and restaurants 0.734*** -14.62***
Transport, storage and comm 0.00574 -15.60***
Real estate, renting
Tunisia 0.532*** 2.523***
Yemen 1.827*** 2.314***
Palestine 1.362*** 3.248***
Jordan 1.776*** 2.195***
Morocco 1.464* 2.839***
Lebanon 1.076** 1.369***
17
: Continued

Minor 0.575** 1.525***
Moderate -0.356* 0.138
Major -0.366 0.242
Very Severe -0.459 0.413
Minor -0.196** -0.506***
Moderate 0.143*** 0.0476
Major 0.0425 -0.618***
Very Severe 0.259* 0.428**
Constant -15.03*** -3.190
N 811
Pseudo R2 0.22
Log pseudolikelihood -493.78
18
: Continued


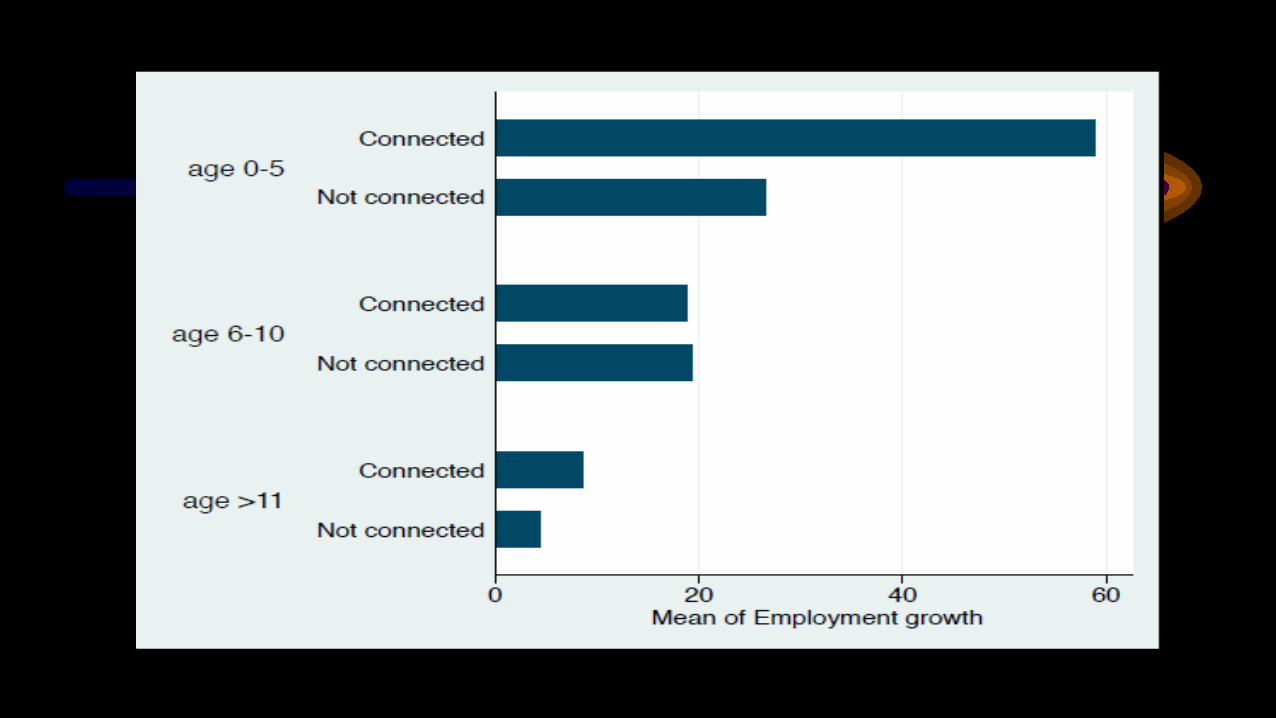
Political Connections:
• Unfortunately, no direct measure of political connection exists in the survey data
• We use different proxies for political connections. – Whether a government contract secured in the last 12 months– Access to State bank finance
20

Main Findings
• Political Connections seem to be associated with higher employment growth for young large firms
• The likelihood of being gazelle conditional on being politically connected is higher than the probability of being gazelle for non-connected firms in the data.
21


Main Findings
• Political connection is strongly associated with access to finance, underlying a potential mechanism linking employment growth, age, size, and political connection.
• We do not find strong evidence that the concentration of politically connected firms in a sector hamper non-connected firms to be gazelles.
24


Financial Constraints and Political connection

Some Policy Recommendations
• New firms including startups are the ones more likely to create jobs in the region as they try to find new and innovative ways to produce and serve their markets.
• And the largest among those young firms are even more likely to contribute to reducing unemployment.
27

Some Policy Recommendations• Maximizing government efforts to reduce unemployment would
therefore require a focus on new firms that are medium to large-sized with investment in R&D.
• Policy incentives such as tax breaks, subsidies, credit facilitation and other forms of government support should be disproportionately better directed to young innovative firms.
• These firms face more financial constraints and a harder time establishing themselves in the market, yet they are the region’s best hope in addressing its chronic youth unemployment problem
28