Embed Size (px)
Citation preview

Catheter Related Infections
Mansoor Masjedi MD , FCCMShiraz University of Medical sciences
3rd international congress of critical care medicineTeh., Iran ; 20-22th Jan. 2016

AgendaAgendaWhat are the Devices.Epidemiology.Pathogenesis.Diagnosis.Treatment.Prevention.


Downloaded from: Infectious Diseases (on 16 November 2007 12:04 PM)
© 2007 Elsevier

8
Three ways stop cock (open connector) Single use vials, used
multiple times
Peripheral catheter with no sterile catheter dressing
Central line with no sterile dressing
Multiple use vials with inserted needles
CL insertion without maximal barriers

Per
cen
tag
e o
f H
AIs
Per
cen
tag
e o
f H
AIs
Country Type of Study/Unit HAI Rate (%) Year
Albania Adult ICUs 31.6 2008
Albania Surgical ICUs 22.0 2008
Argentina (INICC Study) Multicenter adult ICU 27.0 2003
Bangladesh Adult ICUs 30 2011
Brazil Multicenter newborn ICU 28.1 2004
Brazil Newborn ICU 50.7 2002
Brazil(INICC Study) Multicenter adult ICU 29.6 2006
Bulgaria Newborn ICU 1.9 2011
Chile Hospitalwide 14.0 2001
China Hospitalwide 3.04 2005
China Newborn ICU 11.6 2007
Colombia Newborn ICU 5.3 2005
Colombia (INICC Study) Multicenter adult ICU 12.2 2006
Costa Rica (INICC Study) Adult ICU 4.8 2009
Croatia (INICC Study) Adult ICU 7.0 2006
Cuba (INICC Study) Multicenter adult ICU 22.4 2011
Egypt Pediatrie ICU 23.0 2005
Egypt (INICC study) Adult ICU 32.8 2012
Egypt (INICC study) Pediatric ICU 24.5 2012
India Pediatric ICU 19.3 2011
India (INICC Study) Multicenter adult ICU 12.3 2005
Kosovo Adult ICU 64.3 2008
Kosovo Adult and New Born 17.4 2006
Kuwait Adult MS ICU 10.6 2008
Lebanon (INICC study) Adult ICU 9.8 2012
Macedonia (INICC study) Adult ICU 2.1 2010

Per
cen
tag
e o
f H
AIs
Per
cen
tag
e o
f H
AIs
Country Type of Study/Unit HAI Rate (%) Year
Mexico Hospitalwide 21.0 2002Mexico Multicenter adult ICU 23.2 2000Mexico (INICC Study) Multicenter adult ICU 24.4 2006Morocco (INICC Study) Adult medical ICU 19.3 2005Pakistan Adult ICUs 39.7 2007Peru (INICC Study) Multicenter adult ICU 11.2 2005Philippines (INICC Study) Adult ICU 19.1 2006Poland (INICC study) Adult ICU 24.3 2012Saudi Arabia Multicenter hospitalwide 2.8 2004Saudi Arabia Hospitalwide maternity 4.0 2002Saudi Arabia Hospitalwide 8.5 2002Saudi Arabia Adult ICU 19.8 2002Saudi Arabia Newborn ICU 35.8 2002Serbia Adult ICUs 40.8 2006Tanzania Multicenter hospitalwide 14.8 2003Tanzania Adult medical ICU 40.0 2003Tunisia (INICC study) Newborn and Pediatric 4.1 2010Turkey Adult ICU 12.5 2000Turkey Adult ICU 33.0 2003Turkey Adult ICU 51.8 2003Turkey Multicenter adult ICU 48.7 2004Turkey Neurology ICU 88.9 2005Turkey General pediatric wards 3.02 2012Turkey Intensive care unit 25.6 2011Turkey Intensive care unit 20.1 2011Turkey Newborn ICU 29.7 2010Turkey Adult ICU 16.6 2005Turkey (INICC Study) Multicenter adult ICU 20.5 2005
INICC 8 countries Multicenter adult ICU 14.7 2005
Range: 2% to 88%

Country Setting HAI per 1000 bed days
Year
Argentina (INICC Study) Multicenter adult ICU 90.0 2003Brazil Multicenter adult ICU 30.6 2006Brazil Multicenter newborn ICU 24.9 2004Brazil Newborn ICU 62.0 2002China Newborn ICU 14.9 2007Colombia (INICC Study) Newborn ICU 6.2 2005Colombia (INICC Study) Multicenter adult ICU 18.2 2006Costa Rica (INICC Study) Adult ICU 13.9 2009Croatia (INICC Study) Adult ICU 25.6 2006Cuba (INICC Study) Multicenter adult ICU 30.6 2011Egypt Pediatric ICU 40.0 2005Egypt Pediatric ICU 8.6 2011Egypt Multicenter ICUs 20.5 2012Egypt (INICC Study) Adult ICU 52.9 2012Egypt (INICC Study) Pediatric ICU 22.8 2012India Hospitalwide 36.2 2004India Pediatric ICU 21 2011India (INICC Study) Multicenter adult ICU 21.4 2005INICC (INICC Study) Multicenter adult ICU 22.5 2005Kuwait Adult MS ICU 20.6 2008Lebanon (INICC study) Adult ICU 11.85 2012Lithuania 5 Pediatric ICUs 24.5 2009Macedonia (INICC study) Adult ICU 4.5 2010Mexico (INICC Study) Multicenter adult ICU 39.0 2006Morocco (INICC Study) Adult medical ICU 20.4 2005Peru (INICC Study) Multicenter adult ICU 25.3 2005Philippines (INICC Study) Adult ICU 27.5 2006Poland (INICC Study) Adult ICU 21.9 2012Serbia Adult ICUs 65.6 2006Tunisia (INICC Study) Pediatric and Newborn 6.88 2010Turkey Burn ICU 18.2 2009Turkey General Pediatric wards 3.17 2012Turkey ICU 21.6 2011Turkey Newborn ICU 17.3 2010Turkey Adult ICU 30.2 2012Turkey (INICC Study) Multicenter adult ICU 48.4 2005Turkey (INICC Study) Neurology ICU 84.2 2005
HA
Is p
er 1
000
Bed
Day
sH
AIs
per
100
0 B
ed D
ays Range: 11 to 90 HAIs per 1000 Bed days

CL
AB
SI p
er
10
00
CL
da
ysC
LA
BS
I pe
r 1
00
0 C
L d
ays
Country ICU Type CLABSI per 1000 CL days
Year
Argentina Adult 11.4 2002
Argentina (INICC Study) Adult 30.3 2004
Argentina (INICC Study) Adult 2.7 2004
Brazil NICU 17.3 2010
Brazil PICU 10.2 2003
Brazil (INICC Study) Adult 9.1 2008
Brazil (INICC Study) Adult, PICU 34.0 2003
Brazil (INICC Study) NICU 3.1 2007
China NICU 18 2007
China (INICC Study) Adult 3.1 2011
China (INICC Study) Adult 7.66 2012
Colombia (INICC Study) Adult 11.3 2006
Costa Rica (INICC Study) Adult 4.65 2009
Croatia (INICC Study) Adult 8.3 2006
Cuba (INICC Study) Adult 2.0 2011
Egypt (INICC Study) Adult 22.5 2011
Egypt (INICC Study) PICU 18.8 2011
El Salvador (INICC Study) PICU 10.1 2011
El Salvador (INICC Study) NICU 16.1 2011
India Adult, PICU, NICU 0.48 2010
India NICU 27.0 2011
India (INICC Study) Adult 7.9 2007
Iran Adult 147.3 2004

Country ICU Type CLABSI per 1000 CL days
Year
Kuwait Adult 5.5 2008Lebanon (INICC Study) Adult 5.2 2011Lithuania PICU 7.7 2009Macedonia (INICC Study) Adult 1.47 2010Mexico (INICC Study) Adult 23.1 2006Morocco (INICC Study) Adult 15.7 2009Peru PICU 18.1 2010Peru (INICC Study) Adult 7.7 2008Philippines (INICC Study) Adult 4.6 2011Philippines (INICC Study) PICU 8.23 2011Philippines (INICC Study) NICU 20.8 2011Poland (INICC Study) Adult 4.01 2011Saudi Arabia NICU 8.2 2009Tunisia Adult 15.3 2006Tunisia Adult 14.8 2007Tunisia (INICC Study) PICU, NICU 8.65 2010Turkey Adult 11.8 2010Turkey Adult 2.8 2011Turkey NICU 3.8 2012Turkey (INICC Study) Adult 17.6 2007INICC 15 countries NICU 13.7 2011INICC 18 countries Adult, PICU, 9.2 2008INICC 18 countries NICU 14.8 2008INICC 25 countries Adult, PICU, 7.6 2010INICC 25 countries NICU 13.9 2010INICC 36 countries Adult, PICU, 6.8 2011INICC 36 countries NICU 12.2 2011INICC 8 countries Adult, PICU, NICU 18.5 2006
CL
AB
SI p
er
10
00
CL
da
ys
CL
AB
SI p
er
10
00
CL
da
ys
Range: 2 to 147 CLABs per 1000 CL days

VA
P p
er 1
000
MV
day
sV
AP
per
100
0 M
V d
ays
Country ICU Type VAP per 1000 MV days
Year
Albania Adult, PICU, NICU 40.0 2008
Argentina (INICC Study) Adult 46.3 2004Brazil NICU 3.2 2010
Brazil PICU 18.7 2003
Brazil (INICC Study) Adult 20.9 2008
Brazil (INICC Study) Adult, PICU 26.0 2003
Brazil (INICC Study) NICU 4.3 2007
China NICU 63.3 2007
China (INICC Study) Adult 20.8 2011
China (INICC Study) Adult 10.46 2012
Colombia (INICC Study) Adult 10.1 2006
Costa Rica (INICC Study) Adult 29.9 2009
Croatia (INICC Study) Adult 47.8 2006
Cuba (INICC Study) Adult 52.5 2011
Egypt (INICC Study) Adult 73.4 2011
Egypt (INICC Study) PICU 31.8 2011
El Salvador (INICC Study) PICU 12.1 2011
El Salvador (INICC Study) NICU 9.9 2011India Adult, PICU, NICU 21.9 2010
India (INICC Study) Adult 10.4 2007
Iran Adult 275 2004

Country ICU Type VAP per 1000 MV days Year
Kuwait Adult 9.1 2008
Lebanon (INICC Study) Adult 8.1 2011
Lithuania PICU 28.8 2009
Macedonia (INICC Study) Adult 6.58 2010
Mexico (INICC Study) Adult 21.8 2006
Morocco (INICC Study) Adult 43.2 2009Peru PICU 7.9 2010
Peru (INICC Study) Adult 31.3 2008
Philippines (INICC Study) Adult 16.7 2011
Philippines (INICC Study) PICU 12.8 2011
Philippines (INICC Study) NICU 0.44 2011
Poland (INICC Study) Adult 18.2 2011
Tunisia Adult 4.4 2006
Tunisia (INICC Study) PICU, NICU 5.56 2010Turkey Adult 27.1 2010
Turkey Adult 21.2 2011
Turkey NICU 13.76 2012
Turkey (INICC Study) Adult 26.5 2007
INICC 15 countries NICU 9.7 2011
INICC 18 countries Adult, PICU, 19.5 2008
INICC 18 countries NICU 7.5 2008
INICC 25 countries Adult, PICU, 13.6 2010
INICC 25 countries NICU 9.5 2010
INICC 36 countries Adult, PICU, 15.8 2011
INICC 36 countries NICU 9.0 2011
INICC 8 countries Adult, PICU, NICU 24.1 2006
VA
P p
er 1
000
MV
day
sV
AP
per
100
0 M
V d
ays
Range: 3 to 275 VAP per 1000 MV days
CA
UT
I per
100
0 U
C d
ays
CA
UT
I per
100
0 U
C d
ays
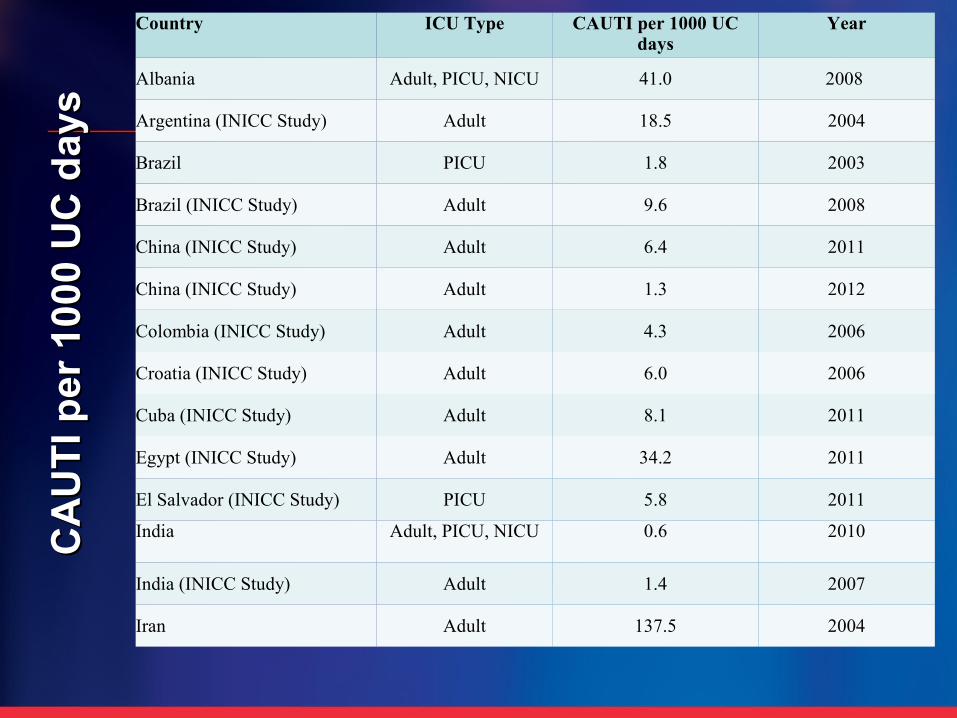
Country ICU Type CAUTI per 1000 UC days
Year
Albania Adult, PICU, NICU 41.0 2008
Argentina (INICC Study) Adult 18.5 2004
Brazil PICU 1.8 2003
Brazil (INICC Study) Adult 9.6 2008
China (INICC Study) Adult 6.4 2011
China (INICC Study) Adult 1.3 2012
Colombia (INICC Study) Adult 4.3 2006
Croatia (INICC Study) Adult 6.0 2006
Cuba (INICC Study) Adult 8.1 2011
Egypt (INICC Study) Adult 34.2 2011
El Salvador (INICC Study) PICU 5.8 2011
India Adult, PICU, NICU 0.6 2010
India (INICC Study) Adult 1.4 2007
Iran Adult 137.5 2004

Country ICU Type CAUTI per 1000 UC days
Year
Kuwait Adult 2.3 2008
Lebanon (INICC Study) Adult 4.1 2011
Lithuania PICU 3.4 2009
Macedonia (INICC Study) Adult 0.45 2010
Mexico (INICC Study) Adult 13.4 2006
Morocco (INICC Study) Adult 11.7 2009Peru PICU 5.1 2010
Peru (INICC Study) Adult 5.1 2008
Philippines (INICC Study) Adult 4.2 2011
Philippines (INICC Study) PICU 0.0 2011
Poland (INICC Study) Adult 4.8 2011
Tunisia (INICC Study) PICU, NICU 0.0 2010Turkey Adult 9.6 2010
Turkey Adult 11.9 2011
Turkey Adult 19.02 2012
Turkey (INICC Study) Adult 8.3 2007
INICC 18 countries Adult, PICU, 6.5 2008
INICC 25 countries Adult, PICU, 6.3 2010
INICC 36 countries Adult, PICU, 6.3 2011
INICC 8 countries Adult, PICU, NICU 8.9 2006
CA
UT
I per
100
0 U
C d
ays
CA
UT
I per
100
0 U
C d
ays
Range: 0.1 to 137 CAUTI per 1000 UC days

CLAB Rates Stratified Socio-Economic LevelCLAB Rates Stratified Socio-Economic Level
95%CI 18.06-20.1 6.5-7.5 7.3-7.8
Rosenthal VD, et al. Pediatric Critical Care 2012. Infection 2012.

CLAB Rates Stratified By Hospital TypeCLAB Rates Stratified By Hospital Type
95%CI 9.6-10.3 8.6-9.9 5.4-6.3
Rosenthal VD, et al. Pediatric Critical Care 2012. Infection 2012.

VAP Rates Stratified By Hospital TypeVAP Rates Stratified By Hospital Type
95%CI 13.3-14.2 19.8-21.0 6.4-7.7
Rosenthal VD, et al. Pediatric Critical Care 2012. Infection 2012.

21
PHILIPPINESPHILIPPINES
MACEDONIAMACEDONIA
PAKISTANPAKISTAN
EGYPTEGYPT
CUBACUBAEl SALVADOREl SALVADOR
KOSOVOKOSOVO
NIGERIANIGERIA
DOMINICANDOMINICAN
GUATEMALAGUATEMALA
LEBANONLEBANON
CHINACHINA
THAILANDTHAILAND
JAPANJAPAN
URUGUAYURUGUAY
MALAYSIAMALAYSIA
PANAMAPANAMA
1000 Hospitals of 200 CITIES of 54 COUNTRIES of 4 CONTINENTS
COSTA RICACOSTA RICA
CHILECHILE
SAUDI SAUDI ARABIAARABIA
UKRAINEUKRAINE
VENEZUELAVENEZUELA
CROATIACROATIA
VIETNAMVIETNAM
POLANDPOLAND
SUDANSUDAN

Papers published by INICC by Papers published by INICC by specific Country of Europe, Asia specific Country of Europe, Asia
and Africaand Africa

Five INICC International Reports Five INICC International Reports (One every second year, from 2006 to 2014)(One every second year, from 2006 to 2014)
Publication year 2006
Number of Countries
8
Peer Review Journal
Annals of Internal
Medicine
23
2008
18
American Journal of Infection Control
2010
25
American Journal of Infection Control
2012
36
American Journal of Infection Control
2014
43
American Journal of Infection Control
Submitted

INICC2002-2005
(Annals 2006)
INICC2002-2007
(AJIC 2008)
INICC2003-2008
(AJIC 2010)
INICC2004-2009
(AJIC 2012)
INICC2007-2012
(AJIC 2014)
Number of Countries
8 18 25 36 43 Participating
CountriesArgentina, Brazil,
Colombia, India, Mexico, Morocco, Peru, and Turkey
Argentina, Brazil, Chile, Colombia, Costa Rica, Cuba,
India, Kosovo, Lebanon, Macedonia,
Mexico, Morocco, Nigeria, Peru, Philippines, El
Salvador, Turkey, Uruguay
Argentina, Brazil, China, Colombia, Costa Rica, Cuba,
Greece, India, Jordan, Kosovo, Lebanon,
Lithuania, Macedonia, Mexico, Morocco, Pakistan,
Panama, Peru, Philippines, El
Salvador, Thailand, Tunisia, Turkey,
Venezuela, Uruguay
Argentina, Brazil, Bulgaria, China, Colombia, Costa
Rica, Cuba, Dominican Republic,
Ecuador, Egypt, Greece, India, Jordan,
Kosovo, Lebanon, Lithuania,
Macedonia, Malaysia, Mexico, Morocco, Pakistan, Panama, Peru, Philippines, Puerto Rico, El Salvador, Saudi
Arabia, Singapore, Sri Lanka, Sudan,
Thailand, Tunisia, Turkey, Venezuela, Vietnam, Uruguay
Argentina, Bolivia, Brazil, Bulgaria, China, Colombia, Costa
Rica, Cuba, Dominican Republic,
Ecuador, Egypt, Greece, India, Iran,
Jordan, Kosovo, Lebanon, Lithuania,
Macedonia, Malaysia, Mexico, Morocco, Pakistan, Panama, Peru, Philippines,
Poland, Puerto Rico, Romania, El
Salvador, Saudi Arabia, Serbia,
Singapore, Slovakia, Sri Lanka,
Sudan, Thailand, Tunisia, Turkey,
United Arab Emirates, Uruguay, Venezuela, Vietnam
Number of ICUs
55 98 173 422 503

INICC2002-2005
(Annals 2006)
INICC2002-2007(AJIC 2008)
INICC2003-2008(AJIC 2010)
INICC2004-2009(AJIC 2012)
INICC2007-2012(AJIC 2014)
Medical Cardiac ICU
CLABSI - 9.9 (8.7 – 11.3) 8.5 (7.5 – 9.7) 6.2 (5.6 – 6.9) 3.5 (3.1 – 3.9)CAUTI - 6.4 (5.3 – 7.7) 4.4 (3.5 – 5.3) 3.7 (3.2 – 4.3) 5.9 (5.4 – 6.4)VAP - 20.2
(17.0 – 23.9)14.9
(12.4 – 17.9)10.8
(9.5 – 12.3)11.5
(10.5 – 12.5) Medical-surgical ICU
CLABSI - 8.9 (8.4 – 9.4) 7.4 (7.2 – 7.7) 6.8 (6.6 – 7.1) 4.9 (4.8 – 5.1)CAUTI - 6.6 (6.2 – 7.0) 6.1 (5.9 – 6.4) 7.1 (6.9 – 7.4) 5.3 (5.2 – 5.8)VAP - 19.8
(14.2 – 27.1)14.7
(14.2 – 15.2)18.4
(17.9 – 18.8)16.5
(16.1 – 16.8) Pediatric ICU CLABSI - 6.9 (5.6 – 8.3) 7.8 (7.1 – 8.5) 4.6 (3.7 – 5.6) 6.1 (5.7 – 6.5)CAUTI - 4.0 (2.4 – 6.2) 4.4 (3.6 – 5.4) 4.7 (4.1 – 5.5) 5.6 (5.1 – 6.1)VAP - 7.9 (6.0 – 10.1) 5.5 (4.9 – 6.0) 6.5 (5.9 – 7.1) 7.9 (7.4 – 8.4) Newborn ICU (1501-
2500 g)
CLABSI - 15.2 (10.3 – 21.5)
13.9 (12.4 – 15.6)
11.9 (10.2 – 13.9)
4.8 (3.7 – 6.1)
VAP - 6.68 (3.0 – 12.7) 9.50 (7.9 – 11.3) 10.1 (7.9 – 12.8) 10.7 (8.4 – 13.4) Overall - CLABSI 12.5
(11.7 – 13.3)9.2
(8.8 – 9.7)7.6
(7.4 – 7.9)6.8
(6.7 – 7.0)4.8
(4.7 – 4.9)CAUTI 8.9
(8.3 – 9.5)6.5
(6.1 – 6.9)6.3
(6.0 – 6.5)6.3
(6.2 – 6.5)5.3
(5.2 – 5.4)VAP 24.1
(22.8 – 25.5)19.5
(18.7 – 20.3)13.6
(13.3 – 14.0)15.8
(15.5 – 16.1)14.7
(14.5 – 14.9)

International Nosocomial Infection Control Consortium (INICC) report, data summary for
2007- 2012, Device-associated module
AJIC published in 2014
Víctor Daniel Rosenthal 1; Dennis George Maki 2; Yatin Mehta 3; Hakan Leblebicioglu 4; Ziad Ahmed Memish 5; Haifaa Hassan Al-Mousa 6; Hu Bijie 7; Carlos Alvarez-Moreno 8; Eduardo A
Servolo-Medeiros 9; Anucha Apisarnthanarak 10; Lul Raka 11; Luis E Cuellar 12; Altaf Ahmed 13; Josephine Anne Navoa-Ng 14; Amani Ali El-Kholy 15; Souha Sami Kanj 16; Ider Bat-Erdene 17;
Wieslawa Duszynska 18; Nguyen Van Truong 19; Maria Marcela Bovera 20; Lucy Chai See-Lum 21; Rosalia Fernandez-Hidalgo 22; Gabriela Di-Silvestre 23; Farid Zand 24; Sona Hlinkova 25; Vladislav Belskiy 26; Hussain Al-Rahma 27; Marco Tulio Luque-Torres 28; Nesil Bayraktar 29; Zan Mitrev 30;
Vaidotas Gurskis 31; Dale Fisher 32; ilham Bulos Abu-Khader 33; Kamal Berechid 34; Arnaldo Rodríguez-Sánchez 35; Florin Horhat 36; Osiel Requejo-Pino 37; Nassya Hadjieva 38; Nejla Ben-
Jaballah 39; Elías García-Mayorca 40; Luis Kushner-Dávalos 41; Srdjan Pasic 42; Luis E. Pedrozo-Ortiz 43; Eleni Apostolopoulou 44; Nepomuceno Mejía 45; May Osman Gamar-Elanbya 46; Kushlani
Jayatilleke 47; Miriam de Lourdes-Dueñas 48; Guadalupe Aguirre-Avalos 49.
Rosenthal, V. D., et alRosenthal, V. D., et al. International Nosocomial Infection Control Consortium (INICC) report, data summary for 2007- 2012, Device-
associated module" American journal of infection control" American journal of infection control

INICC report – 43 countries- “2007 to 2012”. INICC report – 43 countries- “2007 to 2012”.
Countries included: Argentina, Bolivia, Brazil, Bulgaria, China, Colombia, Costa Rica, Cuba, Dominican Republic, Ecuador, Egypt, Greece, India, Iran, Jordan, Kosovo, Lebanon, Lithuania, Macedonia, Malaysia, Mexico, Morocco, Pakistan, Panama, Peru, Philippines, Poland, Puerto Rico, Romania, El Salvador, Saudi Arabia, Serbia, Singapore, Slovakia, Sri Lanka, Sudan, Thailand, Tunisia, Turkey, United Arab Emirates, Uruguay, Venezuela, Vietnam
ICUs: 503
Patients: 605,310
Bed days: 3,338,396
Central Line days: 1,650,901
Ventilator days: 1,197,681
Urinary catheter days: 1,947,650
BSI (n): 7887
VAP (n): 17,605
CAUTI (n): 10,322
Total IAD: 35,814Rosenthal, V. D., et alRosenthal, V. D., et al. International Nosocomial Infection Control Consortium (INICC) report, data summary for 2007- 2012, Device-
associated module" American journal of infection control" American journal of infection control

HAI rates INICC vs CDC-NHSN (USA)HAI rates INICC vs CDC-NHSN (USA)
INICC 2007–2012
Pooled Mean (95% CI)
U.S. NHSN 2012
Pooled Mean (95% CI)
Medical Cardiac ICU CLABSI 3.5 (3.1 – 3.9) 1.1 (1.0 – 1.1)CAUTI 5.9 (5.4 – 6.4) 2.2 (2.0 – 2.3)VAP 11.5 (10.5 – 12.5) 1.0 (0.8 – 1.1) Medical-surgical ICU CLABSI 4.9 (4.8 – 5.1) 0.9 (0.9 – 1.0)CAUTI 5.3 (5.2 – 5.8) 1.2 (1.2 – 1.3)VAP 16.5 (16.1 – 16.8) 1.1 (1.0 – 1.2) Pediatric ICU CLABSI 6.1 (5.7 – 6.5) 1.4 (1.3 – 1.6)CAUTI 5.6 (5.1 – 6.1) 2.7 (2.5 – 3.0)VAP 7.9 (7.4 – 8.4) 0.8 (0.6 – 0.9) Newborn ICU (1501-2500 g) CLABSI 4.8 (3.7 – 6.1) 0.6 (0.5 – 0.8)VAP 10.7 (8.4 – 13.4) 0.2 (0.1 – 0.5)
Rosenthal, V. D., et alRosenthal, V. D., et al. International Nosocomial Infection Control Consortium (INICC) report, data summary for 2007- 2012, Device-associated module" American journal of infection control" American journal of infection control

29


EngageEngagePartner with Infection Control, ID expertsIncrease awareness about morbidity and mortality associated with CLABSI Make harm visible
Tell storiesPost # infections
Estimates of opportunity to improve
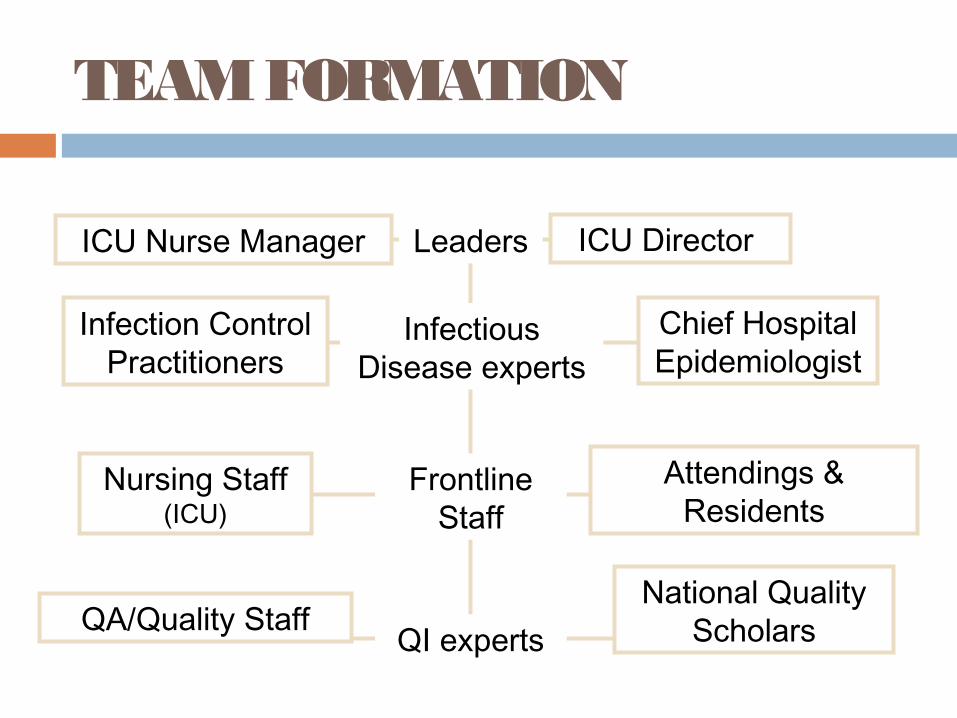
TEAM FORMATION
ICU Director ICU Nurse Manager
Infection Control Practitioners
Chief Hospital Epidemiologist
Attendings & Residents
Nursing Staff (ICU)
QA/Quality Staff QI experts
Frontline Staff
Infectious Disease experts
Leaders
National Quality Scholars

Form the Dream Team
• Heterogeneous in make up; homogeneous in mind set
• All stakeholders must be included • All RN teams fail because MDs insert lines
• Find a high profile champion
• Get a process owner
Vanderbilt Infection Control & Prevention

Thank You Notes to NICU Staff
Thank You From Thank You From Baby Boy JonesBaby Boy Jones
I have gone 136 days without a bloodstream infection. Keep up the
good work! My Mom left some “kisses” for you! XOXOX

EducateEducate
Educate staff and senior leaders about CDC guidelines
Develop a resource notebookDevelop policies and proceduresCDC guidelines and Fact SheetPower point slides for In-services
Consider a quiz to evaluate provider knowledgeCan use on-line training

EvaluateEvaluate
Outcome measure: CLABSI rateRate, # infections, weeks/months since last infection
Process measures% checklists completed% violations noted# lines removed
Celebrate success

Share the DataShare the Data
CLA-BSI in Trauma
0
1
2
3
4
5
6
7
8
9
2005 2006 2007
Infs
per
100
dev
ice
days
TraumaCDC Benchmark
BSI Bundle

The Check ListThe Check ListAdapt to your own institutionMust be filled out for each line insertionInclude 5 BSI bundle elements
Simpler is betterCan always add elements as you become better at capturing data
LF
Time end (catheter secured):
MR #:
Check if:
Femoral
Internal Jugular
/ / Date:
Type of catheter:
Triple lumen Introducer Swan-Ganz
Insertion Site:
Subclavian
Other (specify):
Pt/Family teaching done Consent obtained
Pre-insertion skin prep (check any used): Alcohol Betadine (povidone-iodine) Chlorhexidine Other (specify):
Describe the circumstances under which this line was placed: Non-emergent Emergent (life-threatening or code situation)
Please file page 2 in patients chart and return top form to the designated location in the ICU.
List all sites where insertion was attempted. Other (specify):
: Time start (1st needle stick): :
How many different needle sticks did the patient receive (number of skin breaks)?
1 Unknown
The provider inserting this line:
* If “No”, was this procedure supervised by someone with least five (5) central lines experience? Yes No Didn’t ask
Yes No
Please use military time (i.e. 1:00 pm is 13:00)
a. Handed-off his/her pager before the procedure? Yes No b. Washed hands immediately prior to procedure? Yes No *
Didn’t ask Didn’t ask Didn’t ask c. Has previously placed at least five (5) central lines?
Describe the level of training of the person who actually inserted the line? Medical Student Intern (PGY-1) Resident (PGY-2+) Fellow Attending
Barrier precautions (check any used): Sterile gloves Sterile gown Mask Sterile towels Full body drape
Side: Right Left
2 3 4 5 6+
Follow-up CXR: Ordered Not ordered (specify reason):
CXR findings (check all that apply): No pneumothorax Pneumothorax (describe action taken): Catheter in good position Catheter position adjusted (describe):
Type of dressing: Bio-occlusive Gauze Other (specify):
Patient tolerated the procedure well? Yes No
Was the sterile field maintained throughout the entire procedure? Yes No
Complications? None Other (describe):
Dressing applied by: Nurse Proceduralist Other (specify):
Nursing Checklist: Central Venous Catheter Insertion
Vanderbilt University Medical Center
RIJ LIJ RSC LSC RF
Guidewire exchange
Placement unsuccessful
MC 2705 (Rev. 06/04)
NOTE: Please use either black or blue ink to complete this form.
Comments:
Vascath
Signature: ______________________________________________ Date: _________________
Indications for use: Pressors Hemodynamic monit. Fluids/blood products Frequent lab draws
Pre-existing infection
Nurse Practitioner
Double lumen
atVanderbilt
Monroe Carell Jr. OR
CCU MICU SICU BICU PCCU NICU
NSICU TICU Other

ExecuteExecute
Hand HygieneRemove Unnecessary LinesUse of Maximal Barrier PrecautionsChlorhexidine for Skin AntisepsisAvoid femoral lines
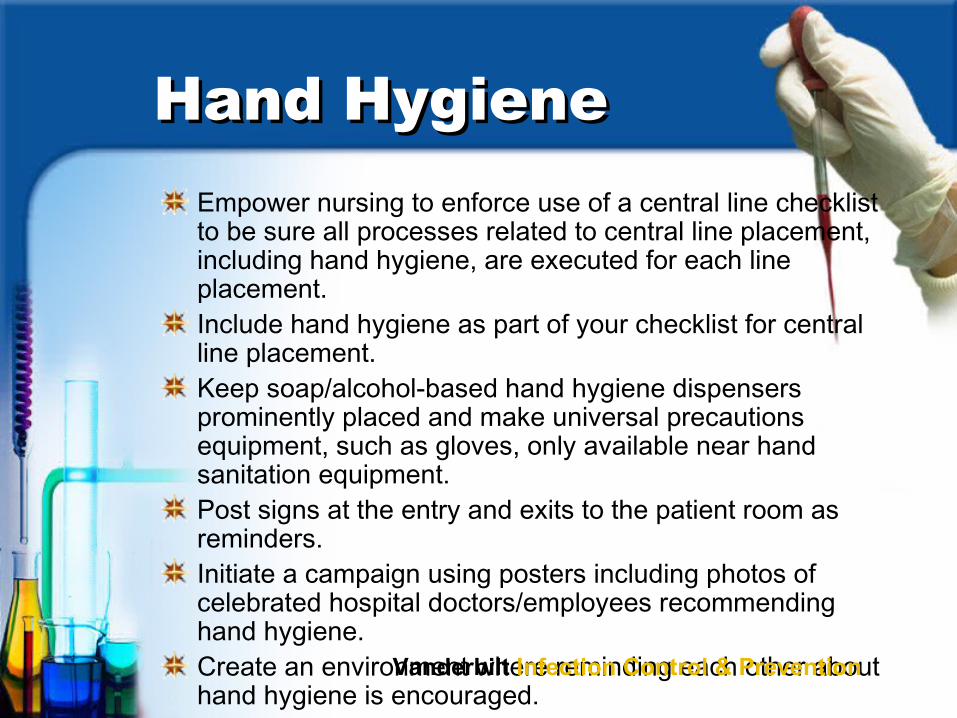
Hand HygieneHand HygieneEmpower nursing to enforce use of a central line checklist to be sure all processes related to central line placement, including hand hygiene, are executed for each line placement. Include hand hygiene as part of your checklist for central line placement.Keep soap/alcohol-based hand hygiene dispensers prominently placed and make universal precautions equipment, such as gloves, only available near hand sanitation equipment.Post signs at the entry and exits to the patient room as reminders.Initiate a campaign using posters including photos of celebrated hospital doctors/employees recommending hand hygiene.Create an environment where reminding each other about hand hygiene is encouraged.
Vanderbilt Infection Control & Prevention

Start SmallStart SmallSelect the team and the venue. It is often best to start in one ICU. Many hospitals will have only one ICU, making the choice easier.Assess where you stand presently. What precautions are taken presently when placing lines? Is there a process in place? If so, work with staff to begin preparing for changes.Contact your Infection Control Department. Learn about your catheter-related bloodstream infection rate and how frequently the hospital reports it to regulatory agencies.Organize an educational program. Teaching the core principles to the ICU staff will open many people’s minds to the process of change.Introduce the central line bundle to the staff.
Vanderbilt Infection Control & Prevention

One ICU…then the RestOne ICU…then the RestOnce the bundle has been applied to one patient and subsequent shifts, increase utilization to the remainder of the ICU.Engage in additional PDSA cycles to refine the process and make it more reliable.After achieving reduction in CR-BSI in the pilot ICU, spread the changes to other ICUs, and eventually to other places in the hospital where central lines are inserted
…So Use Data
Vanderbilt Infection Control & Prevention

Potential BarriersPotential BarriersFear of change
Use knowledgeUse optimism
Communication breakdownInvolve all stakeholders on the front end
MD and staff partial “buy-in”Supply continuous data to all groupsChanges in rates convert the non-believers
Vanderbilt Infection Control & Prevention

Questions?Questions?

Do remember the Do remember the Reasons for Infections Reasons for Infections are Many but solutions are Many but solutions are few …are few …
47